· company comments capitaland capitaland owns 71 acres in danga bay, iskandar with gdv of rm8.1bn...
TRANSCRIPT
March 18, 2013
IMPORTANT DISCLOSURES, INCLUDING ANY REQUIRED RESEARCH CERTIFICATIONS, ARE PROVIDED AT THE END OF THIS REPORT.
CIMB Research Report
Iskandar Malaysia Iskandar - Malaysia's Shenzhen
PP14048/11/2012 (031065)
March 18, 2013
2
Table of Contents
1. WHY WE THINK ISKANDAR WILL SUCCEED ................................................................................. 6
2. BACKGROUND ...................................................................................................................................... 8
3. ECONOMIC PERSPECTIVE ............................................................................................................... 20
4. PROPERTY PERSPECTIVE ................................................................................................................ 28
5. PLANTATION PERSPECTIVE ............................................................................................................ 39
6. CONSTRUCTION PERSPECTIVE ...................................................................................................... 49
7. OIL & GAS PERSPECTIVE .................................................................................................................. 53
8. TRANSPORT INFRASTRUCTURE PERSPECTIVE .......................................................................... 56
9. SINGAPORE PERSPECTIVE .............................................................................................................. 58
10. VALUATION AND RECOMMENDATIONS ...................................................................................... 70
11. APPENDIX ........................................................................................................................................... 75
Company Briefs ............................................................................................................................................... 76
March 18, 2013
IMPORTANT DISCLOSURES, INCLUDING ANY REQUIRED RESEARCH CERTIFICATIONS, ARE PROVIDED AT THE END OF THIS REPORT. Designed by Eight, Powered by EFA
MALAYSIA SINGAPORE
ISKANDAR MALAYSIA
Conviction| |
Iskandar - Malaysia's Shenzhen Excitement about Iskandar is reaching levels never seen before in Malaysia. This is understandable given that the "Shenzhen of Malaysia" reached tipping point last year. We remain bullish on the growth corridor and advise investors to position for the longer term.
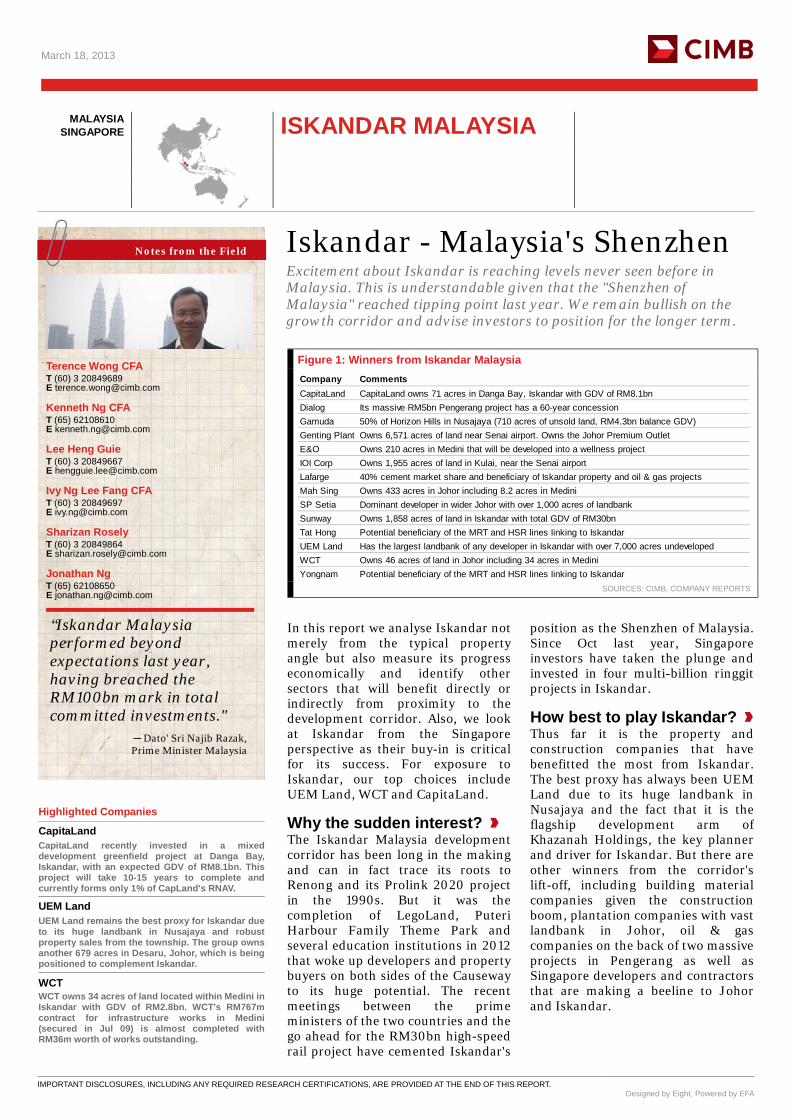
Figure 1: Winners from Iskandar Malaysia Company CommentsCapitaLand CapitaLand owns 71 acres in Danga Bay, Iskandar with GDV of RM8.1bnDialog Its massive RM5bn Pengerang project has a 60-year concessionGamuda 50% of Horizon Hills in Nusajaya (710 acres of unsold land, RM4.3bn balance GDV) Genting Plant Owns 6,571 acres of land near Senai airport. Owns the Johor Premium OutletE&O Owns 210 acres in Medini that will be developed into a wellness projectIOI Corp Owns 1,955 acres of land in Kulai, near the Senai airportLafarge 40% cement market share and beneficiary of Iskandar property and oil & gas projectsMah Sing Owns 433 acres in Johor including 8.2 acres in MediniSP Setia Dominant developer in wider Johor with over 1,000 acres of landbankSunway Owns 1,858 acres of land in Iskandar with total GDV of RM30bn Tat Hong Potential beneficiary of the MRT and HSR lines linking to Iskandar UEM Land Has the largest landbank of any developer in Iskandar with over 7,000 acres undevelopedWCT Owns 46 acres of land in Johor including 34 acres in MediniYongnam Potential beneficiary of the MRT and HSR lines linking to Iskandar
SOURCES: CIMB, COMPANY REPORTS
In this report we analyse Iskandar not merely from the typical property angle but also measure its progress economically and identify other sectors that will benefit directly or indirectly from proximity to the development corridor. Also, we look at Iskandar from the Singapore perspective as their buy-in is critical for its success. For exposure to Iskandar, our top choices include UEM Land, WCT and CapitaLand.
Why the sudden interest? The Iskandar Malaysia development corridor has been long in the making and can in fact trace its roots to Renong and its Prolink 2020 project in the 1990s. But it was the completion of LegoLand, Puteri Harbour Family Theme Park and several education institutions in 2012 that woke up developers and property buyers on both sides of the Causeway to its huge potential. The recent meetings between the prime ministers of the two countries and the go ahead for the RM30bn high-speed rail project have cemented Iskandar's
position as the Shenzhen of Malaysia. Since Oct last year, Singapore investors have taken the plunge and invested in four multi-billion ringgit projects in Iskandar.
How best to play Iskandar? Thus far it is the property and construction companies that have benefitted the most from Iskandar. The best proxy has always been UEM Land due to its huge landbank in Nusajaya and the fact that it is the flagship development arm of Khazanah Holdings, the key planner and driver for Iskandar. But there are other winners from the corridor's lift-off, including building material companies given the construction boom, plantation companies with vast landbank in Johor, oil & gas companies on the back of two massive projects in Pengerang as well as Singapore developers and contractors that are making a beeline to Johor and Iskandar.
Notes from the Field
Terence Wong CFA
T (60) 3 20849689 E [email protected]
Kenneth Ng CFA
T (65) 62108610 E [email protected]
Lee Heng Guie
T (60) 3 20849667 E [email protected]
Ivy Ng Lee Fang CFA
T (60) 3 20849697 E [email protected]
Sharizan Rosely
T (60) 3 20849864 E [email protected]
Jonathan Ng
T (65) 62108650 E [email protected]
“Iskandar Malaysia performed beyond expectations last year, having breached the RM100bn mark in total committed investments."
─ Dato' Sri Najib Razak, Prime Minister Malaysia
Highlighted Companies
CapitaLand CapitaLand recently invested in a mixed development greenfield project at Danga Bay, Iskandar, with an expected GDV of RM8.1bn. This project will take 10-15 years to complete and currently forms only 1% of CapLand's RNAV.
UEM Land UEM Land remains the best proxy for Iskandar due to its huge landbank in Nusajaya and robust property sales from the township. The group owns another 679 acres in Desaru, Johor, which is being positioned to complement Iskandar.
WCT WCT owns 34 acres of land located within Medini in Iskandar with GDV of RM2.8bn. WCT's RM767m contract for infrastructure works in Medini (secured in Jul 09) is almost completed with RM36m worth of works outstanding.
March 18, 2013
4
KEY CHARTS
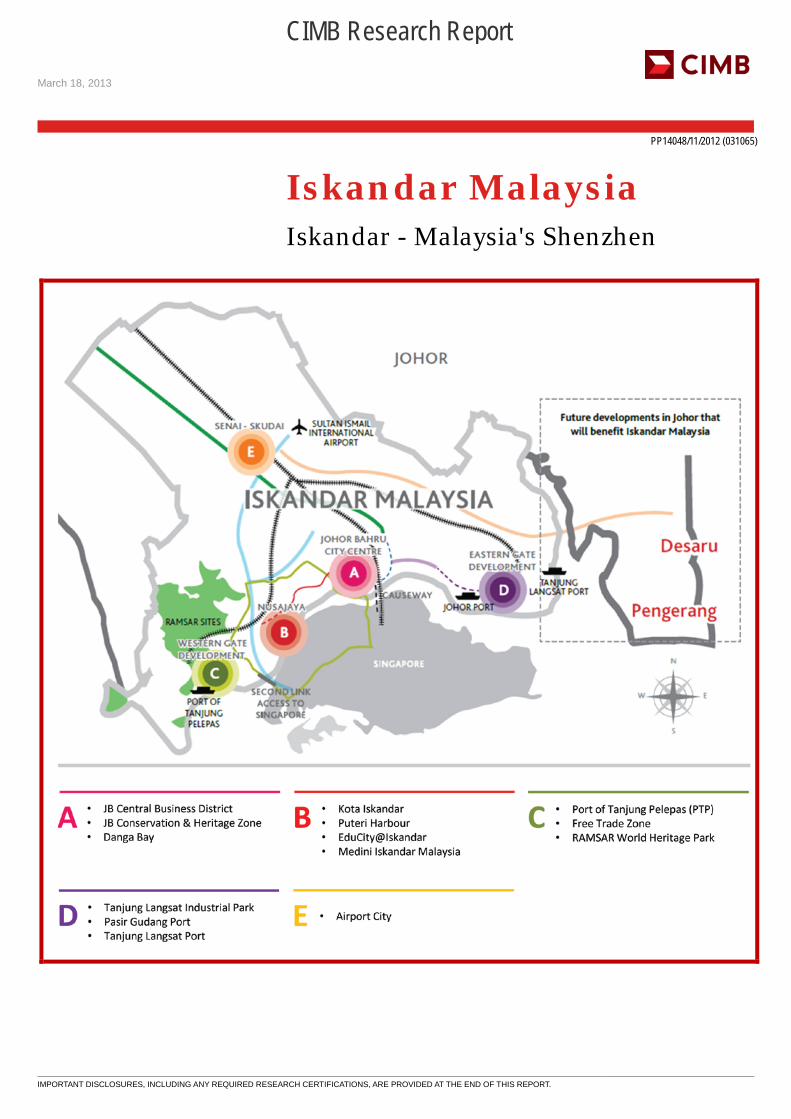
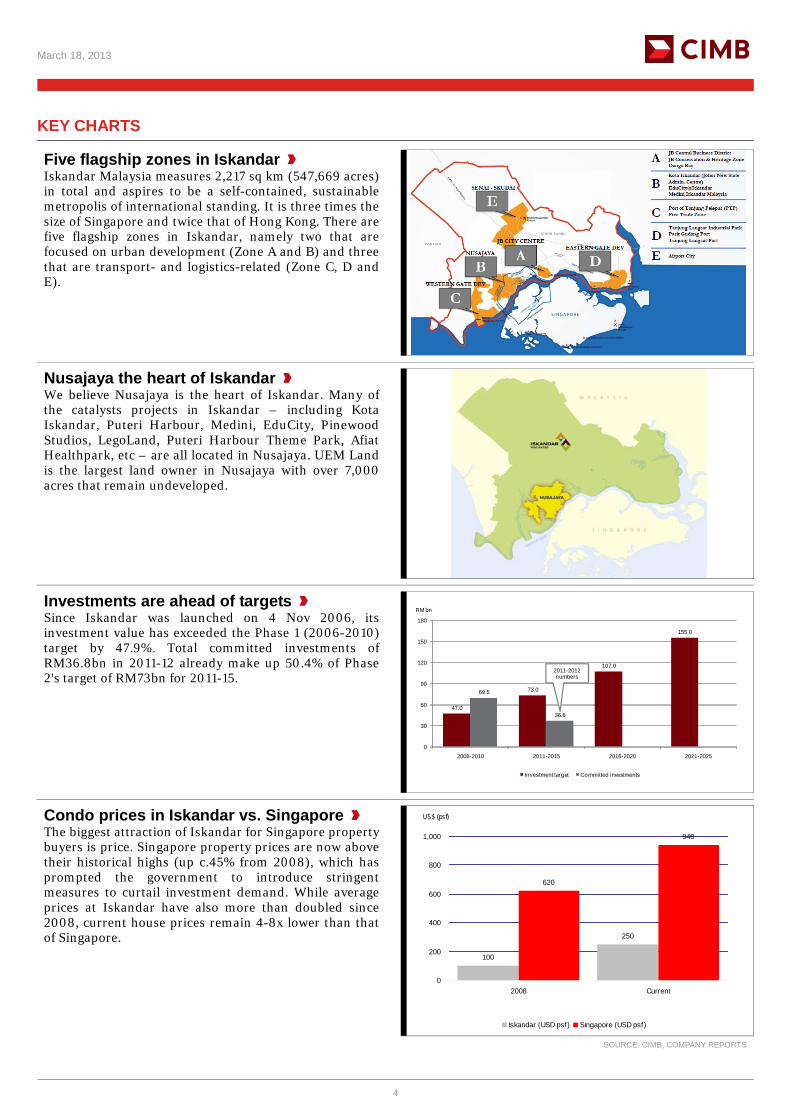
Five flagship zones in Iskandar Iskandar Malaysia measures 2,217 sq km (547,669 acres) in total and aspires to be a self-contained, sustainable metropolis of international standing. It is three times the size of Singapore and twice that of Hong Kong. There are five flagship zones in Iskandar, namely two that are focused on urban development (Zone A and B) and three that are transport- and logistics-related (Zone C, D and E).
Nusajaya the heart of Iskandar We believe Nusajaya is the heart of Iskandar. Many of the catalysts projects in Iskandar – including Kota Iskandar, Puteri Harbour, Medini, EduCity, Pinewood Studios, LegoLand, Puteri Harbour Theme Park, Afiat Healthpark, etc – are all located in Nusajaya. UEM Land is the largest land owner in Nusajaya with over 7,000 acres that remain undeveloped.
Investments are ahead of targets Since Iskandar was launched on 4 Nov 2006, its investment value has exceeded the Phase 1 (2006-2010) target by 47.9%. Total committed investments of RM36.8bn in 2011-12 already make up 50.4% of Phase 2's target of RM73bn for 2011-15.
47.0
73.0
107.0
155.0
69.5
36.8
0
30
60
90
120
150
180
2006-2010 2011-2015 2016-2020 2021-2025
RM bn
Investment target Committed investments
2011-2012 numbers
Condo prices in Iskandar vs. Singapore The biggest attraction of Iskandar for Singapore property buyers is price. Singapore property prices are now above their historical highs (up c.45% from 2008), which has prompted the government to introduce stringent measures to curtail investment demand. While average prices at Iskandar have also more than doubled since 2008, current house prices remain 4-8x lower than that of Singapore.
100
250
620
940
0
200
400
600
800
1,000
2008 Current
Iskandar (USD psf) Singapore (USD psf)
US$ (psf)
SOURCE: CIMB, COMPANY REPORTS
March 18, 2013
5
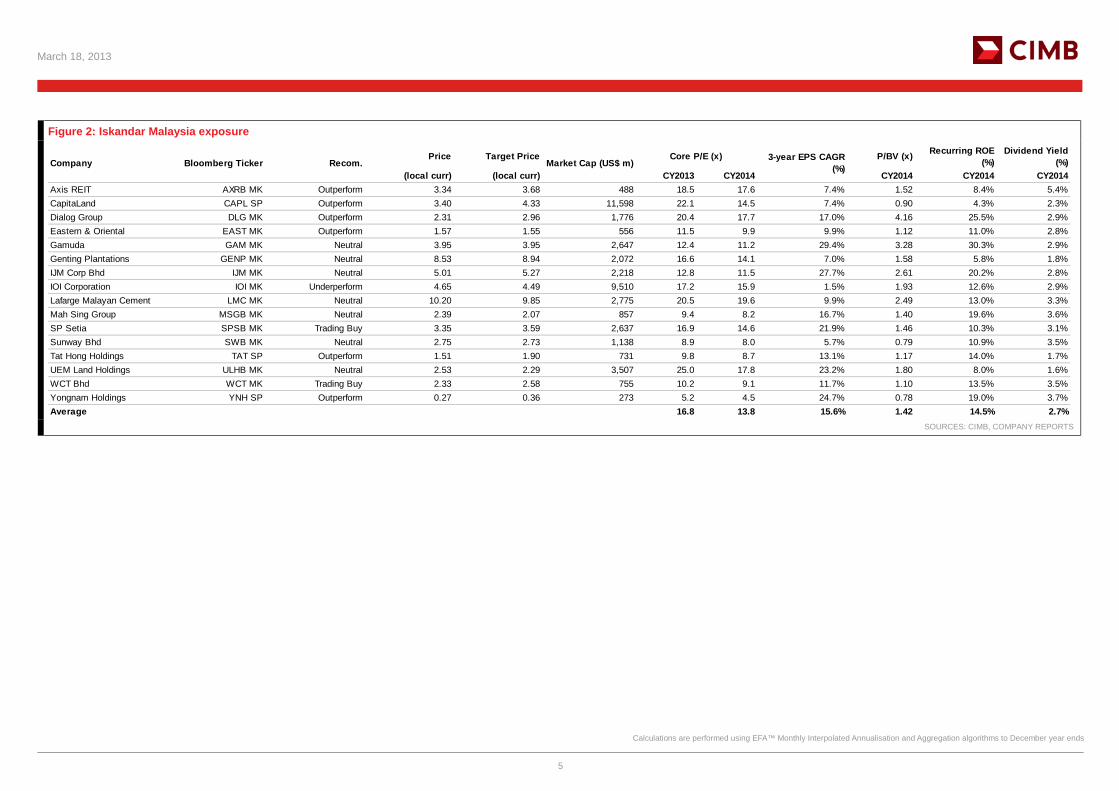
Figure 2: Iskandar Malaysia exposure
Price Target Price P/BV (x) Recurring ROE (%)
Dividend Yield (%)
(local curr) (local curr) CY2013 CY2014 CY2014 CY2014 CY2014Axis REIT AXRB MK Outperform 3.34 3.68 488 18.5 17.6 7.4% 1.52 8.4% 5.4%CapitaLand CAPL SP Outperform 3.40 4.33 11,598 22.1 14.5 7.4% 0.90 4.3% 2.3%Dialog Group DLG MK Outperform 2.31 2.96 1,776 20.4 17.7 17.0% 4.16 25.5% 2.9%Eastern & Oriental EAST MK Outperform 1.57 1.55 556 11.5 9.9 9.9% 1.12 11.0% 2.8%Gamuda GAM MK Neutral 3.95 3.95 2,647 12.4 11.2 29.4% 3.28 30.3% 2.9%Genting Plantations GENP MK Neutral 8.53 8.94 2,072 16.6 14.1 7.0% 1.58 5.8% 1.8%IJM Corp Bhd IJM MK Neutral 5.01 5.27 2,218 12.8 11.5 27.7% 2.61 20.2% 2.8%IOI Corporation IOI MK Underperform 4.65 4.49 9,510 17.2 15.9 1.5% 1.93 12.6% 2.9%Lafarge Malayan Cement LMC MK Neutral 10.20 9.85 2,775 20.5 19.6 9.9% 2.49 13.0% 3.3%Mah Sing Group MSGB MK Neutral 2.39 2.07 857 9.4 8.2 16.7% 1.40 19.6% 3.6%SP Setia SPSB MK Trading Buy 3.35 3.59 2,637 16.9 14.6 21.9% 1.46 10.3% 3.1%Sunway Bhd SWB MK Neutral 2.75 2.73 1,138 8.9 8.0 5.7% 0.79 10.9% 3.5%Tat Hong Holdings TAT SP Outperform 1.51 1.90 731 9.8 8.7 13.1% 1.17 14.0% 1.7%UEM Land Holdings ULHB MK Neutral 2.53 2.29 3,507 25.0 17.8 23.2% 1.80 8.0% 1.6%WCT Bhd WCT MK Trading Buy 2.33 2.58 755 10.2 9.1 11.7% 1.10 13.5% 3.5%Yongnam Holdings YNH SP Outperform 0.27 0.36 273 5.2 4.5 24.7% 0.78 19.0% 3.7%Average 16.8 13.8 15.6% 1.42 14.5% 2.7%
Company Bloomberg Ticker Recom. Market Cap (US$ m)Core P/E (x) 3-year EPS CAGR
(%)
SOURCES: CIMB, COMPANY REPORTS
Calculations are performed using EFA™ Monthly Interpolated Annualisation and Aggregation algorithms to December year ends
March 18, 2013
6
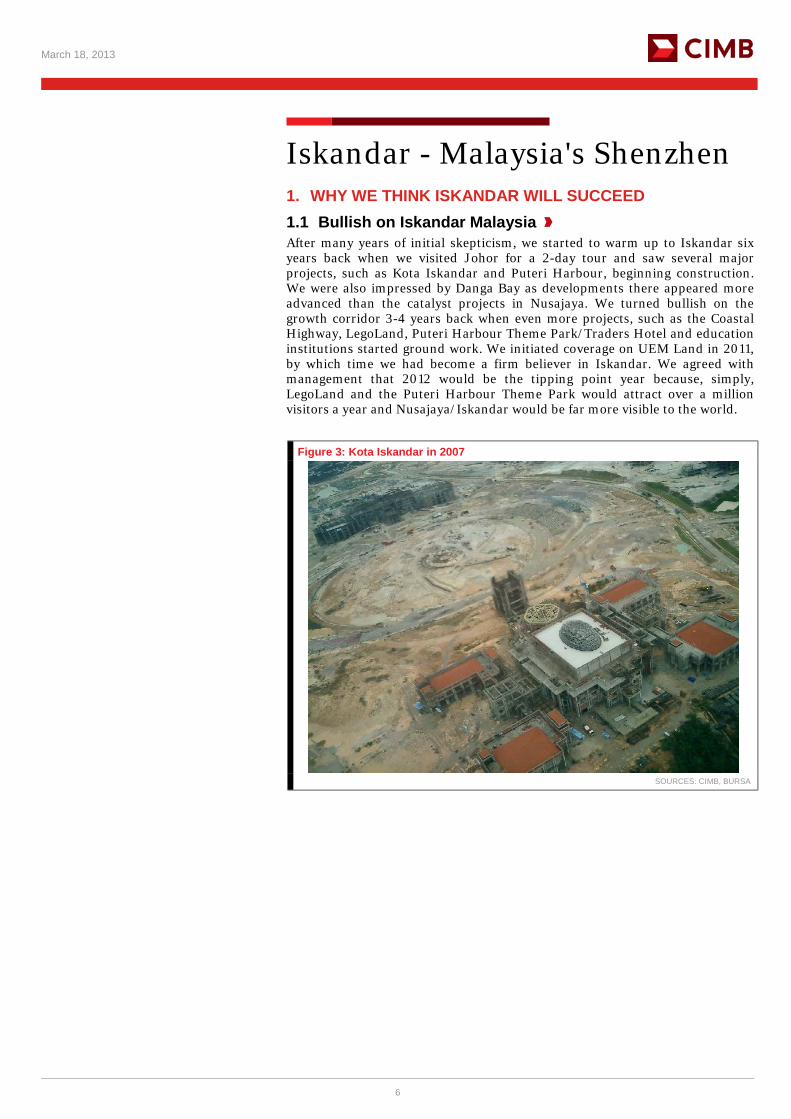
Iskandar - Malaysia's Shenzhen 1. WHY WE THINK ISKANDAR WILL SUCCEED 1.1 Bullish on Iskandar Malaysia After many years of initial skepticism, we started to warm up to Iskandar six years back when we visited Johor for a 2-day tour and saw several major projects, such as Kota Iskandar and Puteri Harbour, beginning construction. We were also impressed by Danga Bay as developments there appeared more advanced than the catalyst projects in Nusajaya. We turned bullish on the growth corridor 3-4 years back when even more projects, such as the Coastal Highway, LegoLand, Puteri Harbour Theme Park/Traders Hotel and education institutions started ground work. We initiated coverage on UEM Land in 2011, by which time we had become a firm believer in Iskandar. We agreed with management that 2012 would be the tipping point year because, simply, LegoLand and the Puteri Harbour Theme Park would attract over a million visitors a year and Nusajaya/Iskandar would be far more visible to the world.
Figure 3: Kota Iskandar in 2007
SOURCES: CIMB, BURSA
March 18, 2013
7
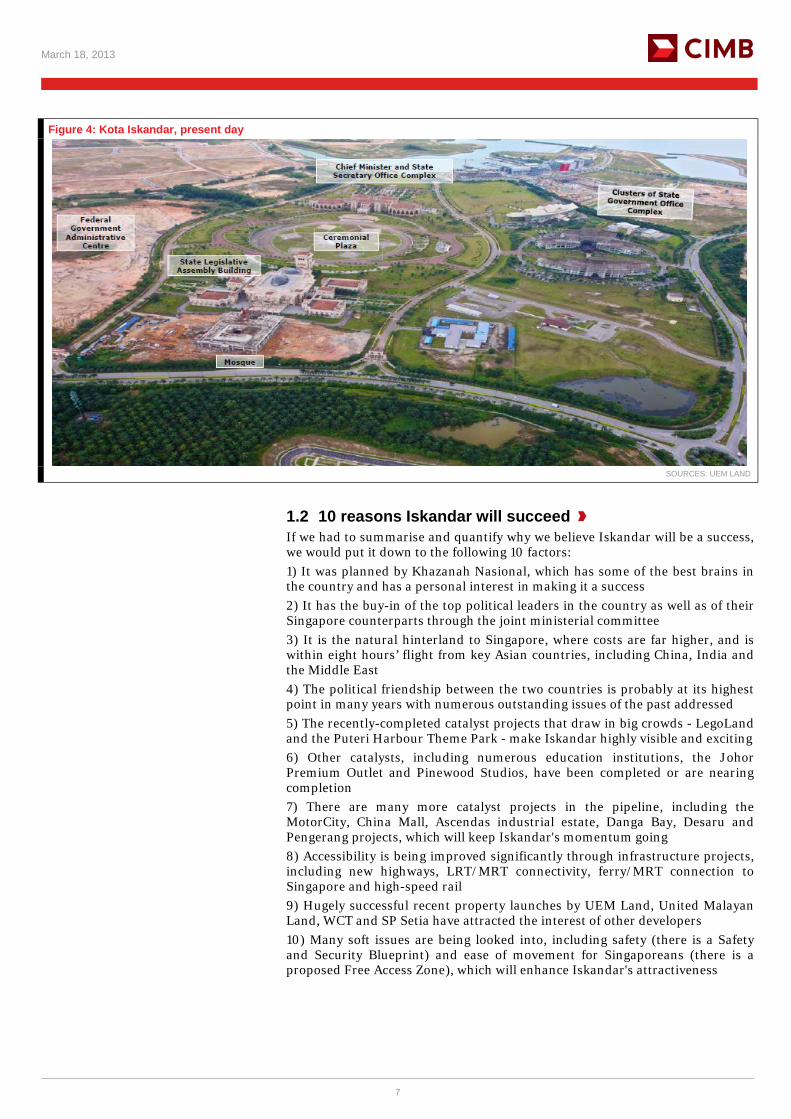
Figure 4: Kota Iskandar, present day
SOURCES: UEM LAND
1.2 10 reasons Iskandar will succeed If we had to summarise and quantify why we believe Iskandar will be a success, we would put it down to the following 10 factors: 1) It was planned by Khazanah Nasional, which has some of the best brains in the country and has a personal interest in making it a success 2) It has the buy-in of the top political leaders in the country as well as of their Singapore counterparts through the joint ministerial committee 3) It is the natural hinterland to Singapore, where costs are far higher, and is within eight hours’ flight from key Asian countries, including China, India and the Middle East 4) The political friendship between the two countries is probably at its highest point in many years with numerous outstanding issues of the past addressed 5) The recently-completed catalyst projects that draw in big crowds - LegoLand and the Puteri Harbour Theme Park - make Iskandar highly visible and exciting 6) Other catalysts, including numerous education institutions, the Johor Premium Outlet and Pinewood Studios, have been completed or are nearing completion 7) There are many more catalyst projects in the pipeline, including the MotorCity, China Mall, Ascendas industrial estate, Danga Bay, Desaru and Pengerang projects, which will keep Iskandar's momentum going 8) Accessibility is being improved significantly through infrastructure projects, including new highways, LRT/MRT connectivity, ferry/MRT connection to Singapore and high-speed rail 9) Hugely successful recent property launches by UEM Land, United Malayan Land, WCT and SP Setia have attracted the interest of other developers 10) Many soft issues are being looked into, including safety (there is a Safety and Security Blueprint) and ease of movement for Singaporeans (there is a proposed Free Access Zone), which will enhance Iskandar's attractiveness
March 18, 2013
8
2. BACKGROUND 2.1 Going back to the very beginning Iskandar can trace its roots to the Nusajaya township in Johor that began life as the Prolink 2020 project. Prolink 2020 was the brainchild of Tan Sri Halim Saad, the then major shareholder of Renong Berhad (subsequently renamed UEM World). The Prolink 2020 project was conceived in the early-1990s and, at 23,875 acres, was touted as the largest private township in Asia. The landbank came about as part of the construction of the Malaysia-Singapore Second Crossing as the highway connecting the North South Expressway to the second bridge to Singapore cuts through Prolink 2020. At that time, the township was estimated to have a GDV of RM8bn-9bn and a population of 500,000 when completed within 20 years. There were grand plans for the township then, including the development of duty-free shopping and education institutions.
We first visited the Prolink 2020 project in mid-1997, shortly after the maiden launch of Nusajaya on 14 April 1997. Even then, launches in the township were well-received, with a three-day queue for the official maiden launch of 600 mixed development units. Demand for link houses priced RM193,000-350,000 was strong as 216 non-Bumi units were fully sold out on the day of the launch. Likewise, SP Setia’s maiden launch of the 1,600-acre Bukit Indah township in Nusajaya (land which Renong sold to SP Setia) during the first week of May in 1997 was also well-received. Of the 850 link houses priced RM200,000-250,000, approximately 85% of the non-Bumi units were quickly snapped up.
2.2 Khazanah comes into the picture The 1997/98 Asian financial crisis caused major disruptions to the Malaysian economy, including to Renong and the Prolink 2020 project, which eventually led to the ownership of Renong and UEM Holdings changing hands from Tan Sri Halim Saad to Khazanah Nasional. Under Khazanah, the Renong-UEM Group underwent several restructuring exercises, which resulted in Nusajaya being listed under UEM Land Holdings in 2007. Via UEM Land, Khazanah emerged as one of the largest development land owners in Johor, which probably led to it taking on an enlarged role in the planning of the entire Iskandar Malaysia.
In 2005, Khazanah became the planner for the Iskandar Malaysia development corridor. Iskandar was one of five development corridors launched in 2006 under the 9th Malaysia Plan but was arguably the most important. In addition to its planning role, Khazanah was identified to play an investment role for catalyst infrastructure and development projects, such as the Johor State New Administrative Centre, the Southern Johor Industrial Logistic Cluster, Waterfront City, Medical Hub, EduCity and a proposed international destination resort. These initiatives were to complement the many existing and ongoing developments in the state, such as the Port of Tanjong Pelepas, Senai Airport, Danga Bay and Johor Corporation.
2.3 Iskandar Malaysia as we know it Previously known as the Iskandar Development Region, Iskandar Malaysia measures 2,217 sq km (547,669 acres) in total and aspires to be a self-contained, sustainable metropolis of international standing. It is three times the size of Singapore and twice that of Hong Kong and covers the southern part of Johor from the Senai Airport to the eastern and western coastal areas, including the capital of the state, Johor Bahru.
March 18, 2013
9
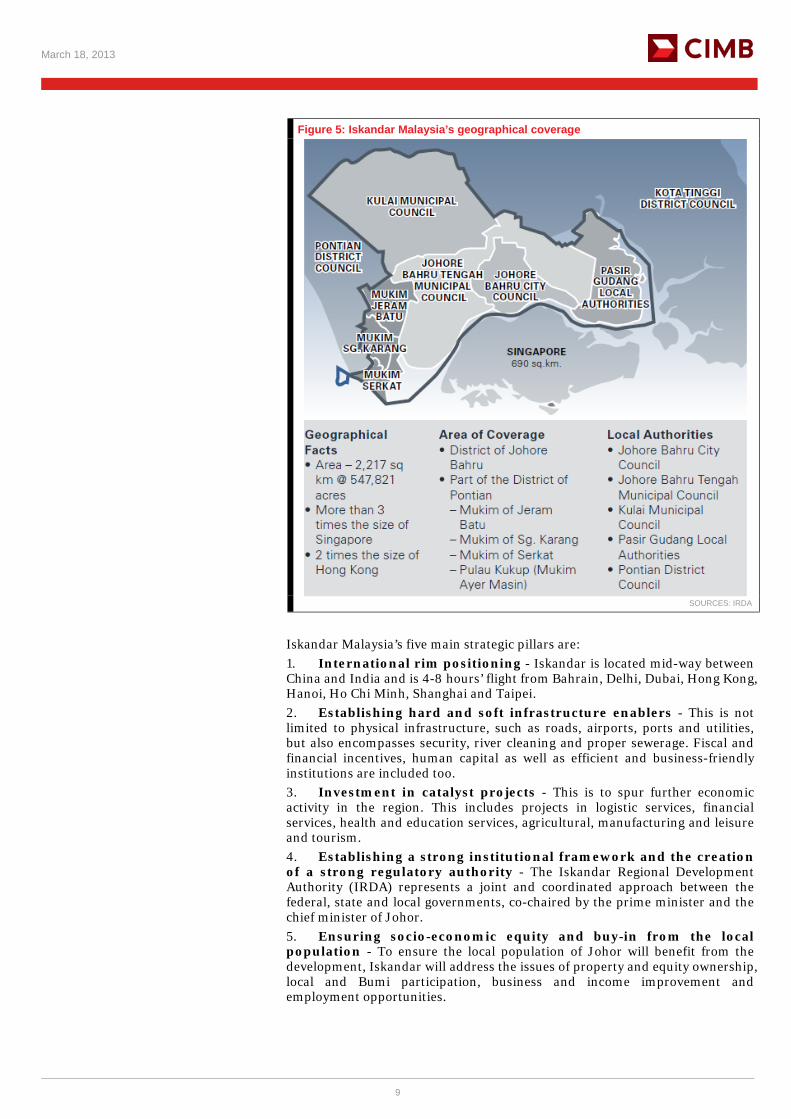
Figure 5: Iskandar Malaysia’s geographical coverage
SOURCES: IRDA
Iskandar Malaysia’s five main strategic pillars are: 1. International rim positioning - Iskandar is located mid-way between China and India and is 4-8 hours’ flight from Bahrain, Delhi, Dubai, Hong Kong, Hanoi, Ho Chi Minh, Shanghai and Taipei. 2. Establishing hard and soft infrastructure enablers - This is not limited to physical infrastructure, such as roads, airports, ports and utilities, but also encompasses security, river cleaning and proper sewerage. Fiscal and financial incentives, human capital as well as efficient and business-friendly institutions are included too. 3. Investment in catalyst projects - This is to spur further economic activity in the region. This includes projects in logistic services, financial services, health and education services, agricultural, manufacturing and leisure and tourism. 4. Establishing a strong institutional framework and the creation of a strong regulatory authority - The Iskandar Regional Development Authority (IRDA) represents a joint and coordinated approach between the federal, state and local governments, co-chaired by the prime minister and the chief minister of Johor. 5. Ensuring socio-economic equity and buy-in from the local population - To ensure the local population of Johor will benefit from the development, Iskandar will address the issues of property and equity ownership, local and Bumi participation, business and income improvement and employment opportunities.
March 18, 2013
10
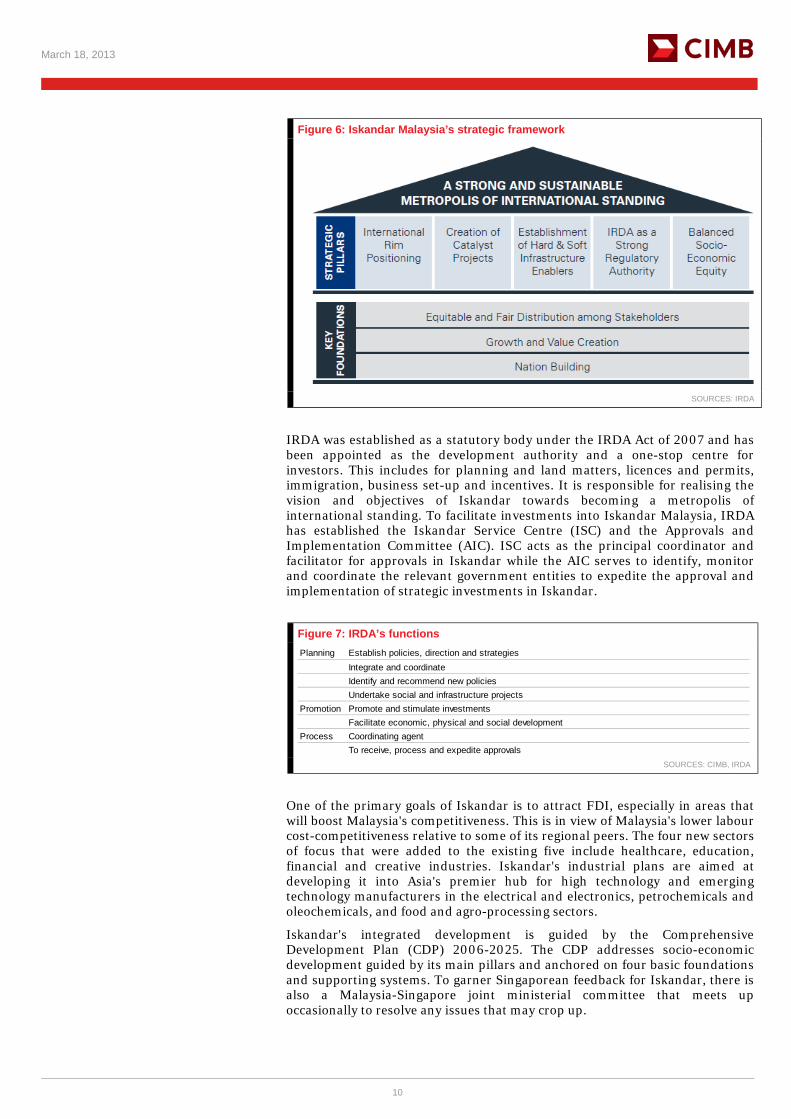
Figure 6: Iskandar Malaysia’s strategic framework
SOURCES: IRDA
IRDA was established as a statutory body under the IRDA Act of 2007 and has been appointed as the development authority and a one-stop centre for investors. This includes for planning and land matters, licences and permits, immigration, business set-up and incentives. It is responsible for realising the vision and objectives of Iskandar towards becoming a metropolis of international standing. To facilitate investments into Iskandar Malaysia, IRDA has established the Iskandar Service Centre (ISC) and the Approvals and Implementation Committee (AIC). ISC acts as the principal coordinator and facilitator for approvals in Iskandar while the AIC serves to identify, monitor and coordinate the relevant government entities to expedite the approval and implementation of strategic investments in Iskandar.
Figure 7: IRDA’s functions Planning Establish policies, direction and strategies
Integrate and coordinateIdentify and recommend new policiesUndertake social and infrastructure projects
Promotion Promote and stimulate investmentsFacilitate economic, physical and social development
Process Coordinating agentTo receive, process and expedite approvals
SOURCES: CIMB, IRDA
One of the primary goals of Iskandar is to attract FDI, especially in areas that will boost Malaysia's competitiveness. This is in view of Malaysia's lower labour cost-competitiveness relative to some of its regional peers. The four new sectors of focus that were added to the existing five include healthcare, education, financial and creative industries. Iskandar's industrial plans are aimed at developing it into Asia's premier hub for high technology and emerging technology manufacturers in the electrical and electronics, petrochemicals and oleochemicals, and food and agro-processing sectors.
Iskandar's integrated development is guided by the Comprehensive Development Plan (CDP) 2006-2025. The CDP addresses socio-economic development guided by its main pillars and anchored on four basic foundations and supporting systems. To garner Singaporean feedback for Iskandar, there is also a Malaysia-Singapore joint ministerial committee that meets up occasionally to resolve any issues that may crop up.
March 18, 2013
11
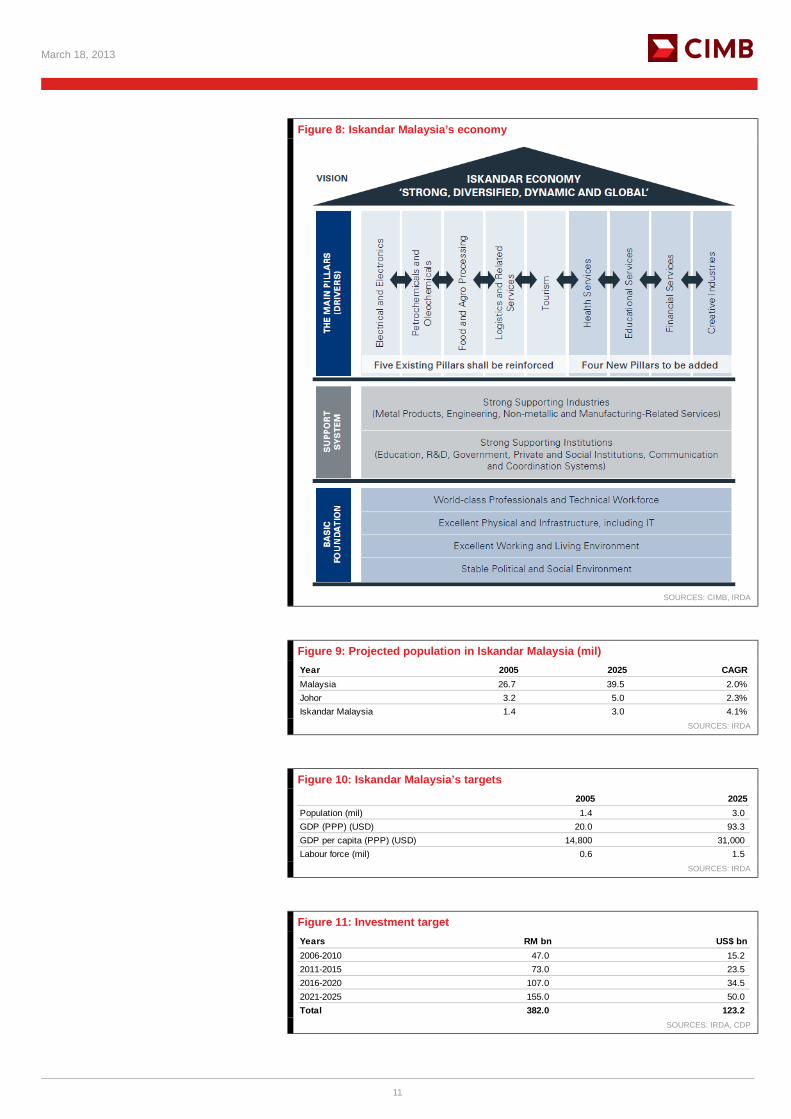
Figure 8: Iskandar Malaysia’s economy
SOURCES: CIMB, IRDA
Figure 9: Projected population in Iskandar Malaysia (mil) Year 2005 2025 CAGRMalaysia 26.7 39.5 2.0%Johor 3.2 5.0 2.3%Iskandar Malaysia 1.4 3.0 4.1%
SOURCES: IRDA
Figure 10: Iskandar Malaysia’s targets 2005 2025
Population (mil) 1.4 3.0 GDP (PPP) (USD) 20.0 93.3 GDP per capita (PPP) (USD) 14,800 31,000 Labour force (mil) 0.6 1.5
SOURCES: IRDA
Figure 11: Investment target Years RM bn US$ bn2006-2010 47.0 15.2 2011-2015 73.0 23.5 2016-2020 107.0 34.5 2021-2025 155.0 50.0 Total 382.0 123.2
SOURCES: IRDA, CDP
March 18, 2013
12
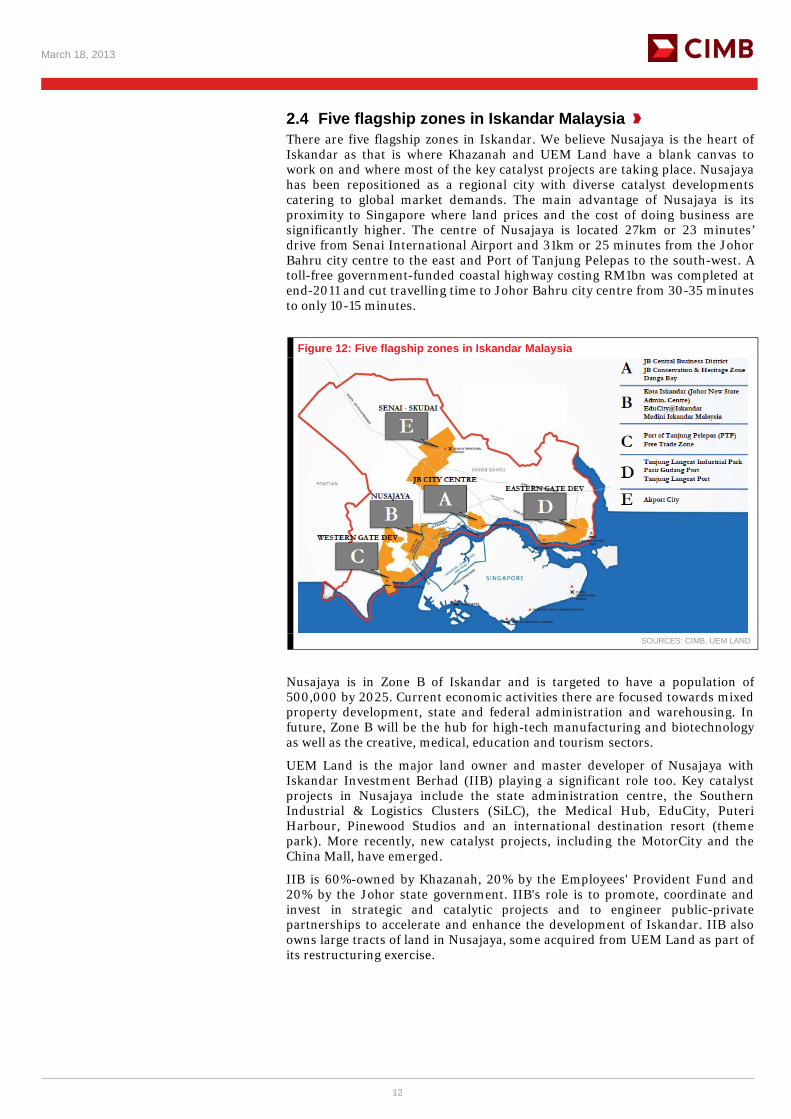
2.4 Five flagship zones in Iskandar Malaysia There are five flagship zones in Iskandar. We believe Nusajaya is the heart of Iskandar as that is where Khazanah and UEM Land have a blank canvas to work on and where most of the key catalyst projects are taking place. Nusajaya has been repositioned as a regional city with diverse catalyst developments catering to global market demands. The main advantage of Nusajaya is its proximity to Singapore where land prices and the cost of doing business are significantly higher. The centre of Nusajaya is located 27km or 23 minutes’ drive from Senai International Airport and 31km or 25 minutes from the Johor Bahru city centre to the east and Port of Tanjung Pelepas to the south-west. A toll-free government-funded coastal highway costing RM1bn was completed at end-2011 and cut travelling time to Johor Bahru city centre from 30-35 minutes to only 10-15 minutes.
Figure 12: Five flagship zones in Iskandar Malaysia
SOURCES: CIMB, UEM LAND
Nusajaya is in Zone B of Iskandar and is targeted to have a population of 500,000 by 2025. Current economic activities there are focused towards mixed property development, state and federal administration and warehousing. In future, Zone B will be the hub for high-tech manufacturing and biotechnology as well as the creative, medical, education and tourism sectors.
UEM Land is the major land owner and master developer of Nusajaya with Iskandar Investment Berhad (IIB) playing a significant role too. Key catalyst projects in Nusajaya include the state administration centre, the Southern Industrial & Logistics Clusters (SiLC), the Medical Hub, EduCity, Puteri Harbour, Pinewood Studios and an international destination resort (theme park). More recently, new catalyst projects, including the MotorCity and the China Mall, have emerged.
IIB is 60%-owned by Khazanah, 20% by the Employees' Provident Fund and 20% by the Johor state government. IIB's role is to promote, coordinate and invest in strategic and catalytic projects and to engineer public-private partnerships to accelerate and enhance the development of Iskandar. IIB also owns large tracts of land in Nusajaya, some acquired from UEM Land as part of its restructuring exercise.
March 18, 2013
13
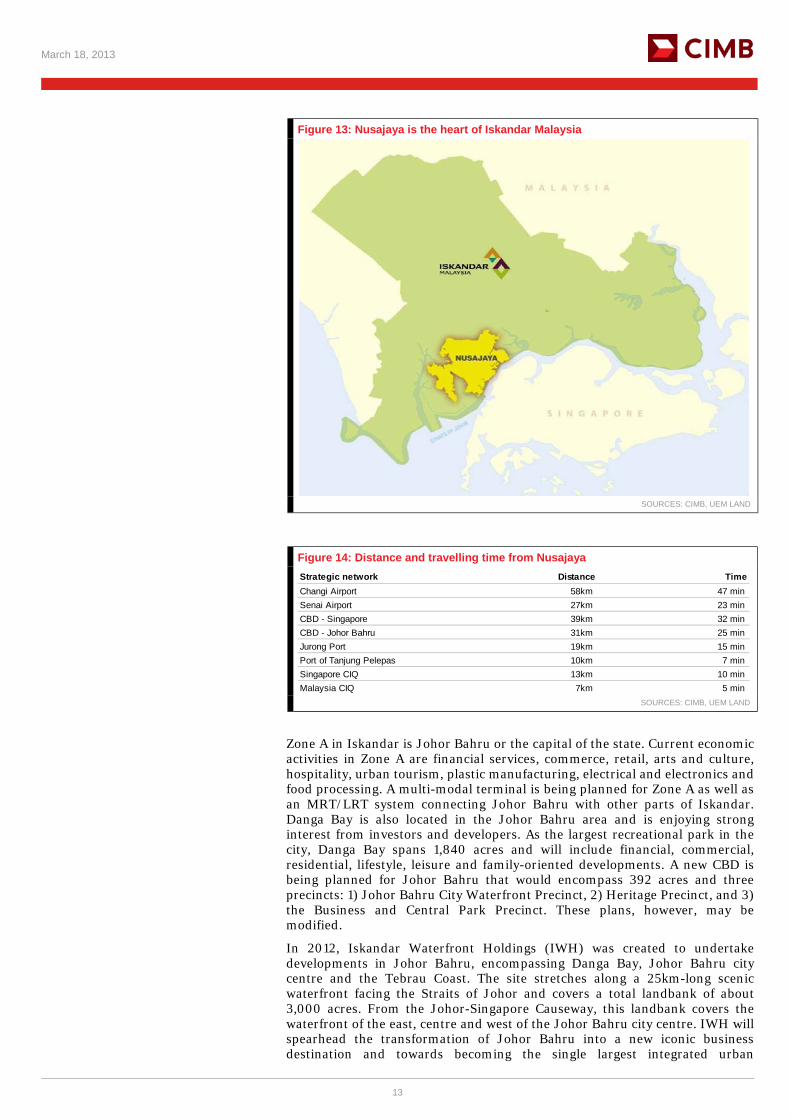
Figure 13: Nusajaya is the heart of Iskandar Malaysia
SOURCES: CIMB, UEM LAND
Figure 14: Distance and travelling time from Nusajaya Strategic network Distance Time Changi Airport 58km 47 minSenai Airport 27km 23 minCBD - Singapore 39km 32 minCBD - Johor Bahru 31km 25 minJurong Port 19km 15 minPort of Tanjung Pelepas 10km 7 minSingapore CIQ 13km 10 minMalaysia CIQ 7km 5 min
SOURCES: CIMB, UEM LAND
Zone A in Iskandar is Johor Bahru or the capital of the state. Current economic activities in Zone A are financial services, commerce, retail, arts and culture, hospitality, urban tourism, plastic manufacturing, electrical and electronics and food processing. A multi-modal terminal is being planned for Zone A as well as an MRT/LRT system connecting Johor Bahru with other parts of Iskandar. Danga Bay is also located in the Johor Bahru area and is enjoying strong interest from investors and developers. As the largest recreational park in the city, Danga Bay spans 1,840 acres and will include financial, commercial, residential, lifestyle, leisure and family-oriented developments. A new CBD is being planned for Johor Bahru that would encompass 392 acres and three precincts: 1) Johor Bahru City Waterfront Precinct, 2) Heritage Precinct, and 3) the Business and Central Park Precinct. These plans, however, may be modified.
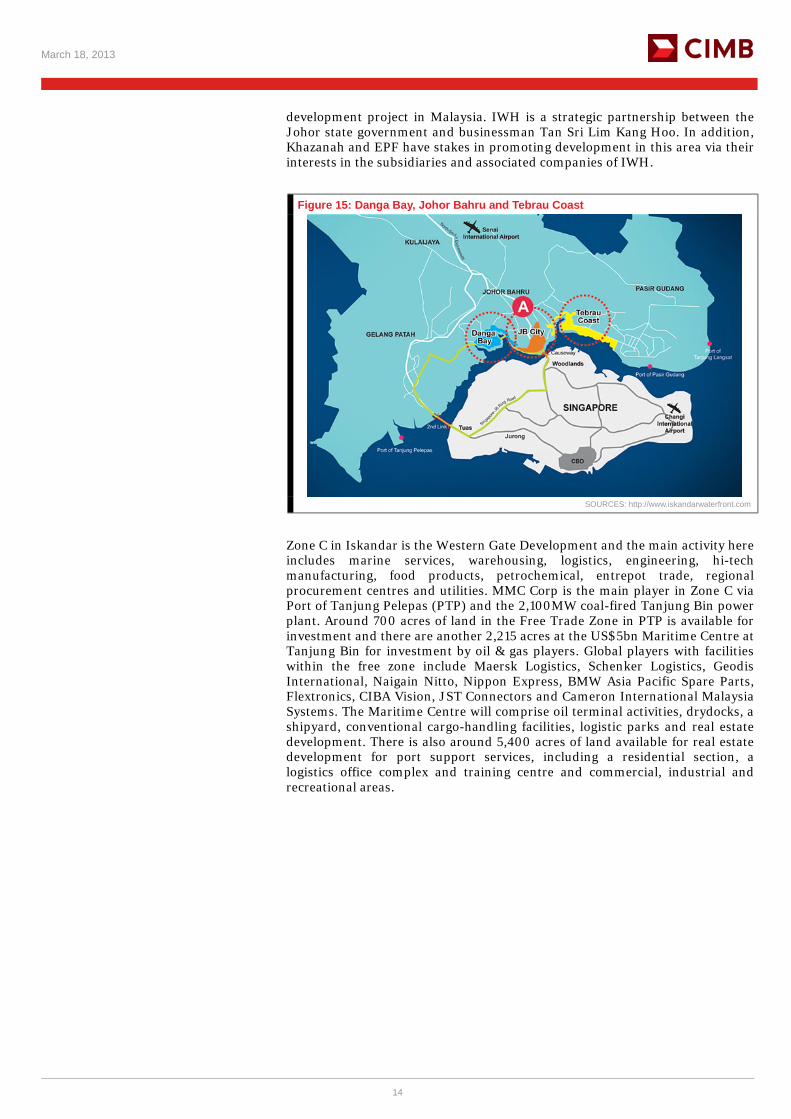
In 2012, Iskandar Waterfront Holdings (IWH) was created to undertake developments in Johor Bahru, encompassing Danga Bay, Johor Bahru city centre and the Tebrau Coast. The site stretches along a 25km-long scenic waterfront facing the Straits of Johor and covers a total landbank of about 3,000 acres. From the Johor-Singapore Causeway, this landbank covers the waterfront of the east, centre and west of the Johor Bahru city centre. IWH will spearhead the transformation of Johor Bahru into a new iconic business destination and towards becoming the single largest integrated urban
March 18, 2013
14
development project in Malaysia. IWH is a strategic partnership between the Johor state government and businessman Tan Sri Lim Kang Hoo. In addition, Khazanah and EPF have stakes in promoting development in this area via their interests in the subsidiaries and associated companies of IWH.
Figure 15: Danga Bay, Johor Bahru and Tebrau Coast
SOURCES: http://www.iskandarwaterfront.com
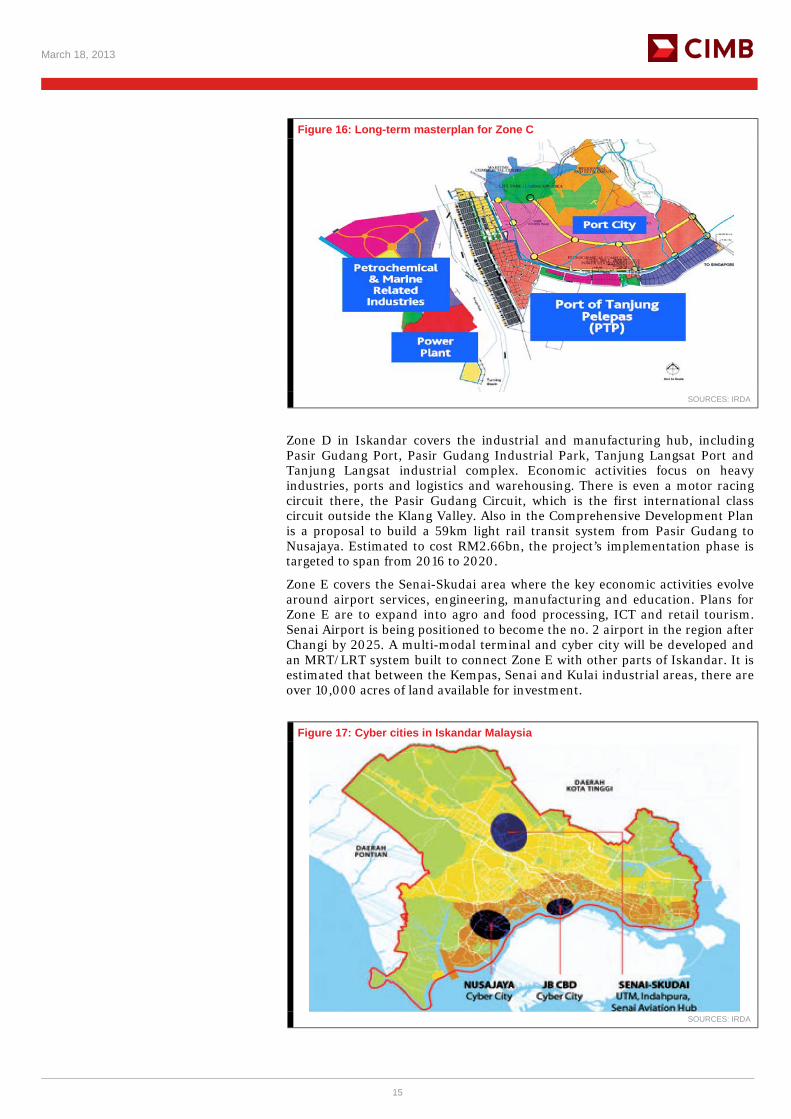
Zone C in Iskandar is the Western Gate Development and the main activity here includes marine services, warehousing, logistics, engineering, hi-tech manufacturing, food products, petrochemical, entrepot trade, regional procurement centres and utilities. MMC Corp is the main player in Zone C via Port of Tanjung Pelepas (PTP) and the 2,100MW coal-fired Tanjung Bin power plant. Around 700 acres of land in the Free Trade Zone in PTP is available for investment and there are another 2,215 acres at the US$5bn Maritime Centre at Tanjung Bin for investment by oil & gas players. Global players with facilities within the free zone include Maersk Logistics, Schenker Logistics, Geodis International, Naigain Nitto, Nippon Express, BMW Asia Pacific Spare Parts, Flextronics, CIBA Vision, JST Connectors and Cameron International Malaysia Systems. The Maritime Centre will comprise oil terminal activities, drydocks, a shipyard, conventional cargo-handling facilities, logistic parks and real estate development. There is also around 5,400 acres of land available for real estate development for port support services, including a residential section, a logistics office complex and training centre and commercial, industrial and recreational areas.
March 18, 2013
15
Figure 16: Long-term masterplan for Zone C
SOURCES: IRDA
Zone D in Iskandar covers the industrial and manufacturing hub, including Pasir Gudang Port, Pasir Gudang Industrial Park, Tanjung Langsat Port and Tanjung Langsat industrial complex. Economic activities focus on heavy industries, ports and logistics and warehousing. There is even a motor racing circuit there, the Pasir Gudang Circuit, which is the first international class circuit outside the Klang Valley. Also in the Comprehensive Development Plan is a proposal to build a 59km light rail transit system from Pasir Gudang to Nusajaya. Estimated to cost RM2.66bn, the project’s implementation phase is targeted to span from 2016 to 2020.
Zone E covers the Senai-Skudai area where the key economic activities evolve around airport services, engineering, manufacturing and education. Plans for Zone E are to expand into agro and food processing, ICT and retail tourism. Senai Airport is being positioned to become the no. 2 airport in the region after Changi by 2025. A multi-modal terminal and cyber city will be developed and an MRT/LRT system built to connect Zone E with other parts of Iskandar. It is estimated that between the Kempas, Senai and Kulai industrial areas, there are over 10,000 acres of land available for investment.
Figure 17: Cyber cities in Iskandar Malaysia
SOURCES: IRDA
March 18, 2013
16
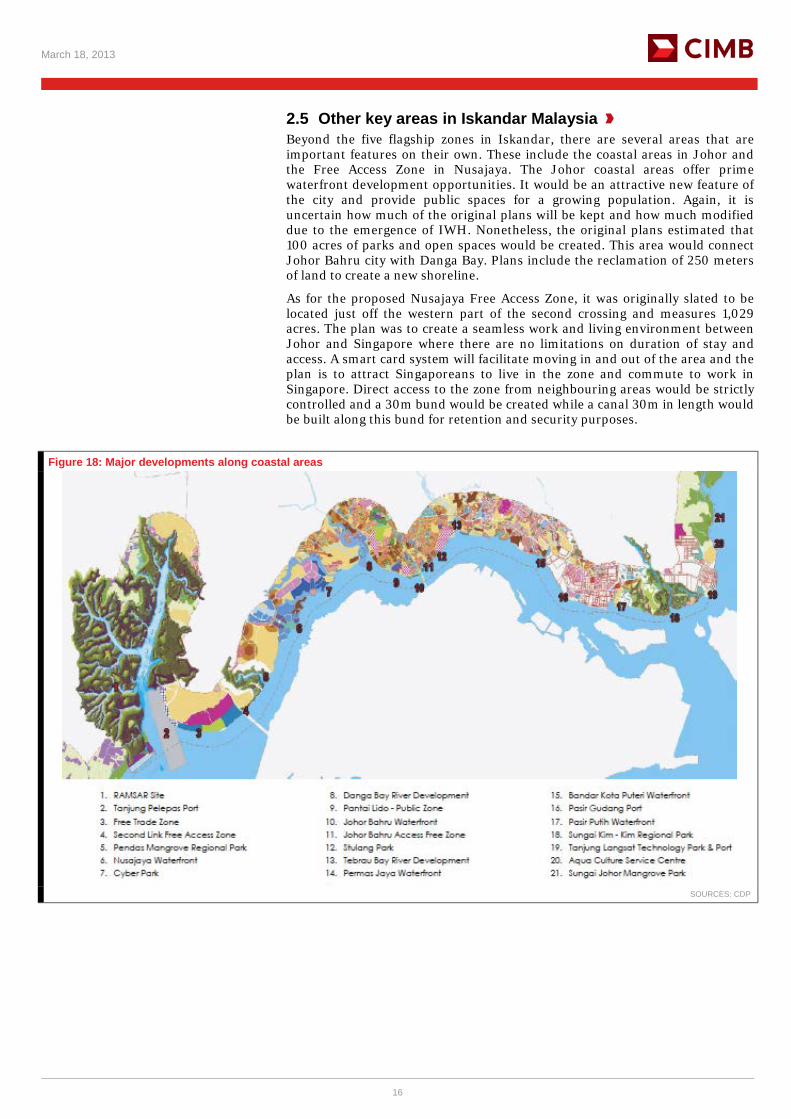
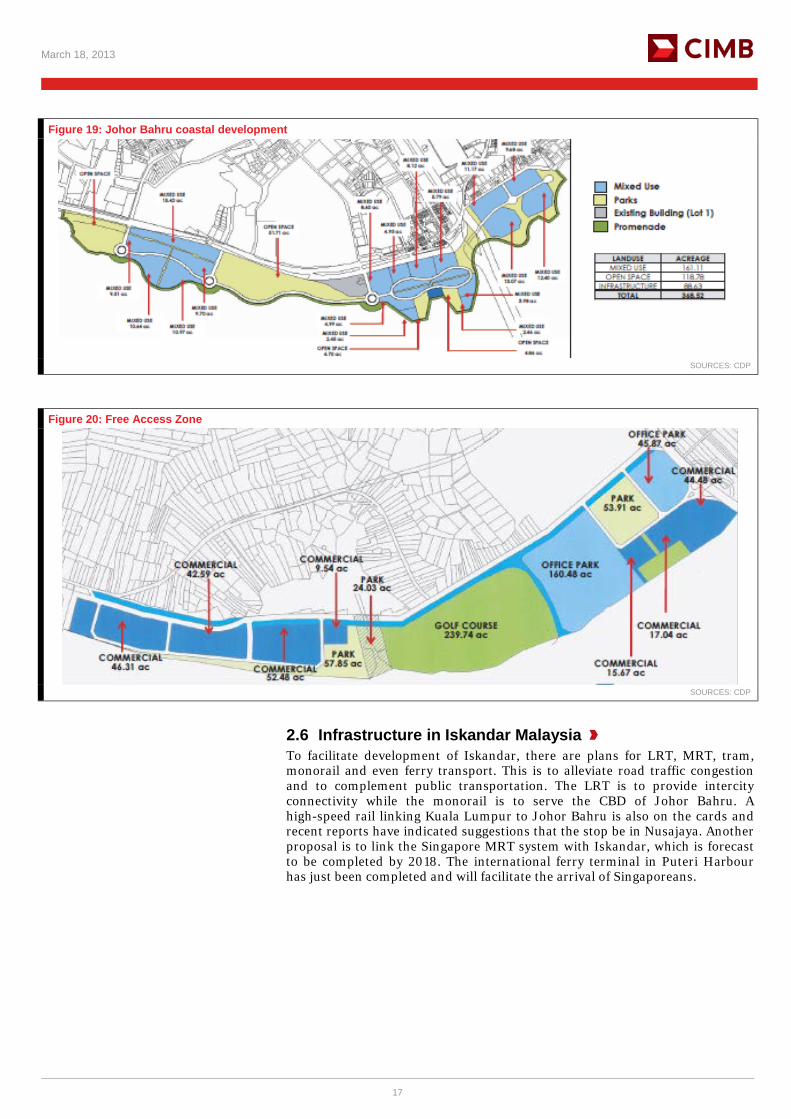
2.5 Other key areas in Iskandar Malaysia Beyond the five flagship zones in Iskandar, there are several areas that are important features on their own. These include the coastal areas in Johor and the Free Access Zone in Nusajaya. The Johor coastal areas offer prime waterfront development opportunities. It would be an attractive new feature of the city and provide public spaces for a growing population. Again, it is uncertain how much of the original plans will be kept and how much modified due to the emergence of IWH. Nonetheless, the original plans estimated that 100 acres of parks and open spaces would be created. This area would connect Johor Bahru city with Danga Bay. Plans include the reclamation of 250 meters of land to create a new shoreline.
As for the proposed Nusajaya Free Access Zone, it was originally slated to be located just off the western part of the second crossing and measures 1,029 acres. The plan was to create a seamless work and living environment between Johor and Singapore where there are no limitations on duration of stay and access. A smart card system will facilitate moving in and out of the area and the plan is to attract Singaporeans to live in the zone and commute to work in Singapore. Direct access to the zone from neighbouring areas would be strictly controlled and a 30m bund would be created while a canal 30m in length would be built along this bund for retention and security purposes.
Figure 18: Major developments along coastal areas
SOURCES: CDP
March 18, 2013
17
Figure 19: Johor Bahru coastal development
SOURCES: CDP
Figure 20: Free Access Zone
SOURCES: CDP
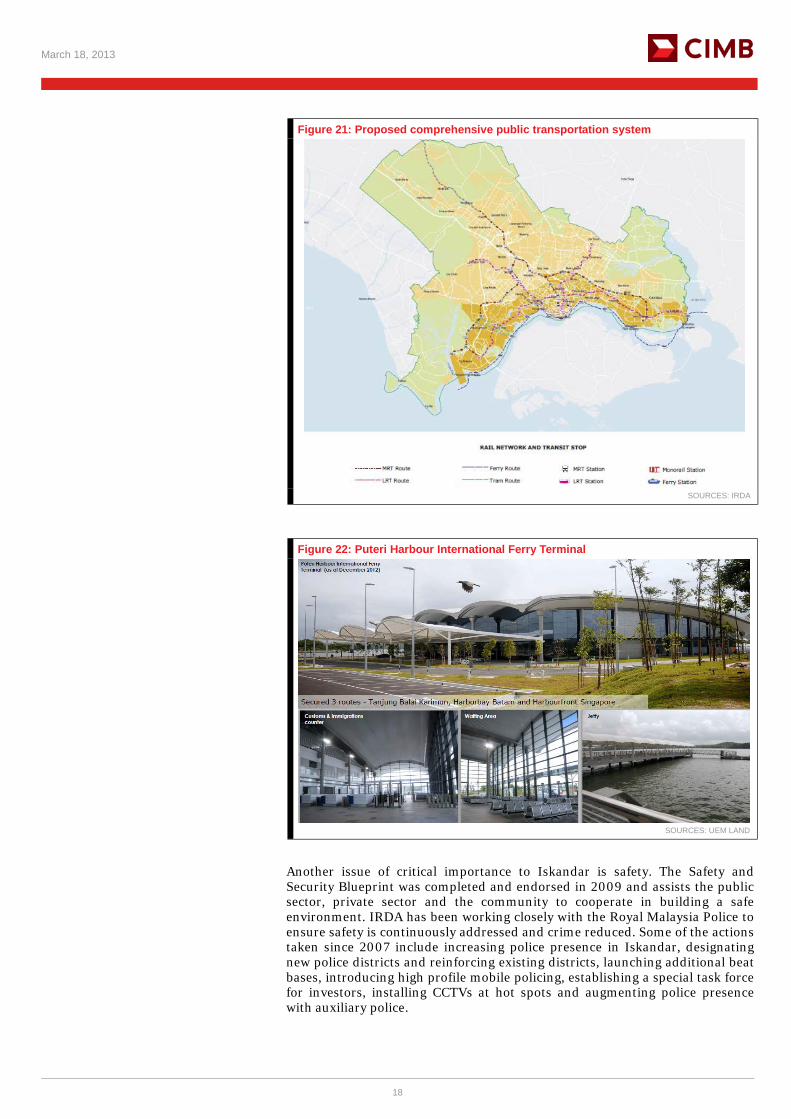
2.6 Infrastructure in Iskandar Malaysia To facilitate development of Iskandar, there are plans for LRT, MRT, tram, monorail and even ferry transport. This is to alleviate road traffic congestion and to complement public transportation. The LRT is to provide intercity connectivity while the monorail is to serve the CBD of Johor Bahru. A high-speed rail linking Kuala Lumpur to Johor Bahru is also on the cards and recent reports have indicated suggestions that the stop be in Nusajaya. Another proposal is to link the Singapore MRT system with Iskandar, which is forecast to be completed by 2018. The international ferry terminal in Puteri Harbour has just been completed and will facilitate the arrival of Singaporeans.
March 18, 2013
18
Figure 21: Proposed comprehensive public transportation system
SOURCES: IRDA
Figure 22: Puteri Harbour International Ferry Terminal
SOURCES: UEM LAND
Another issue of critical importance to Iskandar is safety. The Safety and Security Blueprint was completed and endorsed in 2009 and assists the public sector, private sector and the community to cooperate in building a safe environment. IRDA has been working closely with the Royal Malaysia Police to ensure safety is continuously addressed and crime reduced. Some of the actions taken since 2007 include increasing police presence in Iskandar, designating new police districts and reinforcing existing districts, launching additional beat bases, introducing high profile mobile policing, establishing a special task force for investors, installing CCTVs at hot spots and augmenting police presence with auxiliary police.
March 18, 2013
19
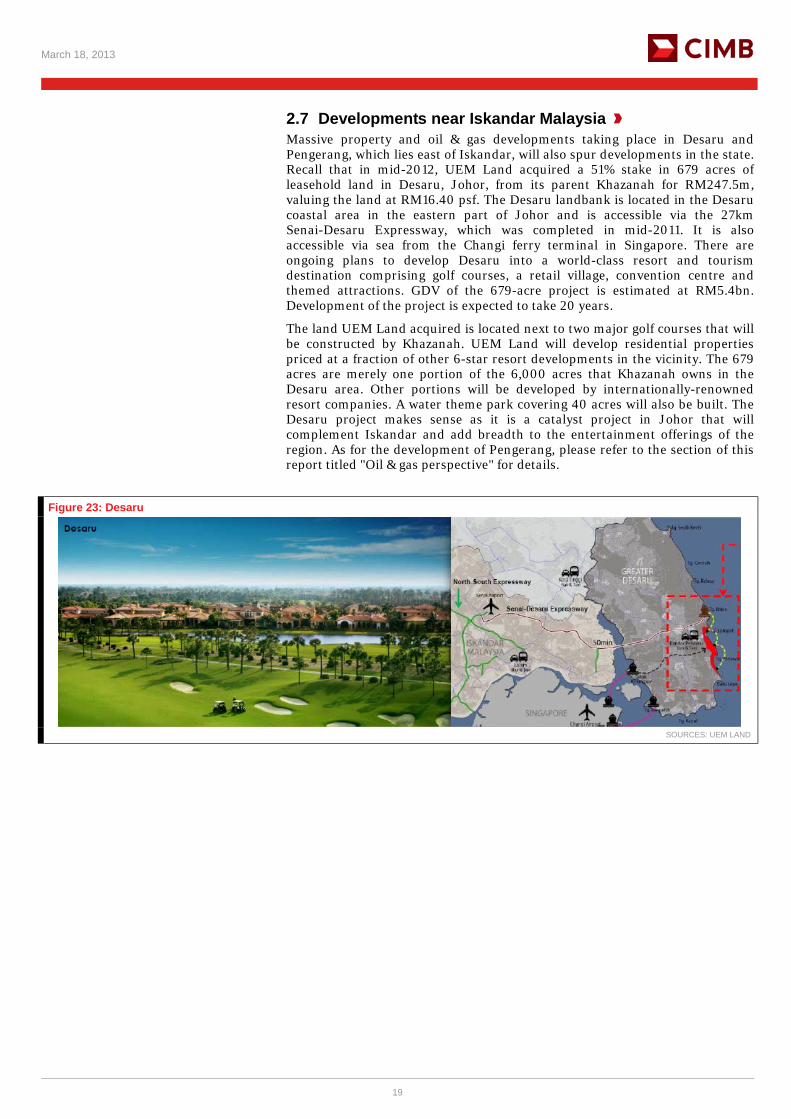
2.7 Developments near Iskandar Malaysia Massive property and oil & gas developments taking place in Desaru and Pengerang, which lies east of Iskandar, will also spur developments in the state. Recall that in mid-2012, UEM Land acquired a 51% stake in 679 acres of leasehold land in Desaru, Johor, from its parent Khazanah for RM247.5m, valuing the land at RM16.40 psf. The Desaru landbank is located in the Desaru coastal area in the eastern part of Johor and is accessible via the 27km Senai-Desaru Expressway, which was completed in mid-2011. It is also accessible via sea from the Changi ferry terminal in Singapore. There are ongoing plans to develop Desaru into a world-class resort and tourism destination comprising golf courses, a retail village, convention centre and themed attractions. GDV of the 679-acre project is estimated at RM5.4bn. Development of the project is expected to take 20 years.
The land UEM Land acquired is located next to two major golf courses that will be constructed by Khazanah. UEM Land will develop residential properties priced at a fraction of other 6-star resort developments in the vicinity. The 679 acres are merely one portion of the 6,000 acres that Khazanah owns in the Desaru area. Other portions will be developed by internationally-renowned resort companies. A water theme park covering 40 acres will also be built. The Desaru project makes sense as it is a catalyst project in Johor that will complement Iskandar and add breadth to the entertainment offerings of the region. As for the development of Pengerang, please refer to the section of this report titled "Oil & gas perspective" for details.
Figure 23: Desaru
SOURCES: UEM LAND
March 18, 2013
20
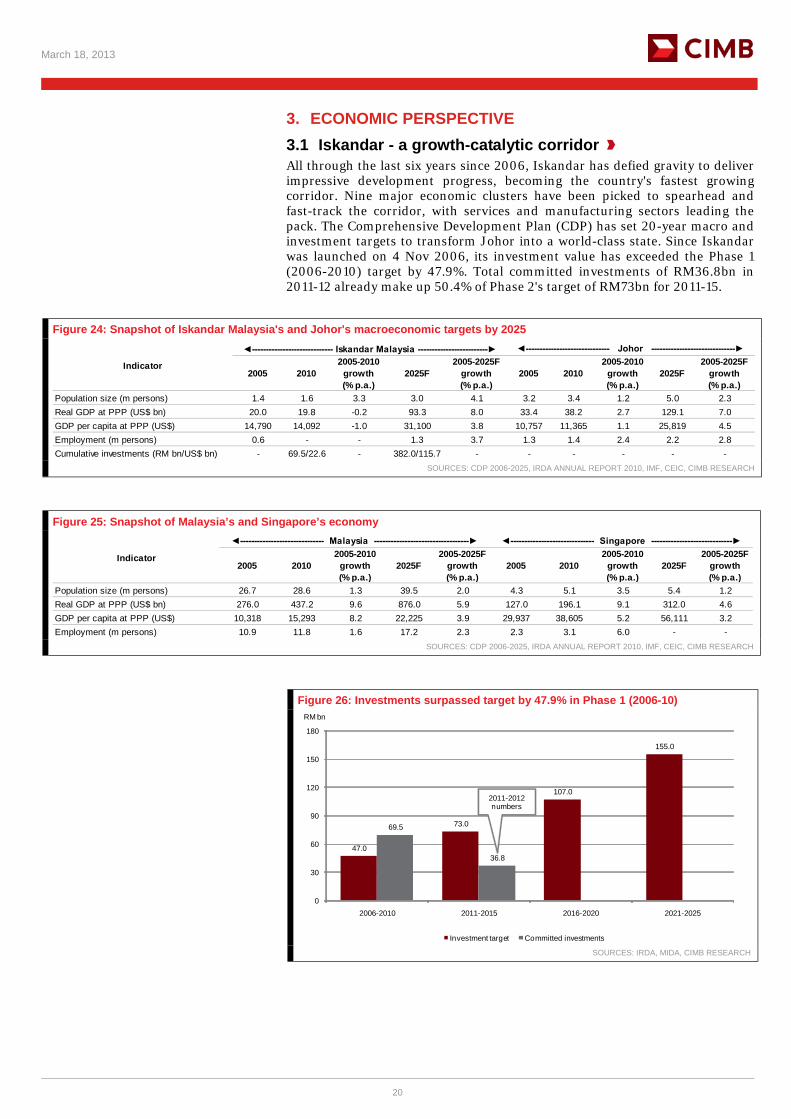
3. ECONOMIC PERSPECTIVE 3.1 Iskandar - a growth-catalytic corridor All through the last six years since 2006, Iskandar has defied gravity to deliver impressive development progress, becoming the country's fastest growing corridor. Nine major economic clusters have been picked to spearhead and fast-track the corridor, with services and manufacturing sectors leading the pack. The Comprehensive Development Plan (CDP) has set 20-year macro and investment targets to transform Johor into a world-class state. Since Iskandar was launched on 4 Nov 2006, its investment value has exceeded the Phase 1 (2006-2010) target by 47.9%. Total committed investments of RM36.8bn in 2011-12 already make up 50.4% of Phase 2's target of RM73bn for 2011-15.
Figure 24: Snapshot of Iskandar Malaysia's and Johor's macroeconomic targets by 2025
2005 20102005-2010
growth (% p.a.)
2025F2005-2025F
growth (% p.a.)
2005 20102005-2010
growth (% p.a.)
2025F2005-2025F
growth (% p.a.)
Population size (m persons) 1.4 1.6 3.3 3.0 4.1 3.2 3.4 1.2 5.0 2.3Real GDP at PPP (US$ bn) 20.0 19.8 -0.2 93.3 8.0 33.4 38.2 2.7 129.1 7.0GDP per capita at PPP (US$) 14,790 14,092 -1.0 31,100 3.8 10,757 11,365 1.1 25,819 4.5Employment (m persons) 0.6 - - 1.3 3.7 1.3 1.4 2.4 2.2 2.8Cumulative investments (RM bn/US$ bn) - 69.5/22.6 - 382.0/115.7 - - - - - -
◄----------------------------- Iskandar Malaysia -------------------------► ◄------------------------------ Johor ------------------------------►
Indicator
SOURCES: CDP 2006-2025, IRDA ANNUAL REPORT 2010, IMF, CEIC, CIMB RESEARCH
Figure 25: Snapshot of Malaysia’s and Singapore’s economy
2005 20102005-2010
growth (% p.a.)
2025F2005-2025F
growth (% p.a.)
2005 20102005-2010
growth (% p.a.)
2025F2005-2025F
growth (% p.a.)
Population size (m persons) 26.7 28.6 1.3 39.5 2.0 4.3 5.1 3.5 5.4 1.2Real GDP at PPP (US$ bn) 276.0 437.2 9.6 876.0 5.9 127.0 196.1 9.1 312.0 4.6GDP per capita at PPP (US$) 10,318 15,293 8.2 22,225 3.9 29,937 38,605 5.2 56,111 3.2Employment (m persons) 10.9 11.8 1.6 17.2 2.3 2.3 3.1 6.0 - -
◄------------------------------ Malaysia ----------------------------------► ◄------------------------------ Singapore -----------------------------►
Indicator
SOURCES: CDP 2006-2025, IRDA ANNUAL REPORT 2010, IMF, CEIC, CIMB RESEARCH
Figure 26: Investments surpassed target by 47.9% in Phase 1 (2006-10)
47.0
73.0
107.0
155.0
69.5
36.8
0
30
60
90
120
150
180
2006-2010 2011-2015 2016-2020 2021-2025
RM bn
Investment target Committed investments
2011-2012 numbers
SOURCES: IRDA, MIDA, CIMB RESEARCH
March 18, 2013
21
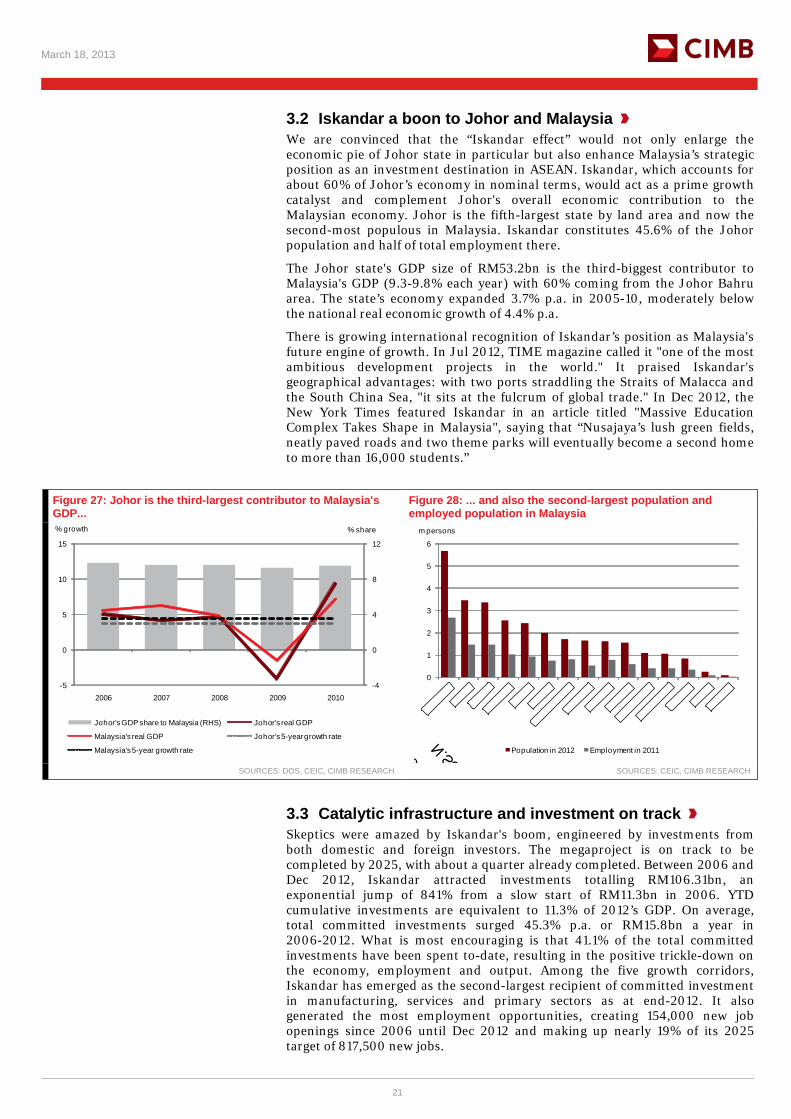
3.2 Iskandar a boon to Johor and Malaysia We are convinced that the “Iskandar effect” would not only enlarge the economic pie of Johor state in particular but also enhance Malaysia’s strategic position as an investment destination in ASEAN. Iskandar, which accounts for about 60% of Johor’s economy in nominal terms, would act as a prime growth catalyst and complement Johor's overall economic contribution to the Malaysian economy. Johor is the fifth-largest state by land area and now the second-most populous in Malaysia. Iskandar constitutes 45.6% of the Johor population and half of total employment there.
The Johor state's GDP size of RM53.2bn is the third-biggest contributor to Malaysia's GDP (9.3-9.8% each year) with 60% coming from the Johor Bahru area. The state’s economy expanded 3.7% p.a. in 2005-10, moderately below the national real economic growth of 4.4% p.a.
There is growing international recognition of Iskandar’s position as Malaysia's future engine of growth. In Jul 2012, TIME magazine called it "one of the most ambitious development projects in the world." It praised Iskandar's geographical advantages: with two ports straddling the Straits of Malacca and the South China Sea, "it sits at the fulcrum of global trade." In Dec 2012, the New York Times featured Iskandar in an article titled "Massive Education Complex Takes Shape in Malaysia", saying that “Nusajaya’s lush green fields, neatly paved roads and two theme parks will eventually become a second home to more than 16,000 students.”
Figure 27: Johor is the third-largest contributor to Malaysia's GDP...
Figure 28: ... and also the second-largest population and employed population in Malaysia
-4
0
4
8
12
-5
0
5
10
15
2006 2007 2008 2009 2010
% share% growth
Johor's GDP share to Malaysia (RHS) Johor's real GDP
Malaysia's real GDP Johor's 5-year growth rate
Malaysia's 5-year growth rate
0
1
2
3
4
5
6
m persons
Population in 2012 Employment in 2011
SOURCES: DOS, CEIC, CIMB RESEARCH SOURCES: CEIC, CIMB RESEARCH
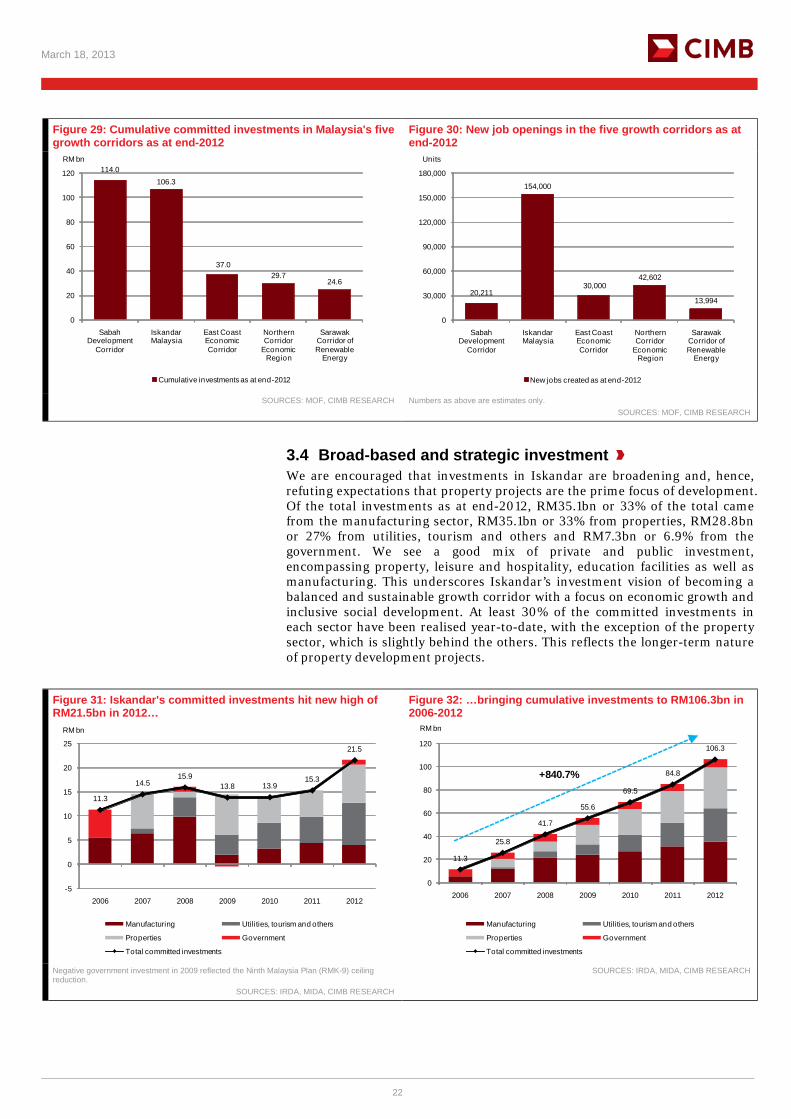
3.3 Catalytic infrastructure and investment on track Skeptics were amazed by Iskandar's boom, engineered by investments from both domestic and foreign investors. The megaproject is on track to be completed by 2025, with about a quarter already completed. Between 2006 and Dec 2012, Iskandar attracted investments totalling RM106.31bn, an exponential jump of 841% from a slow start of RM11.3bn in 2006. YTD cumulative investments are equivalent to 11.3% of 2012’s GDP. On average, total committed investments surged 45.3% p.a. or RM15.8bn a year in 2006-2012. What is most encouraging is that 41.1% of the total committed investments have been spent to-date, resulting in the positive trickle-down on the economy, employment and output. Among the five growth corridors, Iskandar has emerged as the second-largest recipient of committed investment in manufacturing, services and primary sectors as at end-2012. It also generated the most employment opportunities, creating 154,000 new job openings since 2006 until Dec 2012 and making up nearly 19% of its 2025 target of 817,500 new jobs.
March 18, 2013
22
Figure 29: Cumulative committed investments in Malaysia's five growth corridors as at end-2012
Figure 30: New job openings in the five growth corridors as at end-2012
114.0106.3
37.029.7
24.6
0
20
40
60
80
100
120
Sabah Development
Corridor
Iskandar Malaysia
East Coast Economic Corridor
Northern Corridor
Economic Region
Sarawak Corridor of Renewable
Energy
RM bn
Cumulative investments as at end-2012
20,211
154,000
30,00042,602
13,994
0
30,000
60,000
90,000
120,000
150,000
180,000
Sabah Development
Corridor
Iskandar Malaysia
East Coast Economic Corridor
Northern Corridor
Economic Region
Sarawak Corridor of Renewable
Energy
Units
New jobs created as at end-2012
SOURCES: MOF, CIMB RESEARCH Numbers as above are estimates only. SOURCES: MOF, CIMB RESEARCH
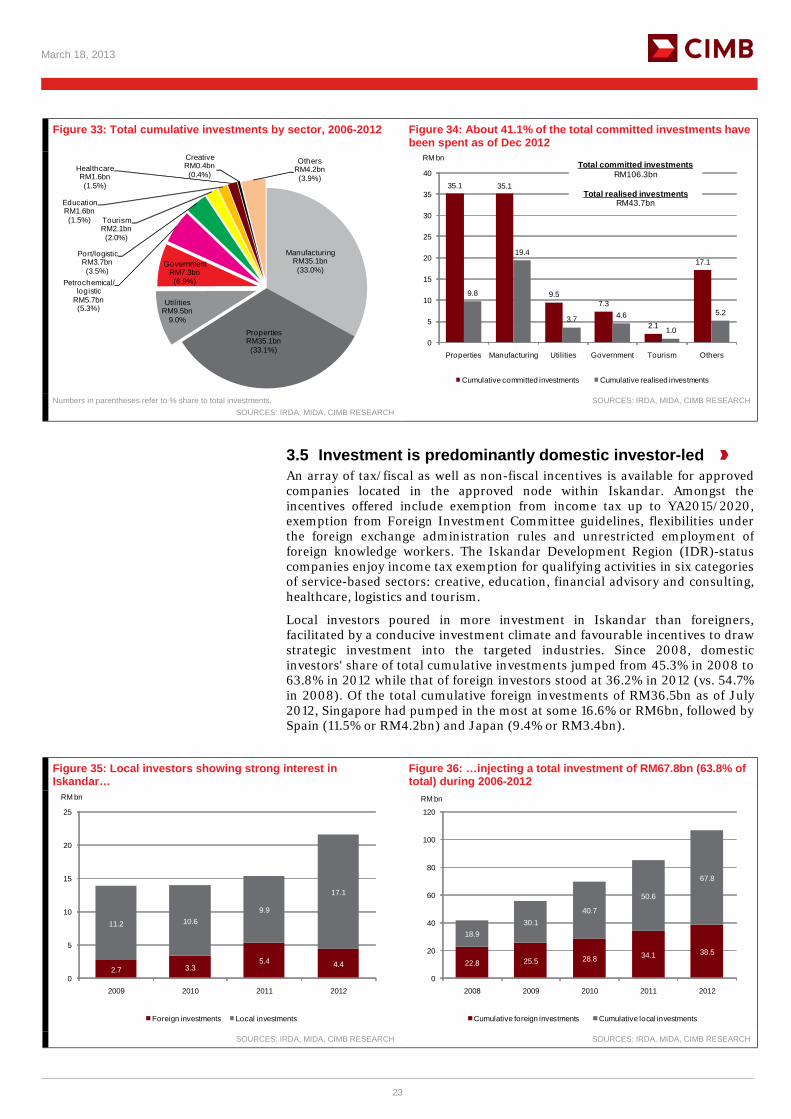
3.4 Broad-based and strategic investment We are encouraged that investments in Iskandar are broadening and, hence, refuting expectations that property projects are the prime focus of development. Of the total investments as at end-2012, RM35.1bn or 33% of the total came from the manufacturing sector, RM35.1bn or 33% from properties, RM28.8bn or 27% from utilities, tourism and others and RM7.3bn or 6.9% from the government. We see a good mix of private and public investment, encompassing property, leisure and hospitality, education facilities as well as manufacturing. This underscores Iskandar’s investment vision of becoming a balanced and sustainable growth corridor with a focus on economic growth and inclusive social development. At least 30% of the committed investments in each sector have been realised year-to-date, with the exception of the property sector, which is slightly behind the others. This reflects the longer-term nature of property development projects.
Figure 31: Iskandar's committed investments hit new high of RM21.5bn in 2012…
Figure 32: …bringing cumulative investments to RM106.3bn in 2006-2012
11.3
14.515.9
13.8 13.915.3
21.5
-5
0
5
10
15
20
25
2006 2007 2008 2009 2010 2011 2012
RM bn
Manufacturing Utilities, tourism and others
Properties Government
Total committed investments
11.3
25.8
41.7
55.6
69.5
84.8
106.3
0
20
40
60
80
100
120
2006 2007 2008 2009 2010 2011 2012
RM bn
Manufacturing Utilities, tourism and others
Properties Government
Total committed investments
+840.7%
Negative government investment in 2009 reflected the Ninth Malaysia Plan (RMK-9) ceiling reduction.
SOURCES: IRDA, MIDA, CIMB RESEARCH
SOURCES: IRDA, MIDA, CIMB RESEARCH
March 18, 2013
23
Figure 33: Total cumulative investments by sector, 2006-2012 Figure 34: About 41.1% of the total committed investments have been spent as of Dec 2012
ManufacturingRM35.1bn(33.0%)
PropertiesRM35.1bn(33.1%)
UtilitiesRM9.5bn
9.0%
Government RM7.3bn(6.9%)Petrochemical/
logisticRM5.7bn(5.3%)
Port/logisticRM3.7bn(3.5%)
TourismRM2.1bn(2.0%)
EducationRM1.6bn(1.5%)
HealthcareRM1.6bn(1.5%)
CreativeRM0.4bn(0.4%)
OthersRM4.2bn(3.9%)
35.1 35.1
9.57.3
2.1
17.1
9.8
19.4
3.7 4.6
1.0
5.2
0
5
10
15
20
25
30
35
40
Properties Manufacturing Utilities Government Tourism Others
RM bn
Cumulative committed investments Cumulative realised investments
Total committed investments RM106.3bn
Total realised investments RM43.7bn
Numbers in parentheses refer to % share to total investments.
SOURCES: IRDA, MIDA, CIMB RESEARCH SOURCES: IRDA, MIDA, CIMB RESEARCH
3.5 Investment is predominantly domestic investor-led An array of tax/fiscal as well as non-fiscal incentives is available for approved companies located in the approved node within Iskandar. Amongst the incentives offered include exemption from income tax up to YA2015/2020, exemption from Foreign Investment Committee guidelines, flexibilities under the foreign exchange administration rules and unrestricted employment of foreign knowledge workers. The Iskandar Development Region (IDR)-status companies enjoy income tax exemption for qualifying activities in six categories of service-based sectors: creative, education, financial advisory and consulting, healthcare, logistics and tourism.
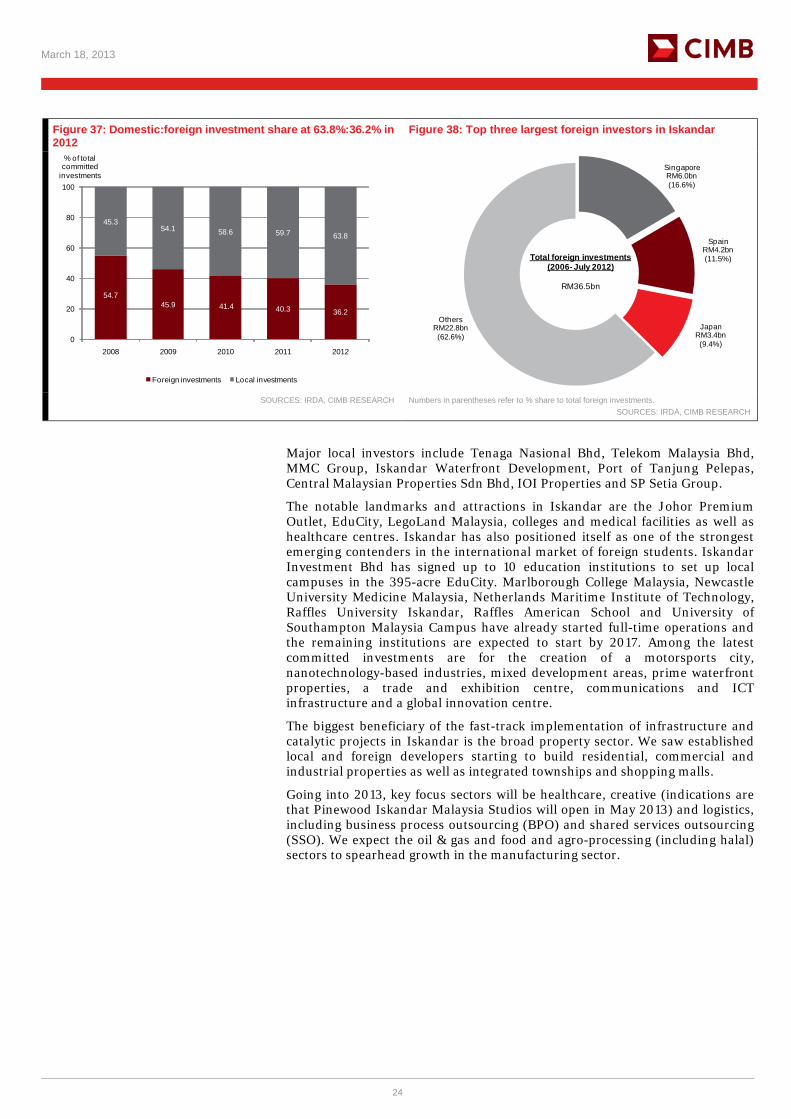
Local investors poured in more investment in Iskandar than foreigners, facilitated by a conducive investment climate and favourable incentives to draw strategic investment into the targeted industries. Since 2008, domestic investors' share of total cumulative investments jumped from 45.3% in 2008 to 63.8% in 2012 while that of foreign investors stood at 36.2% in 2012 (vs. 54.7% in 2008). Of the total cumulative foreign investments of RM36.5bn as of July 2012, Singapore had pumped in the most at some 16.6% or RM6bn, followed by Spain (11.5% or RM4.2bn) and Japan (9.4% or RM3.4bn).
Figure 35: Local investors showing strong interest in Iskandar…
Figure 36: …injecting a total investment of RM67.8bn (63.8% of total) during 2006-2012
2.7 3.35.4 4.4
11.2 10.69.9
17.1
0
5
10
15
20
25
2009 2010 2011 2012
RM bn
Foreign investments Local investments
22.8 25.5 28.8 34.1 38.5
18.930.1
40.7
50.6
67.8
0
20
40
60
80
100
120
2008 2009 2010 2011 2012
RM bn
Cumulative foreign investments Cumulative local investments
SOURCES: IRDA, MIDA, CIMB RESEARCH SOURCES: IRDA, MIDA, CIMB RESEARCH
March 18, 2013
24
Figure 37: Domestic:foreign investment share at 63.8%:36.2% in 2012
Figure 38: Top three largest foreign investors in Iskandar
54.745.9 41.4 40.3 36.2
45.354.1 58.6 59.7 63.8
0
20
40
60
80
100
2008 2009 2010 2011 2012
% of total committed
investments
Foreign investments Local investments
SingaporeRM6.0bn(16.6%)
SpainRM4.2bn(11.5%)
JapanRM3.4bn(9.4%)
OthersRM22.8bn(62.6%)
Total foreign investments (2006- July 2012)
RM36.5bn
SOURCES: IRDA, CIMB RESEARCH Numbers in parentheses refer to % share to total foreign investments.
SOURCES: IRDA, CIMB RESEARCH
Major local investors include Tenaga Nasional Bhd, Telekom Malaysia Bhd, MMC Group, Iskandar Waterfront Development, Port of Tanjung Pelepas, Central Malaysian Properties Sdn Bhd, IOI Properties and SP Setia Group.
The notable landmarks and attractions in Iskandar are the Johor Premium Outlet, EduCity, LegoLand Malaysia, colleges and medical facilities as well as healthcare centres. Iskandar has also positioned itself as one of the strongest emerging contenders in the international market of foreign students. Iskandar Investment Bhd has signed up to 10 education institutions to set up local campuses in the 395-acre EduCity. Marlborough College Malaysia, Newcastle University Medicine Malaysia, Netherlands Maritime Institute of Technology, Raffles University Iskandar, Raffles American School and University of Southampton Malaysia Campus have already started full-time operations and the remaining institutions are expected to start by 2017. Among the latest committed investments are for the creation of a motorsports city, nanotechnology-based industries, mixed development areas, prime waterfront properties, a trade and exhibition centre, communications and ICT infrastructure and a global innovation centre.
The biggest beneficiary of the fast-track implementation of infrastructure and catalytic projects in Iskandar is the broad property sector. We saw established local and foreign developers starting to build residential, commercial and industrial properties as well as integrated townships and shopping malls.
Going into 2013, key focus sectors will be healthcare, creative (indications are that Pinewood Iskandar Malaysia Studios will open in May 2013) and logistics, including business process outsourcing (BPO) and shared services outsourcing (SSO). We expect the oil & gas and food and agro-processing (including halal) sectors to spearhead growth in the manufacturing sector.
March 18, 2013
25
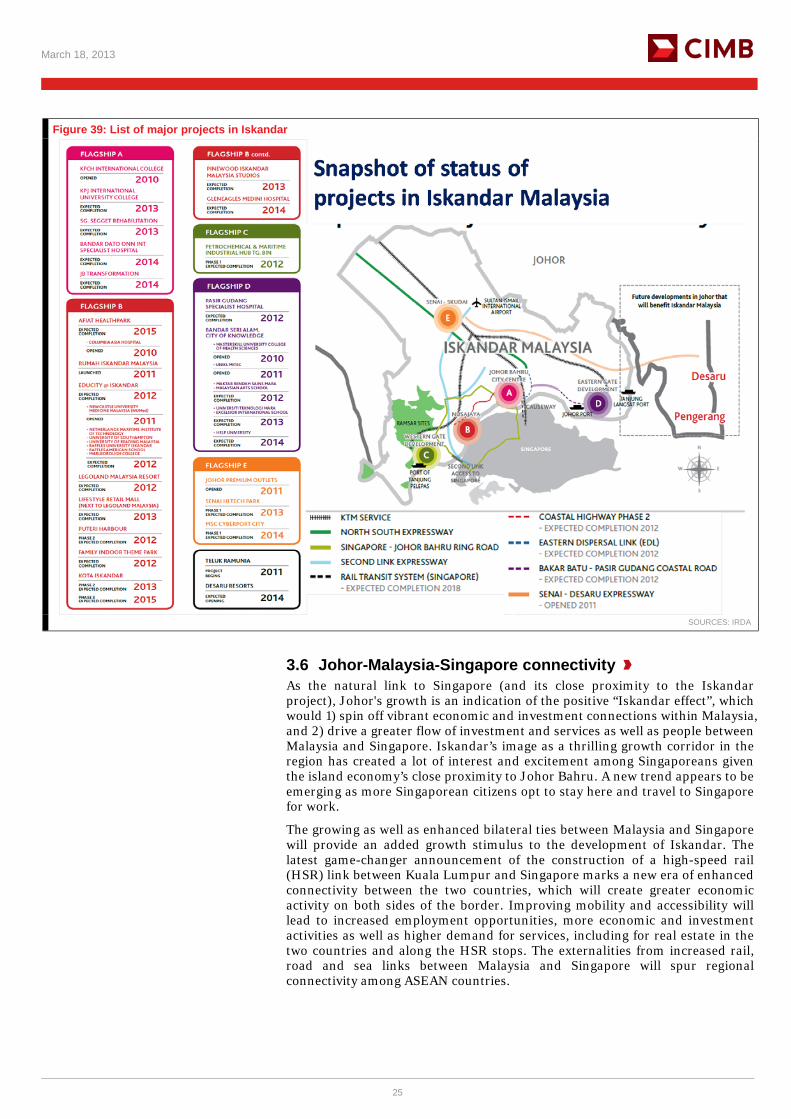
Figure 39: List of major projects in Iskandar
SOURCES: IRDA
3.6 Johor-Malaysia-Singapore connectivity As the natural link to Singapore (and its close proximity to the Iskandar project), Johor's growth is an indication of the positive “Iskandar effect”, which would 1) spin off vibrant economic and investment connections within Malaysia, and 2) drive a greater flow of investment and services as well as people between Malaysia and Singapore. Iskandar’s image as a thrilling growth corridor in the region has created a lot of interest and excitement among Singaporeans given the island economy’s close proximity to Johor Bahru. A new trend appears to be emerging as more Singaporean citizens opt to stay here and travel to Singapore for work.
The growing as well as enhanced bilateral ties between Malaysia and Singapore will provide an added growth stimulus to the development of Iskandar. The latest game-changer announcement of the construction of a high-speed rail (HSR) link between Kuala Lumpur and Singapore marks a new era of enhanced connectivity between the two countries, which will create greater economic activity on both sides of the border. Improving mobility and accessibility will lead to increased employment opportunities, more economic and investment activities as well as higher demand for services, including for real estate in the two countries and along the HSR stops. The externalities from increased rail, road and sea links between Malaysia and Singapore will spur regional connectivity among ASEAN countries.
March 18, 2013
26
3.7 Convincing buy-ins from Singaporean investors In the early days of Iskandar's inception and development, Singapore investors adopted a cautious approach, taking time to assess whether the "mammoth" growth corridor can take off as planned. Now, the astonishing development progress in Iskandar, along with continued strong endorsement from both prime ministers, has changed Singaporean investors' perceptions. It is a win-win situation for both countries.
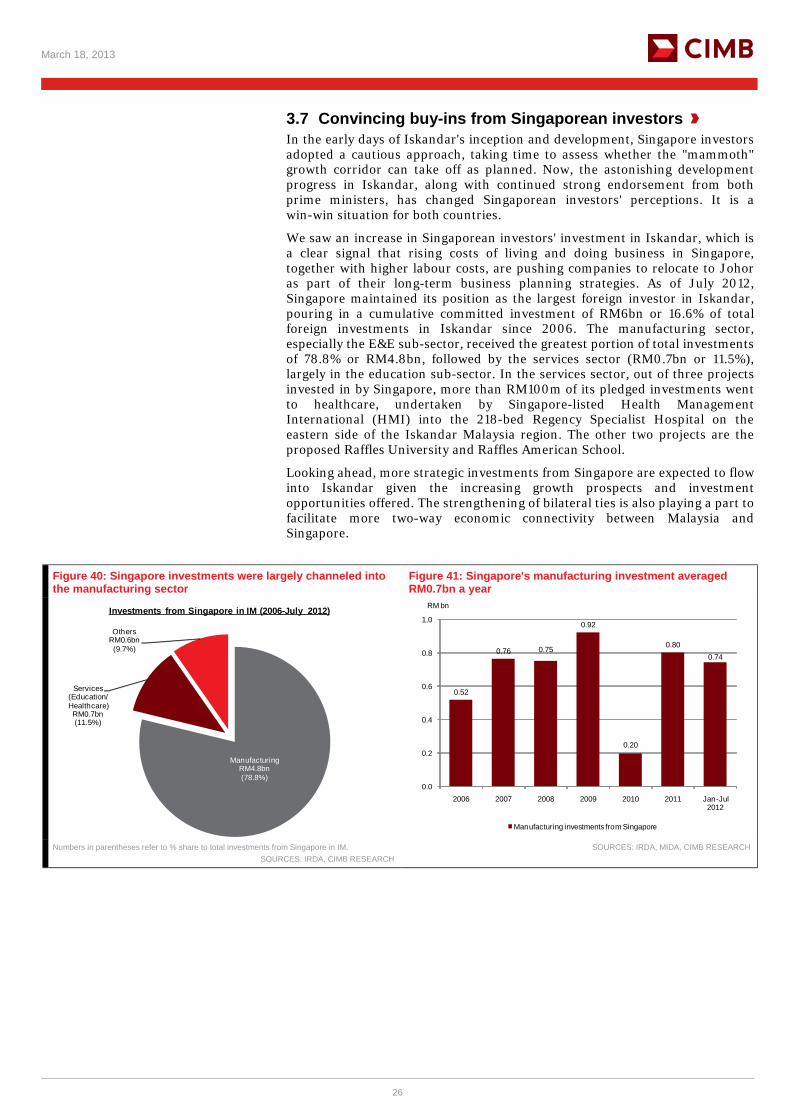
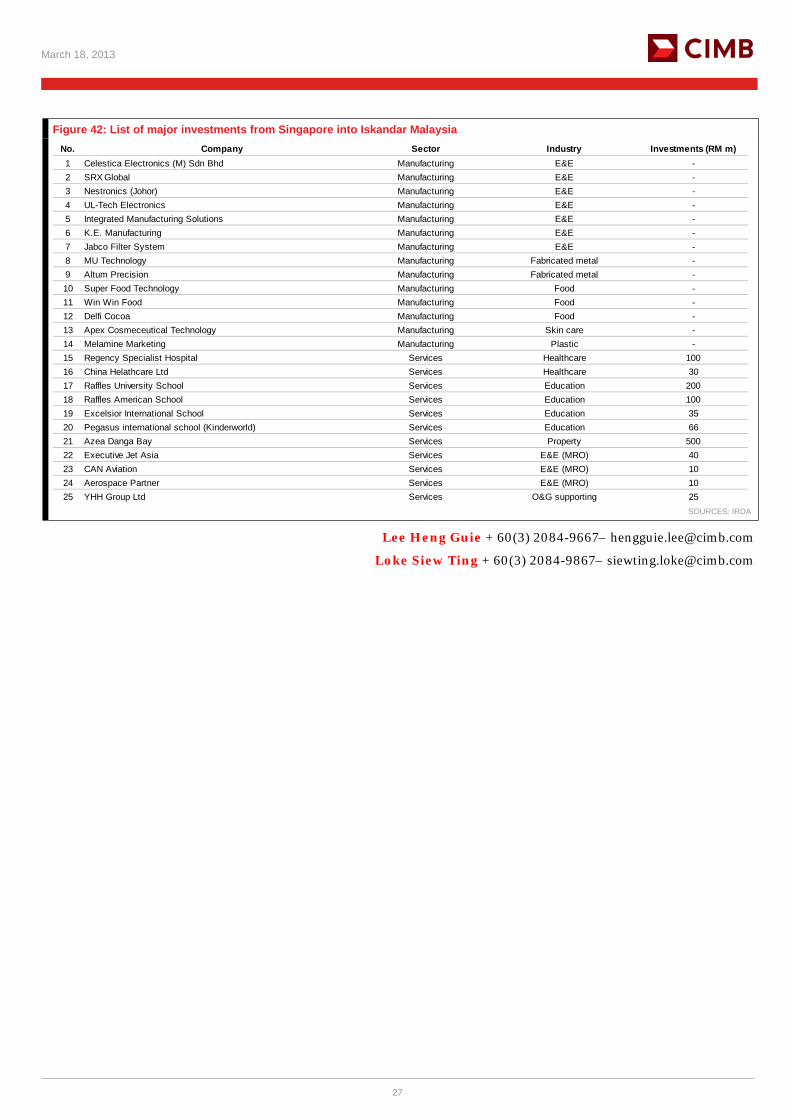
We saw an increase in Singaporean investors' investment in Iskandar, which is a clear signal that rising costs of living and doing business in Singapore, together with higher labour costs, are pushing companies to relocate to Johor as part of their long-term business planning strategies. As of July 2012, Singapore maintained its position as the largest foreign investor in Iskandar, pouring in a cumulative committed investment of RM6bn or 16.6% of total foreign investments in Iskandar since 2006. The manufacturing sector, especially the E&E sub-sector, received the greatest portion of total investments of 78.8% or RM4.8bn, followed by the services sector (RM0.7bn or 11.5%), largely in the education sub-sector. In the services sector, out of three projects invested in by Singapore, more than RM100m of its pledged investments went to healthcare, undertaken by Singapore-listed Health Management International (HMI) into the 218-bed Regency Specialist Hospital on the eastern side of the Iskandar Malaysia region. The other two projects are the proposed Raffles University and Raffles American School.
Looking ahead, more strategic investments from Singapore are expected to flow into Iskandar given the increasing growth prospects and investment opportunities offered. The strengthening of bilateral ties is also playing a part to facilitate more two-way economic connectivity between Malaysia and Singapore.
Figure 40: Singapore investments were largely channeled into the manufacturing sector
Figure 41: Singapore's manufacturing investment averaged RM0.7bn a year
ManufacturingRM4.8bn(78.8%)
Services (Education/Healthcare)RM0.7bn(11.5%)
OthersRM0.6bn(9.7%)
Investments from Singapore in IM (2006-July 2012)
0.52
0.76 0.75
0.92
0.20
0.800.74
0.0
0.2
0.4
0.6
0.8
1.0
2006 2007 2008 2009 2010 2011 Jan-Jul 2012
RM bn
Manufacturing investments from Singapore
Numbers in parentheses refer to % share to total investments from Singapore in IM. SOURCES: IRDA, CIMB RESEARCH
SOURCES: IRDA, MIDA, CIMB RESEARCH
March 18, 2013
27
Figure 42: List of major investments from Singapore into Iskandar Malaysia No. Company Sector Industry Investments (RM m)1 Celestica Electronics (M) Sdn Bhd Manufacturing E&E -2 SRX Global Manufacturing E&E -3 Nestronics (Johor) Manufacturing E&E -4 UL-Tech Electronics Manufacturing E&E -5 Integrated Manufacturing Solutions Manufacturing E&E -6 K.E. Manufacturing Manufacturing E&E -7 Jabco Filter System Manufacturing E&E -8 MU Technology Manufacturing Fabricated metal -9 Altum Precision Manufacturing Fabricated metal -10 Super Food Technology Manufacturing Food -11 Win Win Food Manufacturing Food -12 Delfi Cocoa Manufacturing Food -13 Apex Cosmeceutical Technology Manufacturing Skin care -14 Melamine Marketing Manufacturing Plastic -15 Regency Specialist Hospital Services Healthcare 10016 China Helathcare Ltd Services Healthcare 3017 Raffles University School Services Education 20018 Raffles American School Services Education 10019 Excelsior International School Services Education 3520 Pegasus international school (Kinderworld) Services Education 6621 Azea Danga Bay Services Property 50022 Executive Jet Asia Services E&E (MRO) 4023 CAN Aviation Services E&E (MRO) 1024 Aerospace Partner Services E&E (MRO) 1025 YHH Group Ltd Services O&G supporting 25
SOURCES: IRDA
Lee Heng Guie + 60(3) 2084-9667– [email protected]
Loke Siew Ting + 60(3) 2084-9867– [email protected]
March 18, 2013
28
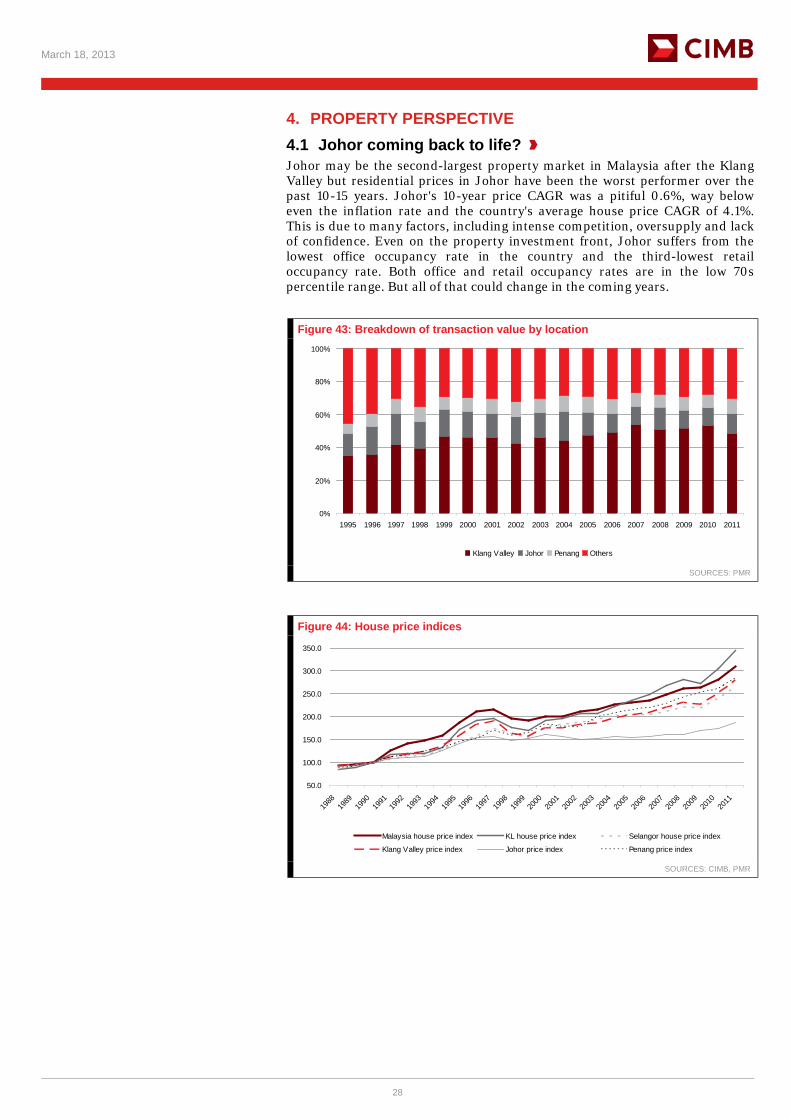
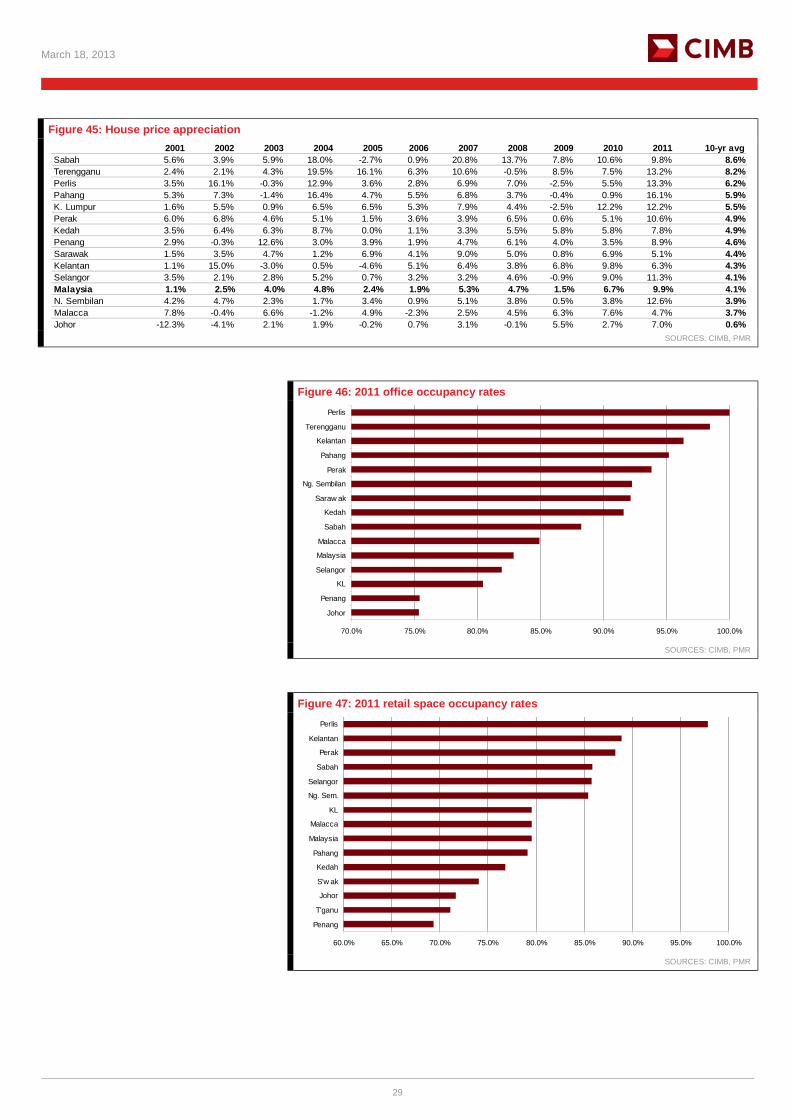
4. PROPERTY PERSPECTIVE 4.1 Johor coming back to life? Johor may be the second-largest property market in Malaysia after the Klang Valley but residential prices in Johor have been the worst performer over the past 10-15 years. Johor's 10-year price CAGR was a pitiful 0.6%, way below even the inflation rate and the country's average house price CAGR of 4.1%. This is due to many factors, including intense competition, oversupply and lack of confidence. Even on the property investment front, Johor suffers from the lowest office occupancy rate in the country and the third-lowest retail occupancy rate. Both office and retail occupancy rates are in the low 70s percentile range. But all of that could change in the coming years.
Figure 43: Breakdown of transaction value by location
0%
20%
40%
60%
80%
100%
1995 1996 1997 1998 1999 2000 2001 2002 2003 2004 2005 2006 2007 2008 2009 2010 2011
Klang Valley Johor Penang Others
SOURCES: PMR
Figure 44: House price indices
50.0
100.0
150.0
200.0
250.0
300.0
350.0
1988
1989
1990
1991
1992
1993
1994
1995
1996
1997
1998
1999
2000
2001
2002
2003
2004
2005
2006
2007
2008
2009
2010
2011
Malaysia house price index KL house price index Selangor house price index
Klang Valley price index Johor price index Penang price index
SOURCES: CIMB, PMR
March 18, 2013
29
Figure 45: House price appreciation 2001 2002 2003 2004 2005 2006 2007 2008 2009 2010 2011 10-yr avg
Sabah 5.6% 3.9% 5.9% 18.0% -2.7% 0.9% 20.8% 13.7% 7.8% 10.6% 9.8% 8.6%Terengganu 2.4% 2.1% 4.3% 19.5% 16.1% 6.3% 10.6% -0.5% 8.5% 7.5% 13.2% 8.2%Perlis 3.5% 16.1% -0.3% 12.9% 3.6% 2.8% 6.9% 7.0% -2.5% 5.5% 13.3% 6.2%Pahang 5.3% 7.3% -1.4% 16.4% 4.7% 5.5% 6.8% 3.7% -0.4% 0.9% 16.1% 5.9%K. Lumpur 1.6% 5.5% 0.9% 6.5% 6.5% 5.3% 7.9% 4.4% -2.5% 12.2% 12.2% 5.5%Perak 6.0% 6.8% 4.6% 5.1% 1.5% 3.6% 3.9% 6.5% 0.6% 5.1% 10.6% 4.9%Kedah 3.5% 6.4% 6.3% 8.7% 0.0% 1.1% 3.3% 5.5% 5.8% 5.8% 7.8% 4.9%Penang 2.9% -0.3% 12.6% 3.0% 3.9% 1.9% 4.7% 6.1% 4.0% 3.5% 8.9% 4.6%Sarawak 1.5% 3.5% 4.7% 1.2% 6.9% 4.1% 9.0% 5.0% 0.8% 6.9% 5.1% 4.4%Kelantan 1.1% 15.0% -3.0% 0.5% -4.6% 5.1% 6.4% 3.8% 6.8% 9.8% 6.3% 4.3%Selangor 3.5% 2.1% 2.8% 5.2% 0.7% 3.2% 3.2% 4.6% -0.9% 9.0% 11.3% 4.1%Malaysia 1.1% 2.5% 4.0% 4.8% 2.4% 1.9% 5.3% 4.7% 1.5% 6.7% 9.9% 4.1%N. Sembilan 4.2% 4.7% 2.3% 1.7% 3.4% 0.9% 5.1% 3.8% 0.5% 3.8% 12.6% 3.9%Malacca 7.8% -0.4% 6.6% -1.2% 4.9% -2.3% 2.5% 4.5% 6.3% 7.6% 4.7% 3.7%Johor -12.3% -4.1% 2.1% 1.9% -0.2% 0.7% 3.1% -0.1% 5.5% 2.7% 7.0% 0.6%
SOURCES: CIMB, PMR
Figure 46: 2011 office occupancy rates
70.0% 75.0% 80.0% 85.0% 90.0% 95.0% 100.0%
Johor
Penang
KL
Selangor
Malaysia
Malacca
Sabah
Kedah
Saraw ak
Ng. Sembilan
Perak
Pahang
Kelantan
Terengganu
Perlis
SOURCES: CIMB, PMR
Figure 47: 2011 retail space occupancy rates
60.0% 65.0% 70.0% 75.0% 80.0% 85.0% 90.0% 95.0% 100.0%
Penang
T'ganu
Johor
S'w ak
Kedah
Pahang
Malaysia
Malacca
KL
Ng. Sem.
Selangor
Sabah
Perak
Kelantan
Perlis
SOURCES: CIMB, PMR
March 18, 2013
30
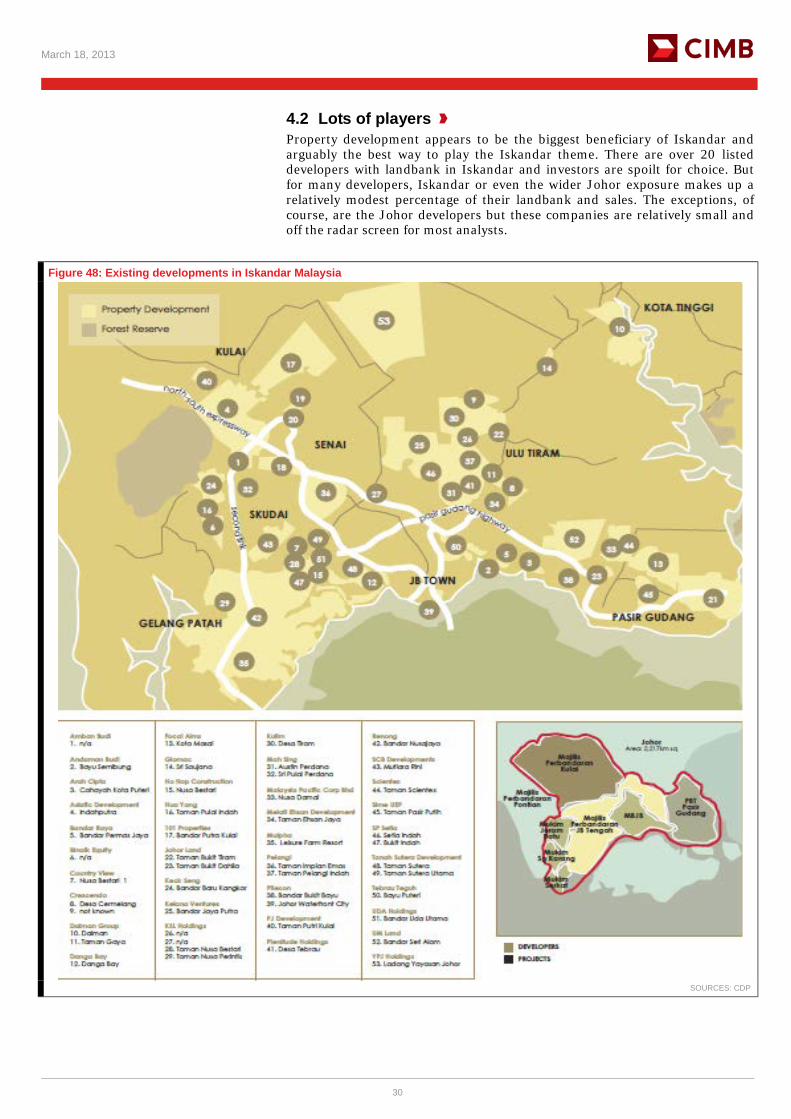
4.2 Lots of players Property development appears to be the biggest beneficiary of Iskandar and arguably the best way to play the Iskandar theme. There are over 20 listed developers with landbank in Iskandar and investors are spoilt for choice. But for many developers, Iskandar or even the wider Johor exposure makes up a relatively modest percentage of their landbank and sales. The exceptions, of course, are the Johor developers but these companies are relatively small and off the radar screen for most analysts.
Figure 48: Existing developments in Iskandar Malaysia
SOURCES: CDP
March 18, 2013
31
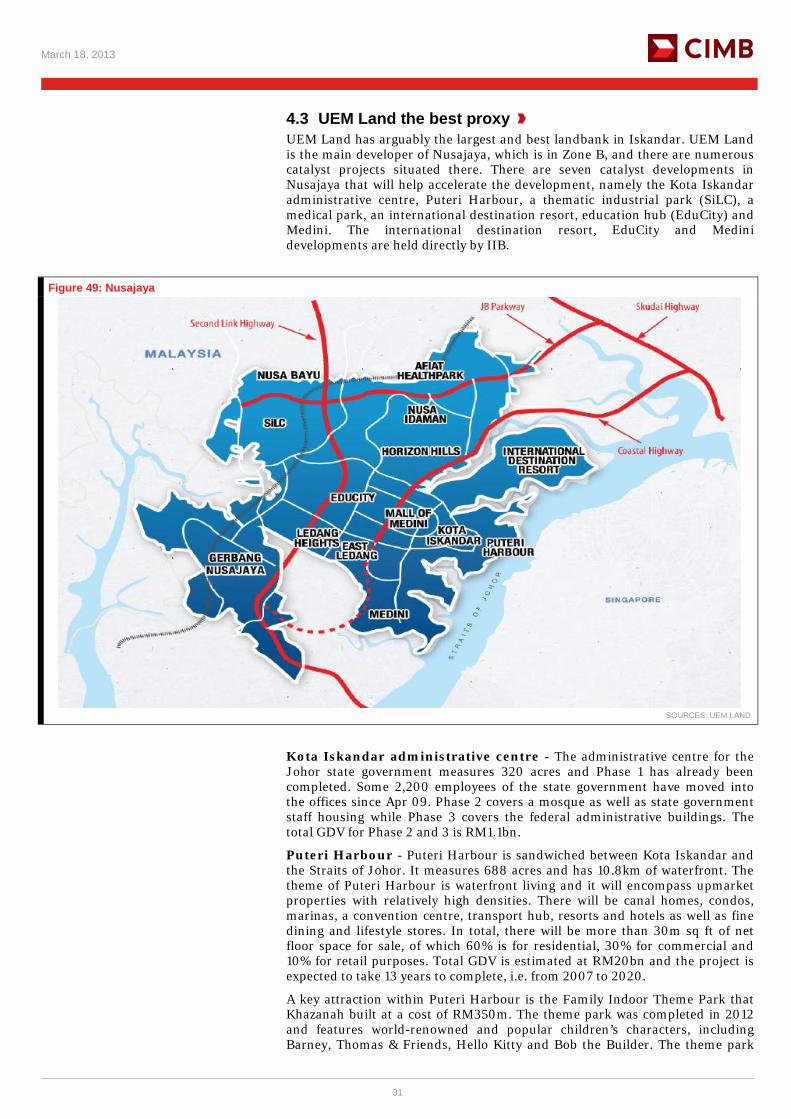
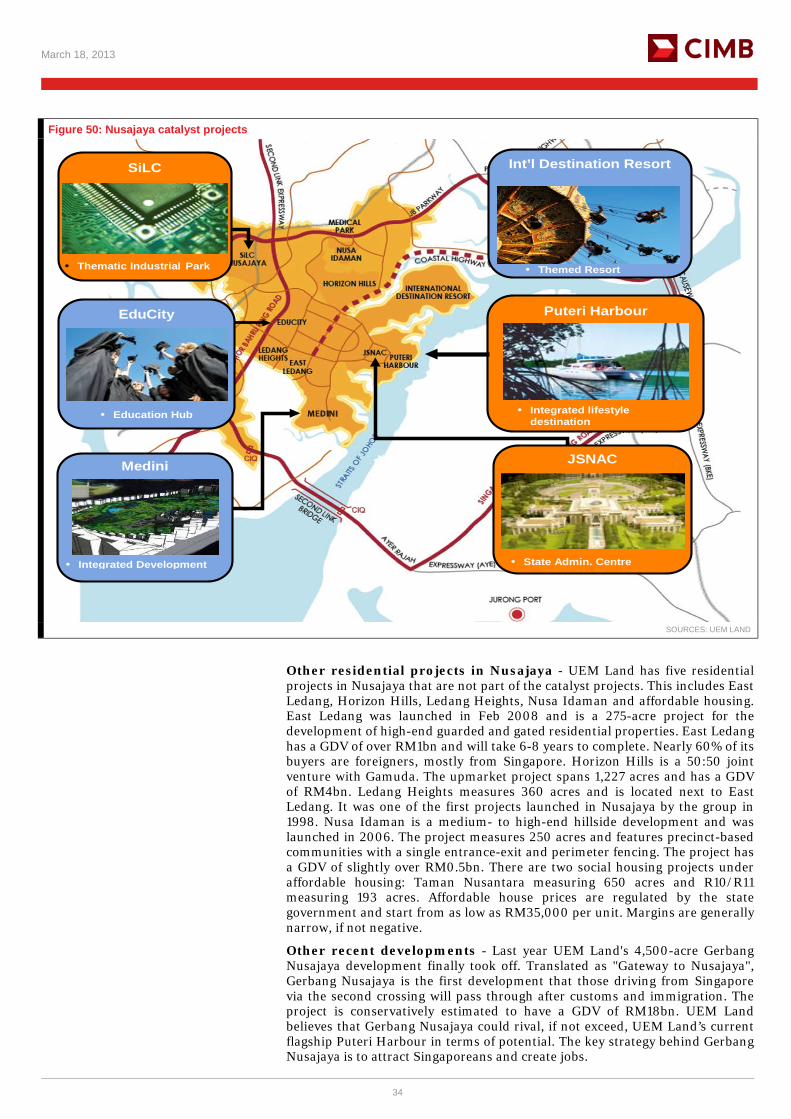
4.3 UEM Land the best proxy UEM Land has arguably the largest and best landbank in Iskandar. UEM Land is the main developer of Nusajaya, which is in Zone B, and there are numerous catalyst projects situated there. There are seven catalyst developments in Nusajaya that will help accelerate the development, namely the Kota Iskandar administrative centre, Puteri Harbour, a thematic industrial park (SiLC), a medical park, an international destination resort, education hub (EduCity) and Medini. The international destination resort, EduCity and Medini developments are held directly by IIB.
Figure 49: Nusajaya
SOURCES: UEM LAND
Kota Iskandar administrative centre - The administrative centre for the Johor state government measures 320 acres and Phase 1 has already been completed. Some 2,200 employees of the state government have moved into the offices since Apr 09. Phase 2 covers a mosque as well as state government staff housing while Phase 3 covers the federal administrative buildings. The total GDV for Phase 2 and 3 is RM1.1bn.
Puteri Harbour - Puteri Harbour is sandwiched between Kota Iskandar and the Straits of Johor. It measures 688 acres and has 10.8km of waterfront. The theme of Puteri Harbour is waterfront living and it will encompass upmarket properties with relatively high densities. There will be canal homes, condos, marinas, a convention centre, transport hub, resorts and hotels as well as fine dining and lifestyle stores. In total, there will be more than 30m sq ft of net floor space for sale, of which 60% is for residential, 30% for commercial and 10% for retail purposes. Total GDV is estimated at RM20bn and the project is expected to take 13 years to complete, i.e. from 2007 to 2020.
A key attraction within Puteri Harbour is the Family Indoor Theme Park that Khazanah built at a cost of RM350m. The theme park was completed in 2012 and features world-renowned and popular children’s characters, including Barney, Thomas & Friends, Hello Kitty and Bob the Builder. The theme park
March 18, 2013
32
measures 60,000 sq ft and other components of the project include a 100,000 sq ft retail centre and a 300-room Traders Hotel.
Development of Puteri Harbour has been expedited via land sales and joint ventures. In Dec 2007, UEM Land sold 111 acres of land to its joint venture company with Dubai-based Limitless Holdings for RM242m or RM50 psf. Limitless, which is part of the Dubai state-owned investment group Dubai World, held 60% in the JV company while UEM Land owned 40%. Due to financial difficulties as a result of the global financial crisis, Bandar Raya Development took over the development rights to the 111 acres from the joint venture.
Another joint venture in Puteri Harbour is a 50:50 JV with United Malayan Land to develop the Somerset serviced apartments with a retail block. The project has been sold out with pricing hitting as high as RM1,000 psf. In Apr 10, UEM Land sold outright a 3.3-acre piece of land to Encorp for RM26m or RM180 psf that is being developed into a residential and commercial building with GDV of RM330m. Prices at Encorp's condo have set new benchmarks in Puteri Harbour of over RM1,000 psf. In mid-2011, UEM Land sold a 3.2-acre piece of land for RM31m or RM220 psf to Tiong Nam Logistics to develop a hotel and serviced apartments.
In Jan 2013, UEM Land sold 44 acres of land in Puteri Harbour for RM401m or RM210 psf to Liberty Bridge Sdn Bhd, which is equally owned by Multi-Purpose Holding's Tan Sri Surin Upatkoon, KL Kepong's Tan Sri Lee Oi Hian, Tan Sri Wan Azmi Wan Hamzah and chairman and managing director of UOB-Kay Hian Holdings Ltd Wee Ee Chao. The pricing of the land appears to be relatively low due to its large size and lower plot ratios. UEM Land stands to reap significant profits from this land sale that will be recognised in 2013.
UEM Land has launched two wholly-owned projects in Puteri Harbour since 2011. In end-2011, UEM Land launched the Imperia condos, which were priced at an average of RM725 psf. At end-2012, the group launched the Teega condos, which are of slightly lower specifications but branded under the Sunrise name, and managed to fetch a higher average of RM750 psf for the first two towers and RM800 psf for the final tower. UEM Land plans to embark on two more projects in Puteri Harbour in 2013.
Southern Industrial & Logistics Clusters (SiLC) - SiLC measures 1,300 acres and is a managed industrial park based on the clustering concept. The industrial park is expected to take 33 years to complete with a GDV of around RM1bn for land only. UEM Land will promote “clean” industrial clusters around three major areas, including 1) advanced technologies of nanotech and biotech, 2) agro-based industries of food and nutrition, and 3) integrated logistics. Phase 1 and Phase 2A covering 275 acres have already been completed and UEM Land is now undertaking works on Phase 2B and Phase 2C with an additional land of 332 acres. Most of the buyers thus far have been Singapore-based companies.
Afiat Healthpark - The medical park spans only 67 acres and will primarily serve the healthcare needs of the local population. It is an integrated development with three distinctive areas covering modern medicine, traditional and complementary medicine and wellness.
International destination resort - The international destination resort space covers 3,321 acres and will be the site for large international theme parks. It will be anchored by an international theme park with a strong brand name and supported by well-known hotels as well as retail, dining and entertainment facilities. We believe that success in securing a major theme park would go far in accelerating the development of Nusajaya and the spillover to the rest of Iskandar would be very significant.
EduCity - The 395-acre EduCity will be a fully-integrated education hub consisting of world-class universities, industry-centric R&D clusters, colleges, international schools and amenities. GDV of EduCity is in excess of RM1bn over seven years. It is estimated that the student population will hit 16,000 by 2018. The Netherlands Maritime Institute of Technology (NMIT) Maritime Studies

March 18, 2013
33
JB City Campus and the medicine faculty of Newcastle University started operations in 2011. The University of Southampton engineering faculty and Marlborough College commenced operations in 2012. EduCity also has a 12,000-seating capacity stadium and sports complex on 22 acres of land as well as an international student village.
Medini - Medini is a major catalyst project and considered one of the flagships of Nusajaya. An agreement was signed on 29 Aug 2007 between IIB and 1) Mubadala, the investment company of the Abu Dhabi government, 2) Kuwait Finance House, and 3) Millenium, a member of the Lebanon-based Saraya Holdings Group. Medini measures 2,200 acres and a 99-year leasehold interest was transacted for US$1.2bn or over RM43 psf. Medini will be developed into a US$20bn integrated city made up of three clusters consisting of nine distinctly-themed zones.
Significant incentives were granted by the government solely for Medini, including 1) exemption from Foreign Investment Committee rules, 2) freedom to source capital globally, 3) the ability to employ foreigners freely, 4) exemption from income taxes for 10 years from commencement of business, and 5) exemption from withholding tax on royalty and technical fee payments to non-residents for 10 years from commencement of operations. These incentives are available only for the creative, education, financial advisory and consulting, healthcare, logistics and tourism industries.
Medini is a mixed-use urban development which will feature a lifestyle and leisure cluster, a logistics village, “creative park” and an international financial district. It is divided into four zones, i.e. Medini North, Iskandar Financial District, Medini Central and Medini South. Significant progress has been achieved at Medini and infrastructure works are being undertaken by WCT, costing RM767m. In addition to being awarded the infrastructure works in Jul 09, WCT also acquired two parcels of land in Medini, a residential one costing RM61m and measuring 11 acres (RM127 psf for the land and RM30 psf based on GFA) in Oct 09 as well as a 10-acre commercial parcel costing RM50m (RM115 psf for the land and RM30 psf based on GFA) in Dec 10.
The RM750m LegoLand Theme Park sits on 76 acres and is one of the key attractions in Medini. The theme park was completed last year and is expected to attract 1.2m-1.5m visitors annually. Another major development in Medini is E&O’s joint venture with Khazanah and Temasek to develop a RM3bn wellness township. Other projects in Medini include UEM Land’s 55%-owned Lifestyle Retail Mall next to LegoLand, WCT’s RM600m 1 Medini condo and the Medini Square joint venture with Bina Puri. A LegoLand-themed hotel and Phase 2 of LegoLand is under construction. Temasek will also build and own two office buildings in Medini.
Another major project in Medini is the Gleneagles Medini medical centre to be built on 15 acres of land. The hospital will provide a comprehensive and fully-integrated healthcare service platform. Phase 1 will have a 300-bed capacity while future phases will include a rehabilitation centre, nursing home and hospital residency. Phase 1 is targeted for completion in 2014. Adjacent to Medini is the RM400m Pinewood Iskandar Malaysia Studios, a collaborative project between Khazanah and UK-based Pinewood, located on 80 acres of land. The plan is to develop a world-class media production facility to produce a variety of movies and animations. Phase 1 involves 30 acres of land and is targeted for completion this year.
March 18, 2013
34
Figure 50: Nusajaya catalyst projects
Puteri Harbour
• Integrated lifestyle destination
• Themed Resort
Int’l Destination Resort
JSNAC
• State Admin. Centre
Medini
• Integrated Development
EduCity
• Education Hub
SiLC
• Thematic Industrial Park
SOURCES: UEM LAND
Other residential projects in Nusajaya - UEM Land has five residential projects in Nusajaya that are not part of the catalyst projects. This includes East Ledang, Horizon Hills, Ledang Heights, Nusa Idaman and affordable housing. East Ledang was launched in Feb 2008 and is a 275-acre project for the development of high-end guarded and gated residential properties. East Ledang has a GDV of over RM1bn and will take 6-8 years to complete. Nearly 60% of its buyers are foreigners, mostly from Singapore. Horizon Hills is a 50:50 joint venture with Gamuda. The upmarket project spans 1,227 acres and has a GDV of RM4bn. Ledang Heights measures 360 acres and is located next to East Ledang. It was one of the first projects launched in Nusajaya by the group in 1998. Nusa Idaman is a medium- to high-end hillside development and was launched in 2006. The project measures 250 acres and features precinct-based communities with a single entrance-exit and perimeter fencing. The project has a GDV of slightly over RM0.5bn. There are two social housing projects under affordable housing: Taman Nusantara measuring 650 acres and R10/R11 measuring 193 acres. Affordable house prices are regulated by the state government and start from as low as RM35,000 per unit. Margins are generally narrow, if not negative.
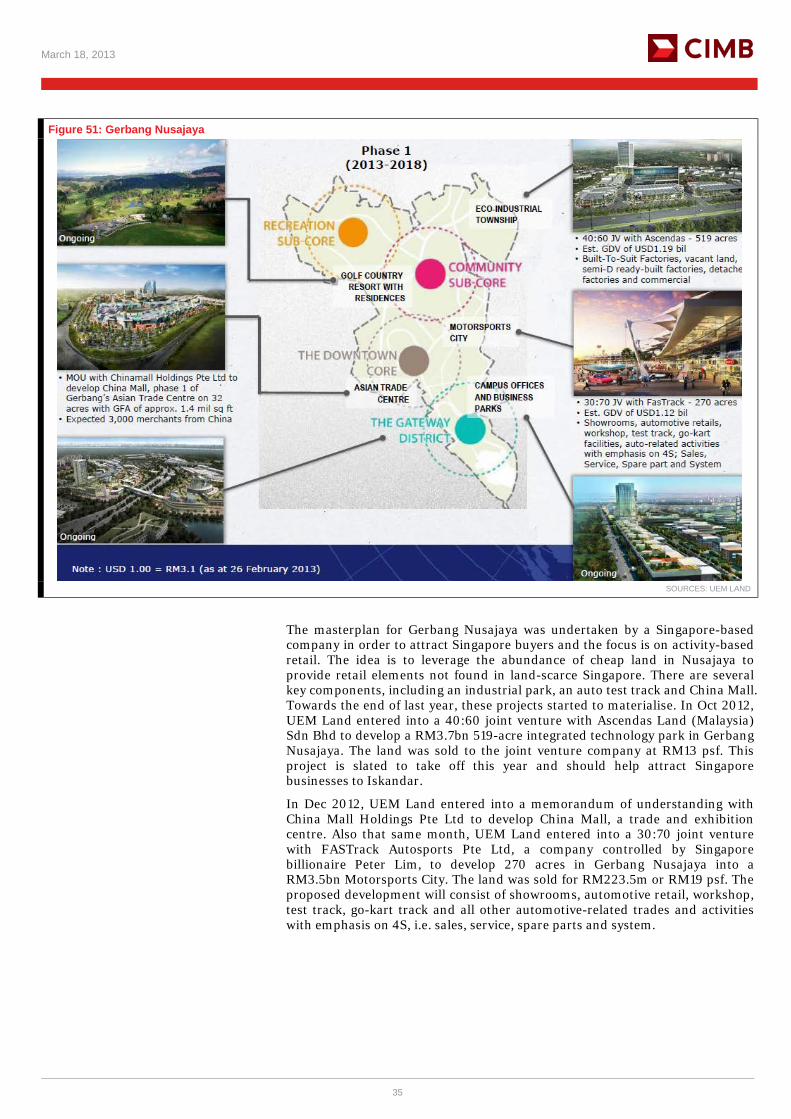
Other recent developments - Last year UEM Land's 4,500-acre Gerbang Nusajaya development finally took off. Translated as "Gateway to Nusajaya", Gerbang Nusajaya is the first development that those driving from Singapore via the second crossing will pass through after customs and immigration. The project is conservatively estimated to have a GDV of RM18bn. UEM Land believes that Gerbang Nusajaya could rival, if not exceed, UEM Land’s current flagship Puteri Harbour in terms of potential. The key strategy behind Gerbang Nusajaya is to attract Singaporeans and create jobs.
March 18, 2013
35
Figure 51: Gerbang Nusajaya
SOURCES: UEM LAND
The masterplan for Gerbang Nusajaya was undertaken by a Singapore-based company in order to attract Singapore buyers and the focus is on activity-based retail. The idea is to leverage the abundance of cheap land in Nusajaya to provide retail elements not found in land-scarce Singapore. There are several key components, including an industrial park, an auto test track and China Mall. Towards the end of last year, these projects started to materialise. In Oct 2012, UEM Land entered into a 40:60 joint venture with Ascendas Land (Malaysia) Sdn Bhd to develop a RM3.7bn 519-acre integrated technology park in Gerbang Nusajaya. The land was sold to the joint venture company at RM13 psf. This project is slated to take off this year and should help attract Singapore businesses to Iskandar.
In Dec 2012, UEM Land entered into a memorandum of understanding with China Mall Holdings Pte Ltd to develop China Mall, a trade and exhibition centre. Also that same month, UEM Land entered into a 30:70 joint venture with FASTrack Autosports Pte Ltd, a company controlled by Singapore billionaire Peter Lim, to develop 270 acres in Gerbang Nusajaya into a RM3.5bn Motorsports City. The land was sold for RM223.5m or RM19 psf. The proposed development will consist of showrooms, automotive retail, workshop, test track, go-kart track and all other automotive-related trades and activities with emphasis on 4S, i.e. sales, service, spare parts and system.
March 18, 2013
36
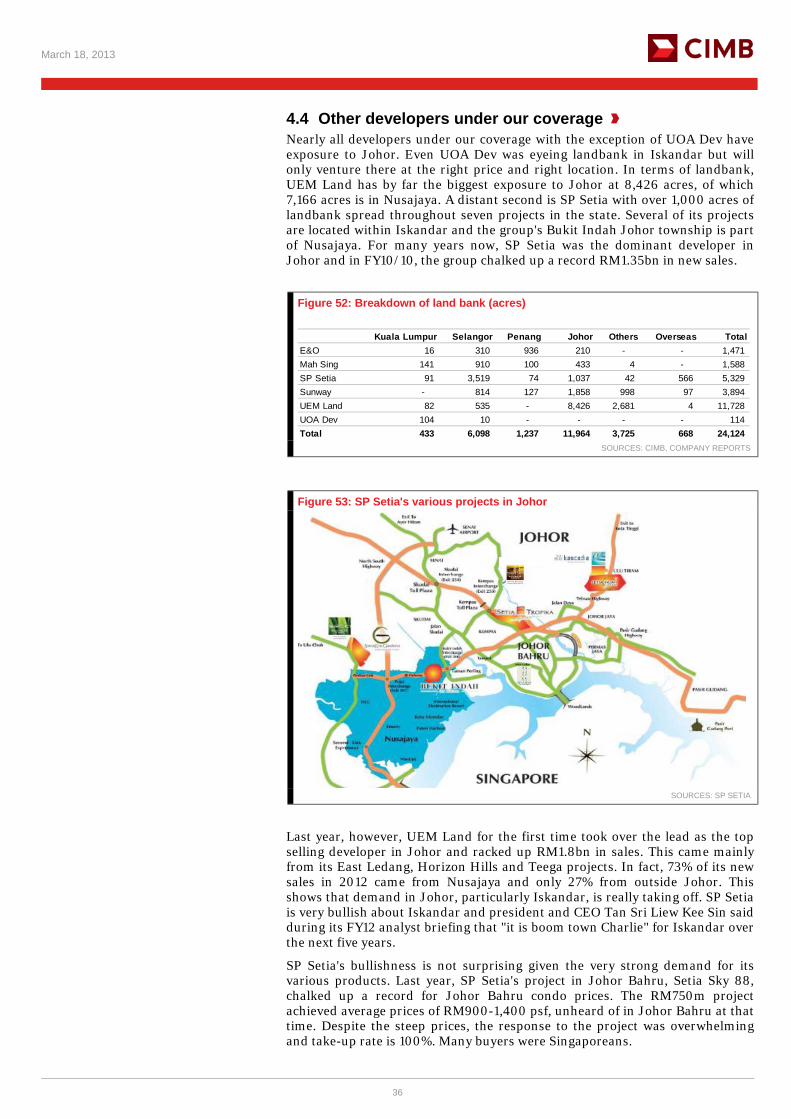
4.4 Other developers under our coverage Nearly all developers under our coverage with the exception of UOA Dev have exposure to Johor. Even UOA Dev was eyeing landbank in Iskandar but will only venture there at the right price and right location. In terms of landbank, UEM Land has by far the biggest exposure to Johor at 8,426 acres, of which 7,166 acres is in Nusajaya. A distant second is SP Setia with over 1,000 acres of landbank spread throughout seven projects in the state. Several of its projects are located within Iskandar and the group's Bukit Indah Johor township is part of Nusajaya. For many years now, SP Setia was the dominant developer in Johor and in FY10/10, the group chalked up a record RM1.35bn in new sales.
Figure 52: Breakdown of land bank (acres)
Kuala Lumpur Selangor Penang Johor Others Overseas TotalE&O 16 310 936 210 - - 1,471 Mah Sing 141 910 100 433 4 - 1,588 SP Setia 91 3,519 74 1,037 42 566 5,329 Sunway - 814 127 1,858 998 97 3,894 UEM Land 82 535 - 8,426 2,681 4 11,728 UOA Dev 104 10 - - - - 114 Total 433 6,098 1,237 11,964 3,725 668 24,124
SOURCES: CIMB, COMPANY REPORTS
Figure 53: SP Setia's various projects in Johor
SOURCES: SP SETIA
Last year, however, UEM Land for the first time took over the lead as the top selling developer in Johor and racked up RM1.8bn in sales. This came mainly from its East Ledang, Horizon Hills and Teega projects. In fact, 73% of its new sales in 2012 came from Nusajaya and only 27% from outside Johor. This shows that demand in Johor, particularly Iskandar, is really taking off. SP Setia is very bullish about Iskandar and president and CEO Tan Sri Liew Kee Sin said during its FY12 analyst briefing that "it is boom town Charlie" for Iskandar over the next five years.
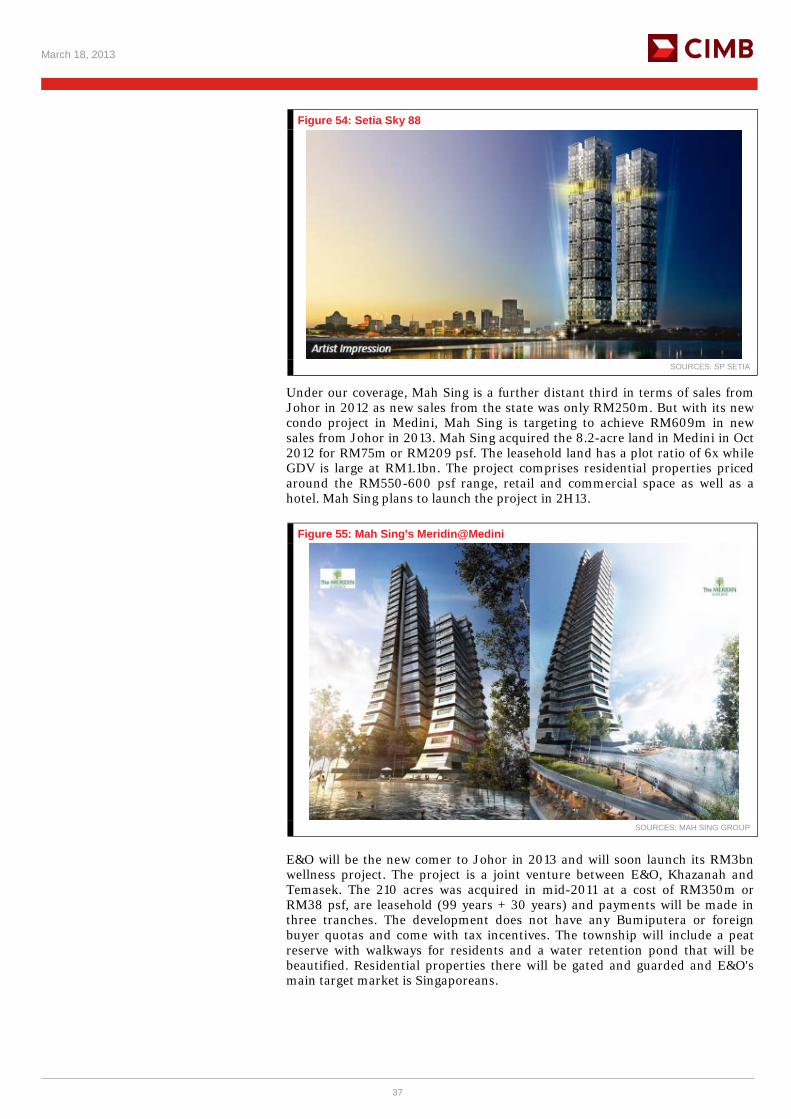
SP Setia's bullishness is not surprising given the very strong demand for its various products. Last year, SP Setia's project in Johor Bahru, Setia Sky 88, chalked up a record for Johor Bahru condo prices. The RM750m project achieved average prices of RM900-1,400 psf, unheard of in Johor Bahru at that time. Despite the steep prices, the response to the project was overwhelming and take-up rate is 100%. Many buyers were Singaporeans.
March 18, 2013
37
Figure 54: Setia Sky 88
SOURCES: SP SETIA
Under our coverage, Mah Sing is a further distant third in terms of sales from Johor in 2012 as new sales from the state was only RM250m. But with its new condo project in Medini, Mah Sing is targeting to achieve RM609m in new sales from Johor in 2013. Mah Sing acquired the 8.2-acre land in Medini in Oct 2012 for RM75m or RM209 psf. The leasehold land has a plot ratio of 6x while GDV is large at RM1.1bn. The project comprises residential properties priced around the RM550-600 psf range, retail and commercial space as well as a hotel. Mah Sing plans to launch the project in 2H13.
Figure 55: Mah Sing's Meridin@Medini
SOURCES: MAH SING GROUP
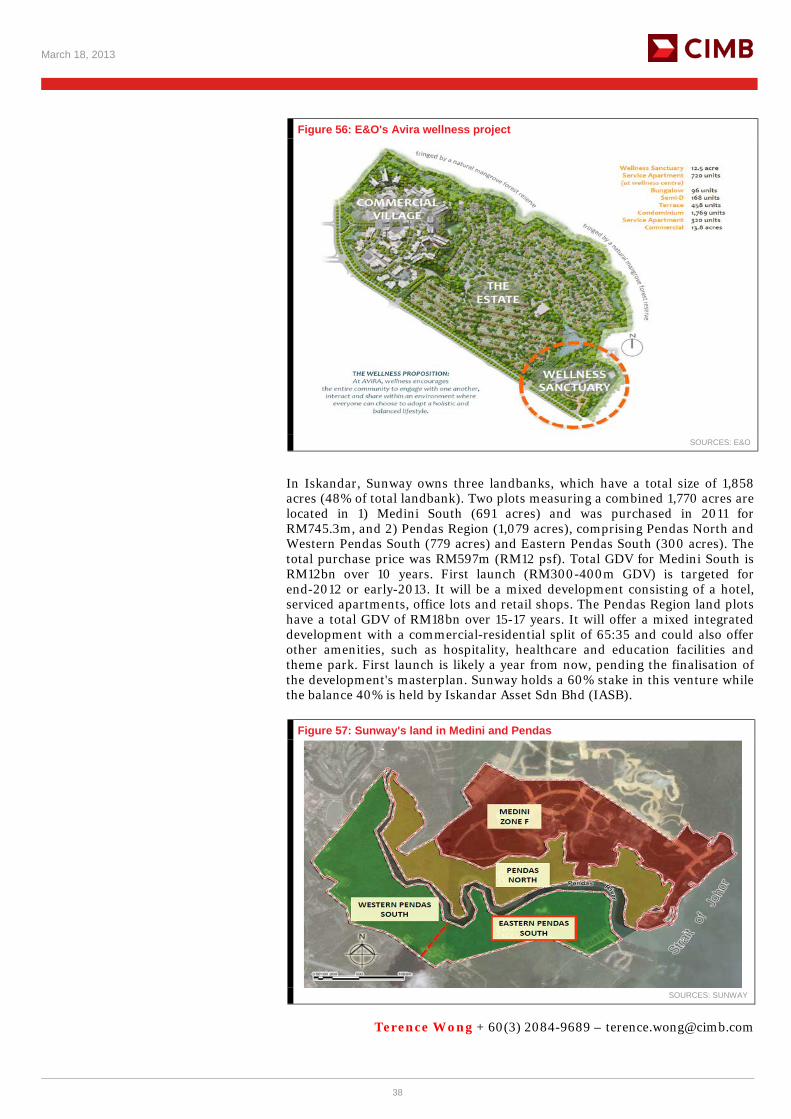
E&O will be the new comer to Johor in 2013 and will soon launch its RM3bn wellness project. The project is a joint venture between E&O, Khazanah and Temasek. The 210 acres was acquired in mid-2011 at a cost of RM350m or RM38 psf, are leasehold (99 years + 30 years) and payments will be made in three tranches. The development does not have any Bumiputera or foreign buyer quotas and come with tax incentives. The township will include a peat reserve with walkways for residents and a water retention pond that will be beautified. Residential properties there will be gated and guarded and E&O's main target market is Singaporeans.
March 18, 2013
38
Figure 56: E&O's Avira wellness project
SOURCES: E&O
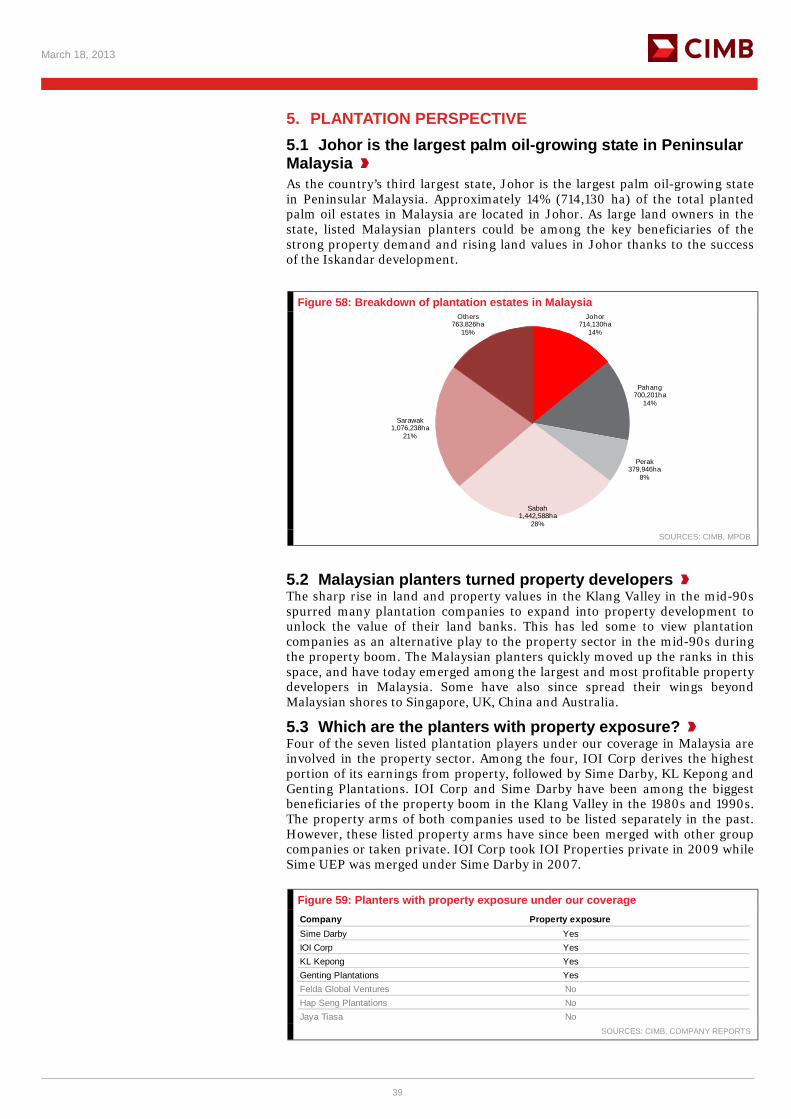
In Iskandar, Sunway owns three landbanks, which have a total size of 1,858 acres (48% of total landbank). Two plots measuring a combined 1,770 acres are located in 1) Medini South (691 acres) and was purchased in 2011 for RM745.3m, and 2) Pendas Region (1,079 acres), comprising Pendas North and Western Pendas South (779 acres) and Eastern Pendas South (300 acres). The total purchase price was RM597m (RM12 psf). Total GDV for Medini South is RM12bn over 10 years. First launch (RM300-400m GDV) is targeted for end-2012 or early-2013. It will be a mixed development consisting of a hotel, serviced apartments, office lots and retail shops. The Pendas Region land plots have a total GDV of RM18bn over 15-17 years. It will offer a mixed integrated development with a commercial-residential split of 65:35 and could also offer other amenities, such as hospitality, healthcare and education facilities and theme park. First launch is likely a year from now, pending the finalisation of the development's masterplan. Sunway holds a 60% stake in this venture while the balance 40% is held by Iskandar Asset Sdn Bhd (IASB).
Figure 57: Sunway's land in Medini and Pendas
SOURCES: SUNWAY
Terence Wong + 60(3) 2084-9689 – [email protected]
March 18, 2013
39
5. PLANTATION PERSPECTIVE 5.1 Johor is the largest palm oil-growing state in Peninsular Malaysia As the country’s third largest state, Johor is the largest palm oil-growing state in Peninsular Malaysia. Approximately 14% (714,130 ha) of the total planted palm oil estates in Malaysia are located in Johor. As large land owners in the state, listed Malaysian planters could be among the key beneficiaries of the strong property demand and rising land values in Johor thanks to the success of the Iskandar development.
Figure 58: Breakdown of plantation estates in Malaysia
Johor714,130ha
14%
Pahang700,201ha
14%
Perak379,946ha
8%
Sabah1,442,588ha
28%
Sarawak1,076,238ha
21%
Others763,826ha
15%
SOURCES: CIMB, MPOB
5.2 Malaysian planters turned property developers The sharp rise in land and property values in the Klang Valley in the mid-90s spurred many plantation companies to expand into property development to unlock the value of their land banks. This has led some to view plantation companies as an alternative play to the property sector in the mid-90s during the property boom. The Malaysian planters quickly moved up the ranks in this space, and have today emerged among the largest and most profitable property developers in Malaysia. Some have also since spread their wings beyond Malaysian shores to Singapore, UK, China and Australia.
5.3 Which are the planters with property exposure? Four of the seven listed plantation players under our coverage in Malaysia are involved in the property sector. Among the four, IOI Corp derives the highest portion of its earnings from property, followed by Sime Darby, KL Kepong and Genting Plantations. IOI Corp and Sime Darby have been among the biggest beneficiaries of the property boom in the Klang Valley in the 1980s and 1990s. The property arms of both companies used to be listed separately in the past. However, these listed property arms have since been merged with other group companies or taken private. IOI Corp took IOI Properties private in 2009 while Sime UEP was merged under Sime Darby in 2007.
Figure 59: Planters with property exposure under our coverage Company Property exposureSime Darby YesIOI Corp YesKL Kepong YesGenting Plantations YesFelda Global Ventures NoHap Seng Plantations NoJaya Tiasa No
SOURCES: CIMB, COMPANY REPORTS
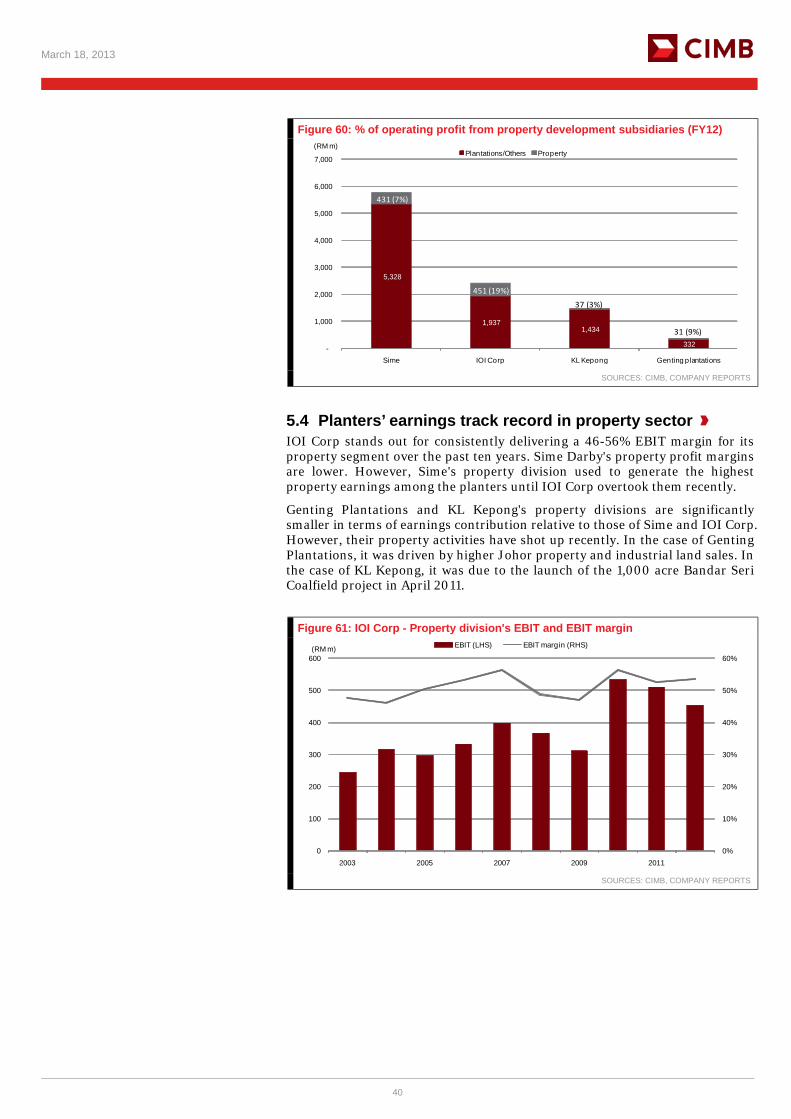
March 18, 2013
40
Figure 60: % of operating profit from property development subsidiaries (FY12)
5,328
1,937 1,434
332
431 (7%)
451 (19%)
37 (3%)
31 (9%)
-
1,000
2,000
3,000
4,000
5,000
6,000
7,000
Sime IOI Corp KL Kepong Genting plantations
Plantations/Others Property(RM m)
SOURCES: CIMB, COMPANY REPORTS
5.4 Planters’ earnings track record in property sector IOI Corp stands out for consistently delivering a 46-56% EBIT margin for its property segment over the past ten years. Sime Darby's property profit margins are lower. However, Sime's property division used to generate the highest property earnings among the planters until IOI Corp overtook them recently.
Genting Plantations and KL Kepong's property divisions are significantly smaller in terms of earnings contribution relative to those of Sime and IOI Corp. However, their property activities have shot up recently. In the case of Genting Plantations, it was driven by higher Johor property and industrial land sales. In the case of KL Kepong, it was due to the launch of the 1,000 acre Bandar Seri Coalfield project in April 2011.
Figure 61: IOI Corp - Property division's EBIT and EBIT margin
0%
10%
20%
30%
40%
50%
60%
0
100
200
300
400
500
600
2003 2005 2007 2009 2011
EBIT (LHS) EBIT margin (RHS)(RM m)
SOURCES: CIMB, COMPANY REPORTS
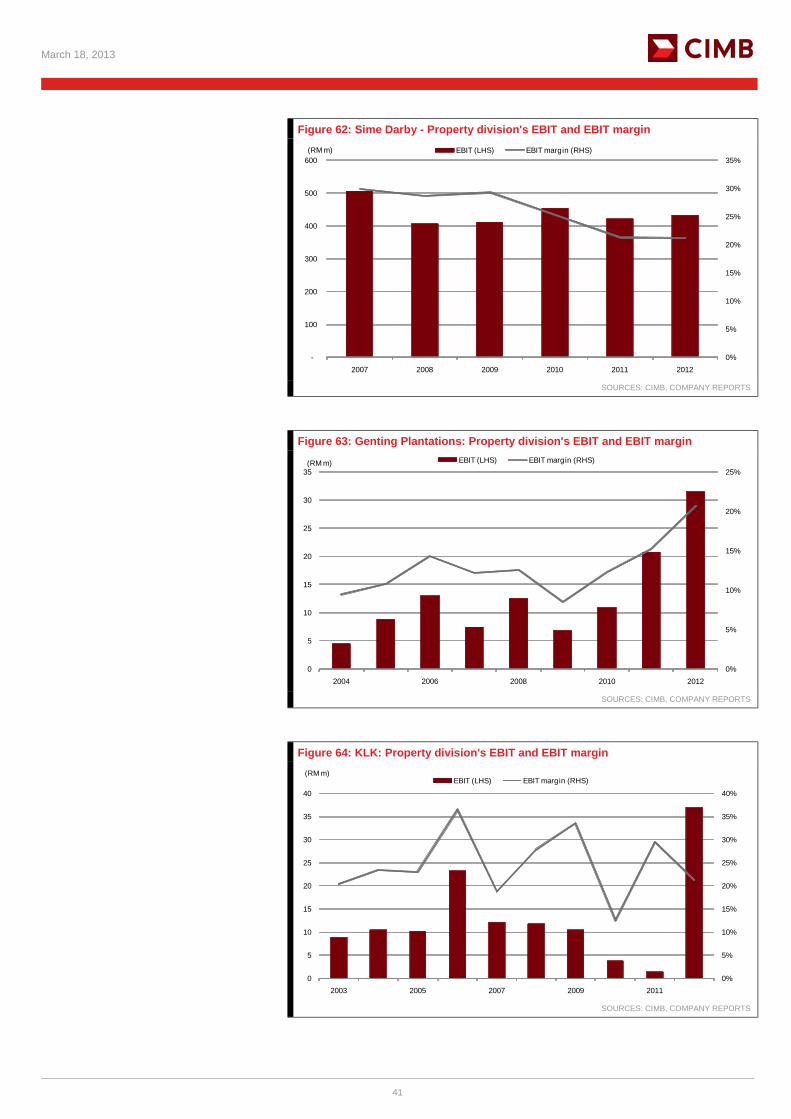
March 18, 2013
41
Figure 62: Sime Darby - Property division's EBIT and EBIT margin
0%
5%
10%
15%
20%
25%
30%
35%
-
100
200
300
400
500
600
2007 2008 2009 2010 2011 2012
EBIT (LHS) EBIT margin (RHS)(RM m)
SOURCES: CIMB, COMPANY REPORTS
Figure 63: Genting Plantations: Property division's EBIT and EBIT margin
0%
5%
10%
15%
20%
25%
0
5
10
15
20
25
30
35
2004 2006 2008 2010 2012
EBIT (LHS) EBIT margin (RHS)(RM m)
SOURCES: CIMB, COMPANY REPORTS
Figure 64: KLK: Property division's EBIT and EBIT margin
0%
5%
10%
15%
20%
25%
30%
35%
40%
0
5
10
15
20
25
30
35
40
2003 2005 2007 2009 2011
EBIT (LHS) EBIT margin (RHS)(RM m)
SOURCES: CIMB, COMPANY REPORTS
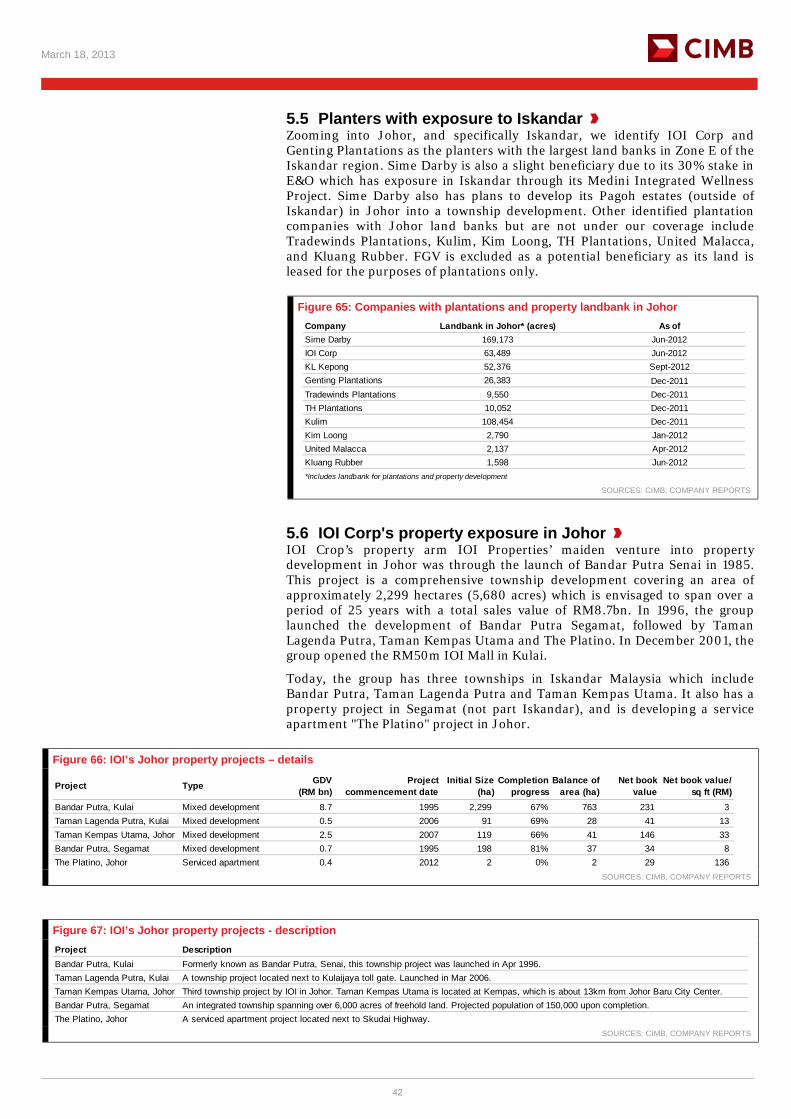
March 18, 2013
42
5.5 Planters with exposure to Iskandar Zooming into Johor, and specifically Iskandar, we identify IOI Corp and Genting Plantations as the planters with the largest land banks in Zone E of the Iskandar region. Sime Darby is also a slight beneficiary due to its 30% stake in E&O which has exposure in Iskandar through its Medini Integrated Wellness Project. Sime Darby also has plans to develop its Pagoh estates (outside of Iskandar) in Johor into a township development. Other identified plantation companies with Johor land banks but are not under our coverage include Tradewinds Plantations, Kulim, Kim Loong, TH Plantations, United Malacca, and Kluang Rubber. FGV is excluded as a potential beneficiary as its land is leased for the purposes of plantations only.
Figure 65: Companies with plantations and property landbank in Johor Company Landbank in Johor* (acres) As ofSime Darby 169,173 Jun-2012IOI Corp 63,489 Jun-2012KL Kepong 52,376 Sept-2012Genting Plantations 26,383 Dec-2011Tradewinds Plantations 9,550 Dec-2011TH Plantations 10,052 Dec-2011Kulim 108,454 Dec-2011Kim Loong 2,790 Jan-2012United Malacca 2,137 Apr-2012Kluang Rubber 1,598 Jun-2012*Includes landbank for plantations and property development
SOURCES: CIMB, COMPANY REPORTS
5.6 IOI Corp's property exposure in Johor IOI Crop’s property arm IOI Properties’ maiden venture into property development in Johor was through the launch of Bandar Putra Senai in 1985. This project is a comprehensive township development covering an area of approximately 2,299 hectares (5,680 acres) which is envisaged to span over a period of 25 years with a total sales value of RM8.7bn. In 1996, the group launched the development of Bandar Putra Segamat, followed by Taman Lagenda Putra, Taman Kempas Utama and The Platino. In December 2001, the group opened the RM50m IOI Mall in Kulai.
Today, the group has three townships in Iskandar Malaysia which include Bandar Putra, Taman Lagenda Putra and Taman Kempas Utama. It also has a property project in Segamat (not part Iskandar), and is developing a service apartment "The Platino" project in Johor.
Figure 66: IOI’s Johor property projects – details
Project Type GDV(RM bn)
Project commencement date
Initial Size (ha)
Completion progress
Balance of area (ha)
Net book value
Net book value/ sq ft (RM)
Bandar Putra, Kulai Mixed development 8.7 1995 2,299 67% 763 231 3 Taman Lagenda Putra, Kulai Mixed development 0.5 2006 91 69% 28 41 13 Taman Kempas Utama, Johor Mixed development 2.5 2007 119 66% 41 146 33 Bandar Putra, Segamat Mixed development 0.7 1995 198 81% 37 34 8 The Platino, Johor Serviced apartment 0.4 2012 2 0% 2 29 136
SOURCES: CIMB, COMPANY REPORTS
Figure 67: IOI’s Johor property projects - description Project DescriptionBandar Putra, Kulai Formerly known as Bandar Putra, Senai, this township project was launched in Apr 1996.Taman Lagenda Putra, Kulai A township project located next to Kulaijaya toll gate. Launched in Mar 2006.Taman Kempas Utama, Johor Third township project by IOI in Johor. Taman Kempas Utama is located at Kempas, which is about 13km from Johor Baru City Center.Bandar Putra, Segamat An integrated township spanning over 6,000 acres of freehold land. Projected population of 150,000 upon completion.The Platino, Johor A serviced apartment project located next to Skudai Highway.
SOURCES: CIMB, COMPANY REPORTS
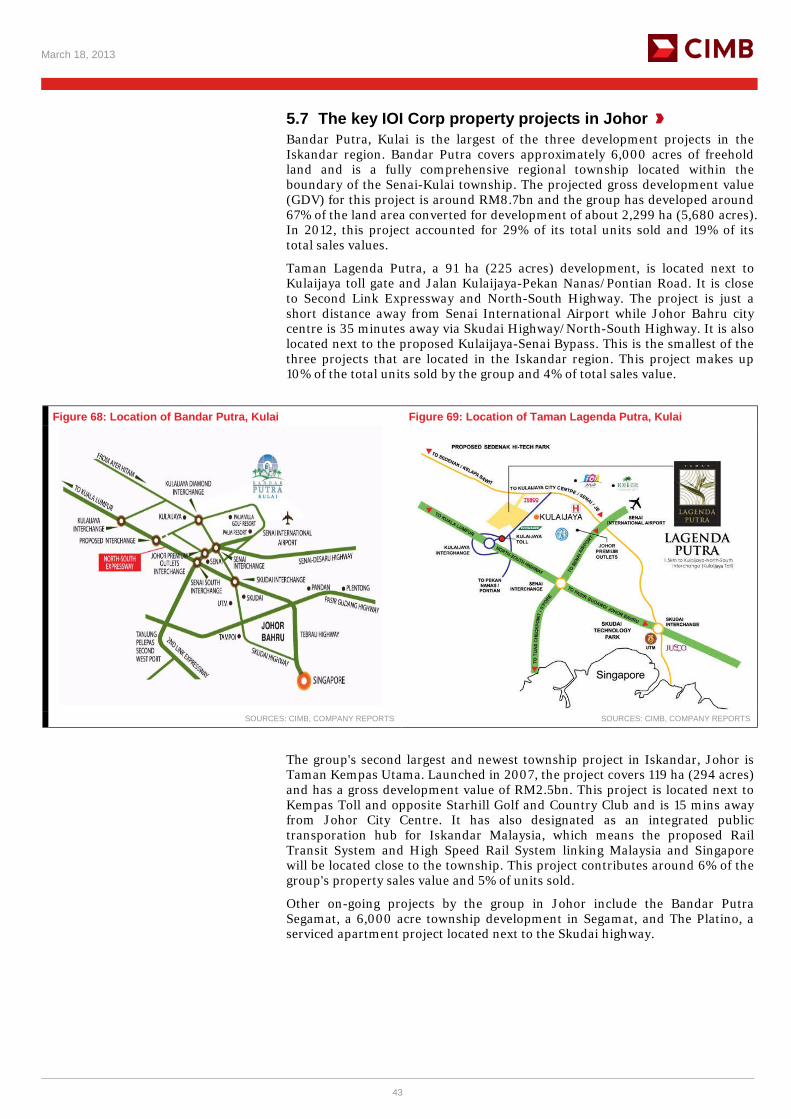
March 18, 2013
43
5.7 The key IOI Corp property projects in Johor Bandar Putra, Kulai is the largest of the three development projects in the Iskandar region. Bandar Putra covers approximately 6,000 acres of freehold land and is a fully comprehensive regional township located within the boundary of the Senai-Kulai township. The projected gross development value (GDV) for this project is around RM8.7bn and the group has developed around 67% of the land area converted for development of about 2,299 ha (5,680 acres). In 2012, this project accounted for 29% of its total units sold and 19% of its total sales values.
Taman Lagenda Putra, a 91 ha (225 acres) development, is located next to Kulaijaya toll gate and Jalan Kulaijaya-Pekan Nanas/Pontian Road. It is close to Second Link Expressway and North-South Highway. The project is just a short distance away from Senai International Airport while Johor Bahru city centre is 35 minutes away via Skudai Highway/North-South Highway. It is also located next to the proposed Kulaijaya-Senai Bypass. This is the smallest of the three projects that are located in the Iskandar region. This project makes up 10% of the total units sold by the group and 4% of total sales value.
Figure 68: Location of Bandar Putra, Kulai Figure 69: Location of Taman Lagenda Putra, Kulai
SOURCES: CIMB, COMPANY REPORTS SOURCES: CIMB, COMPANY REPORTS
The group's second largest and newest township project in Iskandar, Johor is Taman Kempas Utama. Launched in 2007, the project covers 119 ha (294 acres) and has a gross development value of RM2.5bn. This project is located next to Kempas Toll and opposite Starhill Golf and Country Club and is 15 mins away from Johor City Centre. It has also designated as an integrated public transporation hub for Iskandar Malaysia, which means the proposed Rail Transit System and High Speed Rail System linking Malaysia and Singapore will be located close to the township. This project contributes around 6% of the group's property sales value and 5% of units sold.
Other on-going projects by the group in Johor include the Bandar Putra Segamat, a 6,000 acre township development in Segamat, and The Platino, a serviced apartment project located next to the Skudai highway.
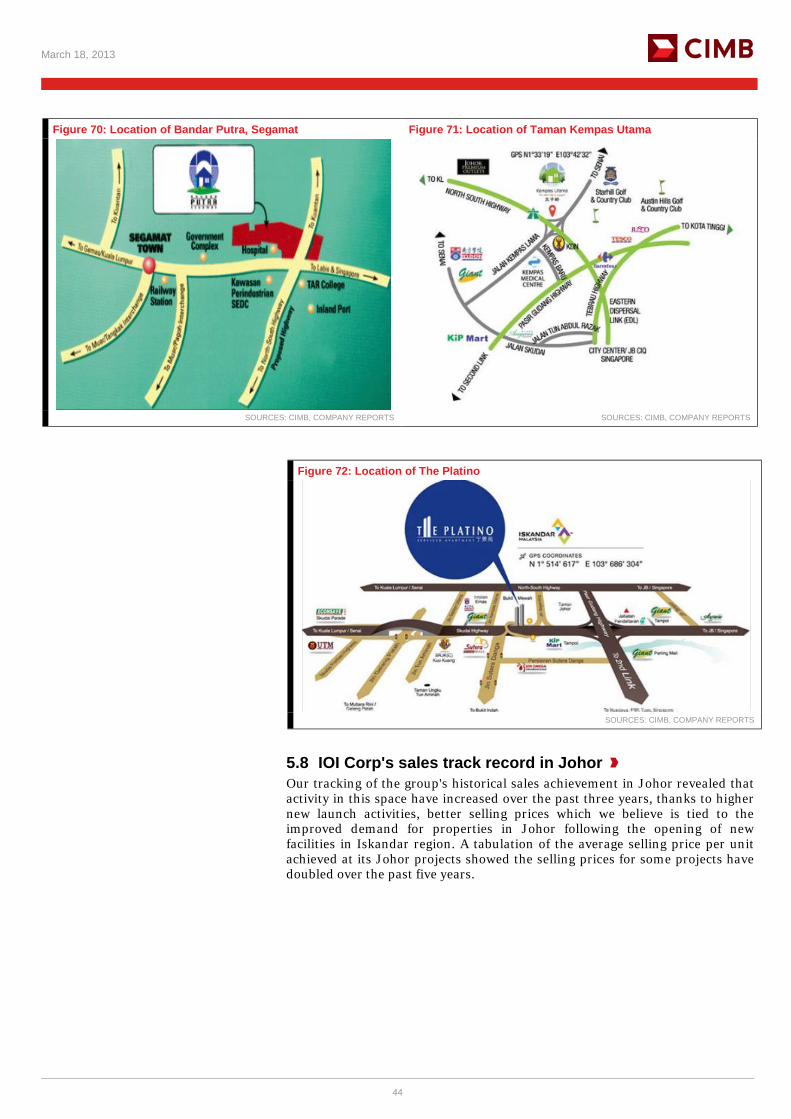
March 18, 2013
44
Figure 70: Location of Bandar Putra, Segamat Figure 71: Location of Taman Kempas Utama
SOURCES: CIMB, COMPANY REPORTS SOURCES: CIMB, COMPANY REPORTS
Figure 72: Location of The Platino
SOURCES: CIMB, COMPANY REPORTS
5.8 IOI Corp's sales track record in Johor Our tracking of the group's historical sales achievement in Johor revealed that activity in this space have increased over the past three years, thanks to higher new launch activities, better selling prices which we believe is tied to the improved demand for properties in Johor following the opening of new facilities in Iskandar region. A tabulation of the average selling price per unit achieved at its Johor projects showed the selling prices for some projects have doubled over the past five years.
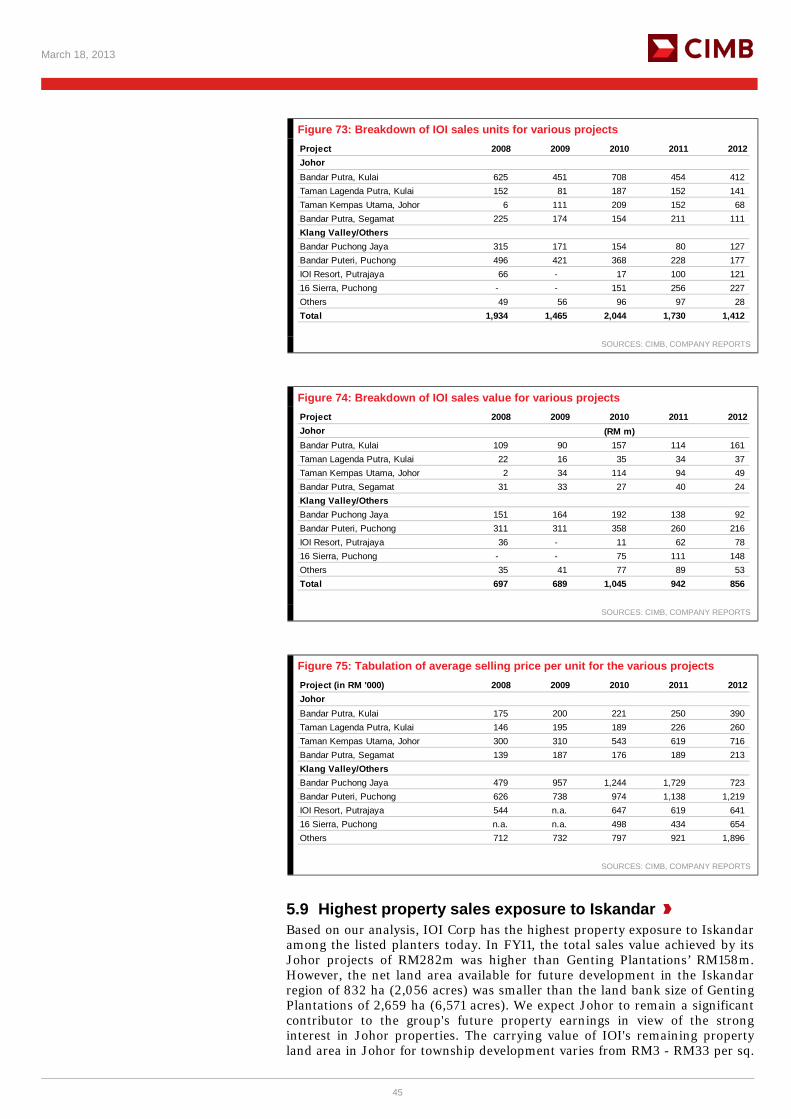
March 18, 2013
45
Figure 73: Breakdown of IOI sales units for various projects Project 2008 2009 2010 2011 2012JohorBandar Putra, Kulai 625 451 708 454 412 Taman Lagenda Putra, Kulai 152 81 187 152 141 Taman Kempas Utama, Johor 6 111 209 152 68 Bandar Putra, Segamat 225 174 154 211 111 Klang Valley/OthersBandar Puchong Jaya 315 171 154 80 127 Bandar Puteri, Puchong 496 421 368 228 177 IOI Resort, Putrajaya 66 - 17 100 121 16 Sierra, Puchong - - 151 256 227 Others 49 56 96 97 28 Total 1,934 1,465 2,044 1,730 1,412
SOURCES: CIMB, COMPANY REPORTS
Figure 74: Breakdown of IOI sales value for various projects Project 2008 2009 2010 2011 2012JohorBandar Putra, Kulai 109 90 157 114 161 Taman Lagenda Putra, Kulai 22 16 35 34 37 Taman Kempas Utama, Johor 2 34 114 94 49 Bandar Putra, Segamat 31 33 27 40 24 Klang Valley/OthersBandar Puchong Jaya 151 164 192 138 92 Bandar Puteri, Puchong 311 311 358 260 216 IOI Resort, Putrajaya 36 - 11 62 78 16 Sierra, Puchong - - 75 111 148 Others 35 41 77 89 53 Total 697 689 1,045 942 856
(RM m)
SOURCES: CIMB, COMPANY REPORTS
Figure 75: Tabulation of average selling price per unit for the various projects Project (in RM '000) 2008 2009 2010 2011 2012JohorBandar Putra, Kulai 175 200 221 250 390 Taman Lagenda Putra, Kulai 146 195 189 226 260 Taman Kempas Utama, Johor 300 310 543 619 716 Bandar Putra, Segamat 139 187 176 189 213 Klang Valley/OthersBandar Puchong Jaya 479 957 1,244 1,729 723 Bandar Puteri, Puchong 626 738 974 1,138 1,219 IOI Resort, Putrajaya 544 n.a. 647 619 641 16 Sierra, Puchong n.a. n.a. 498 434 654 Others 712 732 797 921 1,896
SOURCES: CIMB, COMPANY REPORTS
5.9 Highest property sales exposure to Iskandar Based on our analysis, IOI Corp has the highest property exposure to Iskandar among the listed planters today. In FY11, the total sales value achieved by its Johor projects of RM282m was higher than Genting Plantations’ RM158m. However, the net land area available for future development in the Iskandar region of 832 ha (2,056 acres) was smaller than the land bank size of Genting Plantations of 2,659 ha (6,571 acres). We expect Johor to remain a significant contributor to the group's future property earnings in view of the strong interest in Johor properties. The carrying value of IOI's remaining property land area in Johor for township development varies from RM3 - RM33 per sq.
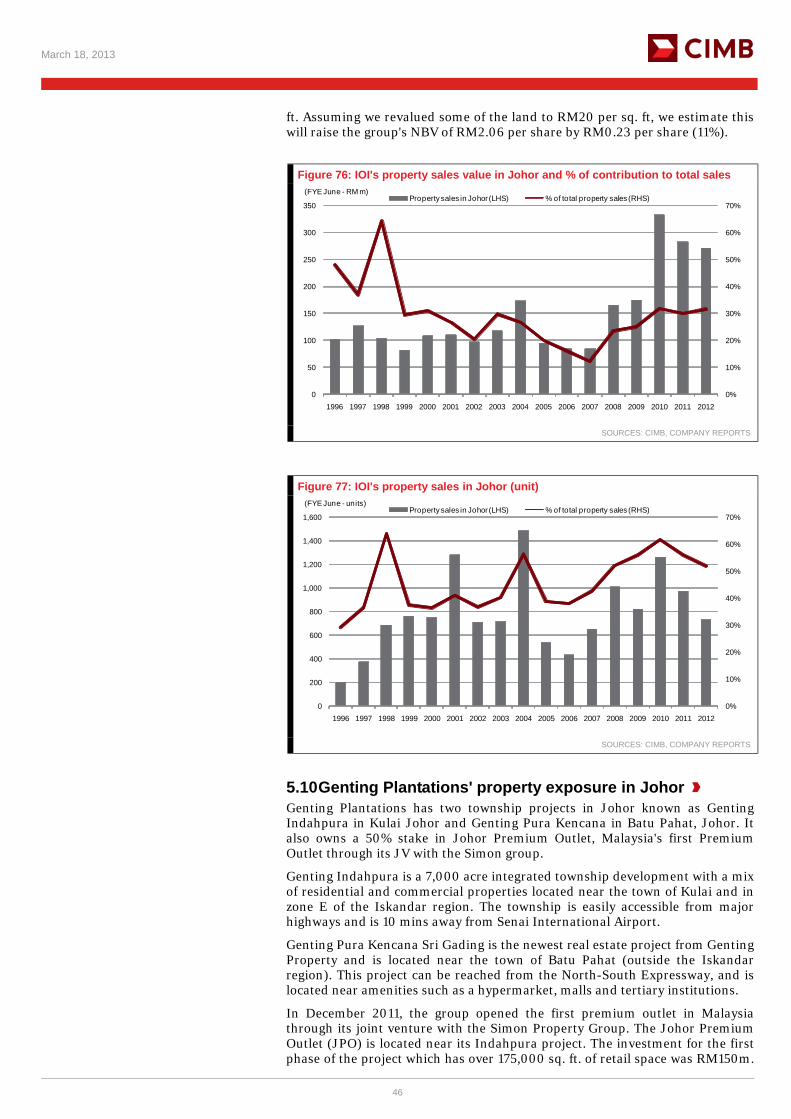
March 18, 2013
46
ft. Assuming we revalued some of the land to RM20 per sq. ft, we estimate this will raise the group's NBV of RM2.06 per share by RM0.23 per share (11%).
Figure 76: IOI's property sales value in Johor and % of contribution to total sales
0%
10%
20%
30%
40%
50%
60%
70%
0
50
100
150
200
250
300
350
1996 1997 1998 1999 2000 2001 2002 2003 2004 2005 2006 2007 2008 2009 2010 2011 2012
Property sales in Johor (LHS) % of total property sales (RHS)(FYE June - RM m)
SOURCES: CIMB, COMPANY REPORTS
Figure 77: IOI's property sales in Johor (unit)
0%
10%
20%
30%
40%
50%
60%
70%
0
200
400
600
800
1,000
1,200
1,400
1,600
1996 1997 1998 1999 2000 2001 2002 2003 2004 2005 2006 2007 2008 2009 2010 2011 2012
Property sales in Johor (LHS) % of total property sales (RHS)(FYE June - units)
SOURCES: CIMB, COMPANY REPORTS
5.10 Genting Plantations' property exposure in Johor Genting Plantations has two township projects in Johor known as Genting Indahpura in Kulai Johor and Genting Pura Kencana in Batu Pahat, Johor. It also owns a 50% stake in Johor Premium Outlet, Malaysia's first Premium Outlet through its JV with the Simon group.
Genting Indahpura is a 7,000 acre integrated township development with a mix of residential and commercial properties located near the town of Kulai and in zone E of the Iskandar region. The township is easily accessible from major highways and is 10 mins away from Senai International Airport.
Genting Pura Kencana Sri Gading is the newest real estate project from Genting Property and is located near the town of Batu Pahat (outside the Iskandar region). This project can be reached from the North-South Expressway, and is located near amenities such as a hypermarket, malls and tertiary institutions.
In December 2011, the group opened the first premium outlet in Malaysia through its joint venture with the Simon Property Group. The Johor Premium Outlet (JPO) is located near its Indahpura project. The investment for the first phase of the project which has over 175,000 sq. ft. of retail space was RM150m.
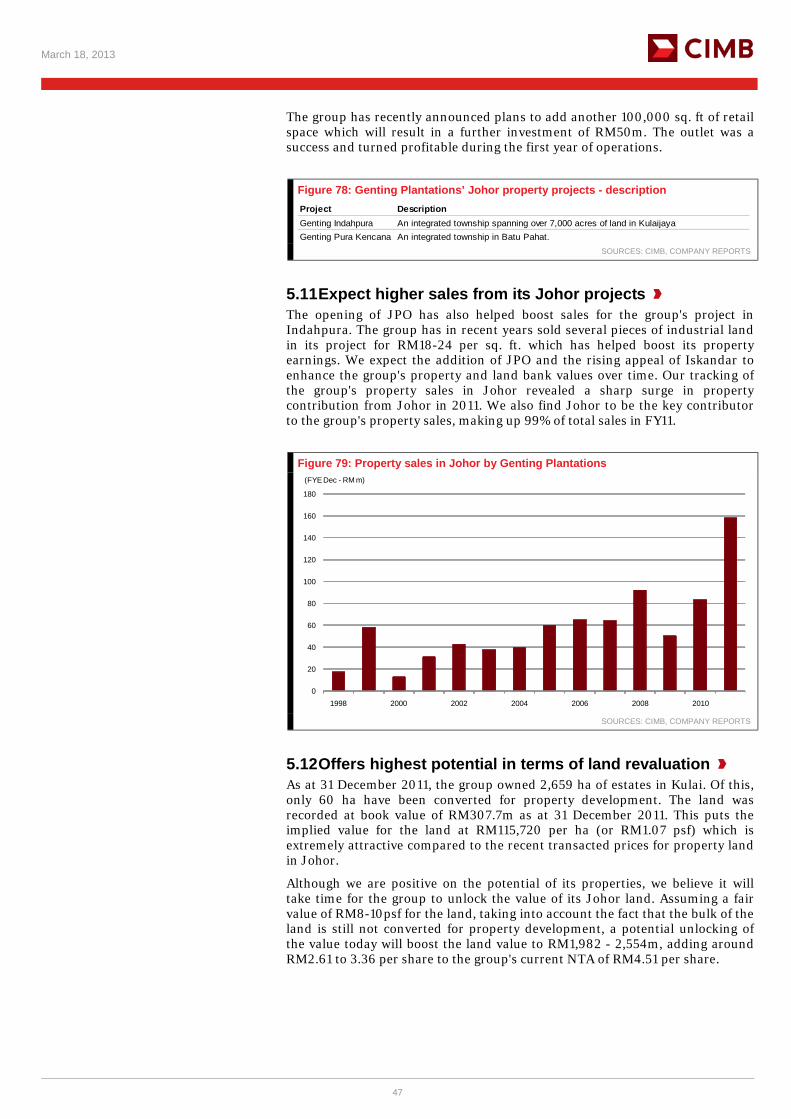
March 18, 2013
47
The group has recently announced plans to add another 100,000 sq. ft of retail space which will result in a further investment of RM50m. The outlet was a success and turned profitable during the first year of operations.
Figure 78: Genting Plantations’ Johor property projects - description Project DescriptionGenting Indahpura An integrated township spanning over 7,000 acres of land in KulaijayaGenting Pura Kencana An integrated township in Batu Pahat.
SOURCES: CIMB, COMPANY REPORTS
5.11 Expect higher sales from its Johor projects The opening of JPO has also helped boost sales for the group's project in Indahpura. The group has in recent years sold several pieces of industrial land in its project for RM18-24 per sq. ft. which has helped boost its property earnings. We expect the addition of JPO and the rising appeal of Iskandar to enhance the group's property and land bank values over time. Our tracking of the group's property sales in Johor revealed a sharp surge in property contribution from Johor in 2011. We also find Johor to be the key contributor to the group's property sales, making up 99% of total sales in FY11.
Figure 79: Property sales in Johor by Genting Plantations
0
20
40
60
80
100
120
140
160
180
1998 2000 2002 2004 2006 2008 2010
(FYE Dec - RM m)
SOURCES: CIMB, COMPANY REPORTS
5.12 Offers highest potential in terms of land revaluation As at 31 December 2011, the group owned 2,659 ha of estates in Kulai. Of this, only 60 ha have been converted for property development. The land was recorded at book value of RM307.7m as at 31 December 2011. This puts the implied value for the land at RM115,720 per ha (or RM1.07 psf) which is extremely attractive compared to the recent transacted prices for property land in Johor.
Although we are positive on the potential of its properties, we believe it will take time for the group to unlock the value of its Johor land. Assuming a fair value of RM8-10psf for the land, taking into account the fact that the bulk of the land is still not converted for property development, a potential unlocking of the value today will boost the land value to RM1,982 - 2,554m, adding around RM2.61 to 3.36 per share to the group's current NTA of RM4.51 per share.
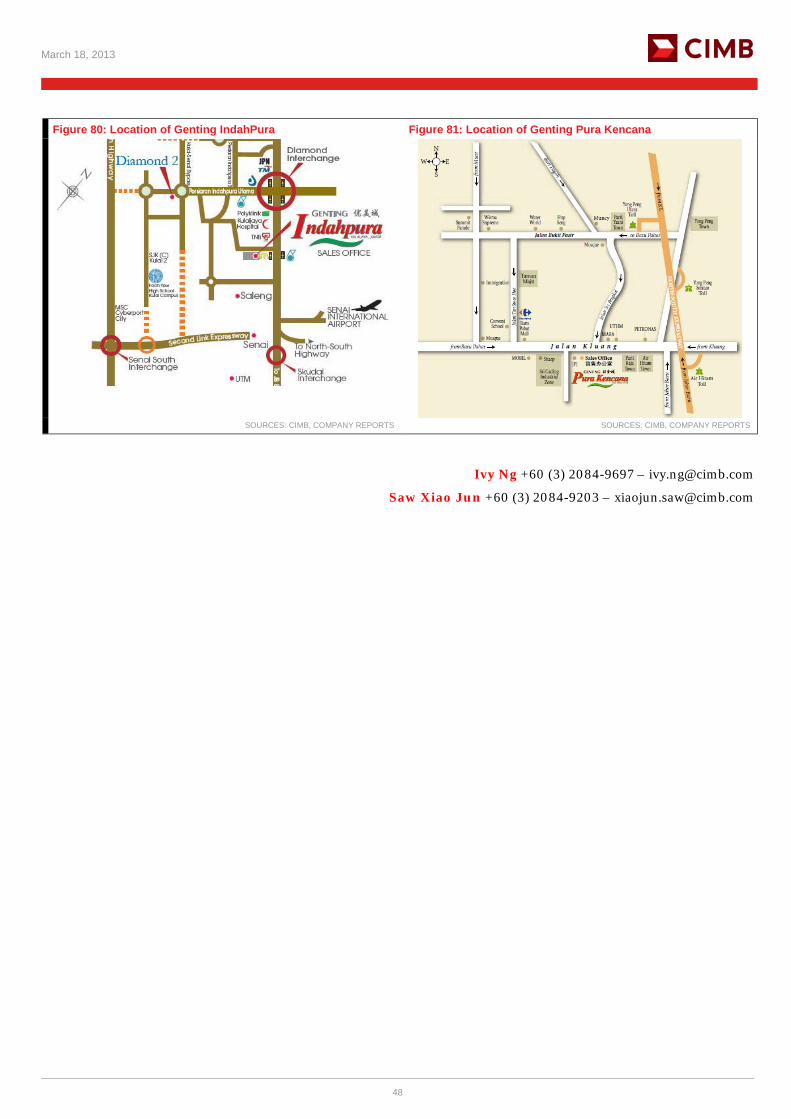
March 18, 2013
48
Figure 80: Location of Genting IndahPura Figure 81: Location of Genting Pura Kencana
SOURCES: CIMB, COMPANY REPORTS SOURCES: CIMB, COMPANY REPORTS
Ivy Ng +60 (3) 2084-9697 – [email protected]
Saw Xiao Jun +60 (3) 2084-9203 – [email protected]
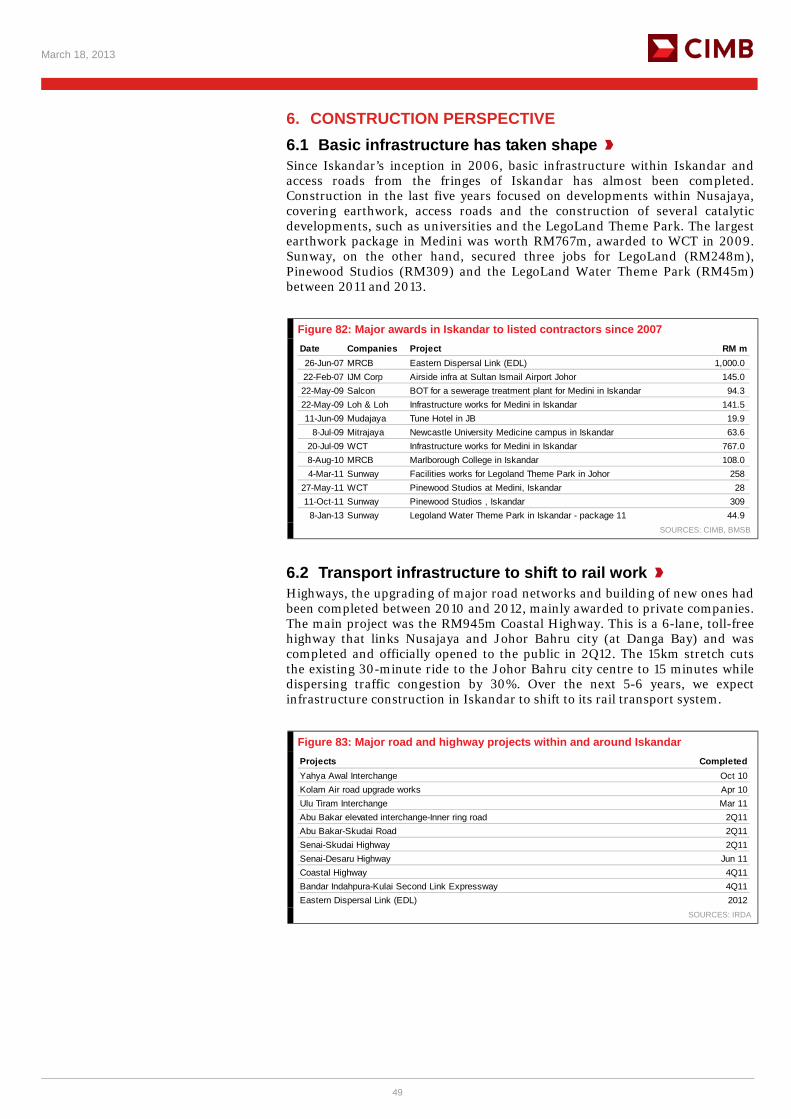
March 18, 2013
49
6. CONSTRUCTION PERSPECTIVE 6.1 Basic infrastructure has taken shape Since Iskandar’s inception in 2006, basic infrastructure within Iskandar and access roads from the fringes of Iskandar has almost been completed. Construction in the last five years focused on developments within Nusajaya, covering earthwork, access roads and the construction of several catalytic developments, such as universities and the LegoLand Theme Park. The largest earthwork package in Medini was worth RM767m, awarded to WCT in 2009. Sunway, on the other hand, secured three jobs for LegoLand (RM248m), Pinewood Studios (RM309) and the LegoLand Water Theme Park (RM45m) between 2011 and 2013.
Figure 82: Major awards in Iskandar to listed contractors since 2007 Date Companies Project RM m26-Jun-07 MRCB Eastern Dispersal Link (EDL) 1,000.022-Feb-07 IJM Corp Airside infra at Sultan Ismail Airport Johor 145.022-May-09 Salcon BOT for a sewerage treatment plant for Medini in Iskandar 94.322-May-09 Loh & Loh Infrastructure works for Medini in Iskandar 141.511-Jun-09 Mudajaya Tune Hotel in JB 19.9
8-Jul-09 Mitrajaya Newcastle University Medicine campus in Iskandar 63.620-Jul-09 WCT Infrastructure works for Medini in Iskandar 767.08-Aug-10 MRCB Marlborough College in Iskandar 108.04-Mar-11 Sunway Facilities works for Legoland Theme Park in Johor 258
27-May-11 WCT Pinewood Studios at Medini, Iskandar 2811-Oct-11 Sunway Pinewood Studios , Iskandar 309
8-Jan-13 Sunway Legoland Water Theme Park in Iskandar - package 11 44.9 SOURCES: CIMB, BMSB
6.2 Transport infrastructure to shift to rail work Highways, the upgrading of major road networks and building of new ones had been completed between 2010 and 2012, mainly awarded to private companies. The main project was the RM945m Coastal Highway. This is a 6-lane, toll-free highway that links Nusajaya and Johor Bahru city (at Danga Bay) and was completed and officially opened to the public in 2Q12. The 15km stretch cuts the existing 30-minute ride to the Johor Bahru city centre to 15 minutes while dispersing traffic congestion by 30%. Over the next 5-6 years, we expect infrastructure construction in Iskandar to shift to its rail transport system.
Figure 83: Major road and highway projects within and around Iskandar Projects CompletedYahya Awal Interchange Oct 10Kolam Air road upgrade works Apr 10Ulu Tiram Interchange Mar 11Abu Bakar elevated interchange-Inner ring road 2Q11Abu Bakar-Skudai Road 2Q11Senai-Skudai Highway 2Q11Senai-Desaru Highway Jun 11Coastal Highway 4Q11Bandar Indahpura-Kulai Second Link Expressway 4Q11Eastern Dispersal Link (EDL) 2012
SOURCES: IRDA

March 18, 2013
50
Figure 84: Coastal Highway alignment
SOURCES: INTERNET
6.3 HSR and RTS The proposed KL-Singapore High Speed Rail (HSR) and JB-Singapore Rapit Transit System (RTS) should improve rail connectivity in the peninsula's southern region. This would benefit Iskandar as accessibility to the area from KL and Singapore will be greatly enhanced, a positive for property valuations. However, such plans will only be realised over the longer term as both the HSR and RTS are still in their planning stage, with completion targets of 2018-19, or 5-6 years down the road. Construction will be positive for contractors on a wider scale as tenders are likely to be split into several packages.
6.4 HSR tenders in 2014? Feasibility studies for the HSR have been completed but the project still needs more detailed evaluation before a possible project structure can be firmed up. Although both the Malaysian and Singapore governments have agreed to pursue it, we understand that plans would take at least another 1.5 years to progress to the detailed design and tender stages. The widely reported RM30bn cost estimate is still questionable, pending a decision on the rail’s final alignments, track profile and number of stops. The alignments (320-330km) will be entirely new and are likely to cover the major part of the western corridor of Peninsular Malaysia.
Figure 85: KL-Singapore High Speed Rail (HSR) Project cost : Estimated RM16.5bn by ETP, RM12bn by SPAD Latest cost estimate : RM30bnDistance : 320-330kmTravel time : 1.5-2 hoursAverage speed : 350-450 kmphAuthority : Land Public Transport Commission (SPAD)
: Economic Planning Unit (EPU)Pre-feasibility studies : CompletedDetailed feasibility studies : Commence in 2012, for 6-12 monthsProject owner : Not determinedFunding structure : Likely to be a PFIEarly contenders : 1) UEM Group, 2) Tan Sri Ravindran Menon
: 3) China Infraglobe Consortium-Global Rail: 4) YTL Corp
Initially proposed technology : Magnetic levitation (Maglev)Completion of feasibility studies : 1H13Development period : 1.5 years - design, 3-4 years - constructionViable passengers p.a. for HSR : 8m (according to Edge analysis)Passenger catchment : >2m airline travelers p.a., 2m cars and bus users p.a.
SOURCES: CIMB, PRESS REPORTS
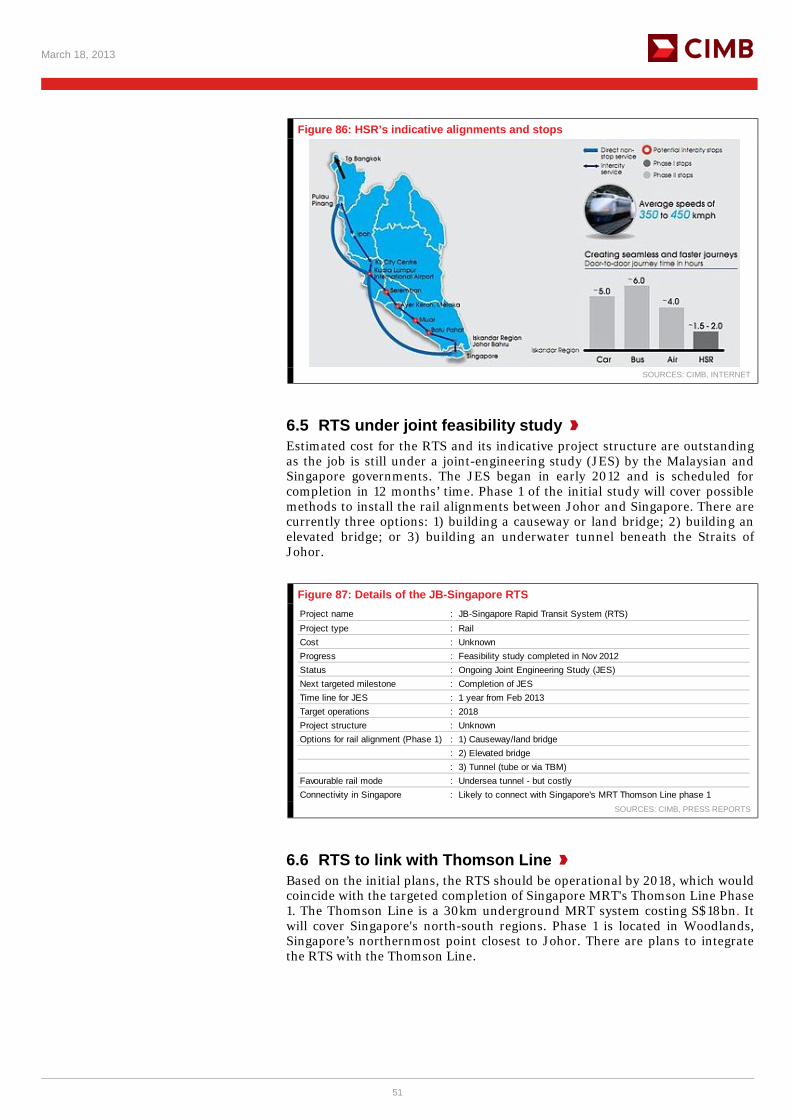
March 18, 2013
51
Figure 86: HSR’s indicative alignments and stops
SOURCES: CIMB, INTERNET
6.5 RTS under joint feasibility study Estimated cost for the RTS and its indicative project structure are outstanding as the job is still under a joint-engineering study (JES) by the Malaysian and Singapore governments. The JES began in early 2012 and is scheduled for completion in 12 months’ time. Phase 1 of the initial study will cover possible methods to install the rail alignments between Johor and Singapore. There are currently three options: 1) building a causeway or land bridge; 2) building an elevated bridge; or 3) building an underwater tunnel beneath the Straits of Johor.
Figure 87: Details of the JB-Singapore RTS Project name : JB-Singapore Rapid Transit System (RTS)Project type : RailCost : UnknownProgress : Feasibility study completed in Nov 2012Status : Ongoing Joint Engineering Study (JES)Next targeted milestone : Completion of JESTime line for JES : 1 year from Feb 2013Target operations : 2018Project structure : UnknownOptions for rail alignment (Phase 1) : 1) Causeway/land bridge
: 2) Elevated bridge : 3) Tunnel (tube or via TBM)
Favourable rail mode : Undersea tunnel - but costlyConnectivity in Singapore : Likely to connect with Singapore's MRT Thomson Line phase 1
SOURCES: CIMB, PRESS REPORTS
6.6 RTS to link with Thomson Line Based on the initial plans, the RTS should be operational by 2018, which would coincide with the targeted completion of Singapore MRT's Thomson Line Phase 1. The Thomson Line is a 30km underground MRT system costing S$18bn. It will cover Singapore's north-south regions. Phase 1 is located in Woodlands, Singapore’s northernmost point closest to Johor. There are plans to integrate the RTS with the Thomson Line.
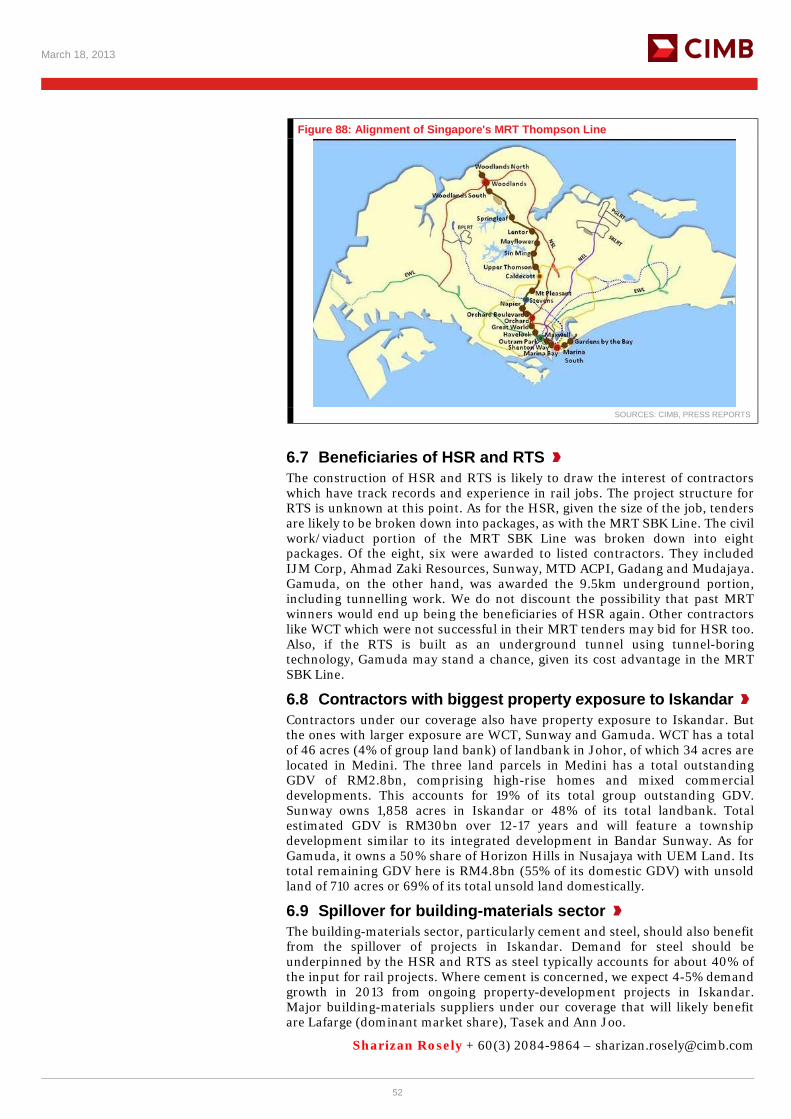
March 18, 2013
52
Figure 88: Alignment of Singapore's MRT Thompson Line
SOURCES: CIMB, PRESS REPORTS
6.7 Beneficiaries of HSR and RTS The construction of HSR and RTS is likely to draw the interest of contractors which have track records and experience in rail jobs. The project structure for RTS is unknown at this point. As for the HSR, given the size of the job, tenders are likely to be broken down into packages, as with the MRT SBK Line. The civil work/viaduct portion of the MRT SBK Line was broken down into eight packages. Of the eight, six were awarded to listed contractors. They included IJM Corp, Ahmad Zaki Resources, Sunway, MTD ACPI, Gadang and Mudajaya. Gamuda, on the other hand, was awarded the 9.5km underground portion, including tunnelling work. We do not discount the possibility that past MRT winners would end up being the beneficiaries of HSR again. Other contractors like WCT which were not successful in their MRT tenders may bid for HSR too. Also, if the RTS is built as an underground tunnel using tunnel-boring technology, Gamuda may stand a chance, given its cost advantage in the MRT SBK Line.
6.8 Contractors with biggest property exposure to Iskandar Contractors under our coverage also have property exposure to Iskandar. But the ones with larger exposure are WCT, Sunway and Gamuda. WCT has a total of 46 acres (4% of group land bank) of landbank in Johor, of which 34 acres are located in Medini. The three land parcels in Medini has a total outstanding GDV of RM2.8bn, comprising high-rise homes and mixed commercial developments. This accounts for 19% of its total group outstanding GDV. Sunway owns 1,858 acres in Iskandar or 48% of its total landbank. Total estimated GDV is RM30bn over 12-17 years and will feature a township development similar to its integrated development in Bandar Sunway. As for Gamuda, it owns a 50% share of Horizon Hills in Nusajaya with UEM Land. Its total remaining GDV here is RM4.8bn (55% of its domestic GDV) with unsold land of 710 acres or 69% of its total unsold land domestically.
6.9 Spillover for building-materials sector The building-materials sector, particularly cement and steel, should also benefit from the spillover of projects in Iskandar. Demand for steel should be underpinned by the HSR and RTS as steel typically accounts for about 40% of the input for rail projects. Where cement is concerned, we expect 4-5% demand growth in 2013 from ongoing property-development projects in Iskandar. Major building-materials suppliers under our coverage that will likely benefit are Lafarge (dominant market share), Tasek and Ann Joo.
Sharizan Rosely + 60(3) 2084-9864 – [email protected]
March 18, 2013
53
7. OIL & GAS PERSPECTIVE 7.1 Dialog's Pengerang The Pengerang development was first unveiled in Jun 2009 when we attended the signing ceremony for an MOU between Dialog and the Johor state government to set up an independent deepwater petroleum terminal in the seaside town of Pengerang in Johor. The partnership was given a boost in Oct 2010 when the Johor government awarded Dialog exclusive rights to develop the terminal for 60 years. In Apr 2012, we attended the groundbreaking ceremony of the terminal and toured the project site.
The terminal is positioned to become a regional petroleum hub by virtue of its strategic location on the southern tip of Johor, next to a busy international shipping lane and close to the petroleum trading centre in Singapore. The terminal will also include jetty and other marine facilities with water depth of up to 26m, capable of handling very large crude carriers and making the terminal the first deepwater terminal in Southeast Asia. These facilities are expected to put Pengerang on the map as Asia’s Rotterdam, Europe’s biggest port city.
The project was initiated by Dialog's executive chairman and MD Dr. Ngau Boon Keat, who believes that unless Malaysia takes the step to promote and attract investors to invest in oil terminals, it will face greater competition from neighbouring countries. Dr. Ngau is part of the 7-member Petronas pioneer team that came up with the national oil company's first production sharing contract in the 1970s.
Johor is a prime area given its size and access to sheltered ports in the southern part of the state where Pengerang, Tanjung Pelepas, Tanjung Bin and Tanjung Langsat are located. Dr. Ngau has been quoted as saying that south Johor could have a total terminal capacity of 10m cu m within the next seven years and can grow to become a large petroleum, petrochemical and liquefied natural gas trading hub. Furthermore, Johor’s proximity to Singapore, where land is scarce and expensive, could lure customers from across the causeway. Singapore is the world’s third largest oil trading hub, beaten only by London and New York. Its physical oil trade amounted to US$375bn in 2007. Dubai, which is benefiting from the surge in oil refining in India and the Middle East, is also looking to rival Singapore as a trading hub. In Sep 2010, Reuters wrote that in 10 years’ time, Dubai will have the capacity to outperform Singapore, which lacks storage capacity.
What started out as a private initiative is now an entry point project (EPP) under the government’s purview. EPP is defined as an iconic project that can generate results with strong multiplier effects. EPPs come under the government’s National Key Economic Areas and are part of the government’s Economic Transformation Programme (ETP). Dr. Ngau believes that the Pengerang terminal will spur tremendous opportunities and may eventually attract combined investments worth RM95bn. Tax revenue from the project and spin-offs from related industries could enable the government to collect RM12bn over the life of the project.
Core players for the terminal include the Johor government, Dialog and a Dutch company, Vopak. Dialog will be both the contractor and operator, a dual role to which the company is no stranger. Dialog built and currently operates the terminals in Kertih and Tanjung Langsat. Vopak, which is also Dialog’s partner at the Kertih terminal, will be among the main clients for the Pengerang terminal. Vopak brings with it a whole new set of opportunities. Its presence could attract more lucrative investments to the area as well as add credibility to, and expedite the growth of, the development. Vopak is the world’s largest independent tank terminal operator, specialising in the storage and handling of liquid and gaseous chemicals as well as oil products.
The Pengerang terminal is Dialog’s third and complements its investments in Kertih and Tanjung Langsat. Of the three terminals, Pengerang will be the biggest with a storage capacity of 5m cu m, significantly higher than Kertih’s 400,000 cu m and Tanjung Langsat’s 650,000 cu m. Pengerang’s Phase 1 will

March 18, 2013
54
begin operations in 2014, followed by Phase 2 in 2016 and Phase 3 in 2018. The terminal is expected to take 10 years to be fully developed. Pengerang’s contribution to Dialog is expected to be 10 times bigger than Kertih’s when the former’s Phase 3 starts its operations in 2018. Spanning 60 years, Pengerang is Dialog’s longest concession ever.
Figure 89: Comparison of Dialog's terminals Tank terminal Storage Land size Dialog's Partners Concession
capacity (m³) (acre) stake period Kertih 400,000 40 30% Petronas (40%), Vopak (30%) 20 years effective 1996Tanjung Langsat 650,000 50 44% MISC (36%), Trafigura (20%) 30 years effective 2009Pengerang 5,000,000 500 46% Vopak (44%), Johor state government (10%) 60 years effective 2010
SOURCES: COMPANY REPORTS
The 7-year engineering, procurement, construction and commissioning (EPCC) package for the Pengerang terminal is worth RM5bn and covers all three phases. The work is being done in-house by Dialog’s EPCC team and 90%-owned Fitzroy Engineering at facilities that include a 35-acre yard adjacent to the project site. Given the on-site yard, Dialog is hopeful of securing a portion of EPCC works for Petronas’s US$20bn refinery and petrochemical integrated development (Rapid) project, which is next door and will sprawl over a massive 2,000 hectares (see the next section on Rapid).
Land reclamation works for Phase 1, which spans 170 acres with a length of 2km, were completed around Apr 2012, paving the way for the start of construction of tanks and jetties. Land reclamation works have started at the 200-acre Phase 2 for completion in 1H13.
Figure 90: Plan of Phase 1
SOURCES: CIMB
7.2 Petronas's Rapid Introduced in May 2011 and launched a year later, the Rapid project is being developed by Petronas at a cost of US$20bn. A feasibility study, along with a site topographical survey and soil investigation works, was completed in Oct 2011. A front-end engineering design (FEED) study and an environmental impact assessment are being conducted by France-based Technip. Following the completion of the FEED study, a final investment decision is expected to be reached by mid-2013.
The project is expected to create thousands of new jobs and attract a host of ancillary and supporting service providers upon completion. It is targeted to meet the burgeoning demand for energy and petrochemical products, especially
March 18, 2013
55
in Asia, over the next 20 years while enhancing both Malaysia's and the region's petrochemical industry. Covering an area of 2,000 hectares, the Rapid complex will have a refining capacity of 300,000 barrels per day (bpd) and will be much larger than Petronas's existing petrochemical complexes in Melaka, Kertih and Gebeng combined. The complex will also produce gasoline and diesel that will meet Euro 4 and Euro 5 fuel specifications and include a naphtha cracker as well as other infrastructure, such as pipelines, storage tanks and warehousing facilities. The ongoing FEED study will provide the configurations of various units of the complex and the investment required for each unit.
In May 2012, Petronas COO Datuk Wan Zulkiflee Wan Ariffin was quoted as saying that the project will potentially require 10 to 12 partners. He had also said that Petronas prefers to finalise the choice of its partners before it declares its final investment decision. The project has so far secured the partnership of three corporations.
An agreement was signed with Japan's Itochu Corp and Thailand's PTT Global Chemical in May 2012. The two companies will partner Petronas to develop a few downstream units of the complex.
Earlier, in Mar 2012, Petronas and BASF signed an agreement to form a joint specialty chemical venture within the Rapid project. However, the agreement was terminated on 21 Jan 2013 by mutual agreement. Notwithstanding this decision, both Petronas and BASF are committed to maintaining their existing partnership, BASF Petronas Chemicals, at Gebeng Industrial Zone in Kuantan, Pahang. Two days after the BASF pullout, Petronas signed an agreement with another German company, Evonik Industries AG, to jointly develop specialty chemical production facilities at the Rapid complex.
Norziana Mohd Inon +60 (3) 2084-9645 – [email protected]
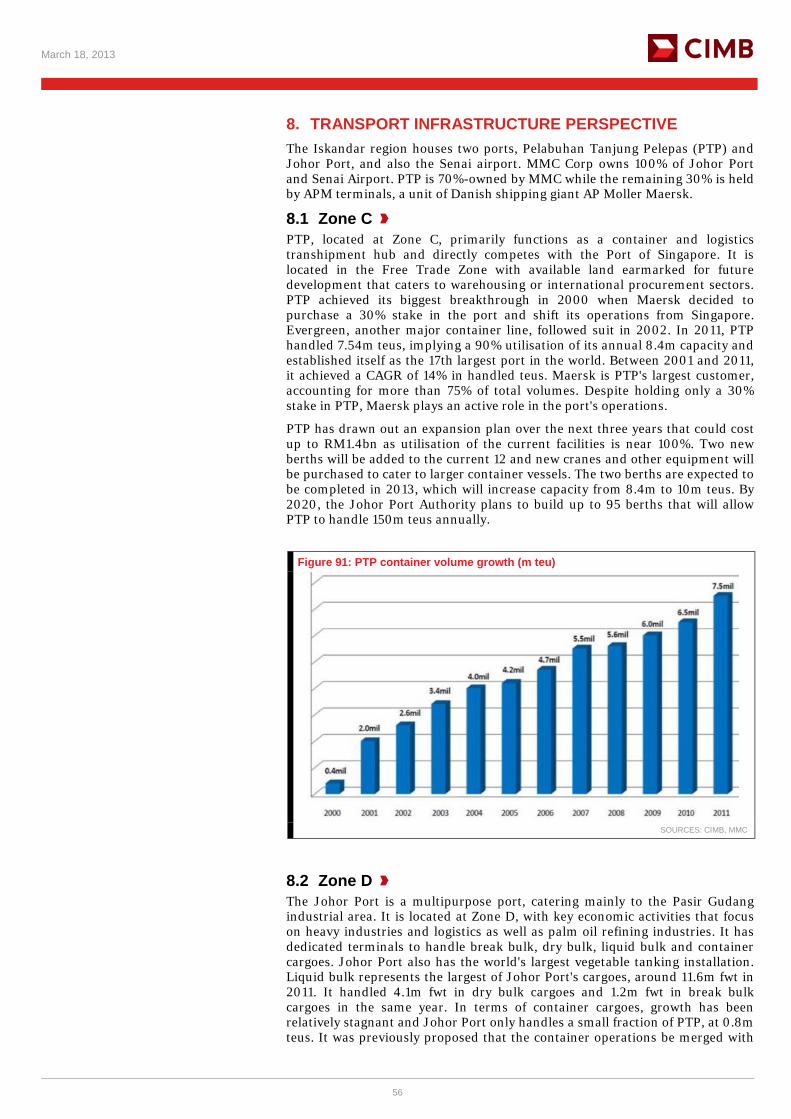
March 18, 2013
56
8. TRANSPORT INFRASTRUCTURE PERSPECTIVE The Iskandar region houses two ports, Pelabuhan Tanjung Pelepas (PTP) and Johor Port, and also the Senai airport. MMC Corp owns 100% of Johor Port and Senai Airport. PTP is 70%-owned by MMC while the remaining 30% is held by APM terminals, a unit of Danish shipping giant AP Moller Maersk.
8.1 Zone C PTP, located at Zone C, primarily functions as a container and logistics transhipment hub and directly competes with the Port of Singapore. It is located in the Free Trade Zone with available land earmarked for future development that caters to warehousing or international procurement sectors. PTP achieved its biggest breakthrough in 2000 when Maersk decided to purchase a 30% stake in the port and shift its operations from Singapore. Evergreen, another major container line, followed suit in 2002. In 2011, PTP handled 7.54m teus, implying a 90% utilisation of its annual 8.4m capacity and established itself as the 17th largest port in the world. Between 2001 and 2011, it achieved a CAGR of 14% in handled teus. Maersk is PTP's largest customer, accounting for more than 75% of total volumes. Despite holding only a 30% stake in PTP, Maersk plays an active role in the port's operations.
PTP has drawn out an expansion plan over the next three years that could cost up to RM1.4bn as utilisation of the current facilities is near 100%. Two new berths will be added to the current 12 and new cranes and other equipment will be purchased to cater to larger container vessels. The two berths are expected to be completed in 2013, which will increase capacity from 8.4m to 10m teus. By 2020, the Johor Port Authority plans to build up to 95 berths that will allow PTP to handle 150m teus annually.
Figure 91: PTP container volume growth (m teu)
SOURCES: CIMB, MMC
8.2 Zone D The Johor Port is a multipurpose port, catering mainly to the Pasir Gudang industrial area. It is located at Zone D, with key economic activities that focus on heavy industries and logistics as well as palm oil refining industries. It has dedicated terminals to handle break bulk, dry bulk, liquid bulk and container cargoes. Johor Port also has the world's largest vegetable tanking installation. Liquid bulk represents the largest of Johor Port's cargoes, around 11.6m fwt in 2011. It handled 4.1m fwt in dry bulk cargoes and 1.2m fwt in break bulk cargoes in the same year. In terms of container cargoes, growth has been relatively stagnant and Johor Port only handles a small fraction of PTP, at 0.8m teus. It was previously proposed that the container operations be merged with
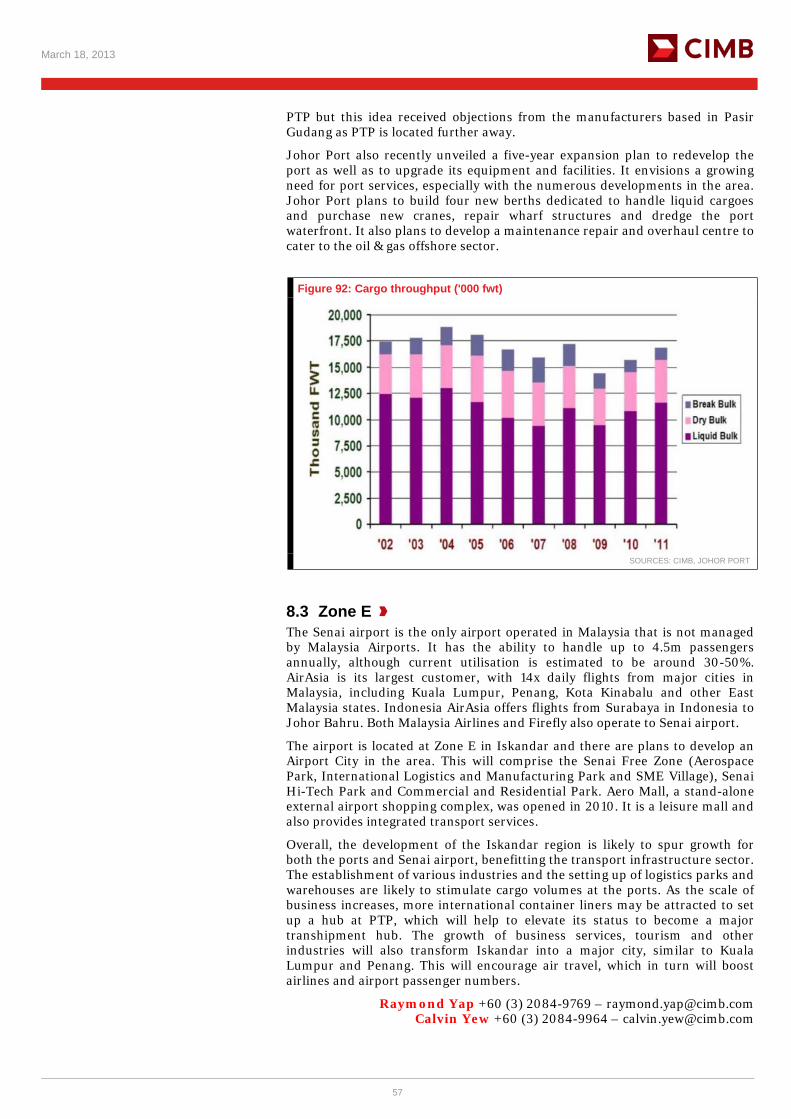
March 18, 2013
57
PTP but this idea received objections from the manufacturers based in Pasir Gudang as PTP is located further away.
Johor Port also recently unveiled a five-year expansion plan to redevelop the port as well as to upgrade its equipment and facilities. It envisions a growing need for port services, especially with the numerous developments in the area. Johor Port plans to build four new berths dedicated to handle liquid cargoes and purchase new cranes, repair wharf structures and dredge the port waterfront. It also plans to develop a maintenance repair and overhaul centre to cater to the oil & gas offshore sector.
Figure 92: Cargo throughput ('000 fwt)
SOURCES: CIMB, JOHOR PORT
8.3 Zone E The Senai airport is the only airport operated in Malaysia that is not managed by Malaysia Airports. It has the ability to handle up to 4.5m passengers annually, although current utilisation is estimated to be around 30-50%. AirAsia is its largest customer, with 14x daily flights from major cities in Malaysia, including Kuala Lumpur, Penang, Kota Kinabalu and other East Malaysia states. Indonesia AirAsia offers flights from Surabaya in Indonesia to Johor Bahru. Both Malaysia Airlines and Firefly also operate to Senai airport.
The airport is located at Zone E in Iskandar and there are plans to develop an Airport City in the area. This will comprise the Senai Free Zone (Aerospace Park, International Logistics and Manufacturing Park and SME Village), Senai Hi-Tech Park and Commercial and Residential Park. Aero Mall, a stand-alone external airport shopping complex, was opened in 2010. It is a leisure mall and also provides integrated transport services.
Overall, the development of the Iskandar region is likely to spur growth for both the ports and Senai airport, benefitting the transport infrastructure sector. The establishment of various industries and the setting up of logistics parks and warehouses are likely to stimulate cargo volumes at the ports. As the scale of business increases, more international container liners may be attracted to set up a hub at PTP, which will help to elevate its status to become a major transhipment hub. The growth of business services, tourism and other industries will also transform Iskandar into a major city, similar to Kuala Lumpur and Penang. This will encourage air travel, which in turn will boost airlines and airport passenger numbers.
Raymond Yap +60 (3) 2084-9769 – [email protected] Calvin Yew +60 (3) 2084-9964 – [email protected]
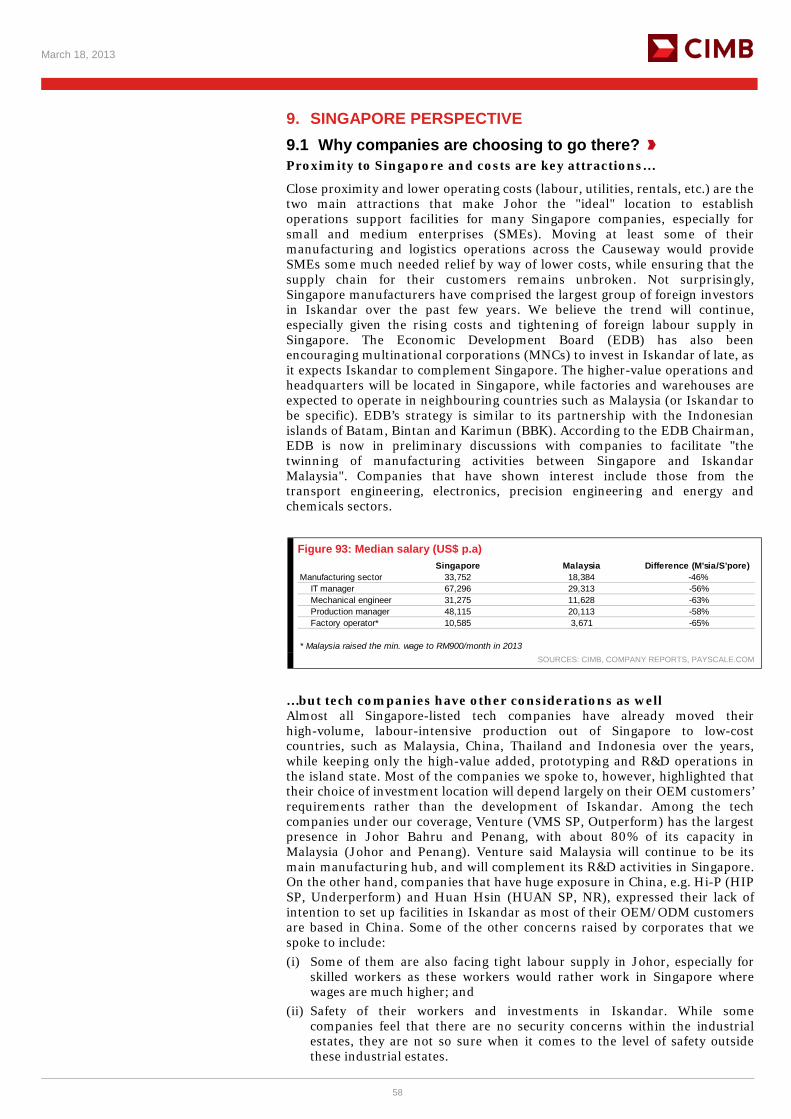
March 18, 2013
58
9. SINGAPORE PERSPECTIVE 9.1 Why companies are choosing to go there? Proximity to Singapore and costs are key attractions…
Close proximity and lower operating costs (labour, utilities, rentals, etc.) are the two main attractions that make Johor the "ideal" location to establish operations support facilities for many Singapore companies, especially for small and medium enterprises (SMEs). Moving at least some of their manufacturing and logistics operations across the Causeway would provide SMEs some much needed relief by way of lower costs, while ensuring that the supply chain for their customers remains unbroken. Not surprisingly, Singapore manufacturers have comprised the largest group of foreign investors in Iskandar over the past few years. We believe the trend will continue, especially given the rising costs and tightening of foreign labour supply in Singapore. The Economic Development Board (EDB) has also been encouraging multinational corporations (MNCs) to invest in Iskandar of late, as it expects Iskandar to complement Singapore. The higher-value operations and headquarters will be located in Singapore, while factories and warehouses are expected to operate in neighbouring countries such as Malaysia (or Iskandar to be specific). EDB’s strategy is similar to its partnership with the Indonesian islands of Batam, Bintan and Karimun (BBK). According to the EDB Chairman, EDB is now in preliminary discussions with companies to facilitate "the twinning of manufacturing activities between Singapore and Iskandar Malaysia". Companies that have shown interest include those from the transport engineering, electronics, precision engineering and energy and chemicals sectors.
Figure 93: Median salary (US$ p.a) Singapore Malaysia Difference (M'sia/S'pore)
Manufacturing sector 33,752 18,384 -46% IT manager 67,296 29,313 -56% Mechanical engineer 31,275 11,628 -63% Production manager 48,115 20,113 -58% Factory operator* 10,585 3,671 -65%
* Malaysia raised the min. wage to RM900/month in 2013 SOURCES: CIMB, COMPANY REPORTS, PAYSCALE.COM
…but tech companies have other considerations as well Almost all Singapore-listed tech companies have already moved their high-volume, labour-intensive production out of Singapore to low-cost countries, such as Malaysia, China, Thailand and Indonesia over the years, while keeping only the high-value added, prototyping and R&D operations in the island state. Most of the companies we spoke to, however, highlighted that their choice of investment location will depend largely on their OEM customers’ requirements rather than the development of Iskandar. Among the tech companies under our coverage, Venture (VMS SP, Outperform) has the largest presence in Johor Bahru and Penang, with about 80% of its capacity in Malaysia (Johor and Penang). Venture said Malaysia will continue to be its main manufacturing hub, and will complement its R&D activities in Singapore. On the other hand, companies that have huge exposure in China, e.g. Hi-P (HIP SP, Underperform) and Huan Hsin (HUAN SP, NR), expressed their lack of intention to set up facilities in Iskandar as most of their OEM/ODM customers are based in China. Some of the other concerns raised by corporates that we spoke to include: (i) Some of them are also facing tight labour supply in Johor, especially for
skilled workers as these workers would rather work in Singapore where wages are much higher; and
(ii) Safety of their workers and investments in Iskandar. While some companies feel that there are no security concerns within the industrial estates, they are not so sure when it comes to the level of safety outside these industrial estates.
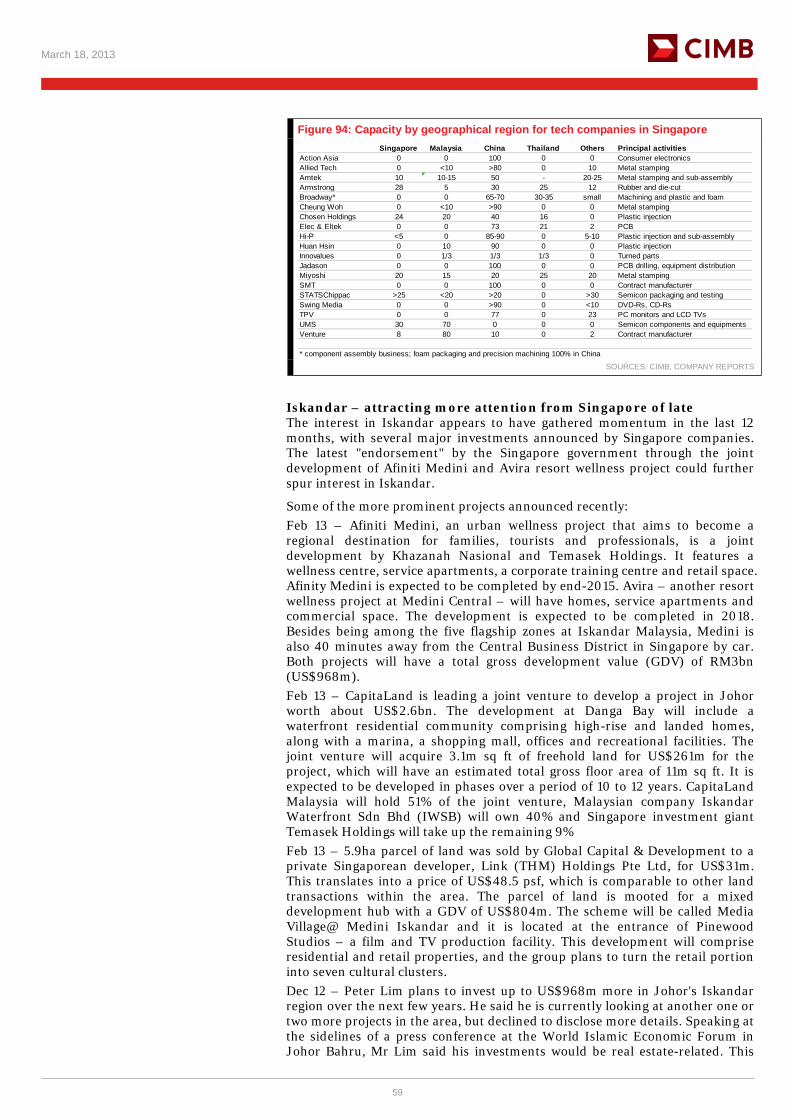
March 18, 2013
59
Figure 94: Capacity by geographical region for tech companies in Singapore Singapore Malaysia China Thailand Others Principal activities
Action Asia 0 0 100 0 0 Consumer electronicsAllied Tech 0 <10 >80 0 10 Metal stampingAmtek 10 10-15 50 - 20-25 Metal stamping and sub-assemblyArmstrong 28 5 30 25 12 Rubber and die-cutBroadway* 0 0 65-70 30-35 small Machining and plastic and foamCheung Woh 0 <10 >90 0 0 Metal stampingChosen Holdings 24 20 40 16 0 Plastic injection Elec & Eltek 0 0 73 21 2 PCBHi-P <5 0 85-90 0 5-10 Plastic injection and sub-assemblyHuan Hsin 0 10 90 0 0 Plastic injection Innovalues 0 1/3 1/3 1/3 0 Turned partsJadason 0 0 100 0 0 PCB drilling, equipment distributionMiyoshi 20 15 20 25 20 Metal stamping SMT 0 0 100 0 0 Contract manufacturerSTATSChippac >25 <20 >20 0 >30 Semicon packaging and testingSwing Media 0 0 >90 0 <10 DVD-Rs, CD-RsTPV 0 0 77 0 23 PC monitors and LCD TVsUMS 30 70 0 0 0 Semicon components and equipmentsVenture 8 80 10 0 2 Contract manufacturer
* component assembly business; foam packaging and precision machining 100% in China SOURCES: CIMB, COMPANY REPORTS
Iskandar – attracting more attention from Singapore of late The interest in Iskandar appears to have gathered momentum in the last 12 months, with several major investments announced by Singapore companies. The latest "endorsement" by the Singapore government through the joint development of Afiniti Medini and Avira resort wellness project could further spur interest in Iskandar.
Some of the more prominent projects announced recently: Feb 13 – Afiniti Medini, an urban wellness project that aims to become a regional destination for families, tourists and professionals, is a joint development by Khazanah Nasional and Temasek Holdings. It features a wellness centre, service apartments, a corporate training centre and retail space. Afinity Medini is expected to be completed by end-2015. Avira – another resort wellness project at Medini Central – will have homes, service apartments and commercial space. The development is expected to be completed in 2018. Besides being among the five flagship zones at Iskandar Malaysia, Medini is also 40 minutes away from the Central Business District in Singapore by car. Both projects will have a total gross development value (GDV) of RM3bn (US$968m). Feb 13 – CapitaLand is leading a joint venture to develop a project in Johor worth about US$2.6bn. The development at Danga Bay will include a waterfront residential community comprising high-rise and landed homes, along with a marina, a shopping mall, offices and recreational facilities. The joint venture will acquire 3.1m sq ft of freehold land for US$261m for the project, which will have an estimated total gross floor area of 11m sq ft. It is expected to be developed in phases over a period of 10 to 12 years. CapitaLand Malaysia will hold 51% of the joint venture, Malaysian company Iskandar Waterfront Sdn Bhd (IWSB) will own 40% and Singapore investment giant Temasek Holdings will take up the remaining 9% Feb 13 – 5.9ha parcel of land was sold by Global Capital & Development to a private Singaporean developer, Link (THM) Holdings Pte Ltd, for US$31m. This translates into a price of US$48.5 psf, which is comparable to other land transactions within the area. The parcel of land is mooted for a mixed development hub with a GDV of US$804m. The scheme will be called Media Village@ Medini Iskandar and it is located at the entrance of Pinewood Studios – a film and TV production facility. This development will comprise residential and retail properties, and the group plans to turn the retail portion into seven cultural clusters. Dec 12 – Peter Lim plans to invest up to US$968m more in Johor's Iskandar region over the next few years. He said he is currently looking at another one or two more projects in the area, but declined to disclose more details. Speaking at the sidelines of a press conference at the World Islamic Economic Forum in Johor Bahru, Mr Lim said his investments would be real estate-related. This
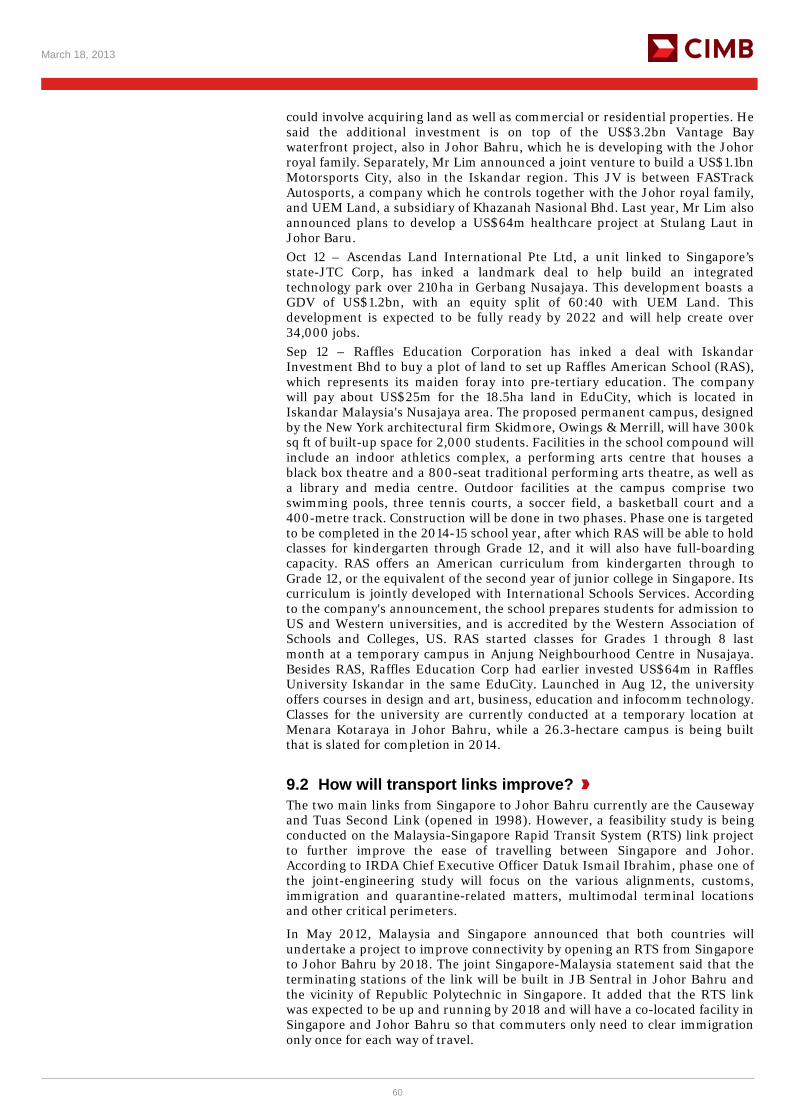
March 18, 2013
60
could involve acquiring land as well as commercial or residential properties. He said the additional investment is on top of the US$3.2bn Vantage Bay waterfront project, also in Johor Bahru, which he is developing with the Johor royal family. Separately, Mr Lim announced a joint venture to build a US$1.1bn Motorsports City, also in the Iskandar region. This JV is between FASTrack Autosports, a company which he controls together with the Johor royal family, and UEM Land, a subsidiary of Khazanah Nasional Bhd. Last year, Mr Lim also announced plans to develop a US$64m healthcare project at Stulang Laut in Johor Baru. Oct 12 – Ascendas Land International Pte Ltd, a unit linked to Singapore’s state-JTC Corp, has inked a landmark deal to help build an integrated technology park over 210ha in Gerbang Nusajaya. This development boasts a GDV of US$1.2bn, with an equity split of 60:40 with UEM Land. This development is expected to be fully ready by 2022 and will help create over 34,000 jobs. Sep 12 – Raffles Education Corporation has inked a deal with Iskandar Investment Bhd to buy a plot of land to set up Raffles American School (RAS), which represents its maiden foray into pre-tertiary education. The company will pay about US$25m for the 18.5ha land in EduCity, which is located in Iskandar Malaysia's Nusajaya area. The proposed permanent campus, designed by the New York architectural firm Skidmore, Owings & Merrill, will have 300k sq ft of built-up space for 2,000 students. Facilities in the school compound will include an indoor athletics complex, a performing arts centre that houses a black box theatre and a 800-seat traditional performing arts theatre, as well as a library and media centre. Outdoor facilities at the campus comprise two swimming pools, three tennis courts, a soccer field, a basketball court and a 400-metre track. Construction will be done in two phases. Phase one is targeted to be completed in the 2014-15 school year, after which RAS will be able to hold classes for kindergarten through Grade 12, and it will also have full-boarding capacity. RAS offers an American curriculum from kindergarten through to Grade 12, or the equivalent of the second year of junior college in Singapore. Its curriculum is jointly developed with International Schools Services. According to the company's announcement, the school prepares students for admission to US and Western universities, and is accredited by the Western Association of Schools and Colleges, US. RAS started classes for Grades 1 through 8 last month at a temporary campus in Anjung Neighbourhood Centre in Nusajaya. Besides RAS, Raffles Education Corp had earlier invested US$64m in Raffles University Iskandar in the same EduCity. Launched in Aug 12, the university offers courses in design and art, business, education and infocomm technology. Classes for the university are currently conducted at a temporary location at Menara Kotaraya in Johor Bahru, while a 26.3-hectare campus is being built that is slated for completion in 2014.
9.2 How will transport links improve? The two main links from Singapore to Johor Bahru currently are the Causeway and Tuas Second Link (opened in 1998). However, a feasibility study is being conducted on the Malaysia-Singapore Rapid Transit System (RTS) link project to further improve the ease of travelling between Singapore and Johor. According to IRDA Chief Executive Officer Datuk Ismail Ibrahim, phase one of the joint-engineering study will focus on the various alignments, customs, immigration and quarantine-related matters, multimodal terminal locations and other critical perimeters.
In May 2012, Malaysia and Singapore announced that both countries will undertake a project to improve connectivity by opening an RTS from Singapore to Johor Bahru by 2018. The joint Singapore-Malaysia statement said that the terminating stations of the link will be built in JB Sentral in Johor Bahru and the vicinity of Republic Polytechnic in Singapore. It added that the RTS link was expected to be up and running by 2018 and will have a co-located facility in Singapore and Johor Bahru so that commuters only need to clear immigration only once for each way of travel.
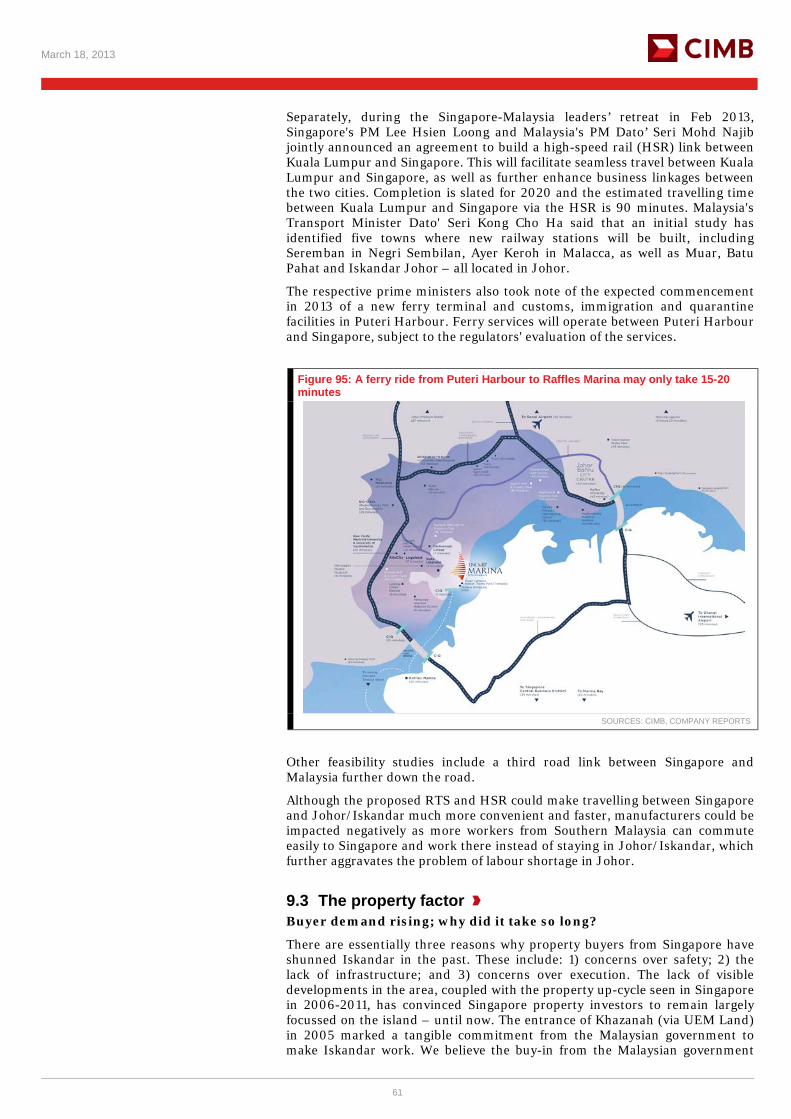
March 18, 2013
61
Separately, during the Singapore-Malaysia leaders’ retreat in Feb 2013, Singapore's PM Lee Hsien Loong and Malaysia's PM Dato’ Seri Mohd Najib jointly announced an agreement to build a high-speed rail (HSR) link between Kuala Lumpur and Singapore. This will facilitate seamless travel between Kuala Lumpur and Singapore, as well as further enhance business linkages between the two cities. Completion is slated for 2020 and the estimated travelling time between Kuala Lumpur and Singapore via the HSR is 90 minutes. Malaysia's Transport Minister Dato' Seri Kong Cho Ha said that an initial study has identified five towns where new railway stations will be built, including Seremban in Negri Sembilan, Ayer Keroh in Malacca, as well as Muar, Batu Pahat and Iskandar Johor – all located in Johor.
The respective prime ministers also took note of the expected commencement in 2013 of a new ferry terminal and customs, immigration and quarantine facilities in Puteri Harbour. Ferry services will operate between Puteri Harbour and Singapore, subject to the regulators' evaluation of the services.
Figure 95: A ferry ride from Puteri Harbour to Raffles Marina may only take 15-20 minutes
SOURCES: CIMB, COMPANY REPORTS
Other feasibility studies include a third road link between Singapore and Malaysia further down the road.
Although the proposed RTS and HSR could make travelling between Singapore and Johor/Iskandar much more convenient and faster, manufacturers could be impacted negatively as more workers from Southern Malaysia can commute easily to Singapore and work there instead of staying in Johor/Iskandar, which further aggravates the problem of labour shortage in Johor.
9.3 The property factor Buyer demand rising; why did it take so long?
There are essentially three reasons why property buyers from Singapore have shunned Iskandar in the past. These include: 1) concerns over safety; 2) the lack of infrastructure; and 3) concerns over execution. The lack of visible developments in the area, coupled with the property up-cycle seen in Singapore in 2006-2011, has convinced Singapore property investors to remain largely focussed on the island – until now. The entrance of Khazanah (via UEM Land) in 2005 marked a tangible commitment from the Malaysian government to make Iskandar work. We believe the buy-in from the Malaysian government
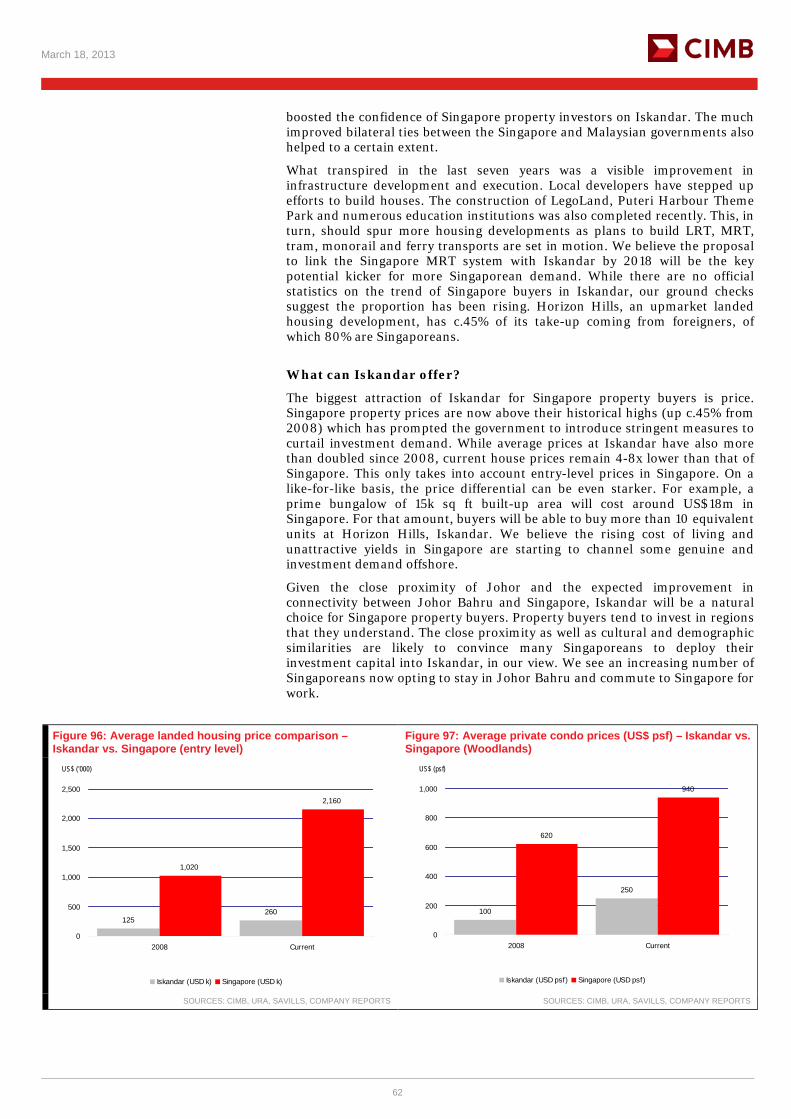
March 18, 2013
62
boosted the confidence of Singapore property investors on Iskandar. The much improved bilateral ties between the Singapore and Malaysian governments also helped to a certain extent.
What transpired in the last seven years was a visible improvement in infrastructure development and execution. Local developers have stepped up efforts to build houses. The construction of LegoLand, Puteri Harbour Theme Park and numerous education institutions was also completed recently. This, in turn, should spur more housing developments as plans to build LRT, MRT, tram, monorail and ferry transports are set in motion. We believe the proposal to link the Singapore MRT system with Iskandar by 2018 will be the key potential kicker for more Singaporean demand. While there are no official statistics on the trend of Singapore buyers in Iskandar, our ground checks suggest the proportion has been rising. Horizon Hills, an upmarket landed housing development, has c.45% of its take-up coming from foreigners, of which 80% are Singaporeans.
What can Iskandar offer?
The biggest attraction of Iskandar for Singapore property buyers is price. Singapore property prices are now above their historical highs (up c.45% from 2008) which has prompted the government to introduce stringent measures to curtail investment demand. While average prices at Iskandar have also more than doubled since 2008, current house prices remain 4-8x lower than that of Singapore. This only takes into account entry-level prices in Singapore. On a like-for-like basis, the price differential can be even starker. For example, a prime bungalow of 15k sq ft built-up area will cost around US$18m in Singapore. For that amount, buyers will be able to buy more than 10 equivalent units at Horizon Hills, Iskandar. We believe the rising cost of living and unattractive yields in Singapore are starting to channel some genuine and investment demand offshore.
Given the close proximity of Johor and the expected improvement in connectivity between Johor Bahru and Singapore, Iskandar will be a natural choice for Singapore property buyers. Property buyers tend to invest in regions that they understand. The close proximity as well as cultural and demographic similarities are likely to convince many Singaporeans to deploy their investment capital into Iskandar, in our view. We see an increasing number of Singaporeans now opting to stay in Johor Bahru and commute to Singapore for work.
Figure 96: Average landed housing price comparison – Iskandar vs. Singapore (entry level)
Figure 97: Average private condo prices (US$ psf) – Iskandar vs. Singapore (Woodlands)
125260
1,020
2,160
0
500
1,000
1,500
2,000
2,500
2008 Current
Iskandar (USD k) Singapore (USD k)
US$ ('000)
100
250
620
940
0
200
400
600
800
1,000
2008 Current
Iskandar (USD psf) Singapore (USD psf)
US$ (psf)
SOURCES: CIMB, URA, SAVILLS, COMPANY REPORTS SOURCES: CIMB, URA, SAVILLS, COMPANY REPORTS
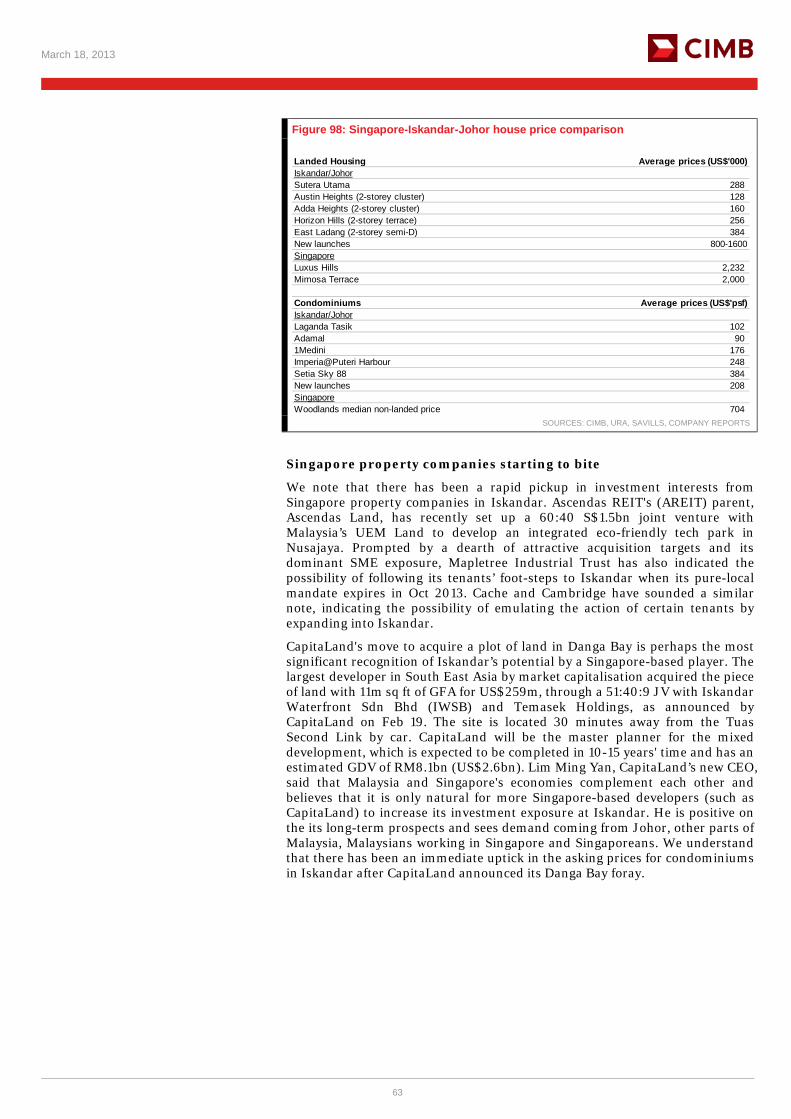
March 18, 2013
63
Figure 98: Singapore-Iskandar-Johor house price comparison
Landed Housing Average prices (US$'000)Iskandar/JohorSutera Utama 288Austin Heights (2-storey cluster) 128Adda Heights (2-storey cluster) 160Horizon Hills (2-storey terrace) 256East Ladang (2-storey semi-D) 384New launches 800-1600SingaporeLuxus Hills 2,232Mimosa Terrace 2,000
Condominiums Average prices (US$'psf)Iskandar/JohorLaganda Tasik 102Adamal 901Medini 176Imperia@Puteri Harbour 248Setia Sky 88 384New launches 208SingaporeWoodlands median non-landed price 704
SOURCES: CIMB, URA, SAVILLS, COMPANY REPORTS
Singapore property companies starting to bite
We note that there has been a rapid pickup in investment interests from Singapore property companies in Iskandar. Ascendas REIT's (AREIT) parent, Ascendas Land, has recently set up a 60:40 S$1.5bn joint venture with Malaysia’s UEM Land to develop an integrated eco-friendly tech park in Nusajaya. Prompted by a dearth of attractive acquisition targets and its dominant SME exposure, Mapletree Industrial Trust has also indicated the possibility of following its tenants’ foot-steps to Iskandar when its pure-local mandate expires in Oct 2013. Cache and Cambridge have sounded a similar note, indicating the possibility of emulating the action of certain tenants by expanding into Iskandar.
CapitaLand's move to acquire a plot of land in Danga Bay is perhaps the most significant recognition of Iskandar’s potential by a Singapore-based player. The largest developer in South East Asia by market capitalisation acquired the piece of land with 11m sq ft of GFA for US$259m, through a 51:40:9 JV with Iskandar Waterfront Sdn Bhd (IWSB) and Temasek Holdings, as announced by CapitaLand on Feb 19. The site is located 30 minutes away from the Tuas Second Link by car. CapitaLand will be the master planner for the mixed development, which is expected to be completed in 10-15 years' time and has an estimated GDV of RM8.1bn (US$2.6bn). Lim Ming Yan, CapitaLand’s new CEO, said that Malaysia and Singapore's economies complement each other and believes that it is only natural for more Singapore-based developers (such as CapitaLand) to increase its investment exposure at Iskandar. He is positive on the its long-term prospects and sees demand coming from Johor, other parts of Malaysia, Malaysians working in Singapore and Singaporeans. We understand that there has been an immediate uptick in the asking prices for condominiums in Iskandar after CapitaLand announced its Danga Bay foray.
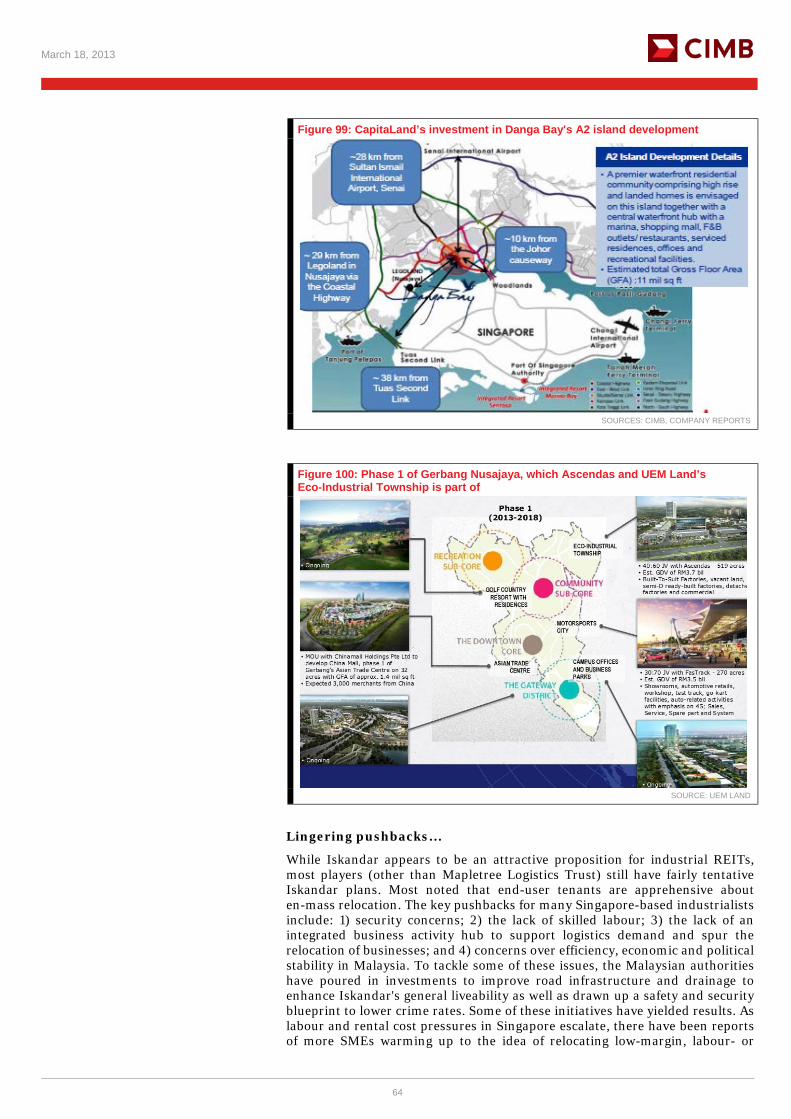
March 18, 2013
64
Figure 99: CapitaLand’s investment in Danga Bay's A2 island development
SOURCES: CIMB, COMPANY REPORTS
Figure 100: Phase 1 of Gerbang Nusajaya, which Ascendas and UEM Land’s Eco-Industrial Township is part of
SOURCE: UEM LAND
Lingering pushbacks…
While Iskandar appears to be an attractive proposition for industrial REITs, most players (other than Mapletree Logistics Trust) still have fairly tentative Iskandar plans. Most noted that end-user tenants are apprehensive about en-mass relocation. The key pushbacks for many Singapore-based industrialists include: 1) security concerns; 2) the lack of skilled labour; 3) the lack of an integrated business activity hub to support logistics demand and spur the relocation of businesses; and 4) concerns over efficiency, economic and political stability in Malaysia. To tackle some of these issues, the Malaysian authorities have poured in investments to improve road infrastructure and drainage to enhance Iskandar's general liveability as well as drawn up a safety and security blueprint to lower crime rates. Some of these initiatives have yielded results. As labour and rental cost pressures in Singapore escalate, there have been reports of more SMEs warming up to the idea of relocating low-margin, labour- or
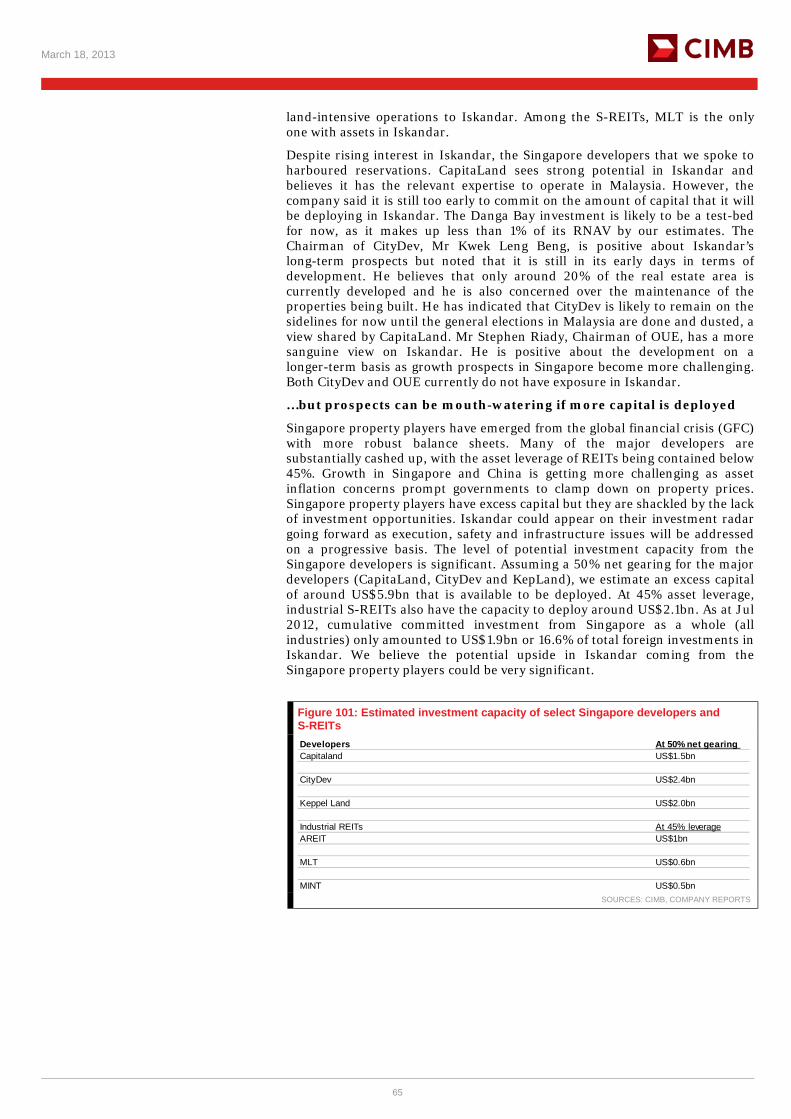
March 18, 2013
65
land-intensive operations to Iskandar. Among the S-REITs, MLT is the only one with assets in Iskandar.
Despite rising interest in Iskandar, the Singapore developers that we spoke to harboured reservations. CapitaLand sees strong potential in Iskandar and believes it has the relevant expertise to operate in Malaysia. However, the company said it is still too early to commit on the amount of capital that it will be deploying in Iskandar. The Danga Bay investment is likely to be a test-bed for now, as it makes up less than 1% of its RNAV by our estimates. The Chairman of CityDev, Mr Kwek Leng Beng, is positive about Iskandar’s long-term prospects but noted that it is still in its early days in terms of development. He believes that only around 20% of the real estate area is currently developed and he is also concerned over the maintenance of the properties being built. He has indicated that CityDev is likely to remain on the sidelines for now until the general elections in Malaysia are done and dusted, a view shared by CapitaLand. Mr Stephen Riady, Chairman of OUE, has a more sanguine view on Iskandar. He is positive about the development on a longer-term basis as growth prospects in Singapore become more challenging. Both CityDev and OUE currently do not have exposure in Iskandar.
…but prospects can be mouth-watering if more capital is deployed
Singapore property players have emerged from the global financial crisis (GFC) with more robust balance sheets. Many of the major developers are substantially cashed up, with the asset leverage of REITs being contained below 45%. Growth in Singapore and China is getting more challenging as asset inflation concerns prompt governments to clamp down on property prices. Singapore property players have excess capital but they are shackled by the lack of investment opportunities. Iskandar could appear on their investment radar going forward as execution, safety and infrastructure issues will be addressed on a progressive basis. The level of potential investment capacity from the Singapore developers is significant. Assuming a 50% net gearing for the major developers (CapitaLand, CityDev and KepLand), we estimate an excess capital of around US$5.9bn that is available to be deployed. At 45% asset leverage, industrial S-REITs also have the capacity to deploy around US$2.1bn. As at Jul 2012, cumulative committed investment from Singapore as a whole (all industries) only amounted to US$1.9bn or 16.6% of total foreign investments in Iskandar. We believe the potential upside in Iskandar coming from the Singapore property players could be very significant.
Figure 101: Estimated investment capacity of select Singapore developers and S-REITs Developers At 50% net gearing Capitaland US$1.5bn
CityDev US$2.4bn
Keppel Land US$2.0bn
Industrial REITs At 45% leverageAREIT US$1bn
MLT US$0.6bn
MINT US$0.5bn SOURCES: CIMB, COMPANY REPORTS
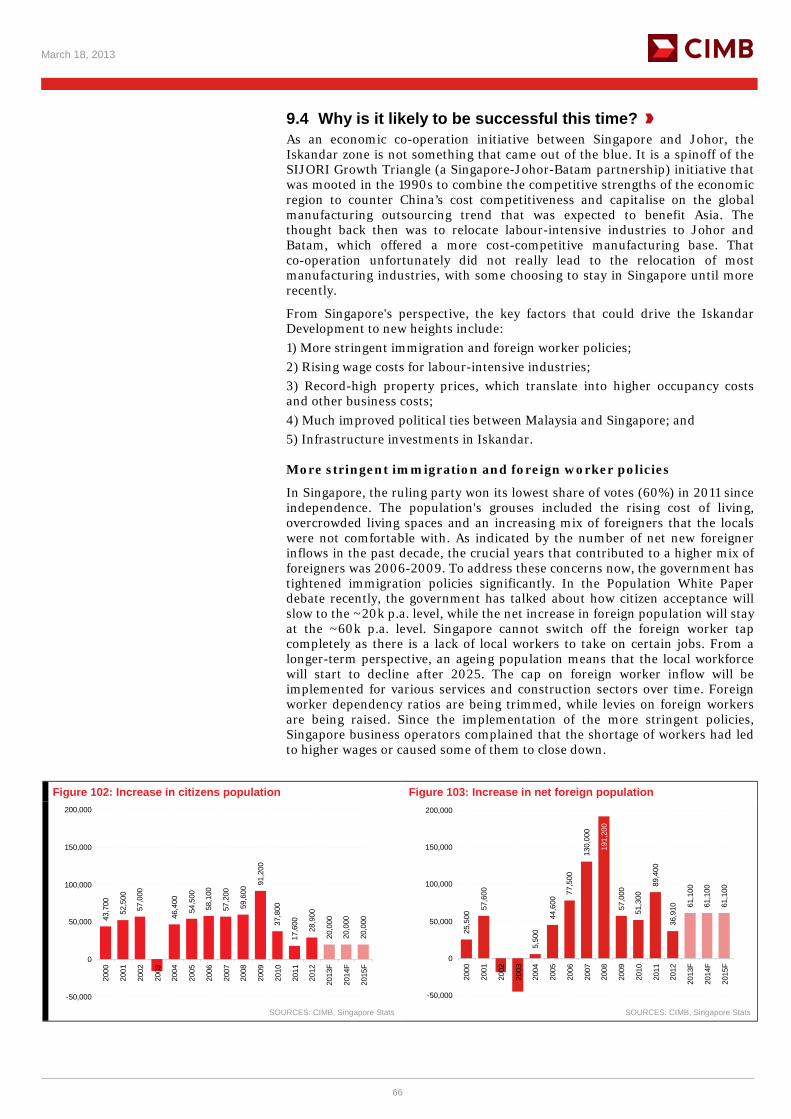
March 18, 2013
66
9.4 Why is it likely to be successful this time? As an economic co-operation initiative between Singapore and Johor, the Iskandar zone is not something that came out of the blue. It is a spinoff of the SIJORI Growth Triangle (a Singapore-Johor-Batam partnership) initiative that was mooted in the 1990s to combine the competitive strengths of the economic region to counter China’s cost competitiveness and capitalise on the global manufacturing outsourcing trend that was expected to benefit Asia. The thought back then was to relocate labour-intensive industries to Johor and Batam, which offered a more cost-competitive manufacturing base. That co-operation unfortunately did not really lead to the relocation of most manufacturing industries, with some choosing to stay in Singapore until more recently.
From Singapore's perspective, the key factors that could drive the Iskandar Development to new heights include: 1) More stringent immigration and foreign worker policies; 2) Rising wage costs for labour-intensive industries; 3) Record-high property prices, which translate into higher occupancy costs and other business costs; 4) Much improved political ties between Malaysia and Singapore; and 5) Infrastructure investments in Iskandar. More stringent immigration and foreign worker policies
In Singapore, the ruling party won its lowest share of votes (60%) in 2011 since independence. The population's grouses included the rising cost of living, overcrowded living spaces and an increasing mix of foreigners that the locals were not comfortable with. As indicated by the number of net new foreigner inflows in the past decade, the crucial years that contributed to a higher mix of foreigners was 2006-2009. To address these concerns now, the government has tightened immigration policies significantly. In the Population White Paper debate recently, the government has talked about how citizen acceptance will slow to the ~20k p.a. level, while the net increase in foreign population will stay at the ~60k p.a. level. Singapore cannot switch off the foreign worker tap completely as there is a lack of local workers to take on certain jobs. From a longer-term perspective, an ageing population means that the local workforce will start to decline after 2025. The cap on foreign worker inflow will be implemented for various services and construction sectors over time. Foreign worker dependency ratios are being trimmed, while levies on foreign workers are being raised. Since the implementation of the more stringent policies, Singapore business operators complained that the shortage of workers had led to higher wages or caused some of them to close down.
Figure 102: Increase in citizens population Figure 103: Increase in net foreign population
43,7
00
52,5
00
57,0
00
46,4
00
54,5
00
58,1
00
57,2
00
59,6
00
91,2
00
37,8
00
17,6
00
28,9
00
20,0
00
20,0
00
20,0
00
-50,000
0
50,000
100,000
150,000
200,000
2000
2001
2002
2003
2004
2005
2006
2007
2008
2009
2010
2011
2012
2013
F
2014
F
2015
F
25,5
00
57,6
00
5,50
0
44,6
00
77,5
00
130,
000
57,0
00
51,3
00
89,4
00
36,9
10 61,1
00
61,1
00
61,1
00
191,
200
-50,000
0
50,000
100,000
150,000
200,000
2000
2001
2002
2003
2004
2005
2006
2007
2008
2009
2010
2011
2012
2013
F
2014
F
2015
F
SOURCES: CIMB, Singapore Stats SOURCES: CIMB, Singapore Stats
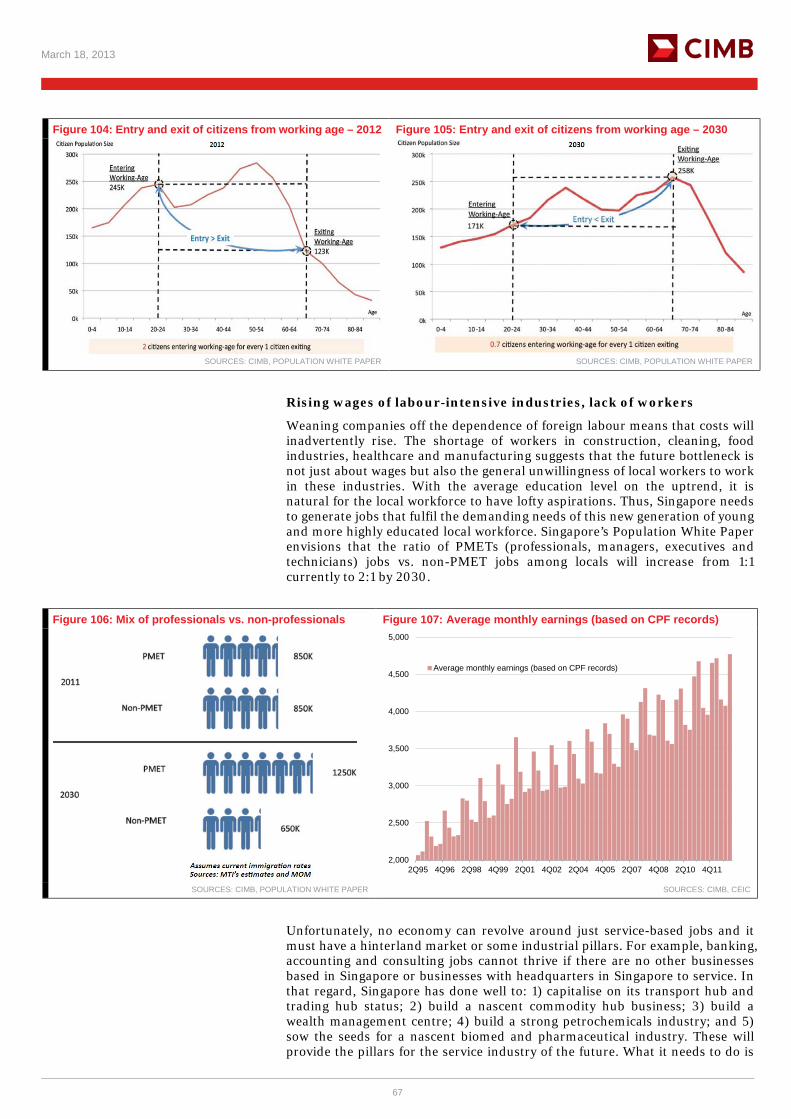
March 18, 2013
67
Figure 104: Entry and exit of citizens from working age – 2012 Figure 105: Entry and exit of citizens from working age – 2030
SOURCES: CIMB, POPULATION WHITE PAPER SOURCES: CIMB, POPULATION WHITE PAPER
Rising wages of labour-intensive industries, lack of workers
Weaning companies off the dependence of foreign labour means that costs will inadvertently rise. The shortage of workers in construction, cleaning, food industries, healthcare and manufacturing suggests that the future bottleneck is not just about wages but also the general unwillingness of local workers to work in these industries. With the average education level on the uptrend, it is natural for the local workforce to have lofty aspirations. Thus, Singapore needs to generate jobs that fulfil the demanding needs of this new generation of young and more highly educated local workforce. Singapore’s Population White Paper envisions that the ratio of PMETs (professionals, managers, executives and technicians) jobs vs. non-PMET jobs among locals will increase from 1:1 currently to 2:1 by 2030.
Figure 106: Mix of professionals vs. non-professionals Figure 107: Average monthly earnings (based on CPF records)
2,000
2,500
3,000
3,500
4,000
4,500
5,000
2Q95 4Q96 2Q98 4Q99 2Q01 4Q02 2Q04 4Q05 2Q07 4Q08 2Q10 4Q11
Average monthly earnings (based on CPF records)
SOURCES: CIMB, POPULATION WHITE PAPER SOURCES: CIMB, CEIC
Unfortunately, no economy can revolve around just service-based jobs and it must have a hinterland market or some industrial pillars. For example, banking, accounting and consulting jobs cannot thrive if there are no other businesses based in Singapore or businesses with headquarters in Singapore to service. In that regard, Singapore has done well to: 1) capitalise on its transport hub and trading hub status; 2) build a nascent commodity hub business; 3) build a wealth management centre; 4) build a strong petrochemicals industry; and 5) sow the seeds for a nascent biomed and pharmaceutical industry. These will provide the pillars for the service industry of the future. What it needs to do is
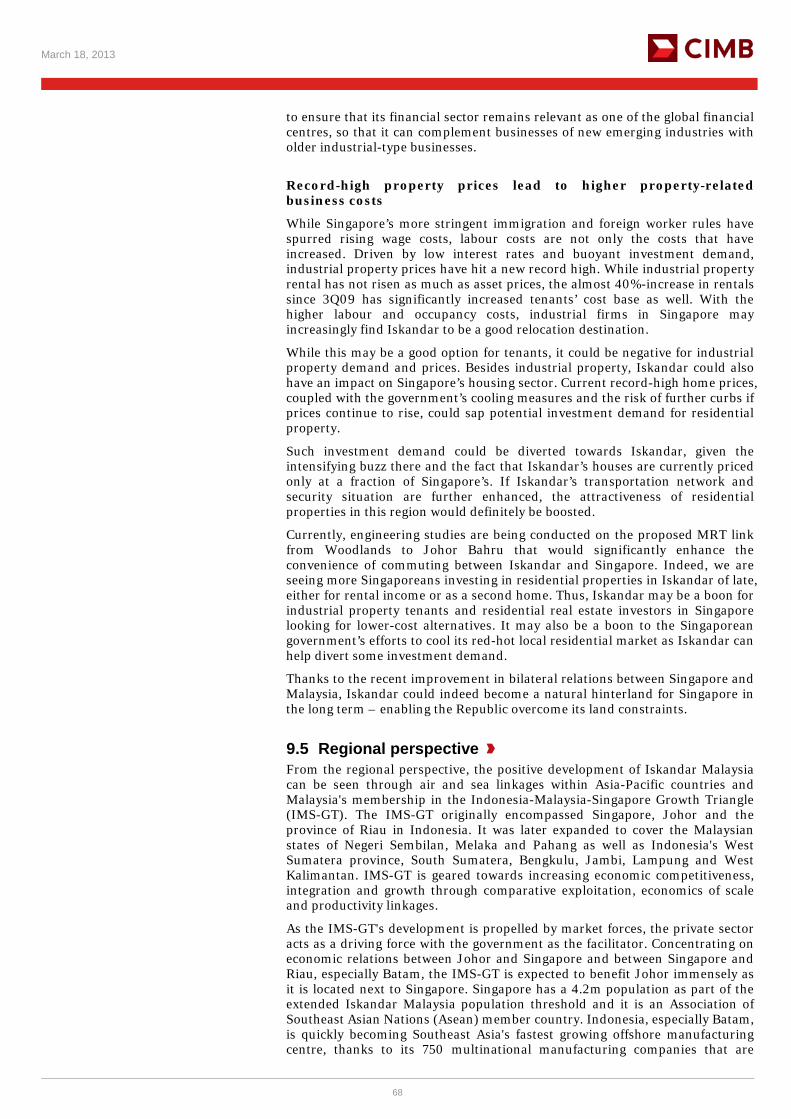
March 18, 2013
68
to ensure that its financial sector remains relevant as one of the global financial centres, so that it can complement businesses of new emerging industries with older industrial-type businesses.
Record-high property prices lead to higher property-related business costs
While Singapore’s more stringent immigration and foreign worker rules have spurred rising wage costs, labour costs are not only the costs that have increased. Driven by low interest rates and buoyant investment demand, industrial property prices have hit a new record high. While industrial property rental has not risen as much as asset prices, the almost 40%-increase in rentals since 3Q09 has significantly increased tenants’ cost base as well. With the higher labour and occupancy costs, industrial firms in Singapore may increasingly find Iskandar to be a good relocation destination.
While this may be a good option for tenants, it could be negative for industrial property demand and prices. Besides industrial property, Iskandar could also have an impact on Singapore’s housing sector. Current record-high home prices, coupled with the government’s cooling measures and the risk of further curbs if prices continue to rise, could sap potential investment demand for residential property.
Such investment demand could be diverted towards Iskandar, given the intensifying buzz there and the fact that Iskandar’s houses are currently priced only at a fraction of Singapore’s. If Iskandar’s transportation network and security situation are further enhanced, the attractiveness of residential properties in this region would definitely be boosted.
Currently, engineering studies are being conducted on the proposed MRT link from Woodlands to Johor Bahru that would significantly enhance the convenience of commuting between Iskandar and Singapore. Indeed, we are seeing more Singaporeans investing in residential properties in Iskandar of late, either for rental income or as a second home. Thus, Iskandar may be a boon for industrial property tenants and residential real estate investors in Singapore looking for lower-cost alternatives. It may also be a boon to the Singaporean government’s efforts to cool its red-hot local residential market as Iskandar can help divert some investment demand.
Thanks to the recent improvement in bilateral relations between Singapore and Malaysia, Iskandar could indeed become a natural hinterland for Singapore in the long term – enabling the Republic overcome its land constraints.
9.5 Regional perspective From the regional perspective, the positive development of Iskandar Malaysia can be seen through air and sea linkages within Asia-Pacific countries and Malaysia's membership in the Indonesia-Malaysia-Singapore Growth Triangle (IMS-GT). The IMS-GT originally encompassed Singapore, Johor and the province of Riau in Indonesia. It was later expanded to cover the Malaysian states of Negeri Sembilan, Melaka and Pahang as well as Indonesia's West Sumatera province, South Sumatera, Bengkulu, Jambi, Lampung and West Kalimantan. IMS-GT is geared towards increasing economic competitiveness, integration and growth through comparative exploitation, economics of scale and productivity linkages.
As the IMS-GT's development is propelled by market forces, the private sector acts as a driving force with the government as the facilitator. Concentrating on economic relations between Johor and Singapore and between Singapore and Riau, especially Batam, the IMS-GT is expected to benefit Johor immensely as it is located next to Singapore. Singapore has a 4.2m population as part of the extended Iskandar Malaysia population threshold and it is an Association of Southeast Asian Nations (Asean) member country. Indonesia, especially Batam, is quickly becoming Southeast Asia's fastest growing offshore manufacturing centre, thanks to its 750 multinational manufacturing companies that are

March 18, 2013
69
located in 20 industrial estates. They employ close to 200,000 Indonesians, on top of more than 3,200 foreign workers that hail from all over the world. With two direct road links to Singapore and sea links to Batam, Iskandar Malaysia is in an excellent position to take advantage of the IMS-GT, which facilitates and promotes international cooperation, human mobility and tourism.
9.6 The gripes Some property consultants have highlighted the apparent lack of land zoning and plot ratio controls in Iskandar. This could mean that certain residential projects may not be able to deliver on the promise of sea views (as opposed to what was originally indicated during the marketing phase).
Kenneth Ng +65 6210-8610 – [email protected] Jonathan Ng +65 6210-8650 – [email protected]
Donald Chua +65 6210-8606 – [email protected] Gary Ng +65 6210-8699 – [email protected]
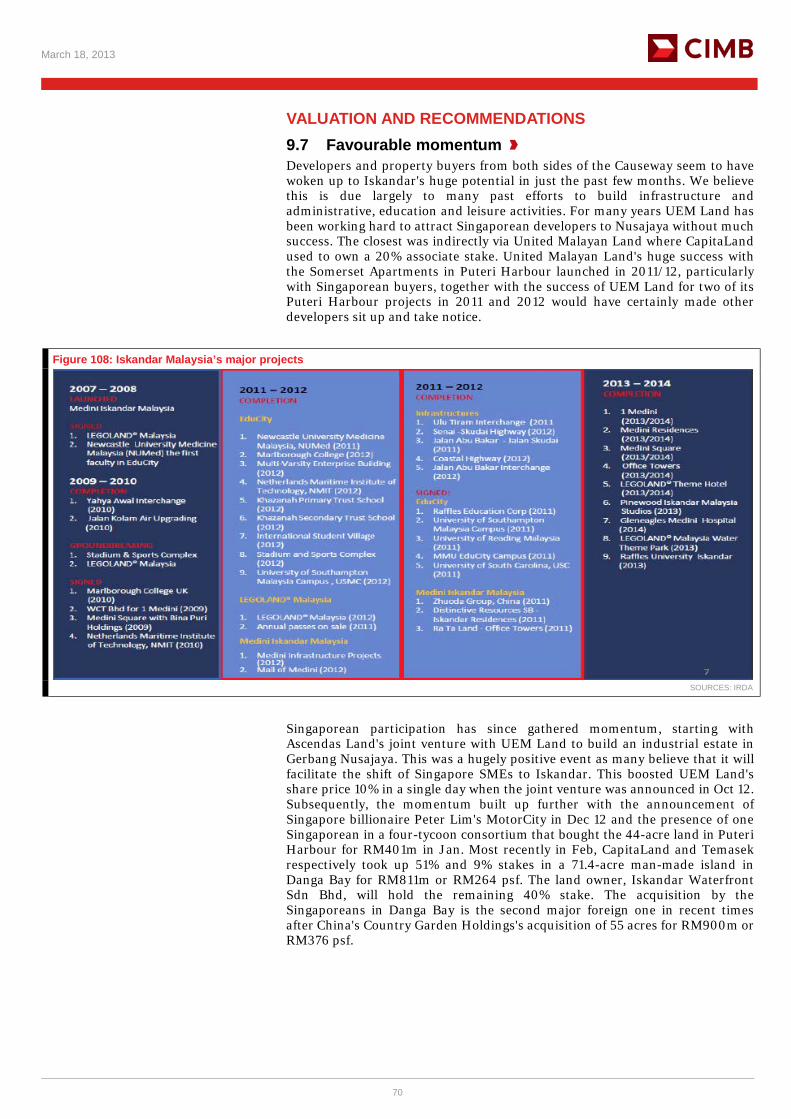
March 18, 2013
70
VALUATION AND RECOMMENDATIONS 9.7 Favourable momentum Developers and property buyers from both sides of the Causeway seem to have woken up to Iskandar's huge potential in just the past few months. We believe this is due largely to many past efforts to build infrastructure and administrative, education and leisure activities. For many years UEM Land has been working hard to attract Singaporean developers to Nusajaya without much success. The closest was indirectly via United Malayan Land where CapitaLand used to own a 20% associate stake. United Malayan Land's huge success with the Somerset Apartments in Puteri Harbour launched in 2011/12, particularly with Singaporean buyers, together with the success of UEM Land for two of its Puteri Harbour projects in 2011 and 2012 would have certainly made other developers sit up and take notice.
Figure 108: Iskandar Malaysia’s major projects
SOURCES: IRDA
Singaporean participation has since gathered momentum, starting with Ascendas Land's joint venture with UEM Land to build an industrial estate in Gerbang Nusajaya. This was a hugely positive event as many believe that it will facilitate the shift of Singapore SMEs to Iskandar. This boosted UEM Land's share price 10% in a single day when the joint venture was announced in Oct 12. Subsequently, the momentum built up further with the announcement of Singapore billionaire Peter Lim's MotorCity in Dec 12 and the presence of one Singaporean in a four-tycoon consortium that bought the 44-acre land in Puteri Harbour for RM401m in Jan. Most recently in Feb, CapitaLand and Temasek respectively took up 51% and 9% stakes in a 71.4-acre man-made island in Danga Bay for RM811m or RM264 psf. The land owner, Iskandar Waterfront Sdn Bhd, will hold the remaining 40% stake. The acquisition by the Singaporeans in Danga Bay is the second major foreign one in recent times after China's Country Garden Holdings's acquisition of 55 acres for RM900m or RM376 psf.
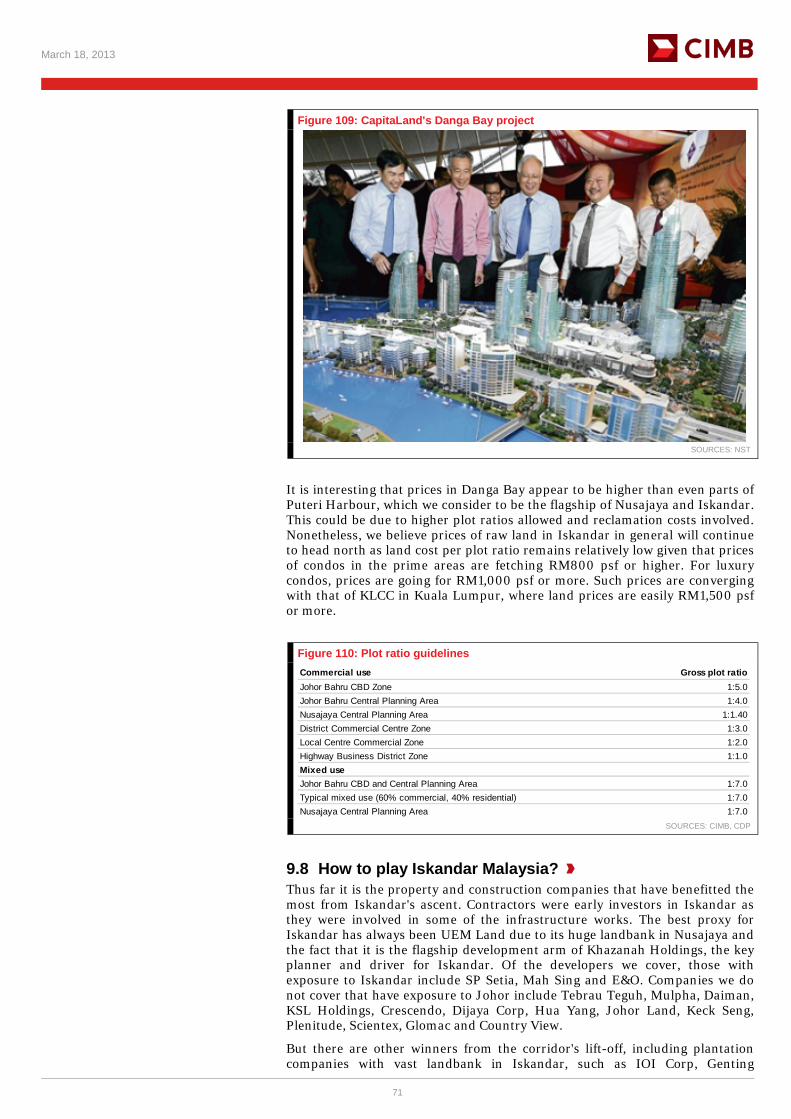
March 18, 2013
71
Figure 109: CapitaLand's Danga Bay project
SOURCES: NST
It is interesting that prices in Danga Bay appear to be higher than even parts of Puteri Harbour, which we consider to be the flagship of Nusajaya and Iskandar. This could be due to higher plot ratios allowed and reclamation costs involved. Nonetheless, we believe prices of raw land in Iskandar in general will continue to head north as land cost per plot ratio remains relatively low given that prices of condos in the prime areas are fetching RM800 psf or higher. For luxury condos, prices are going for RM1,000 psf or more. Such prices are converging with that of KLCC in Kuala Lumpur, where land prices are easily RM1,500 psf or more.
Figure 110: Plot ratio guidelines Commercial use Gross plot ratioJohor Bahru CBD Zone 1:5.0Johor Bahru Central Planning Area 1:4.0Nusajaya Central Planning Area 1:1.40District Commercial Centre Zone 1:3.0Local Centre Commercial Zone 1:2.0Highway Business District Zone 1:1.0Mixed useJohor Bahru CBD and Central Planning Area 1:7.0Typical mixed use (60% commercial, 40% residential) 1:7.0Nusajaya Central Planning Area 1:7.0
SOURCES: CIMB, CDP
9.8 How to play Iskandar Malaysia? Thus far it is the property and construction companies that have benefitted the most from Iskandar's ascent. Contractors were early investors in Iskandar as they were involved in some of the infrastructure works. The best proxy for Iskandar has always been UEM Land due to its huge landbank in Nusajaya and the fact that it is the flagship development arm of Khazanah Holdings, the key planner and driver for Iskandar. Of the developers we cover, those with exposure to Iskandar include SP Setia, Mah Sing and E&O. Companies we do not cover that have exposure to Johor include Tebrau Teguh, Mulpha, Daiman, KSL Holdings, Crescendo, Dijaya Corp, Hua Yang, Johor Land, Keck Seng, Plenitude, Scientex, Glomac and Country View.
But there are other winners from the corridor's lift-off, including plantation companies with vast landbank in Iskandar, such as IOI Corp, Genting
March 18, 2013
72
Plantations and Kulim. Plantation companies with landbank in other parts of Johor that will benefit from spillover development, include Sime Darby, KL Kepong, Tradewinds Plantations, TH Plantations, Kim Loong, United Malacca and Kluang Rubber.
Oil & gas companies, given two massive projects in Pengerang, as well as Singapore companies that are making a beeline to Johor and Iskandar Malaysia, including Ascendas and CapitaLand, also provide investors exposure to the development corridor. However, as Ascendas Land is not listed while Wee Ee Chao's exposure is via his private vehicle, the only direct exposure to Iskandar via a SGX-listed company is CapitaLand. Singapore contractors that could participate in rail infrastructure relating to Iskandar include Tat Hong and Yongnam. Peter Lim is also in the midst of injecting his property investment in Iskandar (through Vantage Bay Sdn Bhd) in SGX-listed Rowsley (please refer to appendix for details).
Our top three preferred Iskandar plays are UEM Land, WCT and CapitaLand.
UEM Land - UEM Land remains the best proxy for Iskandar due to the group's massive landbank in Nusajaya and the numerous catalyst projects that are taking place there including Kota Iskandar, Puteri Harbour, Medini, EduCity, Pinewood Studio, LegoLand, Puteri Harbour Theme Park, Afiat Healthpark. Also, UEM Land is the flagship property arm of Khazanah – the planner and driver of Iskandar. UEM Land locked in RM2.46bn new sales in 2012, representing a 12% yoy increase. 73% of the new sales in 2012 came from Nusajaya projects and only 27% came from non-Nusajaya projects. For 2013, the group is targeting RM2bn new sales from Nusajaya and RM1bn from non-Nusajaya.
WCT - WCT's strategy in 2013 for its property ventures is to expedite its property launches in Iskandar. The group has a total of 46 acres (4% of group landbank) of landbank in Johor, of which 34 acres are located in Medini. The three land parcels in Medini have a total outstanding GDV of RM2.8bn and comprise of high-rise homes and mixed commercial developments. This accounts for 19% of its total group outstanding GDV. Out of the group's targeted RM700m property sales this year, 43% or RM300m is expected to come from Medini Signature (high-rise homes), which have indicative pricing of over RM600 psf. The balance 57% would be made up of new launches for its projects in Klang Valley.
CapitaLand - CapLand is Southeast Asia's largest property developer by market capitalisation and one of the most diversified across segments and regions. Offshore developments account for over 50% of its asset base and earnings. While China continues to form the largest overseas market, the group has recently invested in a mixed development greenfield project at Danga Bay, Iskandar, with an expected GDV of RM8.1bn. This project will take 10-15 years to complete and currently forms only 1% of CapLand's RNAV. But management is positive about Iskandar's long-term prospects and believes it can be competitive given its scale and Singaporean roots. We believe more capital will be progressively deployed into Iskandar. CapLand is currently the largest direct play on Iskandar among the Singapore listed companies.
The following is a list of companies, many of which we do not cover, that have exposure to Iskandar.
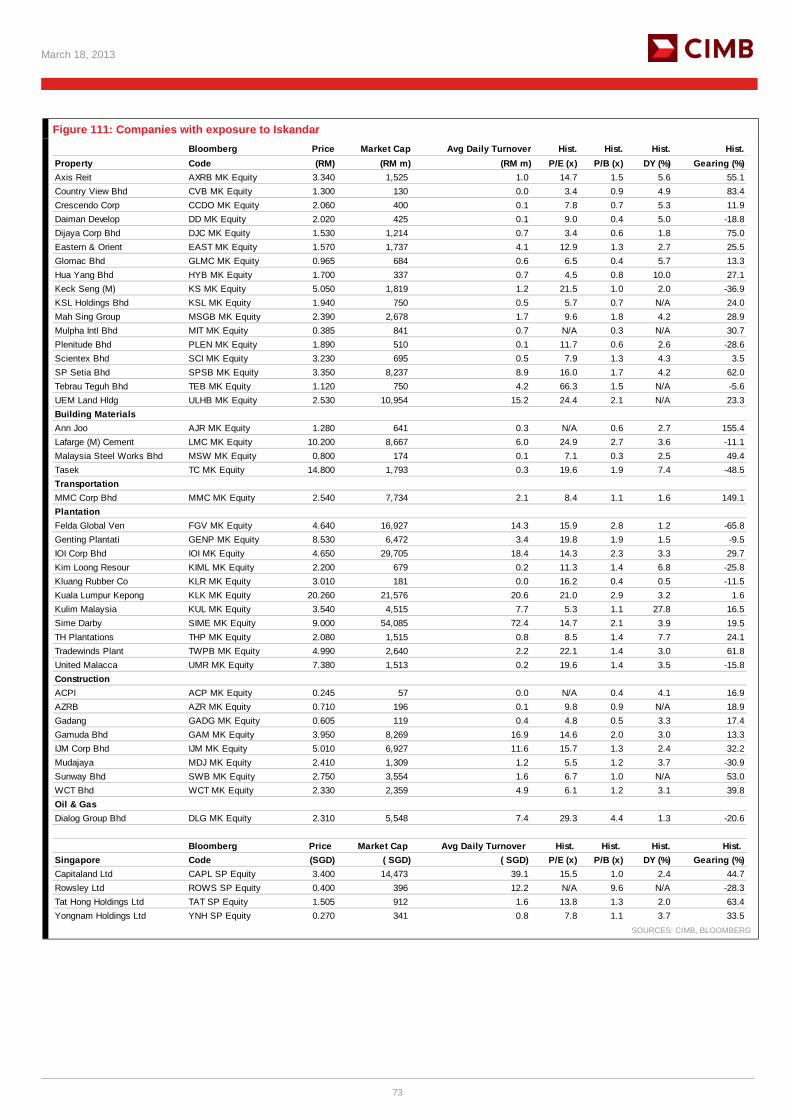
March 18, 2013
73
Figure 111: Companies with exposure to Iskandar Bloomberg Price Market Cap Avg Daily Turnover Hist. Hist. Hist. Hist.
Property Code (RM) (RM m) (RM m) P/E (x) P/B (x) DY (%) Gearing (%)Axis Reit AXRB MK Equity 3.340 1,525 1.0 14.7 1.5 5.6 55.1Country View Bhd CVB MK Equity 1.300 130 0.0 3.4 0.9 4.9 83.4Crescendo Corp CCDO MK Equity 2.060 400 0.1 7.8 0.7 5.3 11.9Daiman Develop DD MK Equity 2.020 425 0.1 9.0 0.4 5.0 -18.8Dijaya Corp Bhd DJC MK Equity 1.530 1,214 0.7 3.4 0.6 1.8 75.0Eastern & Orient EAST MK Equity 1.570 1,737 4.1 12.9 1.3 2.7 25.5Glomac Bhd GLMC MK Equity 0.965 684 0.6 6.5 0.4 5.7 13.3Hua Yang Bhd HYB MK Equity 1.700 337 0.7 4.5 0.8 10.0 27.1Keck Seng (M) KS MK Equity 5.050 1,819 1.2 21.5 1.0 2.0 -36.9KSL Holdings Bhd KSL MK Equity 1.940 750 0.5 5.7 0.7 N/A 24.0Mah Sing Group MSGB MK Equity 2.390 2,678 1.7 9.6 1.8 4.2 28.9Mulpha Intl Bhd MIT MK Equity 0.385 841 0.7 N/A 0.3 N/A 30.7Plenitude Bhd PLEN MK Equity 1.890 510 0.1 11.7 0.6 2.6 -28.6Scientex Bhd SCI MK Equity 3.230 695 0.5 7.9 1.3 4.3 3.5SP Setia Bhd SPSB MK Equity 3.350 8,237 8.9 16.0 1.7 4.2 62.0Tebrau Teguh Bhd TEB MK Equity 1.120 750 4.2 66.3 1.5 N/A -5.6UEM Land Hldg ULHB MK Equity 2.530 10,954 15.2 24.4 2.1 N/A 23.3Building MaterialsAnn Joo AJR MK Equity 1.280 641 0.3 N/A 0.6 2.7 155.4Lafarge (M) Cement LMC MK Equity 10.200 8,667 6.0 24.9 2.7 3.6 -11.1Malaysia Steel Works Bhd MSW MK Equity 0.800 174 0.1 7.1 0.3 2.5 49.4Tasek TC MK Equity 14.800 1,793 0.3 19.6 1.9 7.4 -48.5TransportationMMC Corp Bhd MMC MK Equity 2.540 7,734 2.1 8.4 1.1 1.6 149.1PlantationFelda Global Ven FGV MK Equity 4.640 16,927 14.3 15.9 2.8 1.2 -65.8Genting Plantati GENP MK Equity 8.530 6,472 3.4 19.8 1.9 1.5 -9.5IOI Corp Bhd IOI MK Equity 4.650 29,705 18.4 14.3 2.3 3.3 29.7Kim Loong Resour KIML MK Equity 2.200 679 0.2 11.3 1.4 6.8 -25.8Kluang Rubber Co KLR MK Equity 3.010 181 0.0 16.2 0.4 0.5 -11.5Kuala Lumpur Kepong KLK MK Equity 20.260 21,576 20.6 21.0 2.9 3.2 1.6Kulim Malaysia KUL MK Equity 3.540 4,515 7.7 5.3 1.1 27.8 16.5Sime Darby SIME MK Equity 9.000 54,085 72.4 14.7 2.1 3.9 19.5TH Plantations THP MK Equity 2.080 1,515 0.8 8.5 1.4 7.7 24.1Tradewinds Plant TWPB MK Equity 4.990 2,640 2.2 22.1 1.4 3.0 61.8United Malacca UMR MK Equity 7.380 1,513 0.2 19.6 1.4 3.5 -15.8ConstructionACPI ACP MK Equity 0.245 57 0.0 N/A 0.4 4.1 16.9AZRB AZR MK Equity 0.710 196 0.1 9.8 0.9 N/A 18.9Gadang GADG MK Equity 0.605 119 0.4 4.8 0.5 3.3 17.4Gamuda Bhd GAM MK Equity 3.950 8,269 16.9 14.6 2.0 3.0 13.3IJM Corp Bhd IJM MK Equity 5.010 6,927 11.6 15.7 1.3 2.4 32.2Mudajaya MDJ MK Equity 2.410 1,309 1.2 5.5 1.2 3.7 -30.9Sunway Bhd SWB MK Equity 2.750 3,554 1.6 6.7 1.0 N/A 53.0WCT Bhd WCT MK Equity 2.330 2,359 4.9 6.1 1.2 3.1 39.8Oil & GasDialog Group Bhd DLG MK Equity 2.310 5,548 7.4 29.3 4.4 1.3 -20.6
Bloomberg Price Market Cap Avg Daily Turnover Hist. Hist. Hist. Hist. Singapore Code (SGD) ( SGD) ( SGD) P/E (x) P/B (x) DY (%) Gearing (%)Capitaland Ltd CAPL SP Equity 3.400 14,473 39.1 15.5 1.0 2.4 44.7Rowsley Ltd ROWS SP Equity 0.400 396 12.2 N/A 9.6 N/A -28.3Tat Hong Holdings Ltd TAT SP Equity 1.505 912 1.6 13.8 1.3 2.0 63.4Yongnam Holdings Ltd YNH SP Equity 0.270 341 0.8 7.8 1.1 3.7 33.5
SOURCES: CIMB, BLOOMBERG
March 18, 2013
74
9.9 Conclusion In conclusion, Iskandar no longer appears to be a pie in the sky and investors and buyers alike from Malaysia and Singapore are taking a serious second look at opportunities there. Is this sustainable? The answer to this question depends on which aspect investors are looking at.
If investors are asking about physical property prices, which seem to be going up rapidly with prime condo prices in Puteri Harbour already reaching RM1,200 psf, then the answer is yes but only for a few more years until a lot more supply comes onstream. The early property projects, such as those by UEM Land and United Malayan Land, were priced at RM700-800 psf while, more recently, prices have risen to RM1,000-1,200 psf. We believe Iskandar property prices still have much more upside as prices remain a fraction of their Singapore equivalents. But Iskandar prices could reach a temporary peak in 3-5 years’ time when the supply of completed units starts to hit the market. This is not dissimilar to what happened in the KLCC market when prices doubled within 2-3 years, only to peak and fall after huge supply came onstream.
But if the question relates to Iskandar as a business destination and a growth corridor, then we believe the answer is a resounding yes. We believe the momentum is sustainable as long as the conditions remain conducive with no major hiccups in the relationship between the two countries. Thus far there has been strong progress made on so many fronts, including buy-in from the authorities of both countries, completion of major catalyst projects, commencement of new catalyst projects that are even more ambitious and enhancements and additions to transportation links that can only draw the two nations even closer. Singapore's importance to Iskandar cannot be overemphasised but the relationship also goes both ways. Singapore too stands to benefit significantly from Iskandar as it makes perfect economic sense and that is why we continue to remain bullish on Iskandar, dubbing it the "Shenzhen of Malaysia."
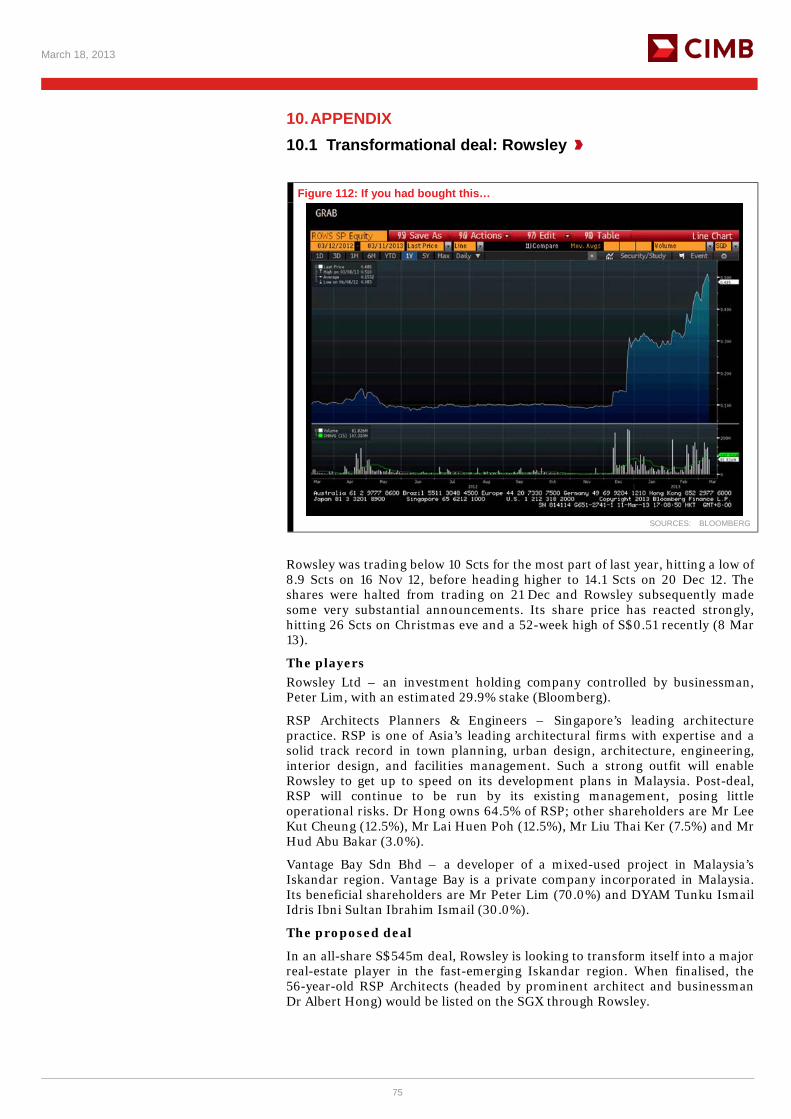
March 18, 2013
75
10. APPENDIX 10.1 Transformational deal: Rowsley
Figure 112: If you had bought this…
SOURCES: BLOOMBERG
Rowsley was trading below 10 Scts for the most part of last year, hitting a low of 8.9 Scts on 16 Nov 12, before heading higher to 14.1 Scts on 20 Dec 12. The shares were halted from trading on 21 Dec and Rowsley subsequently made some very substantial announcements. Its share price has reacted strongly, hitting 26 Scts on Christmas eve and a 52-week high of S$0.51 recently (8 Mar 13).
The players Rowsley Ltd – an investment holding company controlled by businessman, Peter Lim, with an estimated 29.9% stake (Bloomberg).
RSP Architects Planners & Engineers – Singapore’s leading architecture practice. RSP is one of Asia’s leading architectural firms with expertise and a solid track record in town planning, urban design, architecture, engineering, interior design, and facilities management. Such a strong outfit will enable Rowsley to get up to speed on its development plans in Malaysia. Post-deal, RSP will continue to be run by its existing management, posing little operational risks. Dr Hong owns 64.5% of RSP; other shareholders are Mr Lee Kut Cheung (12.5%), Mr Lai Huen Poh (12.5%), Mr Liu Thai Ker (7.5%) and Mr Hud Abu Bakar (3.0%).
Vantage Bay Sdn Bhd – a developer of a mixed-used project in Malaysia’s Iskandar region. Vantage Bay is a private company incorporated in Malaysia. Its beneficial shareholders are Mr Peter Lim (70.0%) and DYAM Tunku Ismail Idris Ibni Sultan Ibrahim Ismail (30.0%).
The proposed deal
In an all-share S$545m deal, Rowsley is looking to transform itself into a major real-estate player in the fast-emerging Iskandar region. When finalised, the 56-year-old RSP Architects (headed by prominent architect and businessman Dr Albert Hong) would be listed on the SGX through Rowsley.
March 18, 2013
76
There are three key components to this deal:- 1) Rowsley will acquire RSP from Dr Hong and four of his partners for up to S$187m, to be paid by issuing nearly 1.25bn Rowsley shares at S$0.15 each. 2) At the same time, Rowsley has entered into another agreement with Vantage Bay Sdn Bhd to buy the latter’s 9.23 ha of land at Iskandar for S$358m. 3) If the deal goes through after a period of due diligence, Rowsley will reward existing shareholders with a free bonus issue of two warrants for every one existing share. Each warrant can be exercised at S$0.18/share.
The Iskandar portion The land Vantage plans to sell to Rowsley is located at Bandar Johor Bahru, Daerah Johor Bahru, Negeri Johor, within Flagship A of the Iskandar development region, Johor Bahru, Malaysia. The land is located on a waterfront site just a few hundred metres from Johor's new customs, immigration and quarantine facility, making it highly convenient for Singaporeans due to its proximity to Singapore. There are plans to develop the land into an integrated mixed-use township with a major shopping, entertainment and residential complex. It will also have a hotel, commercial and office developments. The land is about 9.23 ha in size with the proposed township expected to yield a gross floor area of no less than 10m sf. The adjacent medical hub to be jointly developed by Thomson Medical Limited and Vantage Bay will complement the mixed-use township and enhance the overall attractiveness of the development.
The RSP portion RSP, one of Singapore’s oldest architect firms, started out as a partnership known as Raglan Squire and Partners in 1956. Since then, it has grown in scope and scale to become one of the largest and most established practices in Asia employing 1,000 people in many countries, including Singapore, China, Vietnam, UAE. and Africa. Among its recent projects in Singapore are Bishopgate Residences, a new extension of Plaza Singapura, ITE’s headquarters, College Central and The Wharf Residences. Its commitment to service and quality has led to numerous awards over the years, including prestigious ones like the EDB Solar Pioneer Award, Skyrise Greenery Award and ASEAN Energy Award.
Deal valuations - RSP
The maximum purchase price of S$187m works out to a P/E of 7.5x based on the average annual profit after tax under earn-out targets from financial years ending 31 Dec 13 to 31 Dec 15 (FY13-15).
The maximum RSP purchase price comprises two components: S$131m for the entire issued share capital of RSP, payable by Rowsley shares upon completion, and up to S$56m in “earn-out consideration” payable by Rowsley shares when the Proforma RSP Group achieves a consolidated cumulative net profit after tax of S$75m for FY13-15.
For reference, RSP achieved a PATMI of S$19.6m in FY11. Rowsley has appointed Ernst & Young Solutions to undertake an independent equity valuation of the Proforma RSP Group and will disclose the findings in a circular to shareholders subsequently. There will also be a share moratorium on the new shares to be issued. More details can be found in Rowsley’s announcement dated 3 Feb 13.
Deal valuations - Vantage
For the Vantage acquisition, Rowsley will issue 2.4bn shares to pay up to S$358m. No financial statements are available on the land but Rowsley has commissioned Knight Frank Malaysia Sdn Bhd to undertake an independent valuation of the land and again, a copy of the valuation report will be made available. A share moratorium will also be applicable in respect of the new shares to be issued for this deal.
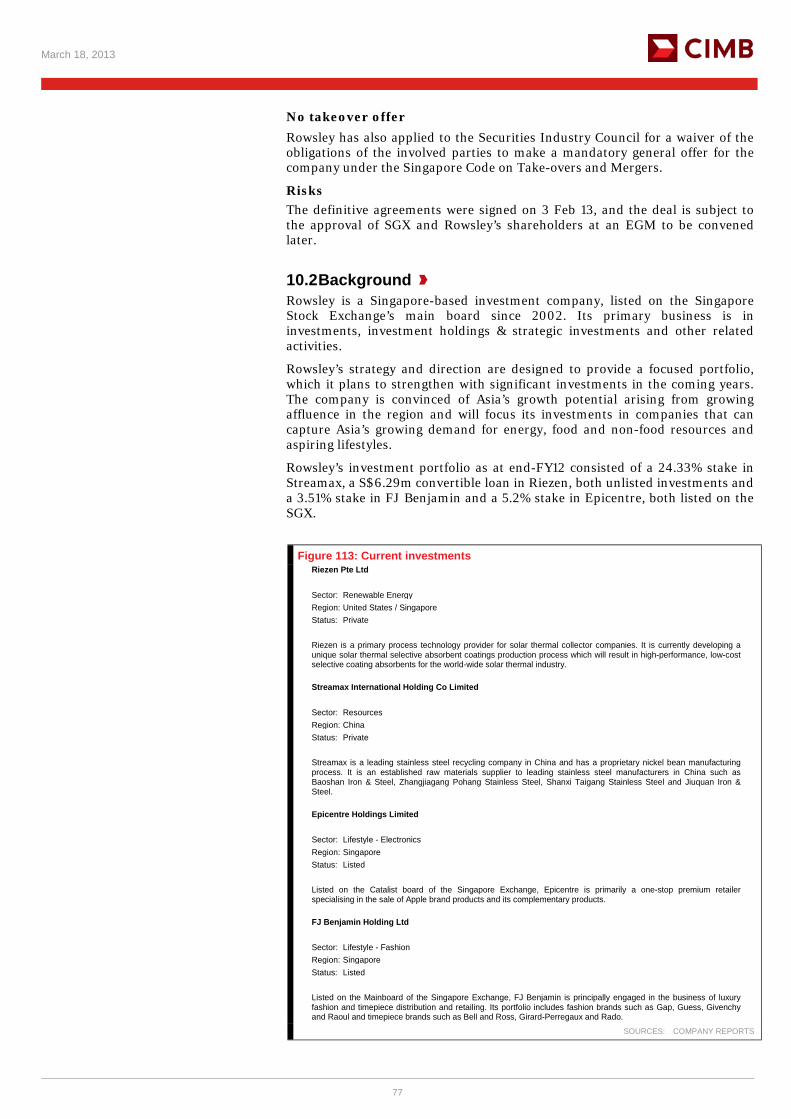
March 18, 2013
77
No takeover offer Rowsley has also applied to the Securities Industry Council for a waiver of the obligations of the involved parties to make a mandatory general offer for the company under the Singapore Code on Take-overs and Mergers.
Risks The definitive agreements were signed on 3 Feb 13, and the deal is subject to the approval of SGX and Rowsley’s shareholders at an EGM to be convened later.
10.2 Background Rowsley is a Singapore-based investment company, listed on the Singapore Stock Exchange’s main board since 2002. Its primary business is in investments, investment holdings & strategic investments and other related activities.
Rowsley’s strategy and direction are designed to provide a focused portfolio, which it plans to strengthen with significant investments in the coming years. The company is convinced of Asia’s growth potential arising from growing affluence in the region and will focus its investments in companies that can capture Asia’s growing demand for energy, food and non-food resources and aspiring lifestyles.
Rowsley’s investment portfolio as at end-FY12 consisted of a 24.33% stake in Streamax, a S$6.29m convertible loan in Riezen, both unlisted investments and a 3.51% stake in FJ Benjamin and a 5.2% stake in Epicentre, both listed on the SGX.
Figure 113: Current investments Riezen Pte Ltd
Sector: Renewable Energy Region: United States / Singapore Status: Private
Riezen is a primary process technology provider for solar thermal collector companies. It is currently developing a unique solar thermal selective absorbent coatings production process which will result in high-performance, low-cost selective coating absorbents for the world-wide solar thermal industry.
Streamax International Holding Co Limited
Sector: Resources Region: China Status: Private
Streamax is a leading stainless steel recycling company in China and has a proprietary nickel bean manufacturing process. It is an established raw materials supplier to leading stainless steel manufacturers in China such as Baoshan Iron & Steel, Zhangjiagang Pohang Stainless Steel, Shanxi Taigang Stainless Steel and Jiuquan Iron & Steel.
Epicentre Holdings Limited
Sector: Lifestyle - Electronics Region: Singapore Status: Listed
Listed on the Catalist board of the Singapore Exchange, Epicentre is primarily a one-stop premium retailer specialising in the sale of Apple brand products and its complementary products.
FJ Benjamin Holding Ltd
Sector: Lifestyle - Fashion Region: Singapore Status: Listed
Listed on the Mainboard of the Singapore Exchange, FJ Benjamin is principally engaged in the business of luxury fashion and timepiece distribution and retailing. Its portfolio includes fashion brands such as Gap, Guess, Givenchy and Raoul and timepiece brands such as Bell and Ross, Girard-Perregaux and Rado.
SOURCES: COMPANY REPORTS
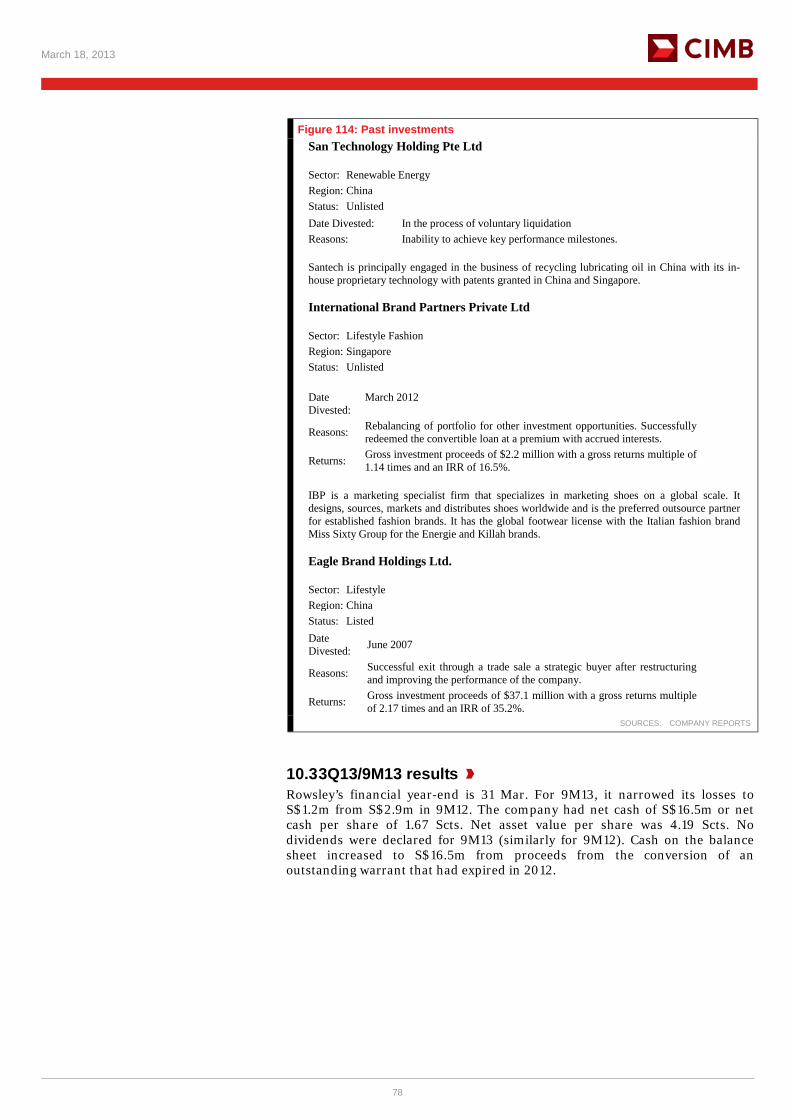
March 18, 2013
78
Figure 114: Past investments San Technology Holding Pte Ltd
Sector: Renewable Energy Region: China Status: Unlisted Date Divested: In the process of voluntary liquidation Reasons: Inability to achieve key performance milestones.
Santech is principally engaged in the business of recycling lubricating oil in China with its in-house proprietary technology with patents granted in China and Singapore.
International Brand Partners Private Ltd
Sector: Lifestyle Fashion Region: Singapore Status: Unlisted Date Divested:
March 2012
Reasons: Rebalancing of portfolio for other investment opportunities. Successfully redeemed the convertible loan at a premium with accrued interests.
Returns: Gross investment proceeds of $2.2 million with a gross returns multiple of 1.14 times and an IRR of 16.5%.
IBP is a marketing specialist firm that specializes in marketing shoes on a global scale. It designs, sources, markets and distributes shoes worldwide and is the preferred outsource partner for established fashion brands. It has the global footwear license with the Italian fashion brand Miss Sixty Group for the Energie and Killah brands.
Eagle Brand Holdings Ltd.
Sector: Lifestyle Region: China Status: Listed Date Divested: June 2007
Reasons: Successful exit through a trade sale a strategic buyer after restructuring and improving the performance of the company.
Returns: Gross investment proceeds of $37.1 million with a gross returns multiple of 2.17 times and an IRR of 35.2%.
SOURCES: COMPANY REPORTS
10.3 3Q13/9M13 results Rowsley’s financial year-end is 31 Mar. For 9M13, it narrowed its losses to S$1.2m from S$2.9m in 9M12. The company had net cash of S$16.5m or net cash per share of 1.67 Scts. Net asset value per share was 4.19 Scts. No dividends were declared for 9M13 (similarly for 9M12). Cash on the balance sheet increased to S$16.5m from proceeds from the conversion of an outstanding warrant that had expired in 2012.
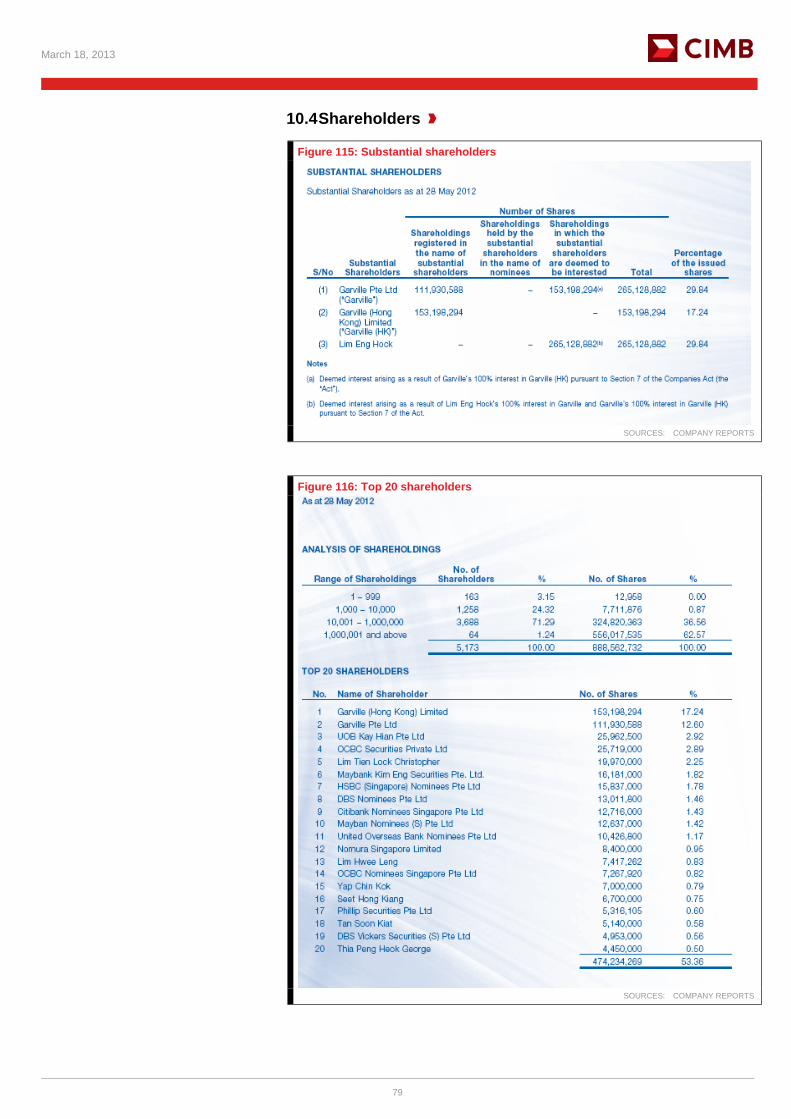
March 18, 2013
79
10.4 Shareholders
Figure 115: Substantial shareholders
SOURCES: COMPANY REPORTS
Figure 116: Top 20 shareholders
SOURCES: COMPANY REPORTS
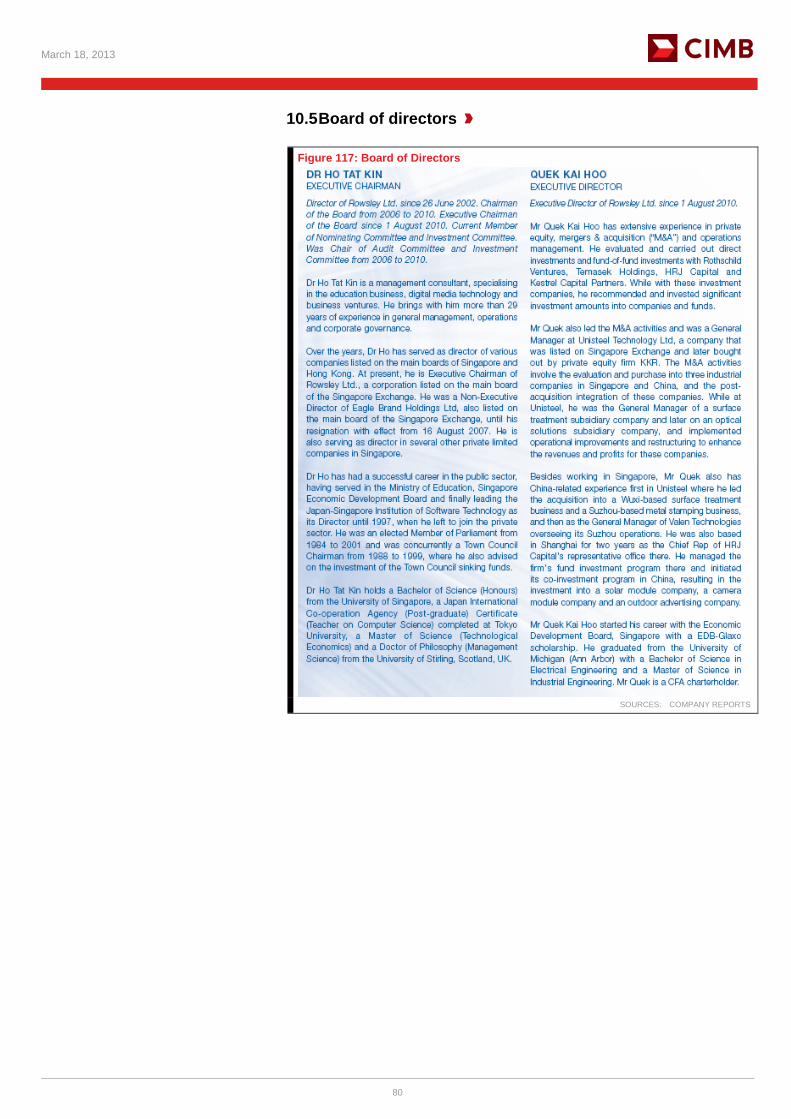
March 18, 2013
80
10.5 Board of directors
Figure 117: Board of Directors
SOURCES: COMPANY REPORTS
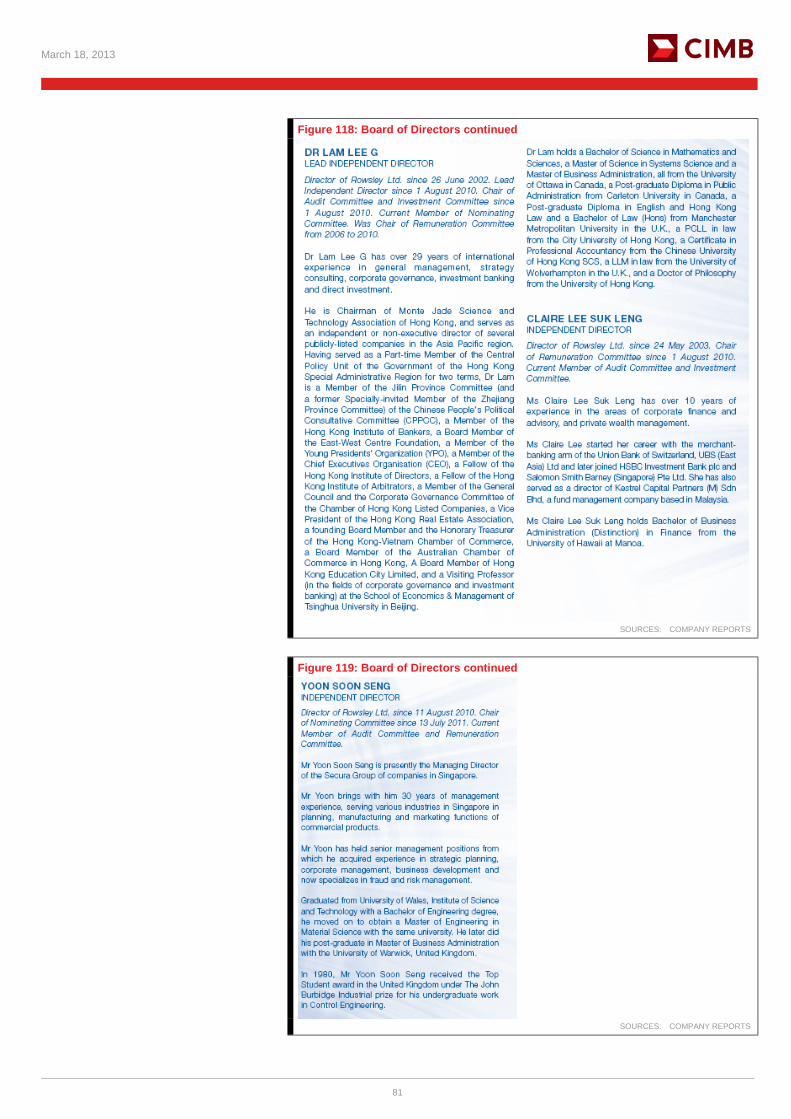
March 18, 2013
81
Figure 118: Board of Directors continued
SOURCES: COMPANY REPORTS
Figure 119: Board of Directors continued
SOURCES: COMPANY REPORTS
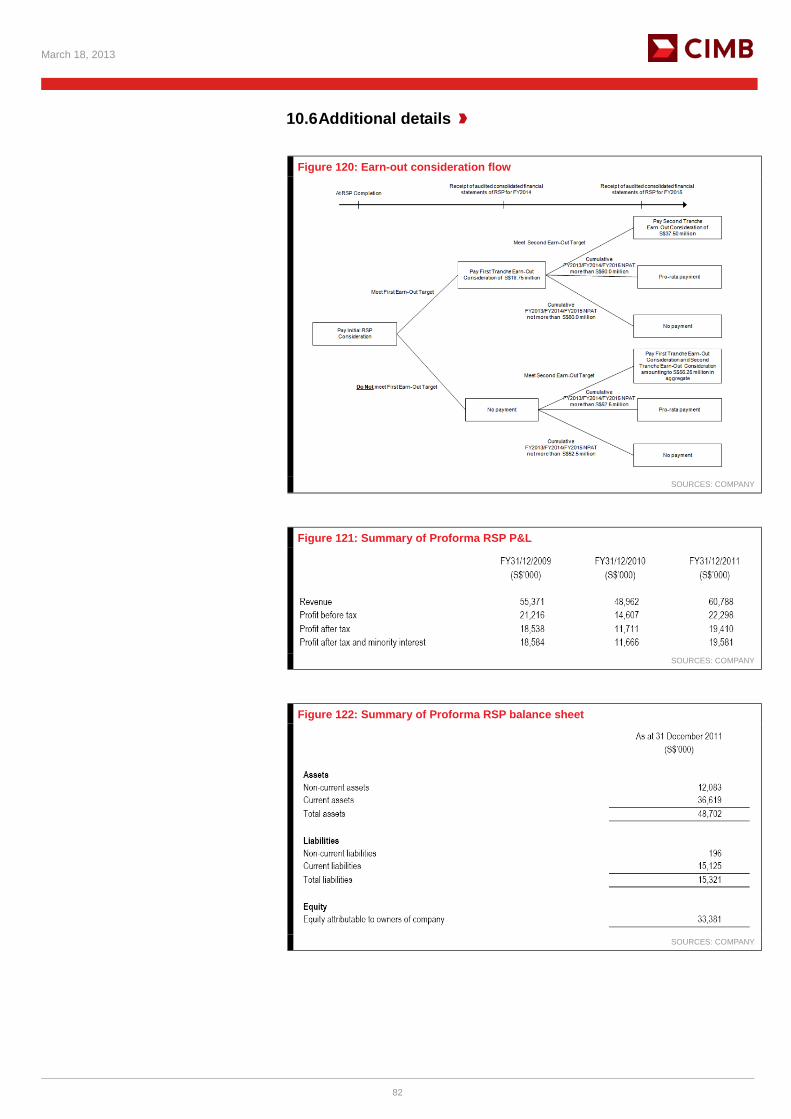
March 18, 2013
82
10.6 Additional details
Figure 120: Earn-out consideration flow
SOURCES: COMPANY
Figure 121: Summary of Proforma RSP P&L
SOURCES: COMPANY
Figure 122: Summary of Proforma RSP balance sheet
SOURCES: COMPANY
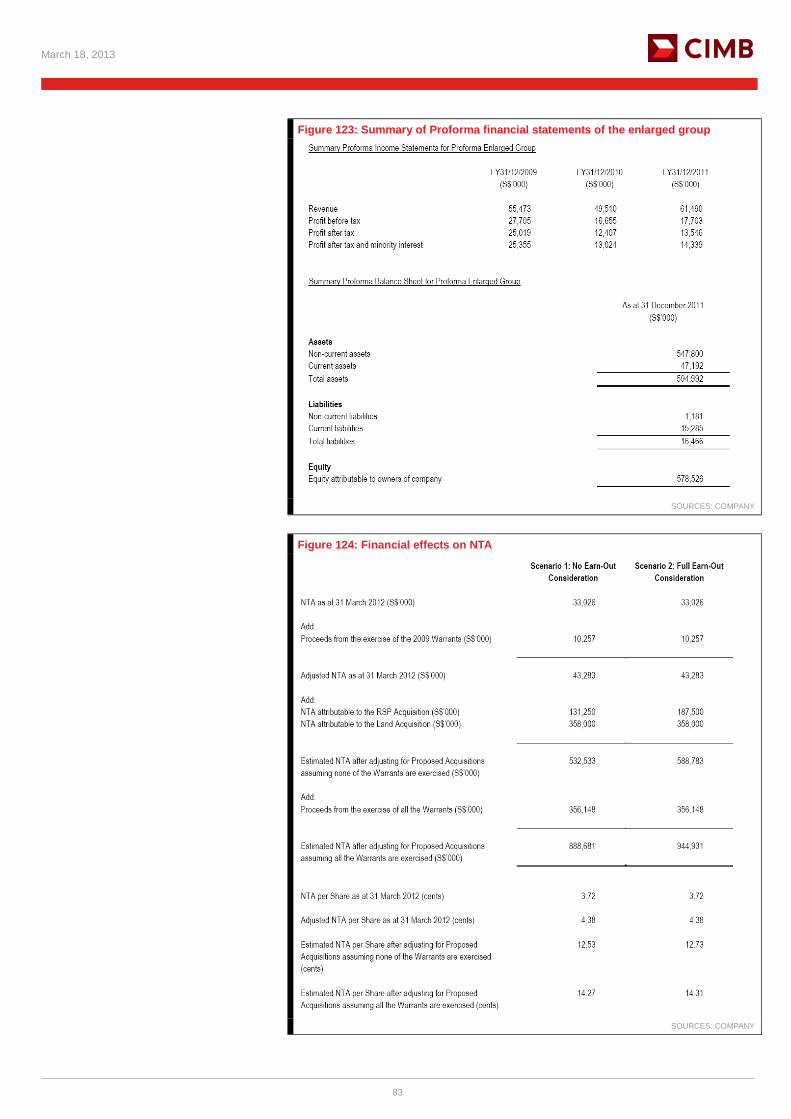
March 18, 2013
83
Figure 123: Summary of Proforma financial statements of the enlarged group
SOURCES: COMPANY
Figure 124: Financial effects on NTA
SOURCES: COMPANY
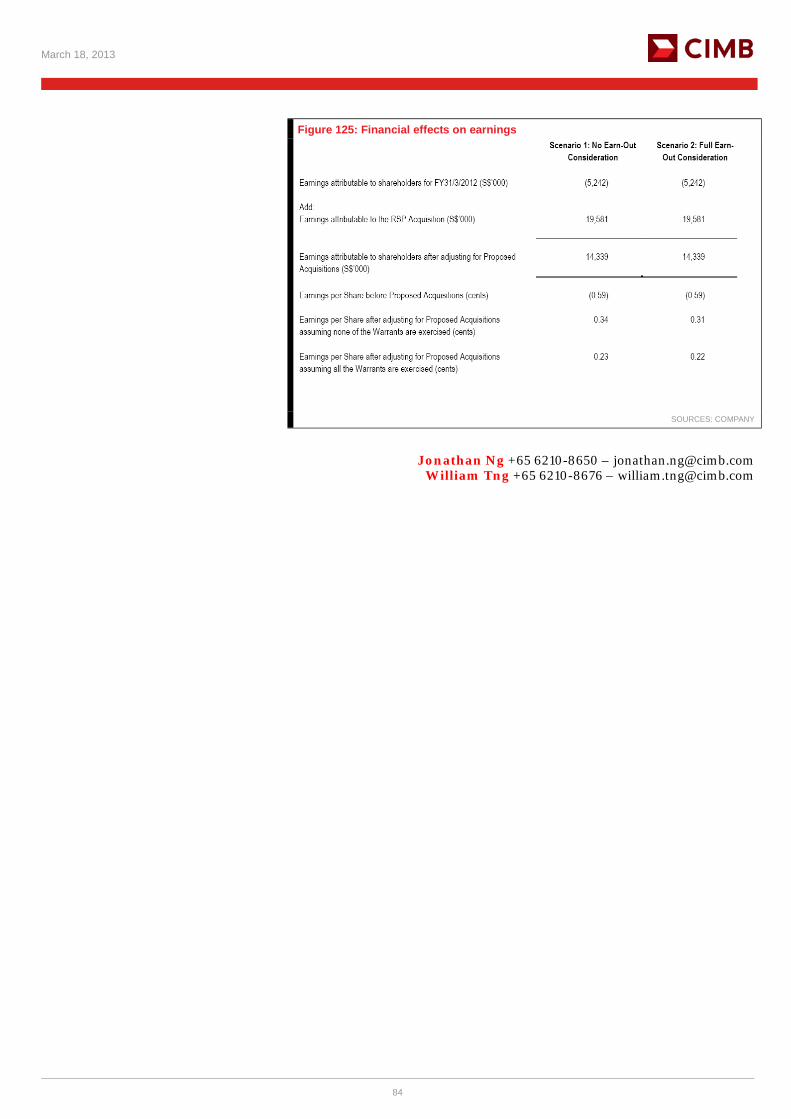
March 18, 2013
84
Figure 125: Financial effects on earnings
SOURCES: COMPANY
Jonathan Ng +65 6210-8650 – [email protected]
William Tng +65 6210-8676 – [email protected]

March 18, 2013
85
Company Briefs
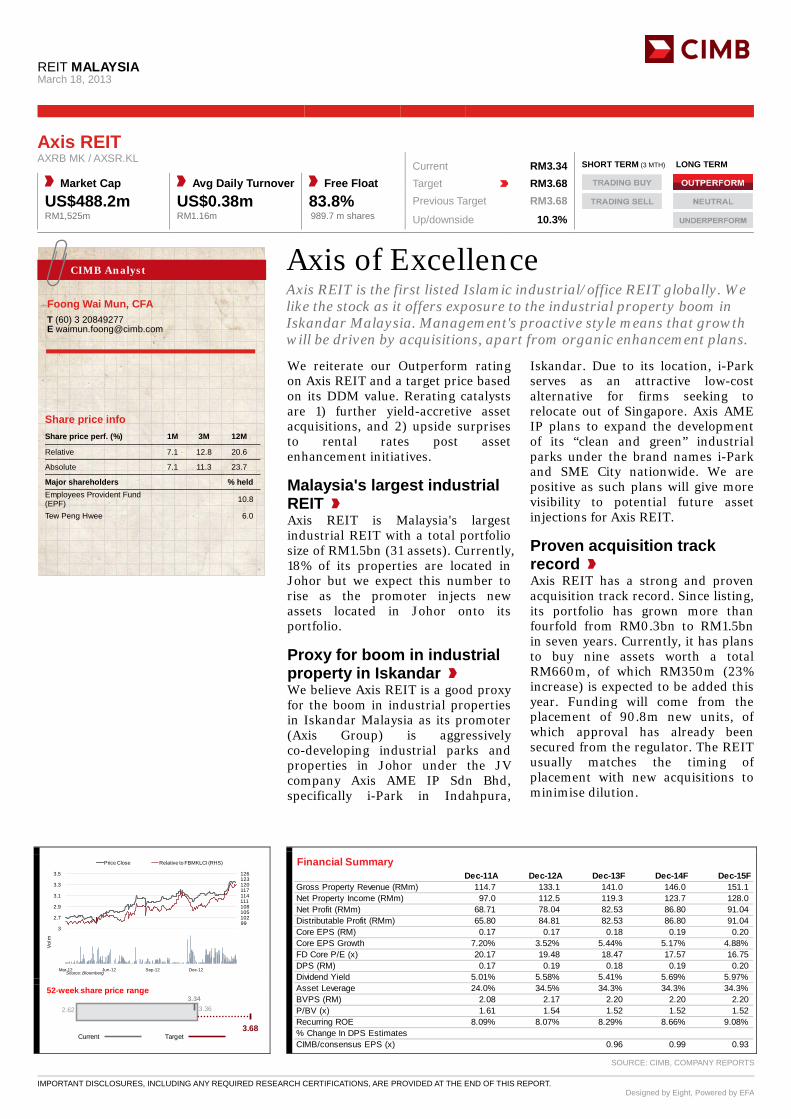
REIT MALAYSIA
March 18, 2013
IMPORTANT DISCLOSURES, INCLUDING ANY REQUIRED RESEARCH CERTIFICATIONS, ARE PROVIDED AT THE END OF THIS REPORT. Designed by Eight, Powered by EFA
Axis of Excellence Axis REIT is the first listed Islamic industrial/office REIT globally. We like the stock as it offers exposure to the industrial property boom in Iskandar Malaysia. Management's proactive style means that growth will be driven by acquisitions, apart from organic enhancement plans. We reiterate our Outperform rating on Axis REIT and a target price based on its DDM value. Rerating catalysts are 1) further yield-accretive asset acquisitions, and 2) upside surprises to rental rates post asset enhancement initiatives.
Malaysia's largest industrial REIT Axis REIT is Malaysia's largest industrial REIT with a total portfolio size of RM1.5bn (31 assets). Currently, 18% of its properties are located in Johor but we expect this number to rise as the promoter injects new assets located in Johor onto its portfolio.
Proxy for boom in industrial property in Iskandar We believe Axis REIT is a good proxy for the boom in industrial properties in Iskandar Malaysia as its promoter (Axis Group) is aggressively co-developing industrial parks and properties in Johor under the JV company Axis AME IP Sdn Bhd, specifically i-Park in Indahpura,
Iskandar. Due to its location, i-Park serves as an attractive low-cost alternative for firms seeking to relocate out of Singapore. Axis AME IP plans to expand the development of its “clean and green” industrial parks under the brand names i-Park and SME City nationwide. We are positive as such plans will give more visibility to potential future asset injections for Axis REIT.
Proven acquisition track record Axis REIT has a strong and proven acquisition track record. Since listing, its portfolio has grown more than fourfold from RM0.3bn to RM1.5bn in seven years. Currently, it has plans to buy nine assets worth a total RM660m, of which RM350m (23% increase) is expected to be added this year. Funding will come from the placement of 90.8m new units, of which approval has already been secured from the regulator. The REIT usually matches the timing of placement with new acquisitions to minimise dilution.
CIMB Analyst
Foong Wai Mun, CFA
T (60) 3 20849277 E [email protected]
Axis REIT AXRB MK / AXSR.KL Current RM3.34 SHORT TERM (3 MTH) LONG TERM
Market Cap Avg Daily Turnover Free Float Target RM3.68 US$488.2m US$0.38m 83.8% Previous Target RM3.68 RM1,525m RM1.16m 989.7 m shares Up/downside 10.3%
Conviction| |
9699102105108111114117120123126
2.5
2.7
2.9
3.1
3.3
3.5
Price Close Relative to FBMKLCI (RHS)
Source: Bloomberg
11223
Mar-12 Jun-12 Sep-12 Dec-12
Vol m
Financial Summary Dec-11A Dec-12A Dec-13F Dec-14F Dec-15F
Gross Property Revenue (RMm) 114.7 133.1 141.0 146.0 151.1Net Property Income (RMm) 97.0 112.5 119.3 123.7 128.0Net Profit (RMm) 68.71 78.04 82.53 86.80 91.04Distributable Profit (RMm) 65.80 84.81 82.53 86.80 91.04Core EPS (RM) 0.17 0.17 0.18 0.19 0.20Core EPS Growth 7.20% 3.52% 5.44% 5.17% 4.88%FD Core P/E (x) 20.17 19.48 18.47 17.57 16.75DPS (RM) 0.17 0.19 0.18 0.19 0.20Dividend Yield 5.01% 5.58% 5.41% 5.69% 5.97%Asset Leverage 24.0% 34.5% 34.3% 34.3% 34.3%BVPS (RM) 2.08 2.17 2.20 2.20 2.20P/BV (x) 1.61 1.54 1.52 1.52 1.52Recurring ROE 8.09% 8.07% 8.29% 8.66% 9.08%% Change In DPS Estimates CIMB/consensus EPS (x) 0.96 0.99 0.93
3.34
3.68
2.62 3.36
Target
52-week share price range
Current
SOURCE: CIMB, COMPANY REPORTS
Share price info Share price perf. (%) 1M 3M 12M
Relative 7.1 12.8 20.6
Absolute 7.1 11.3 23.7
Major shareholders % held Employees Provident Fund (EPF) 10.8
Tew Peng Hwee 6.0
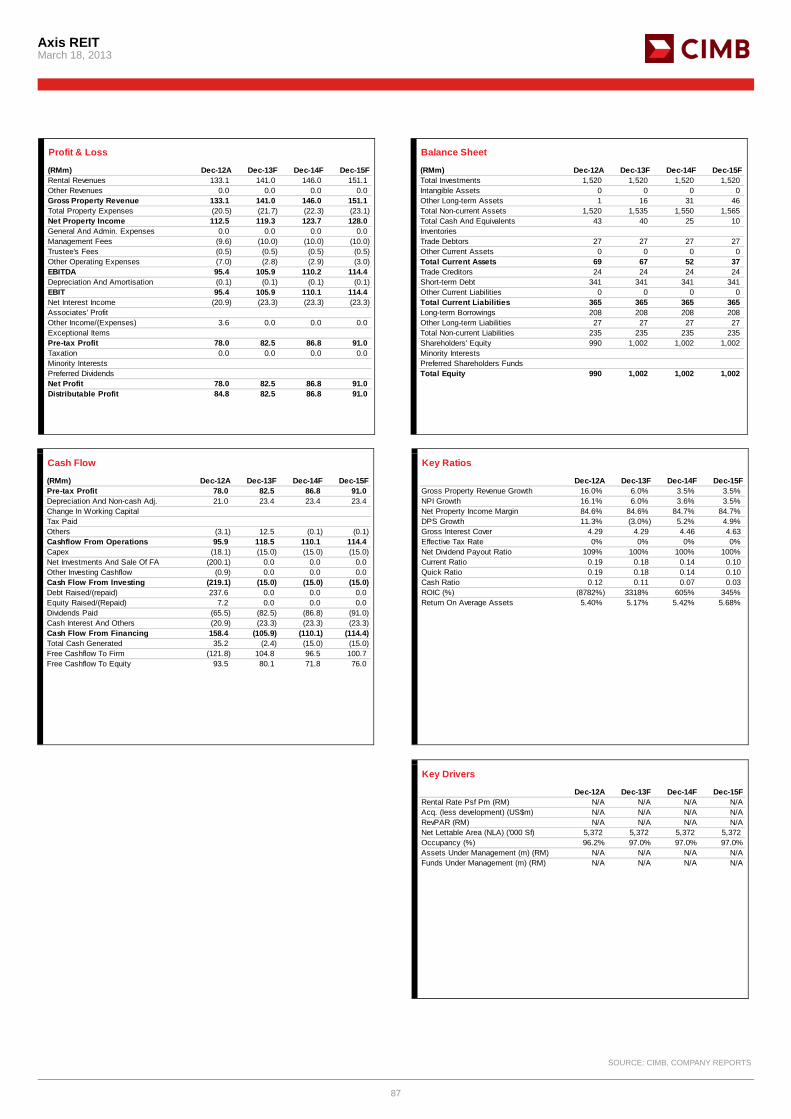
Axis REIT March 18, 2013
87
Profit & Loss
(RMm) Dec-12A Dec-13F Dec-14F Dec-15FRental Revenues 133.1 141.0 146.0 151.1Other Revenues 0.0 0.0 0.0 0.0Gross Property Revenue 133.1 141.0 146.0 151.1Total Property Expenses (20.5) (21.7) (22.3) (23.1)Net Property Income 112.5 119.3 123.7 128.0General And Admin. Expenses 0.0 0.0 0.0 0.0Management Fees (9.6) (10.0) (10.0) (10.0)Trustee's Fees (0.5) (0.5) (0.5) (0.5)Other Operating Expenses (7.0) (2.8) (2.9) (3.0)EBITDA 95.4 105.9 110.2 114.4Depreciation And Amortisation (0.1) (0.1) (0.1) (0.1)EBIT 95.4 105.9 110.1 114.4Net Interest Income (20.9) (23.3) (23.3) (23.3)Associates' ProfitOther Income/(Expenses) 3.6 0.0 0.0 0.0Exceptional ItemsPre-tax Profit 78.0 82.5 86.8 91.0Taxation 0.0 0.0 0.0 0.0Minority InterestsPreferred DividendsNet Profit 78.0 82.5 86.8 91.0Distributable Profit 84.8 82.5 86.8 91.0
Balance Sheet
(RMm) Dec-12A Dec-13F Dec-14F Dec-15FTotal Investments 1,520 1,520 1,520 1,520Intangible Assets 0 0 0 0Other Long-term Assets 1 16 31 46Total Non-current Assets 1,520 1,535 1,550 1,565Total Cash And Equivalents 43 40 25 10InventoriesTrade Debtors 27 27 27 27Other Current Assets 0 0 0 0Total Current Assets 69 67 52 37Trade Creditors 24 24 24 24Short-term Debt 341 341 341 341Other Current Liabilities 0 0 0 0Total Current Liabilities 365 365 365 365Long-term Borrowings 208 208 208 208Other Long-term Liabilities 27 27 27 27Total Non-current Liabilities 235 235 235 235Shareholders' Equity 990 1,002 1,002 1,002Minority InterestsPreferred Shareholders FundsTotal Equity 990 1,002 1,002 1,002
Cash Flow
(RMm) Dec-12A Dec-13F Dec-14F Dec-15FPre-tax Profit 78.0 82.5 86.8 91.0Depreciation And Non-cash Adj. 21.0 23.4 23.4 23.4Change In Working CapitalTax PaidOthers (3.1) 12.5 (0.1) (0.1)Cashflow From Operations 95.9 118.5 110.1 114.4Capex (18.1) (15.0) (15.0) (15.0)Net Investments And Sale Of FA (200.1) 0.0 0.0 0.0Other Investing Cashflow (0.9) 0.0 0.0 0.0Cash Flow From Investing (219.1) (15.0) (15.0) (15.0)Debt Raised/(repaid) 237.6 0.0 0.0 0.0Equity Raised/(Repaid) 7.2 0.0 0.0 0.0Dividends Paid (65.5) (82.5) (86.8) (91.0)Cash Interest And Others (20.9) (23.3) (23.3) (23.3)Cash Flow From Financing 158.4 (105.9) (110.1) (114.4)Total Cash Generated 35.2 (2.4) (15.0) (15.0)Free Cashflow To Firm (121.8) 104.8 96.5 100.7Free Cashflow To Equity 93.5 80.1 71.8 76.0
Key Ratios
Dec-12A Dec-13F Dec-14F Dec-15FGross Property Revenue Growth 16.0% 6.0% 3.5% 3.5%NPI Growth 16.1% 6.0% 3.6% 3.5%Net Property Income Margin 84.6% 84.6% 84.7% 84.7%DPS Growth 11.3% (3.0%) 5.2% 4.9%Gross Interest Cover 4.29 4.29 4.46 4.63Effective Tax Rate 0% 0% 0% 0%Net Dividend Payout Ratio 109% 100% 100% 100%Current Ratio 0.19 0.18 0.14 0.10Quick Ratio 0.19 0.18 0.14 0.10Cash Ratio 0.12 0.11 0.07 0.03ROIC (%) (8782%) 3318% 605% 345%Return On Average Assets 5.40% 5.17% 5.42% 5.68%
Key Drivers
Dec-12A Dec-13F Dec-14F Dec-15FRental Rate Psf Pm (RM) N/A N/A N/A N/AAcq. (less development) (US$m) N/A N/A N/A N/ARevPAR (RM) N/A N/A N/A N/ANet Lettable Area (NLA) ('000 Sf) 5,372 5,372 5,372 5,372 Occupancy (%) 96.2% 97.0% 97.0% 97.0%Assets Under Management (m) (RM) N/A N/A N/A N/AFunds Under Management (m) (RM) N/A N/A N/A N/A
SOURCE: CIMB, COMPANY REPORTS
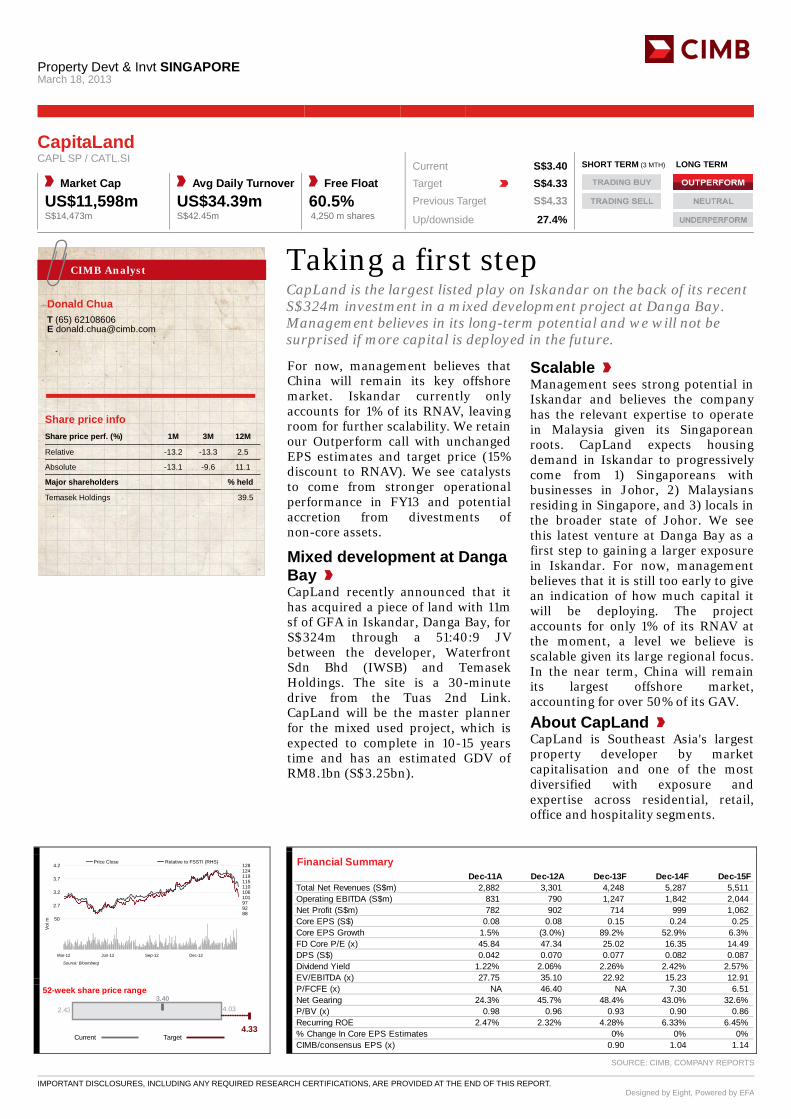
Property Devt & Invt SINGAPORE
March 18, 2013
IMPORTANT DISCLOSURES, INCLUDING ANY REQUIRED RESEARCH CERTIFICATIONS, ARE PROVIDED AT THE END OF THIS REPORT. Designed by Eight, Powered by EFA
Taking a first step CapLand is the largest listed play on Iskandar on the back of its recent S$324m investment in a mixed development project at Danga Bay. Management believes in its long-term potential and we will not be surprised if more capital is deployed in the future. For now, management believes that China will remain its key offshore market. Iskandar currently only accounts for 1% of its RNAV, leaving room for further scalability. We retain our Outperform call with unchanged EPS estimates and target price (15% discount to RNAV). We see catalysts to come from stronger operational performance in FY13 and potential accretion from divestments of non-core assets.
Mixed development at Danga Bay CapLand recently announced that it has acquired a piece of land with 11m sf of GFA in Iskandar, Danga Bay, for S$324m through a 51:40:9 JV between the developer, Waterfront Sdn Bhd (IWSB) and Temasek Holdings. The site is a 30-minute drive from the Tuas 2nd Link. CapLand will be the master planner for the mixed used project, which is expected to complete in 10-15 years time and has an estimated GDV of RM8.1bn (S$3.25bn).
Scalable Management sees strong potential in Iskandar and believes the company has the relevant expertise to operate in Malaysia given its Singaporean roots. CapLand expects housing demand in Iskandar to progressively come from 1) Singaporeans with businesses in Johor, 2) Malaysians residing in Singapore, and 3) locals in the broader state of Johor. We see this latest venture at Danga Bay as a first step to gaining a larger exposure in Iskandar. For now, management believes that it is still too early to give an indication of how much capital it will be deploying. The project accounts for only 1% of its RNAV at the moment, a level we believe is scalable given its large regional focus. In the near term, China will remain its largest offshore market, accounting for over 50% of its GAV.
About CapLand CapLand is Southeast Asia's largest property developer by market capitalisation and one of the most diversified with exposure and expertise across residential, retail, office and hospitality segments.
CIMB Analyst
Donald Chua
T (65) 62108606 E [email protected]
CapitaLand CAPL SP / CATL.SI Current S$3.40 SHORT TERM (3 MTH) LONG TERM
Market Cap Avg Daily Turnover Free Float Target S$4.33 US$11,598m US$34.39m 60.5% Previous Target S$4.33 S$14,473m S$42.45m 4,250 m shares Up/downside 27.4%
Conviction| |
2.2
2.7
3.2
3.7
4.2
83889297101106110115119124128
Price Close Relative to FSSTI (RHS)
Source: Bloomberg
1020304050
Mar-12 Jun-12 Sep-12 Dec-12
Vol m
Financial Summary Dec-11A Dec-12A Dec-13F Dec-14F Dec-15F
Total Net Revenues (S$m) 2,882 3,301 4,248 5,287 5,511Operating EBITDA (S$m) 831 790 1,247 1,842 2,044Net Profit (S$m) 782 902 714 999 1,062Core EPS (S$) 0.08 0.08 0.15 0.24 0.25Core EPS Growth 1.5% (3.0%) 89.2% 52.9% 6.3%FD Core P/E (x) 45.84 47.34 25.02 16.35 14.49DPS (S$) 0.042 0.070 0.077 0.082 0.087Dividend Yield 1.22% 2.06% 2.26% 2.42% 2.57%EV/EBITDA (x) 27.75 35.10 22.92 15.23 12.91P/FCFE (x) NA 46.40 NA 7.30 6.51Net Gearing 24.3% 45.7% 48.4% 43.0% 32.6%P/BV (x) 0.98 0.96 0.93 0.90 0.86Recurring ROE 2.47% 2.32% 4.28% 6.33% 6.45%% Change In Core EPS Estimates 0% 0% 0%CIMB/consensus EPS (x) 0.90 1.04 1.14
3.40
4.33
2.43 4.03
Target
52-week share price range
Current
SOURCE: CIMB, COMPANY REPORTS
Share price info Share price perf. (%) 1M 3M 12M
Relative -13.2 -13.3 2.5
Absolute -13.1 -9.6 11.1
Major shareholders % held
Temasek Holdings 39.5
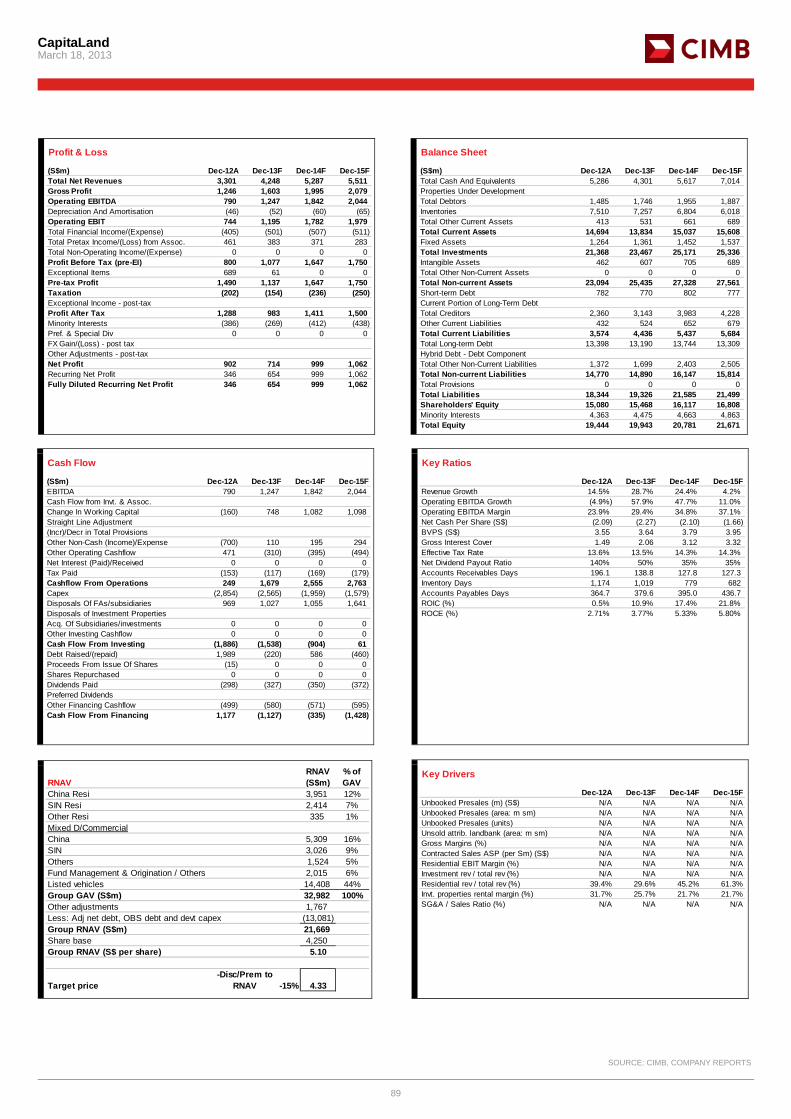
CapitaLand March 18, 2013
89
Profit & Loss
(S$m) Dec-12A Dec-13F Dec-14F Dec-15FTotal Net Revenues 3,301 4,248 5,287 5,511Gross Profit 1,246 1,603 1,995 2,079Operating EBITDA 790 1,247 1,842 2,044Depreciation And Amortisation (46) (52) (60) (65)Operating EBIT 744 1,195 1,782 1,979Total Financial Income/(Expense) (405) (501) (507) (511)Total Pretax Income/(Loss) from Assoc. 461 383 371 283Total Non-Operating Income/(Expense) 0 0 0 0Profit Before Tax (pre-EI) 800 1,077 1,647 1,750Exceptional Items 689 61 0 0Pre-tax Profit 1,490 1,137 1,647 1,750Taxation (202) (154) (236) (250)Exceptional Income - post-taxProfit After Tax 1,288 983 1,411 1,500Minority Interests (386) (269) (412) (438)Pref. & Special Div 0 0 0 0FX Gain/(Loss) - post taxOther Adjustments - post-taxNet Profit 902 714 999 1,062Recurring Net Profit 346 654 999 1,062Fully Diluted Recurring Net Profit 346 654 999 1,062
Balance Sheet
(S$m) Dec-12A Dec-13F Dec-14F Dec-15FTotal Cash And Equivalents 5,286 4,301 5,617 7,014Properties Under DevelopmentTotal Debtors 1,485 1,746 1,955 1,887Inventories 7,510 7,257 6,804 6,018Total Other Current Assets 413 531 661 689Total Current Assets 14,694 13,834 15,037 15,608Fixed Assets 1,264 1,361 1,452 1,537Total Investments 21,368 23,467 25,171 25,336Intangible Assets 462 607 705 689Total Other Non-Current Assets 0 0 0 0Total Non-current Assets 23,094 25,435 27,328 27,561Short-term Debt 782 770 802 777Current Portion of Long-Term DebtTotal Creditors 2,360 3,143 3,983 4,228Other Current Liabilities 432 524 652 679Total Current Liabilities 3,574 4,436 5,437 5,684Total Long-term Debt 13,398 13,190 13,744 13,309Hybrid Debt - Debt ComponentTotal Other Non-Current Liabilities 1,372 1,699 2,403 2,505Total Non-current Liabilities 14,770 14,890 16,147 15,814Total Provisions 0 0 0 0Total Liabilities 18,344 19,326 21,585 21,499Shareholders' Equity 15,080 15,468 16,117 16,808Minority Interests 4,363 4,475 4,663 4,863Total Equity 19,444 19,943 20,781 21,671
Cash Flow
(S$m) Dec-12A Dec-13F Dec-14F Dec-15FEBITDA 790 1,247 1,842 2,044Cash Flow from Invt. & Assoc.Change In Working Capital (160) 748 1,082 1,098Straight Line Adjustment(Incr)/Decr in Total ProvisionsOther Non-Cash (Income)/Expense (700) 110 195 294Other Operating Cashflow 471 (310) (395) (494)Net Interest (Paid)/Received 0 0 0 0Tax Paid (153) (117) (169) (179)Cashflow From Operations 249 1,679 2,555 2,763Capex (2,854) (2,565) (1,959) (1,579)Disposals Of FAs/subsidiaries 969 1,027 1,055 1,641Disposals of Investment PropertiesAcq. Of Subsidiaries/investments 0 0 0 0Other Investing Cashflow 0 0 0 0Cash Flow From Investing (1,886) (1,538) (904) 61Debt Raised/(repaid) 1,989 (220) 586 (460)Proceeds From Issue Of Shares (15) 0 0 0Shares Repurchased 0 0 0 0Dividends Paid (298) (327) (350) (372)Preferred DividendsOther Financing Cashflow (499) (580) (571) (595)Cash Flow From Financing 1,177 (1,127) (335) (1,428)
Key Ratios
Dec-12A Dec-13F Dec-14F Dec-15FRevenue Growth 14.5% 28.7% 24.4% 4.2%Operating EBITDA Growth (4.9%) 57.9% 47.7% 11.0%Operating EBITDA Margin 23.9% 29.4% 34.8% 37.1%Net Cash Per Share (S$) (2.09) (2.27) (2.10) (1.66)BVPS (S$) 3.55 3.64 3.79 3.95Gross Interest Cover 1.49 2.06 3.12 3.32Effective Tax Rate 13.6% 13.5% 14.3% 14.3%Net Dividend Payout Ratio 140% 50% 35% 35%Accounts Receivables Days 196.1 138.8 127.8 127.3Inventory Days 1,174 1,019 779 682Accounts Payables Days 364.7 379.6 395.0 436.7ROIC (%) 0.5% 10.9% 17.4% 21.8%ROCE (%) 2.71% 3.77% 5.33% 5.80%
Key Drivers
Dec-12A Dec-13F Dec-14F Dec-15FUnbooked Presales (m) (S$) N/A N/A N/A N/AUnbooked Presales (area: m sm) N/A N/A N/A N/AUnbooked Presales (units) N/A N/A N/A N/AUnsold attrib. landbank (area: m sm) N/A N/A N/A N/AGross Margins (%) N/A N/A N/A N/AContracted Sales ASP (per Sm) (S$) N/A N/A N/A N/AResidential EBIT Margin (%) N/A N/A N/A N/AInvestment rev / total rev (%) N/A N/A N/A N/AResidential rev / total rev (%) 39.4% 29.6% 45.2% 61.3%Invt. properties rental margin (%) 31.7% 25.7% 21.7% 21.7%SG&A / Sales Ratio (%) N/A N/A N/A N/A
SOURCE: CIMB, COMPANY REPORTS
RNAVRNAV (S$m)
% of GAV
China Resi 3,951 12%SIN Resi 2,414 7%Other Resi 335 1%Mixed D/CommercialChina 5,309 16%SIN 3,026 9%Others 1,524 5%Fund Management & Origination / Others 2,015 6%Listed vehicles 14,408 44%Group GAV (S$m) 32,982 100%Other adjustments 1,767Less: Adj net debt, OBS debt and devt capex (13,081)Group RNAV (S$m) 21,669Share base 4,250Group RNAV (S$ per share) 5.10
Target price-Disc/Prem to
RNAV -15% 4.33
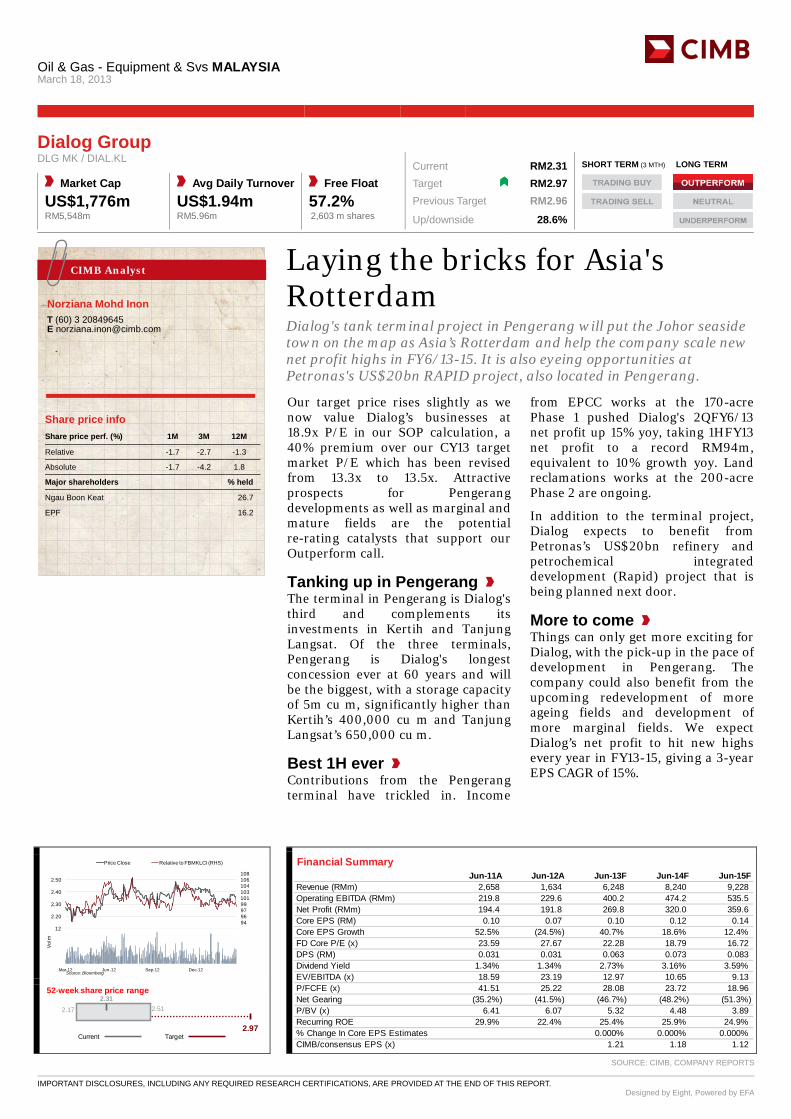
Oil & Gas - Equipment & Svs MALAYSIA
March 18, 2013
IMPORTANT DISCLOSURES, INCLUDING ANY REQUIRED RESEARCH CERTIFICATIONS, ARE PROVIDED AT THE END OF THIS REPORT. Designed by Eight, Powered by EFA
Laying the bricks for Asia's Rotterdam Dialog's tank terminal project in Pengerang will put the Johor seaside town on the map as Asia’s Rotterdam and help the company scale new net profit highs in FY6/13-15. It is also eyeing opportunities at Petronas's US$20bn RAPID project, also located in Pengerang. Our target price rises slightly as we now value Dialog’s businesses at 18.9x P/E in our SOP calculation, a 40% premium over our CY13 target market P/E which has been revised from 13.3x to 13.5x. Attractive prospects for Pengerang developments as well as marginal and mature fields are the potential re-rating catalysts that support our Outperform call.
Tanking up in Pengerang The terminal in Pengerang is Dialog's third and complements its investments in Kertih and Tanjung Langsat. Of the three terminals, Pengerang is Dialog's longest concession ever at 60 years and will be the biggest, with a storage capacity of 5m cu m, significantly higher than Kertih’s 400,000 cu m and Tanjung Langsat’s 650,000 cu m.
Best 1H ever Contributions from the Pengerang terminal have trickled in. Income
from EPCC works at the 170-acre Phase 1 pushed Dialog's 2QFY6/13 net profit up 15% yoy, taking 1HFY13 net profit to a record RM94m, equivalent to 10% growth yoy. Land reclamations works at the 200-acre Phase 2 are ongoing.
In addition to the terminal project, Dialog expects to benefit from Petronas’s US$20bn refinery and petrochemical integrated development (Rapid) project that is being planned next door.
More to come Things can only get more exciting for Dialog, with the pick-up in the pace of development in Pengerang. The company could also benefit from the upcoming redevelopment of more ageing fields and development of more marginal fields. We expect Dialog’s net profit to hit new highs every year in FY13-15, giving a 3-year EPS CAGR of 15%.
CIMB Analyst
Norziana Mohd Inon
T (60) 3 20849645 E [email protected]
Dialog Group DLG MK / DIAL.KL Current RM2.31 SHORT TERM (3 MTH) LONG TERM
Market Cap Avg Daily Turnover Free Float Target RM2.97 US$1,776m US$1.94m 57.2% Previous Target RM2.96 RM5,548m RM5.96m 2,603 m shares Up/downside 28.6%
Conviction| |
9294969799101103104106108
2.10
2.20
2.30
2.40
2.50
Price Close Relative to FBMKLCI (RHS)
Source: Bloomberg
2468
1012
Mar-12 Jun-12 Sep-12 Dec-12
Vol m
Financial Summary Jun-11A Jun-12A Jun-13F Jun-14F Jun-15F
Revenue (RMm) 2,658 1,634 6,248 8,240 9,228Operating EBITDA (RMm) 219.8 229.6 400.2 474.2 535.5Net Profit (RMm) 194.4 191.8 269.8 320.0 359.6Core EPS (RM) 0.10 0.07 0.10 0.12 0.14Core EPS Growth 52.5% (24.5%) 40.7% 18.6% 12.4%FD Core P/E (x) 23.59 27.67 22.28 18.79 16.72DPS (RM) 0.031 0.031 0.063 0.073 0.083Dividend Yield 1.34% 1.34% 2.73% 3.16% 3.59%EV/EBITDA (x) 18.59 23.19 12.97 10.65 9.13P/FCFE (x) 41.51 25.22 28.08 23.72 18.96Net Gearing (35.2%) (41.5%) (46.7%) (48.2%) (51.3%)P/BV (x) 6.41 6.07 5.32 4.48 3.89Recurring ROE 29.9% 22.4% 25.4% 25.9% 24.9%% Change In Core EPS Estimates 0.000% 0.000% 0.000%CIMB/consensus EPS (x) 1.21 1.18 1.12
2.31
2.97
2.17 2.51
Target
52-week share price range
Current
SOURCE: CIMB, COMPANY REPORTS
Share price info Share price perf. (%) 1M 3M 12M
Relative -1.7 -2.7 -1.3
Absolute -1.7 -4.2 1.8
Major shareholders % held
Ngau Boon Keat 26.7
EPF 16.2
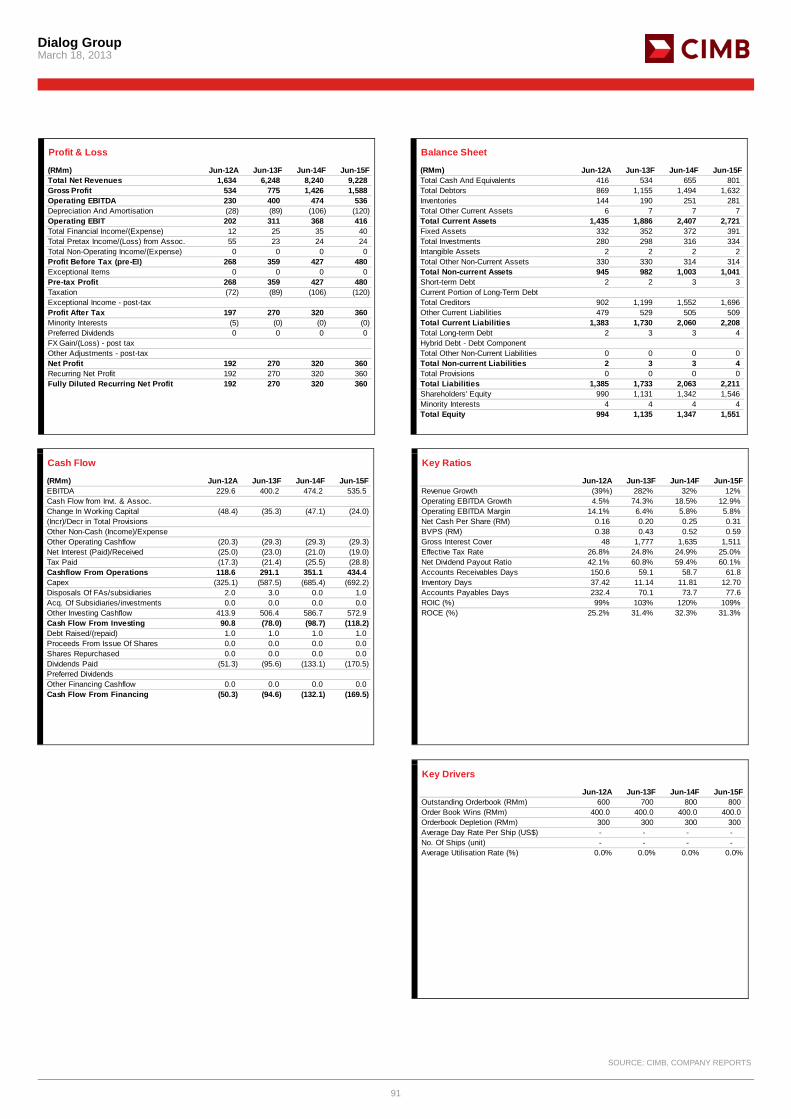
Dialog Group March 18, 2013
91
Profit & Loss
(RMm) Jun-12A Jun-13F Jun-14F Jun-15FTotal Net Revenues 1,634 6,248 8,240 9,228Gross Profit 534 775 1,426 1,588Operating EBITDA 230 400 474 536Depreciation And Amortisation (28) (89) (106) (120)Operating EBIT 202 311 368 416Total Financial Income/(Expense) 12 25 35 40Total Pretax Income/(Loss) from Assoc. 55 23 24 24Total Non-Operating Income/(Expense) 0 0 0 0Profit Before Tax (pre-EI) 268 359 427 480Exceptional Items 0 0 0 0Pre-tax Profit 268 359 427 480Taxation (72) (89) (106) (120)Exceptional Income - post-taxProfit After Tax 197 270 320 360Minority Interests (5) (0) (0) (0)Preferred Dividends 0 0 0 0FX Gain/(Loss) - post taxOther Adjustments - post-taxNet Profit 192 270 320 360Recurring Net Profit 192 270 320 360Fully Diluted Recurring Net Profit 192 270 320 360
Balance Sheet
(RMm) Jun-12A Jun-13F Jun-14F Jun-15FTotal Cash And Equivalents 416 534 655 801Total Debtors 869 1,155 1,494 1,632Inventories 144 190 251 281Total Other Current Assets 6 7 7 7Total Current Assets 1,435 1,886 2,407 2,721Fixed Assets 332 352 372 391Total Investments 280 298 316 334Intangible Assets 2 2 2 2Total Other Non-Current Assets 330 330 314 314Total Non-current Assets 945 982 1,003 1,041Short-term Debt 2 2 3 3Current Portion of Long-Term DebtTotal Creditors 902 1,199 1,552 1,696Other Current Liabilities 479 529 505 509Total Current Liabilities 1,383 1,730 2,060 2,208Total Long-term Debt 2 3 3 4Hybrid Debt - Debt ComponentTotal Other Non-Current Liabilities 0 0 0 0Total Non-current Liabilities 2 3 3 4Total Provisions 0 0 0 0Total Liabilities 1,385 1,733 2,063 2,211Shareholders' Equity 990 1,131 1,342 1,546Minority Interests 4 4 4 4Total Equity 994 1,135 1,347 1,551
Cash Flow
(RMm) Jun-12A Jun-13F Jun-14F Jun-15FEBITDA 229.6 400.2 474.2 535.5Cash Flow from Invt. & Assoc.Change In Working Capital (48.4) (35.3) (47.1) (24.0)(Incr)/Decr in Total ProvisionsOther Non-Cash (Income)/ExpenseOther Operating Cashflow (20.3) (29.3) (29.3) (29.3)Net Interest (Paid)/Received (25.0) (23.0) (21.0) (19.0)Tax Paid (17.3) (21.4) (25.5) (28.8)Cashflow From Operations 118.6 291.1 351.1 434.4Capex (325.1) (587.5) (685.4) (692.2)Disposals Of FAs/subsidiaries 2.0 3.0 0.0 1.0Acq. Of Subsidiaries/investments 0.0 0.0 0.0 0.0Other Investing Cashflow 413.9 506.4 586.7 572.9Cash Flow From Investing 90.8 (78.0) (98.7) (118.2)Debt Raised/(repaid) 1.0 1.0 1.0 1.0Proceeds From Issue Of Shares 0.0 0.0 0.0 0.0Shares Repurchased 0.0 0.0 0.0 0.0Dividends Paid (51.3) (95.6) (133.1) (170.5)Preferred DividendsOther Financing Cashflow 0.0 0.0 0.0 0.0Cash Flow From Financing (50.3) (94.6) (132.1) (169.5)
Key Ratios
Jun-12A Jun-13F Jun-14F Jun-15FRevenue Growth (39%) 282% 32% 12%Operating EBITDA Growth 4.5% 74.3% 18.5% 12.9%Operating EBITDA Margin 14.1% 6.4% 5.8% 5.8%Net Cash Per Share (RM) 0.16 0.20 0.25 0.31BVPS (RM) 0.38 0.43 0.52 0.59Gross Interest Cover 48 1,777 1,635 1,511Effective Tax Rate 26.8% 24.8% 24.9% 25.0%Net Dividend Payout Ratio 42.1% 60.8% 59.4% 60.1%Accounts Receivables Days 150.6 59.1 58.7 61.8Inventory Days 37.42 11.14 11.81 12.70Accounts Payables Days 232.4 70.1 73.7 77.6ROIC (%) 99% 103% 120% 109%ROCE (%) 25.2% 31.4% 32.3% 31.3%
Key Drivers
Jun-12A Jun-13F Jun-14F Jun-15FOutstanding Orderbook (RMm) 600 700 800 800 Order Book Wins (RMm) 400.0 400.0 400.0 400.0 Orderbook Depletion (RMm) 300 300 300 300 Average Day Rate Per Ship (US$) - - - - No. Of Ships (unit) - - - - Average Utilisation Rate (%) 0.0% 0.0% 0.0% 0.0%
SOURCE: CIMB, COMPANY REPORTS
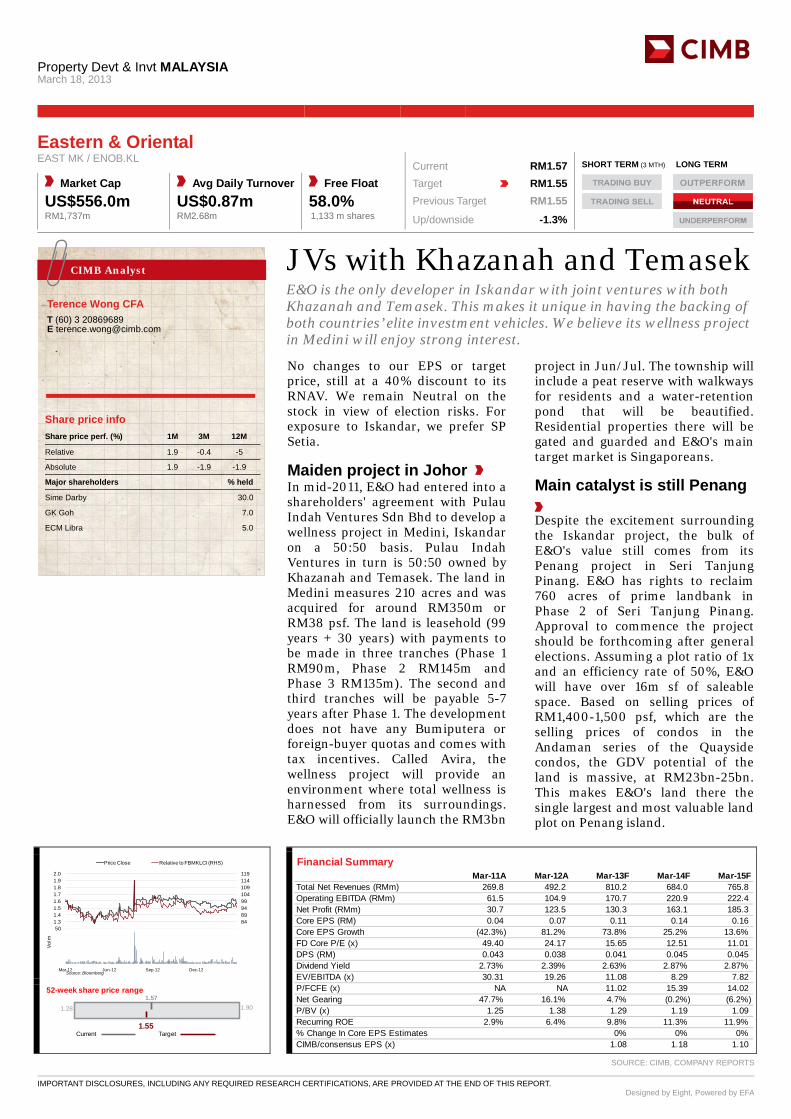
Property Devt & Invt MALAYSIA
March 18, 2013
IMPORTANT DISCLOSURES, INCLUDING ANY REQUIRED RESEARCH CERTIFICATIONS, ARE PROVIDED AT THE END OF THIS REPORT. Designed by Eight, Powered by EFA
JVs with Khazanah and Temasek E&O is the only developer in Iskandar with joint ventures with both Khazanah and Temasek. This makes it unique in having the backing of both countries’ elite investment vehicles. We believe its wellness project in Medini will enjoy strong interest. No changes to our EPS or target price, still at a 40% discount to its RNAV. We remain Neutral on the stock in view of election risks. For exposure to Iskandar, we prefer SP Setia.
Maiden project in Johor In mid-2011, E&O had entered into a shareholders' agreement with Pulau Indah Ventures Sdn Bhd to develop a wellness project in Medini, Iskandar on a 50:50 basis. Pulau Indah Ventures in turn is 50:50 owned by Khazanah and Temasek. The land in Medini measures 210 acres and was acquired for around RM350m or RM38 psf. The land is leasehold (99 years + 30 years) with payments to be made in three tranches (Phase 1 RM90m, Phase 2 RM145m and Phase 3 RM135m). The second and third tranches will be payable 5-7 years after Phase 1. The development does not have any Bumiputera or foreign-buyer quotas and comes with tax incentives. Called Avira, the wellness project will provide an environment where total wellness is harnessed from its surroundings. E&O will officially launch the RM3bn
project in Jun/Jul. The township will include a peat reserve with walkways for residents and a water-retention pond that will be beautified. Residential properties there will be gated and guarded and E&O's main target market is Singaporeans.
Main catalyst is still Penang
Despite the excitement surrounding the Iskandar project, the bulk of E&O's value still comes from its Penang project in Seri Tanjung Pinang. E&O has rights to reclaim 760 acres of prime landbank in Phase 2 of Seri Tanjung Pinang. Approval to commence the project should be forthcoming after general elections. Assuming a plot ratio of 1x and an efficiency rate of 50%, E&O will have over 16m sf of saleable space. Based on selling prices of RM1,400-1,500 psf, which are the selling prices of condos in the Andaman series of the Quayside condos, the GDV potential of the land is massive, at RM23bn-25bn. This makes E&O's land there the single largest and most valuable land plot on Penang island.
CIMB Analyst
Terence Wong CFA
T (60) 3 20869689 E [email protected]
Eastern & Oriental EAST MK / ENOB.KL Current RM1.57 SHORT TERM (3 MTH) LONG TERM
Market Cap Avg Daily Turnover Free Float Target RM1.55 US$556.0m US$0.87m 58.0% Previous Target RM1.55 RM1,737m RM2.68m 1,133 m shares Up/downside -1.3%
Conviction| |
7984899499104109114119
1.21.31.41.51.61.71.81.92.0
Price Close Relative to FBMKLCI (RHS)
Source: Bloomberg
1020304050
Mar-12 Jun-12 Sep-12 Dec-12
Vol m
Financial Summary Mar-11A Mar-12A Mar-13F Mar-14F Mar-15F
Total Net Revenues (RMm) 269.8 492.2 810.2 684.0 765.8Operating EBITDA (RMm) 61.5 104.9 170.7 220.9 222.4Net Profit (RMm) 30.7 123.5 130.3 163.1 185.3Core EPS (RM) 0.04 0.07 0.11 0.14 0.16Core EPS Growth (42.3%) 81.2% 73.8% 25.2% 13.6%FD Core P/E (x) 49.40 24.17 15.65 12.51 11.01DPS (RM) 0.043 0.038 0.041 0.045 0.045Dividend Yield 2.73% 2.39% 2.63% 2.87% 2.87%EV/EBITDA (x) 30.31 19.26 11.08 8.29 7.82P/FCFE (x) NA NA 11.02 15.39 14.02Net Gearing 47.7% 16.1% 4.7% (0.2%) (6.2%)P/BV (x) 1.25 1.38 1.29 1.19 1.09Recurring ROE 2.9% 6.4% 9.8% 11.3% 11.9%% Change In Core EPS Estimates 0% 0% 0%CIMB/consensus EPS (x) 1.08 1.18 1.10
1.57
1.55
1.28 1.90
Target
52-week share price range
Current
SOURCE: CIMB, COMPANY REPORTS
Share price info Share price perf. (%) 1M 3M 12M
Relative 1.9 -0.4 -5
Absolute 1.9 -1.9 -1.9
Major shareholders % held
Sime Darby 30.0
GK Goh 7.0
ECM Libra 5.0

Eastern & Oriental March 18, 2013
93
Profit & Loss
(RMm) Mar-12A Mar-13F Mar-14F Mar-15FTotal Net Revenues 492.2 810.2 684.0 765.8Gross Profit 171.9 286.7 301.5 318.9Operating EBITDA 104.9 170.7 220.9 222.4Depreciation And Amortisation (13.0) (14.9) (15.1) (15.3)Operating EBIT 91.8 155.8 205.8 207.2Total Financial Income/(Expense) (19.9) (12.2) (9.8) (7.9)Total Pretax Income/(Loss) from Assoc. 34.2 46.2 34.9 63.2Total Non-Operating Income/(Expense) 0.0 0.0 0.0 0.0Profit Before Tax (pre-EI) 106.2 189.8 231.0 262.4Exceptional Items 65.1 0.0 0.0 0.0Pre-tax Profit 171.3 189.8 231.0 262.4Taxation (43.4) (47.4) (57.7) (65.6)Exceptional Income - post-taxProfit After Tax 127.9 142.3 173.2 196.8Minority Interests (4.4) (12.0) (10.2) (11.5)Pref. & Special Div 0.0 0.0 0.0 0.0FX Gain/(Loss) - post taxOther Adjustments - post-taxNet Profit 123.5 130.3 163.1 185.3Recurring Net Profit 74.8 130.3 163.1 185.3Fully Diluted Recurring Net Profit 74.8 130.3 163.1 185.3
Balance Sheet
(RMm) Mar-12A Mar-13F Mar-14F Mar-15FTotal Cash And Equivalents 393 584 705 863Properties Under DevelopmentTotal Debtors 123 108 91 102Inventories 38 38 38 38Total Other Current Assets 298 328 360 396Total Current Assets 852 1,058 1,194 1,399Fixed Assets 297 287 277 266Total Investments 80 80 80 80Intangible Assets 0 0 0 0Total Other Non-Current Assets 953 986 1,021 1,057Total Non-current Assets 1,329 1,353 1,378 1,404Short-term Debt 277 290 305 320Current Portion of Long-Term DebtTotal Creditors 198 273 243 263Other Current Liabilities 13 14 17 20Total Current Liabilities 487 578 565 602Total Long-term Debt 328 361 397 437Hybrid Debt - Debt ComponentTotal Other Non-Current Liabilities 0 0 0 0Total Non-current Liabilities 329 361 397 437Total Provisions 47 52 63 72Total Liabilities 864 991 1,026 1,111Shareholders' Equity 1,289 1,379 1,495 1,629Minority Interests 29 41 51 62Total Equity 1,318 1,420 1,546 1,692
Cash Flow
(RMm) Mar-12A Mar-13F Mar-14F Mar-15FEBITDA 104.9 170.7 220.9 222.4Cash Flow from Invt. & Assoc.Change In Working Capital 77.8 60.5 (45.8) (27.6)Straight Line Adjustment(Incr)/Decr in Total ProvisionsOther Non-Cash (Income)/ExpenseOther Operating Cashflow 0.0 0.0 0.0 0.0Net Interest (Paid)/Received (19.9) (12.2) (9.8) (7.9)Tax Paid (38.8) (41.8) (43.4) (54.7)Cashflow From Operations 124.0 177.2 122.0 132.3Capex (49.0) (5.0) (5.0) (5.0)Disposals Of FAs/subsidiaries 21.8 0.0 0.0 0.0Disposals of Investment PropertiesAcq. Of Subsidiaries/investments 0.0 (33.3) (35.0) (36.7)Other Investing Cashflow 17.0 0.0 0.0 0.0Cash Flow From Investing (10.2) (38.3) (40.0) (41.7)Debt Raised/(repaid) (220.2) 46.2 50.6 55.0Proceeds From Issue Of Shares 117.1 2.2 0.0 0.0Shares Repurchased 0.0 0.0 0.0 0.0Dividends Paid (36.1) (42.6) (46.8) (51.1)Preferred DividendsOther Financing Cashflow 109.4 46.2 34.9 63.2Cash Flow From Financing (29.8) 52.0 38.7 67.0
Key Ratios
Mar-12A Mar-13F Mar-14F Mar-15FRevenue Growth 82.4% 64.6% (15.6%) 12.0%Operating EBITDA Growth 70.6% 62.8% 29.4% 0.7%Operating EBITDA Margin 21.3% 21.1% 32.3% 29.0%Net Cash Per Share (RM) (0.19) (0.06) 0.00 0.09BVPS (RM) 1.14 1.21 1.32 1.43Gross Interest Cover 3.05 5.89 7.22 6.74Effective Tax Rate 25.3% 25.0% 25.0% 25.0%Net Dividend Payout Ratio 61.9% 32.7% 28.7% 27.6%Accounts Receivables Days 97.4 47.1 46.5 40.3Inventory Days 43.60 26.46 36.21 30.99Accounts Payables Days 88.5 107.5 168.8 140.2ROIC (%) 4.3% 7.8% 10.6% 10.2%ROCE (%) 5.2% 8.3% 10.1% 9.5%
Key Drivers
Mar-12A Mar-13F Mar-14F Mar-15FUnbooked Presales (m) (RM) N/A N/A N/A N/AUnbooked Presales (area: m sm) N/A N/A N/A N/AUnbooked Presales (units) N/A N/A N/A N/AUnsold attrib. landbank (area: m sm) 5.8 5.7 5.6 5.5 Gross Margins (%) 21.3% 21.1% 32.3% 29.0%Contracted Sales ASP (per Sm) (RM) N/A N/A N/A N/AResidential EBIT Margin (%) 15.0% 30.2% 38.9% 37.2%Investment rev / total rev (%) N/A N/A N/A N/AResidential rev / total rev (%) N/A N/A N/A N/AInvt. properties rental margin (%) N/A N/A N/A N/ASG&A / Sales Ratio (%) N/A N/A N/A N/A
SOURCE: CIMB, COMPANY REPORTS
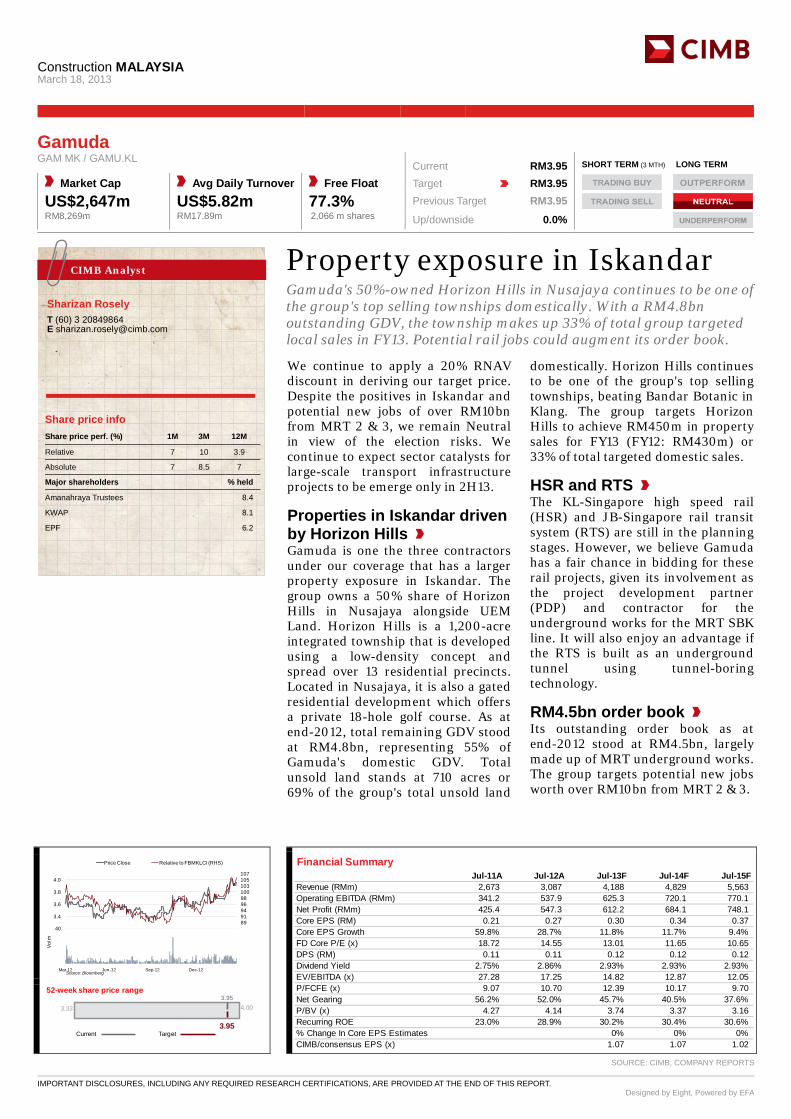
Construction MALAYSIA
March 18, 2013
IMPORTANT DISCLOSURES, INCLUDING ANY REQUIRED RESEARCH CERTIFICATIONS, ARE PROVIDED AT THE END OF THIS REPORT. Designed by Eight, Powered by EFA
Property exposure in Iskandar Gamuda's 50%-owned Horizon Hills in Nusajaya continues to be one of the group's top selling townships domestically. With a RM4.8bn outstanding GDV, the township makes up 33% of total group targeted local sales in FY13. Potential rail jobs could augment its order book. We continue to apply a 20% RNAV discount in deriving our target price. Despite the positives in Iskandar and potential new jobs of over RM10bn from MRT 2 & 3, we remain Neutral in view of the election risks. We continue to expect sector catalysts for large-scale transport infrastructure projects to be emerge only in 2H13.
Properties in Iskandar driven by Horizon Hills Gamuda is one the three contractors under our coverage that has a larger property exposure in Iskandar. The group owns a 50% share of Horizon Hills in Nusajaya alongside UEM Land. Horizon Hills is a 1,200-acre integrated township that is developed using a low-density concept and spread over 13 residential precincts. Located in Nusajaya, it is also a gated residential development which offers a private 18-hole golf course. As at end-2012, total remaining GDV stood at RM4.8bn, representing 55% of Gamuda's domestic GDV. Total unsold land stands at 710 acres or 69% of the group's total unsold land
domestically. Horizon Hills continues to be one of the group's top selling townships, beating Bandar Botanic in Klang. The group targets Horizon Hills to achieve RM450m in property sales for FY13 (FY12: RM430m) or 33% of total targeted domestic sales.
HSR and RTS The KL-Singapore high speed rail (HSR) and JB-Singapore rail transit system (RTS) are still in the planning stages. However, we believe Gamuda has a fair chance in bidding for these rail projects, given its involvement as the project development partner (PDP) and contractor for the underground works for the MRT SBK line. It will also enjoy an advantage if the RTS is built as an underground tunnel using tunnel-boring technology.
RM4.5bn order book Its outstanding order book as at end-2012 stood at RM4.5bn, largely made up of MRT underground works. The group targets potential new jobs worth over RM10bn from MRT 2 & 3.
CIMB Analyst
Sharizan Rosely
T (60) 3 20849864 E [email protected]
Gamuda GAM MK / GAMU.KL Current RM3.95 SHORT TERM (3 MTH) LONG TERM
Market Cap Avg Daily Turnover Free Float Target RM3.95 US$2,647m US$5.82m 77.3% Previous Target RM3.95 RM8,269m RM17.89m 2,066 m shares Up/downside 0.0%
Conviction| |
878991949698100103105107
3.2
3.4
3.6
3.8
4.0
Price Close Relative to FBMKLCI (RHS)
Source: Bloomberg
10
20
30
40
Mar-12 Jun-12 Sep-12 Dec-12
Vol m
Financial Summary Jul-11A Jul-12A Jul-13F Jul-14F Jul-15F
Revenue (RMm) 2,673 3,087 4,188 4,829 5,563Operating EBITDA (RMm) 341.2 537.9 625.3 720.1 770.1Net Profit (RMm) 425.4 547.3 612.2 684.1 748.1Core EPS (RM) 0.21 0.27 0.30 0.34 0.37Core EPS Growth 59.8% 28.7% 11.8% 11.7% 9.4%FD Core P/E (x) 18.72 14.55 13.01 11.65 10.65DPS (RM) 0.11 0.11 0.12 0.12 0.12Dividend Yield 2.75% 2.86% 2.93% 2.93% 2.93%EV/EBITDA (x) 27.28 17.25 14.82 12.87 12.05P/FCFE (x) 9.07 10.70 12.39 10.17 9.70Net Gearing 56.2% 52.0% 45.7% 40.5% 37.6%P/BV (x) 4.27 4.14 3.74 3.37 3.16Recurring ROE 23.0% 28.9% 30.2% 30.4% 30.6%% Change In Core EPS Estimates 0% 0% 0%CIMB/consensus EPS (x) 1.07 1.07 1.02
3.95
3.95
3.33 4.00
Target
52-week share price range
Current
SOURCE: CIMB, COMPANY REPORTS
Share price info Share price perf. (%) 1M 3M 12M
Relative 7 10 3.9
Absolute 7 8.5 7
Major shareholders % held
Amanahraya Trustees 8.4
KWAP 8.1
EPF 6.2

Gamuda March 18, 2013
95
Profit & Loss
(RMm) Jul-12A Jul-13F Jul-14F Jul-15FTotal Net Revenues 3,087 4,188 4,829 5,563Gross Profit 3,087 4,188 4,829 5,563Operating EBITDA 538 625 720 770Depreciation And Amortisation (20) (20) (21) (21)Operating EBIT 518 605 699 749Total Financial Income/(Expense) (17) (20) (19) (19)Total Pretax Income/(Loss) from Assoc. 206 204 200 230Total Non-Operating Income/(Expense) 0 0 0 0Profit Before Tax (pre-EI) 707 790 880 960Exceptional Items 0 0 0 0Pre-tax Profit 707 790 880 960Taxation (141) (158) (176) (192)Exceptional Income - post-taxProfit After Tax 566 632 704 768Minority Interests (19) (20) (20) (20)Preferred Dividends 0 0 0 0FX Gain/(Loss) - post taxOther Adjustments - post-taxNet Profit 547 612 684 748Recurring Net Profit 547 612 684 748Fully Diluted Recurring Net Profit 547 612 684 748
Balance Sheet
(RMm) Jul-12A Jul-13F Jul-14F Jul-15FTotal Cash And Equivalents 644 612 581 552Total Debtors 1,825 2,201 2,493 2,828Inventories 72 90 103 119Total Other Current Assets 289 289 289 289Total Current Assets 2,830 3,192 3,467 3,788Fixed Assets 24 5 84 63Total Investments 85 80 72 64Intangible Assets 18 18 18 17Total Other Non-Current Assets 1,872 1,872 1,872 1,872Total Non-current Assets 2,000 1,975 2,046 2,017Short-term Debt 320 256 205 164Current Portion of Long-Term DebtTotal Creditors 247 306 354 407Other Current Liabilities 636 747 837 938Total Current Liabilities 1,203 1,309 1,396 1,509Total Long-term Debt 1,437 1,437 1,437 1,437Hybrid Debt - Debt ComponentTotal Other Non-Current Liabilities 50 55 61 67Total Non-current Liabilities 1,487 1,492 1,497 1,503Total Provisions 0 0 0 0Total Liabilities 2,690 2,801 2,893 3,013Shareholders' Equity 1,925 2,131 2,366 2,518Minority Interests 215 235 254 274Total Equity 2,140 2,366 2,620 2,792
Cash Flow
(RMm) Jul-12A Jul-13F Jul-14F Jul-15FEBITDA 538 625 720 770Cash Flow from Invt. & Assoc.Change In Working Capital (42) (202) (148) (177)(Incr)/Decr in Total ProvisionsOther Non-Cash (Income)/ExpenseOther Operating Cashflow 250 251 251 251Net Interest (Paid)/Received 0 0 0 0Tax Paid (129) (151) (168) (184)Cashflow From Operations 616 523 654 660Capex (14) (14) (14) (14)Disposals Of FAs/subsidiaries 222 197 194 215Acq. Of Subsidiaries/investments 0 0 0 0Other Investing Cashflow 0 0 0 0Cash Flow From Investing 208 183 180 202Debt Raised/(repaid) (80) (64) (51) (41)Proceeds From Issue Of Shares 0 0 0 0Shares Repurchased 0 0 0 0Dividends Paid (86) (86) (86) (86)Preferred DividendsOther Financing Cashflow (692) (589) (727) (764)Cash Flow From Financing (858) (739) (865) (891)
Key Ratios
Jul-12A Jul-13F Jul-14F Jul-15FRevenue Growth 15.5% 35.7% 15.3% 15.2%Operating EBITDA Growth 57.7% 16.3% 15.2% 7.0%Operating EBITDA Margin 17.4% 14.9% 14.9% 13.8%Net Cash Per Share (RM) (0.55) (0.54) (0.53) (0.52)BVPS (RM) 0.95 1.06 1.17 1.25Gross Interest Cover 8.30 15.03 17.98 19.80Effective Tax Rate 20.0% 20.0% 20.0% 20.0%Net Dividend Payout Ratio 41.6% 38.1% 34.1% 31.2%Accounts Receivables Days 201.0 174.6 176.6 173.8Inventory Days N/A N/A N/A N/AAccounts Payables Days N/A N/A N/A N/AROIC (%) 16.3% 18.8% 20.4% 20.4%ROCE (%) 14.5% 15.7% 17.3% 17.7%
Key Drivers
(RMm) Jul-12A Jul-13F Jul-14F Jul-15FOutstanding Orderbook 6,100 6,600 7,100 7,600 Orderbook Depletion 1,000 1,000 1,000 1,000 Orderbook Replenishment 1,500 1,500 1,500 1,500 ASP (% chg, main prod./serv.) N/A N/A N/A N/AUnit sales grth (%, main prod./serv.) N/A N/A N/A N/AUtil. rate (%, main prod./serv.) N/A N/A N/A N/AASP (% chg, 2ndary prod./serv.) N/A N/A N/A N/AUnit sales grth (%,2ndary prod/serv) N/A N/A N/A N/AUtil. rate (%, 2ndary prod/serv) N/A N/A N/A N/A
SOURCE: CIMB, COMPANY REPORTS
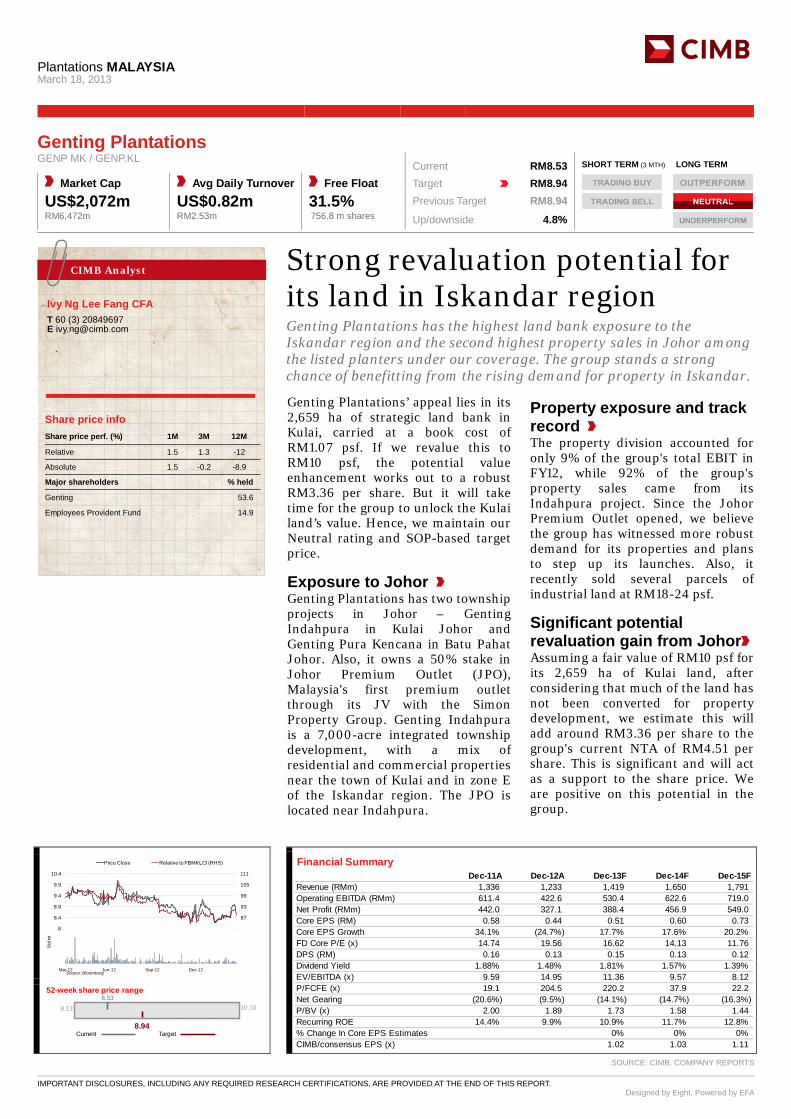
Plantations MALAYSIA
March 18, 2013
IMPORTANT DISCLOSURES, INCLUDING ANY REQUIRED RESEARCH CERTIFICATIONS, ARE PROVIDED AT THE END OF THIS REPORT. Designed by Eight, Powered by EFA
Strong revaluation potential for its land in Iskandar region Genting Plantations has the highest land bank exposure to the Iskandar region and the second highest property sales in Johor among the listed planters under our coverage. The group stands a strong chance of benefitting from the rising demand for property in Iskandar. Genting Plantations’ appeal lies in its 2,659 ha of strategic land bank in Kulai, carried at a book cost of RM1.07 psf. If we revalue this to RM10 psf, the potential value enhancement works out to a robust RM3.36 per share. But it will take time for the group to unlock the Kulai land’s value. Hence, we maintain our Neutral rating and SOP-based target price.
Exposure to Johor Genting Plantations has two township projects in Johor – Genting Indahpura in Kulai Johor and Genting Pura Kencana in Batu Pahat Johor. Also, it owns a 50% stake in Johor Premium Outlet (JPO), Malaysia's first premium outlet through its JV with the Simon Property Group. Genting Indahpura is a 7,000-acre integrated township development, with a mix of residential and commercial properties near the town of Kulai and in zone E of the Iskandar region. The JPO is located near Indahpura.
Property exposure and track record The property division accounted for only 9% of the group's total EBIT in FY12, while 92% of the group's property sales came from its Indahpura project. Since the Johor Premium Outlet opened, we believe the group has witnessed more robust demand for its properties and plans to step up its launches. Also, it recently sold several parcels of industrial land at RM18-24 psf.
Significant potential revaluation gain from Johor Assuming a fair value of RM10 psf for its 2,659 ha of Kulai land, after considering that much of the land has not been converted for property development, we estimate this will add around RM3.36 per share to the group's current NTA of RM4.51 per share. This is significant and will act as a support to the share price. We are positive on this potential in the group.
CIMB Analyst
Ivy Ng Lee Fang CFA
T 60 (3) 20849697 E [email protected]
Genting Plantations GENP MK / GENP.KL Current RM8.53 SHORT TERM (3 MTH) LONG TERM
Market Cap Avg Daily Turnover Free Float Target RM8.94 US$2,072m US$0.82m 31.5% Previous Target RM8.94 RM6,472m RM2.53m 756.8 m shares Up/downside 4.8%
Conviction| |
81
87
93
99
105
111
7.9
8.4
8.9
9.4
9.9
10.4
Price Close Relative to FBMKLCI (RHS)
Source: Bloomberg
2
4
6
8
Mar-12 Jun-12 Sep-12 Dec-12
Vol m
Financial Summary Dec-11A Dec-12A Dec-13F Dec-14F Dec-15F
Revenue (RMm) 1,336 1,233 1,419 1,650 1,791Operating EBITDA (RMm) 611.4 422.6 530.4 622.6 719.0Net Profit (RMm) 442.0 327.1 388.4 456.9 549.0Core EPS (RM) 0.58 0.44 0.51 0.60 0.73Core EPS Growth 34.1% (24.7%) 17.7% 17.6% 20.2%FD Core P/E (x) 14.74 19.56 16.62 14.13 11.76DPS (RM) 0.16 0.13 0.15 0.13 0.12Dividend Yield 1.88% 1.48% 1.81% 1.57% 1.39%EV/EBITDA (x) 9.59 14.95 11.36 9.57 8.12P/FCFE (x) 19.1 204.5 220.2 37.9 22.2Net Gearing (20.6%) (9.5%) (14.1%) (14.7%) (16.3%)P/BV (x) 2.00 1.89 1.73 1.58 1.44Recurring ROE 14.4% 9.9% 10.9% 11.7% 12.8%% Change In Core EPS Estimates 0% 0% 0%CIMB/consensus EPS (x) 1.02 1.03 1.11
8.53
8.94
8.13 10.10
Target
52-week share price range
Current
SOURCE: CIMB, COMPANY REPORTS
Share price info Share price perf. (%) 1M 3M 12M
Relative 1.5 1.3 -12
Absolute 1.5 -0.2 -8.9
Major shareholders % held
Genting 53.6
Employees Provident Fund 14.9
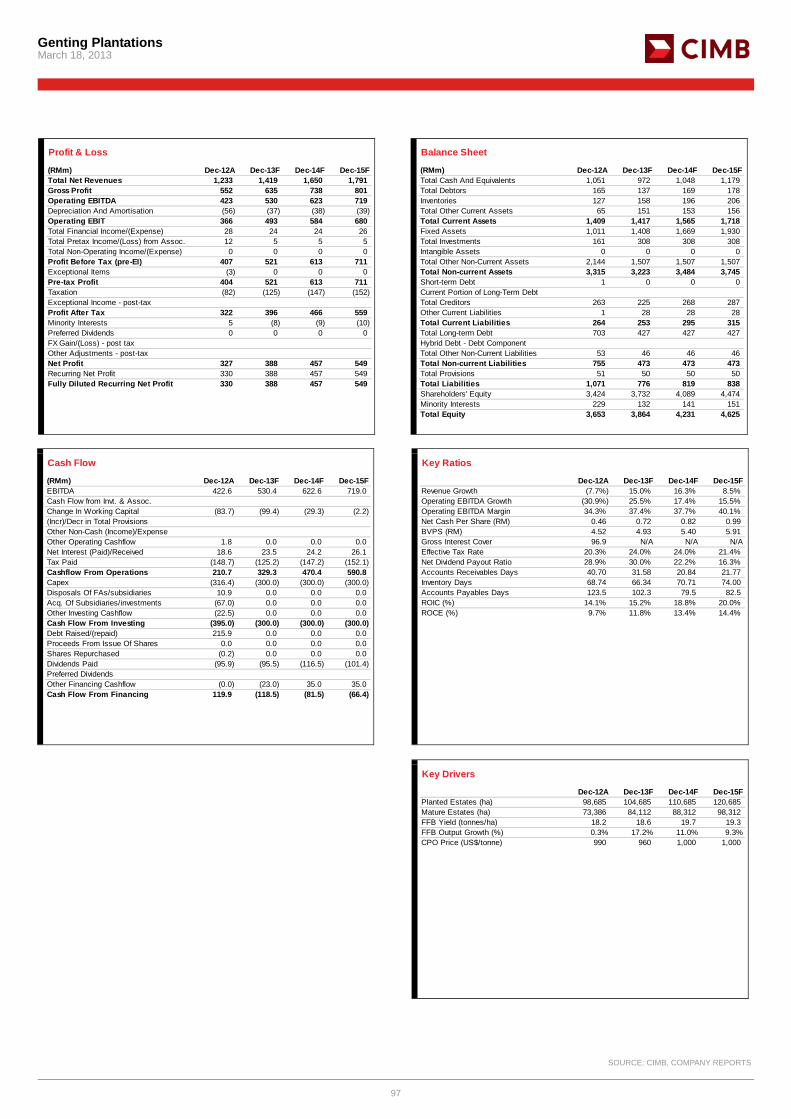
Genting Plantations March 18, 2013
97
Profit & Loss
(RMm) Dec-12A Dec-13F Dec-14F Dec-15FTotal Net Revenues 1,233 1,419 1,650 1,791Gross Profit 552 635 738 801Operating EBITDA 423 530 623 719Depreciation And Amortisation (56) (37) (38) (39)Operating EBIT 366 493 584 680Total Financial Income/(Expense) 28 24 24 26Total Pretax Income/(Loss) from Assoc. 12 5 5 5Total Non-Operating Income/(Expense) 0 0 0 0Profit Before Tax (pre-EI) 407 521 613 711Exceptional Items (3) 0 0 0Pre-tax Profit 404 521 613 711Taxation (82) (125) (147) (152)Exceptional Income - post-taxProfit After Tax 322 396 466 559Minority Interests 5 (8) (9) (10)Preferred Dividends 0 0 0 0FX Gain/(Loss) - post taxOther Adjustments - post-taxNet Profit 327 388 457 549Recurring Net Profit 330 388 457 549Fully Diluted Recurring Net Profit 330 388 457 549
Balance Sheet
(RMm) Dec-12A Dec-13F Dec-14F Dec-15FTotal Cash And Equivalents 1,051 972 1,048 1,179Total Debtors 165 137 169 178Inventories 127 158 196 206Total Other Current Assets 65 151 153 156Total Current Assets 1,409 1,417 1,565 1,718Fixed Assets 1,011 1,408 1,669 1,930Total Investments 161 308 308 308Intangible Assets 0 0 0 0Total Other Non-Current Assets 2,144 1,507 1,507 1,507Total Non-current Assets 3,315 3,223 3,484 3,745Short-term Debt 1 0 0 0Current Portion of Long-Term DebtTotal Creditors 263 225 268 287Other Current Liabilities 1 28 28 28Total Current Liabilities 264 253 295 315Total Long-term Debt 703 427 427 427Hybrid Debt - Debt ComponentTotal Other Non-Current Liabilities 53 46 46 46Total Non-current Liabilities 755 473 473 473Total Provisions 51 50 50 50Total Liabilities 1,071 776 819 838Shareholders' Equity 3,424 3,732 4,089 4,474Minority Interests 229 132 141 151Total Equity 3,653 3,864 4,231 4,625
Cash Flow
(RMm) Dec-12A Dec-13F Dec-14F Dec-15FEBITDA 422.6 530.4 622.6 719.0Cash Flow from Invt. & Assoc.Change In Working Capital (83.7) (99.4) (29.3) (2.2)(Incr)/Decr in Total ProvisionsOther Non-Cash (Income)/ExpenseOther Operating Cashflow 1.8 0.0 0.0 0.0Net Interest (Paid)/Received 18.6 23.5 24.2 26.1Tax Paid (148.7) (125.2) (147.2) (152.1)Cashflow From Operations 210.7 329.3 470.4 590.8Capex (316.4) (300.0) (300.0) (300.0)Disposals Of FAs/subsidiaries 10.9 0.0 0.0 0.0Acq. Of Subsidiaries/investments (67.0) 0.0 0.0 0.0Other Investing Cashflow (22.5) 0.0 0.0 0.0Cash Flow From Investing (395.0) (300.0) (300.0) (300.0)Debt Raised/(repaid) 215.9 0.0 0.0 0.0Proceeds From Issue Of Shares 0.0 0.0 0.0 0.0Shares Repurchased (0.2) 0.0 0.0 0.0Dividends Paid (95.9) (95.5) (116.5) (101.4)Preferred DividendsOther Financing Cashflow (0.0) (23.0) 35.0 35.0Cash Flow From Financing 119.9 (118.5) (81.5) (66.4)
Key Ratios
Dec-12A Dec-13F Dec-14F Dec-15FRevenue Growth (7.7%) 15.0% 16.3% 8.5%Operating EBITDA Growth (30.9%) 25.5% 17.4% 15.5%Operating EBITDA Margin 34.3% 37.4% 37.7% 40.1%Net Cash Per Share (RM) 0.46 0.72 0.82 0.99BVPS (RM) 4.52 4.93 5.40 5.91Gross Interest Cover 96.9 N/A N/A N/AEffective Tax Rate 20.3% 24.0% 24.0% 21.4%Net Dividend Payout Ratio 28.9% 30.0% 22.2% 16.3%Accounts Receivables Days 40.70 31.58 20.84 21.77Inventory Days 68.74 66.34 70.71 74.00Accounts Payables Days 123.5 102.3 79.5 82.5ROIC (%) 14.1% 15.2% 18.8% 20.0%ROCE (%) 9.7% 11.8% 13.4% 14.4%
Key Drivers
Dec-12A Dec-13F Dec-14F Dec-15FPlanted Estates (ha) 98,685 104,685 110,685 120,685 Mature Estates (ha) 73,386 84,112 88,312 98,312 FFB Yield (tonnes/ha) 18.2 18.6 19.7 19.3 FFB Output Growth (%) 0.3% 17.2% 11.0% 9.3%CPO Price (US$/tonne) 990 960 1,000 1,000
SOURCE: CIMB, COMPANY REPORTS
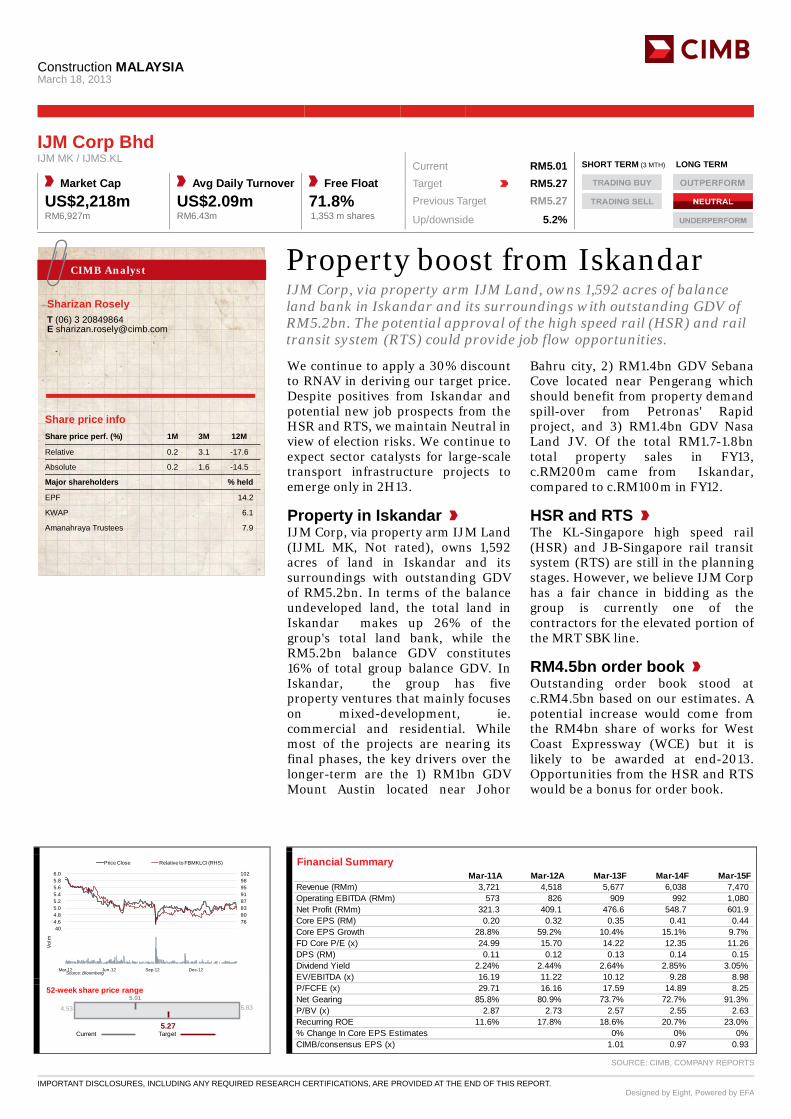
Construction MALAYSIA
March 18, 2013
IMPORTANT DISCLOSURES, INCLUDING ANY REQUIRED RESEARCH CERTIFICATIONS, ARE PROVIDED AT THE END OF THIS REPORT. Designed by Eight, Powered by EFA
Property boost from Iskandar IJM Corp, via property arm IJM Land, owns 1,592 acres of balance land bank in Iskandar and its surroundings with outstanding GDV of RM5.2bn. The potential approval of the high speed rail (HSR) and rail transit system (RTS) could provide job flow opportunities. We continue to apply a 30% discount to RNAV in deriving our target price. Despite positives from Iskandar and potential new job prospects from the HSR and RTS, we maintain Neutral in view of election risks. We continue to expect sector catalysts for large-scale transport infrastructure projects to emerge only in 2H13.
Property in Iskandar IJM Corp, via property arm IJM Land (IJML MK, Not rated), owns 1,592 acres of land in Iskandar and its surroundings with outstanding GDV of RM5.2bn. In terms of the balance undeveloped land, the total land in Iskandar makes up 26% of the group's total land bank, while the RM5.2bn balance GDV constitutes 16% of total group balance GDV. In Iskandar, the group has five property ventures that mainly focuses on mixed-development, ie. commercial and residential. While most of the projects are nearing its final phases, the key drivers over the longer-term are the 1) RM1bn GDV Mount Austin located near Johor
Bahru city, 2) RM1.4bn GDV Sebana Cove located near Pengerang which should benefit from property demand spill-over from Petronas' Rapid project, and 3) RM1.4bn GDV Nasa Land JV. Of the total RM1.7-1.8bn total property sales in FY13, c.RM200m came from Iskandar, compared to c.RM100m in FY12.
HSR and RTS The KL-Singapore high speed rail (HSR) and JB-Singapore rail transit system (RTS) are still in the planning stages. However, we believe IJM Corp has a fair chance in bidding as the group is currently one of the contractors for the elevated portion of the MRT SBK line.
RM4.5bn order book Outstanding order book stood at c.RM4.5bn based on our estimates. A potential increase would come from the RM4bn share of works for West Coast Expressway (WCE) but it is likely to be awarded at end-2013. Opportunities from the HSR and RTS would be a bonus for order book.
CIMB Analyst
Sharizan Rosely
T (06) 3 20849864 E [email protected]
IJM Corp Bhd IJM MK / IJMS.KL Current RM5.01 SHORT TERM (3 MTH) LONG TERM
Market Cap Avg Daily Turnover Free Float Target RM5.27 US$2,218m US$2.09m 71.8% Previous Target RM5.27 RM6,927m RM6.43m 1,353 m shares Up/downside 5.2%
Conviction| |
7276808387919598102
4.44.64.85.05.25.45.65.86.0
Price Close Relative to FBMKLCI (RHS)
Source: Bloomberg
10
20
30
40
Mar-12 Jun-12 Sep-12 Dec-12
Vol m
Financial Summary Mar-11A Mar-12A Mar-13F Mar-14F Mar-15F
Revenue (RMm) 3,721 4,518 5,677 6,038 7,470Operating EBITDA (RMm) 573 826 909 992 1,080Net Profit (RMm) 321.3 409.1 476.6 548.7 601.9Core EPS (RM) 0.20 0.32 0.35 0.41 0.44Core EPS Growth 28.8% 59.2% 10.4% 15.1% 9.7%FD Core P/E (x) 24.99 15.70 14.22 12.35 11.26DPS (RM) 0.11 0.12 0.13 0.14 0.15Dividend Yield 2.24% 2.44% 2.64% 2.85% 3.05%EV/EBITDA (x) 16.19 11.22 10.12 9.28 8.98P/FCFE (x) 29.71 16.16 17.59 14.89 8.25Net Gearing 85.8% 80.9% 73.7% 72.7% 91.3%P/BV (x) 2.87 2.73 2.57 2.55 2.63Recurring ROE 11.6% 17.8% 18.6% 20.7% 23.0%% Change In Core EPS Estimates 0% 0% 0%CIMB/consensus EPS (x) 1.01 0.97 0.93
5.01
5.27
4.53 5.83
Target
52-week share price range
Current
SOURCE: CIMB, COMPANY REPORTS
Share price info Share price perf. (%) 1M 3M 12M
Relative 0.2 3.1 -17.6
Absolute 0.2 1.6 -14.5
Major shareholders % held
EPF 14.2
KWAP 6.1
Amanahraya Trustees 7.9
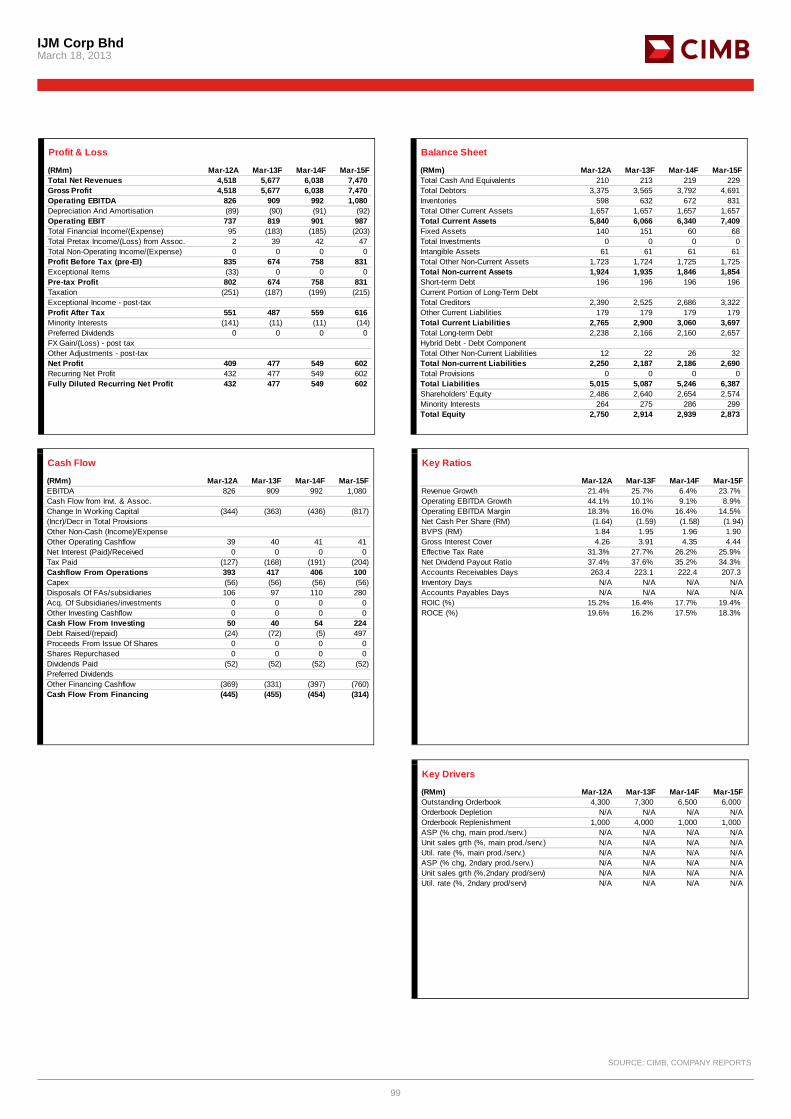
IJM Corp Bhd March 18, 2013
99
Profit & Loss
(RMm) Mar-12A Mar-13F Mar-14F Mar-15FTotal Net Revenues 4,518 5,677 6,038 7,470Gross Profit 4,518 5,677 6,038 7,470Operating EBITDA 826 909 992 1,080Depreciation And Amortisation (89) (90) (91) (92)Operating EBIT 737 819 901 987Total Financial Income/(Expense) 95 (183) (185) (203)Total Pretax Income/(Loss) from Assoc. 2 39 42 47Total Non-Operating Income/(Expense) 0 0 0 0Profit Before Tax (pre-EI) 835 674 758 831Exceptional Items (33) 0 0 0Pre-tax Profit 802 674 758 831Taxation (251) (187) (199) (215)Exceptional Income - post-taxProfit After Tax 551 487 559 616Minority Interests (141) (11) (11) (14)Preferred Dividends 0 0 0 0FX Gain/(Loss) - post taxOther Adjustments - post-taxNet Profit 409 477 549 602Recurring Net Profit 432 477 549 602Fully Diluted Recurring Net Profit 432 477 549 602
Balance Sheet
(RMm) Mar-12A Mar-13F Mar-14F Mar-15FTotal Cash And Equivalents 210 213 219 229Total Debtors 3,375 3,565 3,792 4,691Inventories 598 632 672 831Total Other Current Assets 1,657 1,657 1,657 1,657Total Current Assets 5,840 6,066 6,340 7,409Fixed Assets 140 151 60 68Total Investments 0 0 0 0Intangible Assets 61 61 61 61Total Other Non-Current Assets 1,723 1,724 1,725 1,725Total Non-current Assets 1,924 1,935 1,846 1,854Short-term Debt 196 196 196 196Current Portion of Long-Term DebtTotal Creditors 2,390 2,525 2,686 3,322Other Current Liabilities 179 179 179 179Total Current Liabilities 2,765 2,900 3,060 3,697Total Long-term Debt 2,238 2,166 2,160 2,657Hybrid Debt - Debt ComponentTotal Other Non-Current Liabilities 12 22 26 32Total Non-current Liabilities 2,250 2,187 2,186 2,690Total Provisions 0 0 0 0Total Liabilities 5,015 5,087 5,246 6,387Shareholders' Equity 2,486 2,640 2,654 2,574Minority Interests 264 275 286 299Total Equity 2,750 2,914 2,939 2,873
Cash Flow
(RMm) Mar-12A Mar-13F Mar-14F Mar-15FEBITDA 826 909 992 1,080Cash Flow from Invt. & Assoc.Change In Working Capital (344) (363) (436) (817)(Incr)/Decr in Total ProvisionsOther Non-Cash (Income)/ExpenseOther Operating Cashflow 39 40 41 41Net Interest (Paid)/Received 0 0 0 0Tax Paid (127) (168) (191) (204)Cashflow From Operations 393 417 406 100Capex (56) (56) (56) (56)Disposals Of FAs/subsidiaries 106 97 110 280Acq. Of Subsidiaries/investments 0 0 0 0Other Investing Cashflow 0 0 0 0Cash Flow From Investing 50 40 54 224Debt Raised/(repaid) (24) (72) (5) 497Proceeds From Issue Of Shares 0 0 0 0Shares Repurchased 0 0 0 0Dividends Paid (52) (52) (52) (52)Preferred DividendsOther Financing Cashflow (369) (331) (397) (760)Cash Flow From Financing (445) (455) (454) (314)
Key Ratios
Mar-12A Mar-13F Mar-14F Mar-15FRevenue Growth 21.4% 25.7% 6.4% 23.7%Operating EBITDA Growth 44.1% 10.1% 9.1% 8.9%Operating EBITDA Margin 18.3% 16.0% 16.4% 14.5%Net Cash Per Share (RM) (1.64) (1.59) (1.58) (1.94)BVPS (RM) 1.84 1.95 1.96 1.90Gross Interest Cover 4.26 3.91 4.35 4.44Effective Tax Rate 31.3% 27.7% 26.2% 25.9%Net Dividend Payout Ratio 37.4% 37.6% 35.2% 34.3%Accounts Receivables Days 263.4 223.1 222.4 207.3Inventory Days N/A N/A N/A N/AAccounts Payables Days N/A N/A N/A N/AROIC (%) 15.2% 16.4% 17.7% 19.4%ROCE (%) 19.6% 16.2% 17.5% 18.3%
Key Drivers
(RMm) Mar-12A Mar-13F Mar-14F Mar-15FOutstanding Orderbook 4,300 7,300 6,500 6,000 Orderbook Depletion N/A N/A N/A N/AOrderbook Replenishment 1,000 4,000 1,000 1,000 ASP (% chg, main prod./serv.) N/A N/A N/A N/AUnit sales grth (%, main prod./serv.) N/A N/A N/A N/AUtil. rate (%, main prod./serv.) N/A N/A N/A N/AASP (% chg, 2ndary prod./serv.) N/A N/A N/A N/AUnit sales grth (%,2ndary prod/serv) N/A N/A N/A N/AUtil. rate (%, 2ndary prod/serv) N/A N/A N/A N/A
SOURCE: CIMB, COMPANY REPORTS
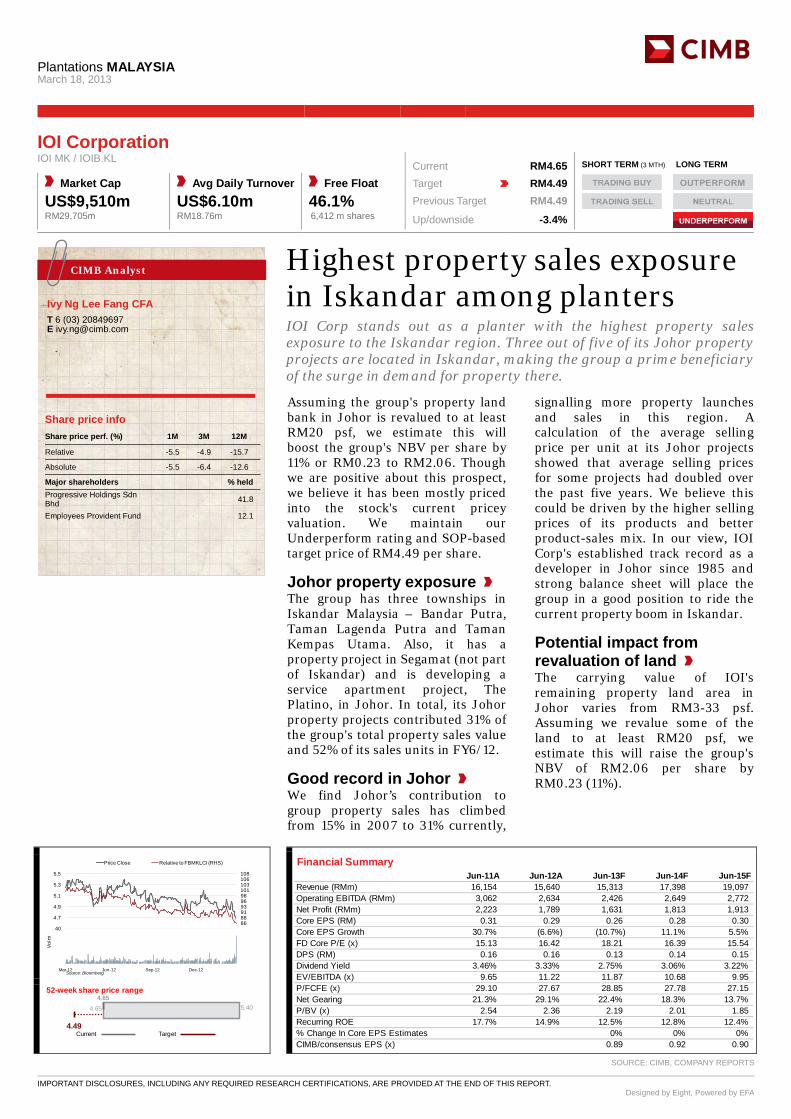
Plantations MALAYSIA
March 18, 2013
IMPORTANT DISCLOSURES, INCLUDING ANY REQUIRED RESEARCH CERTIFICATIONS, ARE PROVIDED AT THE END OF THIS REPORT. Designed by Eight, Powered by EFA
Highest property sales exposure in Iskandar among planters IOI Corp stands out as a planter with the highest property sales exposure to the Iskandar region. Three out of five of its Johor property projects are located in Iskandar, making the group a prime beneficiary of the surge in demand for property there. Assuming the group's property land bank in Johor is revalued to at least RM20 psf, we estimate this will boost the group's NBV per share by 11% or RM0.23 to RM2.06. Though we are positive about this prospect, we believe it has been mostly priced into the stock's current pricey valuation. We maintain our Underperform rating and SOP-based target price of RM4.49 per share.
Johor property exposure The group has three townships in Iskandar Malaysia – Bandar Putra, Taman Lagenda Putra and Taman Kempas Utama. Also, it has a property project in Segamat (not part of Iskandar) and is developing a service apartment project, The Platino, in Johor. In total, its Johor property projects contributed 31% of the group's total property sales value and 52% of its sales units in FY6/12.
Good record in Johor We find Johor’s contribution to group property sales has climbed from 15% in 2007 to 31% currently,
signalling more property launches and sales in this region. A calculation of the average selling price per unit at its Johor projects showed that average selling prices for some projects had doubled over the past five years. We believe this could be driven by the higher selling prices of its products and better product-sales mix. In our view, IOI Corp's established track record as a developer in Johor since 1985 and strong balance sheet will place the group in a good position to ride the current property boom in Iskandar.
Potential impact from revaluation of land The carrying value of IOI's remaining property land area in Johor varies from RM3-33 psf. Assuming we revalue some of the land to at least RM20 psf, we estimate this will raise the group's NBV of RM2.06 per share by RM0.23 (11%).
CIMB Analyst
Ivy Ng Lee Fang CFA
T 6 (03) 20849697 E [email protected]
IOI Corporation IOI MK / IOIB.KL Current RM4.65 SHORT TERM (3 MTH) LONG TERM
Market Cap Avg Daily Turnover Free Float Target RM4.49 US$9,510m US$6.10m 46.1% Previous Target RM4.49 RM29,705m RM18.76m 6,412 m shares Up/downside -3.4%
Conviction| |
83868891939698101103106108
4.5
4.7
4.9
5.1
5.3
5.5
Price Close Relative to FBMKLCI (RHS)
Source: Bloomberg
10
20
30
40
Mar-12 Jun-12 Sep-12 Dec-12
Vol m
Financial Summary Jun-11A Jun-12A Jun-13F Jun-14F Jun-15F
Revenue (RMm) 16,154 15,640 15,313 17,398 19,097Operating EBITDA (RMm) 3,062 2,634 2,426 2,649 2,772Net Profit (RMm) 2,223 1,789 1,631 1,813 1,913Core EPS (RM) 0.31 0.29 0.26 0.28 0.30Core EPS Growth 30.7% (6.6%) (10.7%) 11.1% 5.5%FD Core P/E (x) 15.13 16.42 18.21 16.39 15.54DPS (RM) 0.16 0.16 0.13 0.14 0.15Dividend Yield 3.46% 3.33% 2.75% 3.06% 3.22%EV/EBITDA (x) 9.65 11.22 11.87 10.68 9.95P/FCFE (x) 29.10 27.67 28.85 27.78 27.15Net Gearing 21.3% 29.1% 22.4% 18.3% 13.7%P/BV (x) 2.54 2.36 2.19 2.01 1.85Recurring ROE 17.7% 14.9% 12.5% 12.8% 12.4%% Change In Core EPS Estimates 0% 0% 0%CIMB/consensus EPS (x) 0.89 0.92 0.90
4.65
4.49
4.65 5.40
Target
52-week share price range
Current
SOURCE: CIMB, COMPANY REPORTS
Share price info Share price perf. (%) 1M 3M 12M
Relative -5.5 -4.9 -15.7
Absolute -5.5 -6.4 -12.6
Major shareholders % held Progressive Holdings Sdn Bhd 41.8
Employees Provident Fund 12.1
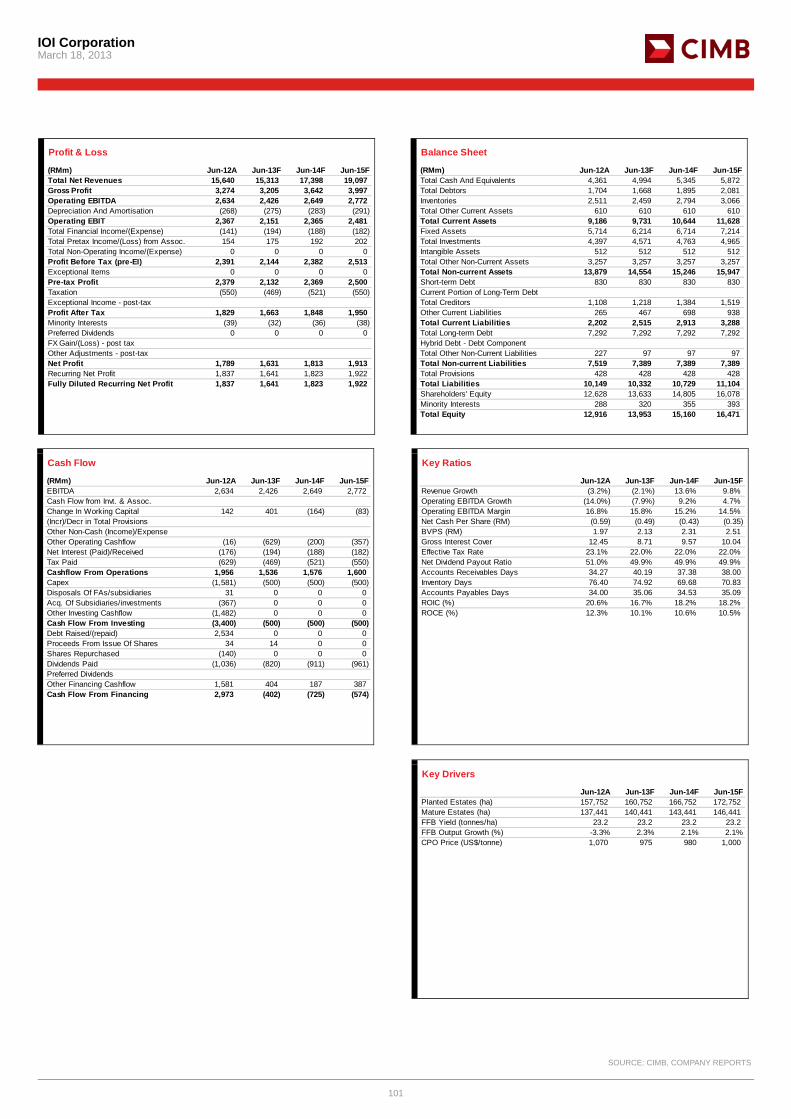
IOI Corporation March 18, 2013
101
Profit & Loss
(RMm) Jun-12A Jun-13F Jun-14F Jun-15FTotal Net Revenues 15,640 15,313 17,398 19,097Gross Profit 3,274 3,205 3,642 3,997Operating EBITDA 2,634 2,426 2,649 2,772Depreciation And Amortisation (268) (275) (283) (291)Operating EBIT 2,367 2,151 2,365 2,481Total Financial Income/(Expense) (141) (194) (188) (182)Total Pretax Income/(Loss) from Assoc. 154 175 192 202Total Non-Operating Income/(Expense) 0 0 0 0Profit Before Tax (pre-EI) 2,391 2,144 2,382 2,513Exceptional Items 0 0 0 0Pre-tax Profit 2,379 2,132 2,369 2,500Taxation (550) (469) (521) (550)Exceptional Income - post-taxProfit After Tax 1,829 1,663 1,848 1,950Minority Interests (39) (32) (36) (38)Preferred Dividends 0 0 0 0FX Gain/(Loss) - post taxOther Adjustments - post-taxNet Profit 1,789 1,631 1,813 1,913Recurring Net Profit 1,837 1,641 1,823 1,922Fully Diluted Recurring Net Profit 1,837 1,641 1,823 1,922
Balance Sheet
(RMm) Jun-12A Jun-13F Jun-14F Jun-15FTotal Cash And Equivalents 4,361 4,994 5,345 5,872Total Debtors 1,704 1,668 1,895 2,081Inventories 2,511 2,459 2,794 3,066Total Other Current Assets 610 610 610 610Total Current Assets 9,186 9,731 10,644 11,628Fixed Assets 5,714 6,214 6,714 7,214Total Investments 4,397 4,571 4,763 4,965Intangible Assets 512 512 512 512Total Other Non-Current Assets 3,257 3,257 3,257 3,257Total Non-current Assets 13,879 14,554 15,246 15,947Short-term Debt 830 830 830 830Current Portion of Long-Term DebtTotal Creditors 1,108 1,218 1,384 1,519Other Current Liabilities 265 467 698 938Total Current Liabilities 2,202 2,515 2,913 3,288Total Long-term Debt 7,292 7,292 7,292 7,292Hybrid Debt - Debt ComponentTotal Other Non-Current Liabilities 227 97 97 97Total Non-current Liabilities 7,519 7,389 7,389 7,389Total Provisions 428 428 428 428Total Liabilities 10,149 10,332 10,729 11,104Shareholders' Equity 12,628 13,633 14,805 16,078Minority Interests 288 320 355 393Total Equity 12,916 13,953 15,160 16,471
Cash Flow
(RMm) Jun-12A Jun-13F Jun-14F Jun-15FEBITDA 2,634 2,426 2,649 2,772Cash Flow from Invt. & Assoc.Change In Working Capital 142 401 (164) (83)(Incr)/Decr in Total ProvisionsOther Non-Cash (Income)/ExpenseOther Operating Cashflow (16) (629) (200) (357)Net Interest (Paid)/Received (176) (194) (188) (182)Tax Paid (629) (469) (521) (550)Cashflow From Operations 1,956 1,536 1,576 1,600Capex (1,581) (500) (500) (500)Disposals Of FAs/subsidiaries 31 0 0 0Acq. Of Subsidiaries/investments (367) 0 0 0Other Investing Cashflow (1,482) 0 0 0Cash Flow From Investing (3,400) (500) (500) (500)Debt Raised/(repaid) 2,534 0 0 0Proceeds From Issue Of Shares 34 14 0 0Shares Repurchased (140) 0 0 0Dividends Paid (1,036) (820) (911) (961)Preferred DividendsOther Financing Cashflow 1,581 404 187 387Cash Flow From Financing 2,973 (402) (725) (574)
Key Ratios
Jun-12A Jun-13F Jun-14F Jun-15FRevenue Growth (3.2%) (2.1%) 13.6% 9.8%Operating EBITDA Growth (14.0%) (7.9%) 9.2% 4.7%Operating EBITDA Margin 16.8% 15.8% 15.2% 14.5%Net Cash Per Share (RM) (0.59) (0.49) (0.43) (0.35)BVPS (RM) 1.97 2.13 2.31 2.51Gross Interest Cover 12.45 8.71 9.57 10.04Effective Tax Rate 23.1% 22.0% 22.0% 22.0%Net Dividend Payout Ratio 51.0% 49.9% 49.9% 49.9%Accounts Receivables Days 34.27 40.19 37.38 38.00Inventory Days 76.40 74.92 69.68 70.83Accounts Payables Days 34.00 35.06 34.53 35.09ROIC (%) 20.6% 16.7% 18.2% 18.2%ROCE (%) 12.3% 10.1% 10.6% 10.5%
Key Drivers
Jun-12A Jun-13F Jun-14F Jun-15FPlanted Estates (ha) 157,752 160,752 166,752 172,752 Mature Estates (ha) 137,441 140,441 143,441 146,441 FFB Yield (tonnes/ha) 23.2 23.2 23.2 23.2 FFB Output Growth (%) -3.3% 2.3% 2.1% 2.1%CPO Price (US$/tonne) 1,070 975 980 1,000
SOURCE: CIMB, COMPANY REPORTS
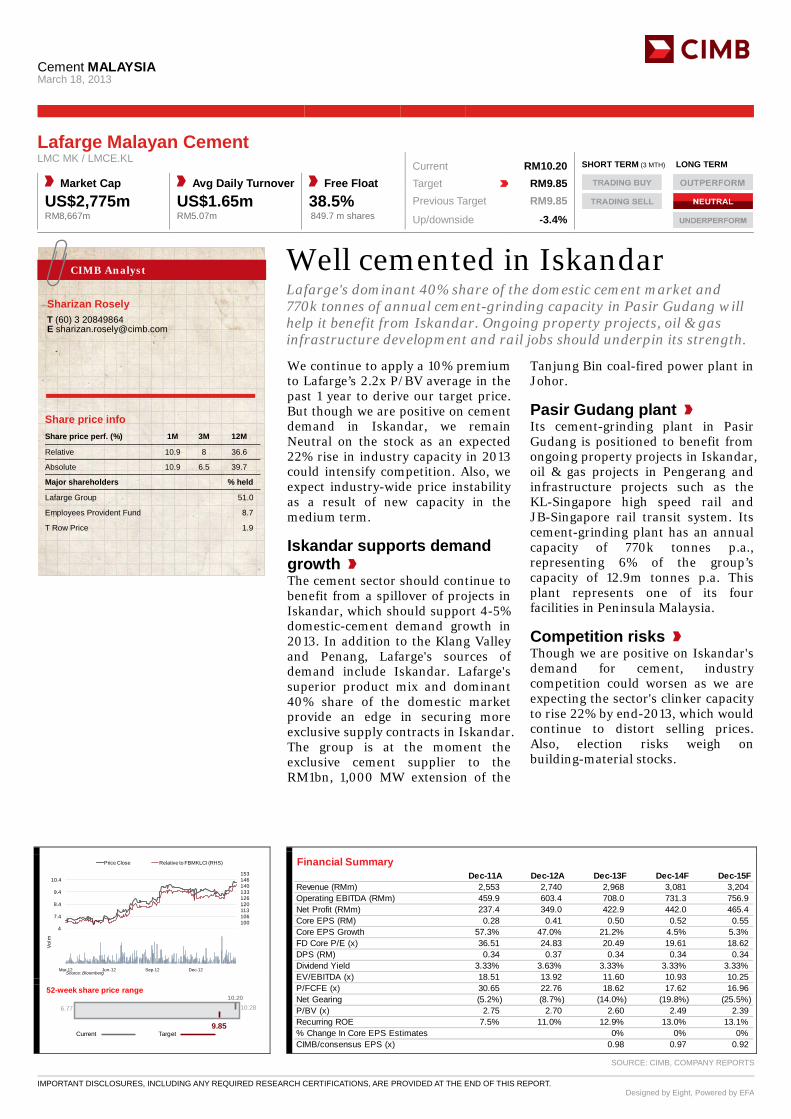
Cement MALAYSIA
March 18, 2013
IMPORTANT DISCLOSURES, INCLUDING ANY REQUIRED RESEARCH CERTIFICATIONS, ARE PROVIDED AT THE END OF THIS REPORT. Designed by Eight, Powered by EFA
Well cemented in Iskandar Lafarge's dominant 40% share of the domestic cement market and 770k tonnes of annual cement-grinding capacity in Pasir Gudang will help it benefit from Iskandar. Ongoing property projects, oil & gas infrastructure development and rail jobs should underpin its strength. We continue to apply a 10% premium to Lafarge’s 2.2x P/BV average in the past 1 year to derive our target price. But though we are positive on cement demand in Iskandar, we remain Neutral on the stock as an expected 22% rise in industry capacity in 2013 could intensify competition. Also, we expect industry-wide price instability as a result of new capacity in the medium term.
Iskandar supports demand growth The cement sector should continue to benefit from a spillover of projects in Iskandar, which should support 4-5% domestic-cement demand growth in 2013. In addition to the Klang Valley and Penang, Lafarge's sources of demand include Iskandar. Lafarge's superior product mix and dominant 40% share of the domestic market provide an edge in securing more exclusive supply contracts in Iskandar. The group is at the moment the exclusive cement supplier to the RM1bn, 1,000 MW extension of the
Tanjung Bin coal-fired power plant in Johor.
Pasir Gudang plant Its cement-grinding plant in Pasir Gudang is positioned to benefit from ongoing property projects in Iskandar, oil & gas projects in Pengerang and infrastructure projects such as the KL-Singapore high speed rail and JB-Singapore rail transit system. Its cement-grinding plant has an annual capacity of 770k tonnes p.a., representing 6% of the group’s capacity of 12.9m tonnes p.a. This plant represents one of its four facilities in Peninsula Malaysia.
Competition risks Though we are positive on Iskandar's demand for cement, industry competition could worsen as we are expecting the sector's clinker capacity to rise 22% by end-2013, which would continue to distort selling prices. Also, election risks weigh on building-material stocks.
CIMB Analyst
Sharizan Rosely
T (60) 3 20849864 E [email protected]
Lafarge Malayan Cement LMC MK / LMCE.KL Current RM10.20 SHORT TERM (3 MTH) LONG TERM
Market Cap Avg Daily Turnover Free Float Target RM9.85 US$2,775m US$1.65m 38.5% Previous Target RM9.85 RM8,667m RM5.07m 849.7 m shares Up/downside -3.4%
Conviction| |
93100106113120126133140146153
6.4
7.4
8.4
9.4
10.4
Price Close Relative to FBMKLCI (RHS)
Source: Bloomberg
1
2
3
4
Mar-12 Jun-12 Sep-12 Dec-12
Vol m
Financial Summary Dec-11A Dec-12A Dec-13F Dec-14F Dec-15F
Revenue (RMm) 2,553 2,740 2,968 3,081 3,204Operating EBITDA (RMm) 459.9 603.4 708.0 731.3 756.9Net Profit (RMm) 237.4 349.0 422.9 442.0 465.4Core EPS (RM) 0.28 0.41 0.50 0.52 0.55Core EPS Growth 57.3% 47.0% 21.2% 4.5% 5.3%FD Core P/E (x) 36.51 24.83 20.49 19.61 18.62DPS (RM) 0.34 0.37 0.34 0.34 0.34Dividend Yield 3.33% 3.63% 3.33% 3.33% 3.33%EV/EBITDA (x) 18.51 13.92 11.60 10.93 10.25P/FCFE (x) 30.65 22.76 18.62 17.62 16.96Net Gearing (5.2%) (8.7%) (14.0%) (19.8%) (25.5%)P/BV (x) 2.75 2.70 2.60 2.49 2.39Recurring ROE 7.5% 11.0% 12.9% 13.0% 13.1%% Change In Core EPS Estimates 0% 0% 0%CIMB/consensus EPS (x) 0.98 0.97 0.92
10.20
9.85
6.77 10.28
Target
52-week share price range
Current
SOURCE: CIMB, COMPANY REPORTS
Share price info Share price perf. (%) 1M 3M 12M
Relative 10.9 8 36.6
Absolute 10.9 6.5 39.7
Major shareholders % held
Lafarge Group 51.0
Employees Provident Fund 8.7
T Row Price 1.9
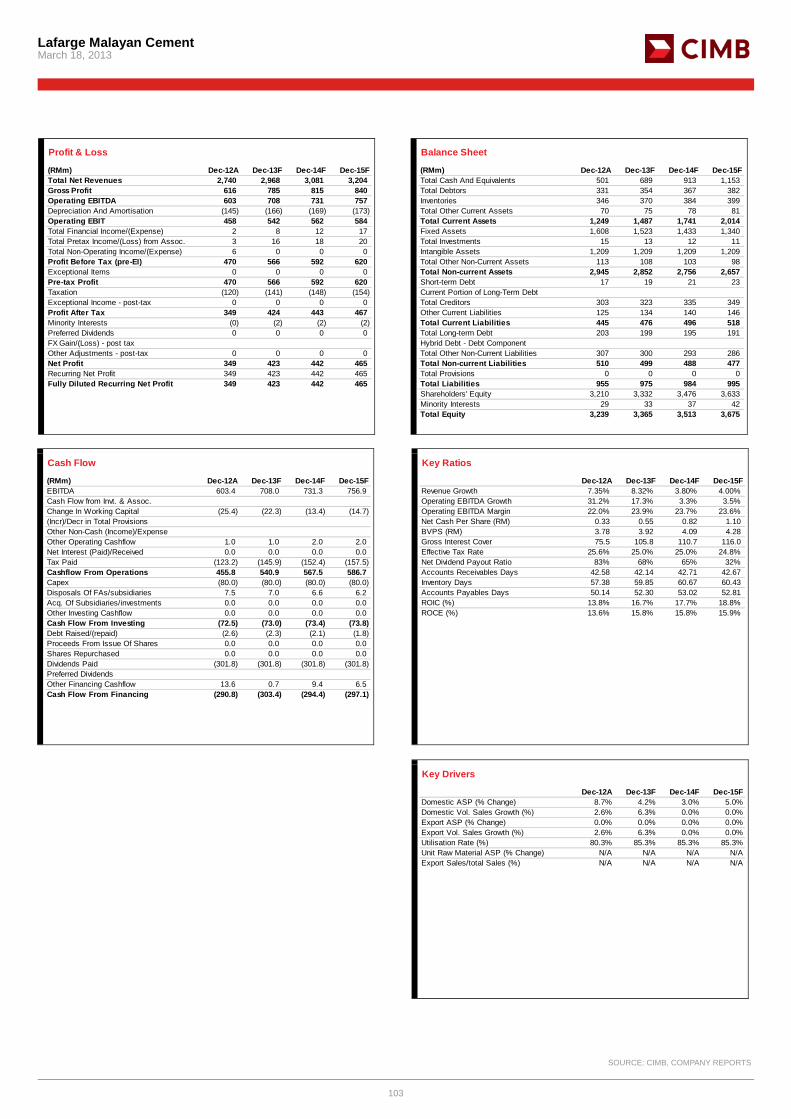
Lafarge Malayan Cement March 18, 2013
103
Profit & Loss
(RMm) Dec-12A Dec-13F Dec-14F Dec-15FTotal Net Revenues 2,740 2,968 3,081 3,204Gross Profit 616 785 815 840Operating EBITDA 603 708 731 757Depreciation And Amortisation (145) (166) (169) (173)Operating EBIT 458 542 562 584Total Financial Income/(Expense) 2 8 12 17Total Pretax Income/(Loss) from Assoc. 3 16 18 20Total Non-Operating Income/(Expense) 6 0 0 0Profit Before Tax (pre-EI) 470 566 592 620Exceptional Items 0 0 0 0Pre-tax Profit 470 566 592 620Taxation (120) (141) (148) (154)Exceptional Income - post-tax 0 0 0 0Profit After Tax 349 424 443 467Minority Interests (0) (2) (2) (2)Preferred Dividends 0 0 0 0FX Gain/(Loss) - post taxOther Adjustments - post-tax 0 0 0 0Net Profit 349 423 442 465Recurring Net Profit 349 423 442 465Fully Diluted Recurring Net Profit 349 423 442 465
Balance Sheet
(RMm) Dec-12A Dec-13F Dec-14F Dec-15FTotal Cash And Equivalents 501 689 913 1,153Total Debtors 331 354 367 382Inventories 346 370 384 399Total Other Current Assets 70 75 78 81Total Current Assets 1,249 1,487 1,741 2,014Fixed Assets 1,608 1,523 1,433 1,340Total Investments 15 13 12 11Intangible Assets 1,209 1,209 1,209 1,209Total Other Non-Current Assets 113 108 103 98Total Non-current Assets 2,945 2,852 2,756 2,657Short-term Debt 17 19 21 23Current Portion of Long-Term DebtTotal Creditors 303 323 335 349Other Current Liabilities 125 134 140 146Total Current Liabilities 445 476 496 518Total Long-term Debt 203 199 195 191Hybrid Debt - Debt ComponentTotal Other Non-Current Liabilities 307 300 293 286Total Non-current Liabilities 510 499 488 477Total Provisions 0 0 0 0Total Liabilities 955 975 984 995Shareholders' Equity 3,210 3,332 3,476 3,633Minority Interests 29 33 37 42Total Equity 3,239 3,365 3,513 3,675
Cash Flow
(RMm) Dec-12A Dec-13F Dec-14F Dec-15FEBITDA 603.4 708.0 731.3 756.9Cash Flow from Invt. & Assoc.Change In Working Capital (25.4) (22.3) (13.4) (14.7)(Incr)/Decr in Total ProvisionsOther Non-Cash (Income)/ExpenseOther Operating Cashflow 1.0 1.0 2.0 2.0Net Interest (Paid)/Received 0.0 0.0 0.0 0.0Tax Paid (123.2) (145.9) (152.4) (157.5)Cashflow From Operations 455.8 540.9 567.5 586.7Capex (80.0) (80.0) (80.0) (80.0)Disposals Of FAs/subsidiaries 7.5 7.0 6.6 6.2Acq. Of Subsidiaries/investments 0.0 0.0 0.0 0.0Other Investing Cashflow 0.0 0.0 0.0 0.0Cash Flow From Investing (72.5) (73.0) (73.4) (73.8)Debt Raised/(repaid) (2.6) (2.3) (2.1) (1.8)Proceeds From Issue Of Shares 0.0 0.0 0.0 0.0Shares Repurchased 0.0 0.0 0.0 0.0Dividends Paid (301.8) (301.8) (301.8) (301.8)Preferred DividendsOther Financing Cashflow 13.6 0.7 9.4 6.5Cash Flow From Financing (290.8) (303.4) (294.4) (297.1)
Key Ratios
Dec-12A Dec-13F Dec-14F Dec-15FRevenue Growth 7.35% 8.32% 3.80% 4.00%Operating EBITDA Growth 31.2% 17.3% 3.3% 3.5%Operating EBITDA Margin 22.0% 23.9% 23.7% 23.6%Net Cash Per Share (RM) 0.33 0.55 0.82 1.10BVPS (RM) 3.78 3.92 4.09 4.28Gross Interest Cover 75.5 105.8 110.7 116.0Effective Tax Rate 25.6% 25.0% 25.0% 24.8%Net Dividend Payout Ratio 83% 68% 65% 32%Accounts Receivables Days 42.58 42.14 42.71 42.67Inventory Days 57.38 59.85 60.67 60.43Accounts Payables Days 50.14 52.30 53.02 52.81ROIC (%) 13.8% 16.7% 17.7% 18.8%ROCE (%) 13.6% 15.8% 15.8% 15.9%
Key Drivers
Dec-12A Dec-13F Dec-14F Dec-15FDomestic ASP (% Change) 8.7% 4.2% 3.0% 5.0%Domestic Vol. Sales Growth (%) 2.6% 6.3% 0.0% 0.0%Export ASP (% Change) 0.0% 0.0% 0.0% 0.0%Export Vol. Sales Growth (%) 2.6% 6.3% 0.0% 0.0%Utilisation Rate (%) 80.3% 85.3% 85.3% 85.3%Unit Raw Material ASP (% Change) N/A N/A N/A N/AExport Sales/total Sales (%) N/A N/A N/A N/A
SOURCE: CIMB, COMPANY REPORTS
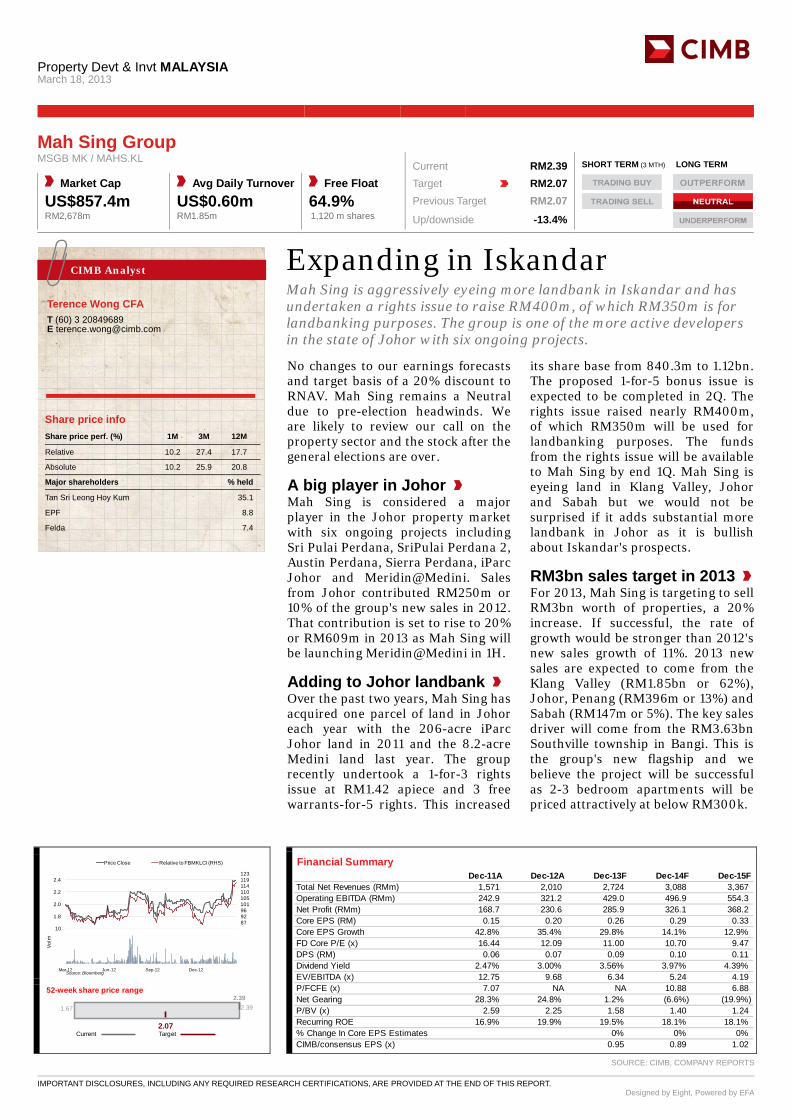
Property Devt & Invt MALAYSIA
March 18, 2013
IMPORTANT DISCLOSURES, INCLUDING ANY REQUIRED RESEARCH CERTIFICATIONS, ARE PROVIDED AT THE END OF THIS REPORT. Designed by Eight, Powered by EFA
Expanding in Iskandar Mah Sing is aggressively eyeing more landbank in Iskandar and has undertaken a rights issue to raise RM400m, of which RM350m is for landbanking purposes. The group is one of the more active developers in the state of Johor with six ongoing projects. No changes to our earnings forecasts and target basis of a 20% discount to RNAV. Mah Sing remains a Neutral due to pre-election headwinds. We are likely to review our call on the property sector and the stock after the general elections are over.
A big player in Johor Mah Sing is considered a major player in the Johor property market with six ongoing projects including Sri Pulai Perdana, SriPulai Perdana 2, Austin Perdana, Sierra Perdana, iParc Johor and Meridin@Medini. Sales from Johor contributed RM250m or 10% of the group's new sales in 2012. That contribution is set to rise to 20% or RM609m in 2013 as Mah Sing will be launching Meridin@Medini in 1H.
Adding to Johor landbank Over the past two years, Mah Sing has acquired one parcel of land in Johor each year with the 206-acre iParc Johor land in 2011 and the 8.2-acre Medini land last year. The group recently undertook a 1-for-3 rights issue at RM1.42 apiece and 3 free warrants-for-5 rights. This increased
its share base from 840.3m to 1.12bn. The proposed 1-for-5 bonus issue is expected to be completed in 2Q. The rights issue raised nearly RM400m, of which RM350m will be used for landbanking purposes. The funds from the rights issue will be available to Mah Sing by end 1Q. Mah Sing is eyeing land in Klang Valley, Johor and Sabah but we would not be surprised if it adds substantial more landbank in Johor as it is bullish about Iskandar's prospects.
RM3bn sales target in 2013 For 2013, Mah Sing is targeting to sell RM3bn worth of properties, a 20% increase. If successful, the rate of growth would be stronger than 2012's new sales growth of 11%. 2013 new sales are expected to come from the Klang Valley (RM1.85bn or 62%), Johor, Penang (RM396m or 13%) and Sabah (RM147m or 5%). The key sales driver will come from the RM3.63bn Southville township in Bangi. This is the group's new flagship and we believe the project will be successful as 2-3 bedroom apartments will be priced attractively at below RM300k.
CIMB Analyst
Terence Wong CFA
T (60) 3 20849689 E [email protected]
Mah Sing Group MSGB MK / MAHS.KL Current RM2.39 SHORT TERM (3 MTH) LONG TERM
Market Cap Avg Daily Turnover Free Float Target RM2.07 US$857.4m US$0.60m 64.9% Previous Target RM2.07 RM2,678m RM1.85m 1,120 m shares Up/downside -13.4%
Conviction| |
83879296101105110114119123
1.6
1.8
2.0
2.2
2.4
Price Close Relative to FBMKLCI (RHS)
Source: Bloomberg
2468
10
Mar-12 Jun-12 Sep-12 Dec-12
Vol m
Financial Summary Dec-11A Dec-12A Dec-13F Dec-14F Dec-15F
Total Net Revenues (RMm) 1,571 2,010 2,724 3,088 3,367Operating EBITDA (RMm) 242.9 321.2 429.0 496.9 554.3Net Profit (RMm) 168.7 230.6 285.9 326.1 368.2Core EPS (RM) 0.15 0.20 0.26 0.29 0.33Core EPS Growth 42.8% 35.4% 29.8% 14.1% 12.9%FD Core P/E (x) 16.44 12.09 11.00 10.70 9.47DPS (RM) 0.06 0.07 0.09 0.10 0.11Dividend Yield 2.47% 3.00% 3.56% 3.97% 4.39%EV/EBITDA (x) 12.75 9.68 6.34 5.24 4.19P/FCFE (x) 7.07 NA NA 10.88 6.88Net Gearing 28.3% 24.8% 1.2% (6.6%) (19.9%)P/BV (x) 2.59 2.25 1.58 1.40 1.24Recurring ROE 16.9% 19.9% 19.5% 18.1% 18.1%% Change In Core EPS Estimates 0% 0% 0%CIMB/consensus EPS (x) 0.95 0.89 1.02
2.39
2.07
1.67 2.39
Target
52-week share price range
Current
SOURCE: CIMB, COMPANY REPORTS
Share price info Share price perf. (%) 1M 3M 12M
Relative 10.2 27.4 17.7
Absolute 10.2 25.9 20.8
Major shareholders % held
Tan Sri Leong Hoy Kum 35.1
EPF 8.8
Felda 7.4

Mah Sing Group March 18, 2013
105
Profit & Loss
(RMm) Dec-12A Dec-13F Dec-14F Dec-15FTotal Net Revenues 2,010 2,724 3,088 3,367Gross Profit 836 876 1,002 1,104Operating EBITDA 321 429 497 554Depreciation And Amortisation (13) (15) (16) (17)Operating EBIT 308 414 481 538Total Financial Income/(Expense) 8 8 11 15Total Pretax Income/(Loss) from Assoc. 0 0 0 0Total Non-Operating Income/(Expense) 0 0 0 0Profit Before Tax (pre-EI) 316 422 491 553Exceptional Items 0 0 0 0Pre-tax Profit 316 422 491 553Taxation (84) (110) (128) (144)Exceptional Income - post-taxProfit After Tax 232 312 364 409Minority Interests (1) (26) (38) (41)Pref. & Special Div 0 0 0 0FX Gain/(Loss) - post taxOther Adjustments - post-taxNet Profit 231 286 326 368Recurring Net Profit 231 286 326 368Fully Diluted Recurring Net Profit 231 286 326 368
Balance Sheet
(RMm) Dec-12A Dec-13F Dec-14F Dec-15FTotal Cash And Equivalents 596 665 879 1,269Properties Under DevelopmentTotal Debtors 398 551 692 681Inventories 40 61 69 75Total Other Current Assets 1,885 1,979 2,108 2,214Total Current Assets 2,919 3,256 3,749 4,239Fixed Assets 101 96 90 84Total Investments 13 13 13 13Intangible Assets 71 71 71 71Total Other Non-Current Assets 491 512 534 557Total Non-current Assets 676 692 708 724Short-term Debt 40 36 33 30Current Portion of Long-Term DebtTotal Creditors 1,314 1,412 1,601 1,745Other Current Liabilities 39 39 39 39Total Current Liabilities 1,394 1,487 1,672 1,814Total Long-term Debt 866 649 714 786Hybrid Debt - Debt ComponentTotal Other Non-Current Liabilities 58 60 62 63Total Non-current Liabilities 924 709 776 849Total Provisions 22 22 22 22Total Liabilities 2,340 2,219 2,470 2,685Shareholders' Equity 1,245 1,693 1,913 2,163Minority Interests 10 36 74 115Total Equity 1,255 1,729 1,987 2,278
Cash Flow
(RMm) Dec-12A Dec-13F Dec-14F Dec-15FEBITDA 321.2 429.0 496.9 554.3Cash Flow from Invt. & Assoc.Change In Working Capital 189.7 (164.1) (90.2) 44.6Straight Line Adjustment(Incr)/Decr in Total ProvisionsOther Non-Cash (Income)/ExpenseOther Operating Cashflow 0.0 0.0 0.0 0.0Net Interest (Paid)/Received 7.8 8.1 10.6 15.2Tax Paid (62.1) (109.7) (127.8) (143.8)Cashflow From Operations 456.5 163.4 289.5 470.4Capex (29.6) (10.0) (10.0) (10.0)Disposals Of FAs/subsidiaries 0.0 0.0 0.0 0.0Disposals of Investment PropertiesAcq. Of Subsidiaries/investments (416.3) (21.0) (22.0) (23.1)Other Investing Cashflow 10.5 (6.5) 0.0 0.0Cash Flow From Investing (435.4) (37.5) (32.0) (33.1)Debt Raised/(repaid) (21.7) (219.1) 63.1 70.0Proceeds From Issue Of Shares 14.7 257.3 0.0 0.0Shares Repurchased 0.0 0.0 0.0 0.0Dividends Paid (84.0) (95.2) (106.4) (117.6)Preferred DividendsOther Financing Cashflow 0.0 0.0 0.0 0.0Cash Flow From Financing (90.9) (56.9) (43.3) (47.5)
Key Ratios
Dec-12A Dec-13F Dec-14F Dec-15FRevenue Growth 31.8% 39.4% 14.3% 9.5%Operating EBITDA Growth 32.2% 33.6% 15.8% 11.6%Operating EBITDA Margin 17.9% 17.1% 17.4% 17.7%Net Cash Per Share (RM) (0.27) (0.02) 0.12 0.41BVPS (RM) 1.06 1.51 1.71 1.93Gross Interest Cover 139.7 221.9 286.6 293.9Effective Tax Rate 26.5% 26.0% 26.0% 26.0%Net Dividend Payout Ratio 36.4% 33.3% 32.6% 31.9%Accounts Receivables Days 76.1 68.0 78.0 78.6Inventory Days 13.02 9.94 11.38 11.65Accounts Payables Days 251.3 269.2 263.6 269.8ROIC (%) 16.3% 19.0% 19.8% 20.9%ROCE (%) 14.9% 18.3% 19.0% 18.9%
Key Drivers
Dec-12A Dec-13F Dec-14F Dec-15FUnbooked Presales (m) (RM) N/A N/A N/A N/AUnbooked Presales (area: m sm) N/A N/A N/A N/AUnbooked Presales (units) N/A N/A N/A N/AUnsold attrib. landbank (area: m sm) 3.9 4.3 4.7 5.1 Gross Margins (%) 18.1% 15.7% 16.1% 16.5%Contracted Sales ASP (per Sm) (RM) N/A N/A N/A N/AResidential EBIT Margin (%) 16.2% 15.8% 16.2% 16.6%Investment rev / total rev (%) N/A N/A N/A N/AResidential rev / total rev (%) N/A N/A N/A N/AInvt. properties rental margin (%) N/A N/A N/A N/ASG&A / Sales Ratio (%) N/A N/A N/A N/A
SOURCE: CIMB, COMPANY REPORTS
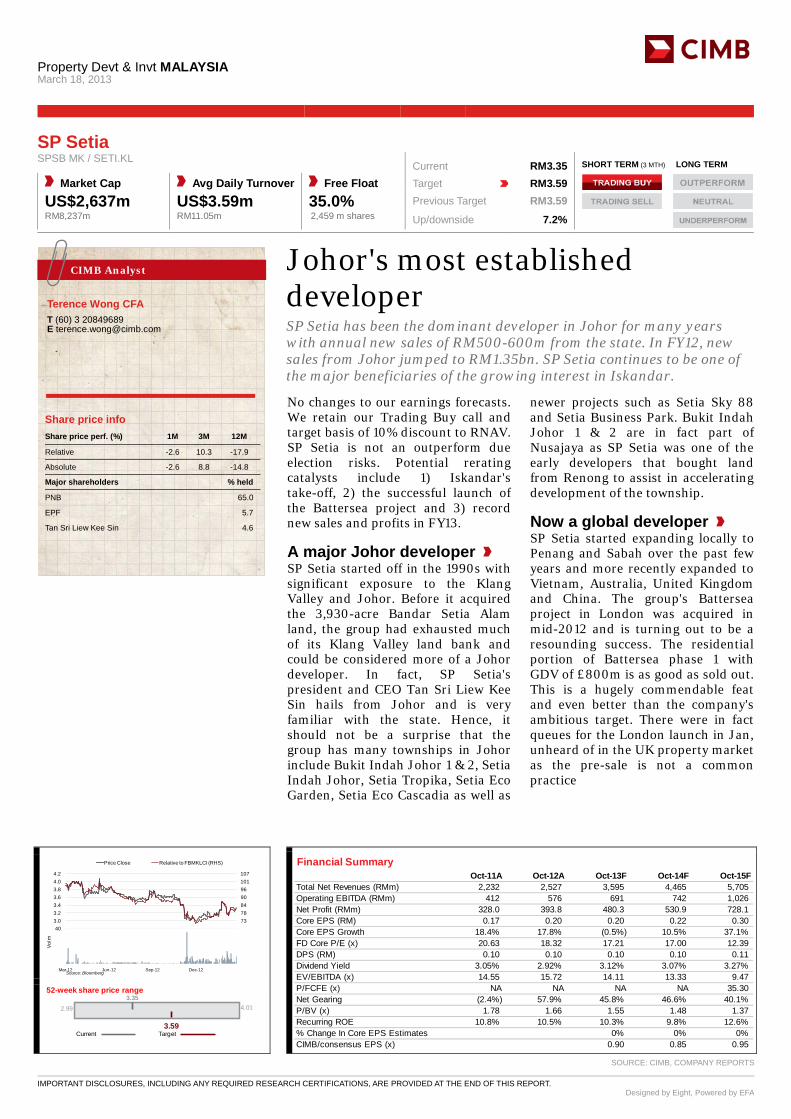
Property Devt & Invt MALAYSIA
March 18, 2013
IMPORTANT DISCLOSURES, INCLUDING ANY REQUIRED RESEARCH CERTIFICATIONS, ARE PROVIDED AT THE END OF THIS REPORT. Designed by Eight, Powered by EFA
Johor's most established developer SP Setia has been the dominant developer in Johor for many years with annual new sales of RM500-600m from the state. In FY12, new sales from Johor jumped to RM1.35bn. SP Setia continues to be one of the major beneficiaries of the growing interest in Iskandar. No changes to our earnings forecasts. We retain our Trading Buy call and target basis of 10% discount to RNAV. SP Setia is not an outperform due election risks. Potential rerating catalysts include 1) Iskandar's take-off, 2) the successful launch of the Battersea project and 3) record new sales and profits in FY13.
A major Johor developer SP Setia started off in the 1990s with significant exposure to the Klang Valley and Johor. Before it acquired the 3,930-acre Bandar Setia Alam land, the group had exhausted much of its Klang Valley land bank and could be considered more of a Johor developer. In fact, SP Setia's president and CEO Tan Sri Liew Kee Sin hails from Johor and is very familiar with the state. Hence, it should not be a surprise that the group has many townships in Johor include Bukit Indah Johor 1 & 2, Setia Indah Johor, Setia Tropika, Setia Eco Garden, Setia Eco Cascadia as well as
newer projects such as Setia Sky 88 and Setia Business Park. Bukit Indah Johor 1 & 2 are in fact part of Nusajaya as SP Setia was one of the early developers that bought land from Renong to assist in accelerating development of the township.
Now a global developer SP Setia started expanding locally to Penang and Sabah over the past few years and more recently expanded to Vietnam, Australia, United Kingdom and China. The group's Battersea project in London was acquired in mid-2012 and is turning out to be a resounding success. The residential portion of Battersea phase 1 with GDV of £800m is as good as sold out. This is a hugely commendable feat and even better than the company's ambitious target. There were in fact queues for the London launch in Jan, unheard of in the UK property market as the pre-sale is not a common practice
CIMB Analyst
Terence Wong CFA
T (60) 3 20849689 E [email protected]
SP Setia SPSB MK / SETI.KL Current RM3.35 SHORT TERM (3 MTH) LONG TERM
Market Cap Avg Daily Turnover Free Float Target RM3.59 US$2,637m US$3.59m 35.0% Previous Target RM3.59 RM8,237m RM11.05m 2,459 m shares Up/downside 7.2%
Conviction| |
677378849096101107
2.83.03.23.43.63.84.04.2
Price Close Relative to FBMKLCI (RHS)
Source: Bloomberg
10
20
30
40
Mar-12 Jun-12 Sep-12 Dec-12
Vol m
Financial Summary Oct-11A Oct-12A Oct-13F Oct-14F Oct-15F
Total Net Revenues (RMm) 2,232 2,527 3,595 4,465 5,705Operating EBITDA (RMm) 412 576 691 742 1,026Net Profit (RMm) 328.0 393.8 480.3 530.9 728.1Core EPS (RM) 0.17 0.20 0.20 0.22 0.30Core EPS Growth 18.4% 17.8% (0.5%) 10.5% 37.1%FD Core P/E (x) 20.63 18.32 17.21 17.00 12.39DPS (RM) 0.10 0.10 0.10 0.10 0.11Dividend Yield 3.05% 2.92% 3.12% 3.07% 3.27%EV/EBITDA (x) 14.55 15.72 14.11 13.33 9.47P/FCFE (x) NA NA NA NA 35.30Net Gearing (2.4%) 57.9% 45.8% 46.6% 40.1%P/BV (x) 1.78 1.66 1.55 1.48 1.37Recurring ROE 10.8% 10.5% 10.3% 9.8% 12.6%% Change In Core EPS Estimates 0% 0% 0%CIMB/consensus EPS (x) 0.90 0.85 0.95
3.35
3.59
2.99 4.01
Target
52-week share price range
Current
SOURCE: CIMB, COMPANY REPORTS
Share price info Share price perf. (%) 1M 3M 12M
Relative -2.6 10.3 -17.9
Absolute -2.6 8.8 -14.8
Major shareholders % held
PNB 65.0
EPF 5.7
Tan Sri Liew Kee Sin 4.6
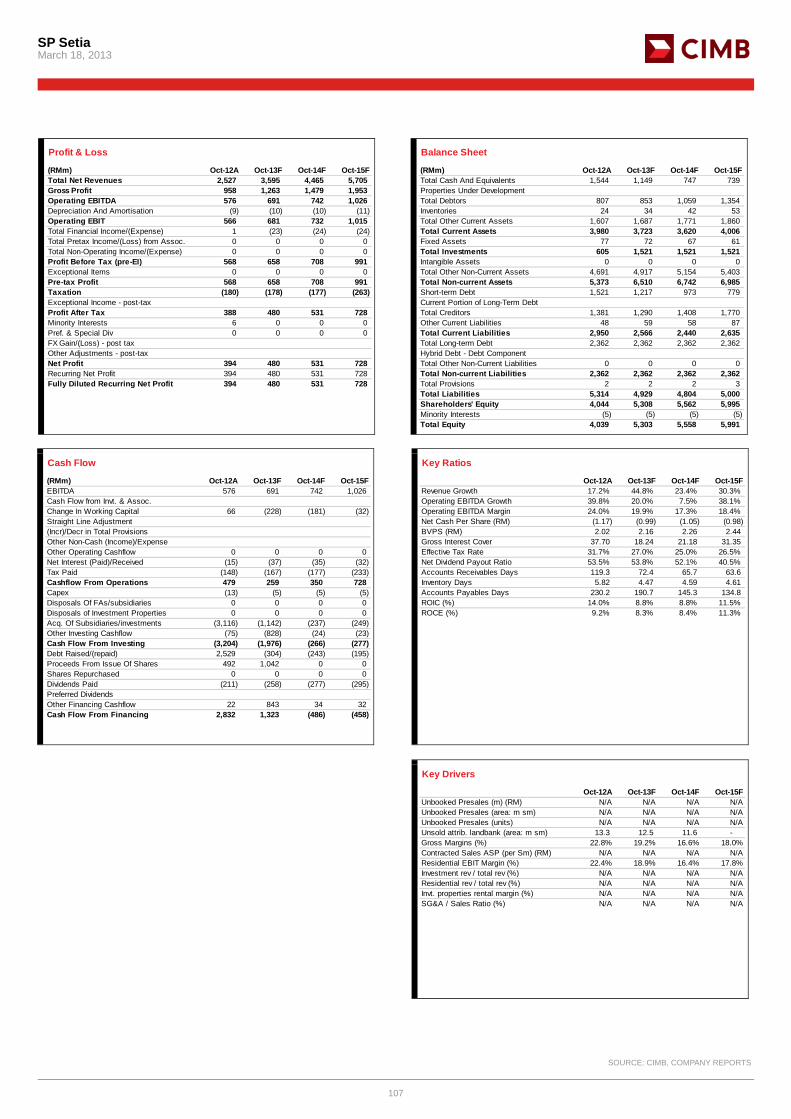
SP Setia March 18, 2013
107
Profit & Loss
(RMm) Oct-12A Oct-13F Oct-14F Oct-15FTotal Net Revenues 2,527 3,595 4,465 5,705Gross Profit 958 1,263 1,479 1,953Operating EBITDA 576 691 742 1,026Depreciation And Amortisation (9) (10) (10) (11)Operating EBIT 566 681 732 1,015Total Financial Income/(Expense) 1 (23) (24) (24)Total Pretax Income/(Loss) from Assoc. 0 0 0 0Total Non-Operating Income/(Expense) 0 0 0 0Profit Before Tax (pre-EI) 568 658 708 991Exceptional Items 0 0 0 0Pre-tax Profit 568 658 708 991Taxation (180) (178) (177) (263)Exceptional Income - post-taxProfit After Tax 388 480 531 728Minority Interests 6 0 0 0Pref. & Special Div 0 0 0 0FX Gain/(Loss) - post taxOther Adjustments - post-taxNet Profit 394 480 531 728Recurring Net Profit 394 480 531 728Fully Diluted Recurring Net Profit 394 480 531 728
Balance Sheet
(RMm) Oct-12A Oct-13F Oct-14F Oct-15FTotal Cash And Equivalents 1,544 1,149 747 739Properties Under DevelopmentTotal Debtors 807 853 1,059 1,354Inventories 24 34 42 53Total Other Current Assets 1,607 1,687 1,771 1,860Total Current Assets 3,980 3,723 3,620 4,006Fixed Assets 77 72 67 61Total Investments 605 1,521 1,521 1,521Intangible Assets 0 0 0 0Total Other Non-Current Assets 4,691 4,917 5,154 5,403Total Non-current Assets 5,373 6,510 6,742 6,985Short-term Debt 1,521 1,217 973 779Current Portion of Long-Term DebtTotal Creditors 1,381 1,290 1,408 1,770Other Current Liabilities 48 59 58 87Total Current Liabilities 2,950 2,566 2,440 2,635Total Long-term Debt 2,362 2,362 2,362 2,362Hybrid Debt - Debt ComponentTotal Other Non-Current Liabilities 0 0 0 0Total Non-current Liabilities 2,362 2,362 2,362 2,362Total Provisions 2 2 2 3Total Liabilities 5,314 4,929 4,804 5,000Shareholders' Equity 4,044 5,308 5,562 5,995Minority Interests (5) (5) (5) (5)Total Equity 4,039 5,303 5,558 5,991
Cash Flow
(RMm) Oct-12A Oct-13F Oct-14F Oct-15FEBITDA 576 691 742 1,026Cash Flow from Invt. & Assoc.Change In Working Capital 66 (228) (181) (32)Straight Line Adjustment(Incr)/Decr in Total ProvisionsOther Non-Cash (Income)/ExpenseOther Operating Cashflow 0 0 0 0Net Interest (Paid)/Received (15) (37) (35) (32)Tax Paid (148) (167) (177) (233)Cashflow From Operations 479 259 350 728Capex (13) (5) (5) (5)Disposals Of FAs/subsidiaries 0 0 0 0Disposals of Investment Properties 0 0 0 0Acq. Of Subsidiaries/investments (3,116) (1,142) (237) (249)Other Investing Cashflow (75) (828) (24) (23)Cash Flow From Investing (3,204) (1,976) (266) (277)Debt Raised/(repaid) 2,529 (304) (243) (195)Proceeds From Issue Of Shares 492 1,042 0 0Shares Repurchased 0 0 0 0Dividends Paid (211) (258) (277) (295)Preferred DividendsOther Financing Cashflow 22 843 34 32Cash Flow From Financing 2,832 1,323 (486) (458)
Key Ratios
Oct-12A Oct-13F Oct-14F Oct-15FRevenue Growth 17.2% 44.8% 23.4% 30.3%Operating EBITDA Growth 39.8% 20.0% 7.5% 38.1%Operating EBITDA Margin 24.0% 19.9% 17.3% 18.4%Net Cash Per Share (RM) (1.17) (0.99) (1.05) (0.98)BVPS (RM) 2.02 2.16 2.26 2.44Gross Interest Cover 37.70 18.24 21.18 31.35Effective Tax Rate 31.7% 27.0% 25.0% 26.5%Net Dividend Payout Ratio 53.5% 53.8% 52.1% 40.5%Accounts Receivables Days 119.3 72.4 65.7 63.6Inventory Days 5.82 4.47 4.59 4.61Accounts Payables Days 230.2 190.7 145.3 134.8ROIC (%) 14.0% 8.8% 8.8% 11.5%ROCE (%) 9.2% 8.3% 8.4% 11.3%
Key Drivers
Oct-12A Oct-13F Oct-14F Oct-15FUnbooked Presales (m) (RM) N/A N/A N/A N/AUnbooked Presales (area: m sm) N/A N/A N/A N/AUnbooked Presales (units) N/A N/A N/A N/AUnsold attrib. landbank (area: m sm) 13.3 12.5 11.6 - Gross Margins (%) 22.8% 19.2% 16.6% 18.0%Contracted Sales ASP (per Sm) (RM) N/A N/A N/A N/AResidential EBIT Margin (%) 22.4% 18.9% 16.4% 17.8%Investment rev / total rev (%) N/A N/A N/A N/AResidential rev / total rev (%) N/A N/A N/A N/AInvt. properties rental margin (%) N/A N/A N/A N/ASG&A / Sales Ratio (%) N/A N/A N/A N/A
SOURCE: CIMB, COMPANY REPORTS
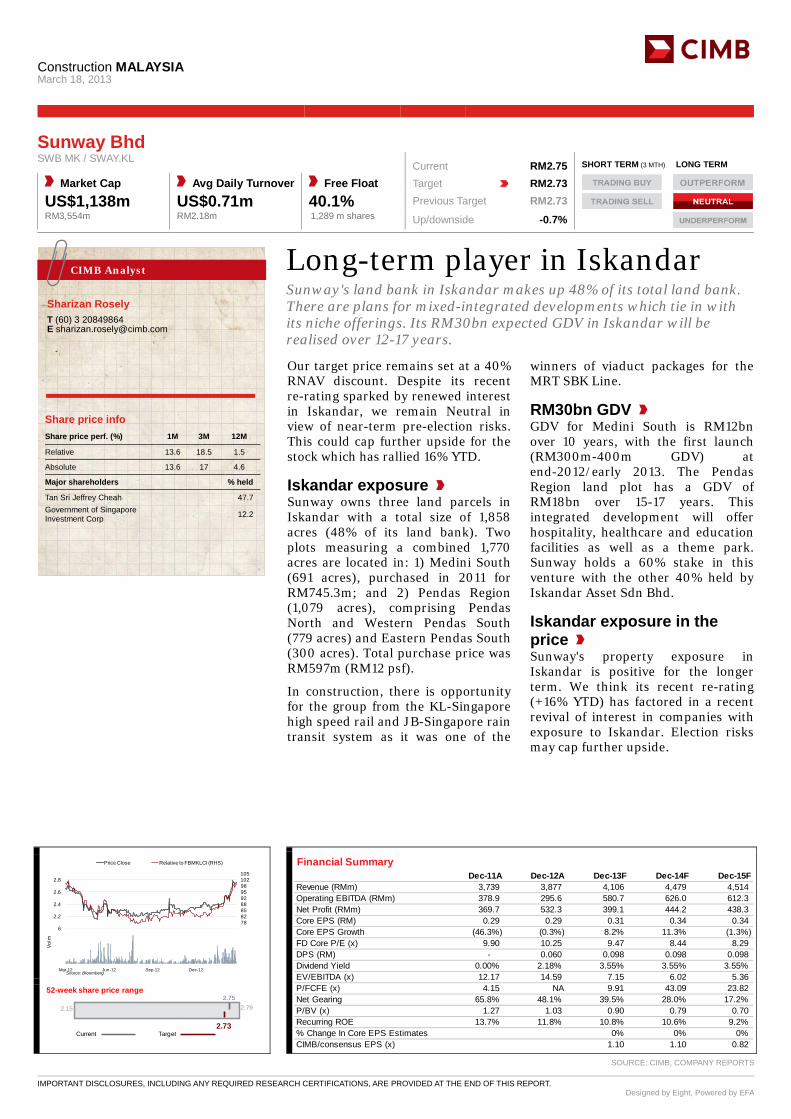
Construction MALAYSIA
March 18, 2013
IMPORTANT DISCLOSURES, INCLUDING ANY REQUIRED RESEARCH CERTIFICATIONS, ARE PROVIDED AT THE END OF THIS REPORT. Designed by Eight, Powered by EFA
Long-term player in Iskandar Sunway's land bank in Iskandar makes up 48% of its total land bank. There are plans for mixed-integrated developments which tie in with its niche offerings. Its RM30bn expected GDV in Iskandar will be realised over 12-17 years. Our target price remains set at a 40% RNAV discount. Despite its recent re-rating sparked by renewed interest in Iskandar, we remain Neutral in view of near-term pre-election risks. This could cap further upside for the stock which has rallied 16% YTD.
Iskandar exposure Sunway owns three land parcels in Iskandar with a total size of 1,858 acres (48% of its land bank). Two plots measuring a combined 1,770 acres are located in: 1) Medini South (691 acres), purchased in 2011 for RM745.3m; and 2) Pendas Region (1,079 acres), comprising Pendas North and Western Pendas South (779 acres) and Eastern Pendas South (300 acres). Total purchase price was RM597m (RM12 psf).
In construction, there is opportunity for the group from the KL-Singapore high speed rail and JB-Singapore rain transit system as it was one of the
winners of viaduct packages for the MRT SBK Line.
RM30bn GDV GDV for Medini South is RM12bn over 10 years, with the first launch (RM300m-400m GDV) at end-2012/early 2013. The Pendas Region land plot has a GDV of RM18bn over 15-17 years. This integrated development will offer hospitality, healthcare and education facilities as well as a theme park. Sunway holds a 60% stake in this venture with the other 40% held by Iskandar Asset Sdn Bhd.
Iskandar exposure in the price Sunway's property exposure in Iskandar is positive for the longer term. We think its recent re-rating (+16% YTD) has factored in a recent revival of interest in companies with exposure to Iskandar. Election risks may cap further upside.
CIMB Analyst
Sharizan Rosely
T (60) 3 20849864 E [email protected]
Sunway Bhd SWB MK / SWAY.KL Current RM2.75 SHORT TERM (3 MTH) LONG TERM
Market Cap Avg Daily Turnover Free Float Target RM2.73 US$1,138m US$0.71m 40.1% Previous Target RM2.73 RM3,554m RM2.18m 1,289 m shares Up/downside -0.7%
Conviction| |
7578828588929598102105
2.0
2.2
2.4
2.6
2.8
Price Close Relative to FBMKLCI (RHS)
Source: Bloomberg
123456
Mar-12 Jun-12 Sep-12 Dec-12
Vol m
Financial Summary Dec-11A Dec-12A Dec-13F Dec-14F Dec-15F
Revenue (RMm) 3,739 3,877 4,106 4,479 4,514Operating EBITDA (RMm) 378.9 295.6 580.7 626.0 612.3Net Profit (RMm) 369.7 532.3 399.1 444.2 438.3Core EPS (RM) 0.29 0.29 0.31 0.34 0.34Core EPS Growth (46.3%) (0.3%) 8.2% 11.3% (1.3%)FD Core P/E (x) 9.90 10.25 9.47 8.44 8.29DPS (RM) - 0.060 0.098 0.098 0.098Dividend Yield 0.00% 2.18% 3.55% 3.55% 3.55%EV/EBITDA (x) 12.17 14.59 7.15 6.02 5.36P/FCFE (x) 4.15 NA 9.91 43.09 23.82Net Gearing 65.8% 48.1% 39.5% 28.0% 17.2%P/BV (x) 1.27 1.03 0.90 0.79 0.70Recurring ROE 13.7% 11.8% 10.8% 10.6% 9.2%% Change In Core EPS Estimates 0% 0% 0%CIMB/consensus EPS (x) 1.10 1.10 0.82
2.75
2.73
2.15 2.79
Target
52-week share price range
Current
SOURCE: CIMB, COMPANY REPORTS
Share price info Share price perf. (%) 1M 3M 12M
Relative 13.6 18.5 1.5
Absolute 13.6 17 4.6
Major shareholders % held
Tan Sri Jeffrey Cheah 47.7 Government of Singapore Investment Corp 12.2
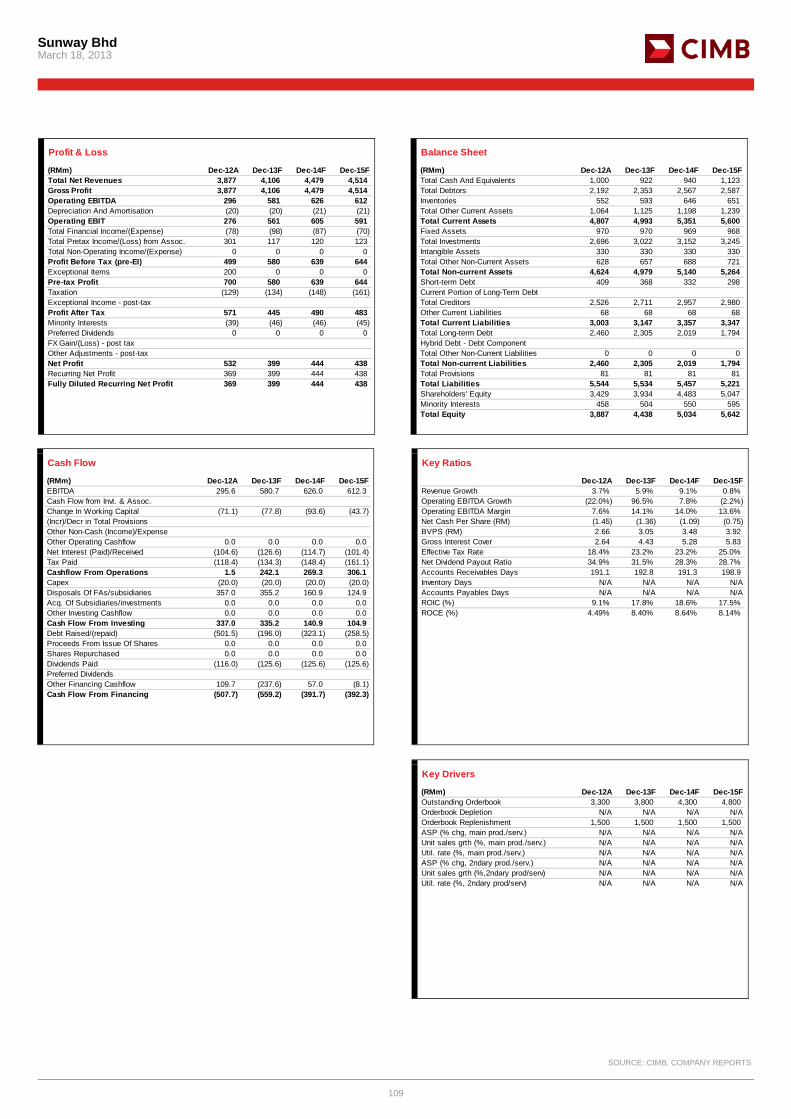
Sunway Bhd March 18, 2013
109
Profit & Loss
(RMm) Dec-12A Dec-13F Dec-14F Dec-15FTotal Net Revenues 3,877 4,106 4,479 4,514Gross Profit 3,877 4,106 4,479 4,514Operating EBITDA 296 581 626 612Depreciation And Amortisation (20) (20) (21) (21)Operating EBIT 276 561 605 591Total Financial Income/(Expense) (78) (98) (87) (70)Total Pretax Income/(Loss) from Assoc. 301 117 120 123Total Non-Operating Income/(Expense) 0 0 0 0Profit Before Tax (pre-EI) 499 580 639 644Exceptional Items 200 0 0 0Pre-tax Profit 700 580 639 644Taxation (129) (134) (148) (161)Exceptional Income - post-taxProfit After Tax 571 445 490 483Minority Interests (39) (46) (46) (45)Preferred Dividends 0 0 0 0FX Gain/(Loss) - post taxOther Adjustments - post-taxNet Profit 532 399 444 438Recurring Net Profit 369 399 444 438Fully Diluted Recurring Net Profit 369 399 444 438
Balance Sheet
(RMm) Dec-12A Dec-13F Dec-14F Dec-15FTotal Cash And Equivalents 1,000 922 940 1,123Total Debtors 2,192 2,353 2,567 2,587Inventories 552 593 646 651Total Other Current Assets 1,064 1,125 1,198 1,239Total Current Assets 4,807 4,993 5,351 5,600Fixed Assets 970 970 969 968Total Investments 2,696 3,022 3,152 3,245Intangible Assets 330 330 330 330Total Other Non-Current Assets 628 657 688 721Total Non-current Assets 4,624 4,979 5,140 5,264Short-term Debt 409 368 332 298Current Portion of Long-Term DebtTotal Creditors 2,526 2,711 2,957 2,980Other Current Liabilities 68 68 68 68Total Current Liabilities 3,003 3,147 3,357 3,347Total Long-term Debt 2,460 2,305 2,019 1,794Hybrid Debt - Debt ComponentTotal Other Non-Current Liabilities 0 0 0 0Total Non-current Liabilities 2,460 2,305 2,019 1,794Total Provisions 81 81 81 81Total Liabilities 5,544 5,534 5,457 5,221Shareholders' Equity 3,429 3,934 4,483 5,047Minority Interests 458 504 550 595Total Equity 3,887 4,438 5,034 5,642
Cash Flow
(RMm) Dec-12A Dec-13F Dec-14F Dec-15FEBITDA 295.6 580.7 626.0 612.3Cash Flow from Invt. & Assoc.Change In Working Capital (71.1) (77.8) (93.6) (43.7)(Incr)/Decr in Total ProvisionsOther Non-Cash (Income)/ExpenseOther Operating Cashflow 0.0 0.0 0.0 0.0Net Interest (Paid)/Received (104.6) (126.6) (114.7) (101.4)Tax Paid (118.4) (134.3) (148.4) (161.1)Cashflow From Operations 1.5 242.1 269.3 306.1Capex (20.0) (20.0) (20.0) (20.0)Disposals Of FAs/subsidiaries 357.0 355.2 160.9 124.9Acq. Of Subsidiaries/investments 0.0 0.0 0.0 0.0Other Investing Cashflow 0.0 0.0 0.0 0.0Cash Flow From Investing 337.0 335.2 140.9 104.9Debt Raised/(repaid) (501.5) (196.0) (323.1) (258.5)Proceeds From Issue Of Shares 0.0 0.0 0.0 0.0Shares Repurchased 0.0 0.0 0.0 0.0Dividends Paid (116.0) (125.6) (125.6) (125.6)Preferred DividendsOther Financing Cashflow 109.7 (237.6) 57.0 (8.1)Cash Flow From Financing (507.7) (559.2) (391.7) (392.3)
Key Ratios
Dec-12A Dec-13F Dec-14F Dec-15FRevenue Growth 3.7% 5.9% 9.1% 0.8%Operating EBITDA Growth (22.0%) 96.5% 7.8% (2.2%)Operating EBITDA Margin 7.6% 14.1% 14.0% 13.6%Net Cash Per Share (RM) (1.45) (1.36) (1.09) (0.75)BVPS (RM) 2.66 3.05 3.48 3.92Gross Interest Cover 2.64 4.43 5.28 5.83Effective Tax Rate 18.4% 23.2% 23.2% 25.0%Net Dividend Payout Ratio 34.9% 31.5% 28.3% 28.7%Accounts Receivables Days 191.1 192.8 191.3 198.9Inventory Days N/A N/A N/A N/AAccounts Payables Days N/A N/A N/A N/AROIC (%) 9.1% 17.8% 18.6% 17.5%ROCE (%) 4.49% 8.40% 8.64% 8.14%
Key Drivers
(RMm) Dec-12A Dec-13F Dec-14F Dec-15FOutstanding Orderbook 3,300 3,800 4,300 4,800 Orderbook Depletion N/A N/A N/A N/AOrderbook Replenishment 1,500 1,500 1,500 1,500 ASP (% chg, main prod./serv.) N/A N/A N/A N/AUnit sales grth (%, main prod./serv.) N/A N/A N/A N/AUtil. rate (%, main prod./serv.) N/A N/A N/A N/AASP (% chg, 2ndary prod./serv.) N/A N/A N/A N/AUnit sales grth (%,2ndary prod/serv) N/A N/A N/A N/AUtil. rate (%, 2ndary prod/serv) N/A N/A N/A N/A
SOURCE: CIMB, COMPANY REPORTS
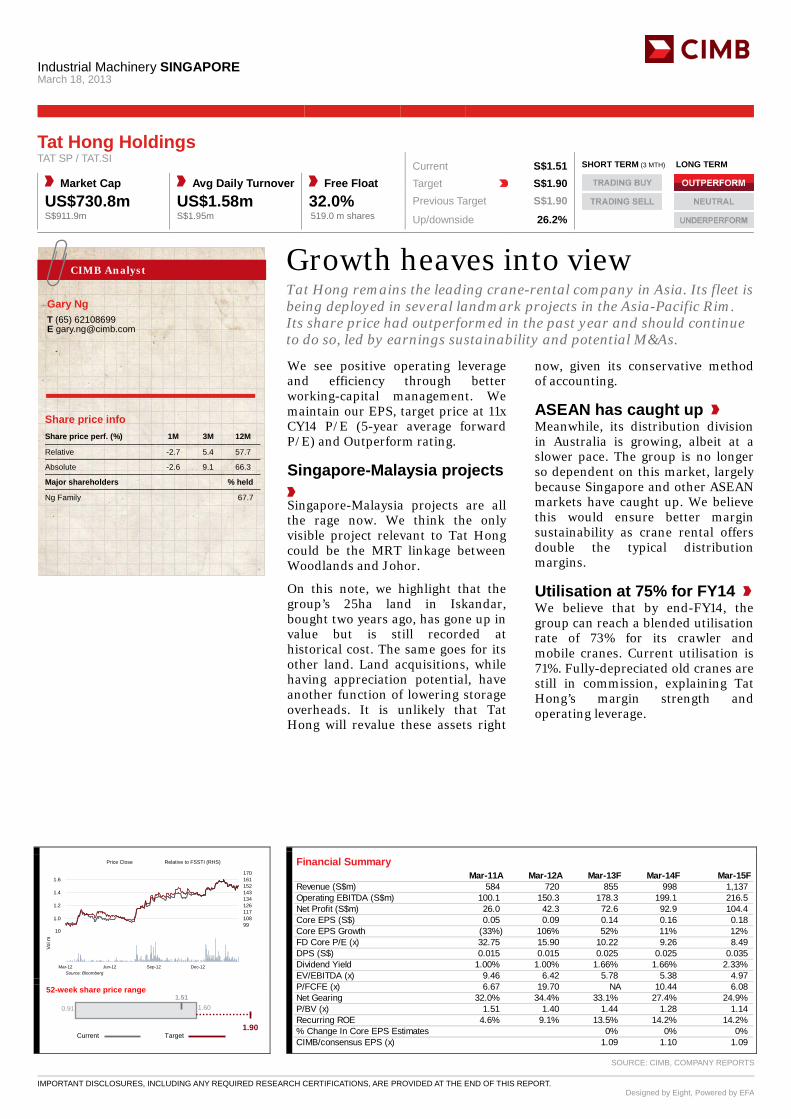
Industrial Machinery SINGAPORE
March 18, 2013
IMPORTANT DISCLOSURES, INCLUDING ANY REQUIRED RESEARCH CERTIFICATIONS, ARE PROVIDED AT THE END OF THIS REPORT. Designed by Eight, Powered by EFA
Growth heaves into view Tat Hong remains the leading crane-rental company in Asia. Its fleet is being deployed in several landmark projects in the Asia-Pacific Rim. Its share price had outperformed in the past year and should continue to do so, led by earnings sustainability and potential M&As. We see positive operating leverage and efficiency through better working-capital management. We maintain our EPS, target price at 11x CY14 P/E (5-year average forward P/E) and Outperform rating.
Singapore-Malaysia projects
Singapore-Malaysia projects are all the rage now. We think the only visible project relevant to Tat Hong could be the MRT linkage between Woodlands and Johor.
On this note, we highlight that the group’s 25ha land in Iskandar, bought two years ago, has gone up in value but is still recorded at historical cost. The same goes for its other land. Land acquisitions, while having appreciation potential, have another function of lowering storage overheads. It is unlikely that Tat Hong will revalue these assets right
now, given its conservative method of accounting.
ASEAN has caught up Meanwhile, its distribution division in Australia is growing, albeit at a slower pace. The group is no longer so dependent on this market, largely because Singapore and other ASEAN markets have caught up. We believe this would ensure better margin sustainability as crane rental offers double the typical distribution margins.
Utilisation at 75% for FY14 We believe that by end-FY14, the group can reach a blended utilisation rate of 73% for its crawler and mobile cranes. Current utilisation is 71%. Fully-depreciated old cranes are still in commission, explaining Tat Hong’s margin strength and operating leverage.
CIMB Analyst
Gary Ng
T (65) 62108699 E [email protected]
Tat Hong Holdings TAT SP / TAT.SI Current S$1.51 SHORT TERM (3 MTH) LONG TERM
Market Cap Avg Daily Turnover Free Float Target S$1.90 US$730.8m US$1.58m 32.0% Previous Target S$1.90 S$911.9m S$1.95m 519.0 m shares Up/downside 26.2%
Conviction| |
9099108117126134143152161170
0.8
1.0
1.2
1.4
1.6
Price Close Relative to FSSTI (RHS)
Source: Bloomberg
2468
10
Mar-12 Jun-12 Sep-12 Dec-12
Vol m
Financial Summary Mar-11A Mar-12A Mar-13F Mar-14F Mar-15F
Revenue (S$m) 584 720 855 998 1,137Operating EBITDA (S$m) 100.1 150.3 178.3 199.1 216.5Net Profit (S$m) 26.0 42.3 72.6 92.9 104.4Core EPS (S$) 0.05 0.09 0.14 0.16 0.18Core EPS Growth (33%) 106% 52% 11% 12%FD Core P/E (x) 32.75 15.90 10.22 9.26 8.49DPS (S$) 0.015 0.015 0.025 0.025 0.035Dividend Yield 1.00% 1.00% 1.66% 1.66% 2.33%EV/EBITDA (x) 9.46 6.42 5.78 5.38 4.97P/FCFE (x) 6.67 19.70 NA 10.44 6.08Net Gearing 32.0% 34.4% 33.1% 27.4% 24.9%P/BV (x) 1.51 1.40 1.44 1.28 1.14Recurring ROE 4.6% 9.1% 13.5% 14.2% 14.2%% Change In Core EPS Estimates 0% 0% 0%CIMB/consensus EPS (x) 1.09 1.10 1.09
1.51
1.90
0.91 1.60
Target
52-week share price range
Current
SOURCE: CIMB, COMPANY REPORTS
Share price info Share price perf. (%) 1M 3M 12M
Relative -2.7 5.4 57.7
Absolute -2.6 9.1 66.3
Major shareholders % held
Ng Family 67.7
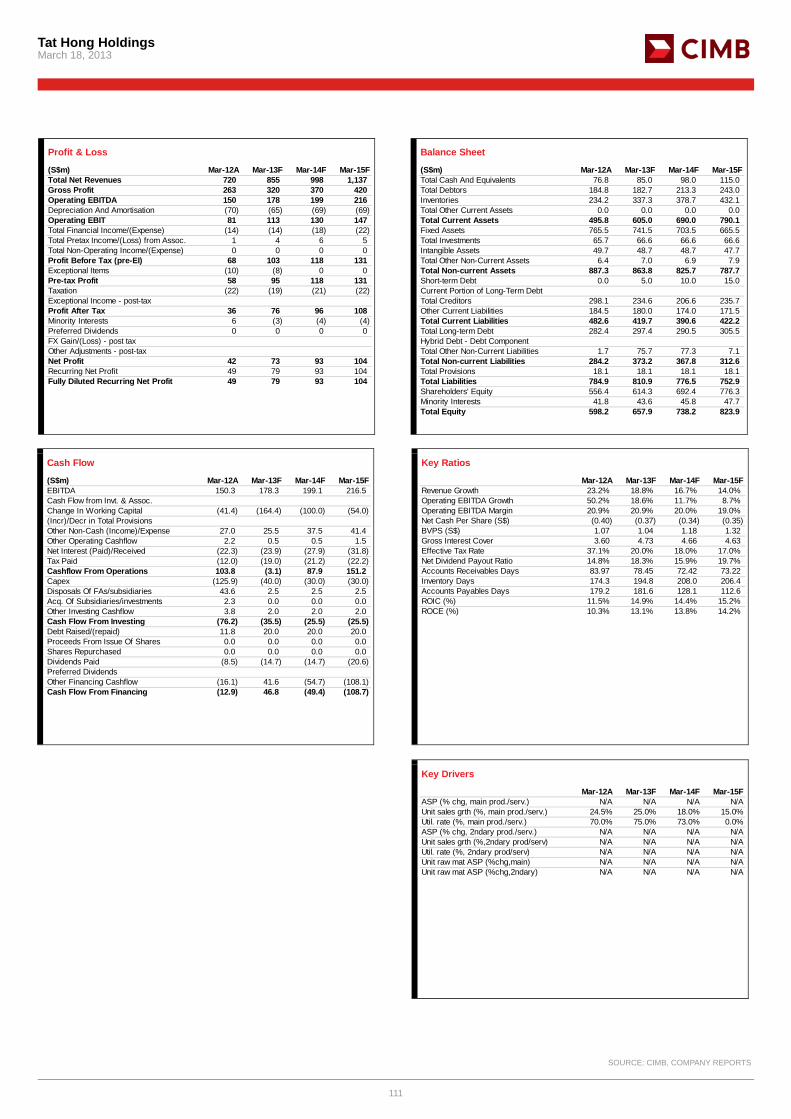
Tat Hong Holdings March 18, 2013
111
Profit & Loss
(S$m) Mar-12A Mar-13F Mar-14F Mar-15FTotal Net Revenues 720 855 998 1,137Gross Profit 263 320 370 420Operating EBITDA 150 178 199 216Depreciation And Amortisation (70) (65) (69) (69)Operating EBIT 81 113 130 147Total Financial Income/(Expense) (14) (14) (18) (22)Total Pretax Income/(Loss) from Assoc. 1 4 6 5Total Non-Operating Income/(Expense) 0 0 0 0Profit Before Tax (pre-EI) 68 103 118 131Exceptional Items (10) (8) 0 0Pre-tax Profit 58 95 118 131Taxation (22) (19) (21) (22)Exceptional Income - post-taxProfit After Tax 36 76 96 108Minority Interests 6 (3) (4) (4)Preferred Dividends 0 0 0 0FX Gain/(Loss) - post taxOther Adjustments - post-taxNet Profit 42 73 93 104Recurring Net Profit 49 79 93 104Fully Diluted Recurring Net Profit 49 79 93 104
Balance Sheet
(S$m) Mar-12A Mar-13F Mar-14F Mar-15FTotal Cash And Equivalents 76.8 85.0 98.0 115.0Total Debtors 184.8 182.7 213.3 243.0Inventories 234.2 337.3 378.7 432.1Total Other Current Assets 0.0 0.0 0.0 0.0Total Current Assets 495.8 605.0 690.0 790.1Fixed Assets 765.5 741.5 703.5 665.5Total Investments 65.7 66.6 66.6 66.6Intangible Assets 49.7 48.7 48.7 47.7Total Other Non-Current Assets 6.4 7.0 6.9 7.9Total Non-current Assets 887.3 863.8 825.7 787.7Short-term Debt 0.0 5.0 10.0 15.0Current Portion of Long-Term DebtTotal Creditors 298.1 234.6 206.6 235.7Other Current Liabilities 184.5 180.0 174.0 171.5Total Current Liabilities 482.6 419.7 390.6 422.2Total Long-term Debt 282.4 297.4 290.5 305.5Hybrid Debt - Debt ComponentTotal Other Non-Current Liabilities 1.7 75.7 77.3 7.1Total Non-current Liabilities 284.2 373.2 367.8 312.6Total Provisions 18.1 18.1 18.1 18.1Total Liabilities 784.9 810.9 776.5 752.9Shareholders' Equity 556.4 614.3 692.4 776.3Minority Interests 41.8 43.6 45.8 47.7Total Equity 598.2 657.9 738.2 823.9
Cash Flow
(S$m) Mar-12A Mar-13F Mar-14F Mar-15FEBITDA 150.3 178.3 199.1 216.5Cash Flow from Invt. & Assoc.Change In Working Capital (41.4) (164.4) (100.0) (54.0)(Incr)/Decr in Total ProvisionsOther Non-Cash (Income)/Expense 27.0 25.5 37.5 41.4Other Operating Cashflow 2.2 0.5 0.5 1.5Net Interest (Paid)/Received (22.3) (23.9) (27.9) (31.8)Tax Paid (12.0) (19.0) (21.2) (22.2)Cashflow From Operations 103.8 (3.1) 87.9 151.2Capex (125.9) (40.0) (30.0) (30.0)Disposals Of FAs/subsidiaries 43.6 2.5 2.5 2.5Acq. Of Subsidiaries/investments 2.3 0.0 0.0 0.0Other Investing Cashflow 3.8 2.0 2.0 2.0Cash Flow From Investing (76.2) (35.5) (25.5) (25.5)Debt Raised/(repaid) 11.8 20.0 20.0 20.0Proceeds From Issue Of Shares 0.0 0.0 0.0 0.0Shares Repurchased 0.0 0.0 0.0 0.0Dividends Paid (8.5) (14.7) (14.7) (20.6)Preferred DividendsOther Financing Cashflow (16.1) 41.6 (54.7) (108.1)Cash Flow From Financing (12.9) 46.8 (49.4) (108.7)
Key Ratios
Mar-12A Mar-13F Mar-14F Mar-15FRevenue Growth 23.2% 18.8% 16.7% 14.0%Operating EBITDA Growth 50.2% 18.6% 11.7% 8.7%Operating EBITDA Margin 20.9% 20.9% 20.0% 19.0%Net Cash Per Share (S$) (0.40) (0.37) (0.34) (0.35)BVPS (S$) 1.07 1.04 1.18 1.32Gross Interest Cover 3.60 4.73 4.66 4.63Effective Tax Rate 37.1% 20.0% 18.0% 17.0%Net Dividend Payout Ratio 14.8% 18.3% 15.9% 19.7%Accounts Receivables Days 83.97 78.45 72.42 73.22Inventory Days 174.3 194.8 208.0 206.4Accounts Payables Days 179.2 181.6 128.1 112.6ROIC (%) 11.5% 14.9% 14.4% 15.2%ROCE (%) 10.3% 13.1% 13.8% 14.2%
Key Drivers
Mar-12A Mar-13F Mar-14F Mar-15FASP (% chg, main prod./serv.) N/A N/A N/A N/AUnit sales grth (%, main prod./serv.) 24.5% 25.0% 18.0% 15.0%Util. rate (%, main prod./serv.) 70.0% 75.0% 73.0% 0.0%ASP (% chg, 2ndary prod./serv.) N/A N/A N/A N/AUnit sales grth (%,2ndary prod/serv) N/A N/A N/A N/AUtil. rate (%, 2ndary prod/serv) N/A N/A N/A N/AUnit raw mat ASP (%chg,main) N/A N/A N/A N/AUnit raw mat ASP (%chg,2ndary) N/A N/A N/A N/A
SOURCE: CIMB, COMPANY REPORTS
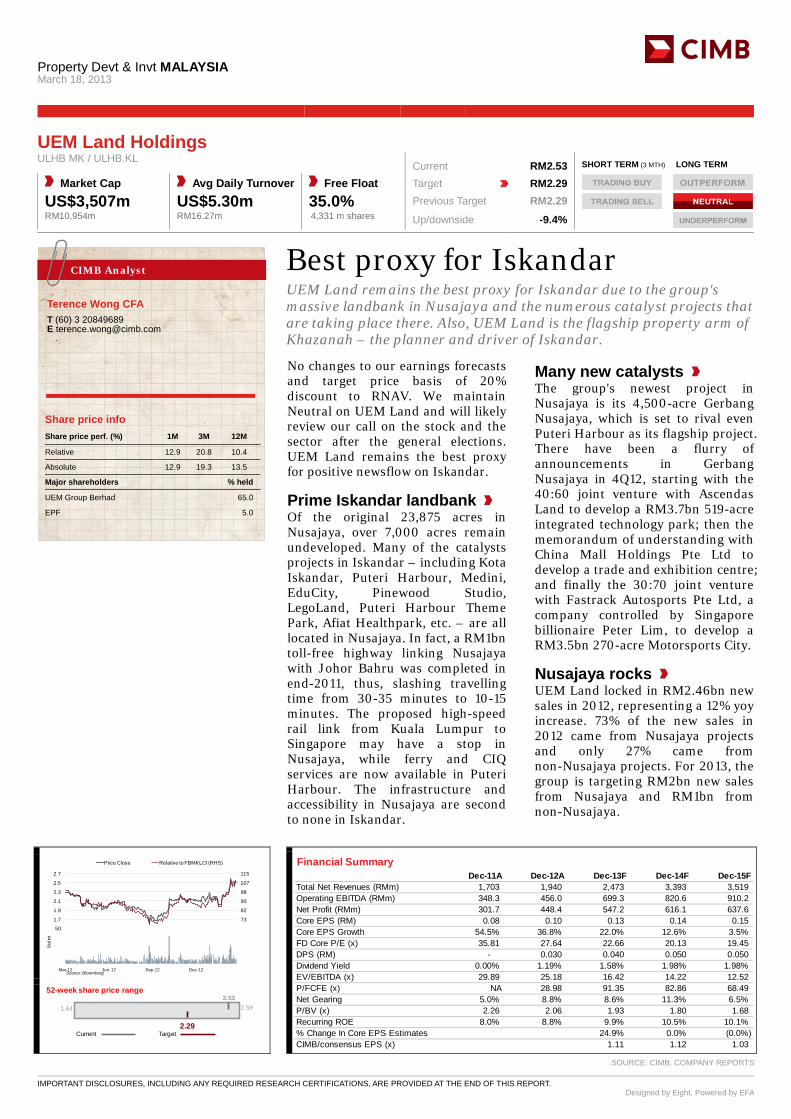
Property Devt & Invt MALAYSIA
March 18, 2013
IMPORTANT DISCLOSURES, INCLUDING ANY REQUIRED RESEARCH CERTIFICATIONS, ARE PROVIDED AT THE END OF THIS REPORT. Designed by Eight, Powered by EFA
Best proxy for Iskandar UEM Land remains the best proxy for Iskandar due to the group's massive landbank in Nusajaya and the numerous catalyst projects that are taking place there. Also, UEM Land is the flagship property arm of Khazanah – the planner and driver of Iskandar. No changes to our earnings forecasts and target price basis of 20% discount to RNAV. We maintain Neutral on UEM Land and will likely review our call on the stock and the sector after the general elections. UEM Land remains the best proxy for positive newsflow on Iskandar.
Prime Iskandar landbank Of the original 23,875 acres in Nusajaya, over 7,000 acres remain undeveloped. Many of the catalysts projects in Iskandar – including Kota Iskandar, Puteri Harbour, Medini, EduCity, Pinewood Studio, LegoLand, Puteri Harbour Theme Park, Afiat Healthpark, etc. – are all located in Nusajaya. In fact, a RM1bn toll-free highway linking Nusajaya with Johor Bahru was completed in end-2011, thus, slashing travelling time from 30-35 minutes to 10-15 minutes. The proposed high-speed rail link from Kuala Lumpur to Singapore may have a stop in Nusajaya, while ferry and CIQ services are now available in Puteri Harbour. The infrastructure and accessibility in Nusajaya are second to none in Iskandar.
Many new catalysts The group's newest project in Nusajaya is its 4,500-acre Gerbang Nusajaya, which is set to rival even Puteri Harbour as its flagship project. There have been a flurry of announcements in Gerbang Nusajaya in 4Q12, starting with the 40:60 joint venture with Ascendas Land to develop a RM3.7bn 519-acre integrated technology park; then the memorandum of understanding with China Mall Holdings Pte Ltd to develop a trade and exhibition centre; and finally the 30:70 joint venture with Fastrack Autosports Pte Ltd, a company controlled by Singapore billionaire Peter Lim, to develop a RM3.5bn 270-acre Motorsports City.
Nusajaya rocks UEM Land locked in RM2.46bn new sales in 2012, representing a 12% yoy increase. 73% of the new sales in 2012 came from Nusajaya projects and only 27% came from non-Nusajaya projects. For 2013, the group is targeting RM2bn new sales from Nusajaya and RM1bn from non-Nusajaya.
CIMB Analyst
Terence Wong CFA
T (60) 3 20849689 E [email protected]
UEM Land Holdings ULHB MK / ULHB.KL Current RM2.53 SHORT TERM (3 MTH) LONG TERM
Market Cap Avg Daily Turnover Free Float Target RM2.29 US$3,507m US$5.30m 35.0% Previous Target RM2.29 RM10,954m RM16.27m 4,331 m shares Up/downside -9.4%
Conviction| |
65
73
82
90
98
107
115
1.5
1.7
1.9
2.1
2.3
2.5
2.7
Price Close Relative to FBMKLCI (RHS)
Source: Bloomberg
1020304050
Mar-12 Jun-12 Sep-12 Dec-12
Vol m
Financial Summary Dec-11A Dec-12A Dec-13F Dec-14F Dec-15F
Total Net Revenues (RMm) 1,703 1,940 2,473 3,393 3,519Operating EBITDA (RMm) 348.3 456.0 699.3 820.6 910.2Net Profit (RMm) 301.7 448.4 547.2 616.1 637.6Core EPS (RM) 0.08 0.10 0.13 0.14 0.15Core EPS Growth 54.5% 36.8% 22.0% 12.6% 3.5%FD Core P/E (x) 35.81 27.64 22.66 20.13 19.45DPS (RM) - 0.030 0.040 0.050 0.050Dividend Yield 0.00% 1.19% 1.58% 1.98% 1.98%EV/EBITDA (x) 29.89 25.18 16.42 14.22 12.52P/FCFE (x) NA 28.98 91.35 82.86 68.49Net Gearing 5.0% 8.8% 8.6% 11.3% 6.5%P/BV (x) 2.26 2.06 1.93 1.80 1.68Recurring ROE 8.0% 8.8% 9.9% 10.5% 10.1%% Change In Core EPS Estimates 24.9% 0.0% (0.0%)CIMB/consensus EPS (x) 1.11 1.12 1.03
2.53
2.29
1.64 2.59
Target
52-week share price range
Current
SOURCE: CIMB, COMPANY REPORTS
Share price info Share price perf. (%) 1M 3M 12M
Relative 12.9 20.8 10.4
Absolute 12.9 19.3 13.5
Major shareholders % held
UEM Group Berhad 65.0
EPF 5.0

UEM Land Holdings March 18, 2013
113
Profit & Loss
(RMm) Dec-12A Dec-13F Dec-14F Dec-15FTotal Net Revenues 1,940 2,473 3,393 3,519Gross Profit 737 1,035 1,316 1,412Operating EBITDA 456 699 821 910Depreciation And Amortisation (20) (24) (24) (25)Operating EBIT 436 676 797 886Total Financial Income/(Expense) 9 (13) (17) (16)Total Pretax Income/(Loss) from Assoc. 89 59 89 58Total Non-Operating Income/(Expense) 0 0 0 0Profit Before Tax (pre-EI) 535 721 869 927Exceptional Items 0 0 0 0Pre-tax Profit 535 721 869 927Taxation (87) (159) (217) (232)Exceptional Income - post-taxProfit After Tax 448 563 651 696Minority Interests 0 (16) (35) (58)Pref. & Special Div 0 0 0 0FX Gain/(Loss) - post taxOther Adjustments - post-tax 0 0 0 0Net Profit 448 547 616 638Recurring Net Profit 448 547 616 638Fully Diluted Recurring Net Profit 448 547 616 638
Balance Sheet
(RMm) Dec-12A Dec-13F Dec-14F Dec-15FTotal Cash And Equivalents 1,205 1,081 1,103 1,125Properties Under DevelopmentTotal Debtors 1,802 2,297 3,153 3,269Inventories 123 125 128 130Total Other Current Assets 954 1,002 1,052 1,104Total Current Assets 4,084 4,506 5,435 5,629Fixed Assets 184 166 146 127Total Investments 1,222 1,264 1,328 1,369Intangible Assets 621 621 621 621Total Other Non-Current Assets 2,975 3,034 3,094 3,155Total Non-current Assets 5,003 5,085 5,190 5,273Short-term Debt 125 112 101 91Current Portion of Long-Term DebtTotal Creditors 713 908 1,247 1,293Other Current Liabilities 182 190 197 205Total Current Liabilities 1,020 1,211 1,545 1,589Total Long-term Debt 1,590 1,502 1,754 1,495Hybrid Debt - Debt ComponentTotal Other Non-Current Liabilities 409 422 434 447Total Non-current Liabilities 1,999 1,924 2,189 1,942Total Provisions 250 250 250 250Total Liabilities 3,269 3,384 3,984 3,781Shareholders' Equity 5,316 5,690 6,089 6,510Minority Interests 501 517 552 610Total Equity 5,817 6,207 6,641 7,120
Cash Flow
(RMm) Dec-12A Dec-13F Dec-14F Dec-15FEBITDA 456 699 821 910Cash Flow from Invt. & Assoc.Change In Working Capital (305) (197) (562) (118)Straight Line Adjustment(Incr)/Decr in Total ProvisionsOther Non-Cash (Income)/ExpenseOther Operating Cashflow 0 0 0 0Net Interest (Paid)/Received 9 (13) (17) (16)Tax Paid (80) (159) (217) (232)Cashflow From Operations 80 330 25 545Capex (41) (5) (5) (5)Disposals Of FAs/subsidiaries 0 0 0 0Disposals of Investment PropertiesAcq. Of Subsidiaries/investments (302) (101) (124) (103)Other Investing Cashflow 130 0 0 0Cash Flow From Investing (214) (106) (129) (108)Debt Raised/(repaid) 561 (88) 254 (256)Proceeds From Issue Of Shares 2 0 0 0Shares Repurchased 0 0 0 0Dividends Paid (130) (173) (217) (217)Preferred DividendsOther Financing Cashflow (3) (86) 89 58Cash Flow From Financing 430 (348) 126 (415)
Key Ratios
Dec-12A Dec-13F Dec-14F Dec-15FRevenue Growth 14% 27% 37% 4%Operating EBITDA Growth 31% 53% 17% 11%Operating EBITDA Margin 23.5% 28.3% 24.2% 25.9%Net Cash Per Share (RM) (0.12) (0.12) (0.17) (0.11)BVPS (RM) 1.23 1.31 1.41 1.50Gross Interest Cover 10.55 14.29 16.15 18.02Effective Tax Rate 16.3% 22.0% 25.0% 25.0%Net Dividend Payout Ratio 29.0% 31.7% 35.2% 34.0%Accounts Receivables Days 269.3 302.6 293.1 333.1Inventory Days 37.60 31.45 22.20 22.33Accounts Payables Days 105.0 123.0 113.2 131.5ROIC (%) 6.38% 8.79% 9.72% 9.84%ROCE (%) 6.7% 9.0% 9.9% 10.4%
Key Drivers
Dec-12A Dec-13F Dec-14F Dec-15FUnbooked Presales (m) (RM) N/A N/A N/A N/AUnbooked Presales (area: m sm) N/A N/A N/A N/AUnbooked Presales (units) N/A N/A N/A N/AUnsold attrib. landbank (area: m sm) 46.1 45.7 45.3 44.9 Gross Margins (%) 23.5% 28.3% 24.2% 25.9%Contracted Sales ASP (per Sm) (RM) N/A N/A N/A N/AResidential EBIT Margin (%) N/A N/A N/A N/AInvestment rev / total rev (%) N/A N/A N/A N/AResidential rev / total rev (%) N/A N/A N/A N/AInvt. properties rental margin (%) N/A N/A N/A N/ASG&A / Sales Ratio (%) N/A N/A N/A N/A
SOURCE: CIMB, COMPANY REPORTS
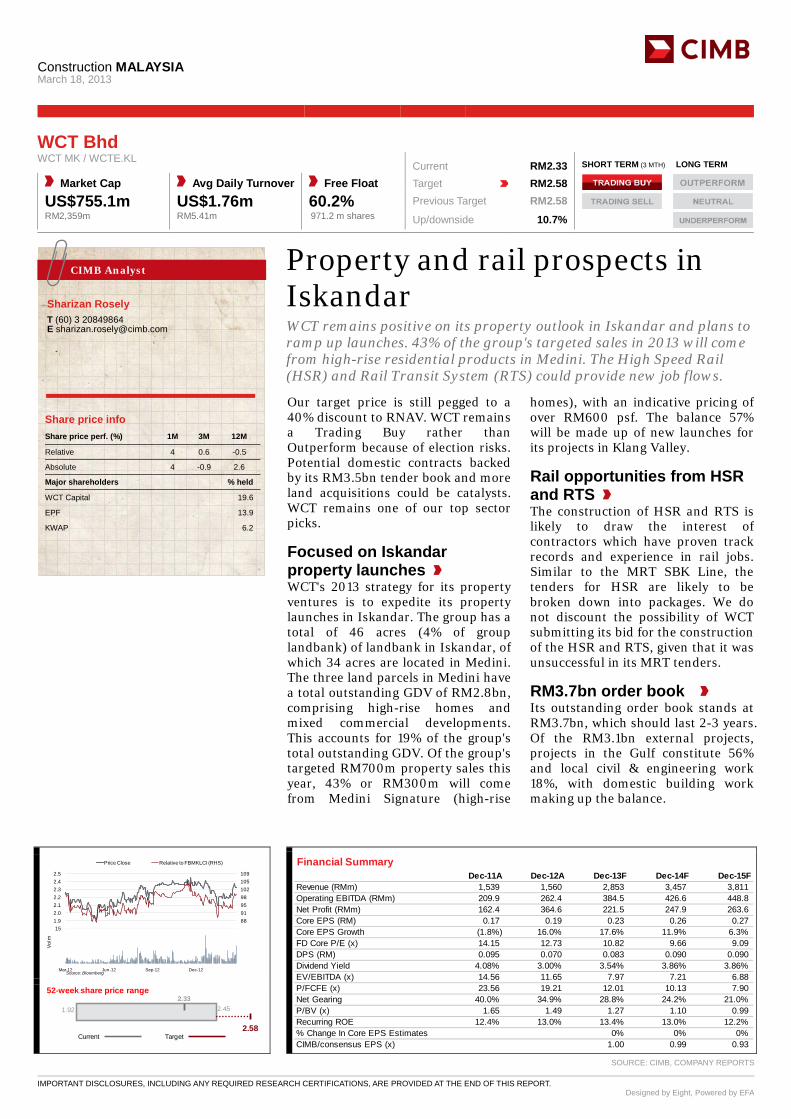
Construction MALAYSIA
March 18, 2013
IMPORTANT DISCLOSURES, INCLUDING ANY REQUIRED RESEARCH CERTIFICATIONS, ARE PROVIDED AT THE END OF THIS REPORT. Designed by Eight, Powered by EFA
Property and rail prospects in Iskandar WCT remains positive on its property outlook in Iskandar and plans to ramp up launches. 43% of the group's targeted sales in 2013 will come from high-rise residential products in Medini. The High Speed Rail (HSR) and Rail Transit System (RTS) could provide new job flows. Our target price is still pegged to a 40% discount to RNAV. WCT remains a Trading Buy rather than Outperform because of election risks. Potential domestic contracts backed by its RM3.5bn tender book and more land acquisitions could be catalysts. WCT remains one of our top sector picks.
Focused on Iskandar property launches WCT's 2013 strategy for its property ventures is to expedite its property launches in Iskandar. The group has a total of 46 acres (4% of group landbank) of landbank in Iskandar, of which 34 acres are located in Medini. The three land parcels in Medini have a total outstanding GDV of RM2.8bn, comprising high-rise homes and mixed commercial developments. This accounts for 19% of the group's total outstanding GDV. Of the group's targeted RM700m property sales this year, 43% or RM300m will come from Medini Signature (high-rise
homes), with an indicative pricing of over RM600 psf. The balance 57% will be made up of new launches for its projects in Klang Valley.
Rail opportunities from HSR and RTS The construction of HSR and RTS is likely to draw the interest of contractors which have proven track records and experience in rail jobs. Similar to the MRT SBK Line, the tenders for HSR are likely to be broken down into packages. We do not discount the possibility of WCT submitting its bid for the construction of the HSR and RTS, given that it was unsuccessful in its MRT tenders.
RM3.7bn order book Its outstanding order book stands at RM3.7bn, which should last 2-3 years. Of the RM3.1bn external projects, projects in the Gulf constitute 56% and local civil & engineering work 18%, with domestic building work making up the balance.
CIMB Analyst
Sharizan Rosely
T (60) 3 20849864 E [email protected]
WCT Bhd WCT MK / WCTE.KL Current RM2.33 SHORT TERM (3 MTH) LONG TERM
Market Cap Avg Daily Turnover Free Float Target RM2.58 US$755.1m US$1.76m 60.2% Previous Target RM2.58 RM2,359m RM5.41m 971.2 m shares Up/downside 10.7%
Conviction| |
8488919598102105109
1.81.92.02.12.22.32.42.5
Price Close Relative to FBMKLCI (RHS)
Source: Bloomberg
5
10
15
Mar-12 Jun-12 Sep-12 Dec-12
Vol m
Financial Summary Dec-11A Dec-12A Dec-13F Dec-14F Dec-15F
Revenue (RMm) 1,539 1,560 2,853 3,457 3,811Operating EBITDA (RMm) 209.9 262.4 384.5 426.6 448.8Net Profit (RMm) 162.4 364.6 221.5 247.9 263.6Core EPS (RM) 0.17 0.19 0.23 0.26 0.27Core EPS Growth (1.8%) 16.0% 17.6% 11.9% 6.3%FD Core P/E (x) 14.15 12.73 10.82 9.66 9.09DPS (RM) 0.095 0.070 0.083 0.090 0.090Dividend Yield 4.08% 3.00% 3.54% 3.86% 3.86%EV/EBITDA (x) 14.56 11.65 7.97 7.21 6.88P/FCFE (x) 23.56 19.21 12.01 10.13 7.90Net Gearing 40.0% 34.9% 28.8% 24.2% 21.0%P/BV (x) 1.65 1.49 1.27 1.10 0.99Recurring ROE 12.4% 13.0% 13.4% 13.0% 12.2%% Change In Core EPS Estimates 0% 0% 0%CIMB/consensus EPS (x) 1.00 0.99 0.93
2.33
2.58
1.92 2.45
Target
52-week share price range
Current
SOURCE: CIMB, COMPANY REPORTS
Share price info Share price perf. (%) 1M 3M 12M
Relative 4 0.6 -0.5
Absolute 4 -0.9 2.6
Major shareholders % held
WCT Capital 19.6
EPF 13.9
KWAP 6.2
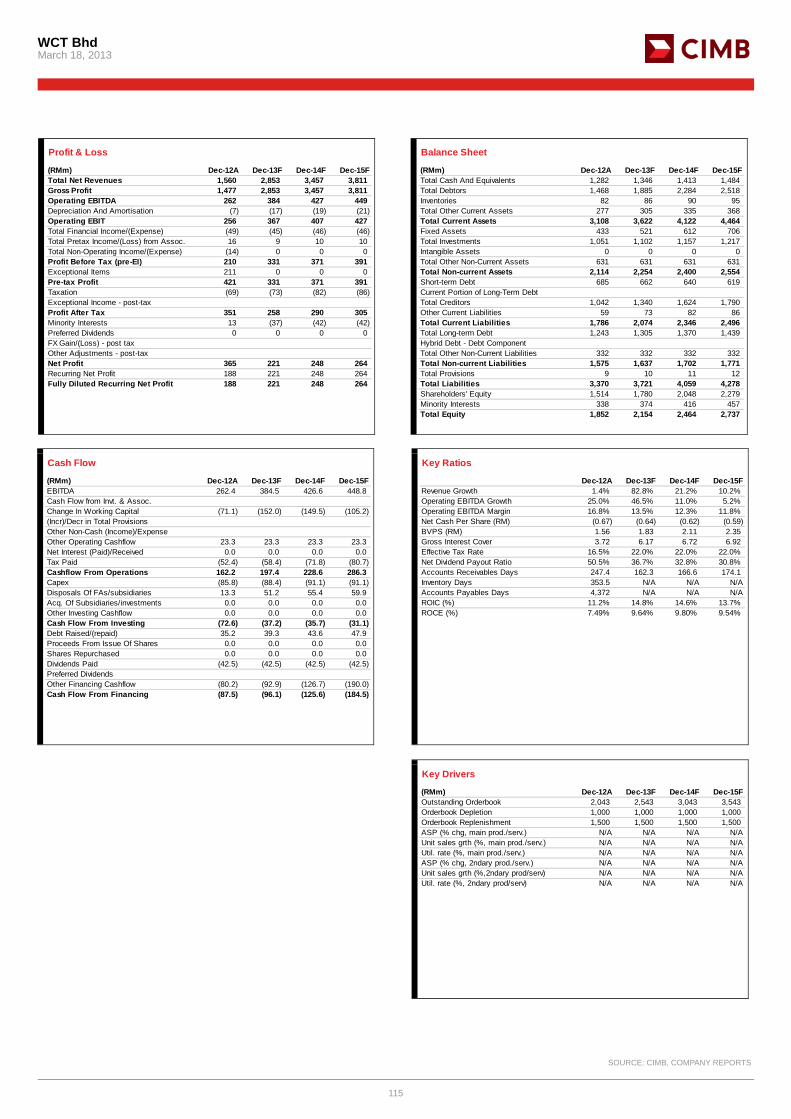
WCT Bhd March 18, 2013
115
Profit & Loss
(RMm) Dec-12A Dec-13F Dec-14F Dec-15FTotal Net Revenues 1,560 2,853 3,457 3,811Gross Profit 1,477 2,853 3,457 3,811Operating EBITDA 262 384 427 449Depreciation And Amortisation (7) (17) (19) (21)Operating EBIT 256 367 407 427Total Financial Income/(Expense) (49) (45) (46) (46)Total Pretax Income/(Loss) from Assoc. 16 9 10 10Total Non-Operating Income/(Expense) (14) 0 0 0Profit Before Tax (pre-EI) 210 331 371 391Exceptional Items 211 0 0 0Pre-tax Profit 421 331 371 391Taxation (69) (73) (82) (86)Exceptional Income - post-taxProfit After Tax 351 258 290 305Minority Interests 13 (37) (42) (42)Preferred Dividends 0 0 0 0FX Gain/(Loss) - post taxOther Adjustments - post-taxNet Profit 365 221 248 264Recurring Net Profit 188 221 248 264Fully Diluted Recurring Net Profit 188 221 248 264
Balance Sheet
(RMm) Dec-12A Dec-13F Dec-14F Dec-15FTotal Cash And Equivalents 1,282 1,346 1,413 1,484Total Debtors 1,468 1,885 2,284 2,518Inventories 82 86 90 95Total Other Current Assets 277 305 335 368Total Current Assets 3,108 3,622 4,122 4,464Fixed Assets 433 521 612 706Total Investments 1,051 1,102 1,157 1,217Intangible Assets 0 0 0 0Total Other Non-Current Assets 631 631 631 631Total Non-current Assets 2,114 2,254 2,400 2,554Short-term Debt 685 662 640 619Current Portion of Long-Term DebtTotal Creditors 1,042 1,340 1,624 1,790Other Current Liabilities 59 73 82 86Total Current Liabilities 1,786 2,074 2,346 2,496Total Long-term Debt 1,243 1,305 1,370 1,439Hybrid Debt - Debt ComponentTotal Other Non-Current Liabilities 332 332 332 332Total Non-current Liabilities 1,575 1,637 1,702 1,771Total Provisions 9 10 11 12Total Liabilities 3,370 3,721 4,059 4,278Shareholders' Equity 1,514 1,780 2,048 2,279Minority Interests 338 374 416 457Total Equity 1,852 2,154 2,464 2,737
Cash Flow
(RMm) Dec-12A Dec-13F Dec-14F Dec-15FEBITDA 262.4 384.5 426.6 448.8Cash Flow from Invt. & Assoc.Change In Working Capital (71.1) (152.0) (149.5) (105.2)(Incr)/Decr in Total ProvisionsOther Non-Cash (Income)/ExpenseOther Operating Cashflow 23.3 23.3 23.3 23.3Net Interest (Paid)/Received 0.0 0.0 0.0 0.0Tax Paid (52.4) (58.4) (71.8) (80.7)Cashflow From Operations 162.2 197.4 228.6 286.3Capex (85.8) (88.4) (91.1) (91.1)Disposals Of FAs/subsidiaries 13.3 51.2 55.4 59.9Acq. Of Subsidiaries/investments 0.0 0.0 0.0 0.0Other Investing Cashflow 0.0 0.0 0.0 0.0Cash Flow From Investing (72.6) (37.2) (35.7) (31.1)Debt Raised/(repaid) 35.2 39.3 43.6 47.9Proceeds From Issue Of Shares 0.0 0.0 0.0 0.0Shares Repurchased 0.0 0.0 0.0 0.0Dividends Paid (42.5) (42.5) (42.5) (42.5)Preferred DividendsOther Financing Cashflow (80.2) (92.9) (126.7) (190.0)Cash Flow From Financing (87.5) (96.1) (125.6) (184.5)
Key Ratios
Dec-12A Dec-13F Dec-14F Dec-15FRevenue Growth 1.4% 82.8% 21.2% 10.2%Operating EBITDA Growth 25.0% 46.5% 11.0% 5.2%Operating EBITDA Margin 16.8% 13.5% 12.3% 11.8%Net Cash Per Share (RM) (0.67) (0.64) (0.62) (0.59)BVPS (RM) 1.56 1.83 2.11 2.35Gross Interest Cover 3.72 6.17 6.72 6.92Effective Tax Rate 16.5% 22.0% 22.0% 22.0%Net Dividend Payout Ratio 50.5% 36.7% 32.8% 30.8%Accounts Receivables Days 247.4 162.3 166.6 174.1Inventory Days 353.5 N/A N/A N/AAccounts Payables Days 4,372 N/A N/A N/AROIC (%) 11.2% 14.8% 14.6% 13.7%ROCE (%) 7.49% 9.64% 9.80% 9.54%
Key Drivers
(RMm) Dec-12A Dec-13F Dec-14F Dec-15FOutstanding Orderbook 2,043 2,543 3,043 3,543 Orderbook Depletion 1,000 1,000 1,000 1,000 Orderbook Replenishment 1,500 1,500 1,500 1,500 ASP (% chg, main prod./serv.) N/A N/A N/A N/AUnit sales grth (%, main prod./serv.) N/A N/A N/A N/AUtil. rate (%, main prod./serv.) N/A N/A N/A N/AASP (% chg, 2ndary prod./serv.) N/A N/A N/A N/AUnit sales grth (%,2ndary prod/serv) N/A N/A N/A N/AUtil. rate (%, 2ndary prod/serv) N/A N/A N/A N/A
SOURCE: CIMB, COMPANY REPORTS
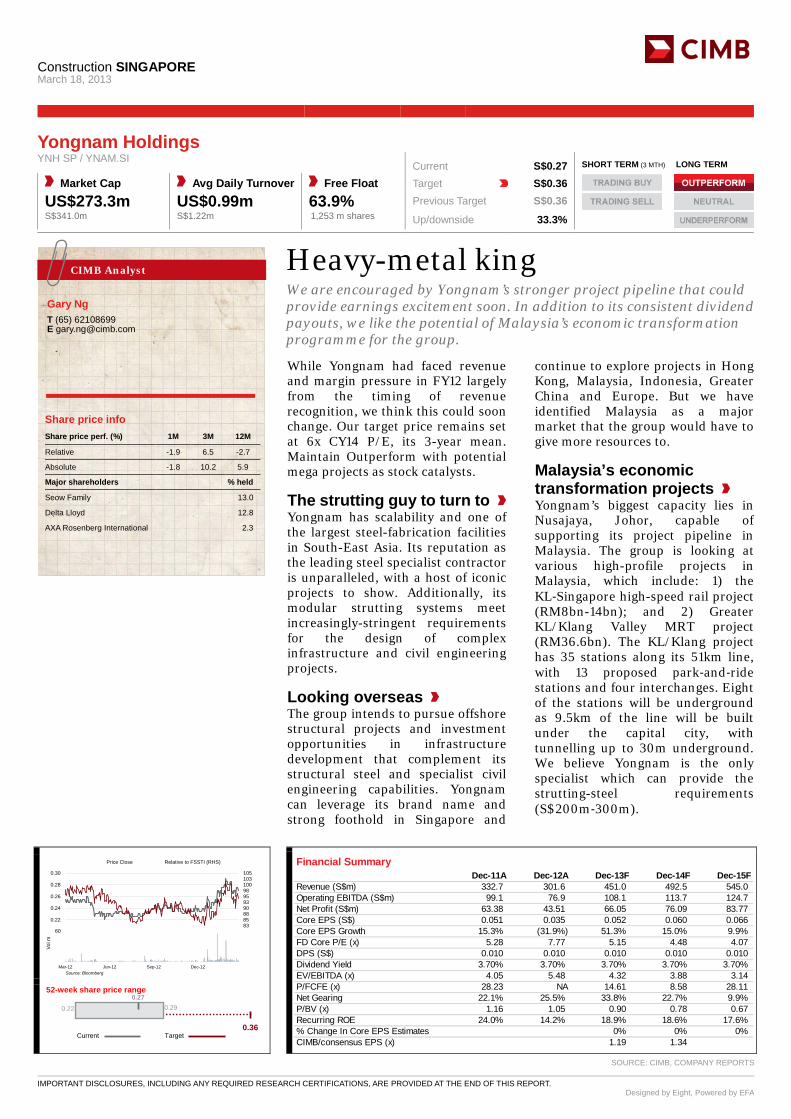
Construction SINGAPORE
March 18, 2013
IMPORTANT DISCLOSURES, INCLUDING ANY REQUIRED RESEARCH CERTIFICATIONS, ARE PROVIDED AT THE END OF THIS REPORT. Designed by Eight, Powered by EFA
Heavy-metal king We are encouraged by Yongnam’s stronger project pipeline that could provide earnings excitement soon. In addition to its consistent dividend payouts, we like the potential of Malaysia’s economic transformation programme for the group. While Yongnam had faced revenue and margin pressure in FY12 largely from the timing of revenue recognition, we think this could soon change. Our target price remains set at 6x CY14 P/E, its 3-year mean. Maintain Outperform with potential mega projects as stock catalysts.
The strutting guy to turn to Yongnam has scalability and one of the largest steel-fabrication facilities in South-East Asia. Its reputation as the leading steel specialist contractor is unparalleled, with a host of iconic projects to show. Additionally, its modular strutting systems meet increasingly-stringent requirements for the design of complex infrastructure and civil engineering projects.
Looking overseas The group intends to pursue offshore structural projects and investment opportunities in infrastructure development that complement its structural steel and specialist civil engineering capabilities. Yongnam can leverage its brand name and strong foothold in Singapore and
continue to explore projects in Hong Kong, Malaysia, Indonesia, Greater China and Europe. But we have identified Malaysia as a major market that the group would have to give more resources to.
Malaysia’s economic transformation projects Yongnam’s biggest capacity lies in Nusajaya, Johor, capable of supporting its project pipeline in Malaysia. The group is looking at various high-profile projects in Malaysia, which include: 1) the KL‐Singapore high-speed rail project (RM8bn-14bn); and 2) Greater KL/Klang Valley MRT project (RM36.6bn). The KL/Klang project has 35 stations along its 51km line, with 13 proposed park‐and‐ride stations and four interchanges. Eight of the stations will be underground as 9.5km of the line will be built under the capital city, with tunnelling up to 30m underground. We believe Yongnam is the only specialist which can provide the strutting-steel requirements (S$200m‐300m).
CIMB Analyst
Gary Ng
T (65) 62108699 E [email protected]
Yongnam Holdings YNH SP / YNAM.SI Current S$0.27 SHORT TERM (3 MTH) LONG TERM
Market Cap Avg Daily Turnover Free Float Target S$0.36 US$273.3m US$0.99m 63.9% Previous Target S$0.36 S$341.0m S$1.22m 1,253 m shares Up/downside 33.3%
Conviction| |
8083858890939598100103105
0.20
0.22
0.24
0.26
0.28
0.30
Price Close Relative to FSSTI (RHS)
Source: Bloomberg
20
40
60
Mar-12 Jun-12 Sep-12 Dec-12
Vol m
Financial Summary Dec-11A Dec-12A Dec-13F Dec-14F Dec-15F
Revenue (S$m) 332.7 301.6 451.0 492.5 545.0Operating EBITDA (S$m) 99.1 76.9 108.1 113.7 124.7Net Profit (S$m) 63.38 43.51 66.05 76.09 83.77Core EPS (S$) 0.051 0.035 0.052 0.060 0.066Core EPS Growth 15.3% (31.9%) 51.3% 15.0% 9.9%FD Core P/E (x) 5.28 7.77 5.15 4.48 4.07DPS (S$) 0.010 0.010 0.010 0.010 0.010Dividend Yield 3.70% 3.70% 3.70% 3.70% 3.70%EV/EBITDA (x) 4.05 5.48 4.32 3.88 3.14P/FCFE (x) 28.23 NA 14.61 8.58 28.11Net Gearing 22.1% 25.5% 33.8% 22.7% 9.9%P/BV (x) 1.16 1.05 0.90 0.78 0.67Recurring ROE 24.0% 14.2% 18.9% 18.6% 17.6%% Change In Core EPS Estimates 0% 0% 0%CIMB/consensus EPS (x) 1.19 1.34
0.27
0.36
0.22 0.29
Target
52-week share price range
Current
SOURCE: CIMB, COMPANY REPORTS
Share price info Share price perf. (%) 1M 3M 12M
Relative -1.9 6.5 -2.7
Absolute -1.8 10.2 5.9
Major shareholders % held
Seow Family 13.0
Delta Lloyd 12.8
AXA Rosenberg International 2.3
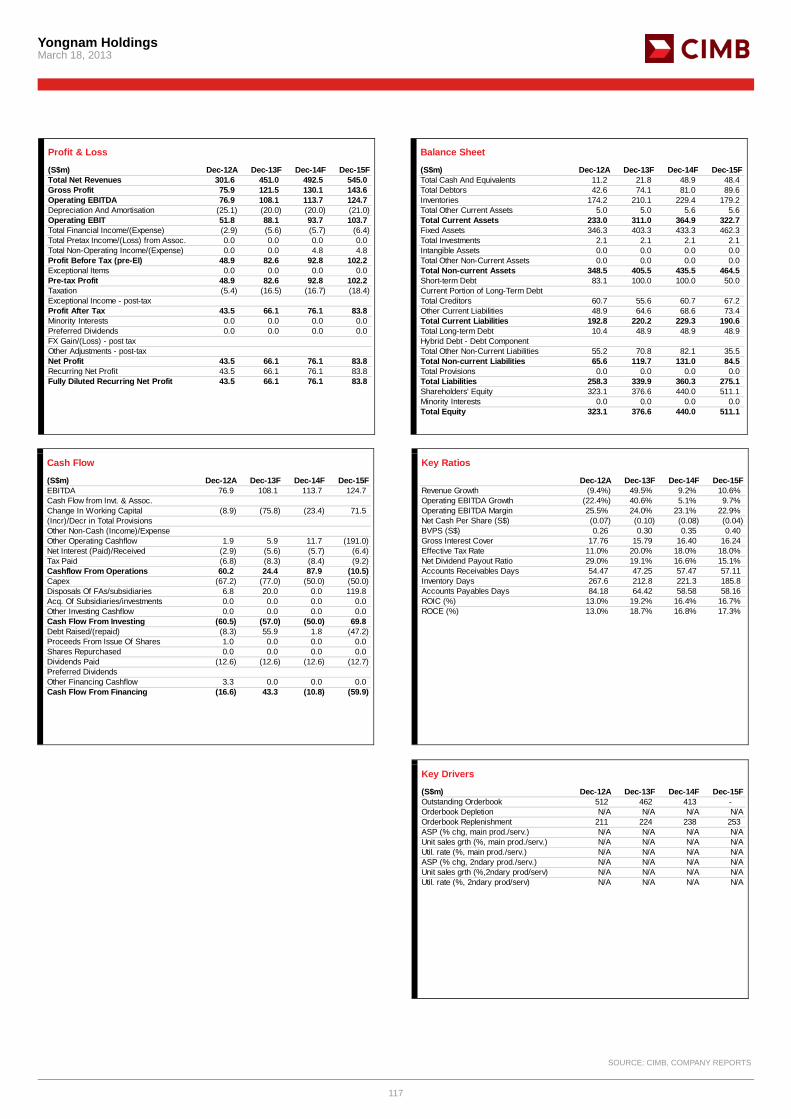
Yongnam Holdings March 18, 2013
117
Profit & Loss
(S$m) Dec-12A Dec-13F Dec-14F Dec-15FTotal Net Revenues 301.6 451.0 492.5 545.0Gross Profit 75.9 121.5 130.1 143.6Operating EBITDA 76.9 108.1 113.7 124.7Depreciation And Amortisation (25.1) (20.0) (20.0) (21.0)Operating EBIT 51.8 88.1 93.7 103.7Total Financial Income/(Expense) (2.9) (5.6) (5.7) (6.4)Total Pretax Income/(Loss) from Assoc. 0.0 0.0 0.0 0.0Total Non-Operating Income/(Expense) 0.0 0.0 4.8 4.8Profit Before Tax (pre-EI) 48.9 82.6 92.8 102.2Exceptional Items 0.0 0.0 0.0 0.0Pre-tax Profit 48.9 82.6 92.8 102.2Taxation (5.4) (16.5) (16.7) (18.4)Exceptional Income - post-taxProfit After Tax 43.5 66.1 76.1 83.8Minority Interests 0.0 0.0 0.0 0.0Preferred Dividends 0.0 0.0 0.0 0.0FX Gain/(Loss) - post taxOther Adjustments - post-taxNet Profit 43.5 66.1 76.1 83.8Recurring Net Profit 43.5 66.1 76.1 83.8Fully Diluted Recurring Net Profit 43.5 66.1 76.1 83.8
Balance Sheet
(S$m) Dec-12A Dec-13F Dec-14F Dec-15FTotal Cash And Equivalents 11.2 21.8 48.9 48.4Total Debtors 42.6 74.1 81.0 89.6Inventories 174.2 210.1 229.4 179.2Total Other Current Assets 5.0 5.0 5.6 5.6Total Current Assets 233.0 311.0 364.9 322.7Fixed Assets 346.3 403.3 433.3 462.3Total Investments 2.1 2.1 2.1 2.1Intangible Assets 0.0 0.0 0.0 0.0Total Other Non-Current Assets 0.0 0.0 0.0 0.0Total Non-current Assets 348.5 405.5 435.5 464.5Short-term Debt 83.1 100.0 100.0 50.0Current Portion of Long-Term DebtTotal Creditors 60.7 55.6 60.7 67.2Other Current Liabilities 48.9 64.6 68.6 73.4Total Current Liabilities 192.8 220.2 229.3 190.6Total Long-term Debt 10.4 48.9 48.9 48.9Hybrid Debt - Debt ComponentTotal Other Non-Current Liabilities 55.2 70.8 82.1 35.5Total Non-current Liabilities 65.6 119.7 131.0 84.5Total Provisions 0.0 0.0 0.0 0.0Total Liabilities 258.3 339.9 360.3 275.1Shareholders' Equity 323.1 376.6 440.0 511.1Minority Interests 0.0 0.0 0.0 0.0Total Equity 323.1 376.6 440.0 511.1
Cash Flow
(S$m) Dec-12A Dec-13F Dec-14F Dec-15FEBITDA 76.9 108.1 113.7 124.7Cash Flow from Invt. & Assoc.Change In Working Capital (8.9) (75.8) (23.4) 71.5(Incr)/Decr in Total ProvisionsOther Non-Cash (Income)/ExpenseOther Operating Cashflow 1.9 5.9 11.7 (191.0)Net Interest (Paid)/Received (2.9) (5.6) (5.7) (6.4)Tax Paid (6.8) (8.3) (8.4) (9.2)Cashflow From Operations 60.2 24.4 87.9 (10.5)Capex (67.2) (77.0) (50.0) (50.0)Disposals Of FAs/subsidiaries 6.8 20.0 0.0 119.8Acq. Of Subsidiaries/investments 0.0 0.0 0.0 0.0Other Investing Cashflow 0.0 0.0 0.0 0.0Cash Flow From Investing (60.5) (57.0) (50.0) 69.8Debt Raised/(repaid) (8.3) 55.9 1.8 (47.2)Proceeds From Issue Of Shares 1.0 0.0 0.0 0.0Shares Repurchased 0.0 0.0 0.0 0.0Dividends Paid (12.6) (12.6) (12.6) (12.7)Preferred DividendsOther Financing Cashflow 3.3 0.0 0.0 0.0Cash Flow From Financing (16.6) 43.3 (10.8) (59.9)
Key Ratios
Dec-12A Dec-13F Dec-14F Dec-15FRevenue Growth (9.4%) 49.5% 9.2% 10.6%Operating EBITDA Growth (22.4%) 40.6% 5.1% 9.7%Operating EBITDA Margin 25.5% 24.0% 23.1% 22.9%Net Cash Per Share (S$) (0.07) (0.10) (0.08) (0.04)BVPS (S$) 0.26 0.30 0.35 0.40Gross Interest Cover 17.76 15.79 16.40 16.24Effective Tax Rate 11.0% 20.0% 18.0% 18.0%Net Dividend Payout Ratio 29.0% 19.1% 16.6% 15.1%Accounts Receivables Days 54.47 47.25 57.47 57.11Inventory Days 267.6 212.8 221.3 185.8Accounts Payables Days 84.18 64.42 58.58 58.16ROIC (%) 13.0% 19.2% 16.4% 16.7%ROCE (%) 13.0% 18.7% 16.8% 17.3%
Key Drivers
(S$m) Dec-12A Dec-13F Dec-14F Dec-15FOutstanding Orderbook 512 462 413 - Orderbook Depletion N/A N/A N/A N/AOrderbook Replenishment 211 224 238 253 ASP (% chg, main prod./serv.) N/A N/A N/A N/AUnit sales grth (%, main prod./serv.) N/A N/A N/A N/AUtil. rate (%, main prod./serv.) N/A N/A N/A N/AASP (% chg, 2ndary prod./serv.) N/A N/A N/A N/AUnit sales grth (%,2ndary prod/serv) N/A N/A N/A N/AUtil. rate (%, 2ndary prod/serv) N/A N/A N/A N/A
SOURCE: CIMB, COMPANY REPORTS

March 18, 2013
118
Notes:
March 18, 2013
119
DISCLAIMER This report is not directed to, or intended for distribution to or use by, any person or entity who is a citizen or resident of or located in any locality, state, country or other jurisdiction where such distribution, publication, availability or use would be contrary to law or regulation. By accepting this report, the recipient hereof represents and warrants that he is entitled to receive such report in accordance with the restrictions set forth below and agrees to be bound by the limitations contained herein (including the “Restrictions on Distributions” set out below). Any failure to comply with these limitations may constitute a violation of law. This publication is being supplied to you strictly on the basis that it will remain confidential. No part of this report may be (i) copied, photocopied, duplicated, stored or reproduced in any form by any means or (ii) redistributed or passed on, directly or indirectly, to any other person in whole or in part, for any purpose without the prior written consent of CIMB. Unless otherwise specified, this report is based upon sources which CIMB considers to be reasonable. Such sources will, unless otherwise specified, for market data, be market data and prices available from the main stock exchange or market where the relevant security is listed, or, where appropriate, any other market. Information on the accounts and business of company(ies) will generally be based on published statements of the company(ies), information disseminated by regulatory information services, other publicly available information and information resulting from our research. Whilst every effort is made to ensure that statements of facts made in this report are accurate, all estimates, projections, forecasts, expressions of opinion and other subjective judgments contained in this report are based on assumptions considered to be reasonable as of the date of the document in which they are contained and must not be construed as a representation that the matters referred to therein will occur. Past performance is not a reliable indicator of future performance. The value of investments may go down as well as up and those investing may, depending on the investments in question, lose more than the initial investment. No report shall constitute an offer or an invitation by or on behalf of CIMB or its affiliates to any person to buy or sell any investments. CIMB, its affiliates and related companies, their directors, associates, connected parties and/or employees may own or have positions in securities of the company(ies) covered in this research report or any securities related thereto and may from time to time add to or dispose of, or may be materially interested in, any such securities. Further, CIMB, its affiliates and its related companies do and seek to do business with the company(ies) covered in this research report and may from time to time act as market maker or have assumed an underwriting commitment in securities of such company(ies), may sell them to or buy them from customers on a principal basis and may also perform or seek to perform significant investment banking, advisory, underwriting or placement services for or relating to such company(ies) as well as solicit such investment, advisory or other services from any entity mentioned in this report. CIMB or its affiliates may enter into an agreement with the company(ies) covered in this report relating to the production of research reports. CIMB may disclose the contents of this report to the company(ies) covered by it and may have amended the contents of this report following such disclosure. The analyst responsible for the production of this report hereby certifies that the views expressed herein accurately and exclusively reflect his or her personal views and opinions about any and all of the issuers or securities analysed in this report and were prepared independently and autonomously. No part of the compensation of the analyst(s) was, is, or will be directly or indirectly related to the inclusion of specific recommendations(s) or view(s) in this report. CIMB prohibits the analyst(s) who prepared this research report from receiving any compensation, incentive or bonus based on specific investment banking transactions or for providing a specific recommendation for, or view of, a particular company. Information barriers and other arrangements may be established where necessary to prevent conflicts of interests arising. However, the analyst(s) may receive compensation that is based on his/their coverage of company(ies) in the performance of his/their duties or the performance of his/their recommendations and the research personnel involved in the preparation of this report may also participate in the solicitation of the businesses as described above. In reviewing this research report, an investor should be aware that any or all of the foregoing, among other things, may give rise to real or potential conflicts of interest. Additional information is, subject to the duties of confidentiality, available on request. Reports relating to a specific geographical area are produced by the corresponding CIMB entity as listed in the table below. The term “CIMB” shall denote, where appropriate, the relevant entity distributing or disseminating the report in the particular jurisdiction referenced below, or, in every other case, CIMB Group Holdings Berhad ("CIMBGH") and its affiliates, subsidiaries and related companies.
Country CIMB Entity Regulated by Australia CIMB Securities (Australia) Limited Australian Securities & Investments Commission Hong Kong CIMB Securities Limited Securities and Futures Commission Hong Kong Indonesia PT CIMB Securities Indonesia Badan Pengawas Pasar Modal & Lembaga Keuangan (Bapepam) India CIMB Securities (India) Private Limited Securities and Exchange Board of India (SEBI) Malaysia CIMB Investment Bank Berhad Securities Commission Malaysia Singapore CIMB Research Pte. Ltd. Monetary Authority of Singapore South Korea CIMB Securities Limited, Korea Branch Financial Services Commission and Financial Supervisory Service Thailand CIMB Securities (Thailand) Co. Ltd. Securities and Exchange Commission Thailand
(i) As of March 17, 2013, CIMB has a proprietary position in the securities (which may include but not limited to shares, warrants, call warrants and/or any other derivatives) in the following company or companies covered or recommended in this report: (a) Affin Holdings, AirAsia Bhd, Alliance Financial Group, AMMB Holdings, Ascendas REIT, Astro Malaysia, Axiata Group, Berjaya Sports Toto, BIMB Holdings, British American Tobacco, Bumi Armada, Bursa Malaysia, Cache Logistics Trust, Capitacommercial Trust, CapitaLand, CapitaMall Trust, Dialog Group, DiGi.com, DRB-Hicom, Eastern & Oriental, Felda Global Ventures, Frasers Centrepoint Trust, Frasers Commercial Trust, Gamuda, Gas Malaysia Berhad, Genting Bhd, Genting Malaysia, Genting Plantations, Hartalega Holdings, Hong Leong Bank, IGB REIT, IJM Corp Bhd, IOI Corporation, JCY International, KLCC Property Holdings, Kuala Lumpur Kepong, Mah Sing Group, Malayan Banking Bhd, Malaysia Airports Holdings, Malaysia Marine & Heavy Eng, Malaysian Airline System, Malaysian Bulk Carriers, Malaysian Resources Corp, Mapletree Logistics Trust, Maxis Berhad, Media Prima Bhd, MISC Bhd, MMC Corp Bhd, Mudajaya Group, Petronas Chemical Group, Petronas Dagangan, Petronas Gas, Public Bank Bhd, RHB Capital Bhd, SapuraKencana Petroleum, Sime Darby Bhd, SP Setia, Starhill Global REIT, Suntec REIT, Sunway Bhd, Sunway REIT, Supermax Corp, Tan Chong Motor Holdings, Telekom Malaysia, Tenaga Nasional, Top Glove Corporation, TSH Resources, UEM Land Holdings, UMW Holdings, UOA Development, Wah Seong Corp, WCT Bhd, YTL Corp Bhd, YTL Power International| (ii) As of March 18, 2013, the analyst(s) who prepared this report, has / have an interest in the securities (which may include but not limited to shares, warrants, call warrants and/or any other derivatives) in the following company or companies covered or recommended in this report: (a) - |
The information contained in this research report is prepared from data believed to be correct and reliable at the time of issue of this report. CIMB may or may not issue regular reports on the subject matter of this report at any frequency and may cease to do so or change the periodicity of reports at any time. CIMB is under no obligation to update this report in the event of a material change to the information contained in this report. This report does not purport to contain all the information that a prospective investor may require. CIMB or any of its affiliates does not make any guarantee, representation or warranty, express or implied, as to the adequacy, accuracy, completeness, reliability or fairness of any such information and opinion contained in this report. Neither CIMB nor any of its affiliates nor its related persons shall be liable in any manner whatsoever for any consequences (including but not limited to any direct, indirect or consequential losses, loss of profits and damages) of any reliance thereon or usage thereof. This report is general in nature and has been prepared for information purposes only. It is intended for circulation amongst CIMB and its affiliates’ clients generally and does not have regard to the specific investment objectives, financial situation and the particular needs of any specific person who may receive this report. The information and opinions in this report are not and should not be construed or considered as an offer, recommendation or solicitation to buy or sell the subject securities, related investments or other financial instruments thereof. Investors are advised to make their own independent evaluation of the information contained in this research report, consider their own individual investment objectives, financial situation and particular needs and consult their own professional and financial advisers as to the legal, business, financial, tax and other aspects before participating in any transaction in respect of the securities of company(ies) covered in this research report. The securities of such company(ies) may not be eligible for sale in all jurisdictions or to all categories of investors. Australia: Despite anything in this report to the contrary, this research is provided in Australia by CIMB Securities (Australia) Limited (“CSAL”) (ABN 84 002 768 701, AFS Licence number 240 530). CSAL is a Market Participant of ASX Ltd, a Clearing Participant of ASX Clear Pty Ltd, a Settlement Participant of ASX Settlement Pty Ltd, and, a participant of Chi X
March 18, 2013
120
Australia Pty Ltd. This research is only available in Australia to persons who are “wholesale clients” (within the meaning of the Corporations Act 2001 (Cth)) and is supplied solely for the use of such wholesale clients and shall not be distributed or passed on to any other person. This research has been prepared without taking into account the objectives, financial situation or needs of the individual recipient. France: Only qualified investors within the meaning of French law shall have access to this report. This report shall not be considered as an offer to subscribe to, or used in connection with, any offer for subscription or sale or marketing or direct or indirect distribution of financial instruments and it is not intended as a solicitation for the purchase of any financial instrument. Hong Kong: This report is issued and distributed in Hong Kong by CIMB Securities Limited (“CHK”) which is licensed in Hong Kong by the Securities and Futures Commission for Type 1 (dealing in securities), Type 4 (advising on securities) and Type 6 (advising on corporate finance) activities. Any investors wishing to purchase or otherwise deal in the securities covered in this report should contact the Head of Sales at CIMB Securities Limited. The views and opinions in this research report are our own as of the date hereof and are subject to change. If the Financial Services and Markets Act of the United Kingdom or the rules of the Financial Services Authority apply to a recipient, our obligations owed to such recipient therein are unaffected. CHK has no obligation to update its opinion or the information in this research report. This publication is strictly confidential and is for private circulation only to clients of CHK. This publication is being supplied to you strictly on the basis that it will remain confidential. No part of this material may be (i) copied, photocopied, duplicated, stored or reproduced in any form by any means or (ii) redistributed or passed on, directly or indirectly, to any other person in whole or in part, for any purpose without the prior written consent of CHK. Unless permitted to do so by the securities laws of Hong Kong, no person may issue or have in its possession for the purposes of issue, whether in Hong Kong or elsewhere, any advertisement, invitation or document relating to the securities covered in this report, which is directed at, or the contents of which are likely to be accessed or read by, the public in Hong Kong (except if permitted to do so under the securities laws of Hong Kong). India: This report is issued and distributed in India by CIMB Securities (India) Private Limited (“CIMB India”) which is registered with SEBI as a stock-broker under the Securities and Exchange Board of India (Stock Brokers and Sub-Brokers) Regulations, 1992 and in accordance with the provisions of Regulation 4 (g) of the Securities and Exchange Board of India (Investment Advisers) Regulations, 2013, CIMB India is not required to seek registration with SEBI as an Investment Adviser. The research analysts, strategists or economists principally responsible for the preparation of this research report are segregated from the other activities of CIMB India and they have received compensation based upon various factors, including quality, accuracy and value of research, firm profitability or revenues, client feedback and competitive factors. Research analysts', strategists' or economists' compensation is not linked to investment banking or capital markets transactions performed or proposed to be performed by CIMB India or its affiliates. Indonesia: This report is issued and distributed by PT CIMB Securities Indonesia (“CIMBI”). The views and opinions in this research report are our own as of the date hereof and are subject to change. If the Financial Services and Markets Act of the United Kingdom or the rules of the Financial Services Authority apply to a recipient, our obligations owed to such recipient therein are unaffected. CIMBI has no obligation to update its opinion or the information in this research report. This publication is strictly confidential and is for private circulation only to clients of CIMBI. This publication is being supplied to you strictly on the basis that it will remain confidential. No part of this material may be (i) copied, photocopied, duplicated, stored or reproduced in any form by any means or (ii) redistributed or passed on, directly or indirectly, to any other person in whole or in part, for any purpose without the prior written consent of CIMBI. Neither this report nor any copy hereof may be distributed in Indonesia or to any Indonesian citizens wherever they are domiciled or to Indonesia residents except in compliance with applicable Indonesian capital market laws and regulations. Malaysia: This report is issued and distributed by CIMB Investment Bank Berhad (“CIMB”). The views and opinions in this research report are our own as of the date hereof and are subject to change. If the Financial Services and Markets Act of the United Kingdom or the rules of the Financial Services Authority apply to a recipient, our obligations owed to such recipient therein are unaffected. CIMB has no obligation to update its opinion or the information in this research report. This publication is strictly confidential and is for private circulation only to clients of CIMB. This publication is being supplied to you strictly on the basis that it will remain confidential. No part of this material may be (i) copied, photocopied, duplicated, stored or reproduced in any form by any means or (ii) redistributed or passed on, directly or indirectly, to any other person in whole or in part, for any purpose without the prior written consent of CIMB. New Zealand: In New Zealand, this report is for distribution only to persons whose principal business is the investment of money or who, in the course of, and for the purposes of their business, habitually invest money pursuant to Section 3(2)(a)(ii) of the Securities Act 1978. Singapore: This report is issued and distributed by CIMB Research Pte Ltd (“CIMBR”). Recipients of this report are to contact CIMBR in Singapore in respect of any matters arising from, or in connection with, this report. The views and opinions in this research report are our own as of the date hereof and are subject to change. If the Financial Services and Markets Act of the United Kingdom or the rules of the Financial Services Authority apply to a recipient, our obligations owed to such recipient therein are unaffected. CIMBR has no obligation to update its opinion or the information in this research report. This publication is strictly confidential and is for private circulation only. If the recipient of this research report is not an accredited investor, expert investor or institutional investor, CIMBR accepts legal responsibility for the contents of the report without any disclaimer limiting or otherwise curtailing such legal responsibility. This publication is being supplied to you strictly on the basis that it will remain confidential. No part of this material may be (i) copied, photocopied, duplicated, stored or reproduced in any form by any means or (ii) redistributed or passed on, directly or indirectly, to any other person in whole or in part, for any purpose without the prior written consent of CIMBR. As of March 17, 2013, CIMBR does not have a proprietary position in the recommended securities in this report. South Korea: This report is issued and distributed in South Korea by CIMB Securities Limited, Korea Branch ("CIMB Korea") which is licensed as a cash equity broker, and regulated by the Financial Services Commission and Financial Supervisory Service of Korea. The views and opinions in this research report are our own as of the date hereof and are subject to change, and this report shall not be considered as an offer to subscribe to, or used in connection with, any offer for subscription or sale or marketing or direct or indirect distribution of financial investment instruments and it is not intended as a solicitation for the purchase of any financial investment instrument. This publication is strictly confidential and is for private circulation only, and no part of this material may be (i) copied, photocopied, duplicated, stored or reproduced in any form by any means or (ii) redistributed or passed on, directly or indirectly, to any other person in whole or in part, for any purpose without the prior written consent of CIMB Korea. Sweden: This report contains only marketing information and has not been approved by the Swedish Financial Supervisory Authority. The distribution of this report is not an offer to sell to any person in Sweden or a solicitation to any person in Sweden to buy any instruments described herein and may not be forwarded to the public in Sweden. Taiwan: This research report is not an offer or marketing of foreign securities in Taiwan. The securities as referred to in this research report have not been and will not be registered with the Financial Supervisory Commission of the Republic of China pursuant to relevant securities laws and regulations and may not be offered or sold within the Republic of China through a public offering or in circumstances which constitutes an offer within the meaning of the Securities and Exchange Law of the Republic of China that requires a registration or approval of the Financial Supervisory Commission of the Republic of China. Thailand: This report is issued and distributed by CIMB Securities (Thailand) Company Limited (CIMBS). The views and opinions in this research report are our own as of the date hereof and are subject to change. If the Financial Services and Markets Act of the United Kingdom or the rules of the Financial Services Authority apply to a recipient, our obligations owed to such recipient therein are unaffected. CIMBS has no obligation to update its opinion or the information in this research report. This publication is strictly confidential and is for private circulation only to clients of CIMBS. This publication is being supplied to you strictly on the basis that it will remain confidential. No part of this material may be (i) copied, photocopied, duplicated, stored or reproduced in any form by any means or (ii) redistributed or passed on, directly or indirectly, to any other person in whole or in part, for any purpose without the prior written consent of CIMBS. Corporate Governance Report: The disclosure of the survey result of the Thai Institute of Directors Association (“IOD”) regarding corporate governance is made pursuant to the policy of the Office of the Securities and Exchange Commission. The survey of the IOD is based on the information of a company listed on the Stock Exchange of Thailand and the Market for Alternative Investment disclosed to the public and able to be accessed by a general public investor. The result, therefore, is from the perspective of a third party. It is not an evaluation of operation and is not based on inside information. The survey result is as of the date appearing in the Corporate Governance Report of Thai Listed Companies. As a result, the survey result may be changed after that date. CIMBS does not confirm nor certify the accuracy of such survey result. Score Range 90 – 100 80 – 89 70 – 79 Below 70 or No Survey Result
March 18, 2013
121
Description Excellent Very Good Good N/A United Arab Emirates: The distributor of this report has not been approved or licensed by the UAE Central Bank or any other relevant licensing authorities or governmental agencies in the United Arab Emirates. This report is strictly private and confidential and has not been reviewed by, deposited or registered with UAE Central Bank or any other licensing authority or governmental agencies in the United Arab Emirates. This report is being issued outside the United Arab Emirates to a limited number of institutional investors and must not be provided to any person other than the original recipient and may not be reproduced or used for any other purpose. Further, the information contained in this report is not intended to lead to the sale of investments under any subscription agreement or the conclusion of any other contract of whatsoever nature within the territory of the United Arab Emirates. United Kingdom and Europe: In the United Kingdom and European Economic Area, this report is being disseminated by CIMB Securities (UK) Limited (“CIMB UK”). CIMB UK is authorised and regulated by the Financial Services Authority and its registered office is at 27 Knightsbridge, London, SW1X 7YB. This report is for distribution only to, and is solely directed at, selected persons on the basis that those persons: (a) are persons that are eligible counterparties and professional clients of CIMB UK; (b) have professional experience in matters relating to investments falling within Article 19(5) of the Financial Services and Markets Act 2000 (Financial Promotion) Order 2005 (as amended, the “Order”); (c) are persons falling within Article 49 (2) (a) to (d) (“high net worth companies, unincorporated associations etc”) of the Order; (d) are outside the United Kingdom; or (e) are persons to whom an invitation or inducement to engage in investment activity (within the meaning of section 21 of the Financial Services and Markets Act 2000) in connection with any investments to which this report relates may otherwise lawfully be communicated or caused to be communicated (all such persons together being referred to as “relevant persons”). This report is directed only at relevant persons and must not be acted on or relied on by persons who are not relevant persons. Any investment or investment activity to which this report relates is available only to relevant persons and will be engaged in only with relevant persons. Only where this report is labelled as non-independent, it does not provide an impartial or objective assessment of the subject matter and does not constitute independent "investment research" under the applicable rules of the Financial Services Authority in the UK. Consequently, any such non-independent report will not have been prepared in accordance with legal requirements designed to promote the independence of investment research and will not subject to any prohibition on dealing ahead of the dissemination of investment research. United States: This research report is distributed in the United States of America by CIMB Securities (USA) Inc, a U.S.-registered broker-dealer and a related company of CIMB Research Pte Ltd, CIMB Investment Bank Berhad, PT CIMB Securities Indonesia, CIMB Securities (Thailand) Co. Ltd, CIMB Securities Limited, and is distributed solely to persons who qualify as "U.S. Institutional Investors" as defined in Rule 15a-6 under the Securities and Exchange Act of 1934. This communication is only for Institutional Investors whose ordinary business activities involve investing in shares, bonds and associated securities and/or derivative securities and who have professional experience in such investments. Any person who is not a U.S. Institutional Investor or Major Institutional Investor must not rely on this communication. The delivery of this research report to any person in the United States of America is not a recommendation to effect any transactions in the securities discussed herein, or an endorsement of any opinion expressed herein. CIMB Securities (USA) Inc, is a FINRA/SIPC member and takes responsibility for the content of this report. For further information or to place an order in any of the above-mentioned securities please contact a registered representative of CIMB Securities (USA) Inc. Other jurisdictions: In any other jurisdictions, except if otherwise restricted by laws or regulations, this report is only for distribution to professional, institutional or sophisticated investors as defined in the laws and regulations of such jurisdictions.
Rating Distribution (%) Investment Banking clients (%)Outperform/Buy/Trading Buy 51.7% 8.6%Neutral 35.0% 4.3%Underperform/Sell/Trading Sell 13.3% 7.1%
Distribution of stock ratings and investment banking clients for quarter ended on 28 February 2013959 companies under coverage
Recommendation Framework #1 * Stock Sector
OUTPERFORM: The stock's total return is expected to exceed a relevant benchmark's total return by 5% or more over the next 12 months.
OVERWEIGHT: The industry, as defined by the analyst's coverage universe, is expected to outperform the relevant primary market index over the next 12 months.
NEUTRAL: The stock's total return is expected to be within +/-5% of a relevant benchmark's total return.
NEUTRAL: The industry, as defined by the analyst's coverage universe, is expected to perform in line with the relevant primary market index over the next 12 months.
UNDERPERFORM: The stock's total return is expected to be below a relevant benchmark's total return by 5% or more over the next 12 months.
UNDERWEIGHT: The industry, as defined by the analyst's coverage universe, is expected to underperform the relevant primary market index over the next 12 months.
TRADING BUY: The stock's total return is expected to exceed a relevant benchmark's total return by 5% or more over the next 3 months.
TRADING BUY: The industry, as defined by the analyst's coverage universe, is expected to outperform the relevant primary market index over the next 3 months.
TRADING SELL: The stock's total return is expected to be below a relevant benchmark's total return by 5% or more over the next 3 months.
TRADING SELL: The industry, as defined by the analyst's coverage universe, is expected to underperform the relevant primary market index over the next 3 months.
* This framework only applies to stocks listed on the Singapore Stock Exchange, Bursa Malaysia, Stock Exchange of Thailand, Jakarta Stock Exchange, Australian Securities Exchange, Korea Exchange, Taiwan Stock Exchange and National Stock Exchange of India/Bombay Stock Exchange. Occasionally, it is permitted for the total expected returns to be temporarily outside the prescribed ranges due to extreme market volatility or other justifiable company or industry-specific reasons. CIMB Research Pte Ltd (Co. Reg. No. 198701620M)
Recommendation Framework #2 ** Stock Sector
OUTPERFORM: Expected positive total returns of 10% or more over the next 12 months. OVERWEIGHT: The industry, as defined by the analyst's coverage universe, has a high number of stocks that are expected to have total returns of +10% or better over the next 12 months.
NEUTRAL: Expected total returns of between -10% and +10% over the next 12 months. NEUTRAL: The industry, as defined by the analyst's coverage universe, has either (i) an equal number of stocks that are expected to have total returns of +10% (or better) or -10% (or worse), or (ii) stocks that are predominantly expected to have total returns that will range from +10% to -10%; both over the next 12 months.
UNDERPERFORM: Expected negative total returns of 10% or more over the next 12 months. UNDERWEIGHT: The industry, as defined by the analyst's coverage universe, has a high number of stocks that are expected to have total returns of -10% or worse over the next 12 months.
TRADING BUY: Expected positive total returns of 10% or more over the next 3 months. TRADING BUY: The industry, as defined by the analyst's coverage universe, has a high number of stocks that are expected to have total returns of +10% or better over the next 3 months.
TRADING SELL: Expected negative total returns of 10% or more over the next 3 months. TRADING SELL: The industry, as defined by the analyst's coverage universe, has a high number of stocks that are expected to have total returns of -10% or worse over the next 3 months.
** This framework only applies to stocks listed on the Hong Kong Stock Exchange and China listings on the Singapore Stock Exchange. Occasionally, it is permitted for the total expected returns to be temporarily outside the prescribed ranges due to extreme market volatility or other justifiable company or industry-specific reasons.

March 18, 2013
122
Corporate Governance Report of Thai Listed Companies (CGR). CG Rating by the Thai Institute of Directors Association (IOD) in 2011. AAV – not available, ADVANC - Excellent, AMATA - Very Good, AOT - Excellent, AP - Very Good, BANPU - Excellent , BAY - Excellent , BBL - Excellent, BCH - Good, BEC - Very Good, BECL - Very Good, BGH - not available, BH - Very Good, BIGC - Very Good, BTS - Very Good, CCET - Good, CK - Very Good, CPALL - Very Good, CPF - Very Good, CPN - Excellent, DELTA - Very Good, DTAC - Very Good, GLOBAL - not available, GLOW - Very Good, GRAMMY – Excellent, HANA - Very Good, HEMRAJ - Excellent, HMPRO - Very Good, INTUCH – Very Good, ITD - Good, IVL - Very Good, JAS – Very Good, KAMART – not available, KBANK - Excellent, KK – Excellent, KTB - Excellent, LH - Very Good, LPN - Excellent, MAJOR - Very Good, MCOT - Excellent, MINT - Very Good, PS - Excellent, PSL - Excellent, PTT - Excellent, PTTGC - not available, PTTEP - Excellent, QH - Excellent, RATCH - Excellent, ROBINS - Excellent, RS – Excellent, SC – Excellent, SCB - Excellent, SCC - Excellent, SCCC - Very Good, SIRI - Very Good, SPALI - Very Good, STA - Very Good, STEC - Very Good, TCAP - Very Good, THAI - Very Good, THCOM – Very Good, TICON – Good, TISCO - Excellent, TMB - Excellent, TOP - Excellent, TRUE - Very Good, TUF - Very Good, WORK – Good.
March 18, 2013
123
Asia
Malaysia 10th Floor, Bangunan CIMB Jalan Semantan Damansara Heights 50490 Kuala Lumpur T: +60 (3) 2084 8888 F: +60 (3) 2084 8899
Singapore 50 Raffles Place #19-00 Singapore Land Tower (S048623) T: +65 6225-1228 F: +65 6224-6906
Indonesia The Indonesia Stock Exchange Building Tower II, 20th Floor Jl. Jend. Sudirman, Kav. 52-53 Jakarta 12190 T: +62 (21) 515-1330 F: +62 (21) 515-1335
Thailand 132 Sindhorn Tower 3, 12th Floor Wireless Road, Lumpini, Pathumwan Bangkok 10330 T: +66 (2) 841-9000 F: +66 (2) 657-9240
Hong Kong Units 7706-08, Level 77 International Commerce Centre 1 Austin Road West Kowloon T: +852 2868-0380 F: +852 2537-1928
China Unit 802 AZIA Center 1233 Lujiazui Ring Road Pudong New District Shanghai 200120 T: +86 (21) 6194-0212 / +86 (21) 6194-0218
Sri Lanka Level 33, West Tower World Trade Center Echelon Square Colombo 01
Sri Lanka John Keells Stock Brokers (Pvt) Ltd, a strategic partner with CIMB Securities 130 Glennie Street Colombo 00200 T: +94 (0) 11 230 6271 F: +94 (0) 11 234 2068
Philippines SB Equities, Inc, a strategic partner with CIMB Securities 18F Security Bank Centre 6776 Ayala Ave. Makati 0719 T: +63 (2) 891-1243 / +63 (2) 891-1258 F: +63 (2) 813-3349
Taiwan* Korea* India* * We are currently in the process of establishing offices inTaiwan.
CIMB Securities Limited, Korea Branch 15F, S-Tower, 116 Shinmun-ro 1-ga Jongro-gu, Seoul 110-700, Korea T: +82 (2) 6730-6000 F: +82 (2) 6730-6183
CIMB Securities (India) Private Limited 1203, The Capital, Bandra Kurla Complex Mumbai 400 051, INDIA T: +91 (22) 6602 5100
Europe Americas
United Kingdom (2719607) 27 Knightsbridge London, SW1X 7YB T: +44 (20) 7201-2199 F: +44 (20) 7201-2191
USA (52-1971703) 540 Madison Avenue 11th Floor, New York, N.Y. 10022 T: +1 (212) 616 8600 F: +1 (212) 616 8639
Australia
Sydney Level 29, Aurora Place 88 Phillip Street Sydney, NSW 2000 +61 2 9694 5000
Melbourne Level 32, 101 Collins St Melbourne, VIC 3000 +61 3 9631 1000

March 4, 2013
124 – Thailand Corporate Day – March 4, 2013