company analysis
TRANSCRIPT
Company Analysis
Overview of Company Analysis
we’ve completed the economic forecast and industry analysis, we can focus on choosing the best positioned company in our chosen industry
Selecting a company will involve an analysis of: The company’s management The company’s financial statements Key drivers for future growth
we are looking for companies with the best management, strong financials, great prospects, and that are undervalued by the market
The past is irrelevant, what you are buying is future results.
Evaluating Management
Strong management is vital for companies to perform in accord with the highest expectations of investors
Unfortunately, evaluating the quality of a company’s management team is very difficult, especially for individual investors
Professionals have the advantage in that they have many contacts within the industry who are familiar with the management team, and they can visit the company and talk with the team personally
Evaluating Management (cont.)
As an individual, there are several things can be done: Read the Annual Report – it has information on the background
of executives and board members. Information includes age, pay, stock ownership, etc
Read the business press – There are often stories which provide insights into the character and abilities of senior management
Call investor relations – They can answer any reasonable questions that you may have
Study the financial statements – Good management leads to solid financials
Evaluating Management (cont.)
Despite your best efforts at judging management’s ability, things can go wrong
History is replete with examples of formerly great managers running their new companies into the ground
Here are a few examples that come to mind: AT&T – C. Michael Armstrong Sunbeam – “Chainsaw” Al Dunlap Apple Computer – John Scully Long-term Capital Management – John Meriwether, Robert
Merton, and Myron Scholes (the latter two were Nobel Prize winners in economics)
Financial Statement Analysis
There are three statements to watch: Income statement Balance sheet Statement of cash flows
Two major tools: Ratios Growth rates
The Income Statement
The income statement provides us with information about the firms revenues and expenses over some previous time period (usually quarterly, semiannually, and annually)
The key variables to watch are revenues, gross profit margins, operating profit margins, net profit margins
We especially want to evaluate the quality of the firm’s earnings
Quality of Earnings Under GAAP, companies are allowed fairly wide latitude on how they
recognize revenues and handle “extraordinary” income and expenses Many companies freely admit to “managing” or “smoothing” earnings,
believing that it adds to the stability of the stock price over time Analysts need to watch for such shenanigans, as it may signal problems Here are a couple of recent examples of questionable quality of
earnings: Qwest – Raised revenue recognition questions when analysts discovered
that they had counted all of the future revenues from a 20-year contract as current earnings.
Priceline.com – Was claiming as revenue the entire price of an airline ticket when, in fact, they only received a commission on its sale and never actually took ownership of the ticket
The disposal of a plant or major piece of equipment, Gains or losses due to accounting charges, charges to write down the value of goodwill are the examples of extra ordinary items.
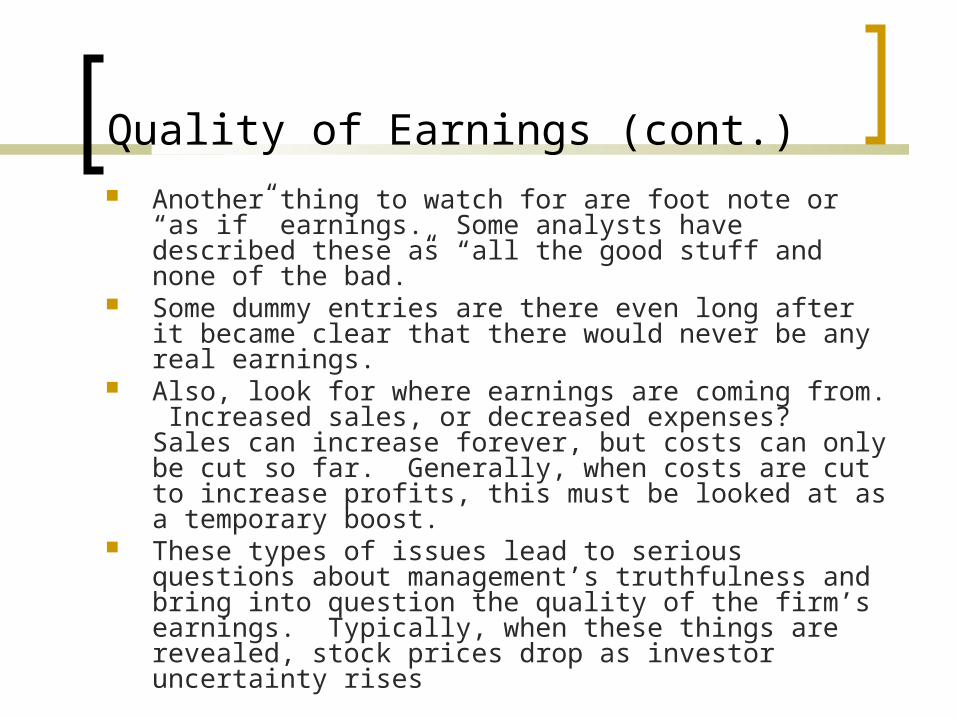
Quality of Earnings (cont.) Another thing to watch for are foot note or “as if” earnings. Some
analysts have described these as “all the good stuff and none of the bad.”
Some dummy entries are there even long after it became clear that there would never be any real earnings.
Also, look for where earnings are coming from. Increased sales, or decreased expenses? Sales can increase forever, but costs can only be cut so far. Generally, when costs are cut to increase profits, this must be looked at as a temporary boost.
These types of issues lead to serious questions about management’s truthfulness and bring into question the quality of the firm’s earnings. Typically, when these things are revealed, stock prices drop as investor uncertainty rises
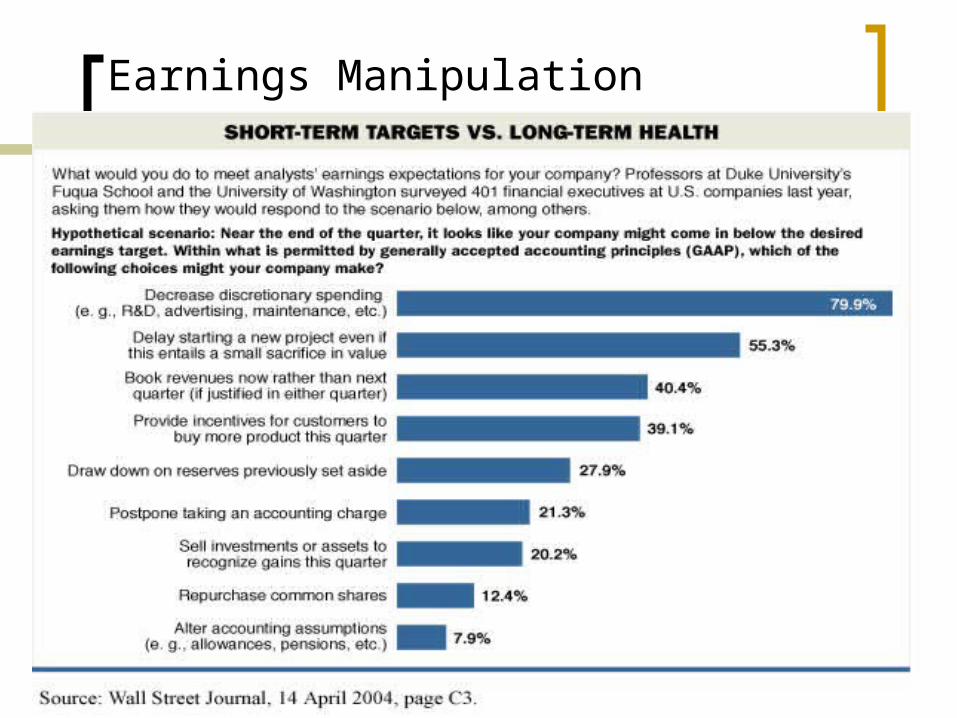
Earnings Manipulation
The Balance Sheet
The balance sheet describes the assets, liabilities, and equity of the firm at a point in time
Key variables to watch on the balance sheet are cash, accounts receivable, inventories, and long-term debt
Always remember what Benjamin Graham said in Security Analysis, “liabilities are real but the assets are of questionable value.”
The Statement of Cash Flows
Ultimately, cash is king and the statement of cash flows tells us exactly why a firm’s cash balance changed
The statement of cash flows is far more difficult to manipulate than the income statement, and can help to gauge the quality of earnings
The Cash Flows from Operations section is the most important as it measures the cash provided by the day to day operation of the business
A company could, for example, show steadily rising revenues and net income, but negative cash flows from operations. How? If accounts receivable is rising. This can only go on for so long before the company has grown its revenues right into bankruptcy because it isn’t collecting on those sales. Positive earnings must always be confirmed by positive cash flows.
This statement is as important, if not more so, than the income statement. Always examine it to find out what management is doing with the shareholder’s money
Analyzing Financial Ratios
Financial ratios are the microscope that allows us to see behind the raw numbers and find out what’s really going on
Financial ratios fall into five categories: Liquidity Efficiency Leverage Coverage Profitability
When analyzing ratios always remember that no one ratio provides the whole story, and that the standards for each ratio are different for every industry
Liquidity Ratios
The current ratio, quick ratio and cash ratio all fall into this category
They help us to see if the company is able to meet its short-term obligations
Efficiency Ratios
The efficiency ratios tell us how effectively management is using the firm’s assets to generate sales
Inventory turnover, accounts receivable turnover, days sales outstanding, fixed asset turnover, and total asset turnover all fall into this category
Leverage Ratios
How much debt does the firm have? That’s the question answered by the leverage ratios
Examples are the debt ratio and debt to equity ratio Remember that lots of debt is great as long as sales are
increasing, but terrible if sales decline Some debt is, without a doubt, good, but too much can
be disastrous Especially be on the lookout for companies with a high
proportion of fixed costs (high operating leverage) and with lots of debt. Airlines are a good example
Coverage Ratios
Coverage ratios are most important to creditors, but whatever is important to creditors is important to shareholder’s too
Examples of coverage ratios include the times interest earned ratio and the fixed charge coverage ratio
Interest cover = PBITD/Interest DSCR= PAT + depreciation +Interest on loan
Interest +EMI
Profitability Ratios
Investors tend to focus the most on profitability ratios, but the others are important as well
Examples include the gross profit margin, operating profit margin, net profit margin, return on capital employed and return on equity
EV/EBITDA ratio
This is a comparison of enterprise value and earnings before interest, taxes, depreciation and amortization.
It compares the value of a company, inclusive of debt and other liabilities, to the actual cash earnings exclusive of the non-cash expenses.
EV/EBITDA Ratio = EV / EBITDA The EV/EBITDA ratio is a better measure than the P/E
ratio because it is not affected by changes in the capital structure
The EV/EBITDA ratio is usually appropriate for the comparison of companies in same industry.
Using Financial Ratios
There are two key uses of financial ratios: Trend Analysis – Looking for trends over time in
ratios. For example, we’d like to see that the inventory turnover ratio is rising. Normally, at least five years of data should be used.
Comparison to Industry Averages – If we assume that, on average, the firm’s competitors are doing things right, then it makes sense to make these comparisons. This can also help to identify areas of relative strength and weakness
Manipulation of Financial Statements
Financial statements may be manipulated in a number of ways to help identify key trends: Common-size Common base year Inflation adjusted
Each of these techniques can provide insights that are not easily seen on the unadjusted financial statements
Several Kinds of “Value”
There are several types of value, of which we are concerned with four: Enterprise value- measures the value of the ongoing operations
of a company. Book Value – The carrying value on the balance sheet of the
firm’s equity (Total Assets less Total Liabilities) Tangible Book Value – Book value minus intangible assets
(goodwill, patents, etc) Market Value - The price of an asset as determined in a
competitive marketplace Intrinsic Value - The present value of the expected future cash
flows discounted at the decision maker’s required rate of return
Growth Rates
Growth rates of various variables are important as well
Key variables to calculate growth rates of are revenues, operating profits, and free cash flow
enterprise value (EV)
The enterprise value (EV) measures the value of the ongoing operations of a company. It measure the value of a company's business instead of measuring the value of the company. It can be thought of as a theoretical takeover price of a company’s business.
Enterprise Value = Market Capitalization +Debt +Preferred Share Capital + Minority Interest - Cash and cash equivalents
Market Capitalization: Is the market value of common shares of a company. It is calculated by multiplying the current market price per share by the total number of equity shares of the company
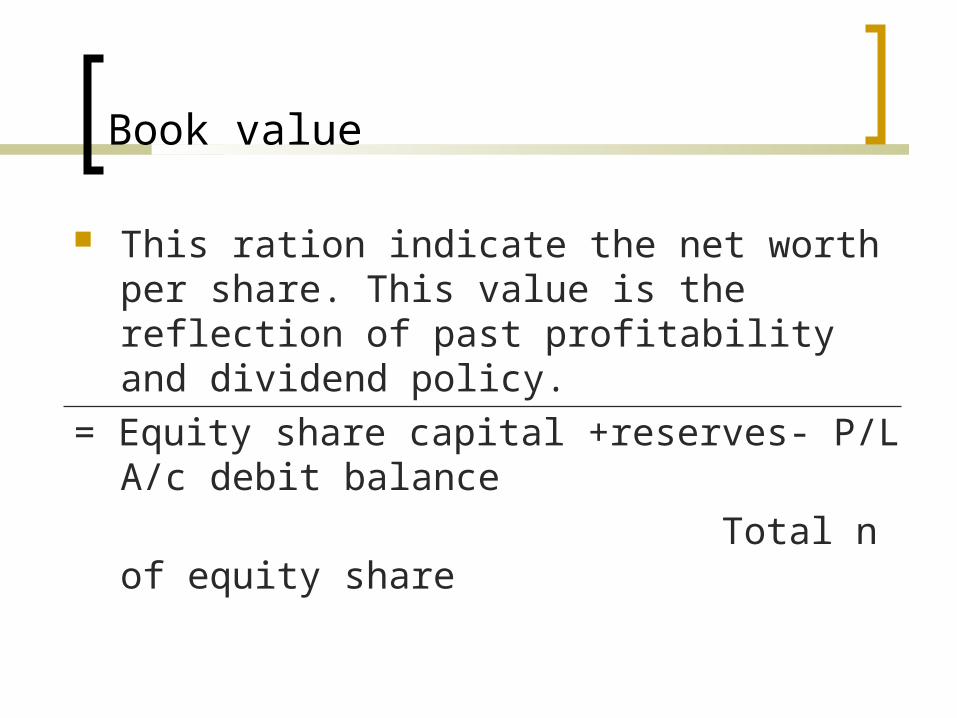
Book value
This ration indicate the net worth per share. This value is the reflection of past profitability and dividend policy.
= Equity share capital +reserves- P/L A/c debit balance Total n of equity share
Determinants of Intrinsic Value
There are two primary determinants of the intrinsic value of an asset to an individual: The size and timing of the expected future cash flows. The individual’s required rate of return (this is determined by a
number of other factors such as risk/return preferences, returns on competing investments, expected inflation, etc.).
Note that the intrinsic value of an asset can be, and often is, different for each individual (that’s what makes markets work).
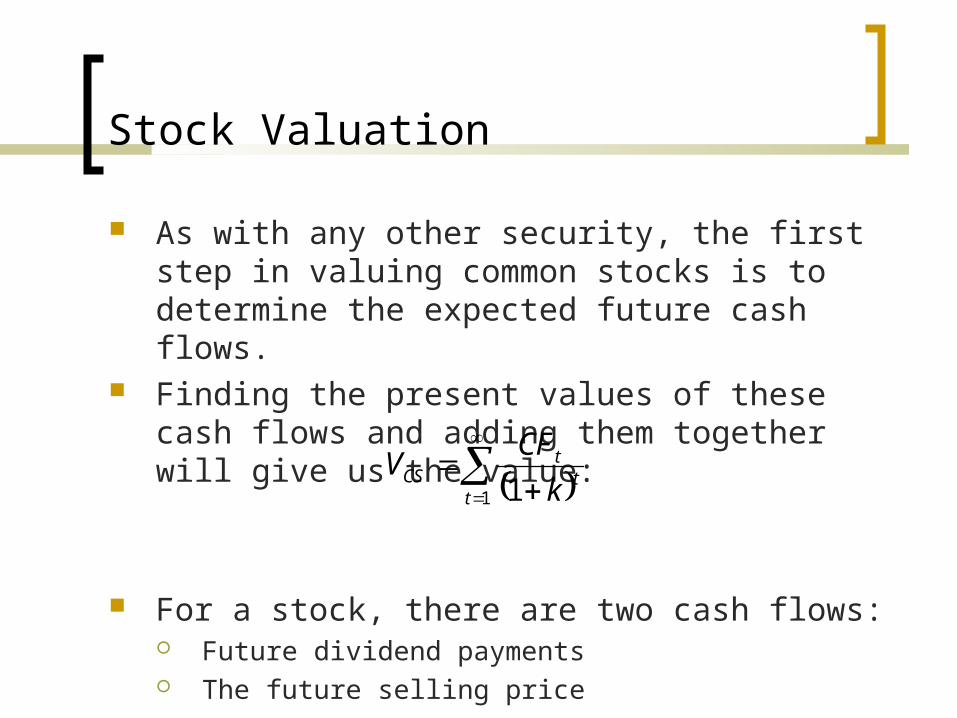
Stock Valuation
As with any other security, the first step in valuing common stocks is to determine the expected future cash flows.
Finding the present values of these cash flows and adding them together will give us the value:
For a stock, there are two cash flows: Future dividend payments The future selling price
1 1tt
tCS k
CFV
Some Notes About Stock
In valuing the common stock, we have made two assumptions: We know the dividends that will be paid in the future. We know how much you will be able to sell the stock
for in the future. Both of these assumptions are unrealistic,
especially knowledge of the future selling price. Furthermore, suppose that you intend on holding
on to the stock for twenty years, the calculations would be very tedious!
Stock Valuation: An Example
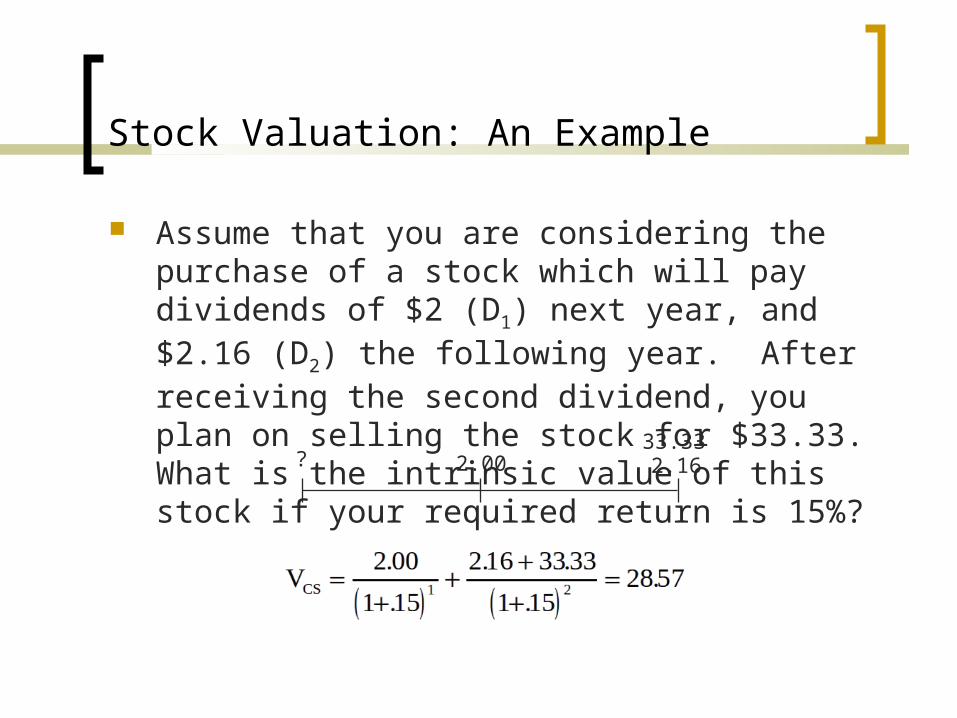
Assume that you are considering the purchase of a stock which will pay dividends of $2 (D1) next year, and $2.16 (D2) the following year. After receiving the second dividend, you plan on selling the stock for $33.33. What is the intrinsic value of this stock if your required return is 15%?
2.00 2.1633.33?
Other Valuation Methods
Some companies do not pay dividends, or the dividends are unpredictable.
In these cases we have several other possible valuation models: Earnings Model Free Cash Flow Model P/E approach Price to Sales (P/S)
The Earnings Model
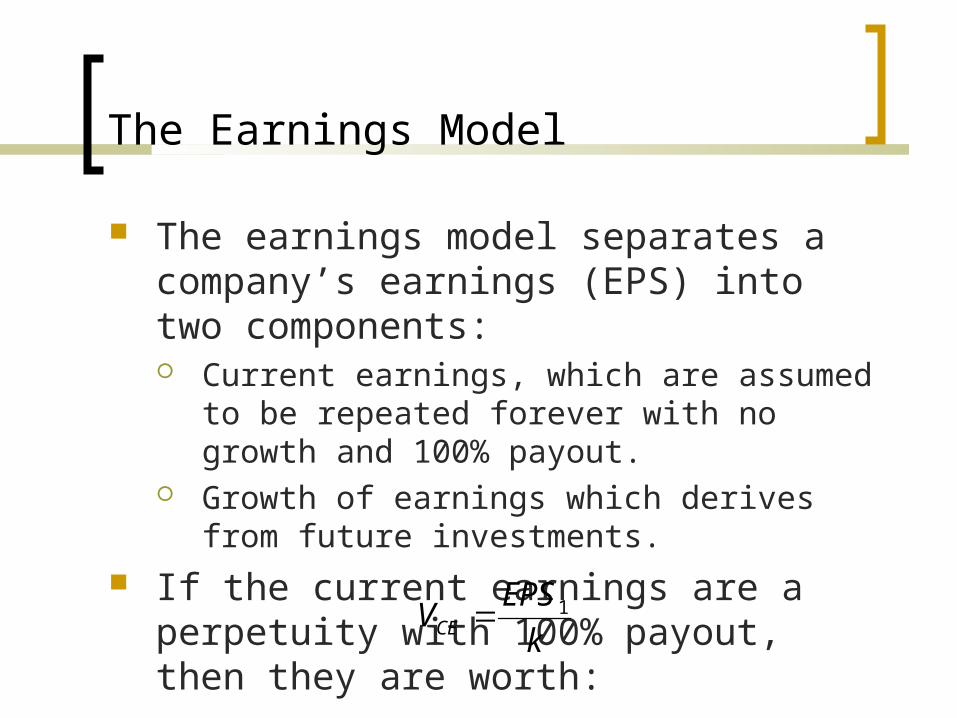
The earnings model separates a company’s earnings (EPS) into two components: Current earnings, which are assumed to be repeated
forever with no growth and 100% payout. Growth of earnings which derives from future
investments. If the current earnings are a perpetuity with
100% payout, then they are worth:
kEPSVCE
1
The Earnings Model (cont.)
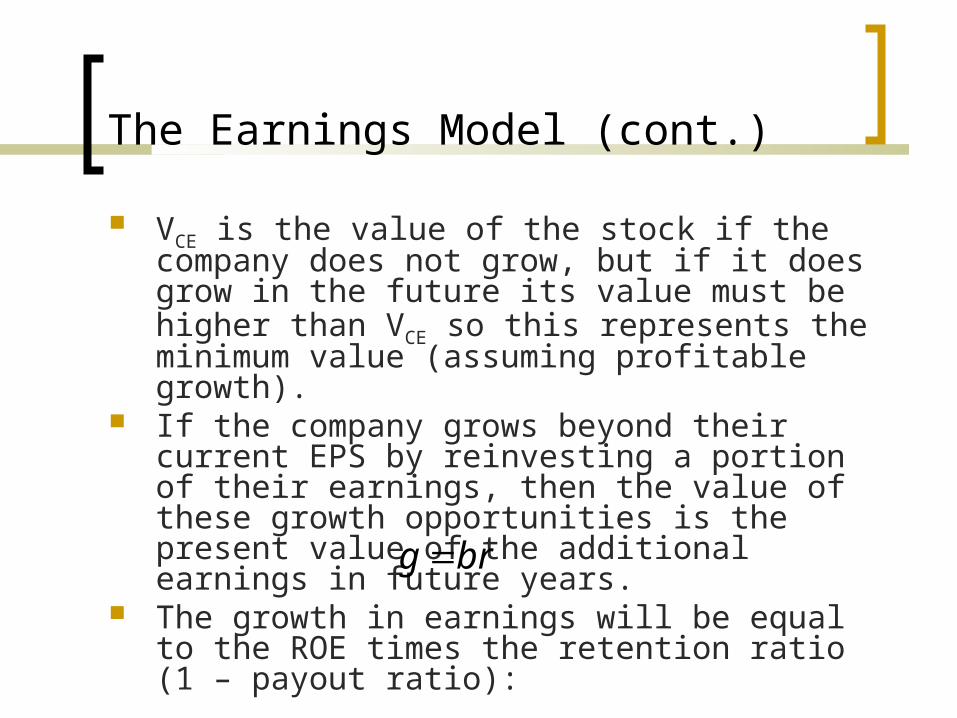
VCE is the value of the stock if the company does not grow, but if it does grow in the future its value must be higher than VCE so this represents the minimum value (assuming profitable growth).
If the company grows beyond their current EPS by reinvesting a portion of their earnings, then the value of these growth opportunities is the present value of the additional earnings in future years.
The growth in earnings will be equal to the ROE times the retention ratio (1 – payout ratio):
Where b = retention ratio and r = ROE (return on equity).brg
The Earnings Model (cont.)
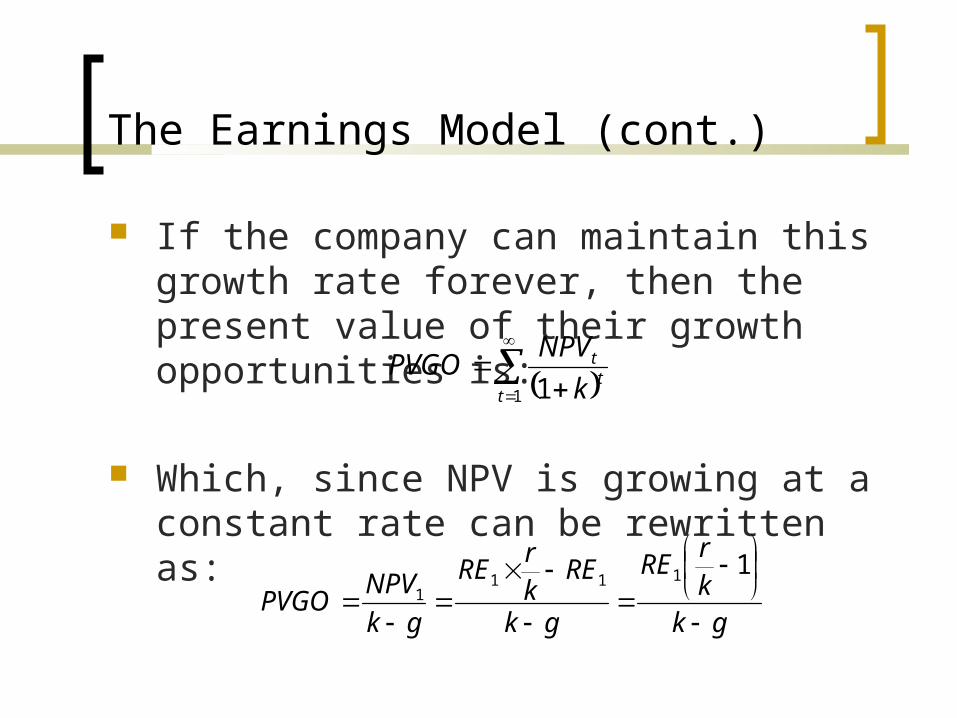
If the company can maintain this growth rate forever, then the present value of their growth opportunities is:
Which, since NPV is growing at a constant rate can be rewritten as:
1 1tt
t
kNPVPVGO
gkkrRE
gk
REkrRE
gkNPVPVGO
11111
The Earnings Model (cont.)
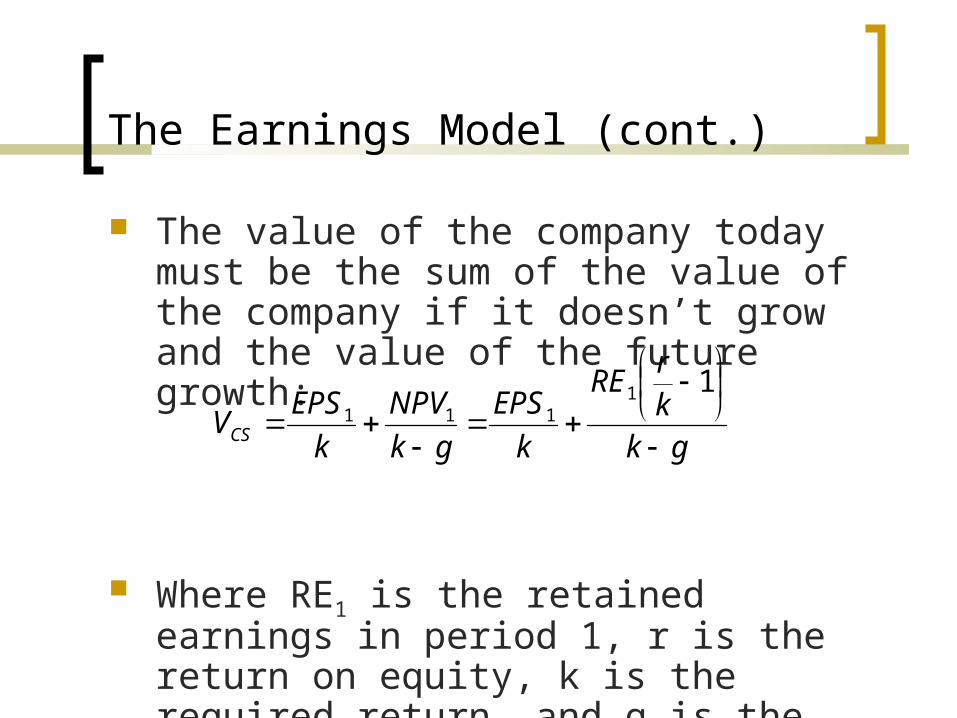
The value of the company today must be the sum of the value of the company if it doesn’t grow and the value of the future growth:
Where RE1 is the retained earnings in period 1, r is the return on equity, k is the required return, and g is the growth rate
gkkrRE
kEPS
gkNPV
kEPSVCS
11
111
The Free Cash Flow Model
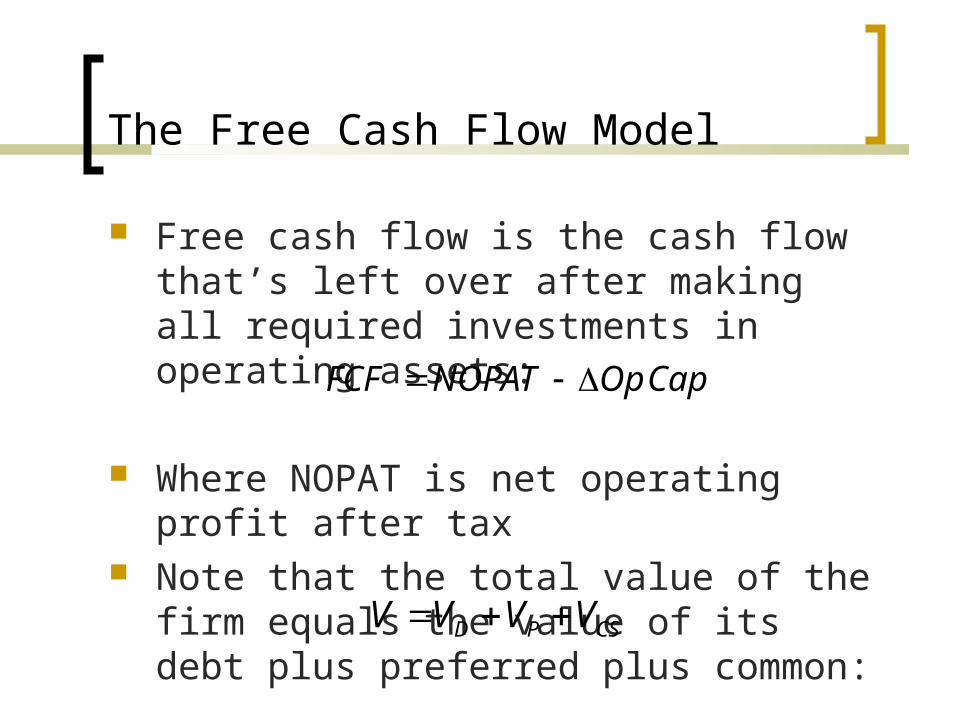
Free cash flow is the cash flow that’s left over after making all required investments in operating assets:
Where NOPAT is net operating profit after tax Note that the total value of the firm equals the
value of its debt plus preferred plus common:
CapOpNOPATFCF
CSPD VVVV
The Free Cash Flow Model (cont.)
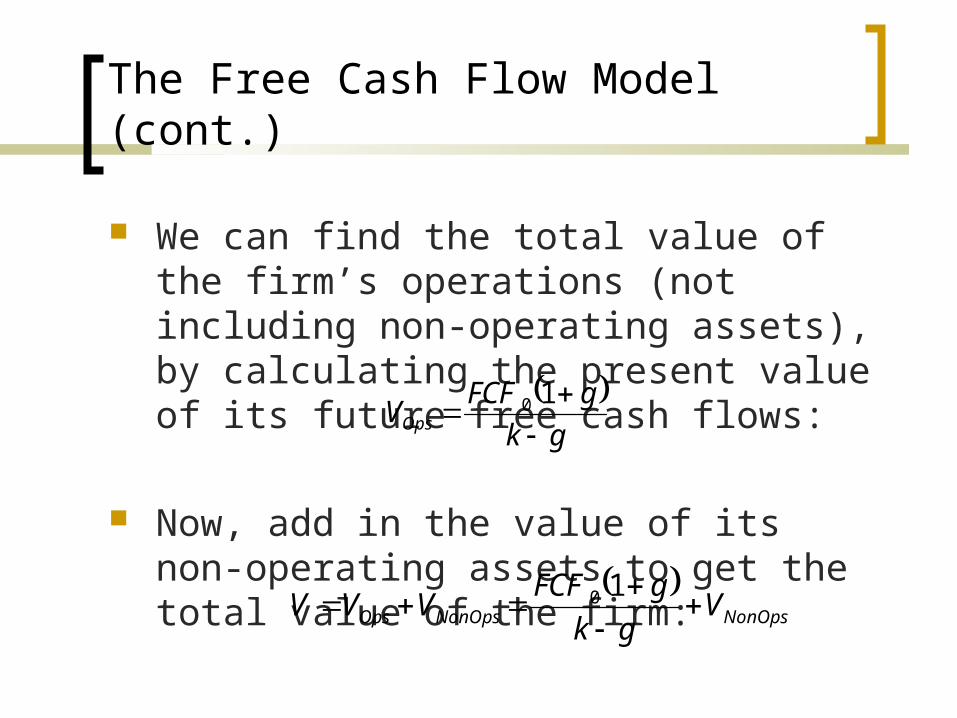
We can find the total value of the firm’s operations (not including non-operating assets), by calculating the present value of its future free cash flows:
Now, add in the value of its non-operating assets to get the total value of the firm:
gk
gFCFVOps
10
NonOpsNonOpsOps V
gkgFCFVVV
10
The Free Cash Flow Model (cont.)
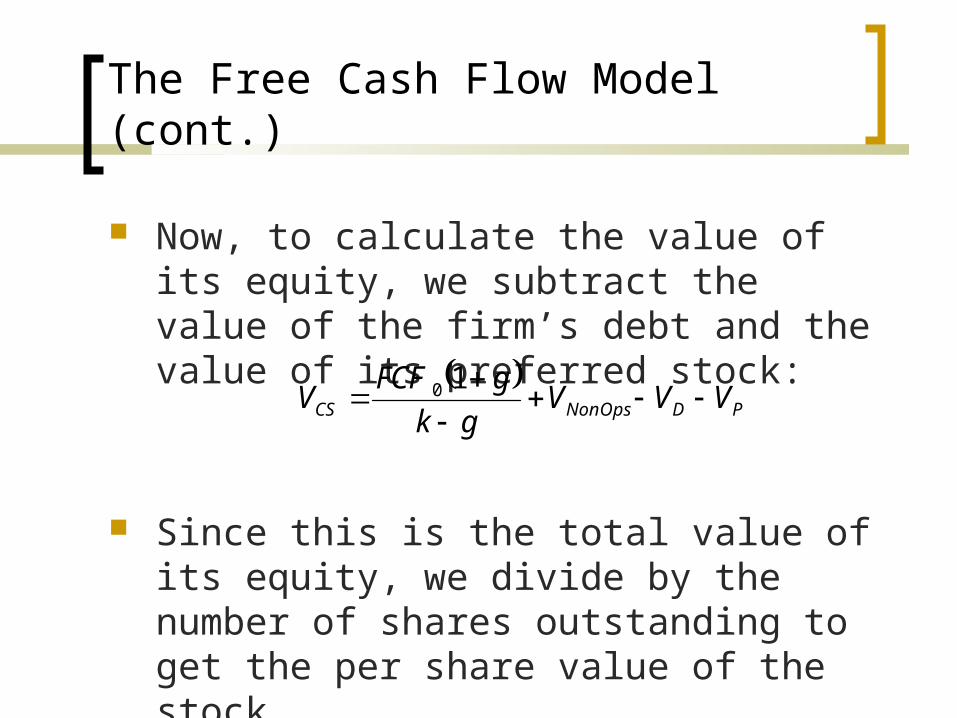
Now, to calculate the value of its equity, we subtract the value of the firm’s debt and the value of its preferred stock:
Since this is the total value of its equity, we divide by the number of shares outstanding to get the per share value of the stock.
PDNonOpsCS VVV
gkgFCFV
10
Relative Value Models
Professional analysts often value stocks relative to one another. For example, an analyst might say that XYZ is undervalued relative
to ABC (which is in the same industry) because it has a lower P/E ratio, but a higher earnings growth rate.
These models are popular, but they do have problems: Even within an industry, companies are rarely perfectly comparable. There is no way to know for sure what the “correct” price multiple is. There is no easy, linear relationship between earnings growth and price
multiples (i.e., we can’t say that because XYZ is growing 2% faster that it’s P/E should be 3 points higher than ABC’s – there are just too many additional factors).
A company’s (or industry’s) historical multiples may not be relevant today due to changes in earnings growth over time.
The P/E Approach
As a rule of thumb, or simplified model, analysts often assume that a stock is worth some “justified” P/E ratio times the firm’s expected earnings.
This justified P/E may be based on the industry average P/E, the company’s own historical P/E, or some other P/E that the analyst feels is justified.
To calculate the value of the stock, we merely multiply its next years’ earnings by this justified P/E:
1EPSEPVCS
The P/S Approach
In some cases, companies aren’t currently earning any money and this makes the P/E approach impossible to use (because there are no earnings).
In these cases, analysts often estimate the value of the stock as some multiple of sales (Price/Sales ratio).
The justified P/S ratio may be based on historical P/S for the company, P/S for the industry, or some other estimate:
1SalesSPVCS


Con..

