community structure of fishes and habitat complexity on a tropical rocky shore
TRANSCRIPT
Environmental Biology of Fishes 61: 353–369, 2001.© 2001 Kluwer Academic Publishers. Printed in the Netherlands.
Community structure of fishes and habitat complexity ona tropical rocky shore
Carlos E.L. Ferreira, Jose E.A. Goncalves & Ricardo CoutinhoInstituto de Estudos do Mar Almirante Paulo Moreira (IEAPM), Departamento de Oceanografia,Rua Kioto 253, Arraial do Cabo, RJ, Cep:28930000, Brazil (e-mail: [email protected])
Received 24 May 2000 Accepted 30 November 2000
Key words: vertical distribution, benthic organisms, reef fish, Brazilian coast, fish diversity and richness, impacts,feeding niches
Synopsis
The relationship between the variables of reef fish community structure (fish richness, fish diversity and total numberof fishes) and those of habitat complexity (total surface area, substratum diversity, topographic complexity, numberof holes, percent cover of turf algae, zoanthids, millepores, massive corals, bare rock, encrusting calcareous algae,urchins, other sessile organisms and Sargassum) were examined on three different rocky shores (FA, FB and FT) atArraial do Cabo, a tropical region located on Brazilian southeastern coast (23◦ S, 42◦ W). Fish abundance and verticaldistribution were assessed by a visual census technique using strip transects. Percentage cover of benthic organismsand other substratum types were calculated by replicated transects using a chain laid down on the substratum.Topographic complexity was determined by the chain link method and number of holes were estimated by directcounts on replicated transects. More than 91 fishes belonging to 37 families were seen in all study sites duringone year of visual census effort. FA and FB sites had similar fish community structure and habitat complexitycharacteristics, while FT showed different habitat characteristics and higher fish diversity and richness, plus totalnumber of fishes. Vertical distribution of fishes along the rocky shores studied seemed to be predictable and wasdetermined by factors such as feeding habits and behavior, availability of refuges and social interactions. The habitatvariables that best explained the higher diversity and number of fishes observed in FT site were total surface areaof rocky shores and the abundance of benthic sessile invertebrates; these conditions were typical of rocky shoresmore exposed to wave surge.
Introduction
Two decades of studies have passed, since the stochas-tic view was proposed as a main factor organizingthe community structure of reef fishes in detrimentto the deterministic view (Sale 1980, 1991). Today, itis widely recognized that communities of reef fishesare determined by several interacting factors includingrecruitment from the planktonic larva phase, interac-tions among the species and the history of disturbances(e.g. physical, biotic and even fishing, Hixon 1991,Russ & Alcala 1998).
One of the fundamental aims of community ecol-ogy is to determine what factors and respective rolesinfluence the structure of natural communities. Also,community structure is related not only to the biolog-ical, but also to the physical structure of a commu-nity. Consequently, several studies have examined theeffects of substratum variables on reef fish communitystructure (Luckhurst & Luckhurst 1978, Bell & Galzin1984, Sale & Douglas 1984, Roberts & Ormond 1987,Chabanet et al. 1997, Ohman & Rajasuriya 1998).
In temperate reefs, kelps provide the additionaldimension of plant canopy, increasing the availability
354
of food and refuges for fishes (Holbrook et al.1990, Ebeling & Hixon 1991). On coral reefs, liv-ing corals form a complex framework, supporting avariety of microhabitats, thus increasing fish diver-sity (Luckhurst & Luckhurst 1978, Carpenter et al.1981) and in some habitats, fish abundance (Chabanetet al. 1997). In other tropical regions, seaweed bedsand seagrass meadows contribute significantly to theenhancement of fish diversity and abundance (Carr1989, Jenkins & Wheatley 1998, Ornellas & Coutinho1998). Likewise, artificial reefs have been widelydeployed to attract fish to low productivity areas,simply by adding complexity (Bonhsack et al. 1997,Grossman et al. 1997). Whereas there is an extensiveliterature in this area of study of different reef ecosys-tems, the great majority have been carried out on coralreefs, few have tried the same thing on rocky shores(Falcon et al. 1996), but never on tropical rocky shores.Despite their lower complexity when compared to coralreefs, tropical rocky shores and adjacent environmentscan support a rich reef fauna and flora (Ferreira et al.1998a,b, Guimaraens & Coutinho 1996, Ornellas &Coutinho 1998) and sustain a high primary productivity(Ferreira 1998).
The main objectives in this study were to examinethe abundance and vertical distribution of fishes alongdifferent rocky shores, detect which habitat variablescould be used to predict the presence and vertical dis-tribution of the most abundant fishes, and which habitatvariables can be used to predict whether a rocky shorecould sustain more or less diversity and/or number offishes.
Methods
Study site
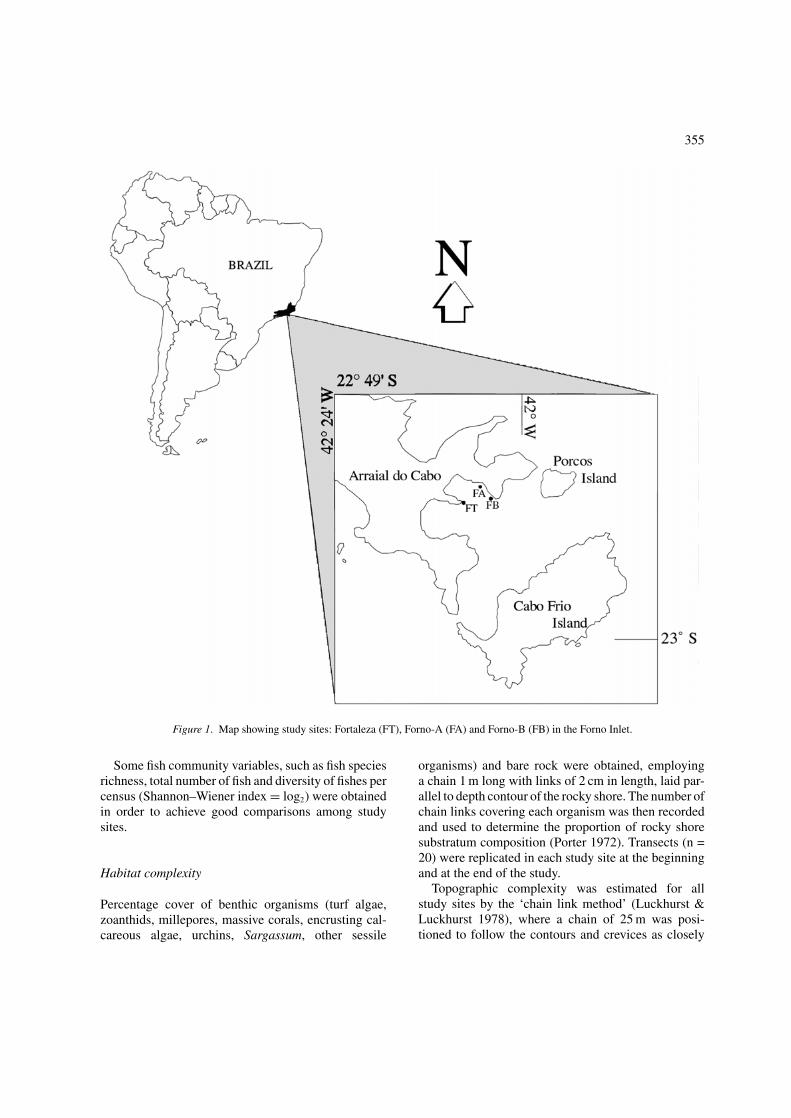
This study was carried out in 1992 at Arraial do Cabo –Rio de Janeiro State (23◦ 44’S - 42◦ W), a tropi-cal region on the Brazilian southeastern coast. Threestudy sites were chosen for sampling at Forno Inlet(Figure 1) in order to obtain data on communities offishes and benthic organisms influenced by differentconditions of wave movement: Fortaleza (FT), Forno-A (FA) and Forno-B (FB). From the first to the last,there is a decrease in intensity of wave surge measuredby gypsum models (Lavrado 1992). The main physio-graphic structure of the study sites is characterized byrocky shores covered by granite boulders, ending in asand bottom, with the presence of rock rubble in some
places. At FT the boulders are larger, and the slope moresteeply. The protected conditions which Forno Inlet andmost other sheltered sites in the region are includedto provide conditions in which rich reef communitiesflourish (Castro et al. 1995, Guimaraens & Coutinho1996, Viana1, Ornellas & Coutinho 1998, Ferreira et al.1998a,b), with clear waters almost year-round and amean average water temperature of about 22◦C. Theregion is characterized by a coastal upwelling event insummer and spring periods, and is associated with localwind regime and bathymetry (Valentin 1984), althoughthe cold nutrient rich water only bathe the study sitesfor short periods and generally in deeper parts (Ferreiraet al. 1998b).
Fish community structure
Abundance of fishes was assessed by a visual censustechnique adapted from Williams (1982), where a sin-gle SCUBA diver (CELF) swims, in a zigzag pattern upto the surface of the rocky shore and down to the sandbottom (∼=5 m long), recording fish species abundanceand size 1 m each side in a strip transect 80 m long (totalof 160 m2). All data were recorded on a prepared acrylicsheet while the diver followed an underwater tapemeasure. Replicated, random censuses (15–18) wereperformed monthly at each study site. The time limit,number of replicates and swimming velocity of eachcensus were defined by plotting data against cumula-tive fish species number using presence–absence dataof previous pilot studies. Vertical replicated visualcensuses (12–15) were simultaneously performed fora better understanding of the vertical distribution offishes on the rocky shores studied. Fishes were countedat each meter following an underwater tape measure,thus allowing a vertical profile of fish distribution anddensity to be build. All censuses were performed athigh tide avoiding bias due to vertical migration offishes. Nocturnal fishes were also sampled in nocturnalcensuses but treated in another paper.
Fishes were grouped in major trophic categories,determined from direct behavioral observations, stom-ach content analysis (Ferreira & Goncalves unpub-lished data) and available literature (Randall 1967,Moura 1998).
1 Viana, M. 1997. Physiographic influence in the structure ofthe suprabenthic fish assemblage in the rocky shore of Arraial doCabo, Rio de Janeiro, Brazil. Boletim do Instituto de Pesca 24:25–35.
355
Figure 1. Map showing study sites: Fortaleza (FT), Forno-A (FA) and Forno-B (FB) in the Forno Inlet.
Some fish community variables, such as fish speciesrichness, total number of fish and diversity of fishes percensus (Shannon–Wiener index = log2) were obtainedin order to achieve good comparisons among studysites.
Habitat complexity
Percentage cover of benthic organisms (turf algae,zoanthids, millepores, massive corals, encrusting cal-careous algae, urchins, Sargassum, other sessile
organisms) and bare rock were obtained, employinga chain 1 m long with links of 2 cm in length, laid par-allel to depth contour of the rocky shore. The number ofchain links covering each organism was then recordedand used to determine the proportion of rocky shoresubstratum composition (Porter 1972). Transects (n =20) were replicated in each study site at the beginningand at the end of the study.
Topographic complexity was estimated for allstudy sites by the ‘chain link method’ (Luckhurst &Luckhurst 1978), where a chain of 25 m was posi-tioned to follow the contours and crevices as closely
356
as possible. A measure of the linear distance fromsurface to sand bottom was also recorded. The meanratios of contour length/stretched length were used asa comparative index.
The number of existing holes were also assessedas a measure of environment complexity. A divercounted all holes found in 1 m of each side of a tapemeasure stretched along the substratum in replicatedtransects (n = 15), from the surface of the rockyshore to the sand bottom. Hole size was also recorded.Although different size holes were detected, we onlyconsidered small holes for analysis, from about 1 mdiameter to a few centimeters, those which could bepromptly used as refuges by fishes. Other habitat vari-ables, including total surface area of the rocky shoreand substratum diversity (Simpson’s index) were alsoestimated.
Data analysis
The fish and habitat related variables were comparedamong study sites using one way analysis of variance(ANOVA), and when necessary data were transformedto stabilize variances (Underwood 1997). AdditionalStudent–Newman–Keuls (SNK) multiple comparisonsof means test were performed as a post-hoc test (Zar1996). Fish and benthic organisms vertical distributionplus relationships among them were analyzed througha Canonical Correspondence Analysis (CCA) utiliz-ing MVSP 3.1 software. This ordination is consideredto be a powerful multivariate technique which is use-ful to extract synthetic environmental gradients fromecological data (Ter Braak & Verdonschat 1995).
Additionally, in order to indicate which habitat com-plexity variables better explain the highest values of thefish community variables, a Multi Dimensional Scaling(MDS) ordination was used. Although this ordina-tion method makes few assumptions about the data,distances between the points within the MDS configu-ration have the same rank order as the correspondingdissimilarity between samples (Clarke 1993), besidesbeing more rapidly accessible to visual analysis. Theone-way ANOSIN permutation test was used a poste-riori to test for significant differences among formedgroups. Both procedures were carried out utilizingPrimer 4.0 software (Clarke & Warwick2).
2 Clarke, K.R. & R.M. Warwick. 1994. Change in marine com-munities: an approach to statistical analysis and interpretation.Plymounth Marine Laboratory, Plymouth. 64 pp.
Results
Fish composition
One year’s visual census effort at Forno Inlet resulted inmore than 91 species belonging to 37 families (Table 1).Communities in all the study sites were composed of:resident fishes (those which are specific site attachedand were sighted in all censuses); wanderer fishes(those holding a larger home range, e.g. some scaridsand acanthurids); and visitors (fishes that occasionallyfeed or rest on the rocky shore, e.g. pelagic fishes likesome carangids). All communities of fishes sampledwere lognormally distributed, with the dominance offew species and high number of rare species. Indeed,the ten most abundant fishes in the three sites corre-sponded to approximately 80% of all fishes censusedduring this study.
Fishes which occurred in huge schools (more than500 individuals), like Harengula clupeola and Selarcrumenophthalmus, were not included in Table 1and in the results, since they were sighted sporad-ically and in high densities, consequently distortingthe final statistical analysis. The ten most abundantfishes in Forno Inlet, considering all study sites collec-tively were in decreasing order Haemulon aurolinea-tum, Stegastes fuscus, Diplodus argenteus, Abudefdufsaxatilis, Halichoeres poeyi, Pseudupeneus maculatus,Chaetodon striatus, Acanthurus chirurgus, Haemulonsteindachneri and Acanthurus bahianus (Table 1).
Comparison of fishes among study sites
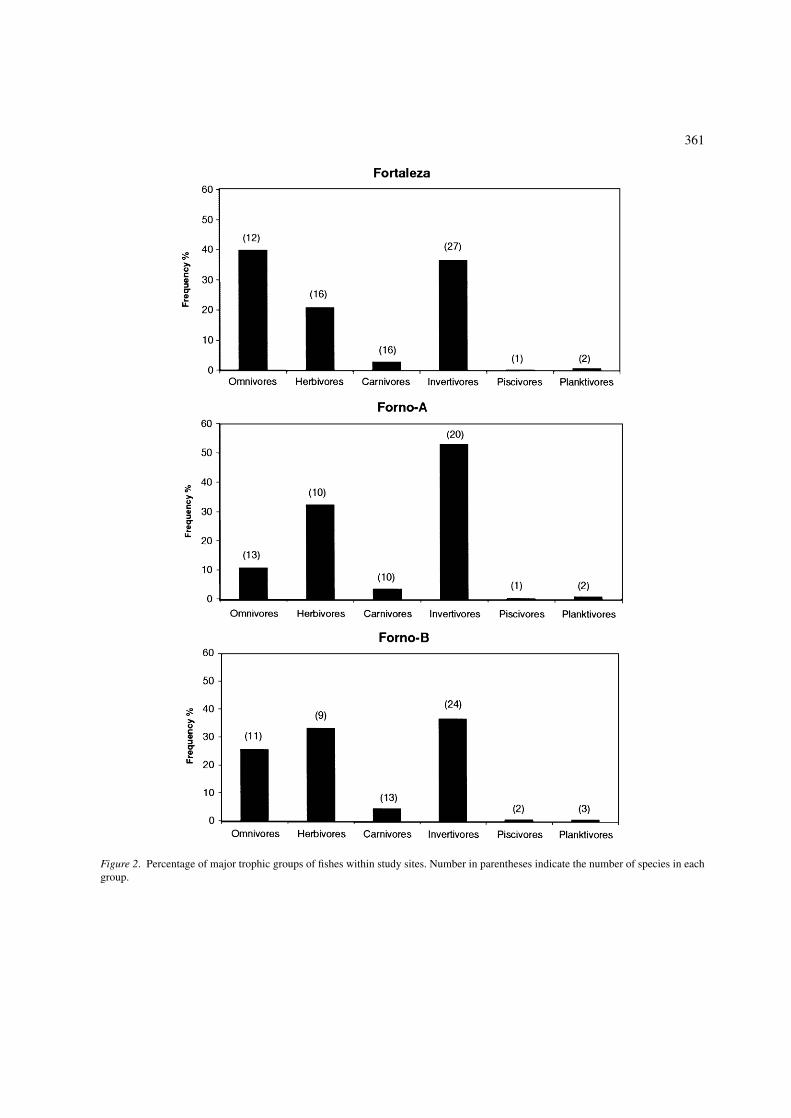
The three sites sustained basically the same commu-nity of fish species, with the ten most abundant fishesin each site being detected in the others, despite dif-ferences in abundance (Table 1). Fish species richness,fish diversity (H’) and total number of fishes per cen-sus were significantly higher at FT than in FA and FBsites (Figure 2). Such differences were due to approxi-mately 15 fishes that were only sighted in FT site, eventhough all of them were found in low abundance (Table1). In terms of trophic groups, composition seemed tobe similar between FA and FB sites, with the majorityof fishes (∼=40–50%) being invertebrate predators, butincluding mainly mobile invertebrate feeders (Figure2). In contrast, at the FT site, omnivores were themost important group, followed by invertivores andherbivores. Herbivores were the second most abun-dant group in FA and FB sites, including territorialist
357
Tabl
e1.
Tota
lcom
posi
tion
ofvi
sual
cens
usin
one
year
effo
rt:D
ensi
type
r160
m2
(mea
n±
SE),
tota
lnum
bero
fspe
cim
ens
coun
ted
(n)
and
perc
ento
fto
talo
bser
ved.
Bol
dnu
mbe
rsin
dica
teth
ete
nm
osta
bund
antfi
shes
inea
chst
udy
site
.
Fam
ily/N
ame
Tro
phic
grou
pFo
rtal
eza
Forn
o-A
Forn
o-B
Den
sity
n%
Den
sity
n%
Den
sity
n%
Aca
nthu
rida
eA
cant
huru
sba
hian
usH
erbi
vore
14.6
5±
1.43
425
3.08
3.57
±0.
5211
81.
152.
97±
0.68
110
1.34
Aca
nthu
rus
chir
urgu
sH
erbi
vore
25.5
5±
1.63
741
5.37
1.21
±0.
3240
0.39
1.27
±0.
2847
0.57
Aca
nthu
rus
coer
uleu
sH
erbi
vore
1.03
±0.
230
0.21
——
——
——
Ant
enna
riid
aeA
nten
nari
usm
ulti
ocel
latu
sC
arni
vore
——
—0.
09±
0.05
30.
02—
——
Bal
istid
aeB
alis
tes
vetu
laIn
vert
ivor
e0.
24±
0.08
70.
050.
24±
0.10
80.
07—
——
Ble
nniid
aePa
rabl
enni
ussp
p.O
mni
vore
4±
0.68
116
0.84
2.36
±0.
3678
0.76
2.62
±0.
3297
1.18
Scar
tell
acr
ista
taH
erbi
vore
1.27
±0.
2637
0.26
0.78
±0.
1626
0.25
0.62
±0.
1223
0.28
Bot
hida
eB
othu
soc
ella
tus
Car
nivo
re0.
48±
0.12
140.
101.
72±
0.22
570.
552
±0.
1874
0.90
Cal
liony
mid
aeC
alli
onym
usba
irdi
Inve
rtiv
ore
——
—0.
09±
0.05
30.
02—
——
Car
angi
dae
Car
ango
ides
bart
holo
mae
iC
arni
vore
3.17
±1.
3192
0.66
——
—0.
75±
0.36
280.
34C
aran
goid
escr
ysos
Car
nivo
re1.
03±
0.57
300.
21—
——
0.16
±0.
096
0.07
Car
anx
latu
sC
arni
vore
0.82
±0.
4624
0.17
——
——
——
Chl
oros
com
brus
chry
suru
sPl
ankt
ivor
e—
——
——
—0.
05±
0.03
20.
02P
seud
ocar
anx
dent
exPl
ankt
ivor
e1.
55±
0.61
450.
322.
06±
0.99
680.
660.
16±
0.09
60.
07C
haen
opsi
dae
Em
blem
ario
psis
sign
ifer
aIn
vert
ivor
e0.
10±
0.08
30.
020.
09±
0.05
30.
020.
16±
0.06
60.
07C
haet
odon
tidae
Cha
etod
onse
dent
ariu
sIn
vert
ivor
e3.
89±
0.38
113
0.81
——
—0.
21±
0.06
80.
09C
haet
odon
stri
atus
Inve
rtiv
ore
13.9
3±
0.78
404
2.92
7.21
±0.
4923
82.
339.
24±
0.53
342
4.18
Cir
rhiti
dae
Am
blyc
irrh
ithu
spi
nos
Car
nivo
re—
——
——
—0.
16±
0.06
60.
07D
acty
lopt
erid
aeD
acty
lopt
erus
voli
tans
Inve
rtiv
ore
1.79
±0.
8152
0.37
——
—0.
16±
0.06
60.
07D
iodo
ntid
aeC
hilo
myc
teru
ssp
inos
usIn
vert
ivor
e0.
10±
0.02
30.
02—
——
0.16
±0.
066
0.07
Dio
don
hyst
rix
Inve
rtiv
ore
0.31
±0.
089
0.06
0.24
±0.
078
0.07
——
—Fi
stul
ariid
aeF
istu
lari
ata
baca
ria
Pisc
ivor
e—
——
——
—0.
16±
0.06
60.
07G
erre
idae
Euc
inos
tom
ussp
p.In
vert
ivor
e0.
06±
0.04
20.
01—
——
0.05
±0.
032
0.02
Gob
iidae
Cor
ypho
pter
ussp
p.O
mni
vore
2.68
±0.
1878
0.56
5.42
±0.
3617
91.
753.
81±
0.44
141
1.72
Ela
cati
nus
figar
oIn
vert
ivor
e4
±0.
3411
60.
845
±0.
2216
51.
611.
83±
0.40
680.
83
358
Tabl
e1.
(Con
tinu
ed).
Fam
ily/N
ame
Tro
phic
grou
pFo
rtal
eza
Forn
o-A
Forn
o-B
Den
sity
n%
Den
sity
n%
Den
sity
n%
Gra
mm
istid
aeR
ypti
cus
bist
risp
inus
Car
nivo
re0.
20±
0.07
60.
04—
——
——
—R
ypti
cus
sapo
nace
usC
arni
vore
0.24
±0.
087
0.05
——
——
——
Hae
mul
idae
Ani
sotr
emus
virg
inic
usIn
vert
ivor
e4.
20±
0.36
122
0.88
——
—0.
18±
0.06
70.
08H
aem
ulon
auro
line
atum
Inve
rtiv
ore
73.9
3±
19.2
721
4415
.593
±15
.58
3069
30.1
19.4
0±
6.22
718
8.78
Hae
mul
onpl
umie
riIn
vert
ivor
e12
.65
±1.
6836
72.
662.
96±
0.31
980.
961
±0.
2137
0.45
Hae
mul
onst
eind
achn
eri
Inve
rtiv
ore
9.79
±1.
1428
42.
059.
60±
1.19
317
3.11
4.94
±1.
3218
32.
24H
oloc
entr
idae
Hol
ocen
trus
asce
nsio
nis
Car
nivo
re2.
36±
0.30
780.
561.
03±
0.26
300.
290.
44±
0.16
130.
15K
ypho
sida
eK
ypho
sus
spp.
Her
bivo
re3.
10±
1.18
900.
65—
——
0.16
±0.
066
0.07
Lab
rida
eB
udia
nus
pulc
hell
usIn
vert
ivor
e0.
10±
0.04
30.
02—
——
——
—B
udia
nus
rufu
sIn
vert
ivor
e0.
10±
0.03
30.
020.
18±
0.06
60.
050.
16±
0.06
60.
07D
orat
onot
usm
egal
epis
Inve
rtiv
ore
0.06
±0.
042
0.01
——
——
——
Hal
icho
eres
cyan
ocep
halu
sIn
vert
ivor
e0.
10±
0.09
30.
020.
09±
0.05
30.
02—
——
Hal
icho
eres
mac
ulip
inna
Inve
rtiv
ore
——
——
——
0.16
±0.
066
0.07
Hal
icho
eres
poey
iIn
vert
ivor
e21
.48
±1.
762
34.
5125
.15
±1.
0683
08.
1422
.48
±1.
2782
210
.0H
alic
hoer
esbr
asil
iens
isIn
vert
ivor
e1.
55±
0.16
450.
320.
18±
0.08
60.
050.
40±
0.10
150.
18L
abri
som
idae
Lab
riso
mus
spp.
Inve
rtiv
ore
——
—0.
57±
0.10
190.
180.
16±
0.06
60.
07L
abri
som
usnu
chip
inni
sIn
vert
ivor
e2.
37±
0.20
690.
50—
——
1.35
±0.
1350
0.61
Mal
acoc
tenu
ssp
.In
vert
ivor
e—
——
1.33
±0.
3244
0.43
——
—M
alac
octe
nus
spp.
Inve
rtiv
ore
——
—0.
09±
0.05
30.
020.
16±
0.06
60.
07M
onac
anth
idae
Alu
tera
scri
pta
Om
nivo
re—
——
0.30
±0.
0810
0.09
——
—C
anth
erhi
nes
pull
usO
mni
vore
0.17
±0.
085
0.03
——
——
——
Step
hano
lepi
shi
spid
usO
mni
vore
10.5
1±
0.68
305
2.21
0.09
±0.
053
0.02
0.40
±0.
0915
0.18
Mug
ilida
eM
ugil
sp.
Her
bivo
re0.
06±
0.04
20.
01—
——
——
—M
ullid
aeP
seud
upen
eus
mac
ulat
usIn
vert
ivor
e18
±1.
3152
23.
7811
.93
±2.
1939
43.
869.
86±
0.82
365
4.46
Mur
aeni
dae
Gym
noth
orax
fune
bris
Car
nivo
re0.
41±
0.09
120.
08—
——
——
—G
ymno
thor
axm
orin
gaC
arni
vore
0.20
±0.
076
0.04
——
——
——
Gym
noth
orax
vici
nus
Car
nivo
re0.
20±
0.07
60.
040.
09±
0.05
30.
020.
16±
0.06
60.
07M
urae
nam
illi
aris
Inve
rtiv
ore
——
——
——
0.16
±0.
066
0.07
Ogc
ocep
halid
aeO
gcoc
epha
lus
vesp
erti
lio
Car
nivo
re—
——
0.42
±0.
0814
0.13
0.27
±0.
0710
0.12
Oph
icht
hida
eM
yric
hthy
sbr
evic
eps
Inve
rtiv
ore
——
—0.
09±
0.05
30.
020.
16±
0.06
60.
07M
yric
hthy
soc
ella
tus
Inve
rtiv
ore
——
——
——
0.24
±0.
089
0.11
359
Ost
raci
idae
Lac
toph
rys
poly
goni
aO
mni
vore
0.55
±0.
1116
0.11
0.24
±0.
078
0.07
0.16
±0.
066
0.07
Lac
toph
rys
quad
rico
rnni
sO
mni
vore
——
—0.
18±
0.06
60.
050.
16±
0.06
60.
07Po
mac
anth
idae
Cen
trop
yge
aura
nton
otus
Om
nivo
re—
——
0.48
±0.
0816
0.15
——
—H
olac
anth
usci
liar
isO
mni
vore
0.51
±0.
1015
0.10
0.09
±0.
053
0.02
0.24
±0.
079
0.11
Hol
acan
thus
tric
olor
Om
nivo
re0.
10±
0.07
30.
02—
——
——
—Po
mac
anth
uspa
ruO
mni
vore
0.44
±0.
1613
0.09
——
—0.
18±
0.07
70.
08Po
mac
entr
idae
Abu
defd
ufsa
xati
lis
Om
nivo
re61
.10
±10
.26
1772
12.8
13.5
7±
2.96
448
4.39
27.2
1±
2.89
1007
12.3
Chr
omis
mul
tili
neat
aPl
ankt
ivor
e1.
41±
0.23
410.
290.
63±
0.11
210.
200.
78±
0.13
290.
35St
egas
tes
fusc
usH
erbi
vore
19.2
7±
1.48
559
4.05
88.4
2±
3.92
2918
28.6
59.7
8±
1.97
2212
27.0
Steg
aste
spi
ctus
Om
nivo
re—
——
3.39
±0.
4311
21.
09—
——
Steg
aste
sva
riab
ilis
Her
bivo
re0.
58±
0.10
170.
121.
57±
0.14
520.
515.
64±
2.37
209
2.55
Scar
idae
Cry
ptot
omus
rose
usH
erbi
vore
1.03
±0.
2630
0.21
0.18
±0.
066
0.05
——
—Sc
arus
tris
pino
sus
Her
bivo
re9.
72±
1.31
282
2.04
0.33
±0.
1411
0.10
0.18
±0.
067
0.08
Scar
usze
lind
aeH
erbi
vore
0.31
±0.
89
0.06
——
——
——
Spar
isom
asp
p.H
erbi
vore
0.96
±0.
2628
0.20
0.30
±0.
0910
0.09
——
—Sp
aris
oma
atom
ariu
mH
erbi
vore
0.72
±0.
1521
0.15
——
—0.
16±
0.06
60.
07Sp
aris
oma
radi
ans
Her
bivo
re0.
86±
0.16
250.
180.
42±
0.19
140.
13—
——
Spar
isom
aax
illa
reH
erbi
vore
6.75
±0.
6619
61.
422.
78±
0.55
920.
902.
10±
0.41
780.
95Sc
iani
dae
Equ
etus
lanc
eola
tus
Inve
rtiv
ore
0.10
±0.
053
0.02
——
——
——
Pare
ques
acum
inat
usC
arni
vore
11.9
6±
1.38
347
2.51
3.27
±0.
5410
81.
062.
64±
0.40
981.
19Sc
orpa
enid
aeSc
orpa
ena
spp.
Car
nivo
re0.
75±
0.19
220.
150.
54±
0.12
180.
170.
94±
0.13
350.
42Se
rran
idae
Epi
neph
elus
mar
gina
tus
Car
nivo
re0.
65±
0.14
190.
130.
81±
0.16
270.
260.
35±
0.11
130.
15E
pine
phel
usm
orio
Car
nivo
re0.
06±
0.05
20.
01—
——
——
—M
ycte
rope
rca
bona
ciC
arni
vore
0.13
±0.
084
0.02
——
—0.
08±
0.04
30.
03M
ycte
rope
rca
inte
rsti
tial
isC
arni
vore
0.06
±0.
042
0.01
0.09
±0.
053
0.02
0.05
±0.
032
0.02
Myc
tero
perc
aac
utir
ostr
isC
arni
vore
1.77
±0.
1948
0.34
2.36
±0.
3078
0.76
1.35
±0.
2650
0.61
Serr
anus
bald
win
iIn
vert
ivor
e2.
51±
0.29
730.
524.
81±
0.56
159
1.56
6.29
±0.
6323
32.
85Sp
arid
aeC
alam
ussp
p.In
vert
ivor
e0.
86±
0.3
250.
180.
24±
0.13
80.
071.
59±
0.56
590.
72D
iplo
dus
arge
nteu
sO
mni
vore
103.
7±
21.3
330
1021
.84.
27±
1.25
141
1.38
17.7
0±
4.82
655
8.01
Syng
nath
idae
Cos
moc
ampu
sal
biro
stri
sIn
vert
ivor
e0.
10±
0.06
30.
02—
——
——
—H
ippo
cam
pus
spp.
Inve
rtiv
ore
0.10
±0.
053
0.02
——
——
——
Syno
dont
idae
Syno
dus
spp.
Pisc
ivor
e0.
48±
0.13
140.
100.
33±
0.12
110.
100.
75±
0.16
280.
34Te
trao
dont
idae
Can
thig
aste
raf
f.ro
stra
taO
mni
vore
2.93
±0.
2385
0.61
1.60
±0.
3153
0.52
2.56
±0.
2695
1.16
Spho
eroi
des
spen
gler
iO
mni
vore
1.75
±0.
3451
0.36
0.54
±0.
1318
0.17
0.97
±0.
2036
0.44
Torp
edin
idae
Nar
cine
bras
ilie
nsis
Inve
rtiv
ore
0.20
±0.
076
0.04
——
——
——
Tota
lobs
erve
d13
789
1018
781
59
360
Table 2. Summary of habitat structure and fish community structure variables (x ±SD), plus the one way ANOVA results of comparisonsamong study sites.
Fortaleza (FT) Forno-A (FA) Forno-B (FB)
Fish species richness (number 73 ± 10.06 61 ± 6.30 55 ± 6.28 p < 0.05∗ F = 4.66 FT �= FA = FBof species per census)
Total number of fishes 468 ± 74.23 318 ± 51.53 233 ± 46.34 p < 0.001∗ F = 8.05 FT �= FA = FBper census
Fish diversity (H′) 4.06 ± 0.49 3.26 ± 0.32 3.50 ± 0.29 p < 0.01∗ F = 6.14 FT �= FA = FBper census
Number of holes 12.33 ± 7.24 21.70 ± 8.94 22.60 ± 5.24 p < 0.01∗ F = 5.54 FT �= FA = FBSurface area (total length of 23.25 ± 4.37 15.57 ± 3.05 14.3 ± 3.19 p < 0.01∗ F = 18.61 FT �= FA = FB
the rocky shore)Substratum diversity 0.68 ± 0.08 0.65 ± 0.05 0.69 ± 0.08 p = 0.48 F = 0.73 FT = FA = FB(Simpson’s index)
Topographic complexity 1.35 ± 0.16 1.36 ± 0.14 1.32 ± 0.11 p = 0.77 F = 0.26 FT = FB = FA(rugosity index)
% cover of turf algae 11.41 ± 5.53 11.07 ± 5.08 11.43 ± 5.77 p = 0.49 F = 0.72 FT = FA = FB% cover of zoanthids 1.85 ± 0.05 23.02 ± 6.93 23.99 ± 15.99 p < 0.001∗ F = 20.18 FT �= FA = FB% cover of millepores 1.63 ± 0.08 4.77 ± 1.33 5.01 ± 1.02 p = 0.07 F = 2.91 FT = FA = FB% cover of massive corals — 1.24 ± 0.78 4.45 ± 2.96 p < 0.001∗ F = 14.99 FT �= FA �= FB% cover of bare rock 31.94 ± 18.11 51.53 ± 6.35 39.66 ± 17.20 p < 0.05∗ F = 4.81 FA �= FT = FB% cover of encrusting 21.78 ± 11.62 2.89 ± 1.03 11.44 ± 8.90 p < 0.001∗ F = 10.73 FT �= FA �= FB
calcareous algae% cover of urchins 9.21 ± 4.78 2.11 ± 1.40 3.39 ± 0.51 p < 0.001∗ F = 24.46 FT �= FA = FB% cover of other organisms 9.09 ± 4.51 5.76 ± 2.43 2.35 ± 1.64 p < 0.001∗ F = 8.24 FT = FA �= FB
(sessile invertebrates)% cover of Sargassum 9.63 ± 2.23 — — FT �= FA = FB
∗Indicates significant difference.
herbivores from which Stegastes fuscus was by far themost abundant, and roving herbivores such as scaridsand acanthurids. The territorial herbivore, S. fuscus,sustained high densities in FA and FB sites, whileoverall roving herbivores were most abundant at FTsite, although more species of these non territorialherbivores were found in the later area. Carnivores, pis-civores and planktivores showed similar percentagesin composition among sites, with the first group beingricher at the FT site (Table 1). A quick view of the datashows that large fishes, not only predators but also her-bivores, sustained higher densities in FT, while smallfishes such as S. baldwini and Coryphopterus spp. weremore abundant in FA and FB.
Habitat complexity
Within the habitat variables, substratum diversity, topo-graphic complexity (rugosity), percentage cover of turfalgae and of Millepora alcicornis were not significantlydifferent among sites (Table 2). Although not revealedby statistical analysis, M. alcicornis was scarce at the
FT site. The same pattern was repeated with the othercnidarians, such as zoanthids (e.g. Palythoa caribae-orum) and massive corals (e.g. Siderastrea stellataand Mussismila hispida). Similar number of holeswere found at the FA and FB sites, almost the dou-ble found in FT site. The mean length of surface areawas slightly higher in FT, and such a difference couldinfluence the comparison to other sites for some organ-isms which possess an equal or a lesser percentageof cover. Abundance of sessile benthic invertebrates,the great majority being filterers, were also higherat FT, as this site is more exposed to predominantcurrents.
Fish and benthic organisms vertical distribution
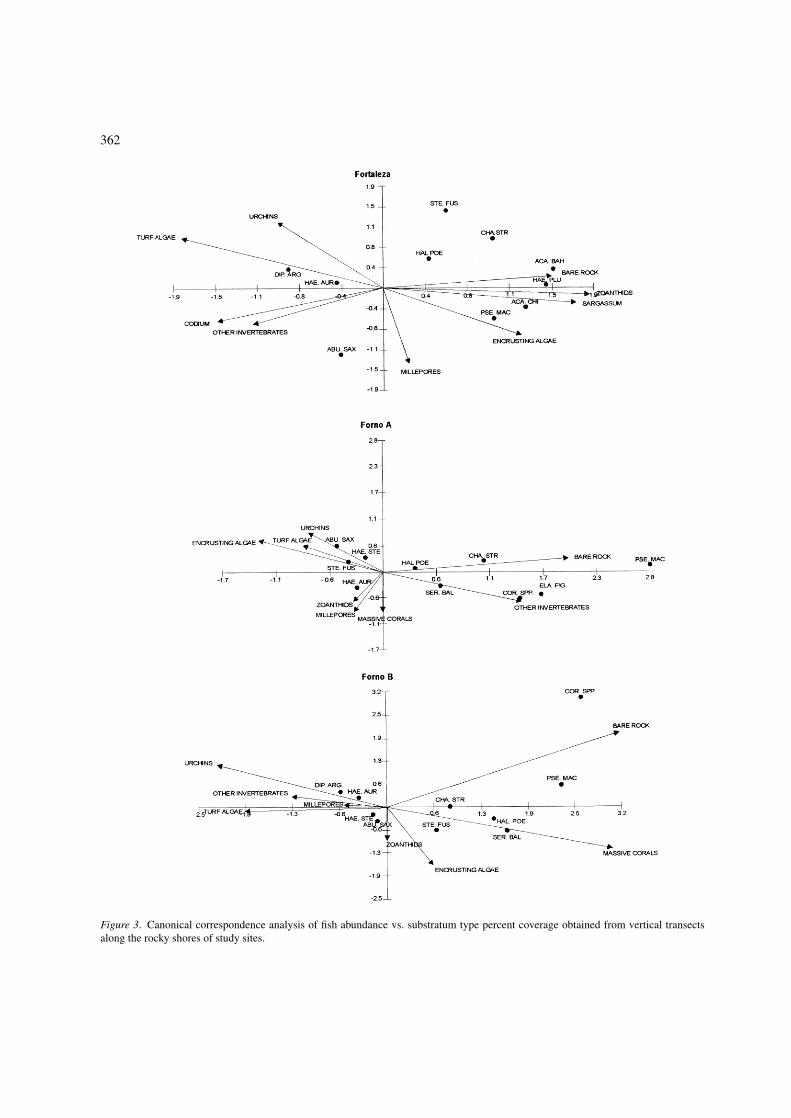
The ten most abundant species of fishes are repre-sented by points and the habitat variables representedby arrows in the CCA ordination diagrams for the threestudy sites (Figure 3). The fish species and habitat vari-ables jointly reflected the species distribution alongeach of the habitat variables. Together, fish species and
361
Figure 2. Percentage of major trophic groups of fishes within study sites. Number in parentheses indicate the number of species in eachgroup.
362
Figure 3. Canonical correspondence analysis of fish abundance vs. substratum type percent coverage obtained from vertical transectsalong the rocky shores of study sites.
363
habitat variables accounted for 65%, 89% and 93% ofthe variance in the weighted averages, respectively forFT, FA and FB sites; the corresponding sums of eigen-values being 1.1, 0.6 and 0.81. In the three biplots, theaxis 1 clearly represented the gradient of depth on therocky shores studied, where the left side was charac-terized by shallow environments with increase in depthas one goes to the right (Figure 4).
In the FT site ordination, turf algae and Codiumintertextum were the most important habitat variablesdescribing the shallow habitat, followed by urchins,mainly Echinometra lucunter, and other sessile benthicinvertebrates, including barnacles, mussels, anemones,sponges, ascidians, hydroids and bryozoans. Fishesabundant in this zone included D. argenteus, H. auro-lineatum and A. saxatilis. The hydrocoral, Milleporaalcicornis, showed an intermediate distribution at theFT site, being more associated with axis 2, which wasresponsible for the dispersing of points in the verticalposition. Stegastes fuscus, which is a typical inhabitantof shallow areas, at the FT site did not present a welldefined pattern, despite sustaining higher abundance inshallow areas (Figure 4a). H. poeyi and C. striatus werefishes which possessed an ample distribution along therocky shore, while the herbivores A. chirurgus andA. bahianus and the benthic invertebrate feeders H.plumieri and P. maculatus were more commonly foundin deeper zones. The later are more associated withthe sand-rocky interface. The percent cover of zoan-thids, together with that of Sargassum furcatum, whichoccurred only in summer periods, were the most impor-tant habitat variables influencing the distribution offishes in deeper zones of the rocky shore. The amountof bare rock increases with depth and such a patternpredominated on all sites. The encrusting calcareousalgae were more densely distributed on mid to deeperhabitats at the FT site.
For FA site, the cover of encrusting calcareous algaewas the best indication of a shallow environment, fol-lowed by the cover of urchins and turf algae. Themost abundant fishes in this zone were A. saxatilis,S. fuscus, H. aurolineatum and H. steindacneri. Thecover of millepores, zoanthids and massive corals,more densely represented in intermediate and deeperzones, were responsible for the vertical point disper-sal of the biplot ordination. H. poeyi, S. baldwini andC. striatus are fishes with an ample distribution alongthe rocky shore in this site. The cover of bare rock andother sessile organisms characterized the deeper zones.Fishes occurring there were the gobiids, Coryphopterusspp., highly associated with soft bottom, the Brazilian
cleaner fish, E. figaro, and the goat fish, P. maculatus(Figure 4b).
In the ordination for the FB site, urchins and turfalgae were the benthic organisms which most influ-enced the distribution of typically shallow habitatfishes, followed by the percentage cover of other sessilebenthic organisms and millepores. The most abundantfishes in this zone were D. argenteus, H. aurolinea-tum, H. steindacneri and A. saxatilis. The percentagecovers of zoanthids and encrusting calcareous algaewere associated with axis 2 and at this site showed ahigh density in mid parts of the rocky shore. S. fuscusand C. striatus, despite being most abundant in shal-low areas (Figure 4c), showed an ample distribution onthe positive side of axis 1. H. poeyi and S. baldwini,as at FA, were fishes with an intermediate depth dis-tribution, while Coryphopterus spp. and P. maculatuswere common in deeper areas. At this site, the percentcover of bare rock, together with massive corals, alsoreflected the distribution of fishes on deeper areas.
Relationship between fish community structure andhabitat complexity
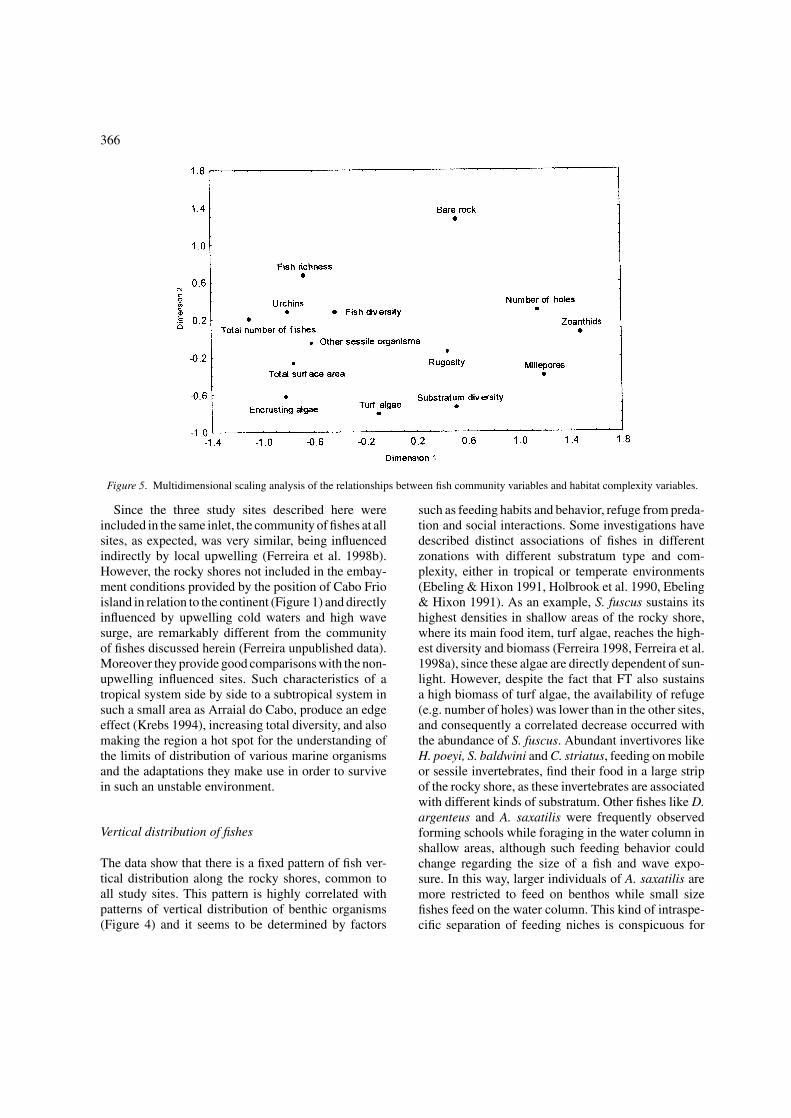
The results of the MDS analysis demonstrate graphi-cally what was explicit in Table 2. Ordination extracted47% of the variance for the first two vectors. The one-way ANOSIN test confirmed a significant difference(R = 0.98, p < 0.1%) between the two groups formed(Figure 5). Group 1 presented habitat variables moreassociated with the FT site, including percent cover ofencrusting calcareous algae, urchins and other sessileinvertebrates, as well as all fish variables (fish rich-ness, fish diversity and total number of fishes). Group 2showed habitat variables which were highly associatedwith the FA and FB sites, such as percent cover of mille-pores and zoanthids, and number of holes, together withthe habitat variables not significantly different amongstudy sites (percent cover of turf algae, rugosity andsubstratum diversity; see Table 2). The habitat variablesthat seemed to be highly associated with fish vari-ables were percent cover of sessile invertebrates, totalsurface area, percent cover of urchins and encrustingcalcareous algae.
Discussion
Patterns of fish abundance
Considering that Arraial do Cabo region is a highlatitude tropical area and does not sustain true coral
364
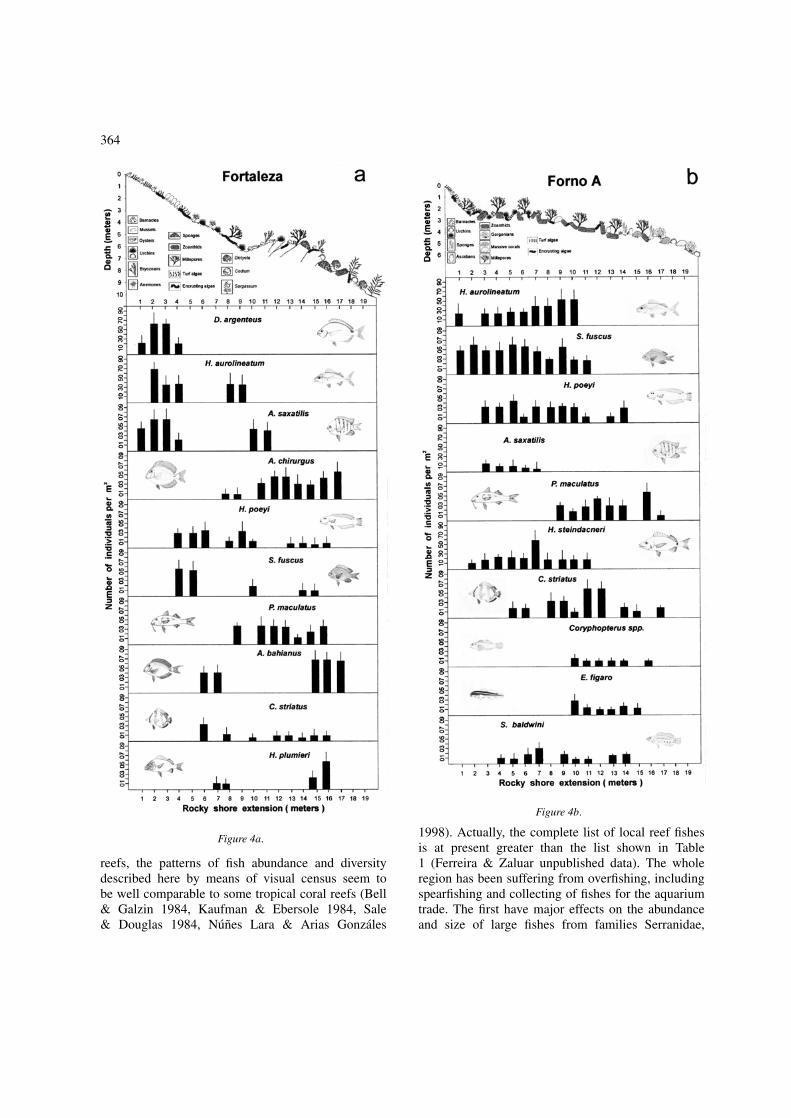
Figure 4a.
reefs, the patterns of fish abundance and diversitydescribed here by means of visual census seem tobe well comparable to some tropical coral reefs (Bell& Galzin 1984, Kaufman & Ebersole 1984, Sale& Douglas 1984, Nunes Lara & Arias Gonzales
Figure 4b.
1998). Actually, the complete list of local reef fishesis at present greater than the list shown in Table1 (Ferreira & Zaluar unpublished data). The wholeregion has been suffering from overfishing, includingspearfishing and collecting of fishes for the aquariumtrade. The first have major effects on the abundanceand size of large fishes from families Serranidae,

365
Figure 4c. Fish abundance and vertical distribution plusschematic view of vertical substratum composition of the threestudy sites: a – Fortaleza, b – Forno-A and c – Forno-B.
Carangidae, Balistidae and Scaridae; while the sec-ond affects most the abundance of fishes from fam-ilies Labridae, Pomacanthidae, Pomacentridae andSyngnathidae. Fortunately, the whole region recently
became a harvest reserve, including a marine pro-tected area. Therefore, the patterns of fish abundancedetected here, mirror the community state at the timeof present study, structured by known factors (Hixon1991, Russ & Alcala 1998) and possible unknownsynergistic factors driven by different local impacts.
The data showed that the basic difference in thecommunity structure of fishes among study sites wasthat FT sustains a higher diversity and abundance offishes than the other sites, which in turn are very simi-lar, both in terms of fish community and environment.Omnivores, for example, were best represented in theFT site (Figure 2), where the cover of P. caribaeorumas well as other cnidarians is very meager, due mainlyto high wave surge, thus giving space to the growth of avariety of sessile invertebrates, and consequently offer-ing a greater diversity of food. Taking this into account,substratum diversity was not a good descriptor for thecomparison of different study sites in this rocky shoresystem. Good examples of omnivores in this case arethe filefish, S. hispidus, and the porgy, D. argenteus(Table 1), since despite them occurring in Forno-A andForno-B sites, they reached higher densities at FT.
As FT sustains a great influx of water, more driftmaterial is available (e.g. macroplankton) (Ferreirapersonal observation), which increases the density ofrestricted planktivores such as C. multilineata, alongwith occasional planktivores (e.g. pelagic pickers) suchas A. saxatilis and C. sedentarius. As the abundanceof virtual prey increased, an increase in abundanceof large predators was detected (Table 1). Otherwise,abundances of more site attached, small fishes, likeCoryphopterus spp. and S. baldwini were higher atthe sheltered sites, where more size specific refugeswere available and less predators were present. Rovingherbivorous fishes were also most abundant at FT. Alarger rocky shore as well as the lack of dominance ofP. caribaeorum were the potential factors contributingto this pattern, since more space was available for algalgrowth. This contrasts with some authors, who foundno relationship between the abundance of herbivorousfishes and algae cover (Wellington & Victor 1985,Chabanet et al. 1997). However, the most importantfactor in explaining the highest abundance of rovingherbivorous fishes at FT site seems to be the low den-sity of S. fuscus territories. In FA and FB sites, thisspecies can occupy more than 70% of the substrate inshallow areas at some places, thus having a great influ-ence on feeding behavior of scarids and acanthurids,which is a well reported interaction (Choat 1991).
366
Figure 5. Multidimensional scaling analysis of the relationships between fish community variables and habitat complexity variables.
Since the three study sites described here wereincluded in the same inlet, the community of fishes at allsites, as expected, was very similar, being influencedindirectly by local upwelling (Ferreira et al. 1998b).However, the rocky shores not included in the embay-ment conditions provided by the position of Cabo Frioisland in relation to the continent (Figure 1) and directlyinfluenced by upwelling cold waters and high wavesurge, are remarkably different from the communityof fishes discussed herein (Ferreira unpublished data).Moreover they provide good comparisons with the non-upwelling influenced sites. Such characteristics of atropical system side by side to a subtropical system insuch a small area as Arraial do Cabo, produce an edgeeffect (Krebs 1994), increasing total diversity, and alsomaking the region a hot spot for the understanding ofthe limits of distribution of various marine organismsand the adaptations they make use in order to survivein such an unstable environment.
Vertical distribution of fishes
The data show that there is a fixed pattern of fish ver-tical distribution along the rocky shores, common toall study sites. This pattern is highly correlated withpatterns of vertical distribution of benthic organisms(Figure 4) and it seems to be determined by factors
such as feeding habits and behavior, refuge from preda-tion and social interactions. Some investigations havedescribed distinct associations of fishes in differentzonations with different substratum type and com-plexity, either in tropical or temperate environments(Ebeling & Hixon 1991, Holbrook et al. 1990, Ebeling& Hixon 1991). As an example, S. fuscus sustains itshighest densities in shallow areas of the rocky shore,where its main food item, turf algae, reaches the high-est diversity and biomass (Ferreira 1998, Ferreira et al.1998a), since these algae are directly dependent of sun-light. However, despite the fact that FT also sustainsa high biomass of turf algae, the availability of refuge(e.g. number of holes) was lower than in the other sites,and consequently a correlated decrease occurred withthe abundance of S. fuscus. Abundant invertivores likeH. poeyi, S. baldwini and C. striatus, feeding on mobileor sessile invertebrates, find their food in a large stripof the rocky shore, as these invertebrates are associatedwith different kinds of substratum. Other fishes like D.argenteus and A. saxatilis were frequently observedforming schools while foraging in the water column inshallow areas, although such feeding behavior couldchange regarding the size of a fish and wave expo-sure. In this way, larger individuals of A. saxatilis aremore restricted to feed on benthos while small sizefishes feed on the water column. This kind of intraspe-cific separation of feeding niches is conspicuous for
367
other species of fishes in this system. P. maculatus is atypical fossorial feeder, foraging mostly over sand, sobeing more abundant in the sand-rocky shore habitat.Notwithstanding, they detect and capture prey in quitedifferent ways (McCormick 1995), thus they couldextend their limits of distribution along the rocky shore.
As FT presented different habitat characteris-tics, some different fish species occurred there.Nevertheless, where the same species are present andcomparisons are done, they tend to maintain the samevertical distribution as is shown in Figure 4. Thus, agood approach to understand the relationship betweenfishes and substratum type relies basically on con-tinued field observations and gut analysis. Bearingthis in mind, it is possible to infer a certain degreeof predictability in terms of spatial distribution offishes, especially for dominant species of fish on theinvestigated rocky shores and even, considering the dif-ferences reported between FT and FA and FB sites, topredict the presence or absence of a fish species (interms of a stabilized community).
Relationships between fish variables andhabitat variables
FT sustains the highest fish richness, fish diversity andtotal number of fishes sighted, and from the MDSresults it was evident that the habitat variables moreassociated with those fish community structure vari-ables are the cover of other sessile invertebrates, totalsurface of the rocky shore, density of urchins and thecover of encrusting calcareous algae. Rugosity (= topo-graphic complexity) which has been widely used incoral reefs around the world as a good predictor offish diversity and, in some locations, abundance (seeChabanet et al. 1997) was a poor descriptor of numberof fishes in the rocky shores studied. Complexity on therocky shore system seems to rely on the presence orabsence of holes, which in turn are formed by accumu-lation and superposition of granite boulders. Indeed, ifthe rocky shore is characterized by large boulders, morelarge holes are formed (as was found at FT), while thereverse is characteristic of the FA and FB rocky shores.Although the number of holes was higher at FA andFB sites, they do not attract so many fishes as FT sus-tains. Indeed, the characteristic of a great number ofholes is to offer refuges for fishes such as damselfishesand small site attached fishes, e.g. Coryphopterus spp.and S. baldwini, which reflect in the greater abundance
of these fishes at the sheltered sites (Table 1). Such arelationship has also been described to occur on coralreefs where architectural complexity of corals attractsmore sedentary and small territorial fishes (Sale &Douglas 1984). Clearly, where there are large patchesof M. alcicornis associated with rocky shores, similar totrue coral reefs, the complexity is higher. Nevertheless,when comparisons were made the difference amongstudy sites regarding rugosity was not significant, eventhough the M. alcicornis cover at FA and FB sites wasgreater than at FT. Actually, the contrast when compar-ing sites with huge cover of M. alcicornis, not analyzedherein, is the refuge that these hydrocorals providedby increasing the variety of microhabitats for recruitsand juveniles, especially noted for H. poeyi, S. pictusand C. striatus (Ferreira personal observation). Since apositive correlation does not necessarily mean causa-tion, careful detailed discussion, relying on fish-habitatinteraction, become necessary (Ohman & Rajasuriya1998).
Excluding recruits and juvenile urchins, adulturchins are food resources for quite a few fishes, includ-ing (in this study) D. histrix and B. vetula, with the lateroccurring in very low densities, mainly due to fishing.Thus, urchins density does not seem to be a good indica-tor of high fish abundance, but as stressed in literature,the lack of their predators (Hay 1984, McClanahan et al.1994). The percent cover of encrusting calcareous algaeis often associated with the density of urchins, speciallyE. lucunter. In fact, due to its characteristic of high her-bivore pressure, this urchin maintains huge barrens ofsuch red encrusting calcareous algae in shallow areas ofthe rocky shores (Ferreira et al. unpublished data), theonly algae which generally could keep itself growingunder a such grazing pressure (Steneck 1988). Despitethis, these algae were abundant on different parts ofthe rocky shores in each study site. Hence, the habitatvariables which could better explain the association ofall fish variables at FT were percent cover of other ses-sile invertebrates and total surface of the rocky shore.Firstly, with an increase in abundance and diversity ofsessile invertebrates, a greater diversity of food is avail-able, as suggested by the high abundance of omnivoresrecorded at FT site (Figure 2). Moreover, additionalspace on the substratum, provided not only by a widerrocky shore, but also by the lack of P. caribaeorum,means that more larvae could recruit in such space, con-sequently increasing the availability and diversity offood. Likewise, the exposure conditions to wave surgeof this site, providing a great influx of drift material,

368
seems to be an additional determinant, contributing toincreasing in the diversity of fishes. Therefore, it is sug-gested that a rocky shore with conditions of high wavesurge, not affected directly by upwelling and larger thanrocky shores like FA and FB sites, could sustain greaternumber and higher diversity of fishes than those rockyshores found in sheltered sites.
Conclusion
The results presented in this study showed that FornoInlet presented a rich reef fish fauna with fixed patternsof vertical distribution on local rocky shores. In pro-tected areas, rocky shores in locations subject to morewave exposure sustain a higher diversity and number offishes. This study demonstrated that some indicators ofhabitat complexity widely used for other reef systems,were not useful for describing and comparing rockyshores, wave exposure being the main structural fac-tor. Although the factors which regulated communitystructure of reef fish have been intensely investigatedand they are known to be determined by several inter-acting factors (Hixon 1991, Russ & Alcala 1998), fishdiversity and distribution in the rocky shore systemstudied here seemed to be highly predictable. This kindof information is valuable in order to optimally managelocal resources. In fact, since Arraial do Cabo is now ina process of evaluation for the regulation of the use ofspecific marine areas, these data will be useful for opti-mizing the management of the local marine resources.It is extremely important to produce basic knowledge,in terms of diversity and abundance of local resources,in order that the development of precise models can beaccomplished and a better understanding of the localrocky shore system and its impacts can be gained. Thiswill be important to help the local preservation effortsin the near future.
Acknowledgements
Logistic and financial support was given by IEAPM.As usual, discussion with Helena Passeri contributedgreatly to final work. Thanks to Terezinha Andrea andJoel Creed for improving the final English version.Thanks also to Seroma who helped with Figure 4 and toEduardo Godoy, who helped to count holes in transects.Many thanks to two anonymous referees for commentsand suggestions.
References cited
Bell, J.D. & R. Galzin. 1984. Influence of live coral cover on coralreef fish communities. Mar. Biol. Prog. Ser. 15: 265–274.
Bonhsack, J.A., A.M. Ecklund & A.M. Szmant. 1997. Artificialreef research: is there more than the attraction-productionissue? Fisheries 22: 14–16.
Carpenter, K.E., R.I. Miclat, V.D. Albaladejo & V.T. Corpuz.1981. The influence of substrate structure on the local abun-dance and diversity of Philippine reef fishes. Proc. 4th Int. CoralReef Symp. 2: 497–502.
Carr, M.H. 1989. Effects of macroalgal assemblages on therecruitment of temperate zone reef fishes. J. Exp. Mar. Biol.Ecol. 126: 59–76.
Castro, C.B., C.A. Echeverrıa, D.O. Pires, B.J. Mascarenhas &S.G. Freitas. 1995. Distribuicao de cnidaria e equinodermatano infralitoral de costoes rochosos de Arraial do Cabo, Rio deJaneiro, Brasil. Rev. Brasil. Biol. 55: 471–480.
Chabanet, P., H. Ralambondrainy, M. Amanieu, G., Faure &R. Galzin. 1997. Relationships between coral reef substrataand fish. Coral Reefs 16: 93–102.
Choat, J.H. 1991. The biology of herbivorous fishes on coral reefs.pp. 120-155. In: P.F. Sale (ed.) The Ecology of Fishes on CoralReefs, Academic Press, San Diego.
Clarke, K.R. 1993. Non-parametric multivariate analysis ofchanges in community structure. Aust. J. Ecol. 18: 117–143.
Ebeling, A.W. & M.A. Hixon. 1991. Tropical and temperate reeffishes: comparison of community structures. pp. 509–563. In:P.F. Sale (ed.) The Ecology of Fishes on Coral Reefs, AcademicPress, San Diego.
Falcon, J.M., S.A. Bortone, A. Brito & C.M. Bundrick. 1996.Structure of and relationships within and between the littoral,rock-substrate fish communities off four islands in the CanarianArchipelago. Mar. Biol. 125: 215–231.
Ferreira, C.E.L. 1998. Partitioning resources by herbivores ina tropical rocky shore. Doctorate Thesis, Sao Carlos FederalUniversity, Sao Paulo. 100 pp.
Ferreira, C.E.L., A.C. Peret & R. Coutinho. 1998. Seasonal graz-ing rates and food processing by tropical herbivorous fishes.J. Fish Biol. 53 (Suppl. A): 222–235.
Ferreira, C.E.L., J.E.A. Goncalves, R. Coutinho & A.C. Peret.1998. Herbivory by the dusky damselfish Stegastes fuscus(Cuvier, 1830) in a tropical rocky shore: effects on the benthiccommunity. J. Exp. Mar. Biol. Ecol. 229: 241–264.
Grossman, G.D., G.P. Jones & W.J. Seaman, Jr. 1997. Do artificialreefs increase regional fish production? A review of existingdata. Fisheries 22: 17–23.
Guimaraens, M.A. & R. Coutinho. 1996. Spatial and temporalvariation of benthic marine algae at Cabo Frio upwelling region,Rio de Janeiro, Brazil. Aquatic. Bot. 52: 283–299.
Hixon, M.A. 1991. Predation as a process structuring coral reeffish communities. pp. 475–508. In: P.F. Sale (ed.) The Ecologyof Fishes on Coral Reefs, Academic Press, San Diego.
Holbrook, S.J., M.H. Carr, R.J. Schmitt & J.A. Coyer. 1990. Effectof giant kelp on local abundance of reef fishes: the importanceof ontogenetic resource requirements. Bull. Mar. Sci. 47: 104–114.
369
Jenkins, G.P. & M.J. Wheatley. 1998. The influence of habi-tat complexity on nearshore fish assemblages in a southernAustralian embayment: comparison of shallow seagrass, reef-algal and unvegetated sand habitats, with emphasis on theirimportance to recruitment. J. Exp. Mar. Biol. Ecol. 221:147–172.
Kaufman, L.S. & J.P. Ebersole. 1984. Microtopography and theorganization of two assemblages of coral reef fishes in the WestIndies. J. Exp. Mar. Biol. Ecol. 78: 253–268.
Krebs, C. J. 1994. Ecology. Harper & Row, New York.550 pp.
Lavrado, H.P. 1992. Prey selection by the gastropod Thaishaemastoma (Linneus) in Arraial do Cabo region, RJ. MasterThesis, Campinas State University, Sao Paulo. 104 pp.
Legendre, L. & P. Legendre. 1983. Numerical ecology. Elsevier,New York. 318 pp.
Luckhurst, B.E. & K. Luckhurst. 1978. Analysis of the influenceof the substrate variables on coral reef fish communities. Mar.Biol. 49: 317–323.
McCormick, M.I. 1995. Fish feeding on mobile benthic inverte-brates: influence of spatial variability in habitat associations.Mar. Biol. 121: 627–637.
Moura, R.L. 1998. Activity, distribution and feeding tactics of afish community from Atol das Rocas. Master Thesis, Sao PauloUniversity, Sao Paulo. 70 pp.
Nunez Lara, E. & E. Arias Gonzalez. 1998. The relationshipbetween reef fish community structure and environmental vari-ables in the southern Mexican Caribbean. J. Fish Biol. 53(Suppl. A): 209–221.
Ohman, M.C. & A. Rajasuriya. 1998. Relationships betweenhabitat complexity and fish communities on coral and sand-stone reefs. Env. Biol. Fish. 55: 19–31.
Ornellas, A. & R. Coutinho. 1998. Spatial and temporal patternsof distribution and abundance of a tropical fish assemblage in aseasonal Sargassum bed, Cabo Frio Island, Brazil. J. Fish Biol.53 (Suppl. A): 198–208.
Porter, J.W. 1972. Patterns of species diversity in Caribbean reefcorals. Ecology 53: 745–748.
Randall, J.E. 1967. Food habits of reef fishes of the West Indies.Stud. Trop. Oceanogra. 5: 665–847.
Roberts, C.M. & R.F.G. Ormond. 1987. Habitat complexity andcoral reef fish diversity and abundance on Red Sea fringingreefs. Mar. Ecol. Prog. Ser. 41: 1–8.
Russ, G.R. & A.C. Alcala. 1998. Natural fishing experiments inmarine reserves 1983–1993: community and trophic responses.Coral Reefs 17: 383–398.
Sale, P.F. 1980. The ecology of fishes on coral reefs. Oceanogr.Mar. Biol. 18: 367–421.
Sale, P.F. 1991. Reef fish communities: open nonequilibrial sys-tems. pp. 564–598. In: P.F. Sale (ed.) The Ecology of Fisheson Coral Reefs, Academic Press, San Diego.
Sale, P.F. & W.A. Douglas. 1984. Temporal variability in the com-munity structure of fish on coral patch reefs and the relation ofcommunity structure to reef structure. Ecology 65: 409–422.
Steneck, R.S. 1988. Herbivory on coral reefs: a synthesis. Proc.6th Int. Coral Reef Symp. 1: 37–49.
Ter Braak, C.J.F. & P.F.M. Verdonschot. 1995. Canonical corre-spondence analysis and related multivariate methods in aquaticecology. Aquatic Sciences 57: 255–289.
Underwood, A.J. 1997. Experiments in ecology: their logicaldesign and interpretation using analysis of variance. CambridgeUniversity Press, Cambridge. 504 pp.
Valentin, J.L. 1984. Analyse des parametres hydrobiologiquesdans la remontee de Cabo Frio (Bresil). Mar. Biol. 82: 259–276.
Wellington, G.M. & B.C. Victor. 1985. El Nino mass coral mor-tality: a test of resource limitation in a coral reef damselfishpopulation. Oecologia 68: 15–19.
Williams, D.McB. 1982. Patterns in the distribution of fish com-munities across the central Great Barrier Reef. Coral Reefs 1:35–43.
Zar, J.H. 1996. Biostatistical analysis. Prentice Hall, UpperSaddle River. 662 pp.