community district 2 brooklyn neighborhood report
DESCRIPTION
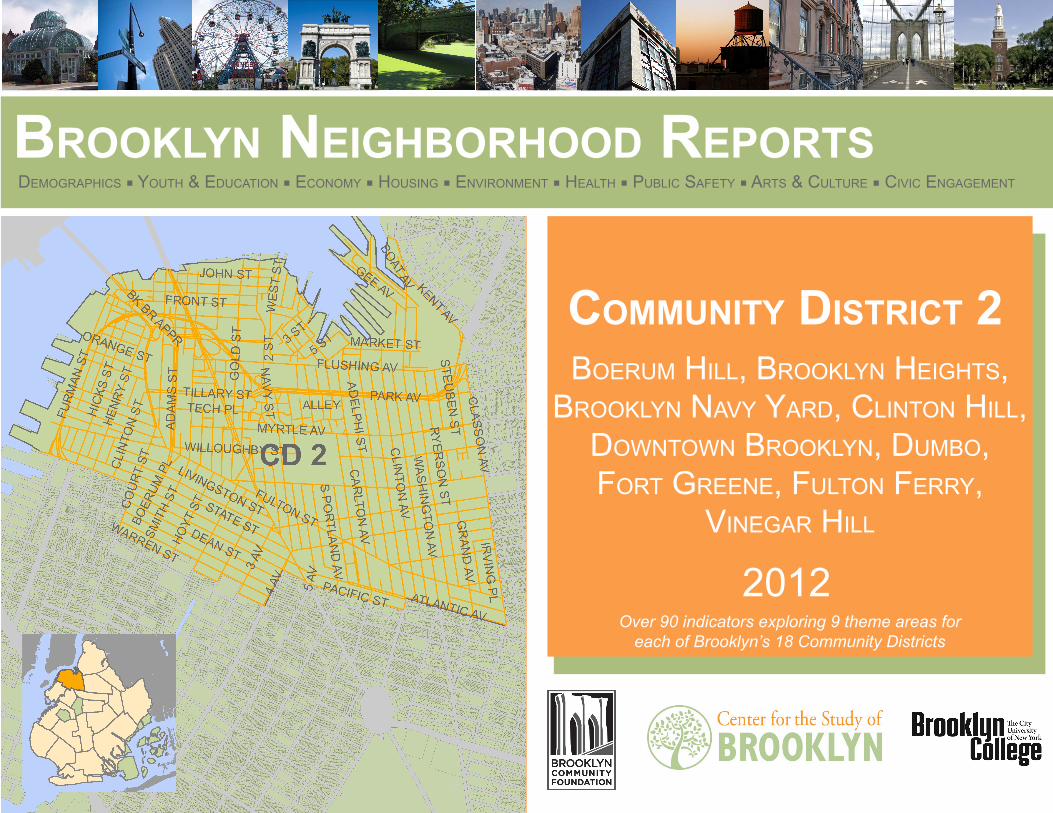
Over 90 indicators exploring 9 theme areas (Demographics, Youth & Education, Economy, Housing, Environment, Health, Public Safety, Arts & Culture and Civic Engagement) for Brooklyn’s Community District 2TRANSCRIPT
Brooklyn neighBorhood reports
Boerum Hill, Brooklyn HeigHts,
Brooklyn navy yard, Clinton Hill, downtown Brooklyn, dumBo, Fort greene, Fulton Ferry,
vinegar Hill
demograpHiCs ■ youtH & eduCation ■ eConomy ■ Housing ■ environment ■ HealtH ■ puBliC saFety ■ arts & Culture ■ CiviC engagement
Over 90 indicators exploring 9 theme areas for each of Brooklyn’s 18 Community Districts
2012
Community distriCt 2
Brooklyn neighBorhood reports 2012demograpHiCs ■ youtH & eduCation ■ eConomy ■ Housing ■ environment ■ HealtH ■ puBliC saFety ■ arts & Culture ■ CiviC engagement demograpHiCs ■ youtH & eduCation ■ eConomy ■ Housing ■ environment ■ HealtH ■ puBliC saFety ■ arts & Culture ■ CiviC engagement
Center For tHe
study oF Brooklyn
direCtorgretCHen maneval
senior researCH assoCiatelorna mason
edward morloCkresearCH assoCiate
researCH assoCiateCHristina pisano
advisory Boardwillard arCHie Brooklyn College alumnus
staFF
Joan Bartolomeo Brooklyn eConomiC development Corporation
adam Friedman pratt Center For Community development
marilyn gelBer Brooklyn Community Foundation
kimBerly george
greater Brooklyn HealtH Coalition
Carl Hum Brooklyn CHamBer oF CommerCe CHristoBal JaCques Brooklyn distriCt puBliC HealtH oFFiCe, nyC dept. oF HealtH and mental Hygiene
stuart p. leFFler
Con edison Jerrold mirotznik Brooklyn College moHammad razvi CounCil oF peoples organization
Cover pHoto sourCes
From tHe direCtorgretCHen maneval, Center For tHe study oF Brooklyn
From tHe Brooklyn Community Foundation
Brooklyn is a vibrant and diverse borough, with over 2,550,000 people calling it home. The 4th largest city in the United States if it were not part of New York City, Brooklyn’s population is greater than Boston, Indianapolis and San Francisco combined. Brooklynites come from more than 130 countries, speak nearly 90 languages, and represent over 180 ethnicities. Brooklyn’s 18 Community Districts include over 70 neighborhoods, and still more communities within those neighborhoods.
It’s imperative that such a densely populated and dynamic city has ready access to timely, accurate and neighborhood-level data. Brooklyn-based community groups and institutions, local government and businesses, and researchers and media deserve to be equipped with such data in order to make the most informed public policy, programming and funding decisions possible. As the only research center devoted exclusively to the study of public affairs in the borough, the Center for the Study of Brooklyn at Brooklyn College provides access to and produces critically relevant data and research about Brooklyn, and facilitates strategic planning initiatives and community needs assessments, for and with our community partners.
Each of the Center’s 19 new Brooklyn Neighborhood Reports- one for each of the borough’s 18 Community Districts, and one for all of Brooklyn- include over 90 indicators that explore 9 different theme areas. The data are presented in clear and concise visuals and text. Accompanying Data Tables provide even greater detail, as do the Data Notes. More in-depth analysis of each of the 9 theme areas will also be included in the Center’s forthcoming Brooklyn Trends Report, to be released in 2012.
As we can see from the Brooklyn Neighborhood Reports, in recent years, much of the borough has been booming. Many indicators for Brooklyn as a whole show that we’re doing relatively well compared with ten and twenty years ago. However, in order to have the most accurate understanding of Brooklyn’s trends and needs, it’s essential that we look beyond the borough-wide numbers and consider what the data at the Community District level reveal. At this smaller scale, differences among indicators for various Community Districts emerge, such as those for educational attainment, employment and income, and housing affordability. Environmental, health and public safety conditions vary as well. Opportunities to participate in arts and culture, and to engage civically, also differ between neighborhoods. In other words, disparities among Brooklyn’s many communities exist, and there is change to be made.
As the Center for the Study of Brooklyn launches our new Brooklyn Neighborhood Reports, we put them into your hands to continue the incredible work you are already doing here in Brooklyn- making positive change in your neighborhoods by engaging your elected officials, improving the services you and your families receive, and increasing resources for your communities. We are here to help in any way we can- please be in touch if you have questions, comments or would like more data to advance your important work. It’s high time that Brooklyn’s collective voice is heard, and it’s our hope that the Brooklyn Neighborhood Reports will provide this voice with clarity and power!
Information is power. Information empowers. As the community foundation for Brooklyn, in addition to funding the best programs and ideas serving our borough, we are seeding projects that generate essential information to educate our 2.5 million residents about key issues and challenges in Brooklyn’s neighborhoods. The Center for the Study of Brooklyn is our information and research partner in this pursuit, gathering critical data, examining it closely, and sharing it with our residents, our businesses, our non-profit leaders, and our public sector officials to use as a tool for informed decision-making.
The Brooklyn Neighborhood Reports create a profile of the civic health of the borough and its 18 Community Districts; it is an incredibly valuable new resource for Brooklynites to measure quality of life in the place they call home. As we analyze the indicators of civic health in Brooklyn, we can begin to identify trends, both encouraging and alarming, that are shaping our borough’s growth and development. This will not only inform the Foundation’s grantmaking, but empower our donors and our residents to take on local challenges and create positive change from the ground up. We encourage you to utilize these Reports to their fullest, to help you to Do Good Right Here.
marilyn gelBer, president
in tHis report
Brooklyn neighBorhood reports 2012demograpHiCs ■ youtH & eduCation ■ eConomy ■ Housing ■ environment ■ HealtH ■ puBliC saFety ■ arts & Culture ■ CiviC engagement
willard arCHie Brooklyn College alumnus
Joan Bartolomeo Brooklyn eConomiC development Corporation
adam Friedman pratt Center For Community development
marilyn gelBer Brooklyn Community Foundation
Carl Hum Brooklyn CHamBer oF CommerCe
Jerrold mirotznik Brooklyn College moHammad razvi CounCil oF peoples organization
demograpHiCs ......................................................................1 youtH & eduCation...............................................................3 eConomy.............................................................................. 4 Housing...............................................................................5 environment.................................................................7 HealtH...........................................................................9 puBliC saFety ....................................................................11arts & Culture..................................................................12CiviC engagement...............................................................13notes and data...................................................................14
Board oF direCtors and staFF
Brooklyn Community Foundation
ellen salpeter and staFF
Heart oF Brooklyn
eriC Cadora
JustiCe mapping Center
pHilip noyes
Brooklyn distriCt puBliC HealtH oFFiCe, nyC dept. oF HealtH and mental Hygiene
Carl Hum
Brooklyn CHamBer oF CommerCe
ingrid gould ellen
Furman Center For real estate & urBan poliCy
Jarrett murpHy and staFF
City limits
speCial tHanks
melissa lee
Coalition For tHe improvement oF BedFord-stuyvesant
ella weiss and staFF
Brooklyn arts CounCil
william tramontano
Brooklyn College
marty markowitz and staFF
oFFiCe oF tHe Brooklyn BorougH president
karen gould
Brooklyn College
Cover pHoto sourCesBrooklyn College
Joe Beone, FliCkr
marC Fader, City limits
Jay woodwortH, FliCkr
Brooklyn College
Brooklyn College
marC Fader, City limits
Brooklyn College
CamBaadam lerner, FliCkr
essie lasH, Heart oF Brooklyn
About Brooklyn's Neighborhoods: The Center for the Study of Brooklyn acknowledges that the number of Brooklyn neighborhoods, their names and boundaries vary from source to source. We've used the NYC Department of City Planning's New York: A City of Neighborhoods Citywide Index Map from 2011 as the source
for the neighborhoods listed on the covers of our Brooklyn Neighborhood Reports.
demographiCs
Source: Bex Walton, Flickr
Population
Age
9.1%
15.8%
63.3%
11.8%
7.1%
10.6%
72.7%
9.5%
0-5
6-17
18-64
65 and Older
CD 2Brooklyn
Brooklyn neighBorhood reports 2012
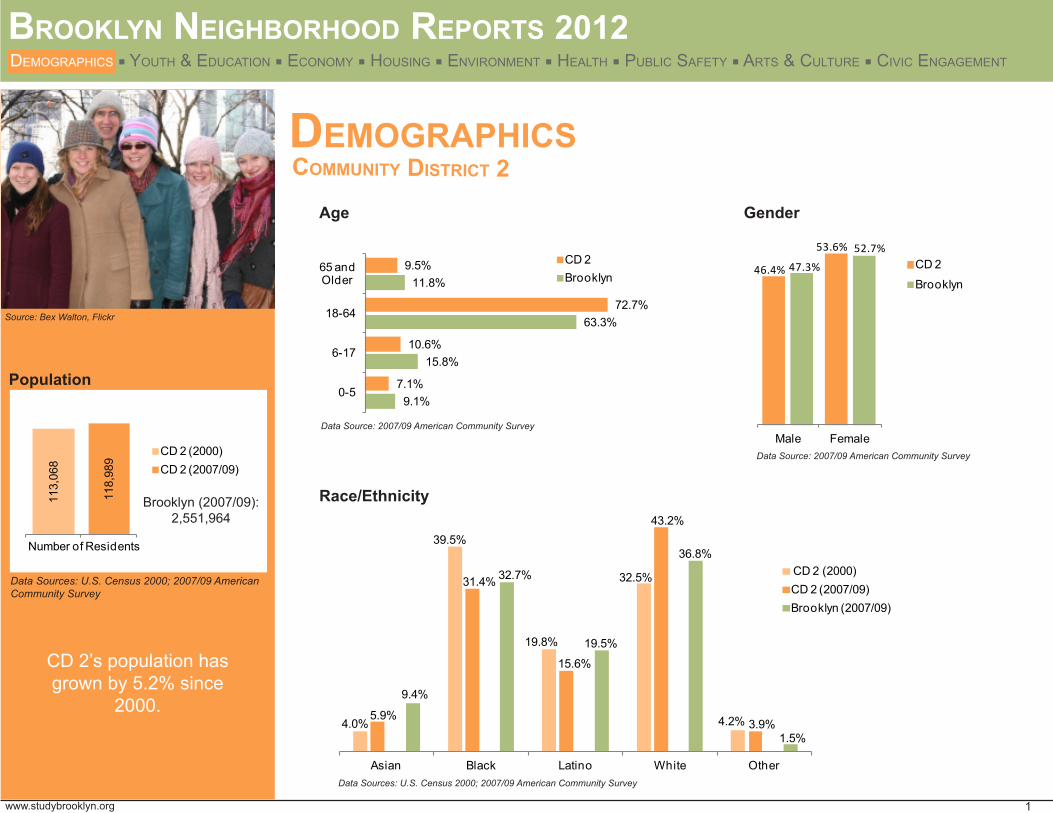
CD 2’s population has grown by 5.2% since
2000. 4.0%
39.5%
19.8%
32.5%
4.2%5.9%
31.4%
15.6%
43.2%
3.9%
9.4%
32.7%
19.5%
36.8%
1.5%
Asian Black Latino White Other
CD 2 (2000)CD 2 (2007/09)Brooklyn (2007/09)
Community distriCt 2
www.studybrooklyn.org
113,
068
118,
989
Number of Residents
CD 2 (2000)CD 2 (2007/09)
Brooklyn (2007/09): 2,551,964
Race/Ethnicity
Gender
Data Sources: U.S. Census 2000; 2007/09 AmericanCommunity Survey
Data Source: 2007/09 American Community Survey
Data Source: 2007/09 American Community Survey
Data Sources: U.S. Census 2000; 2007/09 American Community Survey
demograpHiCs ■ youtH & eduCation ■ eConomy ■ Housing ■ environment ■ HealtH ■ puBliC saFety ■ arts & Culture ■ CiviC engagement demograpHiCs ■ youtH & eduCation ■ eConomy ■ Housing ■ environment ■ HealtH ■ puBliC saFety ■ arts & Culture ■ CiviC engagement
1
46.4%
53.6%
47.3%
52.7%
Male Female
CD 2
Brooklyn
46.4%
53.6%
47.3%
52.7%
Male Female
CD 2
Brooklyn
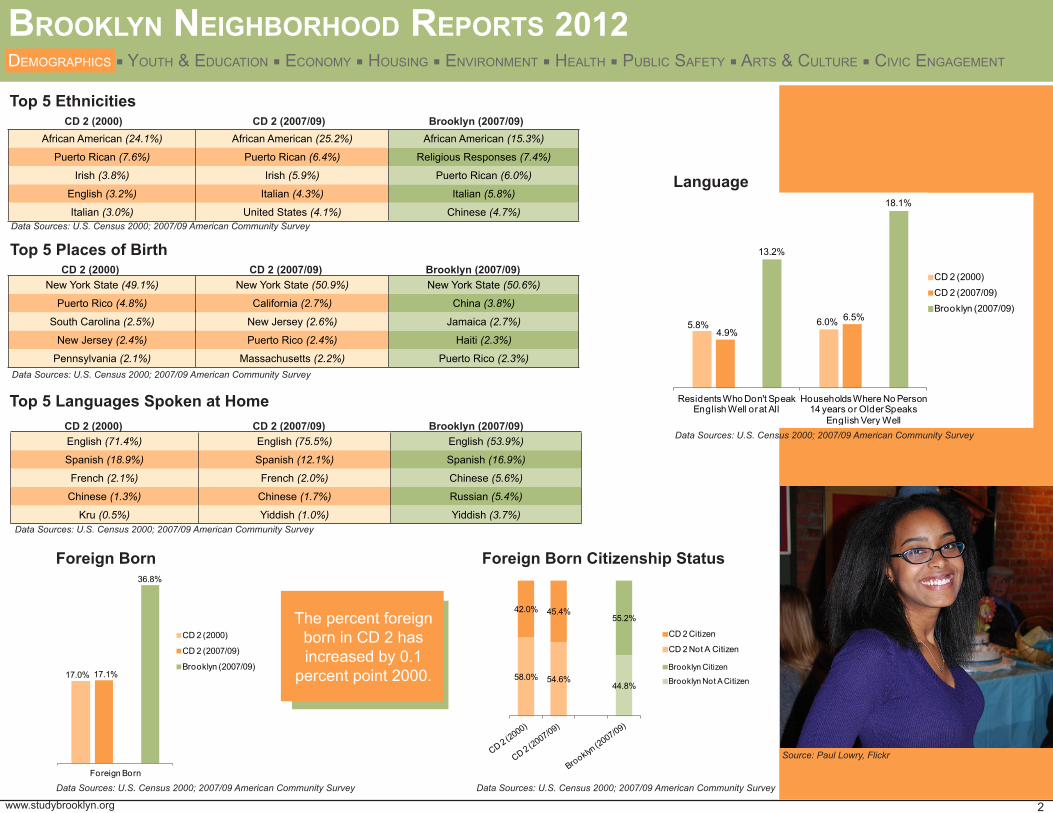
Top 5 Ethnicities
Top 5 Places of Birth
Top 5 Languages Spoken at Home
Foreign Born Citizenship StatusForeign Born
CD 2 (2000) CD 2 (2007/09) Brooklyn (2007/09)
CD 2 (2000) CD 2 (2007/09) Brooklyn (2007/09)
CD 2 (2000) CD 2 (2007/09) Brooklyn (2007/09)
58.0% 54.6%44.8%
42.0% 45.4%55.2%
CD 2 Citizen
CD 2 Not A Citizen
The percent foreign
born in CD 2 hasincreased by 0.1
percent point 2000.
Language
2www.studybrooklyn.org
Brooklyn neighBorhood reports 2012
Data Sources: U.S. Census 2000; 2007/09 American Community Survey
Data Sources: U.S. Census 2000; 2007/09 American Community Survey
Data Sources: U.S. Census 2000; 2007/09 American Community Survey
Data Sources: U.S. Census 2000; 2007/09 American Community Survey Data Sources: U.S. Census 2000; 2007/09 American Community Survey
Data Sources: U.S. Census 2000; 2007/09 American Community Survey
demograpHiCs ■ youtH & eduCation ■ eConomy ■ Housing ■ environment ■ HealtH ■ puBliC saFety ■ arts & Culture ■ CiviC engagement
5.8% 6.0%4.9%
6.5%
13.2%
18.1%
Residents Who Don't Speak English Well or at All
Households Where No Person 14 years or Older Speaks
English Very Well
CD 2 (2000)CD 2 (2007/09)Brooklyn (2007/09)
Source: Paul Lowry, Flickr
17.0% 17.1%
36.8%
Foreign Born
CD 2 (2000)
CD 2 (2007/09)
Brooklyn (2007/09)
African American (24.1%) African American (25.2%) African American (15.3%)
Puerto Rican (7.6%) Puerto Rican (6.4%) Religious Responses (7.4%)
Irish (3.8%) Irish (5.9%) Puerto Rican (6.0%)
English (3.2%) Italian (4.3%) Italian (5.8%)
Italian (3.0%) United States (4.1%) Chinese (4.7%)
New York State (49.1%) New York State (50.9%) New York State (50.6%)
Puerto Rico (4.8%) California (2.7%) China (3.8%)
South Carolina (2.5%) New Jersey (2.6%) Jamaica (2.7%)
New Jersey (2.4%) Puerto Rico (2.4%) Haiti (2.3%)
Pennsylvania (2.1%) Massachusetts (2.2%) Puerto Rico (2.3%)
English (71.4%) English (75.5%) English (53.9%)
Spanish (18.9%) Spanish (12.1%) Spanish (16.9%)
French (2.1%) French (2.0%) Chinese (5.6%)
Chinese (1.3%) Chinese (1.7%) Russian (5.4%)
Kru (0.5%) Yiddish (1.0%) Yiddish (3.7%)
0%
10%
20%
30%
40%
50%
60%
70%
80%
90%
100%
CD 14 (2000)
Brooklyn Citizen
Brooklyn Not A Citizen
youth & eduCation
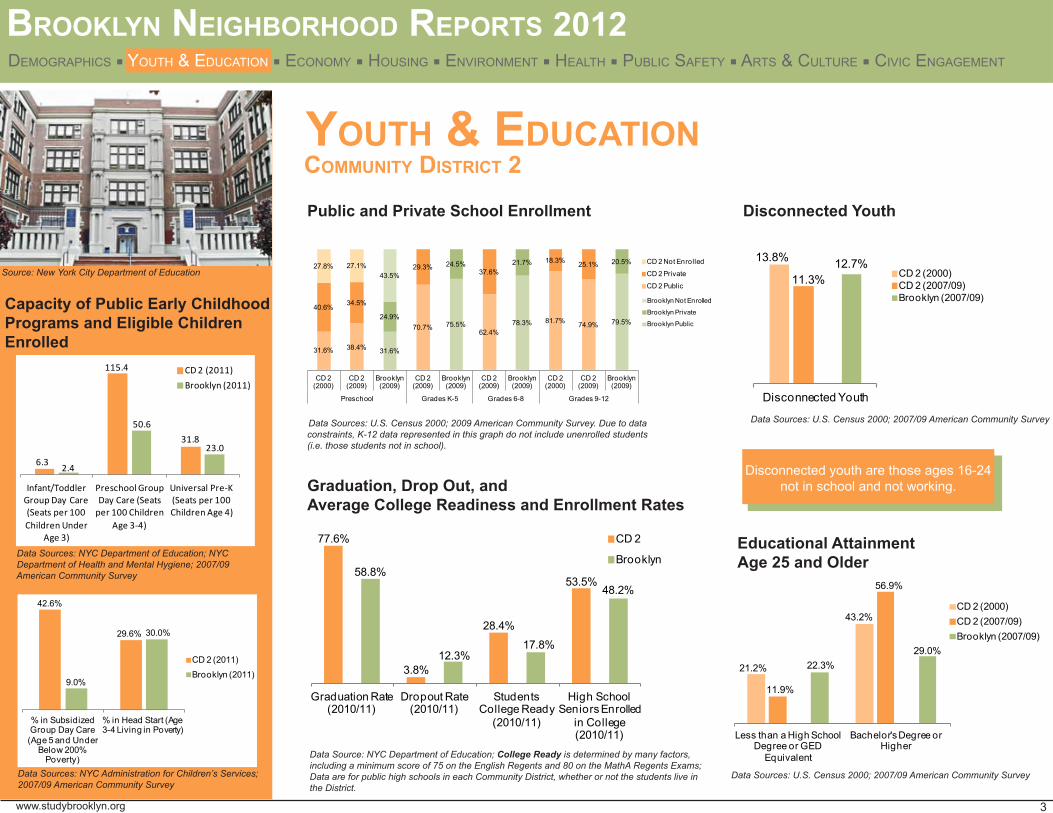
Public and Private School Enrollment Disconnected Youth
Capacity of Public Early Childhood Programs and Eligible Children Enrolled
3
Community distriCt 2
Brooklyn neighBorhood reports 2012
31.6% 38.4% 31.6%
70.7% 75.5%62.4%
78.3% 81.7% 74.9% 79.5%
40.6% 34.5%
24.9%
29.3% 24.5%37.6%
21.7% 18.3% 25.1% 20.5%27.8% 27.1%43.5%
CD 2 (2000)
CD 2 (2009)
Brooklyn (2009)
CD 2 (2009)
Brooklyn (2009)
CD 2 (2009)
Brooklyn (2009)
CD 2 (2000)
CD 2 (2009)
Brooklyn (2009)
Preschool Grades K-5 Grades 6-8 Grades 9-12
CD 2 Not Enrolled
CD 2 Private
CD 2 Public
Educational Attainment Age 25 and Older
21.2%
43.2%
11.9%
56.9%
22.3%29.0%
Less than a High School Degree or GED
Equivalent
Bachelor's Degree or Higher
CD 2 (2000)CD 2 (2007/09)Brooklyn (2007/09)
Disconnected youth are those ages 16-24 not in school and not working.
www.studybrooklyn.org
77.6%
3.8%
28.4%
53.5%58.8%
12.3%17.8%
48.2%
Graduation Rate (2010/11)
Dropout Rate (2010/11)
Students College Ready
(2010/11)
High School Seniors Enrolled
in College (2010/11)
CD 2
Brooklyn
Data Sources: U.S. Census 2000; 2007/09 American Community Survey
Data Sources: U.S. Census 2000; 2007/09 American Community Survey
demograpHiCs ■ youtH & eduCation ■ eConomy ■ Housing ■ environment ■ HealtH ■ puBliC saFety ■ arts & Culture ■ CiviC engagement
13.8%
11.3%12.7%
Disconnected Youth
CD 2 (2000)CD 2 (2007/09)Brooklyn (2007/09)
Data Sources: NYC Administration for Children’s Services; 2007/09 American Community Survey
Data Sources: U.S. Census 2000; 2007/09 American Community Survey
Data Sources: U.S. Census 2000; 2007/09 American Community Survey; Labor Force is the percent of residents 16+ who are employed or unemployed.
demograpHiCs ■ youtH & eduCation ■ eConomy ■ Housing ■ environment ■ HealtH ■ puBliC saFety ■ arts & Culture ■ CiviC engagement
Source: New York City Department of Education
0%10%20%30%40%50%60%70%80%90%
100%
CD
14
(200
0)
CD
14
(200
9)
Broo
klyn
(200
9)
CD
14
(200
9)
Broo
klyn
(200
9)
CD
14
(200
9)
Broo
klyn
(200
9)
CD
14
(200
0)
CD
14
(200
9)
Broo
klyn
(200
9)
Preschool Grades K-5 Grades 6-8 Grades 9-12
Brooklyn Not Enrolled
Brooklyn Private
Brooklyn Public
31.6% 38.4% 31.6%
70.7% 75.5%62.4%
78.3% 81.7% 74.9% 79.5%
40.6% 34.5%
24.9%
29.3% 24.5%37.6%
21.7% 18.3% 25.1% 20.5%27.8% 27.1%43.5%
CD 2 (2000)
CD 2 (2009)
Brooklyn (2009)
CD 2 (2009)
Brooklyn (2009)
CD 2 (2009)
Brooklyn (2009)
CD 2 (2000)
CD 2 (2009)
Brooklyn (2009)
Preschool Grades K-5 Grades 6-8 Grades 9-12
CD 2 Not Enrolled
CD 2 Private
CD 2 Public 13.8%
11.3%12.7%
Disconnected Youth
CD 2 (2000)CD 2 (2007/09)Brooklyn (2007/09)
Data Source: NYC Department of Education; College Ready is determined by many factors, including a minimum score of 75 on the English Regents and 80 on the MathA Regents Exams; Data are for public high schools in each Community District, whether or not the students live in the District.
Graduation, Drop Out, and Average College Readiness and Enrollment Rates
Data Sources: U.S. Census 2000; 2009 American Community Survey. Due to data constraints, K-12 data represented in this graph do not include unenrolled students (i.e. those students not in school).
6.3
115.4
31.8
2.4
50.6
23.0
Infant/Toddler Group Day Care (Seats per 100 Children Under
Age 3)
Preschool Group Day Care (Seats
per 100 Children Age 3-4)
Universal Pre-K (Seats per 100 Children Age 4)
CD 2 (2011)
Brooklyn (2011)
42.6%
29.6%
9.0%
30.0%
% in Subsidized Group Day Care (Age 5 and Under
Below 200% Poverty)
% in Head Start (Age 3-4 Living in Poverty)
CD 2 (2011)
Brooklyn (2011)
Data Sources: NYC Department of Education; NYC Department of Health and Mental Hygiene; 2007/09 American Community Survey
Data Sources: U.S. Census 2000; 2007/09 American Community Survey
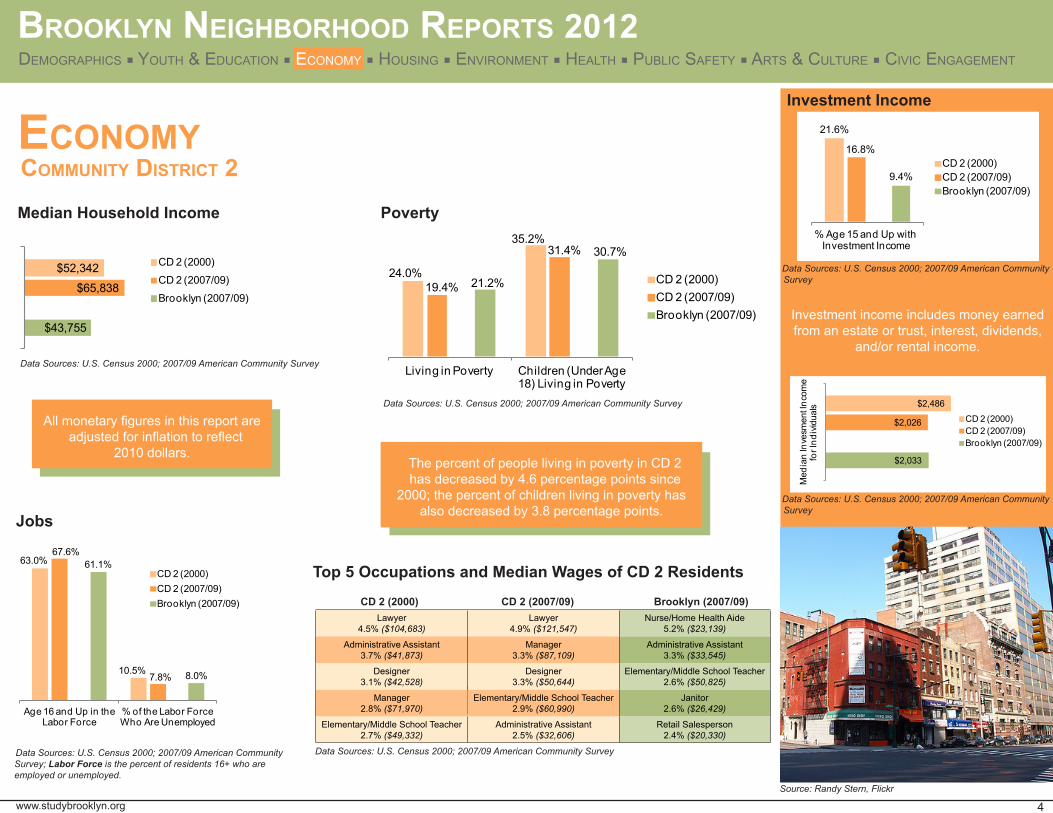
eConomy
$43,755
$65,838
$52,342 CD 2 (2000)
CD 2 (2007/09)
Brooklyn (2007/09)
CD 2 (2000) CD 2 (2007/09) Brooklyn (2007/09)
Median Household Income
Investment Income
Top 5 Occupations and Median Wages of CD 2 Residents
4
Community distriCt 2
Brooklyn neighBorhood reports 2012
All monetary figures in this report are adjusted for inflation to reflect
2010 dollars. The percent of people living in poverty in CD 2 has decreased by 4.6 percentage points since
2000; the percent of children living in poverty has also decreased by 3.8 percentage points.
www.studybrooklyn.org
24.0%
35.2%
19.4%
31.4%
21.2%
30.7%
Living in Poverty Children (Under Age 18) Living in Poverty
CD 2 (2000)CD 2 (2007/09)Brooklyn (2007/09)
21.6%
16.8%
9.4%
% Age 15 and Up with Investment Income
CD 2 (2000)CD 2 (2007/09)Brooklyn (2007/09)
$2,033
$2,026
$2,486
Med
ian
Inve
smen
t Inc
ome
for I
ndiv
idua
ls
CD 2 (2000)CD 2 (2007/09)Brooklyn (2007/09)
Data Sources: U.S. Census 2000; 2007/09 American Community Survey
Data Sources: U.S. Census 2000; 2007/09 American Community Survey
Data Sources: U.S. Census 2000; 2007/09 American Community Survey; Labor Force is the percent of residents 16+ who are employed or unemployed.
Data Sources: U.S. Census 2000; 2007/09 American Community Survey
Data Sources: U.S. Census 2000; 2007/09 American Community Survey
Poverty
demograpHiCs ■ youtH & eduCation ■ eConomy ■ Housing ■ environment ■ HealtH ■ puBliC saFety ■ arts & Culture ■ CiviC engagement
Data Sources: U.S. Census 2000; 2007/09 American Community Survey
Investment income includes money earned from an estate or trust, interest, dividends,
and/or rental income.
63.0%
10.5%
67.6%
7.8%
61.1%
8.0%
Age 16 and Up in the Labor Force
% of the Labor Force Who Are Unemployed
CD 2 (2000)CD 2 (2007/09)Brooklyn (2007/09)
Source: Randy Stern, Flickr
Jobs
$43,755
$65,838
$52,342 CD 2 (2000)
CD 2 (2007/09)
Brooklyn (2007/09)
Lawyer 4.5% ($104,683)
Lawyer 4.9% ($121,547)
Nurse/Home Health Aide 5.2% ($23,139)
Administrative Assistant 3.7% ($41,873)
Manager 3.3% ($87,109)
Administrative Assistant 3.3% ($33,545)
Designer 3.1% ($42,528)
Designer 3.3% ($50,644)
Elementary/Middle School Teacher 2.6% ($50,825)
Manager 2.8% ($71,970)
Elementary/Middle School Teacher 2.9% ($60,990)
Janitor 2.6% ($26,429)
Elementary/Middle School Teacher 2.7% ($49,332)
Administrative Assistant 2.5% ($32,606)
Retail Salesperson 2.4% ($20,330)
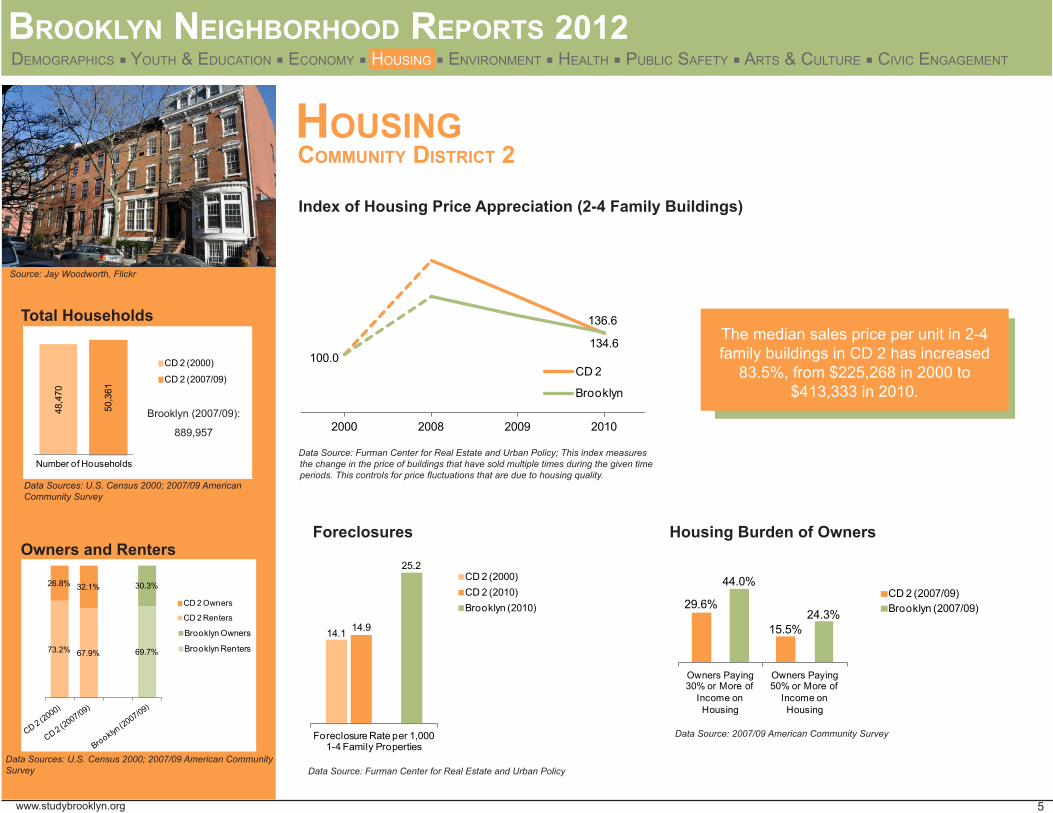
shousing
Total Households
Source: Jay Woodworth, Flickr
Housing Burden of Owners
Index of Housing Price Appreciation (2-4 Family Buildings)
Owners and Renters
The median sales price per unit in 2-4family buildings in CD 2 has increased
83.5%, from $225,268 in 2000 to $413,333 in 2010.
5
Community distriCt 2
Brooklyn neighBorhood reports 2012
14.1 14.9
25.2
Foreclosure Rate per 1,000 1-4 Family Properties
CD 2 (2000)CD 2 (2010)Brooklyn (2010)
www.studybrooklyn.org
Foreclosures
Data Sources: U.S. Census 2000; 2007/09 American Community Survey Data Source: Furman Center for Real Estate and Urban Policy
Data Source: 2007/09 American Community Survey
demograpHiCs ■ youtH & eduCation ■ eConomy ■ Housing ■ environment ■ HealtH ■ puBliC saFety ■ arts & Culture ■ CiviC engagement
Data Source: Furman Center for Real Estate and Urban Policy; This index measures the change in the price of buildings that have sold multiple times during the given time periods. This controls for price fluctuations that are due to housing quality.
Data Sources: U.S. Census 2000; 2007/09 American Community Survey
Data Source: 2007/09 American Community Survey
demograpHiCs ■ youtH & eduCation ■ eConomy ■ Housing ■ environment ■ HealtH ■ puBliC saFety ■ arts & Culture ■ CiviC engagement48
,470
50,3
61
Number of Households
CD 2 (2000)
CD 2 (2007/09)
Brooklyn (2007/09):
889,957
29.6%
15.5%
44.0%
24.3%
Owners Paying 30% or More of
Income on Housing
Owners Paying 50% or More of
Income on Housing
CD 2 (2007/09)Brooklyn (2007/09)
73.2% 67.9% 69.7%
26.8% 32.1% 30.3%
CD 2 Owners
CD 2 Renters
0%10%20%30%40%50%60%70%80%90%
100%
CD 14 (2000)
Brooklyn Owners
Brooklyn Renters
100.0 134.6
136.6
2000 2008 2009 2010
CD 2
Brooklyn
14.1 14.9
25.2
Foreclosure Rate per 1,000 1-4 Family Properties
CD 2 (2000)CD 2 (2010)Brooklyn (2010)
29.6%
15.5%
44.0%
24.3%
Owners Paying 30% or More of
Income on Housing
Owners Paying 50% or More of
Income on Housing
CD 2 (2007/09)Brooklyn (2007/09)
Data Sources: U.S. Census 2000; 2007/09 American Community Survey
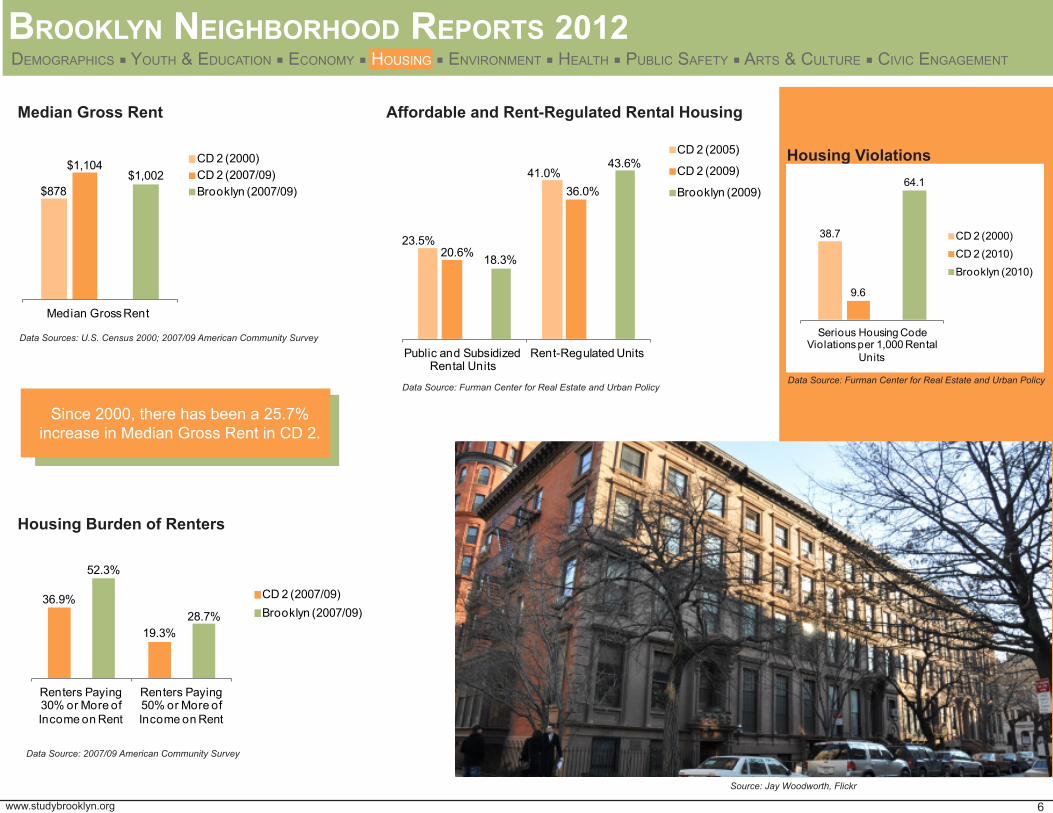
Median Gross Rent
36.9%
19.3%
52.3%
28.7%
Renters Paying 30% or More of Income on Rent
Renters Paying 50% or More of Income on Rent
CD 2 (2007/09)Brooklyn (2007/09)
Affordable and Rent-Regulated Rental Housing
Housing Violations
Since 2000, there has been a 25.7% increase in Median Gross Rent in CD 2.
Source: Jay Woodworth, Flickr
Housing Burden of Renters
$878
$1,104 $1,002
Median Gross Rent
CD 2 (2000)CD 2 (2007/09)Brooklyn (2007/09)
6
Brooklyn neighBorhood reports 2012
www.studybrooklyn.org
Data Sources: U.S. Census 2000; 2007/09 American Community Survey
Data Source: Furman Center for Real Estate and Urban Policy Data Source: Furman Center for Real Estate and Urban Policy
Data Source: 2007/09 American Community Survey
demograpHiCs ■ youtH & eduCation ■ eConomy ■ Housing ■ environment ■ HealtH ■ puBliC saFety ■ arts & Culture ■ CiviC engagement
23.5%
41.0%
20.6%
36.0%
18.3%
43.6%
Public and Subsidized Rental Units
Rent-Regulated Units
CD 2 (2005)
CD 2 (2009)
Brooklyn (2009)
38.7
9.6
64.1
Serious Housing Code Violations per 1,000 Rental
Units
CD 2 (2000)CD 2 (2010)Brooklyn (2010)
36.9%
19.3%
52.3%
28.7%
Renters Paying 30% or More of Income on Rent
Renters Paying 50% or More of Income on Rent
CD 2 (2007/09)Brooklyn (2007/09)
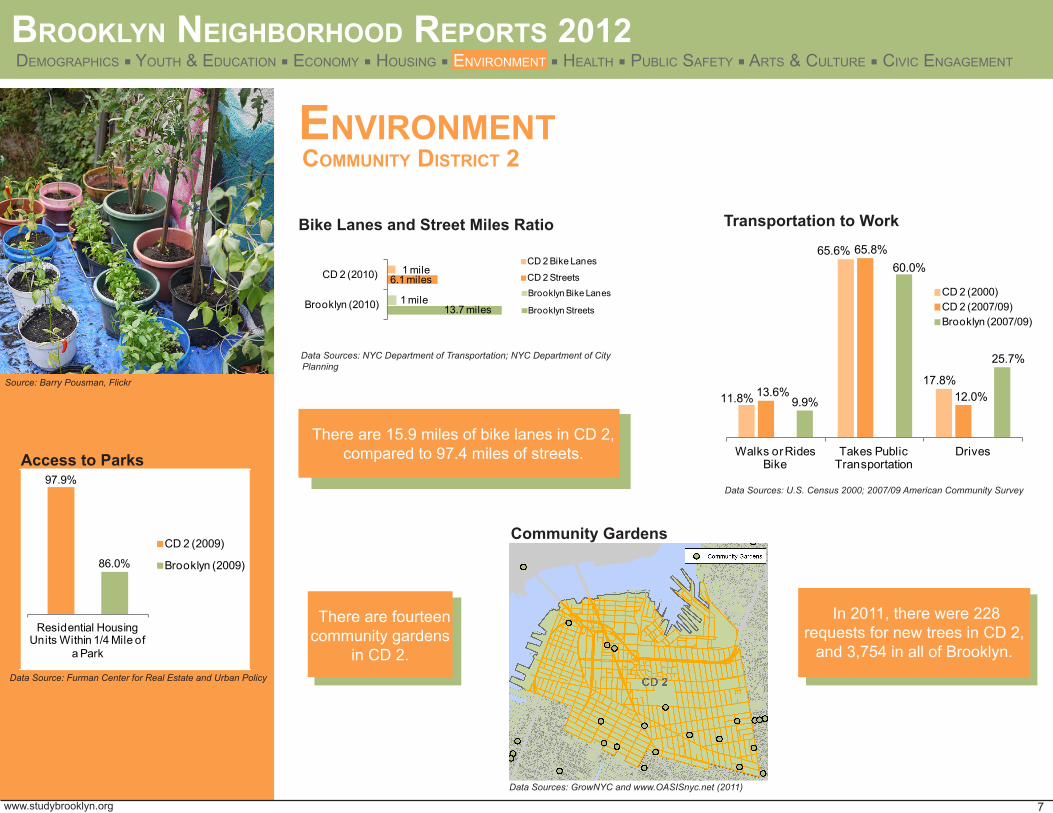
environment
Source: Barry Pousman, Flickr
Access to Parks
Bike Lanes and Street Miles Ratio
There are 15.9 miles of bike lanes in CD 2, compared to 97.4 miles of streets.
Community Gardens
7
Community distriCt 2
Brooklyn neighBorhood reports 2012
13.7 miles
6.1 miles
1 mile
1 mile
Brooklyn (2010)
CD 2 (2010)
CD 2 Bike Lanes
CD 2 Streets
11.8%
65.6%
17.8%13.6%
65.8%
12.0%9.9%
60.0%
25.7%
Walks or Rides Bike
Takes Public Transportation
Drives
CD 2 (2000)CD 2 (2007/09)Brooklyn (2007/09)
There are fourteencommunity gardens
in CD 2.
Transportation to Work
www.studybrooklyn.org
Data Source: Furman Center for Real Estate and Urban Policy
Data Sources: U.S. Census 2000; 2007/09 American Community Survey
Data Sources: GrowNYC and www.OASISnyc.net (2011)
demograpHiCs ■ youtH & eduCation ■ eConomy ■ Housing ■ environment ■ HealtH ■ puBliC saFety ■ arts & Culture ■ CiviC engagement
In 2011, there were 228 requests for new trees in CD 2,
and 3,754 in all of Brooklyn.
demograpHiCs ■ youtH & eduCation ■ eConomy ■ Housing ■ environment ■ HealtH ■ puBliC saFety ■ arts & Culture ■ CiviC engagement
97.9%
86.0%
Residential Housing Units Within 1/4 Mile of
a Park
CD 2 (2009)
Brooklyn (2009)
0 20
Brooklyn (2010)
Brooklyn Bike Lanes
Brooklyn Streets13.7 miles
6.1 miles
1 mile
1 mile
Brooklyn (2010)
CD 2 (2010)
CD 2 Bike Lanes
CD 2 Streets
11.8%
65.6%
17.8%13.6%
65.8%
12.0%9.9%
60.0%
25.7%
Walks or Rides Bike
Takes Public Transportation
Drives
CD 2 (2000)CD 2 (2007/09)Brooklyn (2007/09)
Data Source: NYC Department of Sanitation, via My Neighborhood Statistics
Data Sources: NYC Department of Transportation; NYC Department of City Planning
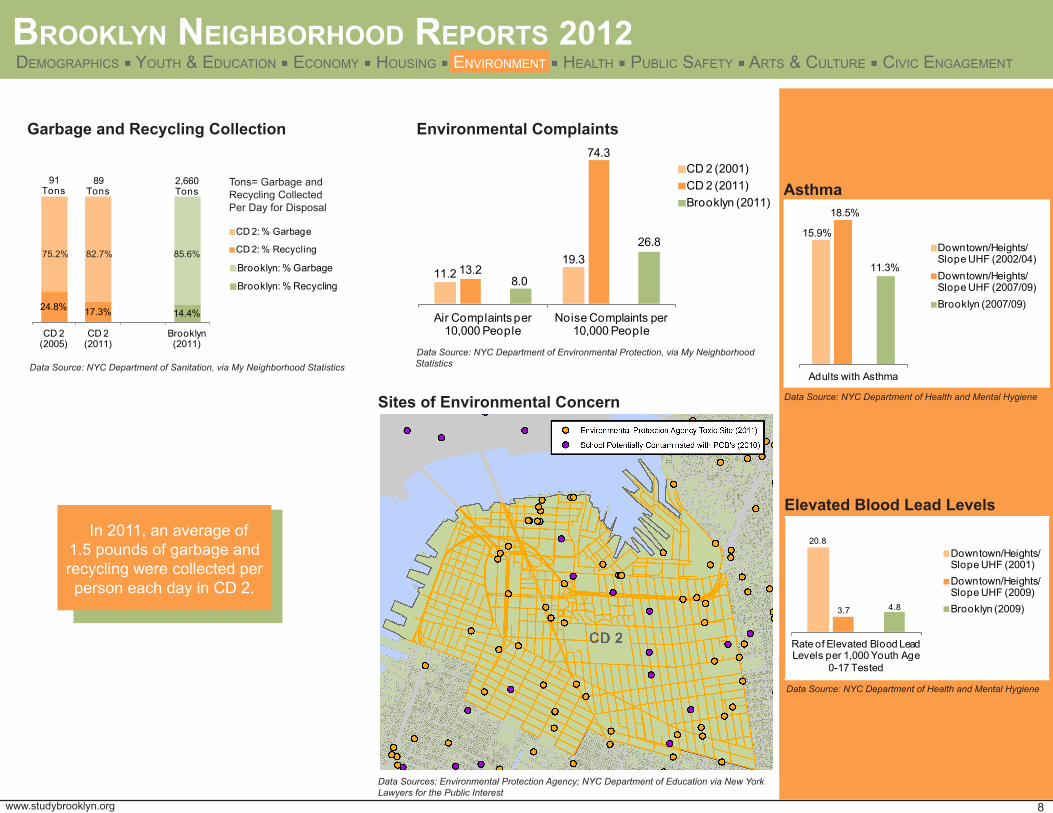
Asthma
In 2011, an average of 1.5 pounds of garbage and recycling were collected per person each day in CD 2.
Elevated Blood Lead Levels
8
24.8% 17.3% 14.4%
91Tons
89Tons
2,660 Tons
CD 2 (2005)
CD 2 (2011)
Brooklyn (2011)
CD 2: % Garbage
CD 2: % Recycling75.2% 82.7% 85.6%
Sites of Environmental Concern
www.studybrooklyn.org
Garbage and Recycling Collection
Brooklyn neighBorhood reports 2012
11.219.3
13.2
74.3
8.0
26.8
Air Complaints per 10,000 People
Noise Complaints per 10,000 People
CD 2 (2001)CD 2 (2011)Brooklyn (2011)
15.9%
18.5%
11.3%
Adults with Asthma
Downtown/Heights/ Slope UHF (2002/04)Downtown/Heights/ Slope UHF (2007/09)Brooklyn (2007/09)
Data Source: NYC Department of Environmental Protection, via My Neighborhood Statistics
Data Source: NYC Department of Health and Mental Hygiene
Data Sources: Environmental Protection Agency; NYC Department of Education via New York Lawyers for the Public Interest
Data Source: NYC Department of Health and Mental Hygiene
Environmental Complaints
demograpHiCs ■ youtH & eduCation ■ eConomy ■ Housing ■ environment ■ HealtH ■ puBliC saFety ■ arts & Culture ■ CiviC engagement
0%
20%
40%
60%
80%
100%
CD 14 (2005)
Brooklyn: % Garbage
Brooklyn: % Recycling
Tons= Garbage and Recycling Collected Per Day for Disposal
20.8
3.7 4.8
Rate of Elevated Blood Lead Levels per 1,000 Youth Age
0-17 Tested
Downtown/Heights/ Slope UHF (2001)Downtown/Heights/ Slope UHF (2009)Brooklyn (2009)
Data Source: NYC Department of Sanitation, via My Neighborhood Statistics
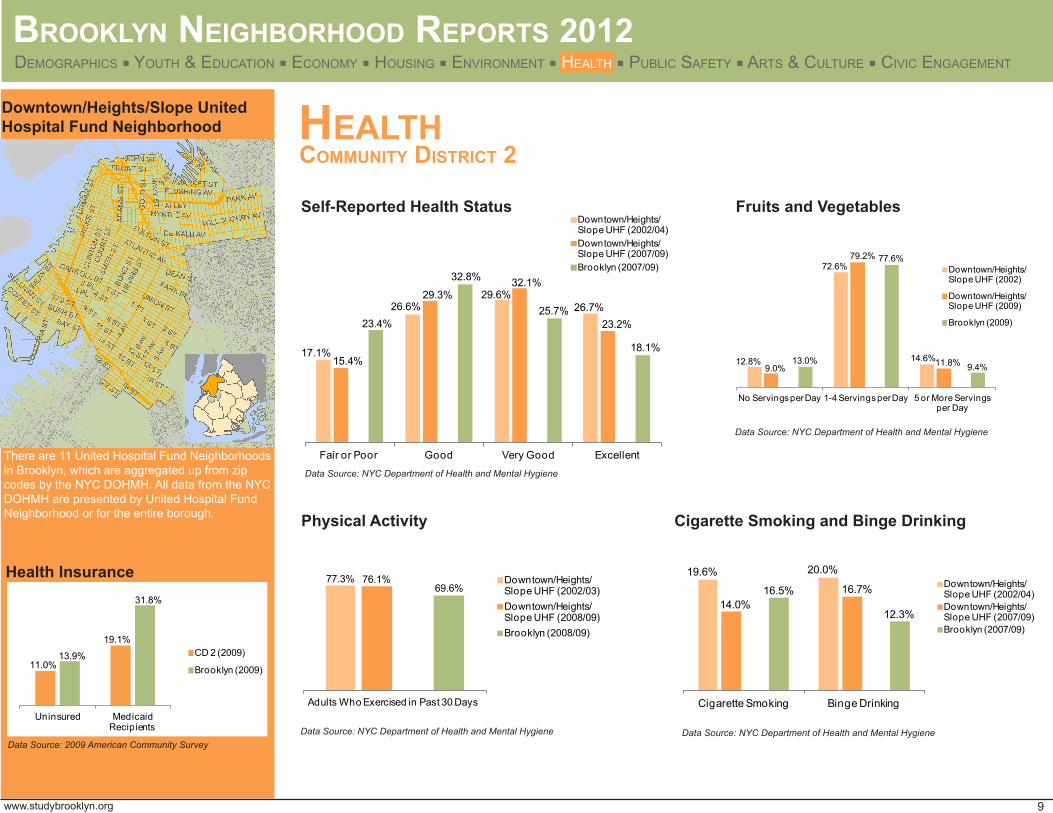
health
19.6% 20.0%
14.0%16.7%16.5%
12.3%
Cigarette Smoking Binge Drinking
Downtown/Heights/Slope UHF (2002/04)
Cigarette Smoking and Binge Drinking
Health Insurance
Downtown/Heights/Slope UnitedHospital Fund Neighborhood
9
Community distriCt 2
Self-Reported Health Status
Brooklyn neighBorhood reports 2012
17.1%
26.6%29.6%
26.7%
15.4%
29.3%32.1%
23.2%23.4%
32.8%
25.7%
18.1%
Fair or Poor Good Very Good Excellent
Downtown/Heights/Slope UHF (2002/04)Downtown/Heights/Slope UHF (2007/09)Brooklyn (2007/09)
11.0%
19.1%
13.9%
31.8%
Uninsured Medicaid Recipients
CD 2 (2009)
Brooklyn (2009)
12.8%
72.6%
14.6%9.0%
79.2%
11.8%13.0%
77.6%
9.4%
No Servings per Day 1-4 Servings per Day 5 or More Servings per Day
Downtown/Heights/ Slope UHF (2002)
Downtown/Heights/ Slope UHF (2009)
Brooklyn (2009)
Fruits and Vegetables
www.studybrooklyn.org
Data Source: NYC Department of Health and Mental Hygiene
Data Source: NYC Department of Health and Mental Hygiene
Data Source: 2009 American Community Survey Data Source: NYC Department of Health and Mental Hygiene
77.3% 76.1%69.6%
Adults Who Exercised in Past 30 Days
Downtown/Heights/ Slope UHF (2002/03)Downtown/Heights/ Slope UHF (2008/09)Brooklyn (2008/09)
Physical Activity
Data Source: NYC Department of Health and Mental Hygiene
demograpHiCs ■ youtH & eduCation ■ eConomy ■ Housing ■ environment ■ HealtH ■ puBliC saFety ■ arts & Culture ■ CiviC engagement
Data Source: NYC Department of Health and Mental Hygiene
Data Source: 2009 American Community Survey
demograpHiCs ■ youtH & eduCation ■ eConomy ■ Housing ■ environment ■ HealtH ■ puBliC saFety ■ arts & Culture ■ CiviC engagement
17.1%
26.6%29.6%
26.7%
15.4%
29.3%32.1%
23.2%23.4%
32.8%
25.7%
18.1%
Fair or Poor Good Very Good Excellent
Downtown/Heights/ Slope UHF (2002/04)Downtown/Heights/ Slope UHF (2007/09)Brooklyn (2007/09)
19.6% 20.0%
14.0%16.7%16.5%
12.3%
Cigarette Smoking Binge Drinking
Downtown/Heights/ Slope UHF (2002/04)Downtown/Heights/ Slope UHF (2007/09)Brooklyn (2007/09)
There are 11 United Hospital Fund Neighborhoods in Brooklyn, which are aggregated up from zip codes by the NYC DOHMH. All data from the NYC DOHMH are presented by United Hospital FundNeighborhood or for the entire borough.
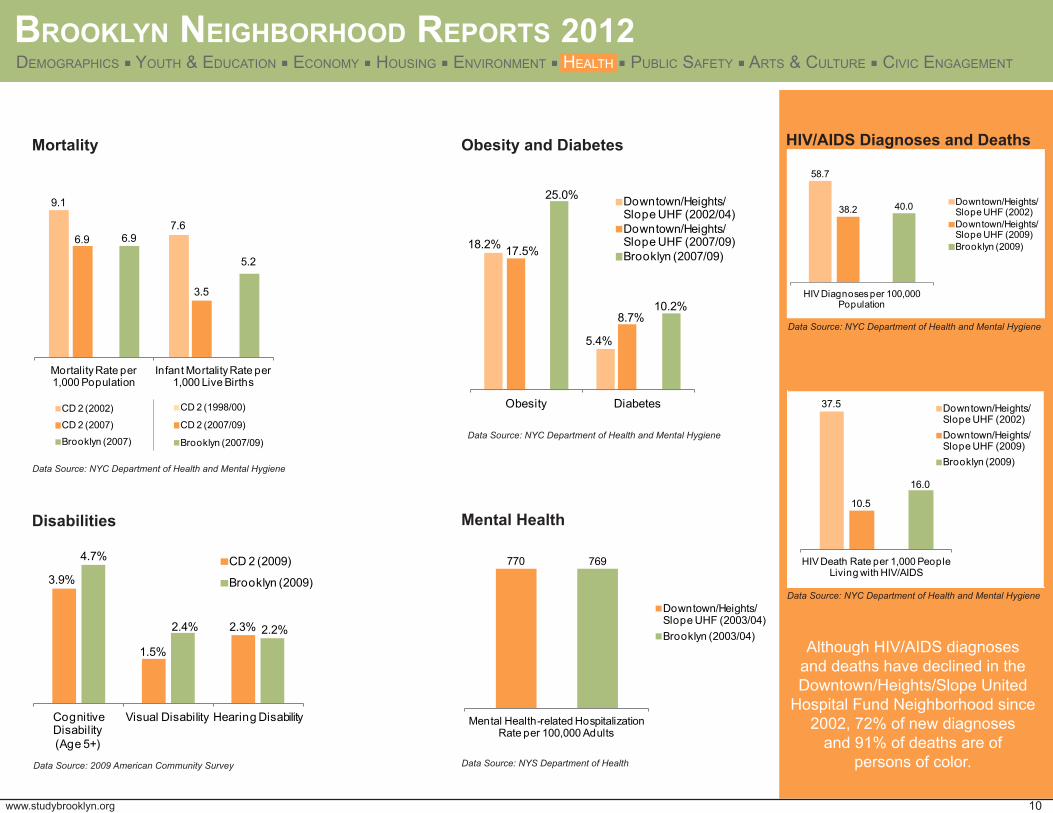
HIV/AIDS Diagnoses and DeathsMortality
18.2%
5.4%
17.5%
8.7%
25.0%
10.2%
Obesity Diabetes
Downtown/Heights/ Slope UHF (2002/04)Downtown/Heights/ Slope UHF (2007/09)Brooklyn (2007/09)
Obesity and Diabetes
3.9%
1.5%
2.3%
4.7%
2.4% 2.2%
Cognitive Disability (Age 5+)
Visual Disability Hearing Disability
CD 2 (2009)
Brooklyn (2009)
Disabilities
Although HIV/AIDS diagnoses
and deaths have declined in the Downtown/Heights/Slope United
Hospital Fund Neighborhood since 2002, 72% of new diagnoses
and 91% of deaths are of persons of color.
10www.studybrooklyn.org
Brooklyn neighBorhood reports 2012
Data Source: NYC Department of Health and Mental Hygiene
Data Source: NYC Department of Health and Mental Hygiene
Data Source: NYC Department of Health and Mental Hygiene
Data Source: NYC Department of Health and Mental Hygiene
Data Source: 2009 American Community Survey Data Source: NYS Department of Health
demograpHiCs ■ youtH & eduCation ■ eConomy ■ Housing ■ environment ■ HealtH ■ puBliC saFety ■ arts & Culture ■ CiviC engagement
770 769
Mental Health-related Hospitalization Rate per 100,000 Adults
Downtown/Heights/ Slope UHF (2003/04)Brooklyn (2003/04)
Mental Health
58.7
38.2 40.0
HIV Diagnoses per 100,000 Population
Downtown/Heights/ Slope UHF (2002)Downtown/Heights/ Slope UHF (2009)Brooklyn (2009)
9.1
7.66.9
3.5
6.9
5.2
Mortality Rate per 1,000 Population
Infant Mortality Rate per 1,000 Live Births
CD 2 (2002)
CD 2 (2007)
Brooklyn (2007)
37.5
10.5
16.0
HIV Death Rate per 1,000 People Living with HIV/AIDS
Downtown/Heights/ Slope UHF (2002)Downtown/Heights/ Slope UHF (2009)Brooklyn (2009)
9.1
7.66.9
3.5
6.9
5.2
Mortality Rate per 1,000 Population
Infant Mortality Rate per 1,000 Live Births
CD 2 (2002)
CD 2 (2007)
Brooklyn (2007)
0
1
2
3
4
5
6
7
8
Mortality Rate per 1,000 Population
Infant Mortality Rate per 1,000 Live Births
CD 2 (1998/00)
CD 2 (2007/09)
Brooklyn (2007/09)
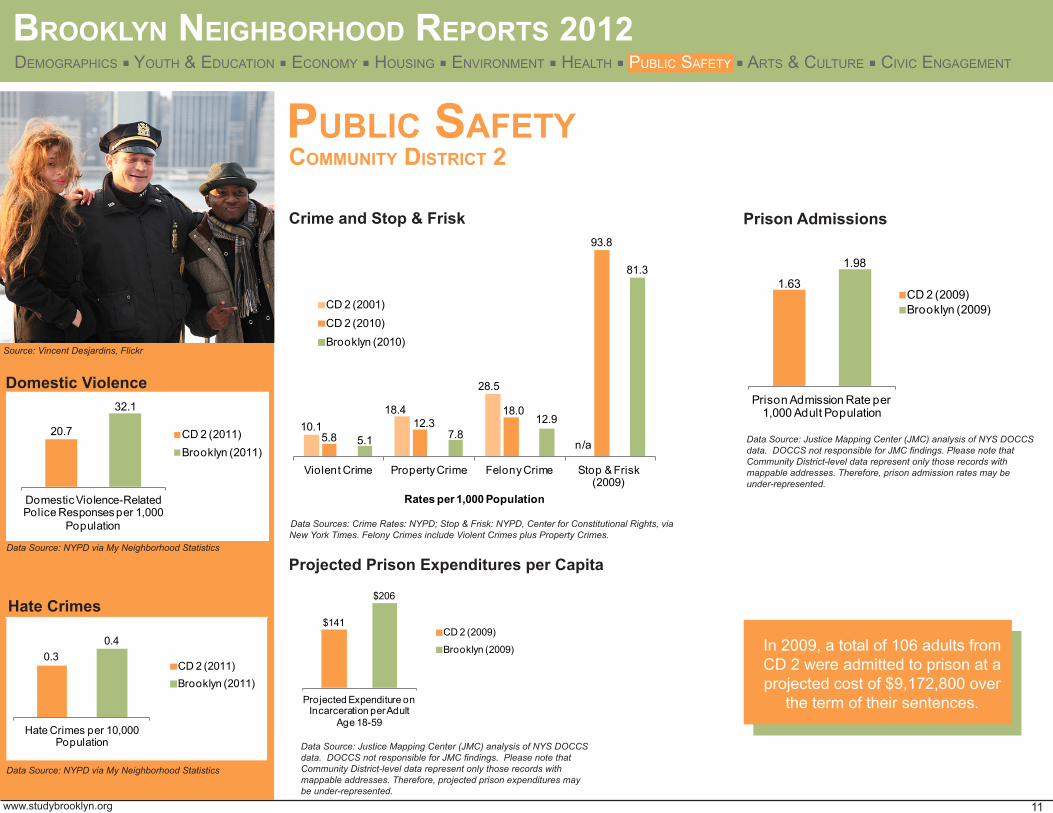
puBliC safety
10.118.4
28.5
n/a5.812.3
18.0
93.8
5.1 7.812.9
81.3
Violent Crime Property Crime Felony Crime Stop & Frisk (2009)
Rates per 1,000 Population
CD 2 (2001)
CD 2 (2010)
Brooklyn (2010)
Crime and Stop & Frisk Prison Admissions
In 2009, a total of 106 adults from CD 2 were admitted to prison at a projected cost of $9,172,800 over
the term of their sentences.
Projected Prison Expenditures per Capita
11
Community distriCt 2
Brooklyn neighBorhood reports 2012
Domestic Violence
20.7
32.1
Domestic Violence-Related Police Responses per 1,000
Population
CD 2 (2011)Brooklyn (2011)
Hate Crimes
www.studybrooklyn.org
Data Source: NYPD via My Neighborhood Statistics
Data Source: NYPD via My Neighborhood Statistics
demograpHiCs ■ youtH & eduCation ■ eConomy ■ Housing ■ environment ■ HealtH ■ puBliC saFety ■ arts & Culture ■ CiviC engagement
Community distriCt 2
Data Sources: U.S. Census 2000; 2007/09 American Community Survey
demograpHiCs ■ youtH & eduCation ■ eConomy ■ Housing ■ environment ■ HealtH ■ puBliC saFety ■ arts & Culture ■ CiviC engagement
Source: Vincent Desjardins, Flickr
0.30.4
Hate Crimes per 10,000 Population
CD 2 (2011)Brooklyn (2011)
1.63
1.98
Prison Admission Rate per 1,000 Adult Population
CD 2 (2009)Brooklyn (2009)
$141
$206
Projected Expenditure on Incarceration per Adult
Age 18-59
CD 2 (2009)
Brooklyn (2009)
Data Sources: Crime Rates: NYPD; Stop & Frisk: NYPD, Center for Constitutional Rights, via New York Times. Felony Crimes include Violent Crimes plus Property Crimes.
Data Source: Justice Mapping Center (JMC) analysis of NYS DOCCS data. DOCCS not responsible for JMC findings. Please note that Community District-level data represent only those records with mappable addresses. Therefore, projected prison expenditures may be under-represented.
Data Source: Justice Mapping Center (JMC) analysis of NYS DOCCS data. DOCCS not responsible for JMC findings. Please note that Community District-level data represent only those records with mappable addresses. Therefore, prison admission rates may be under-represented.
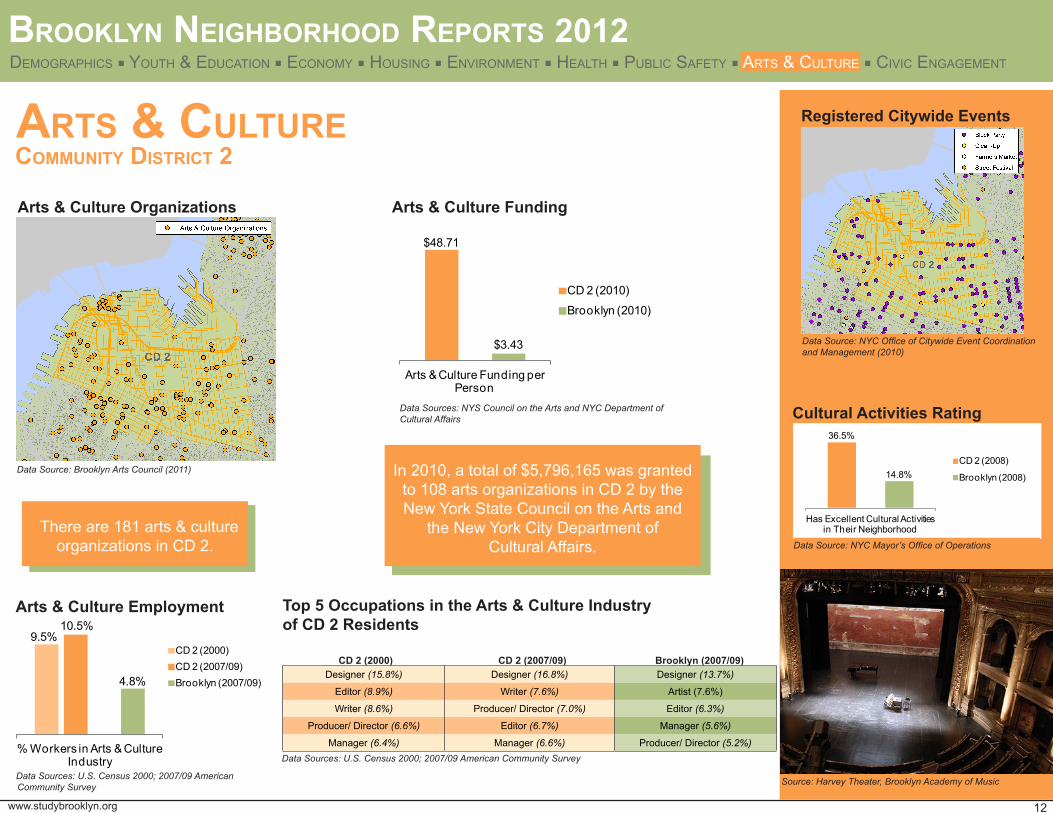
arts & Culture
In 2010, a total of $5,796,165 was granted to 108 arts organizations in CD 2 by the New York State Council on the Arts and
the New York City Department of Cultural Affairs.
Cultural Activities Rating
Registered Citywide Events
Arts & Culture Funding
Arts & Culture Employment
12
Community distriCt 2
Brooklyn neighBorhood reports 2012
36.5%
14.8%
Has Excellent Cultural Activities in Their Neighborhood
CD 2 (2008)
Brooklyn (2008)
9.5%10.5%
4.8%
% Workers in Arts & Culture Industry
CD 2 (2000)CD 2 (2007/09)Brooklyn (2007/09)
www.studybrooklyn.org
Data Source: NYC Mayor’s Office of Operations
Data Source: NYC Office of Citywide Event Coordination and Management (2010)
Data Sources: U.S. Census 2000; 2007/09 American Community Survey
demograpHiCs ■ youtH & eduCation ■ eConomy ■ Housing ■ environment ■ HealtH ■ puBliC saFety ■ arts & Culture ■ CiviC engagement
Top 5 Occupations in the Arts & Culture Industryof CD 2 Residents
CD 2 (2000) CD 2 (2007/09) Brooklyn (2007/09)
Data Sources: U.S. Census 2000; 2007/09 American Community Survey
Arts & Culture Organizations
Data Source: Brooklyn Arts Council (2011)
Source: Harvey Theater, Brooklyn Academy of Music
There are 181 arts & culture organizations in CD 2.
$48.71
$3.43
Arts & Culture Funding per Person
CD 2 (2010)
Brooklyn (2010)
Data Sources: NYS Council on the Arts and NYC Department of Cultural Affairs
Designer (15.8%) Designer (16.8%) Designer (13.7%)
Editor (8.9%) Writer (7.6%) Artist (7.6%)
Writer (8.6%) Producer/ Director (7.0%) Editor (6.3%)
Producer/ Director (6.6%) Editor (6.7%) Manager (5.6%)
Manager (6.4%) Manager (6.6%) Producer/ Director (5.2%)
9.5%10.5%
4.8%
% Workers in Arts & Culture Industry
CD 2 (2000)CD 2 (2007/09)Brooklyn (2007/09)
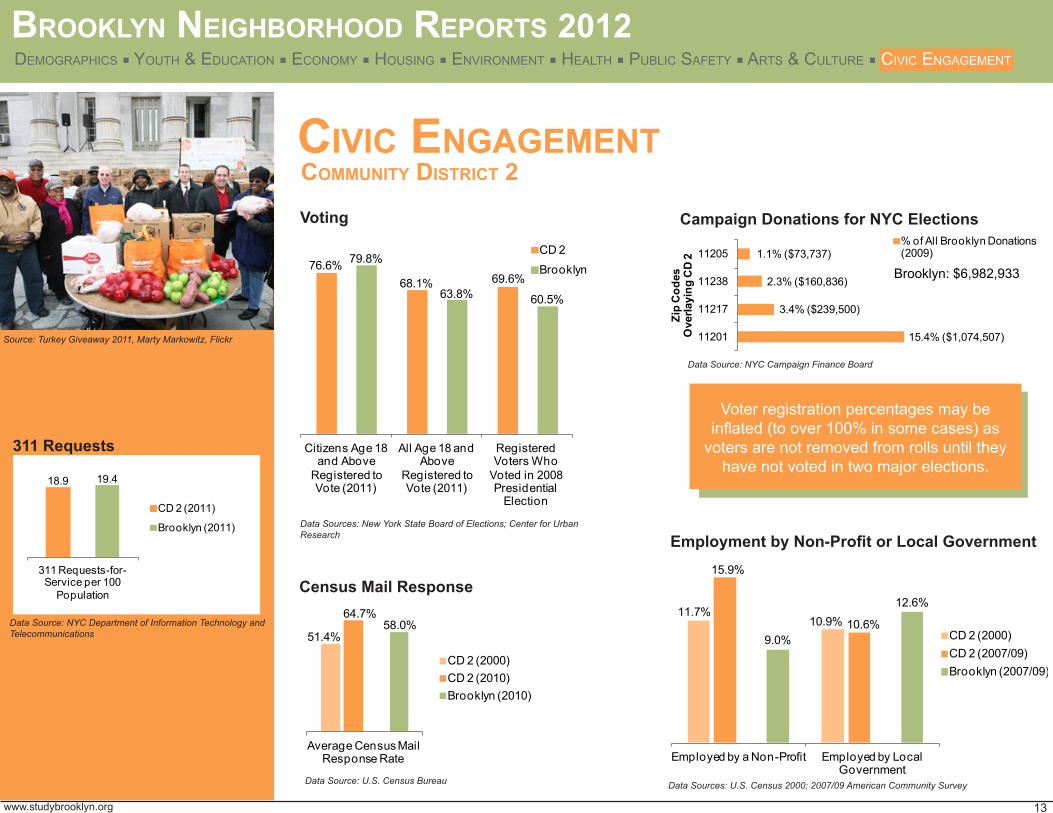
CiviC engagement
Voting
51.4%
64.7%58.0%
Average Census Mail Response Rate
CD 2 (2000)CD 2 (2010)Brooklyn (2010)
Census Mail Response
311 Requests
13
Community distriCt 2
Brooklyn neighBorhood reports 2012
15.4% ($1,074,507)
3.4% ($239,500)
2.3% ($160,836)
1.1% ($73,737)
11201
11217
11238
11205
Zip
Cod
es
Ove
rlayi
ng C
D 2
% of All Brooklyn Donations (2009)
11.7%10.9%
15.9%
10.6%9.0%
12.6%
Employed by a Non-Profit Employed by Local Government
CD 2 (2000)CD 2 (2007/09)Brooklyn (2007/09)
www.studybrooklyn.org
Employment by Non-Profit or Local Government
Data Source: NYC Campaign Finance Board
Data Source: U.S. Census Bureau Data Sources: U.S. Census 2000; 2007/09 American Community Survey
Brooklyn: $6,982,933
Data Source: NYC Department of Information Technology and Telecommunications
demograpHiCs ■ youtH & eduCation ■ eConomy ■ Housing ■ environment ■ HealtH ■ puBliC saFety ■ arts & Culture ■ CiviC engagement
Campaign Donations for NYC Elections
76.6%68.1% 69.6%
79.8%
63.8% 60.5%
Citizens Age 18 and Above
Registered to Vote (2011)
All Age 18 and Above
Registered to Vote (2011)
Registered Voters Who
Voted in 2008 Presidential
Election
CD 2Brooklyn
18.9 19.4
311 Requests-for-Service per 100
Population
CD 2 (2011)
Brooklyn (2011)
Source: Turkey Giveaway 2011, Marty Markowitz, Flickr
demograpHiCs ■ youtH & eduCation ■ eConomy ■ Housing ■ environment ■ HealtH ■ puBliC saFety ■ arts & Culture ■ CiviC engagement
Voter registration percentages may be inflated (to over 100% in some cases) as
voters are not removed from rolls until they have not voted in two major elections.
Data Sources: New York State Board of Elections; Center for Urban Research
notes
Brooklyn neighBorhood reports 2012demograpHiCs ■ youtH & eduCation ■ eConomy ■ Housing ■ environment ■ HealtH ■ puBliC saFety ■ arts & Culture ■ CiviC engagement
14www.studybrooklyn.org
data sourCes
data taBles
Abbreviated data sources are listed under each graph or map in the Brooklyn Neighborhood Reports. Complete data source citations areincluded in the endnotes of the Data Tables that accompany each of the 19 Reports, as well as in the Data Notes document. The Center for the Study of Brooklyn has used in these Reports the most recent data available from all data sources as of December 2011. In the case of U.S. Census Bureau data (the source most often used in these Reports), the 2007/09 American Community Survey 3-Year Estimates, Integrated Public Use Microdata are used instead of one year data as they allow for greater validity, particularly for neighborhood-level data. For each of the Reports for Brooklyn’s 18 Community Districts, the Center uses data going back as far as 2000 (if available) to illuminate trends. For the All Brooklyn Report, data as far back as 1990 are used (if available), and geographic comparisons with New York City, New York State and the Nation are also made (if data were available).
Data Tables that supplement each of the 19 Brooklyn Neighborhood Reports are available on the Center’s website (www.studybrooklyn.org). These Data Tables include exact counts, rates and/or percentages for each indicator in the Brooklyn Neighborhood Reports, as well as endnotes with detailed data source citations.
data notesA Data Notes document is available on the Center’s website (www.studybrooklyn.org) that includes comprehensive definitions of each indicator used in the Brooklyn Neighborhood Reports, the methodology for calculating that indicator (where applicable), and a ranking of the Brooklyn Community Districts with the highest and lowest counts, rates and/or percentages for the most recent year(s) for which those indicators were available. This document also includes detailed data source citations.
your ideas are welCome!This is the first time the Center for the Study of Brooklyn is producing the Brooklyn Neighborhood Reports, and we welcome your feedback on the content and design. We are grateful to everyone
who has helped make these Reports possible, and look forward to hearing your good ideas! Please also contact us immediately if you find any errors in the data, visuals, text, sources, etc.
so that we can make the relevant changes right away.
Released: March 12, 2012