communication strategies of adult cochlear implant candidates · communication strategies of adult...
TRANSCRIPT

J Am Acad Audiol 5 : 52-69 (1994)
Communication Strategies of Adult Cochlear Implant Candidates Jill L. Elfenbein* Charissa R. Lansingt Julia M. Davis t
Anne Kallaus-Gay*
Abstract
Adult cochlear implant candidates' abilities to cope with communication breakdown were assessed using the Communication Strategies Task (CST). Forty adult cochlear implant candidates with acquired hearing losses and 10 adults with normal hearing served as subjects . Appropriateness of responses to the CST were rated by 10 certified speech-language pathologists and audiologists . Seventy-six percent of the subjects demonstrated difficulty identifying onset or resolution of communication breakdown, communicators' feelings, factors contributing to communication breakdown, and appropriate repair strate-gies . The responses of individuals with sudden hearing losses did not differ significantly from the responses of individuals with progressive hearing losses . Response patterns did not correlate with the age of onset of the hearing loss, duration of deafness, age at the time of evaluation, or educational background . The results of this study suggest that ability to cope with communication breakdown must be evaluated on an individual basis.
Key Words : Adult, aural rehabilitation, cochlear implant, communication, deaf, deafened, hearing loss
s the use of cochlear implants increases, clinicians are finding increasing num-bers of adults with profound acquired
hearing losses in their caseloads. They are also finding that little is known about the rehabili-tation needs of deafened adults . The few studies that have focused on this subgroup of the popu-lation of individuals with hearing losses have dealt almost exclusively with mental health, speech production, or use of assistive devices. Data on most topics must be gleaned from either the personal accounts of deafened adults or studies of heterogeneous subject groups (i .e ., groups that contain both congenitally deaf and deafened adults or groups of adults who have acquired hearing losses of varying degrees) (Meadow-Orlans, 1985).
'Department of Speech Pathology and Audiology, Uni-versity of Iowa, Iowa City, Iowa ; t Department of Speech and Hearing Science, University of Illinois at Urbana-Champaign, Urbana, Illinois ; and t College of Liberal Arts, University of Minnesota, Minneapolis, Minnesota
Reprint requests : Jill L . Elfenbein, 125B Speech and Hearing Center, University of Iowa, Iowa City, IA 52242
Experienced clinicians report that adults with profound acquired hearing losses often demonstrate severe communication problems in both social and work settings . They also report that individuals differ in their abilities to cope with these communication problems (Reven and Hausman, 1985 ; Nerbonne et al, 1989). The limited data pool available supports this clinical wisdom . Deafened adults report loneliness, social isolation, and difficulty func-tioning in work environments that require com-munication with colleagues or customers (Thomas and Herbst,1980; Nordeng et al, 1985 ; Orlans, 1985 ; Knutson and Lansing, 1990). A few individuals report that they have taken on these problems as a challenge. Some state sim-ply that they cope as best they can while others report that they have withdrawn from many of the activities in which they find communication difficult (Cowie et al, 1987; Woolley, 1987).
Factors such as the nature of the onset of hearing loss (sudden versus progressive) or the length of time that an individual has been deaf may relate to individuals' responses to hearing loss. For example, it is possible that coping

Communication Strategies/Elfenbein et al
strategies develop as an individual's experience with hearing loss increases. If this is the case, then individuals who have been deaf for long periods of time or who have histories of progres-sive hearing losses could be expected to have better coping strategies than individuals who have been deaf for a short time or have experi-enced sudden losses . The data available are not sufficient to accept or reject such hypotheses .
The manner in which profound hearing loss contributes to the communication problems of deafened adults is clear. It is not known how an individual's experience with hearing loss or ability to cope with communication breakdown factors into the communication problems re-ported .
Purpose
The purpose of this study was to begin to describe the types of coping skills demonstrated by deafened adults who seek cochlear implants . The following specific questions were targeted :
1. Are implant candidates able to identify the onset and resolution of communication breakdown?
2. Are implant candidates able to identify factors that contribute to communication breakdown?
3. Are implant candidates able to identify the feelings of individuals who are experienc-ing communication breakdown?
4. Are implant candidates able to make ap-propriate suggestions for ways to respond to communication breakdown?
5 . Do factors such as nature of the onset of hearing loss (i .e ., sudden versus progres-sive), duration of deafness, age at onset of hearing loss, age at the time of evaluation, or level of education correlate with the behaviors described above?
6 . Does the behavior of implant candidates differ from that of adults with normal hear-ing?
METHOD
Subjects
Experimental Group (EG)
EG subjects were 40 adults, ages 22 to 71 years, referred to the University of Iowa coch-lear implant team . Table 1 provides a summary of the age, gender, hearing loss, and occupation
characteristics of the EG subjects . Table 2 pro-vides a comparison of the EG subjects' educa-tion to that of the general population .
All EG subjects had profound, bilateral, postlingually acquired sensorineural hearing losses . Etiologies included meningitis, Mondini malformation, ototoxic drugs, congenital lues, and head trauma . Twenty-eight percent of the hearing losses were ofunknown etiology. Ninety percent of the subjects reported no benefit in speech understanding from the use of hearing aids . None scored higher than 4 percent when NU-6 word lists were presented at 60 dB HL under aided conditions .
The distribution of education levels in the subject population was similar to that for the state of Iowa but did include more individuals with college degrees than would be expected from a random sample . All EG subjects had average or better full-scale IQ scores as meas-ured on the WAIS-R by a cochlear implant team psychologist . None demonstrated any signifi-cant psychopathology.
Seventy-five percent of the EG subjects reported having participated in an aural reha-bilitation program of some type . In most in-stances, the program content was described as lipreading training .
Twenty-seven of the EG subjects had histo-ries of progressive hearing loss . Thirteen had histories of sudden hearing loss .
Subjects who had progressive hearing losses (EG-P) ranged in age from 22 to 69 years (X = 50.41, SD = 14.95) . The duration of deafness ranged from 1 to 28 years (X =10.33, SD = 7 .26) .
Subjects who had sudden hearing losses (EG-S) ranged in age from 23 to 71 years (X = 50.85, SD = 14.99) . The duration of deafness ranged from 1 to 44 years (X = 19.38, SD = 15.91) .
Control Group (CG)
CG subjects were 10 adults from the Iowa City area who responded to a call for subjects in the local newspaper. All CG subjects had hear-ing within normal limits bilaterally (i .e ., pure-tone thresholds <_ 25 dB HL at octave intervals from 250-4000 Hz) (ANSI, 1989). Table 3 pro-vides a summary of the age, gender, hearing level, and occupations of these subjects . Table 2 provides a comparison of the CG subjects' edu-cation to that of the EG subjects .
The CG subjects ranged in age from 25 to 70 years (X = 50, SD =16.70) . This age distribution was similar to that for the EG subjects . Distri-

Journal of the American Academy of Audiology/Volume 5, Number 1, January 1994
Table 1 Age, Gender, Hearing Loss, and Occupation Characteristics of the Subject Population
Subject Gender Age Etiologyof Onset of Duration of Numberof Better Ear Occupation Hearing Loss" Hearing Loss Deafness t Years Unaided
(Age) (Years) HearingAid Thresholds Used (dB HL) at
.5 kHz 1 kHz 2 kHz
1 F 58 Unknown (P) 32 2 4 110 105 110 Office manager/ clerical workert
2 M 62 Unknown (P) 26 18 36 NR NR NR Government systems analyst t
3 M 68 Unknown (P) 26 4 41 NR NR NR Letter carriert
4 M 44 Multiple 25 6 0 NR NR NR Auto screw episodes of machine meningitis (P) operator
5 F 29 Mondini 4 19 20 105 100 105 Self- malformation (P) employed/
sales
6 F 31 Unknown (P) 21 8 0 NR NR NR Homemaker
7 F 68 Unknown (P) 14 3 20 110 100 100 Homemaker
8 M 65 Familial/noise 38 7 22 100 115 NR Farmer/ exposure (P) teachert
9 F 67 Unknown (P) 51 8 5 NR NR NR Secretaryt
10 F 50 Cochlear 26 7 21 NR NR NR Auditor & otosclerosis (P) commis-
sioner of elections
11 F 46 Ototoxic 44 2 5 NR NR NR Homemaker drugs (P)
12 M 42 Unknown (P) 5 28 37 100 115 115 Skilled laborer
13 M 69 Familial(P) 13 1 42 NR NR 110 Sales
14 F 29 Familial (P) 5 7 17 90 100 100 Child care
15 M 61 Familial(P) 16 22 43 NR NR NR Farmingt
16 M 39 Unknown (P) 6 5 32 110 115 120 Nursery/ landscaping
17 M 37 Familial (P) 22 5 4 90 100 110 Farming
18 F 50 Unknown (P) 3 14 43 NR NR NR Homemaker
19 F 63 Unknown (P) 43 20 0 105 105 NR Homemaker
20 M 24 Unknown (P) birth 14 20 110 110 120 Tax clerk
21 M 68 Meniere's 20 20 20 70 85 90 Milk deliveryt disease (P)

Communication Strategies/Elfenbein et al
Table 1 (Cont'd) Age, Gender, Hearing Loss, and Occupation Characteristics of the Subject Population
Subject Gender Age Etiologyof Onset of Duration of Numberof Better Ear Occupation HearingLoss` HearingLoss Deafnesst Years Unaided
(Age) (Years) HearingAid Thresholds Used (dB HL) at
.5 kHz 1 kHz 2 kHz
22 F 68 Measles (P) 15 10 44 110 110 105 Clerical/ bookkeep- ingt
23 M 55 Noise 24 4 22 100 NR NR Sales/ exposure (P) optician/
draftsman§
24 F 46 Unknown (P) 18 15 21 85 100 110 Research director/ advertising
25 F 50 Measles (P) 3 4 4 100 105 105 Homemaker
26 F 22 Unknown (P) 2 10 20 85 95 105 Laundry
27 M 50 Familial(P) 9 16 0 100 100 NR Accounting
28 F 41 Physicaltrauma 7 34 0 NR NR NR Homemaker (car accident) (S)
29 F 67 Meningitis (S) 61 6 0 NR NR NR Teachert
30 M 62 Meningitis(S) 27 35 0 NR NR NR Electrician
31 M 71 Physicaltrauma 70 1 1 NR NR NR Carpenter t (fall) (S)
32 F 62 Meningitis (S) 61" 1 0 NR NR NR Homemaker
33 M 65 Meningitis(S) 21 44 0 NR 105 110 Farmer
34 M 54 Noise exposure (S) 21 28 30 105 115 115 Computer analyst
35 M 30 Blow to head (S) 29 1 0 120 120 120 Machine operator
36 M 43 Meningitis(S) 13 30 8 100 105 100 Insurance
37 M 23 Familial (S) 7 15 0 110 NR NR Unskilled laborer
38 M 45 Unknown (S) 31 2 2 NR 110 NR Human services coordinator
39 M 40 Noise (S) 19 19 20 100 110 110 Armed services§
40 M 58 Meningitis(S) 23 35 0 120 NR NR Engineer
"P = progressive loss ; S = sudden loss . tTime period from onset of bilateral profound hearing loss to participation in this study, rounded to the nearest year . $ Not employed at the time of the study . §Physically disabled . "Stapedectomy AD at age 37 . F = female ; M = male ; NR = no response .

Journal of the American Academy of Audiology/Volume 5, Number 1, January 1994
Table 2 Comparison of Subject Populations' Education to that of the General Population
Education Level Total US* Iowa t Experimental Subjects ControlSubjects
Less than high school 24.8% 19.7% 12.5% 0%
High school graduate 30.0% 38.5% 35.0% 30%
1-3 years college or technical school 24.9% 24.7% 25.0% 40%
4 or more years college 20.3% 17.1% 27 .5% 30%
*Fom US Bureau of Census Press Release CB-92-87 (5-29-92) . The nation's economic, social, and housing "portrait" drawn from the 1990 Census Long Form .
tFrom Summary Tape File #3A, 1990 Census of Population and Housing, State of Iowa, US Census Bureau .
bution of education level in the CG subjects was similar to that for the EG subjects but did not include any individuals who had not completed high school .
Eight CG subjects reported that they had never lived with anyone who had a hearing loss . Two CG subjects reported that their spouses had acquired hearing losses . Neither the CG subjects nor their spouses were trained in health-related professions. None of the subjects knew any of the individuals who appeared in videotaped materials that were used in the study.
Procedures
Subjects' Task
Each subject watched a series of videotaped vignettes depicting individuals with hearing losses reacting to communication breakdown, the Communication Strategies Task (CST) (Elfenbein and Davis, 1986). Questionnaires completed after each vignette served as cri-tiques of the interactions . An example is pro-vided in Appendix A.
Table 3 Age, Gender, Hearing, and Occupation Characteristics of the Control Subjects
Subject Gender Age Better Ear
.5 kHz
Unaided
1 kHz
Thresholds
2 kHz
(dB HL) at
4 kHz
Occupation
1 F 25 5 10 0 0 Hair stylist
2 F 37 5 5 5 0 Cook
3 F 49 0 5 5 0 Homemaker*
4 F 62 5 5 10 10 Secretary*
5 F 69 10 5 10 25 Homemaker*
6 M 26 5 5 0 0 Graphicdesigner
7 M 47 10 5 10 20 Truck driver
8 M 50 5 0 0 5 Engineer
9 M 65 0 5 15 25 Officemanager*
10 M 70 5 10 5 15 Principal*
*Not employed at the time of the study . F = female ; M = male .

Communication Strategies/Elfenbein et al
The interactions shown in the videotapes were all based on everyday situations : commu-nicating with a waiter at a restaurant, a den-tist, an appointment secretary at a doctor's office, a friend at a large party, a family member at home, and coworkers at a business meeting. In each interaction, communication breakdown was induced by introducing background noise and/or by making the character(s) with normal hearing difficult to speechread .
Three types of vignettes were created: ones in which the character with hearing loss re-acted passively, ones in which the reaction was assertive, and ones in which the reaction was aggressive . For example, in the situation in which a patient is trying to make a doctor's appointment, the passive patient gives up and states that he will have his wife call in, and the assertive patient explains that he has a hearing loss and asks the secretary to face him when she talks. In the same situation, the aggressive patient tells the secretary that she should not be allowed to chew gum at work and that she is rude because she looks down at her appoint-ment book while speaking to him. Additional information concerning the development of these segments is provided in Appendix B.
The tape used in the experimental task contained six 1- to 2-minute communication situations . Two depicted passive behavior, two depicted aggressive behavior, and two depicted assertive behavior . The order of vignette pres-entation was such that vignettes depicting simi-lar behavior patterns were not presented in sequence . All vignettes were captioned. The audio portion of the tape was turned off so that the CG subjects would receive the same audi-tory and visual input as the EG subjects . Sub-jects were given the option of watching each segment twice. They were not permitted to return to a segment once they had seen the next in the series .
After each vignette, the subjects were asked to critique the interaction patterns they had observed . Their first task was to rate the level of communication difficulty the characters were having at the beginning and the end of each vignette using a five-point, equal-appearing-interval scale ranging from "no communication difficulty" to "total communication breakdown."
The subjects' second task was to answer a series of four open-ended questions about both the character with the hearing loss and the character(s) with normal hearing. Table 4 pro-vides a summary of the eight character's hear-ing x question categories . Subjects were asked
Table 4 Summary of the Eight Character's Hearing x Question Type Categories
Character's HearingStatus
Question Type
Abbreviation
Hearing loss Feelings HL-F Normal hearing Feelings NH-F Hearing loss Contribution HL-C Normal hearing Contribution NH-C Hearing loss Improvement HL-I Normal hearing Improvement NH-1 Hearing loss Strategies HL-S Normal hearing Strategies NH-S
to describe the feelings of the characters at the end of the vignette (feelings: HL-F and NH-F). They were then asked to describe what, if any-thing, the characters had done that made com-munication difficult (contribution: HL-C and NH-C). Once that was completed, subjects were asked to describe what the characters did to improve the situation (improvement : HL-I and NH-I) and then explain how they would have handled the situation (strategies : HL-S and NH-S).
Data Analysis
Ten certified speech-language pathologists and audiologists, each with at least 6 yeas of clinical experience with adult populations (X_ = 16.0, SD = 10.44), served as judges during data analysis . Each judge watched the series of vig-nettes shown to the subjects . Judges viewed the tapes watched with captions and listened to the audio signal . Thus, they had access not only to the visual information the subjects received but also to the acoustic information available to the characters with normal hearing.
Identifying Communication Break-down, After each vignette, each judge rated the level of communication difficulty that the characters were having at the beginning and the end of the vignette using the same scale used by the subjects . For four of the six begin-ning segments and all six of the ending seg-ments, consistent ratings of either no/low (< "mild" on the scale) communication difficulty or moderate or greater communication difficulty were found. Subjects' ratings that were consist-ent with the judges' ratings were scored as "appropriate." Subjects' ratings that were at the opposite end of the continuum from that of the judges were scored as "inappropriate." All of

Journal of the American Academy of Audiology/Volume 5, Number 1, January 1994
the responses scored as "inappropriate" dif-fered from the nearest judge's rating by more than one point on the scale. The two beginning segments on which the judges did not agree were omitted from the analysis .
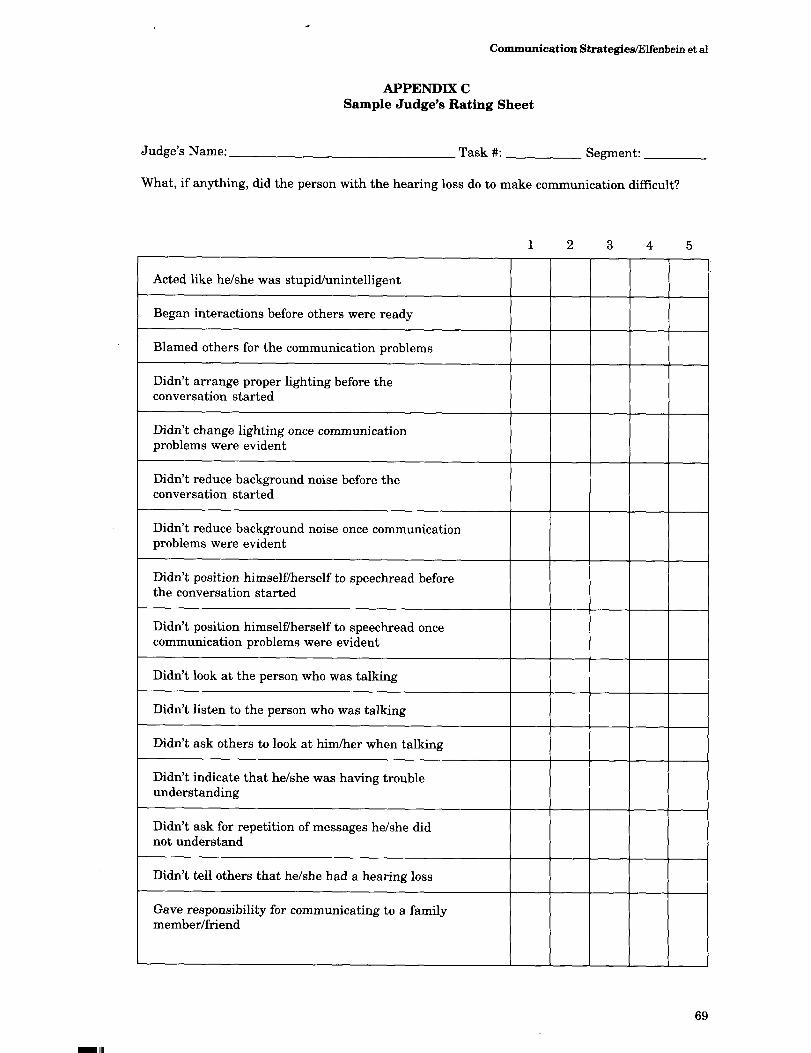
Responses to the Open-Ended Ques-tions. Next, the judges reviewed lists of the subjects' responses to the post vignette ques-tions described earlier. Appendix C provides a sample of the lists used. Subject responses that were similar in content (e.g., "learn to speech-read" and "take lipreading lessons") were pre-sented as single items in order to reduce the length of the judges' task .
Each judge evaluated each response as an indication of the subject's ability to deal with communication breakdown. A five-point, equal-appearing-interval scale was used . Ratings of "1" and "2" were assigned to responses that indicated skill in dealing with communication breakdown. Ratings of "4" and "5" were as-signed to responses that indicated sufficient deficit in dealing with communication break-down and that follow-up counseling was needed . A rating of "3" was assigned when the subject's response did not provide clear evidence of skill or deficit.
Responses that 80 percent of the judges rated as "1" or "2" were scored as "appropriate." Responses that 80 percent of the judges rated as "4" or "5" were scored as "inappropriate."
RESULTS
Identifying Communication Breakdown
Most ofthe subjects (38 of 50) demonstrated good ability to identify the degree of communi-cation breakdown depicted at the beginnings and ends of the vignettes. The remaining sub-jects (7 EG-P, 3 EG-S, 2 CG) responded inappro-priately at least once . Errors included difficulty identifying the onset of communication break-down (6 of 14), difficulty identifying failure of communication repair attempts (3 of 14), and difficulty identifying the resolution of commu-nication breakdown (5 of 14).
Comparison of the EG-P and EG-S subjects' responses by the chi-square technique revealed no significant differences in ability to identify communication breakdown (X2 = 0.038, df =1, p = .845). In light of this, responses for all EG subjects were then compared to the CG sub-jects' responses. Results indicated no signifi-cant differences in the EG and CG subjects'
abilities to identify communication breakdown (X2 = 0.110, df = 1, p = .741).
Responses to the Open-Ended Questions
Appropriate Responses
Summary Statistics . Figure 1 shows the mean number of responses to each question rated as appropriate (i .e ., responses that 80% of the judges rated as "1" or "2") . Although some subjects provided complex answers that in-cluded multiple appropriate responses, only one appropriate response per question was used in these calculations . Each subject responded to each question six times, once for each vi-gnette . Thus, each subject could earn a maxi-mum score of 6 in each of the question catego-ries . Table 5 provides a summary of the types of appropriate responses given.
Eighty-six percent (43 of 50) of the subjects produced at least one appropriate response to each type of question . Of the remaining seven subjects, three were EG-P and four were EG-S . Ninety-eight percent (49 of 50) of the subjects produced 15 to 36 appropriate responses apiece . One produced only one appropriate response . That was subject #37, one of the subjects deaf-ened earliest .
Examination of the subjects' responses to the contributions and strategies questions re-vealed that 98 percent (49 of 50) of the subjects correctly identified and suggested an appropri-ate strategy for dealing with at least one situa-tion in which lack of speechreading cues con-tributed to communication breakdown. The same subjects also correctly identified and sug-gested appropriate coping strategies for at least one situation in which background noise con-tributed to communication breakdown. It should be noted that the vignette captions alerted the viewer to the presence of background noise, such as music or water running in a sink.
Three of the vignettes covered situations in which the character(s) with normal hearing could not be expected to know about the other character's hearing loss (i .e ., no prior knowl-edge likely and no comments about it made during the vignette). When answering ques-tions about these vignettes, 90 percent (45 of 50) of the subjects noted at least once that it was important for the character with the hearing loss to explain the hearing loss . Only 30 per-cent, however, applied this strategy to all three of the situations in which it would have been appropriate.
58

Communication Strategies/Elfenbein et al
U) w U) Z 0 a -U) w
HL-F NH-F HL-C NH-C HL I
QUESTION
NH-1
Analysis of Variance . A three-way analysis of variance (ANOVA) (subject's hear-ing x question type x character's hearing) was performed to examine differences among the three groups in the mean number of appropriate responses. The results of the ANOVA are sum-marized in Table 6. All three main effects were significant, as were the subject's hearing x char-acter's hearing and question type x character's hearing interactions .
Follow-up analysis of the main effects was accomplished using Tukey's Studentized Range Test (alpha = .05) . Order of the means for sub-
HL-S NH-S
Figure 1 Mean number of ap-propriate responses produced by each subject group for each of the open-ended questions . (Note : the x-axis labels are defined in Table 4.)
jects hearing was CG (X = 3 .9), EG-P (X = 3.2), and EG-S (X = 2.8) . Only the means for CG and EG-S were significantly different from each other. Analysis of the main effect of character's hearing revealed that there were significantly more appropriate responses to questions about the characters with hearing losses (X = 3.5)than to questions about the characters with normal hearing (X = 3 .0) . Order of means for question type was strategies (X = 4.1), contribution (X = 3.3), feelings (X = 3.1), and improvement (X = 2.5) . The mean for strategies was significantly higher than each of the others. The means for
Table 5 Summary of the Subjects' Appropriate Responses
Question Response
HL-F
NH-F
HL-C
NH-C
HL-1
NH-1
HL-S
NH-S
Anger, confusion, disgust, embarrassed, frustrated, helpless, satisfied, upset
Anger, confusion, disgust, frustrated, satisfied, shocked, upset
Blamed others/became upset, didn't mention hearing loss, poor position for speechreading, stood near noise source
Tried to communicate in noise, poor position/behavior for speechreading
Asked for decrease in noise, asked for repetition, asked that others alter position for speechreading, ex-plained hearing loss, improved own position for speechreading, said "I don't understand"
Decreased noise when asked, improved position for speechreading spontaneously or when asked, repeated when asked
Ask for decrease in noise, ask for increase in speaking level, ask others to reposition for speechreading, ask for written material (e .g ., menu), explain hearing loss, go to quiet place to communicate, improve position for speechreading, stay calm
Ask whether patient has hearing loss, decrease background noise, discuss impact of hearing loss with friends/family, go to quiet place to communicate, improve position for speechreading, use written material (e .g ., menu)

Journal of the American Academy of Audiology/Volume 5, Number 1, January 1994
Table 6 Summary of the Three-Way ANOVA (Subject's Hearing x Question Type x Charac-ter's Hearing) x Performed on the Appropriate Responses to the Open-Ended Questions
Source of F p
Subject's hearing (SH) 2 4.63 0146 Question type (QT) 3 31 .91 .0001 SH x QT 6 3.61 0023 Character's hearing (CH) 1 17 .66 0001 SH x CH 2 0.92 .4075 QT x CH 3 15.04 .0001 SH x QT x CH 6 1 .21 .3026
contribution and feelings were not significantly different from each other but were significantly higher than the mean for improvement.
Main Effects. Examination of the subject's hearing x question type interaction was con-ducted by performing a one-way ANOVA (sub-ject's hearing) on the data for each of the ques-tion types. The data are shown in Figure 2. The only significant finding was for the question type strategies (F, feelings = 1.93, df = 2, p = .1570; F, contribution =1.44, df= 2, p = .2481; F, im-provement = 0.25, df = 2, p = .7826 F strategies = 12.63, df = 2, p = .0001) . Follow-up analysis of the main effect of subject's hearing using Tukey's Studentized Range Tests (alpha = .05) revealed that the CG mean was signifi-cantly higher than those for the EG-P and EG-S but that the EG-P and EG-S means did not differ from each other.
Interactions. Examination of the question type x character's hearing interaction was con-ducted by performing a one-way ANOVA (char-acter's hearing) on the data for each of the question types. The data are shown in Figure 3.
Significant differences were seen in the data for the question types feelings and improvement (F, feelings = 42 .0, df = 2, p = .0001; F, contribu-tion = 3.32, df = 2, p = .0744; F, improvement = 23.23, df = 2, p = .0001; F, strategies = 0.24, df = 2, p = .6271). In both cases, subjects produced a greater number of appropriate statements about the characters with hearing losses than about the characters with normal hearing.
Inappropriate Responses
Summary Statistics. Figure 4 shows the number of responses rated as inappropriate (i .e ., responses that 80% of the clinicians rated as "4" or "5") . Scoring was done in the same manner as for the appropriate ratings. If a complex answer contained one or more items scored as appropriate and one or more items scored as inappropriate, then the individual was credited with one point in each category . Table 7 provides a summary of the specific responses given.
Seventy-six percent of the subjects (22 of 27 EG-P, 8 of 13 EG-S, 8 of 10 CG) produced at least one response that was scored as inappropriate. This group of 38 subjects included all 12 of the subjects who demonstrated difficulty identify-ing the presence of communication breakdown. Most of the subjects (31 of 38) made only one or two inappropriate responses . The seven other subjects made 3 to 6 inappropriate responses apiece .
Five of the subjects (3 EG-P and 2 EG-S) who made inappropriate responses made notes in the margins of their answer sheets about the feelings of the normally hearing characters. These statements went beyond simple inter-pretation of the facts at hand . The comments included : "She had the feeling that most people
FEELINGS CONTRIBUTION IMPROVEMENT
QUESTION TYPES
STRATEGIES
Figure 2 Mean number of ap-propriate responses produced by each subject group for each of the question types.
60

Communication Strategies/Elfenbein et al
6
O 51
O
a 2 a Q
Z 1 Q LU 2
0
HL-F NH-F HL-C NH-C HL-1 NH-I
QUESTION
have about communicating with deaf people-selfish-didn't want to take the time to commu-nicate ; Waiter was the culprit-thinking, ̀ Deaf old lady!"' and "People who can hear pity you-I see it all the time." Two subjects noted that in the business meeting vignette, when decisions were made about who should attend a confer-ence, the normally hearing coworkers didn't nominate the coworker with the hearing loss because he had a hearing loss . In fact, all nomi-nations, including one made by the character with the hearing loss, were of individuals not seen in the vignette .
Analysis of Variance. A three-way ANOVA (subject's hearing x question x charac-ter's hearing) was used to examine the differ-ences among the three groups in mean number
,0
Q 6-
O r, 2 a a-< 4-Z
0 3-
zd w z
n QUESTIONS ABOUT CHARACTERS WITH HEARING LOSSES _ QUESTIONS ABOUT CHARACTERS WITH NORMAL HEARING
O CG ® EG-S " EG-P
H L-S N H-S
Figure 3 Mean number of ap-propriate responses produced by all subjects for each of the open-ended questions . (Note: the x-axis labels are defined in Table 4.)
of inappropriate responses. The findings are summarized in Table 8. The only significant main effect was question type. The only signifi-cant interactions were subject's hearing x char-acter's hearing and question type x character's hearing.
Main Effects. Follow-up analysis of the main effect of question type was accomplished using a Tukey Studentized Range Test (alpha = .05) . The order of the means was contribution (X = .25), feelings (X = .22), strategies (X = .16) and improvement (X = .09) . The only significant difference was between contribution and im-provement.
Interactions. Examination of the subject's hearing x question type interaction was con-ducted by performing a one-way ANOVA (sub-
Figure4 Mean number ofinap-propriate responses produced by each subject group for each of the open-ended questions. (Note: the x-axis labels are defined in Table 4.)
HL-S NH-S HL-F NH-F HL-C NH-C HL-I NH-I
QUESTION

Journal of the American Academy of AudiologyNolume 5, Number 1, January 1994
Table 7 Summary of the Subjects' Inappropriate Responses
Question
HL-F NH-F
HL-C
NH-C
HL-I
HL-S
Response
Concern regarding details in message that character did not hear Negative feelings about hearing loss when hearing loss is known, negative feelings about hearing loss when hearing loss is not known Character should always face others even when communication not planned, in case others try to communi-cate ; talked too much-interfered with other's communication, made big deal of hearing loss
Ignored hearing loss character's request for help, should have known character had hearing loss, people with hearing loss should always be permitted to lead meetings, messages should have more detail
Nothing, listed behaviors not demonstrated, gave up/asked friend to communicate, ignored NH character until he communicated properly
Nothing can be done, be quiet and listen, don't try to communicate with that person again, have family members/friends communicate for you, always face others in case they want to communicate with you, inappropriate focus on the details of the message
ject's hearing) for each level of question type . The data are shown in Figure 5. The main effect of subject's hearing was of borderline signifi-cance for both contribution and strategies (F, feelings = 0 .47, df = 2, p = .6255 ; F, contribution = 3.01, df = 2, p = .0591; F, improvement = 0.62, df = 2, p = .5413; F, strategies = 3 .00, df = 2, p = .0593).
Examination of the question type x charac-ter's hearing interaction was conducted by per-forming a one-way ANOVA (character's hear-ing) on the data for each of the question types. The data are shown in Figure 6. Significant differences were seen in the data for the ques-tion types contribution and improvement (F, feelings = 2.54, df = 2, p = .1176; F, contribution = 4.82, df = 2, p = .0382; F, improvement = 5.99, df = 2, p = .0180; F, strategies = 0.49, df = 2, p = .4851) . Inboth cases, subjects produced a greater number of inappropriate statements about the
Table 8 Summary of the Three-Way ANOVA (Subject's Hearing x Question Type x Character's Hearing) Performed on the Sub-jects' Inappropriate Responses to the Open-
Ended Questions
Source of F p
Subject's hearing (SH) 2 0.63 .5373
Question type (QT) 3 3.10 0288
SH x QT 6 2.86 .0117
Character's hearing (CH) 1 2 .63 1115
SH x CH 2 2.58 0863
QT x CH 3 3.93 .0099
SH x QT x CH 6 1 .28 .2721
characters with hearing losses than about the characters with normal hearing.
Correlational Analyses of Response Type and Subject Characteristics
Two sets of Pearson product-moment cor-relations were performed using data from the EG-P and EG-S subgroups as well as for the entire EG and the CG. One investigated the strength of the relationships between the num-bers of appropriate and inappropriate respon-ses. The other investigated the strength of the relationship between the variables nature of loss, duration of deafness, education level, and age, and the numbers of appropriate and inap-propriate responses. The results are shown in Tables 9 and 10. With the subgroups, the only significant finding was a moderate positive correlation between number of appropriate re-sponses and duration of deafness for EG-P (r = .47, p = .0114) . Low negative correlations be-tween the numbers of appropriate and inappro-priate responses were found for both the EG subjects (r = -0.34, p = .0322) and the CG sub-jects (r = -0.37, p = .0199) .
DISCUSSION
W hen analyzing the results from this study, it is important to consider that the subject population may represent a unique subset of adults with profound acquired hearing losses . Each of the individuals studied was ex-ploring the possibility of obtaining a cochlear implant. This might indicate that they were experiencing greater than average difficulty in coping with their hearing losses and/or that these individuals had a greater than average
62

Communication Strategies/Elfenbein et al
U) W M1 z O
5
0- C/) w [L 4
Q W 3 a- 0
a 2 a Q z u t z a w :~ I
CG EG-P I" EG-S
~z z I I F4z _J_ -j- T_ c~ .--z.-- FEELINGS CONTRIBUTION IMPROVEMENT STRATEGIES
QUESTION TYPES
willingness to explore new ways of dealing with their hearing problems .
Communication Strategies Task Data
A number of patterns can be seen in the subjects' responses to the CST. First, 86 per-cent of the subjects demonstrated some skills in performing each of the five behaviors assessed : identification of the presence of communication breakdown; identification of the feelings of indi-viduals experiencing communication break-down ; identification of the factors that contrib-uted to communication breakdown; identifica-tion of actions that improved communication; and suggestion of strategies for dealing with communication breakdown. Ninety-eight per-cent demonstrated skills in at least four behavior categories . No significant differences were seen in the CG and EG subjects' abilities in the first four categories . The CG subjects, however, dem-onstrated higher numbers of appropriate re-
U) 6 W
UJ z O CL w Cc
Q Fr a O
z
LJ QUESTIONS ABOUT CHARACTERS WITH HEARING LOSSES
- QUESTIONS ABOUT CHARACTERS WITH NORMAL HEARING
5
3
ik 1 -z a w 2 o I I
HL-F NH-F HL-C NH-C HL-I NH-I
QUESTION
Figure 5 Mean number of inap-propriate responses produced by each subject group for each of the question types.
sponses than the EG subjects on questions dealing with response strategies . Both the CG and EG subjects demonstrated more skill in describing the feelings of and attempts to im-prove communication by characters with hear-ing losses than characters with normal hear-ing.
Ninety-eight percent of the subjects dem-onstrated at least once that they could identify lack of speechreading cues and background noise as factors that contributed to communica-tion breakdown. Ninety percent indicated at least once that an individual with a hearing loss could use explanation of the hearing loss as a strategy to improve communication.
Second, the data indicated that although the subjects demonstrated a broad variety of coping skills, they also had some significant deficits in their abilities to deal with communi-cation breakdown. Seventy-six percent of the subjects demonstrated inappropriate responses, such as suggesting that individuals with nor-
;MIL HL-S NH-S
Figure 6 Mean number of inap-propriate responses produced by all subjects for each of the open-ended questions. (Note : the x-axis labels are defined in Table 4 .)

Journal of the American Academy of Audiology/Volume 5, Number 1, January 1994
Table 9 Pearson Product-Moment Correlations among EG Subject Characteristics and EG Subjects' Responses to the Open-Ended Questions for the EG-P and EG-S
EG-P
Appropriate
Subjects
Inappropriate
EG-S
Appropriate
Subjects
Inappropriate
Age -.04 33 -.05 08 p = .8292 p = .0983 p = .8731 p = .7928
Age at HL onset -.08 35 06 05 p = .6907 p = .0715 .p = .8553 p = .8655
Duration of deafness 47 14 20 04 p = .01 14 p = .4790 p = .5072 p = .8979
Education .25 -.09 -.07 -.11 p = .2150 p = .6290 p = .8283 p = .7338
Appropriate -.21 -.45 p = .3034 p= .1194
mal hearing should always assume that the communication partners have hearing losses, that individuals with hearing losses should always face others in the same room in case another person might want to begin a conversa-tion, and that when communication breakdown occurs, individuals with hearing losses should give up or have family members communicate for them. In two target areas, identification of factors that contributed to communication breakdown and identification of actions that improved communication, the subjects produced more inappropriate responses to questions about the characters with hearing losses than to ques-tions about characters with normal hearing.
Five (12.5%) of the EG subjects made mar-ginal notes on their response sheets that indi-
cated that their interpretation of the vignettes was based on far more than the simple facts at hand (e.g ., "People who can hear pity you- I see it all the time" and "She had the feeling that most people have about communicating with deaf people-selfish-didn't want to take the time to communicate"). It is possible that the subjects are remembering experiences that they have had and overgeneralizing them to the situations in the vignettes. It is also possible that some of these statements reflect the sub-jects' own anxieties. For example, subjects might unconsciously project their feelings onto others when admission of those feelings would cause anxiety (Schum, 1986). The subject who sees pity in the actions of others may see himself as pitiable .
Table 10 Pearson Product-Moment Correlations among Subject Characteristics and Subjects' Responses to the Open-Ended Questions for the CG and EG
CG Subjects
Appropriate Ina
Age -.12 p = .7715 p
Age at HL onset
Duration of deafness
Education .47 p = .1744 p
Appropriate
ppropriate
- .12 = .7515
-.46 = .1857
EG Subjects
-.52 p= .1208
Appropriate Inappropriate
-.05 - .20 p = .7730 p =,2271
-.07 20 .p = .6498 p = .2266
-.04 10 p = .8128 p = .5270
.10 - .10 p= .5556 p= .5511
- .37 p= .0199

Communication Strategies/Elfenbein et al
Third, the data indicate that it is not possi-ble to predict an individual's abilities to iden-tify, assess, or plan repair of communication breakdown simply on the basis of an individu-al's age, an individual's education, whether an individual has a hearing loss, the nature of onset of a hearing loss (sudden versus progres-sive), or the length of time an individual has been deaf. Although a moderate correlation was observed between numbers of appropriate re-sponses and duration of deafness for EG-P sub-jects, there was no parallel relationship for inappropriate responses. Indeed, some of the subjects who demonstrated the highest num-bers of appropriate responses also demonstrated at least one inappropriate response . It is impor-tant to remember that inappropriate responses were not simply errors of omission but were instead marked errors in judgment that a panel of experienced clinicians felt warranted follow-up counseling .
These data indicate that experience with hearing loss is likely only one of a number of factors that contribute to an individual's under-standing ofcommunication breakdown and com-munication repair strategies . The similarities between the responses of the EG and CG sub-jects are indications that other factors, perhaps personality or previous coping experiences, may also have an impact . Additional research is needed to sort out the relations between psy-chosocial factors and the development of com-munication repair strategies .
Implications for Clinical Practice
lems in communication strategy development, clinicians will need to include one or more of the following activities in their assessment batter-ies:
1. Client interview. Interviews can be used to obtain clients' opinions regarding the types of communication problems they encoun-ter, the types of repair strategies they use, the degree to which these strategies prove successful, and the types of communication skill changes they desire .
2. Client evaluation of videotaped interac-~ tions. As in this study, clients can be asked to view videotapes of situations in which communication breakdown occurs and then discuss the causes and possible solutions. Similar data could be obtained by having the client watch live actors role-play a situ-ation (Elfenbein and Davis, 1986).
3. Observation of the client's behavior during communication. Clinicians can videotape and then analyze the client's behavior in one or more communication situations . These can take the form of either simple conversation or role-playing a situation, such as interacting with a clerk at a store or obtaining detailed information regarding how to reach a specific destination (Lansing, 1992). Varying degrees of breakdown can be introduced to present opportunities for the client to demonstrate strategies (e.g., having the speaker turn away from the listener, having the speaker use low vocal intensity) .
These findings support a number of sugges-tions for clinical practice that have been made by the authors and other clinicians . First, given that the ability to cope with communication breakdown is requisite for successful communi-cation, it is essential that the assessment of communication strategies be included in the evaluation of adult cochlear implant candidates (Elfenbein and Davis, 1986). Seventy-six per-cent of the subjects in this study were not able to consistently identify the feelings of individu-als involved in communication breakdown, the factors contributing to communication break-down, or appropriate repair strategies . Response patterns indicated that the level of an individu-al's coping skills cannot be predicted using the nature of a hearing loss (sudden versus progres-sive), the period of time that an individual has been deaf, an individual's age, or an individual's education background . In order to identify prob-
Self-assessment inventories such as the Communication Profile for the Hearing Impaired (CPHI) (Demorest and Erdman, 1986) and Per-formance Inventory for Profound and Severe Hearing Loss (PIPSL) (Owens and Raggio,1988) may also prove useful . Although the format is much different from the experimental task used in this study, clinicians may be able to glean some of the same information from their clients' response patterns. Clinicians should examine the responses to individual questions as well as the overall profile obtained . These responses can provide valuable data regarding perform-ance and/or feelings in specific situations . Cli-nicians must be alert to indications (e.g ., low scores on the CPHI problem awareness and denial scales) that clients are demonstrating difficulty acknowledging communication prob-lems specific to hearing loss (Lansing and Seyfried, 1990). Clinicians might also consider
65

Journal of the American Academy of Audiology/Volume 5, Number 1, January 1994
having spouses complete the inventory in order to obtain their perspectives on clients' behavior .
The second implication for clinical practice is that clinicians need to be prepared to include communication strategy development activi-ties in the rehabilitation programs established for this population (Lynn et al, 1983 ; Lansing and Davis, 1988). The goal is to help the client move toward independence . This process may include:
1. Practice in identifying communication breakdown. Individuals cannot be expected to respond to a situation unless they know that it exists . The focus here is on the many ways that people signal or can check for confusion of a message.
2. Developing an understanding of communi-cation breakdown. Clients need to learn that the communication breakdown they experience is a common occurrence among their hearing-impaired peers and what the causal factors are (e.g ., that it is not specific to their families, coworkers, etc.) . Discus-sions held with other hearing-impaired adults and their spouses can be particu-larly helpful. Feelings of confusion, frustra-tion, and loss need to be identified and dealt with . For example, if clients are confused by communication breakdown, the clini-cian can help them focus on describing the nature of the problem and clarifying the alternatives they have for dealing with it (Schum, 1986).
3. Development of a set of communication repair strategies . Clients need to learn a broad range of coping behaviors from which they can draw when faced with communica-tion breakdown. These strategies have been variously described as "hearing tactics" (Hase, 1987), "communication tactics" (Cowie et al, 1987), "coping strategies" (Abrahamson, 1991), and "communication strategies" (Kaplan, 1985; Elfenbein and Davis, 1986). Whatever they are called, it is important that the strategies match the basic personality of the individual involved .
4. Practice in the use of communication repair strategies . It is not enough for clients sim-ply to memorize a list of strategies. They must practice selecting and using them in a variety of situations and as a result expe-rience the power they have to repair com-munication breakdown. Although roleplay-ing serves as an excellent starting place, practice must extend to the activities of
daily living. Rehabilitation programs ofthis type are of particular value to those clients who are employed or are seeking employ-ment . Orlans (1985) points out that the problem of "communication and sociability . . . is most difficult for those who must work with people (not machines or paper) they do not know under conditions they cannot control" (p. 183). He also notes that some individuals (e.g ., secretaries, law-yers, reporters) may have to change or modify their work and that often the new position "requires less skill or versatility, pays less, and has fewer prospects for ad-vancement" (p . 183) . It is essential that these individuals learn how to manage com-munication situations to minimize the im-pact of their limitations and make maxi-mum use of their skills .
The third implication for clinical practice is that clinicians need to include family members with normal hearing in rehabilitation programs (Lynn et al, 1983; Erber, 1988 ; Abrahamson, 1991). The data from this study indicate that individuals who have normal hearing are likely to demonstrate the same mix of appropriate and inappropriate responses to communication breakdown as individuals who have hearing losses . When designing treatment plans, clini-cians need to include the goal of helping the family develop an understanding both of the impact of hearing loss on communication and of the types of coping strategies that are possible .
Acknowledgment . This research was presented in a poster session at the American Academy of Audiology Conference, Phoenix, AZ, in April 1993. This research was supported in part by NIH Grant #CDR 5 P01 NS20466, Grant RR59 from General Clinical Re-search Program, Division of Research Resources, NIH .
REFERENCES
Abrahamson J . (1991) . Teaching coping strategies : a cli-ent education approach to aural rehabilitation. J Acad RehabilAudiol 24:43-53 .
American National Standards Institute. (1989) . Ameri-can National Standard Specifications for Audiometers (S3.6-1989). New York:ANSI .
Cowie R, Stewart P, Douglas-Cowie E . (1987). The expe-rience of becoming deaf. In : Kyle JG, ed. Adjustment to Acquired Hearing Loss . Bristol, Great Britain : Antony Rowe,140-155 .
Demorest ME, Erdman, SA_ (1986) . Scale composition and item analysis of the Communication Profile for the Hearing Impaired . J Speech Hear Res 29:515-535 .
66

Communication Strategies/Elfenbein et al
Elfenbein J, Davis J . (1986) . Communication effective-ness training: use of video-tape to present examples of communication failure and success. Presented at the Academy of Rehabilitative Audiology Summer Institute, Lake Geneva, WI.
Erber N. (1988) . Communication Therapy for Hearing Impaired Adults . Abbotsford, Australia: Clavis Publish-ing.
Hase V. (1987) . Hearing tactics in the adjustment of the deafened . In: Kyle JG, ed. Adjustment to Acquired Hear-ing Loss . Bristol, Great Britain : Antony Rowe, 203-210 .
Kaplan H . (1985). Communication strategies . In : Kaplan H, Bally S, Garretson C, eds. Speechreading. A Way to Improve Understanding, 2nd ed . Washington, DC : Gallaudet Press, 18-32 .
Knutson JF, Lansing CR . (1990) . The relationship be-tween communication problems and psychological diffi-culties in persons with profound acquired hearing loss . J Speech Hear Disord 55:656-664 .
Lansing CR. (1992) . Communication management strat-egies requested by experienced cochlear implant users . J Acad Rehabil Audiol 25:130-145.
Lansing CR, Davis JD . (1988) . Early versus delayed speech perception training for adult cochlear implant users : initial results . JAcad Rehabil Audiol 21:29-41 .
Lansing CR, Seyfhed DN . (1990) . Longitudinal changes in personal adjustment to hearing loss in adult cochlear implant users . JAcad Rehabil Audiol 23:63-77 .
Lynn M, Porter TH, Maddox HE. (1983). Aural rehabilita-tion of the adult cochlear implant recipient : a discussion . JAcad Rehabil Audiol 16:96-103 .
Meadow-Orlans K. (1985) . Social and psychological ef-fects of hearing loss in adulthood: a literature review . In : Orlans H, ed. Adjustment to Adult Hearing Loss . San Diego, CA : College-Hill Press, 35-57 .
Nerbonne MA, Smedley TC, Tannahill JC, Schow RL, Flevaris-Phillips C . (1989). Case studies: adults/elderly adults . In : Schow RL, Nerbonne MA, eds.Introduction to Aural Rehabilitation . Austin, Texas: Pro-ed, 541-573 .
NordengH, Martinsen H, von Tetzchner S . (1985). Forced language change as a result of acquired deafness. Int J Rehabil Res 8 : 71-74 .
Orlans H. (1985) . Reflections on adult hearing loss . In : Orlans H, ed . Adjustment to Adult Hearing Loss . San Diego, CA : College-Hill Press, 179-194.
Owens E, Raggio M . (1988). Performance Inventory for Profound and Severe Hearing Loss (PIPSL) . J Speech Hear Disord 53:42-56 .
Rezen S, Hausman C. (1985). Coping with Hearing Loss . New York: Red Dembner Enterprises.
Schum RL . (1986) . Counseling in speech and hearing practice . In : Cooper E, ed.Clinical Series No. 9. Rockville, MD: National Student Speech-Language-Hearing Asso-ciation.
Thomas A, Herbst K. (1980). Social and psychological implications of acquired deafness for adults of employ-ment age. Br JAudiol 14: 76-85 .
Woolley M . (1987) . Acquired hearing loss-acquired op-pression . In : Kyle JG, Adjustment to Acquired Hearing Loss . Bristol, Great Britain : Antony Rowe, 169-175 .
APPENDIX A Sample Form from the Communication Strategies Task
Segment lA 1. In your opinion, how much, if any, communication difficulty did the father and daughter
experience at the beginning of this segment?
0% . . . . . . . . . . . . . . . . . . . . . . . . . . . 25% .. . . . . . . . . . . . . . . . . . . . . . . . 50% . . . . . . . . . . . . . . . . . . . . . . . . . 75% . . . . . . . . . . . . . . . . . . . . . . . . . 100% No Mild Moderate Severe Total communication communication communication communication communication difficulty difficulty difficulty difficulty breakdown
2 . In your opinion, how much, if any, communication difficulty did the father and daughter experience at the end of this segment?
0% . . . . . . . . . . . . . . . . . . . . . . . . . . . 25% . . . . . . . . . . . . . . . . . . . . . . . . . 50% . . . . . . . . . . . . . . . . . . . . . . . . . 75% . . . . . . . . . . . . . . . . . . . . . . . . . 100% No Mild Moderate Severe Total communication communication difficulty difficulty
communication communication difficulty difficulty
3. What, if anything, did the father do to make communication difficult?
communication breakdown
4. What, if anything, did the father do to improve communication?

Journal of the American Academy of Audiology/Volume 5, Number 1, January 1994
APPENDIX A (cont'd)
5. a. What feelings did the father have at the end of the segment? b. Why did he have such feelings?
6. If you were the father, what, if anything, would you do to improve communication?
7. What, if anything, did the daughter do to make communication difficult?
8. What, if anything, did the daughter do to improve communication?
9. a. What feelings did the daughter have at the end of the segment? b. Why did she have such feelings?
10 . If you were the daughter, what, if anything, would you do to improve communication?
APPENDIX B Development of the Communication Strategies Task Videotape
During the initial stages of videotape development, 18 situations were identified that : (1) involved information exchange and would be likely to occur in the lives of adults (e.g ., interacting with a dentist) ; and (2) were at high risk for communication breakdown (e.g ., situations in which speechreading would be difficult) . For each situation, a communication goal was established (e.g ., obtaining information about a root canal procedure) and a cause or causes of communication breakdown set (e.g., the dentist moves behind the patient to set up equipment). Then, three scenarios were outlined : one in which the character with hearing loss reacted passively, one in which the character with hearing loss reacted assertively, and one in which the character with hearing loss reacted aggressively .
Actors for vignettes were recruited from the University of Iowa students, staff, faculty, and alumni . Before each vignette was videotaped, the scenario was reviewed with the actors, but no script was provided . Therefore, word choice and body language were left to the interpretation of the individual . For example, one actor pounded on the table as part of an aggressive response while another used a tense, rigid body posture. Allowing the actors freedom to interpret the situations in their own ways provided for a broad range of expression of each of the three types of target behavior .
In order to determine whether the behavior in each vignette was an acceptable representation of the target behavior, vignettes were screened first by the authors and then by five other clinicians . Only those vignettes on which all viewers agreed were used in the experimental tape .
Communication Strategies/Elfenbein et al
APPENDIX C Sample Judge's Rating Sheet
Judge's Name: Task #: Segment:
What, if anything, did the person with the hearing loss do to make communication difficult?
1 2 3 4 5
Acted like he/she was stupid/unintelligent
Began interactions before others were ready
Blamed others for the communication problems
Didn't arrange proper lighting before the conversation started
Didn't change lighting once communication problems were evident
Didn't reduce background noise before the conversation started
Didn't reduce background noise once communication problems were evident
Didn't position himself/herself to speechread before the conversation started
Didn't position himself/herself to speechread once communication problems were evident
Didn't look at the person who was talking
Didn't listen to the person who was talking
Didn't ask others to look at him/her when talking
Didn't indicate that he/she was having trouble understanding
Didn't ask for repetition of messages he/she did not understand
Didn't tell others that he/she had a hearing loss
Gave responsibility for communicating to a family member/friend
69