communication choices: segmentation report on … · research document publication date ......
TRANSCRIPT
Communication Choices A segmentation report on communication methods
used by UK consumers
Research Document
Publication date: 13 November 2012

Communication Choices
Contents
Section Page 1 Executive summary 1
2 Communication choices segmentation 5
3 Communicating with friends and family 12
4 Communicating with businesses 18
5 Attitudes to communication methods 21
6 Changing patterns of communication 28
Annex 1 Technical specification 30
Communication Choices
1
Section 1
Executive summary 1.1. Background to the research and segmentation
We commissioned research in February 2012 to understand the breadth of communication methods used by UK adults to interact with others. This included understanding their preference for particular forms of communication depending on the circumstance: with friends and family or with businesses.
A range of different ways of communicating were investigated, including meeting face to face, using voice calls on fixed landline or on mobile phones, text messaging, emailing, instant messaging, social networking and postal correspondence. A summary of the research was published as part of the Communications Market Report 20121 and showed that digital communications are now widely used alongside traditional methods. Overall, while consumers say they prefer to communicate face to face on a daily basis, texting is the communication they actually use most with friends and family.
This report aims to complement the high-level findings by outlining how the UK consumer population can be segmented into five distinct groups according to their attitudes to and usage of different digital and traditional communication methods, whether communicating with family, friends or businesses. By providing an insight into the communication preferences and tendencies of the population, the research offers an opportunity to dissect ‘the consumer’ into more specific groups of people who share similar attitudes and behaviours. Overall, the findings provide an attitudinal dimension to Ofcom’s existing work in understanding consumer behaviour in relation to different communication methods.
The following section provides a snapshot of each of the five segments that have been identified.
1.2. Overview of the five segments
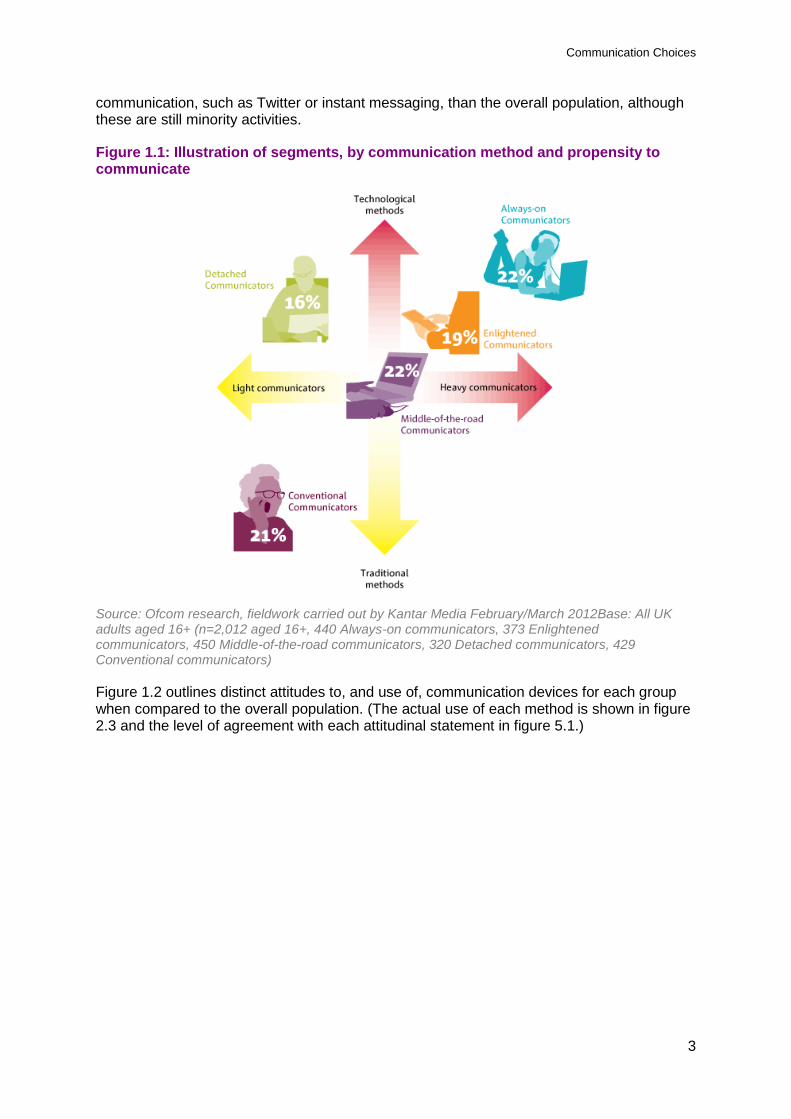
We identified five groups: ‘always-on’ communicators,’ enlightened’ communicators, ‘middle of the road’ communicators, ‘conventional’ communicators and ‘detached’ communicators. These can broadly be defined by their frequency of communication and the extent to which they use new technologies to communicate (see Figure 1.1 below). Comparing each group with the overall population, we found distinct attitudes to, and patterns of use of, communication devices (see Figure 1.2 below).
‘Always-on’ communicators (22% of all adults) As the name suggests, ‘always-on’ communicators are those who communicate a lot, especially with their friends and family, and use a wide range of new technological methods to communicate. These are the youngest group with the greatest proportion still in education and are more likely than the general population to own a mobile phone and have access to a computer. In particular, they are avid users of their mobile phone, using it primarily to send text messages but also to call their friends and family.
1 Ofcom Communications Market Report 2012: http://stakeholders.ofcom.org.uk/binaries/research/cmr/cmr12/UK_1.pdf
Communication Choices
2
Those who use social media for keeping in touch are also more likely to be ‘always on’ communicators and are much more comfortable than the general population sharing information with a wide group of people over the internet.
People in this group are also more likely to use newer forms of communication such as Twitter or VoIP to keep in touch with their family and wider social circle, although these are still minority activities.
‘Enlightened’ communicators (19% of all adults) Enlightened communicators are also a younger group who communicate a lot, though are more likely to be working and in higher social grades than the ‘always-on’ group. They like to keep up with technology and as a result are more likely than the general population to think of themselves as being knowledgeable about the internet, and are the most careful about sharing personal information online.
Technology plays a key role in the communication choices for this group. They are more likely than the general population to own a computer and a mobile phone and use these to keep in contact with friends and family, using texting or mobile calls (or emailing in particular). They say that their use of email to keep in touch with people has increased dramatically over the past couple of years and they expect to use it even more in the future. Social networking sites are also a key communication channel for this group, compared to the overall population.
‘Middle-of-the-road’ communicators (22% of all adults) Middle-of-the-road communicators are more in line with the general population in terms of the frequency with which they communicate. They use a variety of traditional and newer ways of keeping in touch, with mobile calls, text messages and post the most used. They prefer traditional methods to automated services when contacting businesses..
They are most likely to be hesitant about sharing personal opinions over social media such as Twitter, and say that they often “let others try out new services first before giving them a go themselves”.
‘Conventional’ communicators (21% of all adults) Conventional communicators are the oldest group; they are more likely than the general population to be retired and live on their own.
This group communicates least frequently with others, is the least likely to have embraced new technology and the least likely of all the segments to have access to a computer, or to own a mobile phone. They tend to use the more traditional methods of communication such as landline calls and post, and are more likely than the overall population to own a fixed landline. On special occasions such as birthdays, conventional communicators are the most likely to send a card or present in the post.
‘Detached’ communicators (16% of all adults) Communicating with others is not a priority for this group: they communicate less frequently than the overall population and they don’t have strong opinions on any of the attitudinal statements regarding ways of communicating. Their main method of keeping in touch with friends or family on a daily basis is using text messages, and given the choice, they are the least likely of all of the segments to choose to communicate face to face.
While this group may not have particular views on communication methods, their usage patterns suggest that they are more likely to use newer, quick-form text methods of
Communication Choices
3
communication, such as Twitter or instant messaging, than the overall population, although these are still minority activities.
Figure 1.1: Illustration of segments, by communication method and propensity to communicate
Source: Ofcom research, fieldwork carried out by Kantar Media February/March 2012Base: All UK adults aged 16+ (n=2,012 aged 16+, 440 Always-on communicators, 373 Enlightened communicators, 450 Middle-of-the-road communicators, 320 Detached communicators, 429 Conventional communicators)
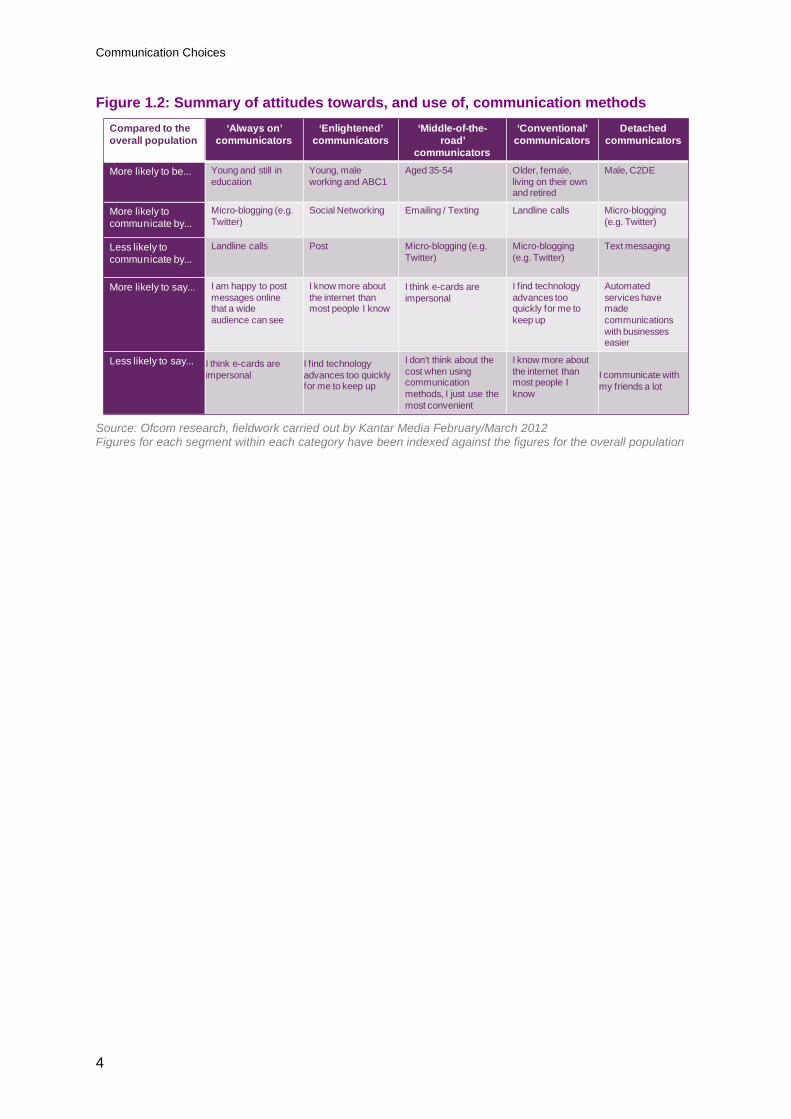
Figure 1.2 outlines distinct attitudes to, and use of, communication devices for each group when compared to the overall population. (The actual use of each method is shown in figure 2.3 and the level of agreement with each attitudinal statement in figure 5.1.)
Communication Choices
4
Figure 1.2: Summary of attitudes towards, and use of, communication methods Compared to the overall population
‘Always on’ communicators
‘Enlightened’communicators
‘Middle-of-the-road’
communicators
‘Conventional’ communicators
Detached communicators
More likely to be... Young and still in education
Young, male working and ABC1
Aged 35-54 Older, female, living on their own and retired
Male, C2DE
More likely to communicate by...
Micro-blogging (e.g. Twitter)
Social Networking Emailing / Texting Landline calls Micro-blogging (e.g. Twitter)
Less likely to communicate by...
Landline calls Post Micro-blogging (e.g. Twitter)
Micro-blogging (e.g. Twitter)
Text messaging
More likely to say... I am happy to post messages online that a wide audience can see
I know more about the internet than most people I know
I think e-cards are impersonal
I find technology advances too quickly for me to keep up
Automated services have made communications with businesses easier
Less likely to say... I think e-cards are impersonal
I find technology advances too quickly for me to keep up
I don't think about the cost when using communication methods, I just use the most convenient
I know more about the internet than most people I know
I communicate with my friends a lot
Source: Ofcom research, fieldwork carried out by Kantar Media February/March 2012 Figures for each segment within each category have been indexed against the figures for the overall population
Communication Choices
5
Section 2
Communication choices segmentation 2.1. Introduction
With the developments in digital technology and growth in take-up of different devices, there are now many more ways in which people can choose to communicate with one another. For example, Ofcom’s Communications Market Report 20122 highlighted the fact that smartphone ownership rose to 39% of UK adults in Q1 2012, up 12 percentage points on 2011. In the same period, 80% of UK households had home internet access.
This report provides an overview of the communication choices people make, depending on their attitudes to digital technology and the different circumstances in which they need to communicate.
2.2. Research methodology and analysis
We commissioned quantitative research in February 2012 to understand the communication choices people make on a daily and weekly basis. In total, 2,012 adults aged 16+ from across the UK were interviewed using a face-to-face omnibus with a nationally representative sample.
A summary of the findings of this research was published as part of the Communications Market Report 2012. This report provides additional analysis, focusing on five segments that have been identified, based on differences in attitudes and behaviours relating to communication preferences and technology take-up.
2.3. Segmentation overview
Segmentation involves the subdivision of a population into discrete groups sharing similar characteristics3. This particular segmentation used responses to questions about people’s use of communication methods, and their attitudes towards technology in relation to communicating with friends and families, and with businesses. See Annex 1 for the technical specification.
3.3.1 Frequency of communication and methods used
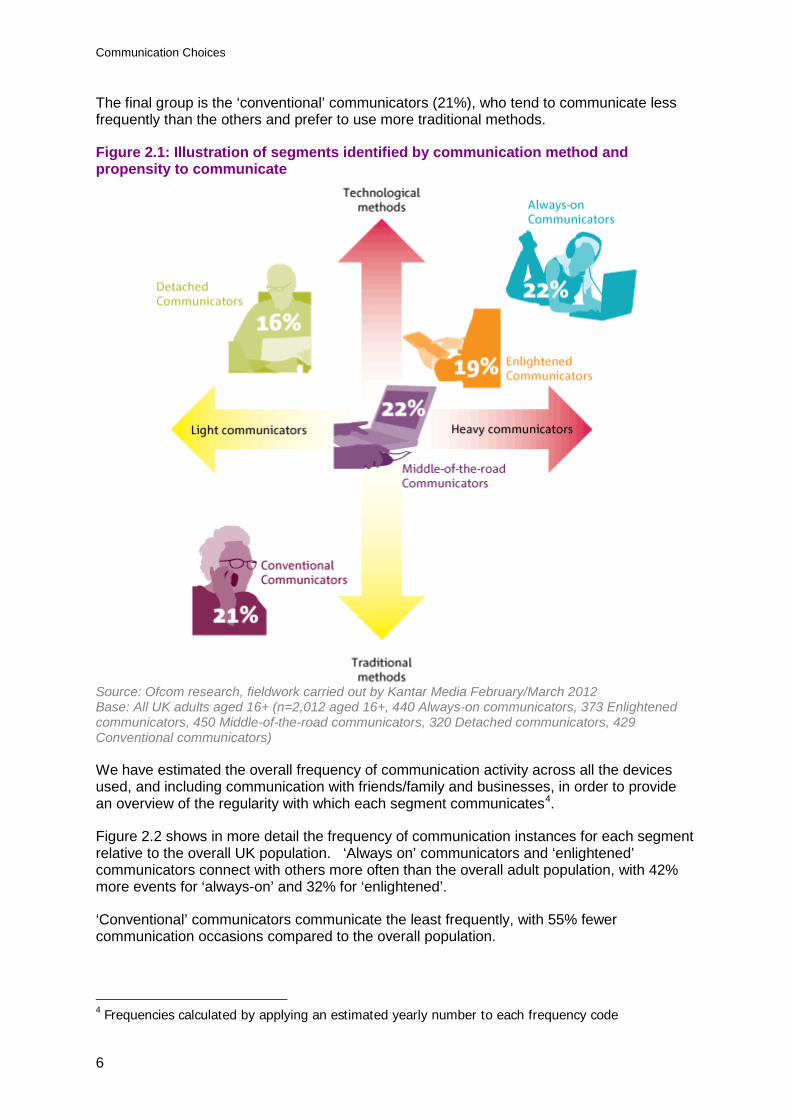
Figure 2.1 illustrates the five segments that were identified in relation to their use of communication, and which can broadly be defined by their frequency of communication and the extent to which they use new technological methods to communicate.
‘Always on’ communicators and ‘enlightened’ communicators account for just over two-fifths of the population (41%). These groups communicate with others on a regular basis and tend to use technological devices, although they differ in terms of their demographic composition.
‘Detached’ communicators and ‘middle-of-the-road’ communicators account for just under 40% of the population. Although both groups use new technologies they tend to communicate less frequently than the ‘always-on’ and ‘enlightened’ communicators.
2 Communications Market Report 2012: http://stakeholders.ofcom.org.uk/binaries/research/cmr/cmr12/UK_1.pdf 3 Segmentation performed using k-means cluster analysis
Communication Choices
6
The final group is the ‘conventional’ communicators (21%), who tend to communicate less frequently than the others and prefer to use more traditional methods.
Figure 2.1: Illustration of segments identified by communication method and propensity to communicate
Source: Ofcom research, fieldwork carried out by Kantar Media February/March 2012 Base: All UK adults aged 16+ (n=2,012 aged 16+, 440 Always-on communicators, 373 Enlightened communicators, 450 Middle-of-the-road communicators, 320 Detached communicators, 429 Conventional communicators)
We have estimated the overall frequency of communication activity across all the devices used, and including communication with friends/family and businesses, in order to provide an overview of the regularity with which each segment communicates4.
Figure 2.2 shows in more detail the frequency of communication instances for each segment relative to the overall UK population. ‘Always on’ communicators and ‘enlightened’ communicators connect with others more often than the overall adult population, with 42% more events for ‘always-on’ and 32% for ‘enlightened’.
‘Conventional’ communicators communicate the least frequently, with 55% fewer communication occasions compared to the overall population.
4 Frequencies calculated by applying an estimated yearly number to each frequency code

Communication Choices
7
Figure 2.2: Frequency of communication occasions for each segment compared to UK population
+42%
+32%
-6%
-55%
-15%
-60%
-40%
-20%
0%
20%
40%
60%
Always on communicators
Enlightened communicators
Middle-of-the-road communicators
Conventional communicators
Detached communicators
% of communication events compared to UK population
Source: Ofcom research, 2012 Base: All UK adults (n=2,012 aged 16+, 440 Always-on communicators, 373 Enlightened communicators, 450 Middle-of-the-road communicators, 320 Detached communicators, 429 Conventional communicators)
3.3.2 Communication devices/services used
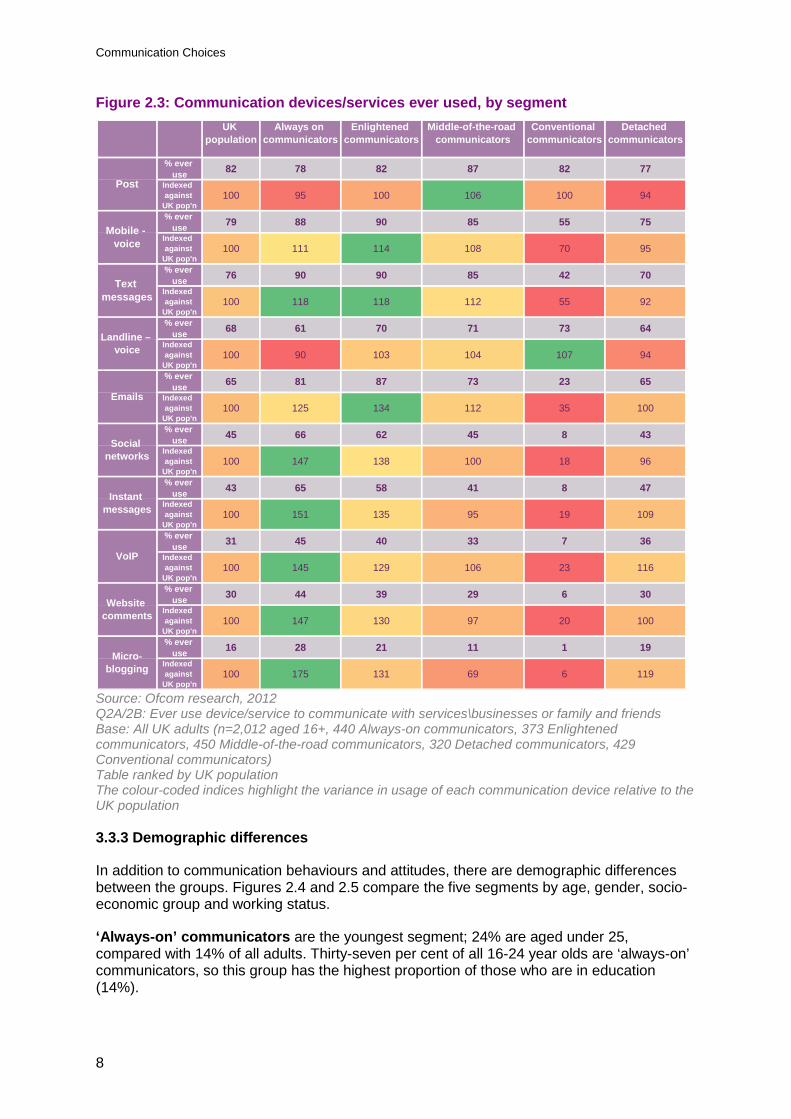
For all respondents, regardless of segment, face-to-face is the most used form of communication in terms of ‘ever used’; whether to stay in touch with family and friends or communicate with businesses. Figure 2.3 shows the level of use of communication devices and services by each segment and how each compares to the overall population.
For ‘always-on’ communicators and ‘enlightened’ communicators, text messaging is the most-used method; 90% of each of these segments claim to have ‘ever’ used this way of communicating, despite being ranked third overall, at 76% of all adults.
Landline calls are used most by ‘conventional’ communicators: 73% compared to 68% of all adults. This group is the least likely to use any computer-based form of communication.
‘Detached’ communicators are less likely than the overall population to use mobile (75%) or landline voice calls (64%), but are more likely to use quick-form text-based methods such as micro-blogging (like Twitter) (19%) or instant messaging (47%).
‘Middle-of-the-road’ communicators are more likely than the overall population to use both traditional and relatively well-established technological methods of communication. For example, 85% use text and a similar proportion make mobile phone calls, while 73% email.
Communication Choices
8
Figure 2.3: Communication devices/services ever used, by segment UK
populationAlways on
communicators Enlightened
communicators Middle-of-the-road
communicators Conventional
communicators Detached
communicators
% ever use 82 78 82 87 82 77
Indexed against
UK pop'n 100 95 100 106 100 94
% ever use 79 88 90 85 55 75
Indexed against
UK pop'n 100 111 114 108 70 95
% ever use 76 90 90 85 42 70
Indexed against
UK pop'n 100 118 118 112 55 92
% ever use 68 61 70 71 73 64
Indexed against
UK pop'n 100 90 103 104 107 94
% ever use 65 81 87 73 23 65
Indexed against
UK pop'n 100 125 134 112 35 100
% ever use 45 66 62 45 8 43
Indexed against
UK pop'n 100 147 138 100 18 96
% ever use 43 65 58 41 8 47
Indexed against
UK pop'n 100 151 135 95 19 109
% ever use 31 45 40 33 7 36
Indexed against
UK pop'n 100 145 129 106 23 116
% ever use 30 44 39 29 6 30
Indexed against
UK pop'n 100 147 130 97 20 100
% ever use 16 28 21 11 1 19
Indexed against
UK pop'n 100 175 131 69 6 119
Emails
Social networks
Instant messages
VoIP
Website comments
Micro-blogging
Post
Mobile - voice
Text messages
Landline – voice
Source: Ofcom research, 2012 Q2A/2B: Ever use device/service to communicate with services\businesses or family and friends Base: All UK adults (n=2,012 aged 16+, 440 Always-on communicators, 373 Enlightened communicators, 450 Middle-of-the-road communicators, 320 Detached communicators, 429 Conventional communicators) Table ranked by UK population The colour-coded indices highlight the variance in usage of each communication device relative to the UK population
3.3.3 Demographic differences
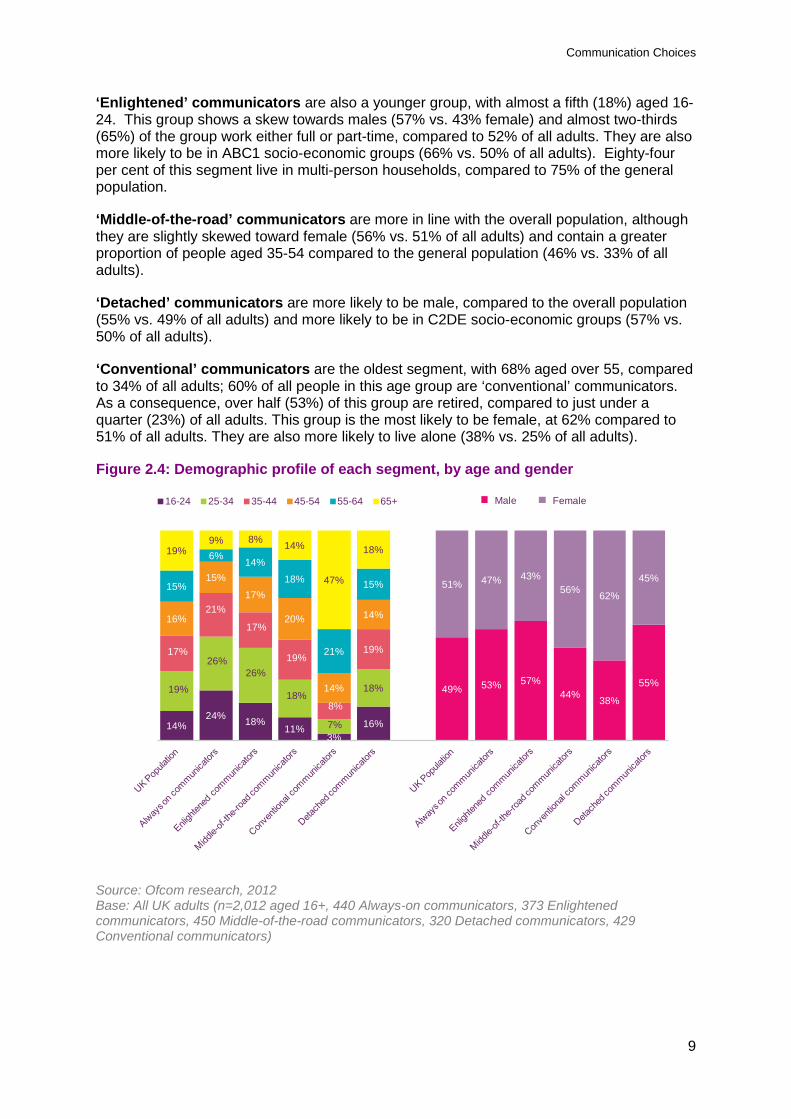
In addition to communication behaviours and attitudes, there are demographic differences between the groups. Figures 2.4 and 2.5 compare the five segments by age, gender, socio-economic group and working status.
‘Always-on’ communicators are the youngest segment; 24% are aged under 25, compared with 14% of all adults. Thirty-seven per cent of all 16-24 year olds are ‘always-on’ communicators, so this group has the highest proportion of those who are in education (14%).
Communication Choices
9
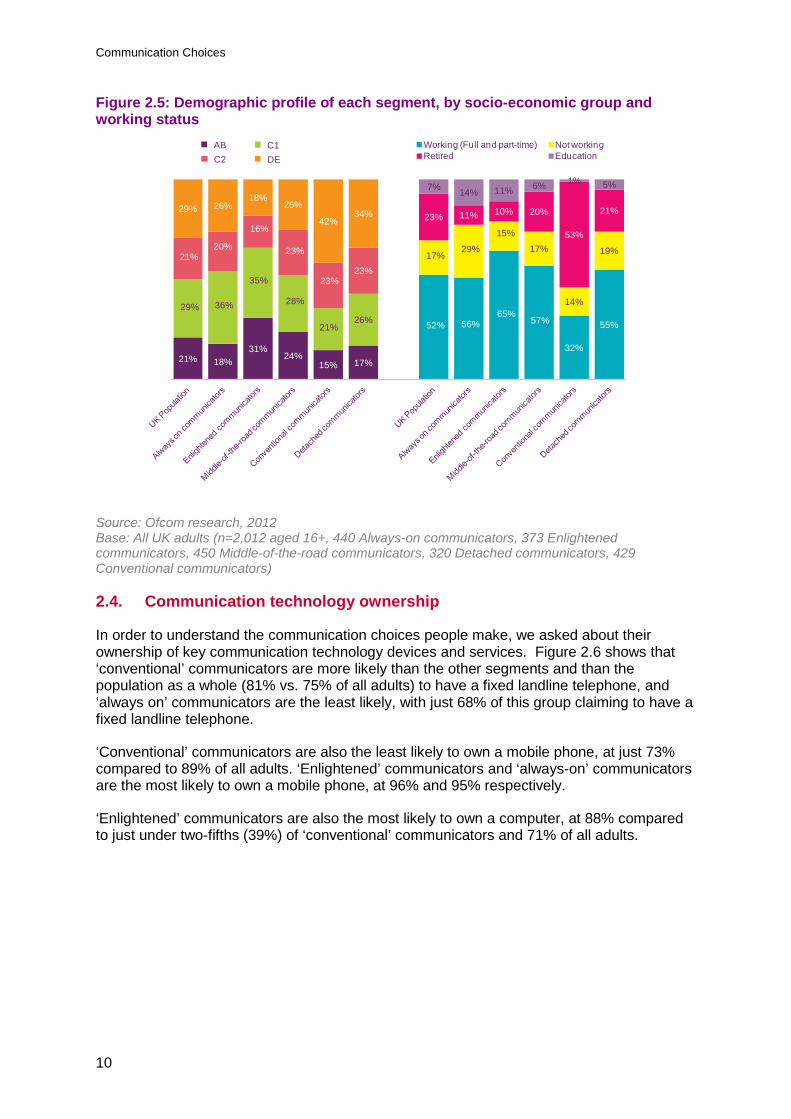
‘Enlightened’ communicators are also a younger group, with almost a fifth (18%) aged 16-24. This group shows a skew towards males (57% vs. 43% female) and almost two-thirds (65%) of the group work either full or part-time, compared to 52% of all adults. They are also more likely to be in ABC1 socio-economic groups (66% vs. 50% of all adults). Eighty-four per cent of this segment live in multi-person households, compared to 75% of the general population.
‘Middle-of-the-road’ communicators are more in line with the overall population, although they are slightly skewed toward female (56% vs. 51% of all adults) and contain a greater proportion of people aged 35-54 compared to the general population (46% vs. 33% of all adults).
‘Detached’ communicators are more likely to be male, compared to the overall population (55% vs. 49% of all adults) and more likely to be in C2DE socio-economic groups (57% vs. 50% of all adults).
‘Conventional’ communicators are the oldest segment, with 68% aged over 55, compared to 34% of all adults; 60% of all people in this age group are ‘conventional’ communicators. As a consequence, over half (53%) of this group are retired, compared to just under a quarter (23%) of all adults. This group is the most likely to be female, at 62% compared to 51% of all adults. They are also more likely to live alone (38% vs. 25% of all adults).
Figure 2.4: Demographic profile of each segment, by age and gender
14%24% 18%
11%3%
16%
19%
26%26%
18%
7%
18%
17%
21%
17%
19%
8%
19%
16%
15%
17%
20%
14%
14%
15%
6% 14%
18%
21%
15%
19%9% 8% 14%
47%
18%
49% 53% 57%44% 38%
55%
51% 47% 43%56% 62%
45%
16-24 25-34 35-44 45-54 55-64 65+ Male Female
Source: Ofcom research, 2012 Base: All UK adults (n=2,012 aged 16+, 440 Always-on communicators, 373 Enlightened communicators, 450 Middle-of-the-road communicators, 320 Detached communicators, 429 Conventional communicators)
Communication Choices
10
Figure 2.5: Demographic profile of each segment, by socio-economic group and working status
21% 18%31%
24%15% 17%
29% 36%
35%
28%
21%26%
21%20%
16%
23%
23%23%
29% 26%18%
25%
42%34%
52% 56%65%
57%
32%
55%
17%29%
15%
17%
14%
19%
23% 11% 10% 20%
53%
21%
7% 14% 11% 6% 1% 5%
Working (Full and part-time) Not workingRetired Education
AB C1C2 DE
Source: Ofcom research, 2012 Base: All UK adults (n=2,012 aged 16+, 440 Always-on communicators, 373 Enlightened communicators, 450 Middle-of-the-road communicators, 320 Detached communicators, 429 Conventional communicators)
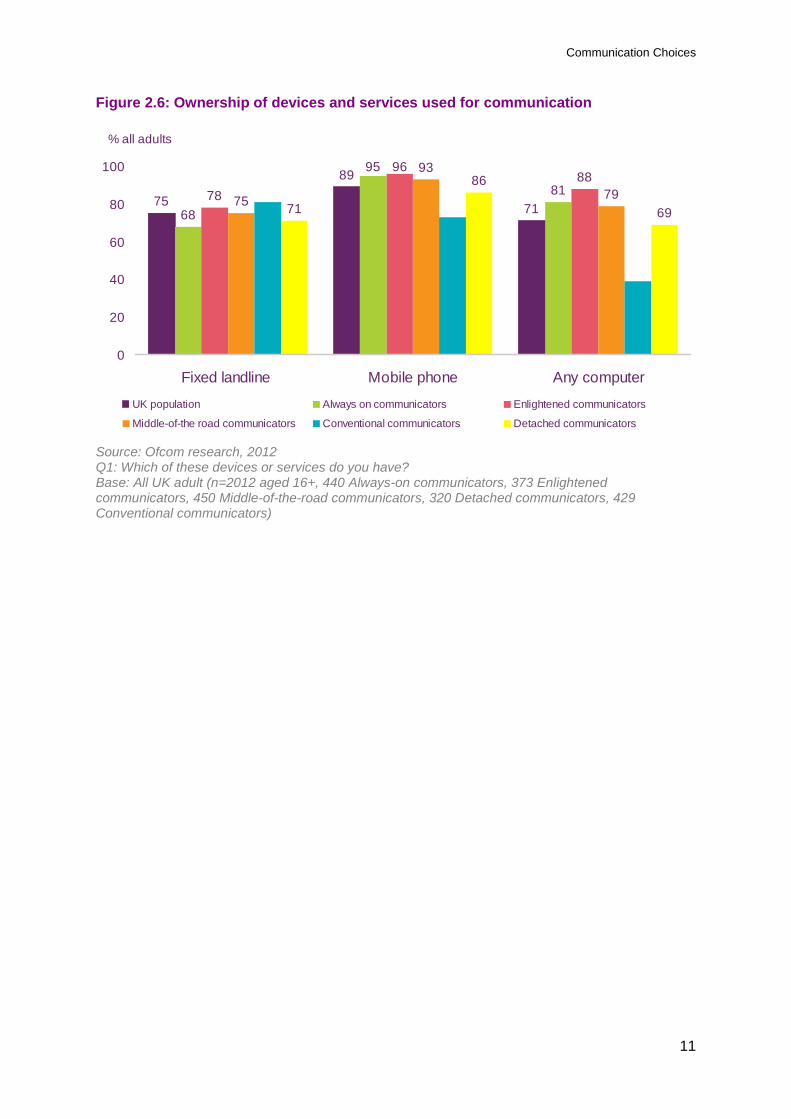
2.4. Communication technology ownership
In order to understand the communication choices people make, we asked about their ownership of key communication technology devices and services. Figure 2.6 shows that ‘conventional’ communicators are more likely than the other segments and than the population as a whole (81% vs. 75% of all adults) to have a fixed landline telephone, and ‘always on’ communicators are the least likely, with just 68% of this group claiming to have a fixed landline telephone.
‘Conventional’ communicators are also the least likely to own a mobile phone, at just 73% compared to 89% of all adults. ‘Enlightened’ communicators and ‘always-on’ communicators are the most likely to own a mobile phone, at 96% and 95% respectively.
‘Enlightened’ communicators are also the most likely to own a computer, at 88% compared to just under two-fifths (39%) of ‘conventional’ communicators and 71% of all adults.
Communication Choices
11
Figure 2.6: Ownership of devices and services used for communication
75
89
7168
95
8178
9688
75
93
7971
86
69
0
20
40
60
80
100
Fixed landline Mobile phone Any computer
UK population Always on communicators Enlightened communicators
Middle-of-the road communicators Conventional communicators Detached communicators
% all adults
Source: Ofcom research, 2012 Q1: Which of these devices or services do you have? Base: All UK adult (n=2012 aged 16+, 440 Always-on communicators, 373 Enlightened communicators, 450 Middle-of-the-road communicators, 320 Detached communicators, 429 Conventional communicators)
Communication Choices
12
Section 3
2 Communicating with friends and family 3.1. Introduction
There are a number of different ways in which people can choose to communicate with others, including meeting face-to-face, calling on the telephone (landline or mobile), sending a text message or an email, other internet means, and the postal service. In order to understand whether communication choices are influenced by circumstances, we asked people about their communication choices for friends and family as well as with businesses and services.
This section focuses on how the segments compare in their communication choices for friends and family, and Section 4 considers communication with businesses and services.
3.2. Preferred methods of communication with friends and family
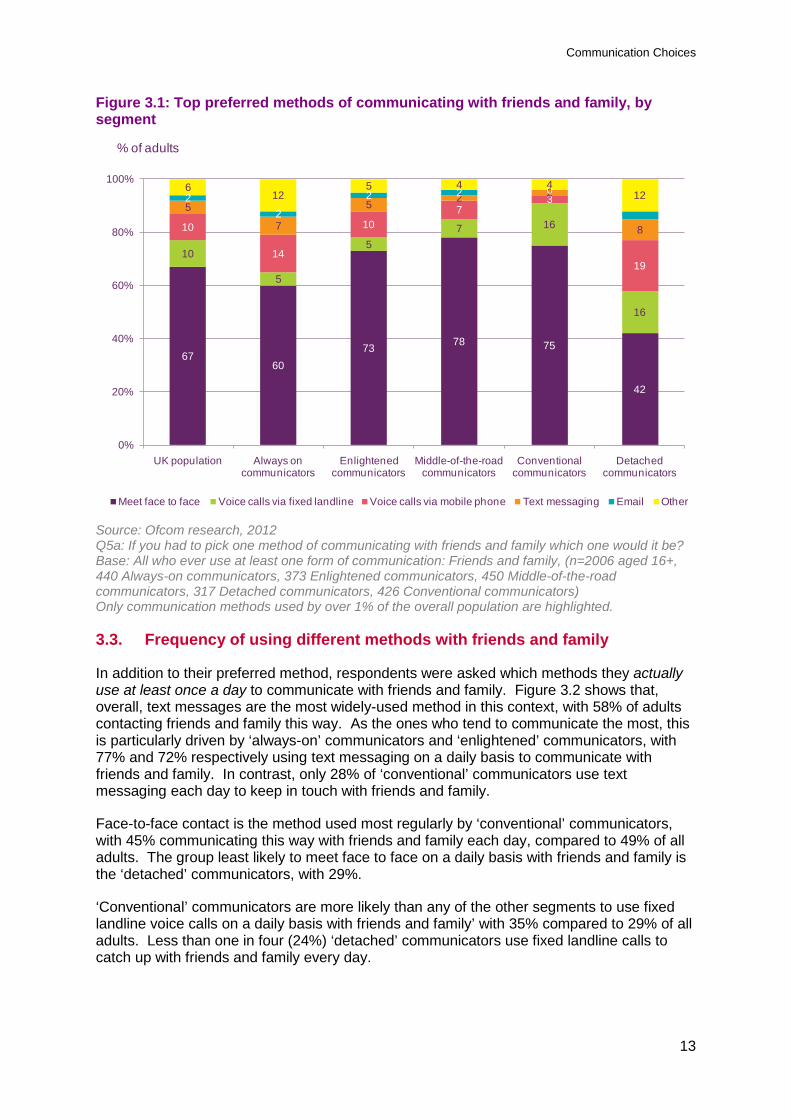
When asked to pick just one way of communicating with friends and family, meeting face-to-face is by far the most preferred, with two-thirds (67%) of adults choosing this method., Detached communicators are the least likely to choose face-to-face meetings, at 42% compared to 78% of ‘middle-of-the-road’ communicators, who are the most likely to prefer this form of communication with friends and family.
‘Detached’ communicators are the most likely to choose voice calls on mobiles, with almost a fifth (19%) selecting this as their preferred method in this context, compared to 10% of all adults and just 3% of ‘conventional’ communicators.
‘Detached’ communicators and ‘conventional’ communicators are the segments most likely to choose to call friends and family via a fixed landline telephone, with 16% of each group choosing this option (if they could pick only one). This compares to one in ten (10%) of all adults and just 5% of ‘enlightened’ communicators and ‘always-on’ communicators.
Communication Choices
13
Figure 3.1: Top preferred methods of communicating with friends and family, by segment
6760
73 78 75
42
10
5
57 16
16
10
14
107
3
19
5
7
5 2 2
8
22
2 2 0612
5 4 412
0%
20%
40%
60%
80%
100%
UK population Always on communicators
Enlightened communicators
Middle-of-the-road communicators
Conventional communicators
Detached communicators
Meet face to face Voice calls via fixed landline Voice calls via mobile phone Text messaging Email Other
% of adults
Source: Ofcom research, 2012 Q5a: If you had to pick one method of communicating with friends and family which one would it be? Base: All who ever use at least one form of communication: Friends and family, (n=2006 aged 16+, 440 Always-on communicators, 373 Enlightened communicators, 450 Middle-of-the-road communicators, 317 Detached communicators, 426 Conventional communicators) Only communication methods used by over 1% of the overall population are highlighted.
3.3. Frequency of using different methods with friends and family
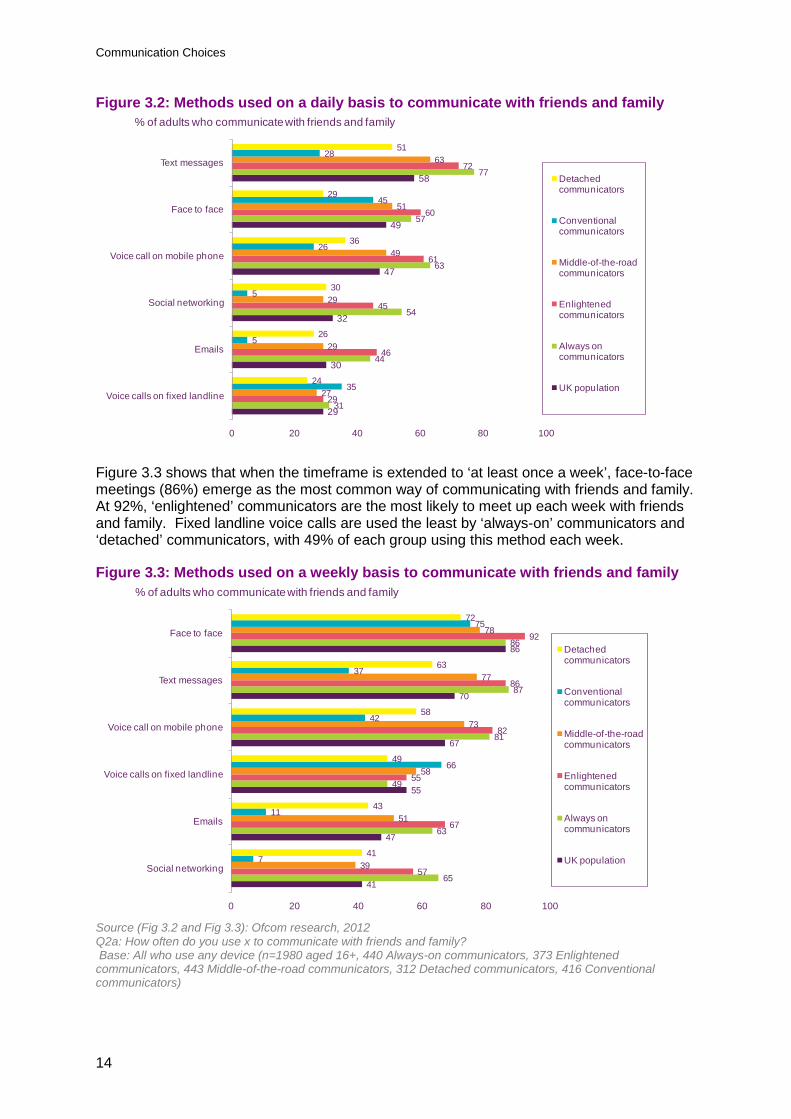
In addition to their preferred method, respondents were asked which methods they actually use at least once a day to communicate with friends and family. Figure 3.2 shows that, overall, text messages are the most widely-used method in this context, with 58% of adults contacting friends and family this way. As the ones who tend to communicate the most, this is particularly driven by ‘always-on’ communicators and ‘enlightened’ communicators, with 77% and 72% respectively using text messaging on a daily basis to communicate with friends and family. In contrast, only 28% of ‘conventional’ communicators use text messaging each day to keep in touch with friends and family.
Face-to-face contact is the method used most regularly by ‘conventional’ communicators, with 45% communicating this way with friends and family each day, compared to 49% of all adults. The group least likely to meet face to face on a daily basis with friends and family is the ‘detached’ communicators, with 29%.
‘Conventional’ communicators are more likely than any of the other segments to use fixed landline voice calls on a daily basis with friends and family’ with 35% compared to 29% of all adults. Less than one in four (24%) ‘detached’ communicators use fixed landline calls to catch up with friends and family every day.
Communication Choices
14
Figure 3.2: Methods used on a daily basis to communicate with friends and family
29
30
32
47
49
58
31
44
54
63
57
77
29
46
45
61
60
72
27
29
29
49
51
63
35
5
5
26
45
28
24
26
30
36
29
51
0 20 40 60 80 100
Voice calls on fixed landline
Emails
Social networking
Voice call on mobile phone
Face to face
Text messages
Detached communicators
Conventional communicators
Middle-of-the-road communicators
Enlightened communicators
Always on communicators
UK population
% of adults who communicate with friends and family
Figure 3.3 shows that when the timeframe is extended to ‘at least once a week’, face-to-face meetings (86%) emerge as the most common way of communicating with friends and family. At 92%, ‘enlightened’ communicators are the most likely to meet up each week with friends and family. Fixed landline voice calls are used the least by ‘always-on’ communicators and ‘detached’ communicators, with 49% of each group using this method each week.
Figure 3.3: Methods used on a weekly basis to communicate with friends and family
41
47
55
67
70
86
65
63
49
81
87
86
57
67
55
82
86
92
39
51
58
73
77
78
7
11
66
42
37
75
41
43
49
58
63
72
0 20 40 60 80 100
Social networking
Emails
Voice calls on fixed landline
Voice call on mobile phone
Text messages
Face to face
Detached communicators
Conventional communicators
Middle-of-the-road communicators
Enlightened communicators
Always on communicators
UK population
% of adults who communicate with friends and family
Source (Fig 3.2 and Fig 3.3): Ofcom research, 2012 Q2a: How often do you use x to communicate with friends and family? Base: All who use any device (n=1980 aged 16+, 440 Always-on communicators, 373 Enlightened communicators, 443 Middle-of-the-road communicators, 312 Detached communicators, 416 Conventional communicators)
Communication Choices
15
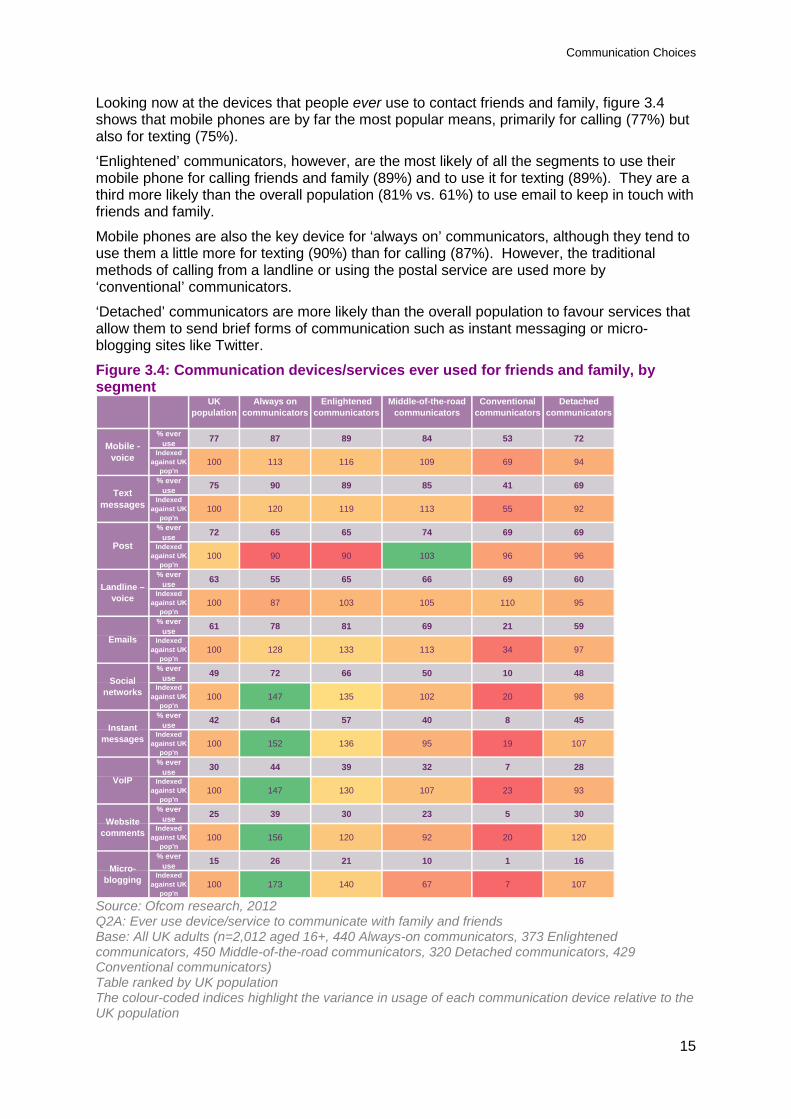
Looking now at the devices that people ever use to contact friends and family, figure 3.4 shows that mobile phones are by far the most popular means, primarily for calling (77%) but also for texting (75%).
‘Enlightened’ communicators, however, are the most likely of all the segments to use their mobile phone for calling friends and family (89%) and to use it for texting (89%). They are a third more likely than the overall population (81% vs. 61%) to use email to keep in touch with friends and family.
Mobile phones are also the key device for ‘always on’ communicators, although they tend to use them a little more for texting (90%) than for calling (87%). However, the traditional methods of calling from a landline or using the postal service are used more by ‘conventional’ communicators.
‘Detached’ communicators are more likely than the overall population to favour services that allow them to send brief forms of communication such as instant messaging or micro-blogging sites like Twitter.
Figure 3.4: Communication devices/services ever used for friends and family, by segment
UK population
Always on communicators
Enlightened communicators
Middle-of-the-road communicators
Conventional communicators
Detached communicators
% ever use 77 87 89 84 53 72
Indexed against UK
pop'n 100 113 116 109 69 94
% ever use 75 90 89 85 41 69
Indexed against UK
pop'n 100 120 119 113 55 92
% ever use 72 65 65 74 69 69
Indexed against UK
pop'n 100 90 90 103 96 96
% ever use 63 55 65 66 69 60
Indexed against UK
pop'n 100 87 103 105 110 95
% ever use 61 78 81 69 21 59
Indexed against UK
pop'n 100 128 133 113 34 97
% ever use 49 72 66 50 10 48
Indexed against UK
pop'n 100 147 135 102 20 98
% ever use 42 64 57 40 8 45
Indexed against UK
pop'n 100 152 136 95 19 107
% ever use 30 44 39 32 7 28
Indexed against UK
pop'n 100 147 130 107 23 93
% ever use 25 39 30 23 5 30
Indexed against UK
pop'n 100 156 120 92 20 120
% ever use 15 26 21 10 1 16
Indexed against UK
pop'n 100 173 140 67 7 107
Instant messages
VoIP
Website comments
Micro-blogging
Post
Mobile - voice
Text messages
Landline – voice
Emails
Social networks
Source: Ofcom research, 2012 Q2A: Ever use device/service to communicate with family and friends Base: All UK adults (n=2,012 aged 16+, 440 Always-on communicators, 373 Enlightened communicators, 450 Middle-of-the-road communicators, 320 Detached communicators, 429 Conventional communicators) Table ranked by UK population The colour-coded indices highlight the variance in usage of each communication device relative to the UK population
Communication Choices
16
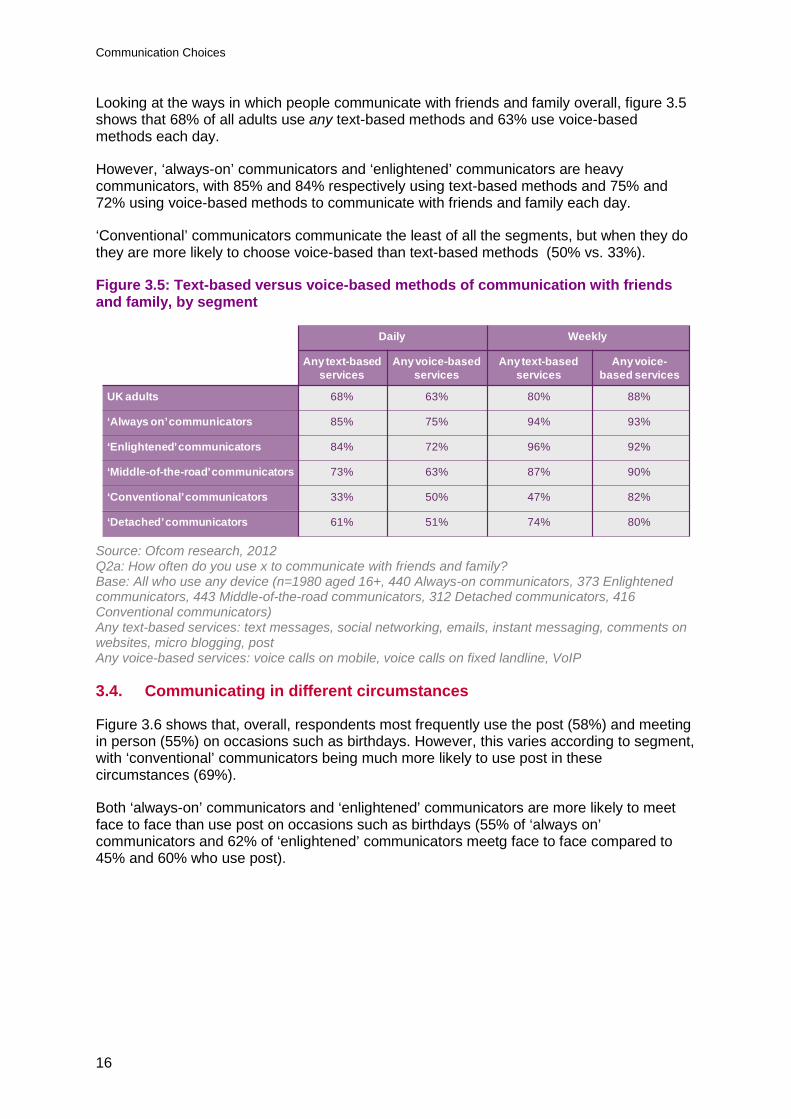
Looking at the ways in which people communicate with friends and family overall, figure 3.5 shows that 68% of all adults use any text-based methods and 63% use voice-based methods each day.
However, ‘always-on’ communicators and ‘enlightened’ communicators are heavy communicators, with 85% and 84% respectively using text-based methods and 75% and 72% using voice-based methods to communicate with friends and family each day.
‘Conventional’ communicators communicate the least of all the segments, but when they do they are more likely to choose voice-based than text-based methods (50% vs. 33%).
Figure 3.5: Text-based versus voice-based methods of communication with friends and family, by segment
Daily Weekly
Any text-based services
Any voice-based services
Any text-based services
Any voice-based services
UK adults 68% 63% 80% 88%
‘Always on’ communicators 85% 75% 94% 93%
‘Enlightened’ communicators 84% 72% 96% 92%
‘Middle-of-the-road’ communicators 73% 63% 87% 90%
‘Conventional’ communicators 33% 50% 47% 82%
‘Detached’ communicators 61% 51% 74% 80%
Source: Ofcom research, 2012 Q2a: How often do you use x to communicate with friends and family? Base: All who use any device (n=1980 aged 16+, 440 Always-on communicators, 373 Enlightened communicators, 443 Middle-of-the-road communicators, 312 Detached communicators, 416 Conventional communicators) Any text-based services: text messages, social networking, emails, instant messaging, comments on websites, micro blogging, post Any voice-based services: voice calls on mobile, voice calls on fixed landline, VoIP
3.4. Communicating in different circumstances
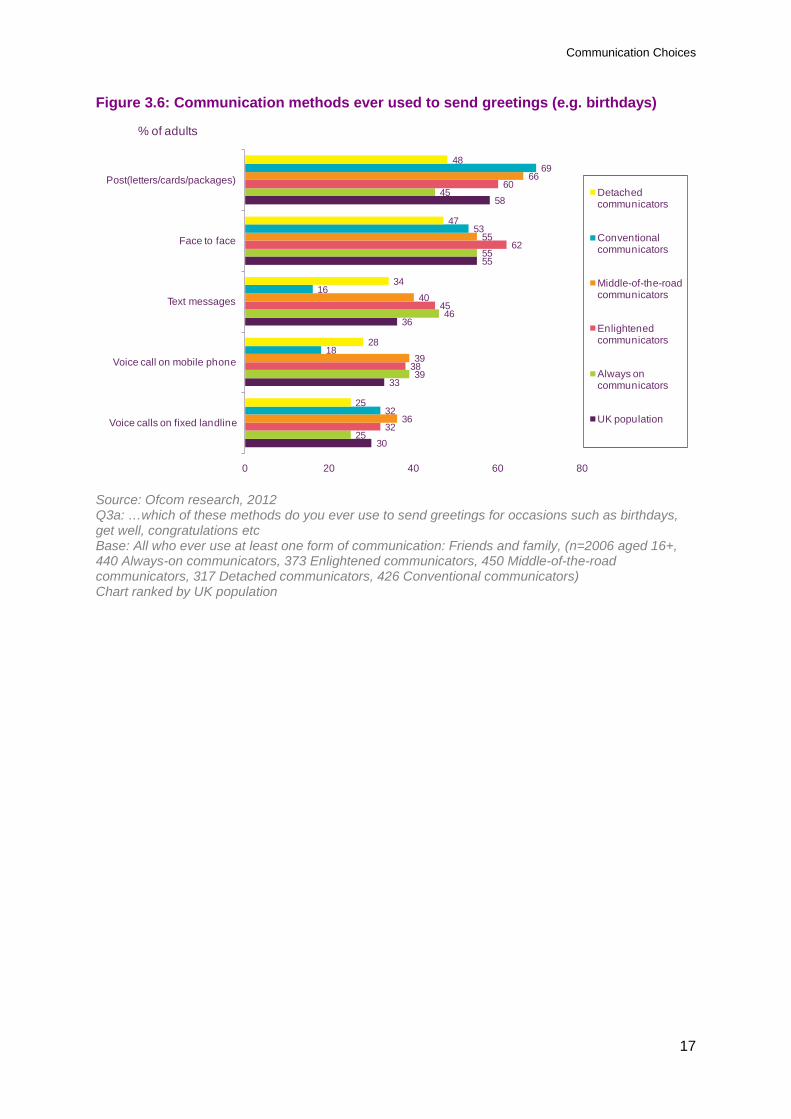
Figure 3.6 shows that, overall, respondents most frequently use the post (58%) and meeting in person (55%) on occasions such as birthdays. However, this varies according to segment, with ‘conventional’ communicators being much more likely to use post in these circumstances (69%).
Both ‘always-on’ communicators and ‘enlightened’ communicators are more likely to meet face to face than use post on occasions such as birthdays (55% of ‘always on’ communicators and 62% of ‘enlightened’ communicators meetg face to face compared to 45% and 60% who use post).
Communication Choices
17
Figure 3.6: Communication methods ever used to send greetings (e.g. birthdays)
30
33
36
55
58
25
39
46
55
45
32
38
45
62
60
36
39
40
55
66
32
18
16
53
69
25
28
34
47
48
0 20 40 60 80
Voice calls on fixed landline
Voice call on mobile phone
Text messages
Face to face
Post(letters/cards/packages)Detached communicators
Conventional communicators
Middle-of-the-road communicators
Enlightened communicators
Always on communicators
UK population
% of adults
Source: Ofcom research, 2012 Q3a: …which of these methods do you ever use to send greetings for occasions such as birthdays, get well, congratulations etc Base: All who ever use at least one form of communication: Friends and family, (n=2006 aged 16+, 440 Always-on communicators, 373 Enlightened communicators, 450 Middle-of-the-road communicators, 317 Detached communicators, 426 Conventional communicators) Chart ranked by UK population
Communication Choices
18
Section 4
3 Communicating with businesses 4.1. Introduction
In addition to exploring the communication choices people make with friends and family, we considered how their choices differ when communicating with businesses and services. This includes occasions when people are looking to make a purchase, following up on something already purchased, contacting utilities companies, or contacting banks, or local authorities. This section will compare the segments’ communication choices with these businesses and services.
4.2. Frequency of using different methods with businesses and services
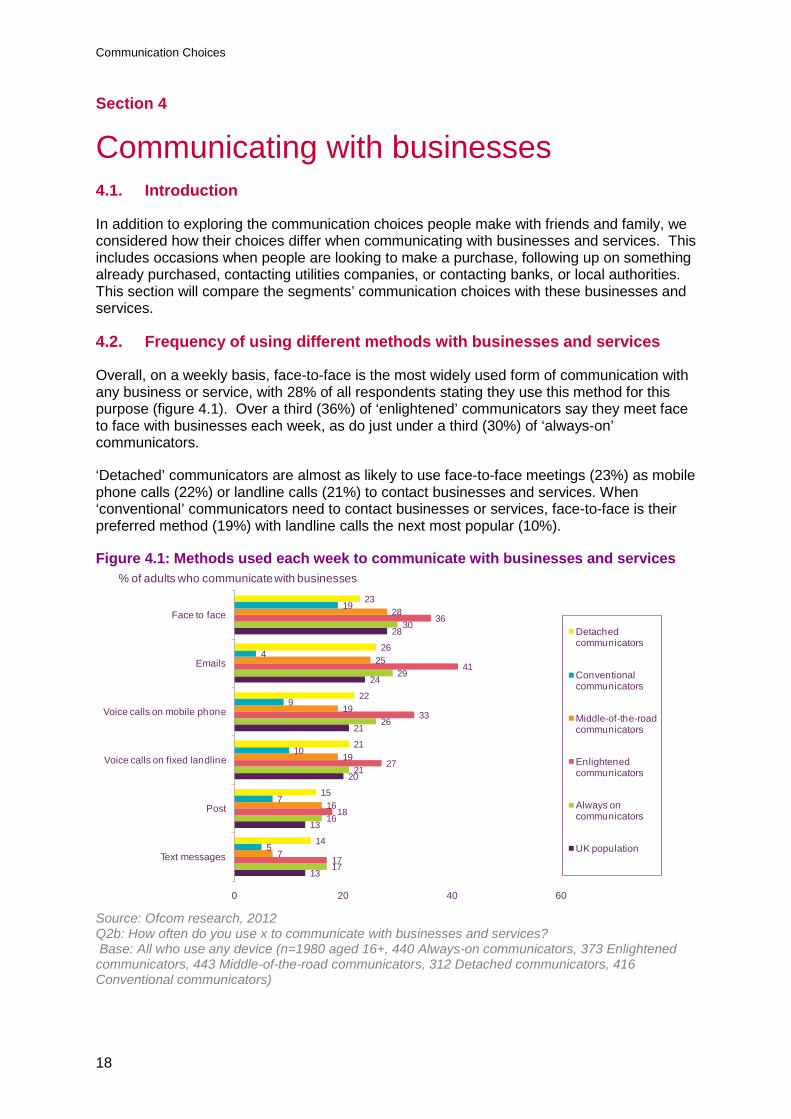
Overall, on a weekly basis, face-to-face is the most widely used form of communication with any business or service, with 28% of all respondents stating they use this method for this purpose (figure 4.1). Over a third (36%) of ‘enlightened’ communicators say they meet face to face with businesses each week, as do just under a third (30%) of ‘always-on’ communicators.
‘Detached’ communicators are almost as likely to use face-to-face meetings (23%) as mobile phone calls (22%) or landline calls (21%) to contact businesses and services. When ‘conventional’ communicators need to contact businesses or services, face-to-face is their preferred method (19%) with landline calls the next most popular (10%).
Figure 4.1: Methods used each week to communicate with businesses and services
13
13
20
21
24
28
17
16
21
26
29
30
17
18
27
33
41
36
7
16
19
19
25
28
5
7
10
9
4
19
14
15
21
22
26
23
0 20 40 60
Text messages
Post
Voice calls on fixed landline
Voice calls on mobile phone
Emails
Face to face
Detached communicators
Conventional communicators
Middle-of-the-road communicators
Enlightened communicators
Always on communicators
UK population
% of adults who communicate with businesses
Source: Ofcom research, 2012 Q2b: How often do you use x to communicate with businesses and services? Base: All who use any device (n=1980 aged 16+, 440 Always-on communicators, 373 Enlightened communicators, 443 Middle-of-the-road communicators, 312 Detached communicators, 416 Conventional communicators)

Communication Choices
19
4.3. Preferred ways to communicate with businesses and services
When respondents are asked to choose their preferred method if they can have only one way to communicate with businesses and services, almost a third (32%) of adults choose voice calls via a fixed landline (figure 4.1). ‘Conventional’ communicators are the most likely to choose landline calls and ‘enlightened’ communicators are the least likely to opt for this method (45% vs. 22%).
‘Enlightened’ communicators are much more likely to choose to meet businesses and services face-to-face than using any other communication method (29%). They are also more likely than the general population to choose email over any other method (22% vs. 15%).
‘Always on’ communicators are nearly three times as likely as ‘conventional’ communicators to choose calling on a mobile (19% vs. 7%)
Figure 4.2: Preferred method to communicate with businesses and services
% of adults who communicate with businesses
3224 22
3645
32
2524 29
2724
20
1519
2214 4
17
13 1915 12
7 12
6 4 5 69 7
9 10 7 5 11 12
0
20
40
60
80
100Other
Post (letters/cards/packages)
Voice calls on mobile
Emails
Meet face to face
Voice calls via fixed landline
Source: Ofcom research, 2012 Q5b: If you had to pick one method of communicating with businesses and services which one would it be? Base: All who ever use at least one form of communication with business/services, (n=1710 aged 16+, 372 Always-on communicators, 330 Enlightened communicators, 409 Middle-of-the-road communicators, 255 Detached communicators, 343 Conventional communicators)
4.4. Communicating with different types of business and service
We asked respondents to consider the different types of businesses and services they communicate with, to understand their communication choices according to the circumstances. We can compare differences between the segments by looking at the choices they make to communicate with banks and with utility services.
To illustrate these differences, Figure 4.3 shows how respondents prefer to contact their bank, compared to utility companies.
Communication Choices
20
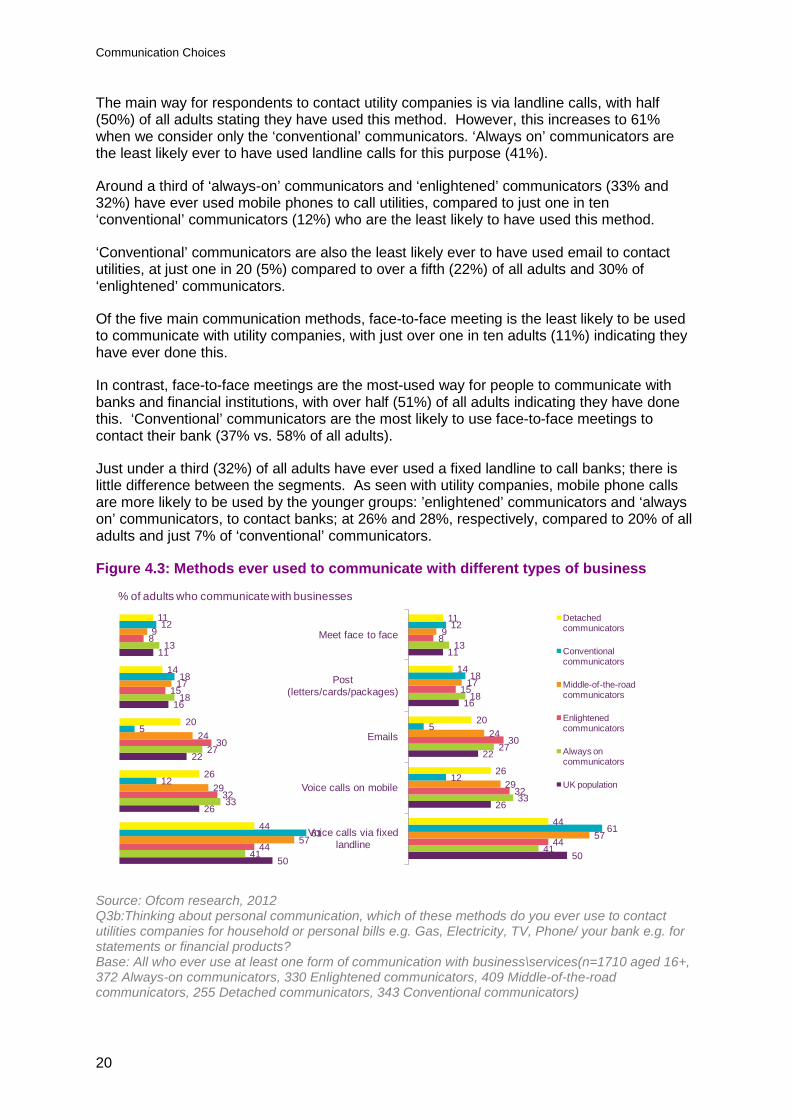
The main way for respondents to contact utility companies is via landline calls, with half (50%) of all adults stating they have used this method. However, this increases to 61% when we consider only the ‘conventional’ communicators. ‘Always on’ communicators are the least likely ever to have used landline calls for this purpose (41%).
Around a third of ‘always-on’ communicators and ‘enlightened’ communicators (33% and 32%) have ever used mobile phones to call utilities, compared to just one in ten ‘conventional’ communicators (12%) who are the least likely to have used this method.
‘Conventional’ communicators are also the least likely ever to have used email to contact utilities, at just one in 20 (5%) compared to over a fifth (22%) of all adults and 30% of ‘enlightened’ communicators.
Of the five main communication methods, face-to-face meeting is the least likely to be used to communicate with utility companies, with just over one in ten adults (11%) indicating they have ever done this.
In contrast, face-to-face meetings are the most-used way for people to communicate with banks and financial institutions, with over half (51%) of all adults indicating they have done this. ‘Conventional’ communicators are the most likely to use face-to-face meetings to contact their bank (37% vs. 58% of all adults).
Just under a third (32%) of all adults have ever used a fixed landline to call banks; there is little difference between the segments. As seen with utility companies, mobile phone calls are more likely to be used by the younger groups: ’enlightened’ communicators and ‘always on’ communicators, to contact banks; at 26% and 28%, respectively, compared to 20% of all adults and just 7% of ‘conventional’ communicators.
Figure 4.3: Methods ever used to communicate with different types of business
% of adults who communicate with businesses
50
26
22
16
11
41
33
27
18
13
44
32
30
15
8
57
29
24
17
9
61
12
5
18
12
44
26
20
14
11
50
26
22
16
11
41
33
27
18
13
44
32
30
15
8
57
29
24
17
9
61
12
5
18
12
44
26
20
14
11
Voice calls via fixed landline
Voice calls on mobile
Emails
Post (letters/cards/packages)
Meet face to face
Detached communicators
Conventional communicators
Middle-of-the-road communicators
Enlightened communicators
Always on communicators
UK population
Source: Ofcom research, 2012 Q3b:Thinking about personal communication, which of these methods do you ever use to contact utilities companies for household or personal bills e.g. Gas, Electricity, TV, Phone/ your bank e.g. for statements or financial products? Base: All who ever use at least one form of communication with business\services(n=1710 aged 16+, 372 Always-on communicators, 330 Enlightened communicators, 409 Middle-of-the-road communicators, 255 Detached communicators, 343 Conventional communicators)
Communication Choices
21
Section 5
4 Attitudes to communication methods 5.1. Introduction
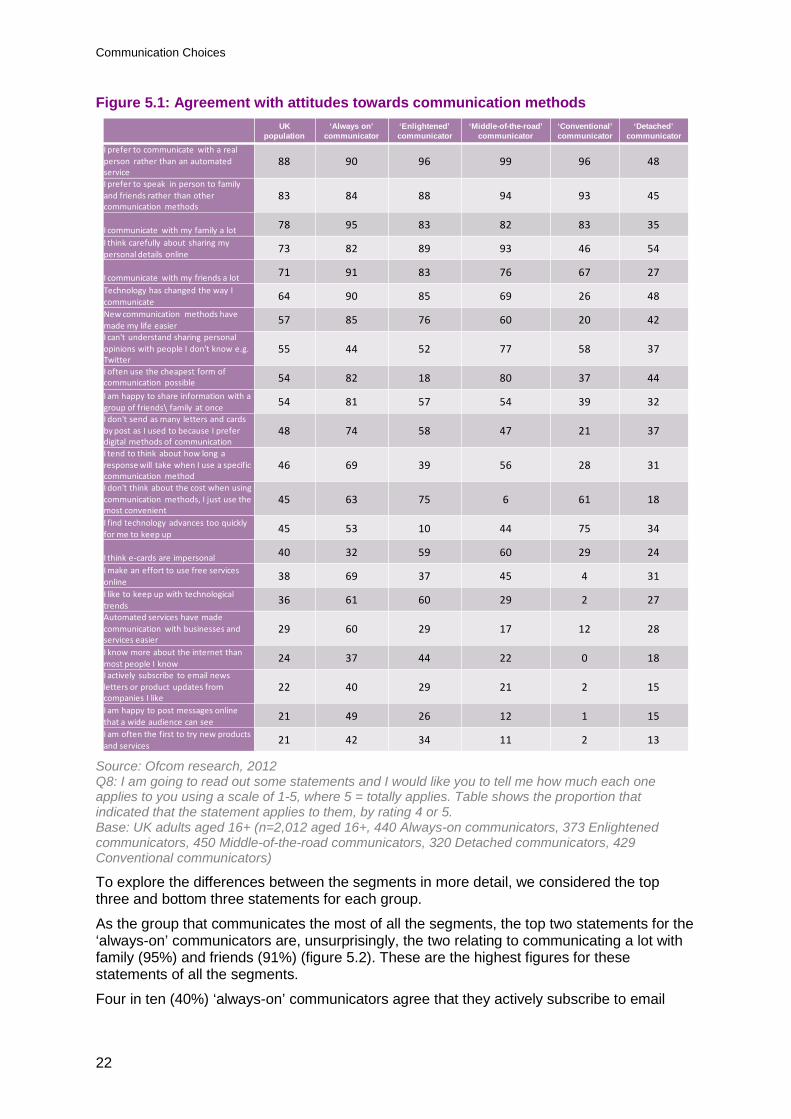
Interviewees were asked about their attitudes to various methods of communication. A series of statements were read out, and respondents were asked to indicate the extent to which the statement applied to them, using a 1 to 5 scale. The variation in response to these attitudinal statements enabled us to identify the five different segment types.
5.2. Attitudes to modern / digital communication methods
Considering first the responses from the whole sample, almost nine in ten (88%) respondents indicated that they preferred to speak to a real person rather than an automated service, and more than eight in ten (83%) said that they prefer to speak to family and friends face to face.
Around two-thirds (64%) stated that technology had changed the way they communicate, while almost six in ten (57%) claimed that new communication methods had made their lives easier. Over three-quarters of people (78%) agreed that they communicated with their family a lot, and slightly fewer (71%) agreed that they communicated with their friends a lot.
Therefore, the results show an overall preference for communicating face to face, although text-based communications are used more often on a daily basis.
Communication Choices
22
Figure 5.1: Agreement with attitudes towards communication methods UK
population‘Always on’
communicator‘Enlightened’ communicator
‘Middle-of-the-road’communicator
‘Conventional’ communicator
‘Detached’ communicator
I prefer to communicate with a real person rather than an automated service
88 90 96 99 96 48
I prefer to speak in person to family and friends rather than other communication methods
83 84 88 94 93 45
I communicate with my family a lot 78 95 83 82 83 35I think carefully about sharing my personal details online 73 82 89 93 46 54
I communicate with my friends a lot 71 91 83 76 67 27Technology has changed the way I communicate 64 90 85 69 26 48New communication methods have made my life easier 57 85 76 60 20 42I can't understand sharing personal opinions with people I don't know e.g. Twitter
55 44 52 77 58 37
I often use the cheapest form of communication possible 54 82 18 80 37 44I am happy to share information with a group of friends\ family at once 54 81 57 54 39 32I don't send as many letters and cards by post as I used to because I prefer digital methods of communication
48 74 58 47 21 37
I tend to think about how long a response will take when I use a specific communication method
46 69 39 56 28 31
I don't think about the cost when using communication methods, I just use the most convenient
45 63 75 6 61 18
I find technology advances too quickly for me to keep up 45 53 10 44 75 34
I think e-cards are impersonal 40 32 59 60 29 24I make an effort to use free services online 38 69 37 45 4 31I like to keep up with technological trends 36 61 60 29 2 27Automated services have made communication with businesses and services easier
29 60 29 17 12 28
I know more about the internet than most people I know 24 37 44 22 0 18I actively subscribe to email news letters or product updates fromcompanies I like
22 40 29 21 2 15
I am happy to post messages online that a wide audience can see 21 49 26 12 1 15I am often the first to try new products and services 21 42 34 11 2 13
Source: Ofcom research, 2012 Q8: I am going to read out some statements and I would like you to tell me how much each one applies to you using a scale of 1-5, where 5 = totally applies. Table shows the proportion that indicated that the statement applies to them, by rating 4 or 5. Base: UK adults aged 16+ (n=2,012 aged 16+, 440 Always-on communicators, 373 Enlightened communicators, 450 Middle-of-the-road communicators, 320 Detached communicators, 429 Conventional communicators) To explore the differences between the segments in more detail, we considered the top three and bottom three statements for each group.
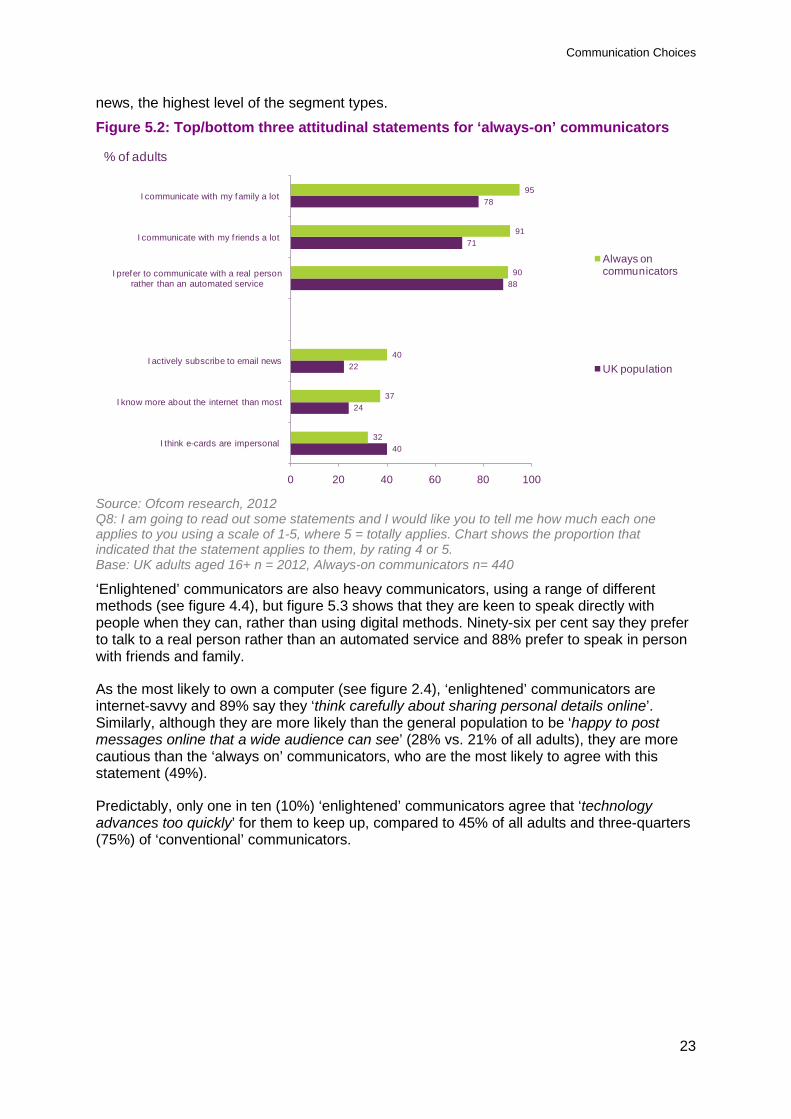
As the group that communicates the most of all the segments, the top two statements for the ‘always-on’ communicators are, unsurprisingly, the two relating to communicating a lot with family (95%) and friends (91%) (figure 5.2). These are the highest figures for these statements of all the segments.
Four in ten (40%) ‘always-on’ communicators agree that they actively subscribe to email
Communication Choices
23
news, the highest level of the segment types.
Figure 5.2: Top/bottom three attitudinal statements for ‘always-on’ communicators
% of adults
40
24
22
88
71
78
32
37
40
90
91
95
0 20 40 60 80 100
I think e-cards are impersonal
I know more about the internet than most
I actively subscribe to email news
I prefer to communicate with a real person rather than an automated service
I communicate with my f riends a lot
I communicate with my family a lot
Always on communicators
UK population
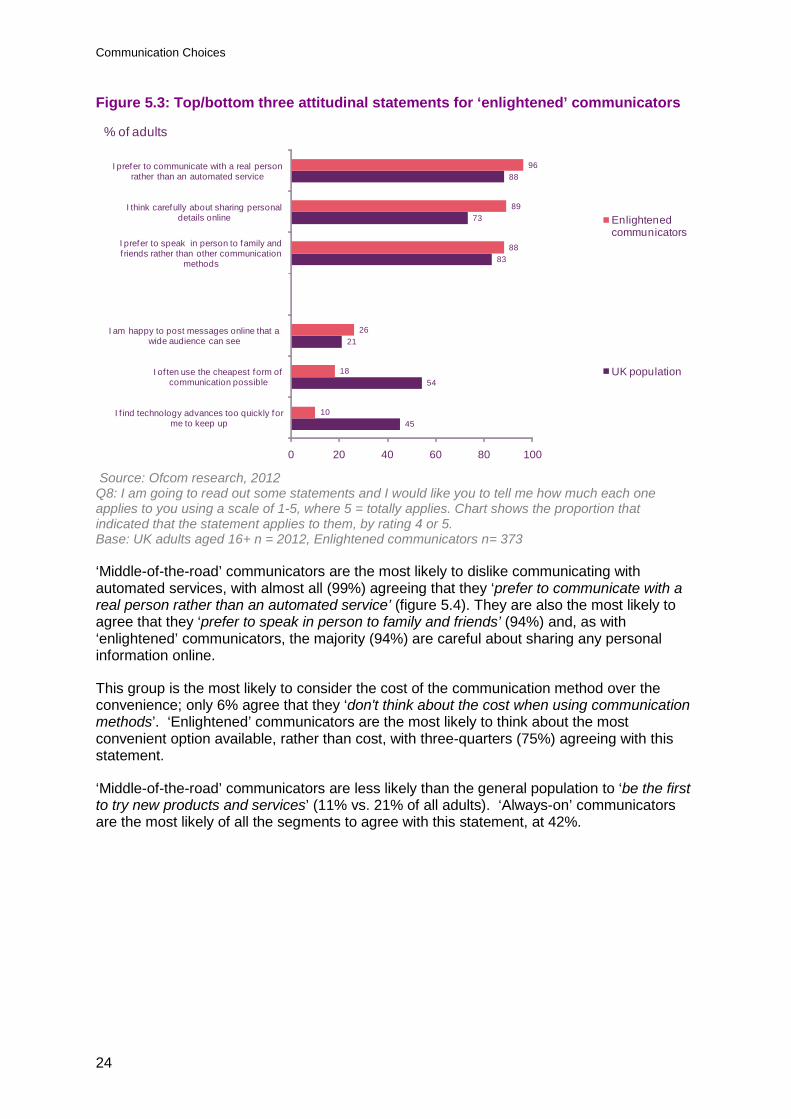
Source: Ofcom research, 2012 Q8: I am going to read out some statements and I would like you to tell me how much each one applies to you using a scale of 1-5, where 5 = totally applies. Chart shows the proportion that indicated that the statement applies to them, by rating 4 or 5. Base: UK adults aged 16+ n = 2012, Always-on communicators n= 440 ‘Enlightened’ communicators are also heavy communicators, using a range of different methods (see figure 4.4), but figure 5.3 shows that they are keen to speak directly with people when they can, rather than using digital methods. Ninety-six per cent say they prefer to talk to a real person rather than an automated service and 88% prefer to speak in person with friends and family.
As the most likely to own a computer (see figure 2.4), ‘enlightened’ communicators are internet-savvy and 89% say they ‘think carefully about sharing personal details online’. Similarly, although they are more likely than the general population to be ‘happy to post messages online that a wide audience can see’ (28% vs. 21% of all adults), they are more cautious than the ‘always on’ communicators, who are the most likely to agree with this statement (49%).
Predictably, only one in ten (10%) ‘enlightened’ communicators agree that ‘technology advances too quickly’ for them to keep up, compared to 45% of all adults and three-quarters (75%) of ‘conventional’ communicators.
Communication Choices
24
Figure 5.3: Top/bottom three attitudinal statements for ‘enlightened’ communicators
% of adults
45
54
21
83
73
88
10
18
26
88
89
96
0 20 40 60 80 100
I f ind technology advances too quickly for me to keep up
I of ten use the cheapest form of communication possible
I am happy to post messages online that a wide audience can see
I prefer to speak in person to family and f riends rather than other communication
methods
I think carefully about sharing personal details online
I prefer to communicate with a real person rather than an automated service
Enlightened communicators
UK population
Source: Ofcom research, 2012 Q8: I am going to read out some statements and I would like you to tell me how much each one applies to you using a scale of 1-5, where 5 = totally applies. Chart shows the proportion that indicated that the statement applies to them, by rating 4 or 5. Base: UK adults aged 16+ n = 2012, Enlightened communicators n= 373
‘Middle-of-the-road’ communicators are the most likely to dislike communicating with automated services, with almost all (99%) agreeing that they ‘prefer to communicate with a real person rather than an automated service’ (figure 5.4). They are also the most likely to agree that they ‘prefer to speak in person to family and friends’ (94%) and, as with ‘enlightened’ communicators, the majority (94%) are careful about sharing any personal information online.
This group is the most likely to consider the cost of the communication method over the convenience; only 6% agree that they ‘don't think about the cost when using communication methods’. ‘Enlightened’ communicators are the most likely to think about the most convenient option available, rather than cost, with three-quarters (75%) agreeing with this statement.
‘Middle-of-the-road’ communicators are less likely than the general population to ‘be the first to try new products and services’ (11% vs. 21% of all adults). ‘Always-on’ communicators are the most likely of all the segments to agree with this statement, at 42%.

Communication Choices
25
Figure 5.4: Top/bottom three attitudinal statements for ‘middle-of-the-road’ communicators
% of adults
45
21
21
73
83
88
6
11
12
93
94
99
0 20 40 60 80 100
I don't think about the cost when using communication methods, I just use the most
convenient
I am often the first to try new products and services
I am happy to post messages online that a wide audience can see
I think carefully about sharing personal details online
I prefer to speak in person to family and friends rather than other communication
methods
I prefer to communicate with a real person rather than an automated service
Middle-of-the-road communicators
UK population
Source: Ofcom research, 2012 Q8: I am going to read out some statements and I would like you to tell me how much each one applies to you using a scale of 1-5, where 5 = totally applies. Chart shows the proportion that indicated that the statement applies to them, by rating 4 or 5. Base: UK adults aged 16+ n = 2012, Middle-of-the-road communicators n= 450
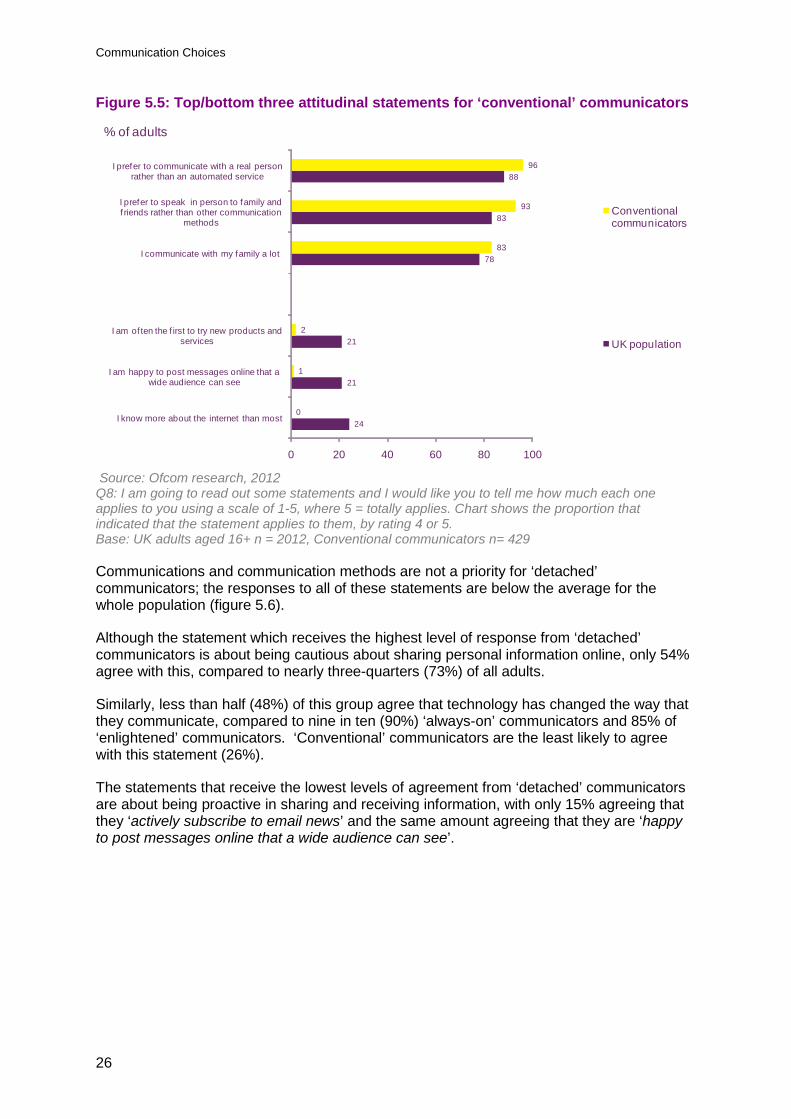
‘Conventional’ communicators share similar attributes to ‘enlightened’ communicators in their attitudes to communicating with family, in particular, with 93% agreeing that they ‘prefer to speak in person to family and friends rather than other communication methods’ (88% of ‘enlightened’ communicators). Eighty-three per cent of ‘conventional’ communicators say that they communicate with their families a lot, compared to 78% of all adults and just 35% of ‘detached’ communicators.
Figure 2.4 showed that ‘conventional’ communicators are the least likely to own a mobile phone (73% vs. 89% of all adults) or a computer (39% vs. 71% of all adults). Unsurprisingly figure 5.5 shows that none (0%) of this group agree that they ‘know more about the internet than most’ compared to around a quarter (24%) of all adults and 44% of ‘enlightened’ communicators.
In addition, only 1% of ’conventional’ communicators say they are ‘happy to post messages online that others can see’ (compared to 21% of all adults), and only 2% agree that they are ‘often the first to try new products and services’.
Communication Choices
26
Figure 5.5: Top/bottom three attitudinal statements for ‘conventional’ communicators
% of adults
24
21
21
78
83
88
0
1
2
83
93
96
0 20 40 60 80 100
I know more about the internet than most
I am happy to post messages online that a wide audience can see
I am of ten the f irst to try new products and services
I communicate with my family a lot
I prefer to speak in person to family and f riends rather than other communication
methods
I prefer to communicate with a real person rather than an automated service
Conventional communicators
UK population
Source: Ofcom research, 2012 Q8: I am going to read out some statements and I would like you to tell me how much each one applies to you using a scale of 1-5, where 5 = totally applies. Chart shows the proportion that indicated that the statement applies to them, by rating 4 or 5. Base: UK adults aged 16+ n = 2012, Conventional communicators n= 429
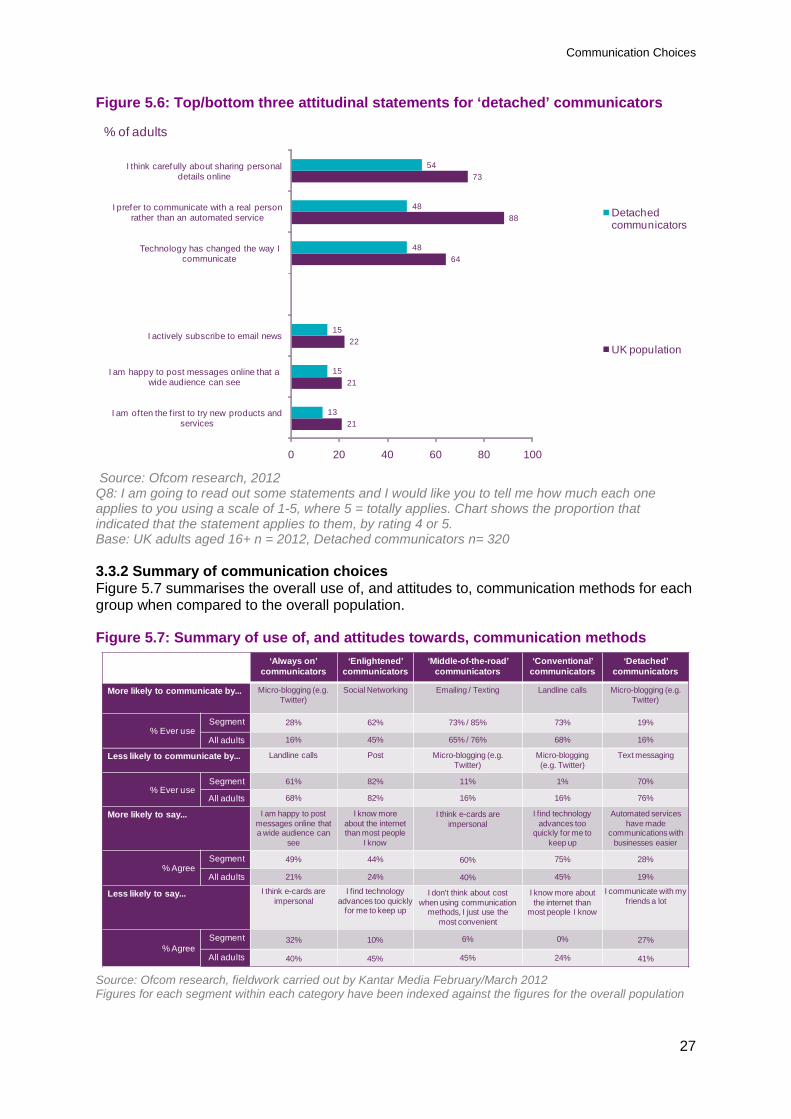
Communications and communication methods are not a priority for ‘detached’ communicators; the responses to all of these statements are below the average for the whole population (figure 5.6).
Although the statement which receives the highest level of response from ‘detached’ communicators is about being cautious about sharing personal information online, only 54% agree with this, compared to nearly three-quarters (73%) of all adults.
Similarly, less than half (48%) of this group agree that technology has changed the way that they communicate, compared to nine in ten (90%) ‘always-on’ communicators and 85% of ‘enlightened’ communicators. ‘Conventional’ communicators are the least likely to agree with this statement (26%).
The statements that receive the lowest levels of agreement from ‘detached’ communicators are about being proactive in sharing and receiving information, with only 15% agreeing that they ‘actively subscribe to email news’ and the same amount agreeing that they are ‘happy to post messages online that a wide audience can see’.
Communication Choices
27
Figure 5.6: Top/bottom three attitudinal statements for ‘detached’ communicators
% of adults
21
21
22
64
88
73
13
15
15
48
48
54
0 20 40 60 80 100
I am of ten the f irst to try new products and services
I am happy to post messages online that a wide audience can see
I actively subscribe to email news
Technology has changed the way I communicate
I prefer to communicate with a real person rather than an automated service
I think carefully about sharing personal details online
Detached communicators
UK population
Source: Ofcom research, 2012 Q8: I am going to read out some statements and I would like you to tell me how much each one applies to you using a scale of 1-5, where 5 = totally applies. Chart shows the proportion that indicated that the statement applies to them, by rating 4 or 5. Base: UK adults aged 16+ n = 2012, Detached communicators n= 320
3.3.2 Summary of communication choices Figure 5.7 summarises the overall use of, and attitudes to, communication methods for each group when compared to the overall population.
Figure 5.7: Summary of use of, and attitudes towards, communication methods ‘Always on’
communicators‘Enlightened’
communicators‘Middle-of-the-road’
communicators‘Conventional’
communicators‘Detached’
communicators
More likely to communicate by... Micro-blogging (e.g. Twitter)
Social Networking Emailing / Texting Landline calls Micro-blogging (e.g. Twitter)
% Ever useSegment 28% 62% 73% / 85% 73% 19%
All adults 16% 45% 65% / 76% 68% 16%
Less likely to communicate by... Landline calls Post Micro-blogging (e.g. Twitter)
Micro-blogging (e.g. Twitter)
Text messaging
% Ever useSegment 61% 82% 11% 1% 70%
All adults 68% 82% 16% 16% 76%
More likely to say... I am happy to post messages online that a wide audience can
see
I know more about the internet than most people
I know
I think e-cards are impersonal
I find technology advances too
quickly for me to keep up
Automated services have made
communications with businesses easier
% AgreeSegment 49% 44% 60% 75% 28%
All adults 21% 24% 40% 45% 19%
Less likely to say... I think e-cards are impersonal
I find technology advances too quickly
for me to keep up
I don't think about cost when using communication
methods, I just use the most convenient
I know more about the internet than
most people I know
I communicate with my friends a lot
% AgreeSegment 32% 10% 6% 0% 27%
All adults 40% 45% 45% 24% 41%
Source: Ofcom research, fieldwork carried out by Kantar Media February/March 2012 Figures for each segment within each category have been indexed against the figures for the overall population
Communication Choices
28
Section 6
5 Changing patterns of communication 6.1. Changes to communication choices
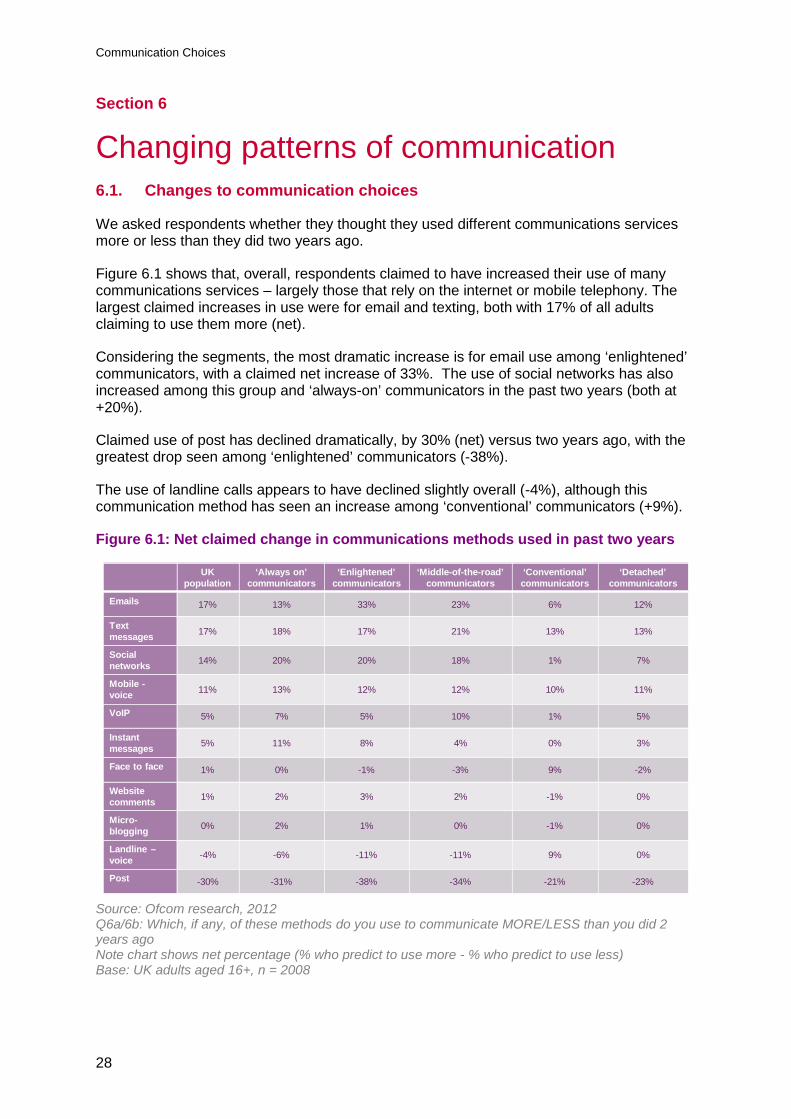
We asked respondents whether they thought they used different communications services more or less than they did two years ago.
Figure 6.1 shows that, overall, respondents claimed to have increased their use of many communications services – largely those that rely on the internet or mobile telephony. The largest claimed increases in use were for email and texting, both with 17% of all adults claiming to use them more (net).
Considering the segments, the most dramatic increase is for email use among ‘enlightened’ communicators, with a claimed net increase of 33%. The use of social networks has also increased among this group and ‘always-on’ communicators in the past two years (both at +20%).
Claimed use of post has declined dramatically, by 30% (net) versus two years ago, with the greatest drop seen among ‘enlightened’ communicators (-38%).
The use of landline calls appears to have declined slightly overall (-4%), although this communication method has seen an increase among ‘conventional’ communicators (+9%).
Figure 6.1: Net claimed change in communications methods used in past two years
UK population
‘Always on’ communicators
‘Enlightened’ communicators
‘Middle-of-the-road’ communicators
‘Conventional’ communicators
‘Detached’ communicators
Emails 17% 13% 33% 23% 6% 12%
Text messages 17% 18% 17% 21% 13% 13%
Social networks 14% 20% 20% 18% 1% 7%
Mobile -voice 11% 13% 12% 12% 10% 11%
VoIP 5% 7% 5% 10% 1% 5%
Instant messages 5% 11% 8% 4% 0% 3%
Face to face 1% 0% -1% -3% 9% -2%
Website comments 1% 2% 3% 2% -1% 0%
Micro-blogging 0% 2% 1% 0% -1% 0%
Landline –voice -4% -6% -11% -11% 9% 0%
Post -30% -31% -38% -34% -21% -23%
Source: Ofcom research, 2012 Q6a/6b: Which, if any, of these methods do you use to communicate MORE/LESS than you did 2 years ago Note chart shows net percentage (% who predict to use more - % who predict to use less) Base: UK adults aged 16+, n = 2008
Communication Choices
29
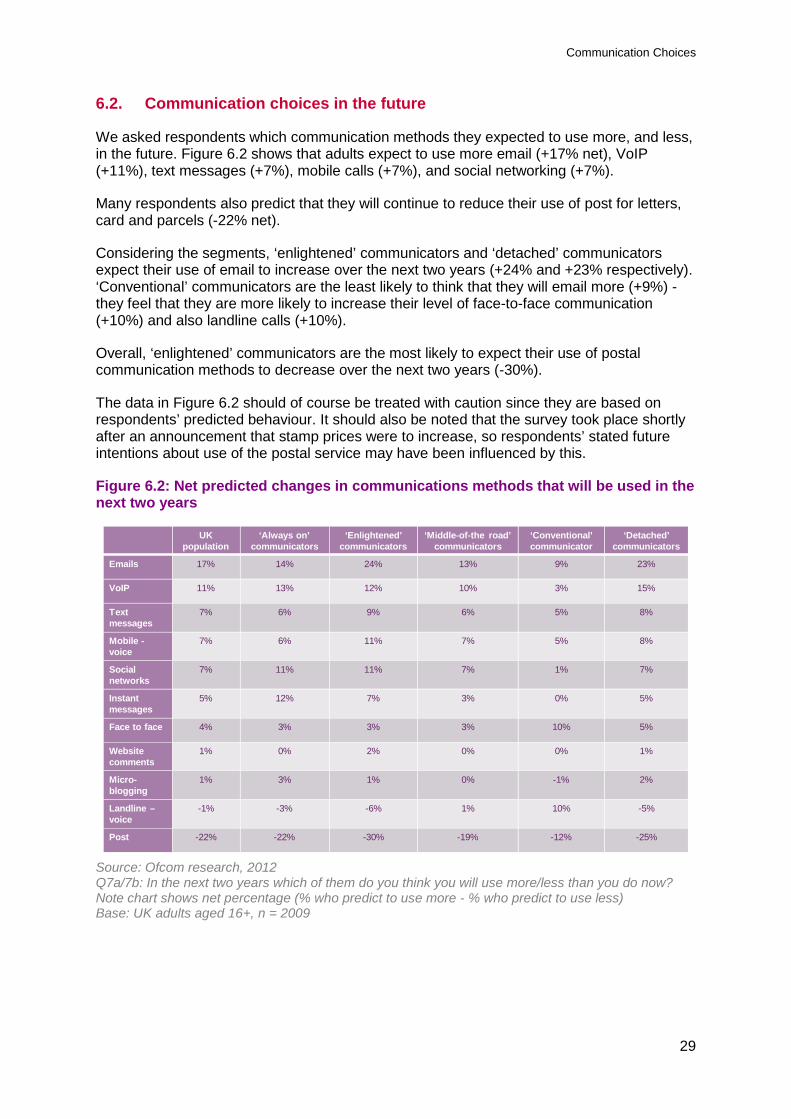
6.2. Communication choices in the future
We asked respondents which communication methods they expected to use more, and less, in the future. Figure 6.2 shows that adults expect to use more email (+17% net), VoIP (+11%), text messages (+7%), mobile calls (+7%), and social networking (+7%).
Many respondents also predict that they will continue to reduce their use of post for letters, card and parcels (-22% net).
Considering the segments, ‘enlightened’ communicators and ‘detached’ communicators expect their use of email to increase over the next two years (+24% and +23% respectively). ‘Conventional’ communicators are the least likely to think that they will email more (+9%) - they feel that they are more likely to increase their level of face-to-face communication (+10%) and also landline calls (+10%).
Overall, ‘enlightened’ communicators are the most likely to expect their use of postal communication methods to decrease over the next two years (-30%).
The data in Figure 6.2 should of course be treated with caution since they are based on respondents’ predicted behaviour. It should also be noted that the survey took place shortly after an announcement that stamp prices were to increase, so respondents’ stated future intentions about use of the postal service may have been influenced by this.
Figure 6.2: Net predicted changes in communications methods that will be used in the next two years
UK population
‘Always on’ communicators
‘Enlightened’ communicators
‘Middle-of-the road’ communicators
‘Conventional’ communicator
‘Detached’ communicators
Emails 17% 14% 24% 13% 9% 23%
VoIP 11% 13% 12% 10% 3% 15%
Text messages
7% 6% 9% 6% 5% 8%
Mobile -voice
7% 6% 11% 7% 5% 8%
Social networks
7% 11% 11% 7% 1% 7%
Instant messages
5% 12% 7% 3% 0% 5%
Face to face 4% 3% 3% 3% 10% 5%
Website comments
1% 0% 2% 0% 0% 1%
Micro-blogging
1% 3% 1% 0% -1% 2%
Landline –voice
-1% -3% -6% 1% 10% -5%
Post -22% -22% -30% -19% -12% -25%
Source: Ofcom research, 2012 Q7a/7b: In the next two years which of them do you think you will use more/less than you do now? Note chart shows net percentage (% who predict to use more - % who predict to use less) Base: UK adults aged 16+, n = 2009
Communication Choices
30
Annex 1
6 Technical specification 1.1. Introduction
Research was undertaken in March 2012 to understand the communication methods used by UK adults. The research covered methods used for communication with friends and family, and methods used to interact with businesses. A segmentation analysis was used to understand how individuals use different combinations of methods.
1.2. Data collection
Data were collected from a demographically nationally representative sample of the UK population aged 16+ using a face-to-face omnibus with fieldwork undertaken between the 16th and 20th March 2012.
The questionnaire covered the following areas:
- Devices used
- Frequency of using different communication method with friends and family and businesses
- Communication methods used for different groups
- Preferred method of communication for different groups
- Single preferred communication method
- Communications methods used more/less than two years ago
- Communication methods will use/less more in the future
- Battery of 22 attitudinal statements about communication methods
1.3. Segmentation
A segmentation was undertaken on the entire sample based on the frequency of using methods of communication with family and friends, or businesses, and people’s attitudes to communication methods.
• Data cleansing – “Don’t know” responses were imputed with the statement mean value by age group due to distinct patterns within the data.
• Input variables – The segmentation used both behavioural and attitudinal input variables. A factor analysis was run on the 22 attitude statements with the number of factors chosen by using the Kaiser Criterion. The five factors were:
o Technological/progressive I like to keep up with the latest technological trends New communications methods have made my life easier Technology has changed the way I communicate I know more about the internet than most people I know I make an effort to use free services online I am often the first to try new products and services I actively subscribe to email news letters or product updates from companies
I like
Communication Choices
31
I am happy to post messages online that a wide audience can see I don't send as many letters and cards by post as I used to, because I prefer
to use digital methods of communication Automated services have made communications with businesses and
services easier I tend to think about how long a response will take when I use a specific
communication method
o Enthusiastic communication I communicate with my family a lot I communicate with my friends a lot I am happy to share information with a group of friends\ family at once
o Traditional
I can't understand sharing personal opinions with people I don't know e.g. Twitter
I think e-cards are impersonal I think carefully about sharing my personal details online I prefer to communicate with a real person rather than an automated service I prefer to speak in person to family and friends rather than via other
communication methods
o Convenience I don't think about the cost when using communication methods, I just use the
most convenient I often use the cheapest form of communication possible
o Technology chasing I find technology advances too quickly for me to keep up
There were 13 behavioural variables made up of the number of times each communication method was used in a year:
o Emails o Social networking sites o Instant messaging o Skype o Comments on forums o Voice calls o Virtual assistance on websites o E-cards o Text messaging o Picture messaging o Post o Face to face
Canonical correlations between the attitudinal factors and behavioural variables were
computed to provide the input variables for the cluster analysis.
• Cluster analysis – a k-means cluster analysis using SPSS v17 was performed with initial seeds created by using a two-step cluster analysis. The optimal number of clusters was derived by comparing cluster homogeneity and heterogeneity. Homogeneity was computed as the average distance of a respondent from the cluster centre, and heterogeneity was computed as the average distance between clusters.