common genetic variants influence human subcortical brain structures · common genetic variants...
TRANSCRIPT
Common genetic variants influence human subcortical brain structures Derrek P. Hibar*1, Jason L. Stein*1,2, Miguel E. Renteria*3, Alejandro Arias-Vasquez*4,5,6,7, Sylvane Desrivières*8, Neda Jahanshad1, Roberto Toro9, Katharina Wittfeld10,11, Lucija Abramovic12, Micael Andersson13, Benjamin S. Aribisala14,15,16, Nicola J. Armstrong17,18, Manon Bernard19, Marc M. Bohlken12, Marco P. Boks12, Janita Bralten4,6,7, Andrew A. Brown20,21, M. Mallar Chakravarty22,23, Qiang Chen24, Christopher R.K. Ching1, Gabriel Cuellar-Partida3, Anouk den Braber25, Sudheer Giddaluru26,27, Aaron L. Goldman24, Oliver Grimm28, Tulio Guadalupe29,30, Johanna Hass31, Girma Woldehawariat32, Avram J. Holmes33,34, Martine Hoogman4,7, Deborah Janowitz11, Tianye Jia8, Sungeun Kim35,36,37, Marieke Klein4,7, Bernd Kraemer38, Phil H. Lee39,34,40,41, Loes M. Olde Loohuis42, Michelle Luciano43, Christine Macare8, Karen A. Mather17, Manuel Mattheisen44,45,46, Yuri Milaneschi47, Kwangsik Nho35,36,37, Martina Papmeyer48, Adaikalavan Ramasamy49,50, Shannon L. Risacher35,37, Roberto Roiz-Santiañez51,52, Emma J. Rose53, Alireza Salami13, Philipp G. Sämann54, Lianne Schmaal47, Andrew J. Schork55,56, Jean Shin19, Lachlan T. Strike3,57, Alexander Teumer58, Marjolein M.J. van Donkelaar4,7, Kristel R. van Eijk12, Raymond K. Walters59,60, Lars T. Westlye21,61, Christopher D. Whelan62, Anderson M. Winkler63, Marcel P. Zwiers7, Saud Alhusaini64,62, Lavinia Athanasiu20,21, Stefan Ehrlich31,34,65, Marina M.H. Hakobjan4,7, Cecilie B. Hartberg20,66, Unn Haukvik20,66, Angelien J.G.A.M. Heister4,7, David Höhn54, Dalia Kasperaviciute67,68, David C.M. Liewald43, Lorna M. Lopez43, Remco R.R. Makkinje4,7, Mar Matarin67, Marlies A.M. Naber4,7, David R. McKay69,70, Margaret Needham53, Allison C. Nugent32, Benno Pütz54, Natalie A. Royle14,43,16, Li Shen35,36,37, Emma Sprooten48,69,70, Daniah Trabzuni50,71, Saskia S.L. van der Marel4,7, Kimm J.E. van Hulzen4,7, Esther Walton31, Christiane Wolf54, Laura Almasy72, David Ames73,74, Sampath Arepalli75, Amelia A. Assareh17, Mark E. Bastin14,43,76,16, Henry Brodaty17,77, Kazima B. Bulayeva78, Melanie A. Carless72, Sven Cichon79,80,81, Aiden Corvin53, Joanne E. Curran72, Michael Czisch54, Greig I. de Zubicaray57, Allissa Dillman75, Ravi Duggirala72, Thomas D. Dyer72, Susanne Erk82, Iryna O. Fedko25, Luigi Ferrucci83, Tatiana M. Foroud84,37, Peter T. Fox85, Masaki Fukunaga86, Raphael Gibbs75,50, Harald H.H. Göring72, Robert C. Green87,40, Sebastian Guelfi50, Narelle K. Hansell3, Catharina A. Hartman88, Katrin Hegenscheid89, Andreas Heinz82, Dena G. Hernandez75,50, Dirk J. Heslenfeld90, Pieter J. Hoekstra88, Florian Holsboer54, Georg Homuth91, Jouke-Jan Hottenga25, Masashi Ikeda92, Clifford R. Jack Jr.93, Mark Jenkinson94, Robert Johnson95, Ryota Kanai96,97, Maria Keil38, Jack W. Kent Jr72, Peter Kochunov98, John B. Kwok99,100, Stephen M. Lawrie48, Xinmin Liu32,101, Dan L. Longo102, Katie L. McMahon103, Eva Meisenzahl104, Ingrid Melle20,21, Sebastian Mohnke82, Grant W. Montgomery3, Jeanette C. Mostert4,7, Thomas W. Mühleisen81,80, Michael A. Nalls75, Thomas E. Nichols105,94, Lars G. Nilsson13, Markus M. Nöthen80,106, Kazutaka Ohi107, Rene L. Olvera85, Rocio Perez-Iglesias108,52, G. Bruce Pike109,110, Steven G. Potkin111, Ivar Reinvang61, Simone Reppermund17, Marcella Rietschel28, Nina Romanczuk-Seiferth82, Glenn D. Rosen112,113, Dan Rujescu104, Knut Schnell114, Peter R. Schofield99,100, Colin Smith115, Vidar M. Steen26,27, Jessika E. Sussmann48, Anbupalam Thalamuthu17, Arthur W. Toga116,

Bryan Traynor75, Juan Troncoso117, Jessica A. Turner118, Maria C. Valdés Hernández76, Dennis van 't Ent25, Marcel van der Brug119, Nic J.A. van der Wee120, Marie-Jose van Tol121, Dick J. Veltman47, Thomas H. Wassink122, Eric Westman123, Ronald H. Zielke95, Alan Zonderman124, David G. Ashbrook125, Reinmar Hager125, Lu Lu126,127, Francis J. McMahon32, Derek W. Morris128,53, Robert W. Williams126,127, Han G. Brunner4,7,129, Randy L. Buckner130,34, Jan K. Buitelaar6,7,131, Wiepke Cahn12, Vince D. Calhoun132,133, Gianpiero L. Cavalleri62, Benedicto Crespo-Facorro51,52, Anders M. Dale134,135, Gareth E. Davies136, Norman Delanty137,62, Chantal Depondt138, Srdjan Djurovic20,139, Wayne C. Drevets32,140, Thomas Espeseth61,21, Randy L. Gollub34,65,40, Beng-Choon Ho141, Wolfgang Hoffmann58,10, Norbert Hosten89, René S. Kahn12, Stephanie Le Hellard26,27, Andreas Meyer-Lindenberg28, Bertram Müller-Myhsok54,142,143, Matthias Nauck144, Lars Nyberg13, Massimo Pandolfo138, Brenda W.J.H. Penninx47, Joshua L. Roffman34, Sanjay M. Sisodiya67, Jordan W. Smoller39,34,40,41, Hans van Bokhoven4,7, Neeltje E.M. van Haren12, Henry Völzke58, Henrik Walter82, Michael W. Weiner145, Wei Wen17, Tonya White146,147, Ingrid Agartz20,66,148, Ole A. Andreassen20,21, John Blangero72, Dorret I. Boomsma25, Rachel M. Brouwer12, Dara M. Cannon32,149, Mark R. Cookson75, Eco J.C. de Geus25, Ian J. Deary43, Gary Donohoe128,53, Guillén Fernández6,7, Simon E. Fisher29,7, Clyde Francks29,7, David C. Glahn69,70, Hans J. Grabe11,150, Oliver Gruber38,54, John Hardy50, Ryota Hashimoto151, Hilleke E. Hulshoff Pol12, Erik G. Jönsson148,20, Iwona Kloszewska152, Simon Lovestone153,154, Venkata S. Mattay24, Patrizia Mecocci155, Colm McDonald149, Andrew M. McIntosh48, Roel A. Ophoff42,12, Tomas Paus156,157, Zdenka Pausova19,158, Mina Ryten50,49, Perminder S. Sachdev17,159, Andrew J. Saykin35,37,84, Andy Simmons160,161,162, Andrew Singleton75, Hilkka Soininen163,164, Joanna M. Wardlaw14,43,76,16, Michael E. Weale49, Daniel R. Weinberger24,165, Hieab H.H. Adams166,147, Lenore J. Launer167, Stephan Seiler168, Reinhold Schmidt168, Ganesh Chauhan169, Claudia L. Satizabal170,171, James T. Becker172,173,174, Lisa Yanek175, Sven J. van der Lee166, Maritza Ebling65,176, Bruce Fischl65,176, W.T. Longstreth177, Douglas Greve65,176, Helena Schmidt178, Paul Nyquist179, Louis N. Vinke65,176, Cornelia M. van Duijn166, Xue Luting180, Bernard Mazoyer181, Joshua C. Bis182, Vilmundur Gudnason183, Sudha Seshadri170,171, M. Arfan Ikram166,147, the Alzheimer’s Disease Neuroimaging Initiative**, the CHARGE Consortium, EPIGEN, IMAGEN, SYS, Nicholas G. Martin*3, Margaret J. Wright*3,57, Gunter Schumann*8, Barbara Franke*4,5,7, Paul M. Thompson*+1, Sarah E. Medland*+3 **Data used in preparing this article were obtained from the Alzheimer’s Disease Neuroimaging Initiative (ADNI) database (adni.loni.usc.edu). As such, many investigators within the ADNI contributed to the design and implementation of ADNI and/or provided data but did not participate in analysis or writing of this report. A complete listing of ADNI investigators can be found at: http://adni.loni.usc.edu/wp-content/uploads/how_to_apply/ADNI_Acknowledgement_List.pdf *Denotes equal contribution +Denotes the corresponding authors
1. Imaging Genetics Center, Institute for Neuroimaging & Informatics, Keck School of Medicine of the University of Southern California, Los Angeles, USA
2. Neurogenetics Program, Department of Neurology, UCLA School of Medicine, Los Angeles, USA
3. QIMR Berghofer Medical Research Institute, Brisbane, Australia 4. Department of Human Genetics, Radboud University Medical Center,
Nijmegen, The Netherlands 5. Department of Psychiatry, Radboud University Medical Center, Nijmegen,
The Netherlands 6. Department of Cognitive Neuroscience, Radboud University Medical
Center, Nijmegen, The Netherlands 7. Donders Institute for Brain, Cognition and Behaviour, Raboud University,
Nijmegen, The Netherlands 8. MRC-SGDP Centre, Institute of Psychiatry, King's College, London,
London, United Kingdom 9. Institut Pasteur, Paris, France 10. German Center for Neurodegenerative Diseases (DZNE),
Rostock/Greifswald, Germany, Greifswald, Germany 11. Department of Psychiatry, University Medicine Greifswald, Greifswald,
Germany 12. Brain Center Rudolf Magnus, Department of Psychiatry, UMC Utrecht,
Utrecht, The Netherlands 13. Umeå Centre for Functional Brain Imaging (UFBI), Umeå University,
Umeå, Sweden 14. Brain Research Imaging Centre, University of Edinburgh, Edinburgh,
United Kingdom 15. Department of Computer Science, Lagos State University, Lagos, Nigeria 16. Scottish Imaging Network, A Platform for Scientific Excellence (SINAPSE)
Collaboration, Department of Neuroimaging Sciences, University of Edinburgh, Edinburgh, United Kingdom
17. Centre for Healthy Brain Ageing, School of Psychiatry, University of New South Wales (UNSW), Sydney, Australia
18. School of Mathematics and Statistics, University of Sydney, Australia 19. Hospital for Sick Children, University of Toronto, Toronto, Canada 20. NORMENT - KG Jebsen Centre, Institute of Clinical Medicine, University
of Oslo, Oslo, Norway 21. NORMENT - KG Jebsen Centre, Division of Mental Health and Addiction,
Oslo University Hospital, Oslo, Norway 22. Cerebral Imaging Centre, Douglas Mental Health University Institute,
Montreal, Canada 23. Department of Psychiatry and Biomedical Engineering, McGill University,
Montreal, Canada 24. Lieber Institute for Brain Development, Baltimore, USA 25. Biological Psychology, Neuroscience Campus Amsterdam, VU University
& VU Medical Center, Amsterdam, The Netherlands
26. NORMENT - KG Jebsen Centre for Psychosis Research, Department of Clinical Science, University of Bergen, Norway
27. Dr. Einar Martens Research Group for Biological Psychiatry, Center for Medical Genetics and Molecular Medicine, Haukeland University Hospital, Bergen, Norway
28. Central Institute of Mental Health, Medical Faculty Mannheim, University Heidelberg, Mannheim, Germany
29. Language and Genetics Department, Max Planck Institute for Psycholinguistics, Nijmegen, The Netherlands
30. International Max Planck Research School for Language Sciences, Nijmegen, The Netherlands
31. Department of Child and Adolescent Psychiatry, Faculty of Medicine of the TU Dresden, Dresden, Germany
32. National Institute of Mental Health Intramural Research Program, Bethesda, USA
33. Department of Psychology, Yale University, New Haven, USA 34. Department of Psychiatry, Massachusetts General Hospital, Boston, USA 35. Center for Neuroimaging, Radiology and Imaging Sciences, Indiana
University School of Medicine, Indianapolis, USA 36. Center for Computational Biology and Bioinformatics, Indiana University
School of Medicine, Indianapolis, USA 37. Indiana Alzheimer Disease Center, Indiana University School of Medicine,
Indianapolis, USA 38. Center for Translational Research in Systems Neuroscience and
Psychiatry, Department of Psychiatry and Psychotherapy, University Medical Center, Goettingen, Germany
39. Psychiatric and Neurodevelopmental Genetics Unit, Center for Human Genetic Research, Massachusetts General Hospital, Boston, USA
40. Harvard Medical School, Cambridge, USA 41. Stanley Center for Psychiatric Research, Broad Institute of MIT and
Harvard, Boston, USA 42. Center for Neurobehavioral Genetics, University of California, Los
Angeles, USA 43. Centre for Cognitive Ageing and Cognitive Epidemiology, Psychology,
University of Edinburgh, Edinburgh, United Kingdom 44. Department of Biomedicine, Aarhus University, Aarhus, Denmark 45. The Lundbeck Foundation Initiative for Integrative Psychiatric Research,
iPSYCH, Aarhus and Copenhagen, Denmark 46. Center for integrated Sequencing, iSEQ, Aarhus University, Aarhus,
Denmark 47. Department of Psychiatry, Neuroscience Campus Amsterdam, VU
University Medical Center, Amsterdam, The Netherlands 48. Division of Psychiatry, Royal Edinburgh Hospital, University of Edinburgh,
Edinburgh, United Kingdom 49. Department of Medical and Molecular Genetics, King’s College London,
London, United Kingdom
50. Reta Lila Weston Institute and Department of Molecular Neuroscience, UCL Institute of Neurology, London, United Kingdom
51. Department of Psychiatry, University Hospital Marqués de Valdecilla, School of Medicine, University of Cantabria-IDIVAL, Santander, Spain
52. Cibersam (Centro Investigación Biomédica en Red Salud Mental), Madrid, Spain
53. Neuropsychiatric Genetics Research Group, Department of Psychiatry and Trinity College Institute of Psychiatry, Trinity College Dublin, Ireland
54. Max Planck Institute of Psychiatry, Munich, Germany 55. Multimodal Imaging Laboratory, Department of Neurosciences, University
of California, San Diego, USA 56. Department of Cognitive Sciences, University of California, San Diego,
USA 57. School of Psychology, University of Queensland, Brisbane, Australia 58. Institute for Community Medicine, University Medicine Greifswald,
Greifswald, Germany 59. Analytic and Translational Genetics Unit, Massachusetts General Hospital,
Boston, USA 60. Medical and Population Genetics Program, Broad Institute for Harvard and
MIT, Cambridge, USA 61. NORMENT - KG Jebsen Centre, Department of Psychology, University of
Oslo, Oslo, Norway 62. Molecular and Cellular Therapeutics, The Royal College of Surgeons,
Dublin, Ireland 63. Oxford University, Oxford, United Kingdom 64. Department of Neurology and Neurosurgery, Montreal Neurological
Institute, McGill University, Montreal, Canada 65. Martinos Center for Biomedical Imaging, Massachusetts General Hospital,
Charlestown, USA 66. Department of Research and Development, Diakonhjemmet Hospital,
Oslo, Norway 67. UCL Institute of Neurology, London, United Kingdom and Epilepsy
Society, United Kingdom 68. Department of Medicine, Imperial College London, London, UK 69. Department of Psychiatry, Yale University, New Haven, USA 70. Olin Neuropsychiatric Research Center, Hartford, USA 71. Department of Genetics, King Faisal Specialist Hospital and Research
Centre, Riyadh, Saudi Arabia 72. Texas Biomedical Research Institute, San Antonio, USA 73. National Ageing Research Institute, Royal Melbourne Hospital, Melbourne,
Australia 74. Academic Unit for Psychiatry of Old Age, University of Melbourne,
Australia 75. Laboratory of Neurogenetics, National Institute on Aging, National
Institutes of Health, Bethesda, USA
76. Centre for Clinical Brain Sciences, University of Edinburgh, Edinburgh, United Kingdom
77. Primary Dementia Collaborative Research Centre - Assessment and Better Care, UNSW, Sydney, Australia
78. N.I. Vavilov Institute of General Genetics, Russian Academy of Sciences, Moscow, Russia
79. Division of Medical Genetics, Department of Biomedicine, University of Basel, Basel, Switzerland
80. Institute of Human Genetics, University of Bonn, Bonn, Germany 81. Institute of Neuroscience and Medicine (INM-1), Research Centre Jülich,
Jülich, Germany 82. Department of Psychiatry and Psychotherapy, Charité Universitätsmedizin
Berlin, CCM, Berlin, Germany 83. Clinical Research Branch, National Institute on Aging, Baltimore, USA 84. Medical and Molecular Genetics, Indiana University School of Medicine,
Indianapolis, USA 85. University of Texas Health Science Center, San Antonio, USA 86. Biofunctional Imaging, Immunology Frontier Research Center, Osaka
University, Osaka, Japan 87. Division of Genetics, Department of Medicine, Brigham and Women’s
Hospital, Boston, USA 88. Department of Psychiatry, University of Groningen, University Medical
Center Groningen, Groningen, The Netherlands 89. Institute of Diagnostic Radiology and Neuroradiology, University Medicine
Greifswald, Greifswald, Germany 90. Department of Psychology, VU University Amsterdam, Amsterdam, The
Netherlands 91. Interfaculty Institute for Genetics and Functional Genomics, University
Medicine Greifswald, Greifswald, Germany 92. Department of Psychiatry, Fujita Health University School of Medicine,
Toyoake, Japan 93. Radiology, Mayo Clinic, Rochester, USA 94. FMRIB Centre, University of Oxford, United Kingdom 95. NICHD Brain and Tissue Bank for Developmental Disorders, University of
Maryland Medical School, Baltimore, USA 96. University of Sussex, Brighton, United Kingdom 97. University College London, London, United Kingdom 98. University of Maryland, Catonsville, USA 99. Neuroscience Research Australia, Sydney, Australia 100. School of Medical Sciences, UNSW, Sydney, Australia 101. Columbia University Medical Center, New York, USA 102. Lymphocyte Cell Biology Unit, Laboratory of Immunology, National
Institute on Aging, National Institutes of Health, Baltimore, USA 103. Centre for Advanced Imaging, University of Queensland, Brisbane,
Australia 104. Ludwig-Maximilians-Universität, Munich, Germany
105. Department of Statistics & WMG, University of Warwick, Coventry, United Kingdom
106. Department of Genomics, Life & Brain Center, University of Bonn, Germany
107. Department of Psychiatry, Osaka University Graduate School of Medicine, Osaka, Japan
108. Institute of Psychiatry, King's College London, London, United Kingdom
109. Department of Neurology, University of Calgary, Calgary, Canada 110. Department of Clinical Neuroscience, University of Calgary,
Calgary, Canada 111. Psychiatry and Human Behavior, University of California, Irvine,
USA 112. Beth Israel Deaconess Medical Center, Boston, USA 113. Department of Neurology, Harvard Medical School, Boston, USA 114. Department of Psychiatry and Psychotherapy, University
Heidelberg, Heidelberg, Germany 115. Department of Neuropathology, MRC Sudden Death Brain Bank
Project, University of Edinburgh, Edinburgh, United Kingdom 116. Laboratory of Neuro Imaging, Institute for Neuroimaging and
Informatics, Keck School of Medicine of the University of Southern California, Los Angeles, USA
117. Brain Resource Center, Johns Hopkins University, Baltimore, USA 118. Georgia State University, Atlanta, USA 119. The Scripps Research Institute, Jupiter, USA 120. Leiden University Medical Center, Leiden, The Netherlands 121. Neuroimaging Centre, University of Groningen, University Medical
Center Groningen, Groningen, The Netherlands 122. Department of Psychiatry, Carver College of Medicine, University of
Iowa, Iowa City, USA 123. Department of Neurobiology, Care Sciences and Society,
Karolinska Institutet, Stockholm, Sweden 124. Research Resources Branch, National Institute on Aging, National
Institutes of Health, Bethesda, USA 125. Faculty of Life Sciences, University of Manchester, Manchester,
United Kingdom 126. Center for Integrative and Translational Genomics, University of
Tennessee Health Science Center, Memphis, USA 127. Department of Anatomy and Neurobiology, University of Tennessee
Health Science Center, Memphis, USA 128. Cognitive Genetics and Therapy Group, School of Psychology &
Discipline of Biochemistry, National University of Ireland Galway, Galway, Ireland
129. Department of Clinical Genetics, Maastricht University Medical Center, Maastricht, The Netherlands
130. Department of Psychology, Center for Brain Science, Harvard University, Cambridge, USA
131. Karakter Child and Adolescent Psychiatry, Radboud university medical center, Nijmegen, The Netherlands
132. The Mind Research Network & LBERI, Albuquerque, USA 133. Department of ECE, University of New Mexico, Albuquerque, USA 134. Center for Translational Imaging and Personalized Medicine,
University of California, San Diego, USA 135. Departments of Neurosciences, Radiology, Psychiatry, and
Cognitive Science, University of California, San Diego, USA 136. Avera Institute for Human Genetics, Sioux Falls, USA 137. Neurology Division, Beaumont Hospital, Dublin, Ireland 138. Department of Neurology, Hopital Erasme, Universite Libre de
Bruxelles, Brussels, Belgium 139. Department of Medical Genetics, Oslo University Hospital, Oslo,
Norway 140. Janssen Research & Development, Johnson & Johnson, New
Jersey, USA 141. Department of Psychiatry, University of Iowa, Iowa City, USA 142. Munich Cluster for Systems Neurology (SyNergy), Munich,
Germany 143. University of Liverpool, Institute of Translational Medicine,
Liverpool, United Kingdom 144. Institute of Clinical Chemistry and Laboratory Medicine, University
Medicine Greifswald, Greifswald, Germany 145. Center for Imaging of Neurodegenerative Disease, San Francisco
VA Medical Center, University of California, San Francisco, USA 146. Department of Child Psychiatry, Erasmus University Medical
Centre, Rotterdam, The Netherlands 147. Department of Radiology, Erasmus University Medical Centre,
Rotterdam, The Netherlands 148. Department of Clinical Neuroscience, Psychiatry Section,
Karolinska Institutet, Stockholm, Sweden 149. Clinical Neuroimaging Laboratory, College of Medicine, Nursing
and Health Sciences, National University of Ireland Galway, Galway, Ireland
150. Department of Psychiatry and Psychotherapy, HELIOS Hospital Stralsund, Germany
151. Molecular Research Center for Children's Mental Development, United Graduate School of Child Development, Osaka University, Osaka, Japan
152. Medical University of Lodz, Lodz, Poland 153. Department of Psychiatry, University of Oxford, Oxford, United
Kingdom 154. King's College London, London, United Kingdom
155. Section of Gerontology and Geriatrics, Department of Medicine, University of Perugia, Perugia, Italy
156. Rotman Research Institute, University of Toronto, Toronto, Canada 157. Departments of Psychology and Psychiatry, University of Toronto,
Canada 158. Departments of Physiology and Nutritional Sciences, University of
Toronto, Canada 159. Neuropsychiatric Institute, Prince of Wales Hospital, Sydney,
Australia 160. Department of Neuroimaging, Institute of Psychiatry, King's College
London, London, United Kingdom 161. Biomedical Research Centre for Mental Health, King's College
London, London, United Kingdom 162. Biomedical Research Unit for Dementia, King's College London,
London, United Kingdom 163. Institute of Clinical Medicine, Neurology, University of Eastern
Finland, Kuopio, Finland 164. Neurocentre Neurology, Kuopio University Hospital, Finland 165. Departments of Psychiatry, Neurology, Neuroscience and the
Institute of Genetic Medicine, Johns Hopkins University School of Medicine, Baltimore, USA
166. Department of Epidemiology, Erasmus University Medical Centre, Rotterdam, The Netherlands
167. Laboratory of Epidemiology and Population Sciences, Intramural Research Program, National Institute on Aging, Bethesda, USA
168. Department of Neurology, Clinical Division of Neurogeriatrics, Medical University Graz, Graz, Austria
169. INSERM U897, University of Bordeaux, France 170. Department of Neurology, Boston University School of Medicine,
Boston, USA 171. Framingham Heart Study, Framingham, USA 172. Department of Neurology, School of Medicine, University of
Pittsburgh, Pittsburgh, USA 173. Department of Psychiatry, School of Medicine, University of
Pittsburgh, Pittsburgh, USA 174. Department of Psychology, School of Medicine, University of
Pittsburgh, Pittsburgh, USA 175. General Internal Medicine, Johns Hopkins School of Medicine,
Baltimore, USA 176. Department of Radiology, Massachusetts General Hospital,
Harvard Medical School, Boston, MA, USA. 177. Department of Neurology University of Washington, Seattle, USA 178. Institute of Molecular Biology and Biochemistry, Medical University
Graz, Austria 179. Department of Neurology, Johns Hopkins University School of
Medicine, Baltimore, USA

180. Department of Biostatistics, Boston University School of Public Health, Boston, USA
181. UMR5296 CNRS, CEA and University of Bordeaux, Bordeaux, France
182. Cardiovascular Health Research Unit, Department of Medicine, University of Washington, Seattle, USA
183. Icelandic Heart Association, Kopavogur, University of Iceland, Faculty of Medicine, Reykjavik, Iceland

Revised Manuscript Under Consideration at Nature To Be Submitted on November 5, 2014 Please address correspondence to Drs. Thompson and Medland: Paul Thompson, Ph.D. Associate Dean for Research, Keck School of Medicine of USC Professor of Neurology, Psychiatry, Engineering, Radiology, Pediatrics, and Ophthalmology Imaging Genetics Center, and Institute for Neuroimaging and Informatics Keck School of Medicine of USC, University of Southern California 2001 N. Soto Street, SSB1-102, Los Angeles, CA 90032 Phone: (323) 442-7246 e-mail: [email protected] Sarah Medland, Ph.D. Associate Professor and Team Head of Quantitative Genetics QIMR Berghofer Medical Research Institute Phone: +61 7 3362 0248 email: [email protected]
Summary The highly complex structure of the human brain is strongly shaped by genetic
influences1. Subcortical brain regions form circuits with cortical areas to coordinate movement
2, learning, memory
3, and motivation
4, and altered circuits can lead to
abnormal behavior and disease2. To investigate how common genetic variants affect
the structure of these brain regions, we conducted genome-wide association studies (GWASs) of the volumes of seven subcortical regions and intracranial volume derived from magnetic resonance images (MRIs) of 30,717 individuals from 50 cohorts worldwide. We identified five novel genetic variants influencing the volumes of the putamen and caudate nucleus. We also found stronger evidence for three loci with previously established influence on hippocampal volume5 and intracranial volume6. These variants showed specific volumetric effects on brain structures rather than global effects across structures. The strongest effects were found for putamen, where a novel intergenic locus with replicable influence on volume (rs945270; P=1.08x10⁻³³; 0.52% variance explained) showed evidence of altering the expression of the KTN1 gene in both brain and blood tissue. Variants influencing putamen volume clustered near developmental genes that regulate apoptosis, axon guidance, and vesicle transport. Identification of these genetic variants provides insight into the causes of variability in human brain development, and may help elucidate mechanisms of neuropsychiatric dysfunction.
Main Text At the individual level, genetic variations exert lasting influences on brain structures and functions associated with behavior and predisposition to disease. Within the context of the Enhancing Neuro Imaging Genetics through Meta-Analysis (ENIGMA) Consortium, we conducted a collaborative large-scale genetic analysis of magnetic resonance imaging (MRI) scans to identify genetic variants that influence brain structure. Here, we focus on volumetric measures derived from a measure of head size (intracranial volume, ICV) and seven subcortical brain structures corrected for ICV (nucleus accumbens, caudate, putamen, pallidum, amygdala, hippocampus, and thalamus). To ensure data homogeneity within the ENIGMA consortium, we designed and implemented standardized protocols for image analysis, quality assessment, genetic imputation (to 1000 Genomes references, version 3), and association (Extended Data Figure 1; Methods).
After establishing that the volumes extracted using our protocols were substantially heritable in a large sample of twins (P < 1x10⁻⁴; see Methods; Extended Data Figure 11a), with similar distributions to prior studies1, we sought to identify common genetic variants contributing to volume differences by meta-analyzing site-level GWAS data in a discovery sample of 13,171 subjects of European ancestry (Extended Data Figure 2). Population stratification was controlled for by including, as covariates, four population components derived from standardized multidimensional scaling analyses of genome-wide genotype data conducted at each site (see Methods). Site-level GWAS results and distributions were visually inspected to check for statistical inflation and patterns indicating technical artifacts (see Methods).
Meta-analysis of the discovery sample identified six genome-wide significant loci after correcting for the number of variants and traits analyzed (P < 7.1x10⁻⁹; see Methods): one associated with intracranial volume, two associated with hippocampal
volume, and three with putamen volume. Another four loci showed suggestive associations (P < 1x10⁻⁷) with putamen volume (one locus), amygdala volume (two loci), and caudate volume (one locus; Table 1; Figure 1; Supplementary Table 5). Quantile-quantile plots showed no evidence of population stratification or cryptic relatedness (Extended Data Figure 4a). We subsequently attempted to replicate the variants with independent data from 17,546 individuals. All subcortical genome-wide significant variants identified in the discovery sample were replicated (Table 1). The variant associated with ICV did not replicate in a smaller independent sample, but was genome-wide significant in a previously published independent study6, providing strong evidence for its association with intracranial volume. Moreover, two suggestive variants associated with putamen and caudate volumes exceeded genome-wide significance after meta-analysis across the discovery and replication datasets (Table 1). Effect sizes were similar across cohorts (PCOCHRAN’S Q > 0.1; Extended Data Figure 4b). Effect sizes remained consistent after excluding patients diagnosed with anxiety, Alzheimer’s disease, attention-deficit/hyperactivity disorder, bipolar disorder, epilepsy, major depressive disorder or schizophrenia (21% of the discovery participants). Correlation in effect size with and without patients was very high (r > 0.99) for loci with P < 1 x 10⁻⁵, indicating these effects were unlikely to be driven by disease (Extended Data Figure 5a). The participants’ age range covered most of the lifespan (9-97 years), but only one of the eight significant loci showed an effect related to the mean age of each cohort (P = 0.002; rs6087771 affecting putamen volume; Extended Data Figure 5b), suggesting that nearly all effects are stable across the lifespan. In addition, none of these loci showed evidence of sex effects (Extended Data Figure 5c).
In our cohorts, significant loci were associated with 0.51-1.40% differences in volume per risk allele, explaining 0.17-0.52% of the phenotypic variance (Table 1); such effect sizes are similar to those of common variants influencing other complex quantitative traits such as height7 and body mass index (BMI)8. The full genome-wide association results explained 7-15% of phenotypic variance after removing the effect of covariates (Extended Data Figure 11). Notably, the genome-wide significant variants identified here showed specific effects on single brain structures rather than pleiotropic effects across multiple structures, despite similar developmental origins as in the case of caudate and putamen (Extended Data Figure 6a). Nevertheless, when we subjected the subcortical meta-analysis results to hierarchical clustering, genetic determinants of the subcortical structures were mostly grouped into larger circuits according to their developmental and functional subdivisions (Extended Data Figure 6b). Genetic variants may therefore have coherent effects on functionally-associated subcortical networks. Multivariate cross-structure9 analyses confirmed the univariate results, but no additional loci reached genome-wide significance (Extended Data Figure 6c). The clustering of results into known brain circuits in the absence of individually significant genetic variants found in the cross-structure analysis suggests variants of small effect may have similar influences across structures. Most variants previously reported to be associated with brain structure and/or function showed little evidence of large-scale volumetric effects (Supplementary Table 8). We detected an intriguing association with hippocampal volume at a SNP with a genome-wide significant association with schizophrenia10 (rs2909457; P = 2.12x10⁻⁶; where the A allele is associated with decreased risk for schizophrenia and decreased hippocampal volume). In general, however, we detected no genome-wide significant association with brain structure for genome-wide significant loci that contribute risk for neuropsychiatric illnesses (Supplementary Table 9).
Of the four loci influencing putamen volume, we identified an intergenic locus 50 kb downstream of the KTN1 gene (rs945270; 14q22.3; n = 28,275; P = 1.08x10⁻³³), which encodes the protein kinectin, a receptor that allows vesicle binding to kinesin and
is involved in organelle transport11. Second, we identified an intronic locus within DCC (rs62097986; 18q21.2; n = 28,036; P = 1.01x10⁻¹³), which encodes a netrin receptor involved in axon guidance and migration, including in the developing striatum12 (Extended Data Figure 3b). Expression of DCC throughout the brain is highest in the first two trimesters of prenatal development13 (Extended Data Figure 8b), suggesting this variant may influence brain volumes early in neurodevelopment. Third, we identified an intronic locus within BCL2L1 (rs6087771; 20q11.21; n = 25,540; P = 1.28x10⁻¹²), which encodes an anti-apoptotic factor that inhibits programmed cell death of immature neurons throughout the brain14 (Extended Data Figure 3c). Consistent with this, expression of BCL2L1 in the striatum strongly decreases at the end of neurogenesis (24-38 post-conception weeks (PCW); Extended Data Figure 8c), a period marked by increased apoptosis in the putamen13,15. Fourth, we identified an intronic locus within DLG2 (rs683250; 11q14.1; n = 26,258; P = 3.94x10⁻¹¹), which encodes the postsynaptic density 93 (PSD-93) protein (Extended Data Figure 3d). PSD-93 is a membrane-associated guanylate kinase involved in organizing channels in the postsynaptic density16. DLG2 expression increases during early mid-fetal development in the striatum13 (Extended Data Figure 8d). Genetic variants in DLG2 affect learning and cognitive flexibility17 and are associated with schizophrenia18. Notably, SNPs associated with variation in putamen volume showed enrichment of genes involved in apoptosis and axon guidance pathways (Extended Data Figure 7; Supplementary Table 7).
Hippocampal volume showed an intergenic association near the HRK gene (rs77956314; 12q24.22; n = 17,190; P = 2.82x10⁻¹⁵; Extended Data Figure 3g) and with an intronic locus in the MSRB3 gene (rs61921502; 12q14.3; n = 16,209; P = 6.87x10⁻¹¹; Extended Data Figure 3h), supporting our prior analyses5,19 of smaller samples imputed to HapMap3 references. Caudate volume was associated with an intergenic locus 80 kb from FAT3 (rs1318862; 11q14.3; n = 15,031; P = 6.17x10⁻⁹; Extended Data Figure 3e). This gene encodes a cadherin specifically expressed in the nervous system during embryonic development that influences neuronal morphology through cell-cell interactions20. ICV was associated with an intronic locus within CRHR1 that tags the chromosome 17q21 inversion21 which has been previously found to influence ICV6 (rs17689882; 17q21.31; n = 12,822; P = 7.72x10⁻⁹; Extended Data Figure 3f). Another previously identified variant with association to ICV (rs10784502)5,19 did not survive genome-wide significance in this analysis but did show a nominal effect in the same direction (P = 2.05x10⁻³; n = 11,373). None of the genome-wide significant loci in this study were in Linkage Disequilibrium (LD) with known functional coding variants, splice sites, or 3’/5’ untranslated regions (UTRs) though several of the loci had epigenetic markings suggesting a regulatory role (Extended Data Figure 3).
Given the strong association with putamen volume, we further examined the rs945270 locus. Epigenetic markers suggest insulator functionality near the locus as this is the lone chromatin mark in the intergenic region22 (Extended Data Figure 3a). Chromatin-immunoprecipitation followed by sequencing (ChIP-seq) indicate that a variant (rs8017172) in complete LD with rs945270 (r2 = 1.0) lies within a binding site of the CTCF (CCCTC-binding factor) transcription regulator (Extended Data Figure 9)23 in embryonic stem cells. To assess potential functionality in brain tissue, we tested for association with gene expression 1 Mb up/down-stream. We identified and replicated an effect of rs945270 on the expression of the KTN1 gene. The C allele, associated with larger putamen volume, also increased expression of KTN1 in the frontal cortex (discovery sample: 304 neuropathologically normal controls (NNCs) [P = 4.1x10⁻¹¹]24; replication sample: 134 NNCs [P = 0.025]), and putamen (sample: 134 NNCs [P = 0.049]25; Figure 2a and b). In blood, rs945270 was also strongly associated with KTN1 expression (P = 5.94x10⁻³¹; n = 5,311)26. After late fetal development, KTN1 is expressed
in the human thalamus, striatum, and hippocampus; it is more highly expressed in the striatum than the cortex (Extended Data Figure 8a)13. KTN1 encodes the kinectin receptor facilitating vesicle binding to kinesin, and is heavily involved in organelle transport11. Kinectin is only found in the dendrites and soma of neurons, not their axons; neurons with more kinectin have larger cell bodies27, and knock-down of kinectin strongly influences cell shape28. The volumetric effects identified here may therefore reflect genetic control of neuronal cell size and/or dendritic complexity. Using 3D surface models of putamen segmentations in MRIs of 1,541 healthy adolescent subjects, we further localized allelic effects of rs945270 to regions along the superior and lateral putamen bilaterally, independent of chosen segmentation protocol (Figure 2c; Extended Data Figure 10). Each copy of the C allele was associated with an increase in volume along anterior superior regions receiving dense cortical projections from dorsolateral prefrontal cortex and supplementary motor area29,30.
In summary, we discovered multiple common genetic variants underlying variation in different structures within the human brain. Many appear to exert their effects through known developmental pathways including apoptosis, axon guidance, and vesicle transport. All structure volumes showed high heritability, but individual genetic variants had diverse effects. Strongest effects were found for putamen and hippocampal volumes, whereas other structures delineated with similar reliability like thalamus showed no association with these or other loci (Supplementary Table 4). Discovery of common variants affecting the human brain is now feasible using collaborative analysis of MRI data, and may elucidate genetic mechanisms driving development and disease.
References 1 Blokland, G. A., de Zubicaray, G. I., McMahon, K. L. & Wright, M. J. Genetic and
environmental influences on neuroimaging phenotypes: a meta-analytical perspective on twin imaging studies. Twin research and human genetics : the official journal of the International Society for Twin Studies 15, 351-371, (2012).
2 Kravitz, A. V. et al. Regulation of parkinsonian motor behaviours by optogenetic control of basal ganglia circuitry. Nature 466, 622-626, (2010).
3 Poldrack, R. A. et al. Interactive memory systems in the human brain. Nature 414, 546-550, (2001).
4 Pessiglione, M., Seymour, B., Flandin, G., Dolan, R. J. & Frith, C. D. Dopamine-dependent prediction errors underpin reward-seeking behaviour in humans. Nature 442, 1042-1045, (2006).
5 Stein, J. L. et al. Identification of common variants associated with human hippocampal and intracranial volumes. Nature genetics 44, 552-561, (2012).
6 Ikram, M. A. et al. Common variants at 6q22 and 17q21 are associated with intracranial volume. Nature genetics 44, 539-+, (2012).
7 Lango Allen, H. et al. Hundreds of variants clustered in genomic loci and biological pathways affect human height. Nature 467, 832-838, (2010).
8 Speliotes, E. K. et al. Association analyses of 249,796 individuals reveal 18 new loci associated with body mass index. Nature genetics 42, 937-948, (2010).
9 van der Sluis, S., Posthuma, D. & Dolan, C. V. TATES: efficient multivariate genotype-phenotype analysis for genome-wide association studies. PLoS genetics 9, e1003235, (2013).
10 Schizophrenia Working Group of the Psychiatric Genomics, C. Biological insights from 108 schizophrenia-associated genetic loci. Nature 511, 421-427, (2014).
11 Kumar, J., Yu, H. & Sheetz, M. P. Kinectin, an Essential Anchor for Kinesin-Driven Vesicle Motility. Science 267, 1834-1837, (1995).
12 Hamasaki, T., Goto, S., Nishikawa, S. & Ushio, Y. A role of netrin-1 in the formation of the subcortical structure striatum: repulsive action on the migration of late-born striatal neurons. The Journal of neuroscience : the official journal of the Society for Neuroscience 21, 4272-4280, (2001).
13 Kang, H. J. et al. Spatio-temporal transcriptome of the human brain. Nature 478, 483-489, (2011).
14 Motoyama, N. et al. Massive cell death of immature hematopoietic cells and neurons in Bcl-x-deficient mice. Science 267, 1506-1510, (1995).
15 Itoh, K. et al. Apoptosis in the basal ganglia of the developing human nervous system. Acta neuropathologica 101, 92-100, (2001).
16 Scannevin, R. H. & Huganir, R. L. Postsynaptic organization and regulation of excitatory synapses. Nat Rev Neurosci 1, 133-141, (2000).
17 Nithianantharajah, J. et al. Synaptic scaffold evolution generated components of vertebrate cognitive complexity. Nature Neuroscience 16, 16-U37, (2013).
18 Kirov, G. et al. De novo CNV analysis implicates specific abnormalities of postsynaptic signalling complexes in the pathogenesis of schizophrenia. Mol Psychiatr 17, 142-153, (2012).
19 Bis, J. C. et al. Common variants at 12q14 and 12q24 are associated with hippocampal volume. Nature genetics 44, 545-+, (2012).
20 Deans, M. R. et al. Control of Neuronal Morphology by the Atypical Cadherin Fat3. Neuron 71, 820-832, (2011).
21 Stefansson, H. et al. A common inversion under selection in Europeans. Nature genetics 37, 129-137, (2005).
22 Ernst, J. & Kellis, M. ChromHMM: automating chromatin-state discovery and characterization. Nature methods 9, 215-216, (2012).
23 Ziebarth, J. D., Bhattacharya, A. & Cui, Y. CTCFBSDB 2.0: a database for CTCF-binding sites and genome organization. Nucleic acids research 41, D188-194, (2013).
24 Hernandez, D. G. et al. Integration of GWAS SNPs and tissue specific expression profiling reveal discrete eQTLs for human traits in blood and brain. Neurobiol Dis 47, 20-28, (2012).
25 Ramasamy, A. et al. Genetic variability in the regulation of gene expression in ten regions of the human brain. Nature Neuroscience Epub Ahead of Print, (2014).
26 Westra, H. J. et al. Systematic identification of trans eQTLs as putative drivers of known disease associations. Nature genetics 45, 1238-1243, (2013).
27 Toyoshima, I. & Sheetz, M. P. Kinectin distribution in chicken nervous system. Neurosci Lett 211, 171-174, (1996).
28 Zhang, X. et al. Kinectin-mediated endoplasmic reticulum dynamics supports focal adhesion growth in the cellular lamella. J Cell Sci 123, 3901-3912, (2010).
29 Cohen, M. X., Schoene-Bake, J. C., Elger, C. E. & Weber, B. Connectivity-based segregation of the human striatum predicts personality characteristics. Nat Neurosci 12, 32-34, (2009).
30 Parent, A. & Hazrati, L. N. Functional anatomy of the basal ganglia. I. The cortico-basal ganglia-thalamo-cortical loop. Brain research. Brain research reviews 20, 91-127, (1995).
Supplementary Information is linked to the online version of the paper at www.nature.com/nature. Acknowledgments Funding sources for contributing sites and acknowledgments of contributing consortia authors can be found in Supplementary Information Note 3.
Author Contributions Individual author contributions are listed in Supplementary Information Note 4.
Author Information Summary statistics from GWAS results are available online using the ENIGMA-Vis web tool: http://enigma.ini.usc.edu/enigma-vis/. Reprints and permissions information is available at www.nature.com/reprints. The authors have no conflict of interest to declare. Correspondence and requests for materials should be addressed to Drs. Paul Thompson and Sarah Medland.
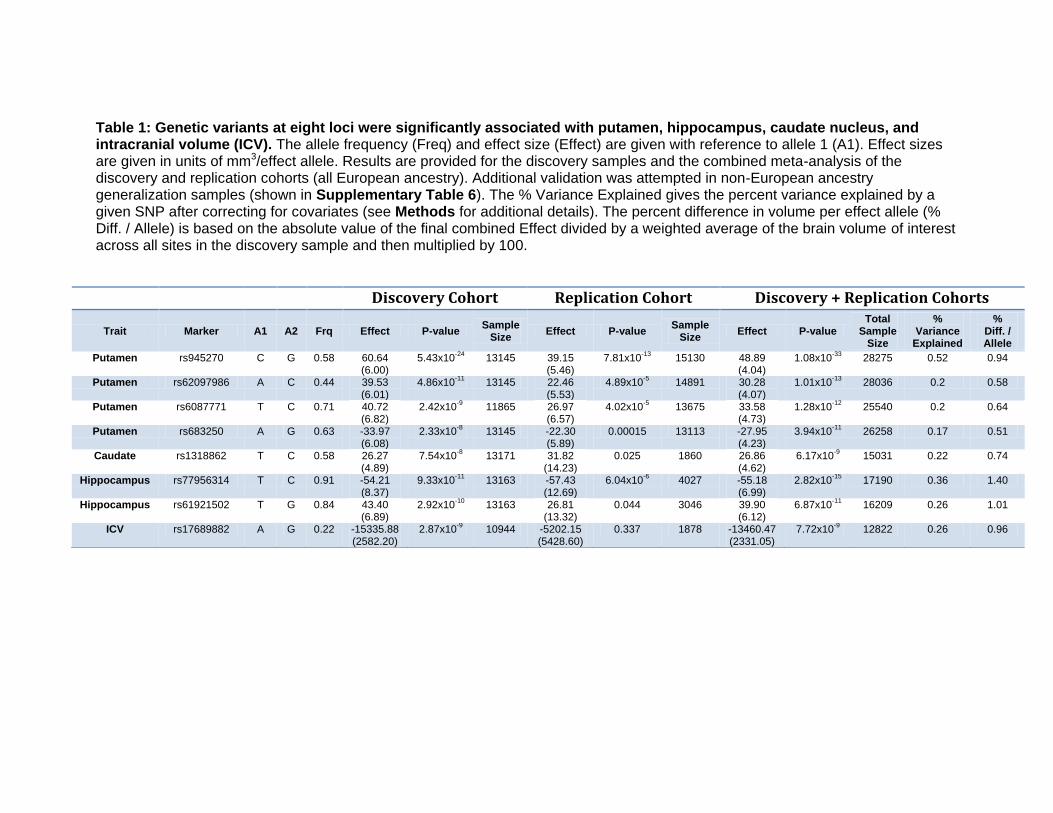
Table 1: Genetic variants at eight loci were significantly associated with putamen, hippocampus, caudate nucleus, and intracranial volume (ICV). The allele frequency (Freq) and effect size (Effect) are given with reference to allele 1 (A1). Effect sizes are given in units of mm3/effect allele. Results are provided for the discovery samples and the combined meta-analysis of the discovery and replication cohorts (all European ancestry). Additional validation was attempted in non-European ancestry generalization samples (shown in Supplementary Table 6). The % Variance Explained gives the percent variance explained by a given SNP after correcting for covariates (see Methods for additional details). The percent difference in volume per effect allele (% Diff. / Allele) is based on the absolute value of the final combined Effect divided by a weighted average of the brain volume of interest across all sites in the discovery sample and then multiplied by 100.
Discovery Cohort Replication Cohort Discovery + Replication Cohorts
Trait Marker A1 A2 Frq Effect P-value Sample
Size Effect P-value
Sample Size
Effect P-value Total
Sample Size
% Variance
Explained
% Diff. / Allele
Putamen rs945270 C G 0.58 60.64 (6.00)
5.43x10⁻²⁴
13145 39.15 (5.46)
7.81x10⁻¹³
15130 48.89 (4.04)
1.08x10⁻³³
28275 0.52 0.94
Putamen rs62097986 A C 0.44 39.53 (6.01)
4.86x10⁻¹¹
13145 22.46 (5.53)
4.89x10⁻⁵
14891 30.28 (4.07)
1.01x10⁻¹³
28036 0.2 0.58
Putamen rs6087771 T C 0.71 40.72 (6.82)
2.42x10⁻⁹
11865 26.97 (6.57)
4.02x10⁻⁵
13675 33.58 (4.73)
1.28x10⁻¹²
25540 0.2 0.64
Putamen rs683250 A G 0.63 -33.97 (6.08)
2.33x10⁻⁸
13145 -22.30 (5.89)
0.00015 13113 -27.95 (4.23)
3.94x10⁻¹¹
26258 0.17 0.51
Caudate rs1318862 T C 0.58 26.27 (4.89)
7.54x10⁻⁸
13171 31.82 (14.23)
0.025 1860 26.86 (4.62)
6.17x10⁻⁹
15031 0.22 0.74
Hippocampus rs77956314 T C 0.91 -54.21 (8.37)
9.33x10⁻¹¹
13163 -57.43 (12.69)
6.04x10⁻⁶
4027 -55.18 (6.99)
2.82x10⁻¹⁵
17190 0.36 1.40
Hippocampus rs61921502 T G 0.84 43.40 (6.89)
2.92x10⁻¹⁰
13163 26.81 (13.32)
0.044 3046 39.90 (6.12)
6.87x10⁻¹¹
16209 0.26 1.01
ICV rs17689882 A G 0.22 -15335.88 (2582.20)
2.87x10⁻⁹
10944 -5202.15 (5428.60)
0.337 1878 -13460.47 (2331.05)
7.72x10⁻⁹
12822 0.26 0.96
Figure Legends
Figure 1: Common genetic variants associated with subcortical and intracranial volumes. Manhattan plots colored with a scheme that matches the corresponding structure (middle panel) are displayed for each subcortical volume studied here. Genome-wide significance is shown for the common P = 5x10⁻⁸ threshold (grey dotted line) and also for the multiple comparisons-corrected threshold of P = 7.1x10⁻⁹ (red dotted line). The most significant SNP within an associated locus is labeled. Figure 2: Effect of rs945270 on KTN1 expression and putamen shape. (a,b) eQTL study in brain tissue demonstrates the effect of rs945270 on KTN1 gene expression (a) in frontal cortex tissue from 304 subjects from the North American Brain Expression Cohort (NABEC) and (b) in an independent sample of 134 subjects from the United Kingdom Brain Expression Cohort (UKBEC) sampled from both frontal cortex and putamen. Boxplot dashed bars mark the 25 and 75 percentile. (c) Surface-based analysis demonstrates that rs945270 has strong effects on the shape of superior and lateral portions of the putamen in 1,541 subjects. Each copy of the rs945270-C allele was significantly associated with increased width in colored areas (false discovery rate corrected at q = 0.05) and the degree of deformation is labeled by color, with red colors indicating greater deformation. Orientation is indicated by arrows: A: anterior; P: posterior, S: superior; I: inferior.
Methods Details of the GWAS meta-analysis are outlined in Extended Data Figure 1. All participants in all cohorts in this study gave written informed consent and sites involved obtained approval from local research ethics committees or Institutional Review Boards. The ENIGMA Consortium follows a rolling meta-analysis framework for incorporating sites into the analysis. The discovery sample comprises studies of European ancestry (Extended Data Figure 2) that contributed GWAS summary statistics for the purpose of this analysis on or before October 1, 2013. The deadline for discovery samples to upload their data was made prior to inspecting the data and was not influenced by the results of the analyses. The meta-analyzed results from discovery cohorts were carried forward for secondary analyses and functional validation studies. Additional samples of European ancestry were gathered to provide in silico or single genotype replication of the strongest associations as part of the replication sample. A generalization sample of sites with non-European ancestry was used to examine the effects across ethnicities. In all, data were contributed from 50 cohorts, each of which is detailed in Supplementary Tables 1-3.
The brain measures examined in this study were obtained from structural MRI data collected at participating sites around the world. Brain scans were processed and examined at each site locally, following a standardized protocol procedure to harmonize the analysis across sites. The standardized protocols for image analysis and quality assurance are openly available online (http://enigma.ini.usc.edu/protocols/imaging-protocols/). The subcortical brain measures (nucleus accumbens, amygdala, caudate nucleus, hippocampus, pallidum, putamen, and thalamus) were delineated in the brain using well-validated, freely available brain segmentation software packages: FIRST31, part of the FMRIB Software Library (FSL), or FreeSurfer32. The agreement between the two software packages has been well documented in the literature5,33 and was further detailed here (Supplementary Table 4). Participating sites used the software package most suitable for their dataset (the software used at each site is given in Supplementary Table 2) without selection based on genotype or the associations present in this study. In addition to the subcortical structures of the brain, we examined the genetic effects of a measure of global head size, intracranial volume (ICV). The ICV was calculated as 1/[determinant of a rotation-translation matrix obtained after affine registration to a common study template and multiplied by the template volume] (1,948,105 mm3). After image processing, each image was inspected individually to identify poorly segmented structures. Each site contributed histograms of the distribution of volumes for the left and right hemisphere structures (and a measure of asymmetry) of each subcortical region used in the analysis. Scans marked as outliers (>3 standard deviations from the mean) based on the histogram plots were re-checked at each site to locate any errors. If a scan had an outlier for a given structure, but was segmented properly, it was retained in the analysis. Site-specific phenotype histograms, Manhattan plots, and QQ plots from each participating site are available on the ENIGMA website (http://enigma.ini.usc.edu/publications/enigma-2/).
Each study in the discovery sample was genotyped using commercially available platforms. Prior to imputation, genetic homogeneity was assessed in each sample using multi-dimensional scaling (MDS) analysis (Extended Data Figure 2). Ancestry outliers were excluded through visual inspection of the first two components. Quality control filtering was applied to remove genotyped SNPs with low minor allele frequency (MAF < 0.01), poor genotype call rate (<95%), and deviations from Hardy-Weinberg Equilibrium (HWE p < 1x10⁻⁶) before imputation. The imputation protocols used MaCH34 for haplotype phasing and minimac35 for imputation and are freely available online
(http://enigma.ini.usc.edu/protocols/genetics-protocols/). Full details of quality control procedures and any deviations from the imputation protocol are given in Supplementary Table 3.
Genome-wide association scans were conducted at each site for all eight traits of interest including ICV and bilateral volumes of the nucleus accumbens, amygdala, caudate nucleus, hippocampus, pallidum, putamen, and thalamus. For each SNP in the genome, the additive dosage value was regressed against the trait of interest separately using a multiple linear regression framework controlling for age, age2, sex, 4 MDS components, ICV (for non-ICV phenotypes), and diagnosis (when applicable). For studies with data collected from multiple centers or scanners, dummy-coded covariates were also included in the model. Sites with family data (NTR-Adults, BrainSCALE, QTIM, SYS, GOBS, ASPSFam, ERF, GeneSTAR, NeuroIMAGE, OATS) used mixed-effects models to control for familial relationships in addition to covariates stated previously. The primary analyses for this paper focused on the full set of subjects including datasets with patients in order to maximize the power to detect effects. We re-analyzed the data excluding patients to verify that detected effects were not due to disease alone (Extended Data Figure 5a). The protocols used for testing association with mach2qtl34 for studies with unrelated subjects and merlin-offline36 for family-based designs are freely available online (http://enigma.ini.usc.edu/protocols/genetics-protocols/). Full details for the software used at each site are given in Supplementary Table 3.
The GWAS results from each site were uploaded to a centralized server for quality checking and processing. Results files from each cohort were free from genomic inflation in Quantile-Quantile (QQ) plots and Manhattan plots (http://enigma.ini.usc.edu/publications/enigma-2/). Poorly imputed SNPs (with R2 < 0.5) and low minor allele count (MAC < 10) were removed from the GWAS result files from each site. The resulting files were combined meta-analytically using a fixed-effect, inverse variance-weighted model as implemented in the software package METAL37. The discovery cohorts were meta-analyzed first, controlling for genomic inflation. The combined discovery dataset (comprised of all meta-analyzed SNPs with data from at least 5,000 subjects) was carried forward for the additional analyses detailed below.
To appropriately account for multiple comparisons over the eight traits in our analysis, we first examined the degree of independence between each trait. We generated an 8 x 8 correlation matrix based on the Pearson’s correlation between all pair-wise combinations of the mean volumes of each structure in the QTIM study. Using the matSpD software38 we found that the effective number of independent traits in our analysis was 7. We therefore set a significance criteria threshold of p < (5x10⁻⁸/7) = 7.1x10⁻⁹.
Heritability estimates for mean volumes of each of the eight structures in this study were calculated using structural equation modeling in OpenMx39. Twin modeling was performed controlling for age and sex differences on a large sample (n = 1,030) of healthy adolescent and young adult twins (148 MZ and 202 DZ pairs) and their siblings from the Queensland Twin Imaging (QTIM) study. Subsequently, a multivariate analysis showed that common environmental factors (C) could be dropped from the model without a significant reduction in the goodness-of-fit (Δχ2
36=29.81; P=0.76). Heritability (h2) was significantly different from zero for all eight brain measures: putamen (h2 = 0.89 [95% confidence interval 0.85-0.92]), thalamus (h2 = 0.88 [0.85-0.92]), ICV (h2 = 0.88 [0.84-0.90]), hippocampus (h2 = 0.79 [0.74-83]), caudate nucleus (h2 = 0.78 [0.75-0.82]), pallidum (h2 = 0.75 [0.72-0.78]), nucleus accumbens (h2 = 0.49 [0.45-0.55]), amygdala (h2 = 0.43 [0.39, 0.48]) (Extended Data Figure 11a).
Percent variance explained by each genome-wide significant SNP was determined based on the final combined discovery dataset (Extended Data Figure 6a)
or the discovery combined with the replication samples (Table 1) after correction for covariates using the following equation:
R2g|c / (1 - R2
c) = (t2/((n – k – 1) + t2)) * 100 where the t-statistic is calculated as the Beta coefficient for a given SNP from the regression model (controlling for covariates) divided by the Standard Error of the Beta estimate and where n is the total number of subjects and k is the total number of covariates included in the model (k = 10)40. R2
g|c is the variance explained by the variant controlling for covariates and R2
c is the variance explained by the covariates alone. R2g|c
/ (1 - R2c) gives the variance explained by the genetic variant after accounting for
covariate effects. The total variance explained by the GWAS (Extended Data Figure 11b and c) was calculated by first LD pruning the results without regard to significance (pruning parameters in PLINK: --indep-pairwise 1000kb 25 0.1). The t-statistics of the regression coefficients from the pruned results are then corrected for the effects of "winner’s curse" and the variance explained by each SNP after accounting for covariate effects is summed across SNPs using freely available code (http://sites.google.com/site/honcheongso/software/total-vg)40,41. As the correction for winners curse may be influenced by asymmetry in the distribution of t (arising from the choice of reference allele) we bootstrapped the choice of reference allele (5,000 iterations) to derive the median value and 95% confidence intervals of the estimates of variance explained (Extended Data Figure 11b and c). The correction for winner's curse corrected for upward biases when estimating the percent variance explained by each SNP across the genome via simulation40, but this correction could still allow some bias. Future large studies will be able to independently evaluate the percentage variance explained.
We performed multivariate GWAS using the Trait-based Association Test that uses Extended Simes procedure (TATES)9. For the TATES analysis we used GWAS summary statistics from the discovery dataset and the correlation matrix created from the eight phenotypes using the QTIM dataset (Extended Data Figure 6c).
We examined the moderating effects of mean age and proportion of females on the effect sizes estimated for the top loci influencing brain volumes (Extended Data Figure 5b and c) using a mixed-effect meta-regression model such that:
Effect = β0 + βmodXmod + ε + η
In this model, the effect and variance at each site are treated as random effects and the moderator Xmod (either mean age or proportion of females) is treated as a fixed effect. Meta-regression tests were performed using the metafor package (version 1.9-1) in R.
Hierarchical clustering was performed on the GWAS t-statistics from the discovery dataset results using independent SNPs clumped from the TATES results (clumping parameters: significance threshold for index SNP = 0.01, significance threshold for clumped SNPs = 0.01, r2 = 0.25, physical distance = 1 Mb; Extended Data Figure 6b). Regions with the strongest genetic similarity were grouped together based on the strength of their pairwise correlations. The results were represented visually using hierarchical clustering with default settings from the gplots package (version 2.12.1) in R.
Gene annotation, gene-based test statistics, and pathway analysis were performed using the KGG2.5 software package42 (Supplementary Table 7, Extended Data Figure 7). LD was calculated based on RSID numbers using the 1000 Genomes Project European samples as a reference (http://enigma.ini.usc.edu/protocols/genetics-protocols/). For the annotation, SNPs were considered “within” a gene if they fell within 5 kb of the 3’/5’ UTR based on human genome (hg19) coordinates. Gene-based tests were performed using the GATES test42 without weighting P-values by predicted
functional relevance. Pathway analysis was performed using the HYST test of association43. For all gene-based tests and pathway analyses, results were considered significant if they exceeded a Bonferroni correction threshold accounting for the number of pathways and traits tested such that Pthresh = 0.05/(671 pathways x 7 independent traits) = 1.06 x 10⁻⁵.
Expression quantitative loci were examined in two independent datasets: the North American Brain Expression Consortium (NABEC; GSE36192)24 and the United Kingdom Brain Expression Consortium (UKBEC; GSE46706)44,45. Detailed processing and exclusion criteria for both datasets are described elsewhere24,45. Briefly, the UKBEC is comprised of 134 neuropathologically normal donors from the MRC Sudden Death Brain Bank in Edinburgh and Sun Health Research Institute; expression was profiled on the Affymetrix Exon 1.0 ST array. The NABEC is comprised of 304 neurologically normal donors from the National Institute of Aging and expression profiled on the Illumina HT12v3 array. The expression values were corrected for gender and batch effects and probes that contained polymorphisms (seen > 1% in European 1000G) were excluded from analyses44. Blood eQTL data were queried using the Blood eQTL Browser (http://genenetwork.nl/bloodeqtlbrowser/)26. Brain expression over the life-span was measured from a spatiotemporal atlas of human gene expression and graphed using custom R scripts (GSE25219; details given in13).
Fine-grained 3D surface mappings of the putamen were generated using a medial surface modeling method46,47 in 1,541 healthy subjects from the IMAGEN study48 (Figure 2c; Extended Data Figure 10a,b). Putamen volume segmentations from either FSL (Figure 2c; Extended Data Figure 10a) or FreeSurfer (Extended Data Figure 10b) were first converted to 3D meshes and then co-registered to an average template for statistical analysis. The medial core distance was used as a measure of shape and was calculated as the distance from each point on the surface to the center of the putamen. At each point along the surface of the putamen, an association test was performed using multiple linear regression where the medial core distance at a given point on the surface was the outcome measure and the additive dosage value of the top SNP was the predictor of interest while including the same covariates that were used for volume including age, sex, age2, 4 MDS, ICV and site.
In Extended Data Figure 3, all tracks were taken from the UCSC Genome Browser Human hg19 assembly. SNPs (top 5%) shows the top 5% associated SNPs within the locus and are colored by their correlation to the top SNP. Genes shows the gene models from GENCODE version 19. Conservation was defined at each base through the phyloP algorithm which assigns scores as -log10 p-values under a null hypothesis of neutral evolution calculated from pre-computed genomic alignment of 100 vertebrate species49. Conserved sites are assigned positive scores, while faster-than-neutral evolving sites are given negative scores. TFBS Conserved shows computationally predicted transcription factor binding sites using the Transfac Matrix Database (v.7.0) found in human, mouse, and rat. Brain histone (1.3yr) and Brain histone (68yr) show maps of histone trimyethlation at histone H3 Lysine 4 (H3K4me3), an epigenetic mark for transcriptional activation, measured by ChIP-Seq. These measurements were made in neuronal nuclei (NeuN+) collected from prefrontal cortex of post-mortem human brain50. CpG methylation was generated using methylated DNA immunoprecipitation and sequencing from postmortem human frontal cortex of a 57 year old male51. DNaseI hyperSens displays DNaseI hypersensitivity, evidence of open chromatin, which was evaluated in postmortem human frontal cerebrum from 3 donors (age 22-35), through the ENCODE consortium52. Finally, hES Chrom State gives the predicted chromatin states based on computational integration of ChIP-seq data for nine

chromatin marks in H1 human embryonic stem cell lines derived in the ENCODE consortium53.
References 31 Patenaude, B., Smith, S. M., Kennedy, D. N. & Jenkinson, M. A Bayesian model
of shape and appearance for subcortical brain segmentation. NeuroImage 56, 907-922, (2011).
32 Fischl, B. et al. Whole brain segmentation: Automated labeling of neuroanatomical structures in the human brain. Neuron 33, 341-355, (2002).
33 Morey, R. A. et al. Scan-rescan reliability of subcortical brain volumes derived from automated segmentation. Hum Brain Mapp 31, 1751-1762, (2010).
34 Li, Y., Willer, C. J., Ding, J., Scheet, P. & Abecasis, G. R. MaCH: Using Sequence and Genotype Data to Estimate Haplotypes and Unobserved Genotypes. Genet Epidemiol 34, 816-834, (2010).
35 Howie, B., Fuchsberger, C., Stephens, M., Marchini, J. & Abecasis, G. R. Fast and accurate genotype imputation in genome-wide association studies through pre-phasing. Nature genetics 44, 955-959, (2012).
36 Abecasis, G. R., Cherny, S. S., Cookson, W. O. & Cardon, L. R. Merlin-rapid analysis of dense genetic maps using sparse gene flow trees. Nature genetics 30, 97-101, (2002).
37 Willer, C. J., Li, Y. & Abecasis, G. R. METAL: fast and efficient meta-analysis of genomewide association scans. Bioinformatics 26, 2190-2191, (2010).
38 Nyholt, D. R. A simple correction for multiple testing for single-nucleotide polymorphisms in linkage disequilibrium with each other. American journal of human genetics 74, 765-769, (2004).
39 Boker, S. et al. OpenMx: An Open Source Extended Structural Equation Modeling Framework. Psychometrika 76, 306-317, (2011).
40 Walters, R., Bartels, M. & Lubke, G. Estimating variance explained by all variants in meta-analysis with heterogeneity. Behavior genetics 43, 543, (2013).
41 So, H. C., Li, M. & Sham, P. C. Uncovering the total heritability explained by all true susceptibility variants in a genome-wide association study. Genet Epidemiol 35, 447-456, (2011).
42 Li, M. X., Gui, H. S., Kwan, J. S. & Sham, P. C. GATES: a rapid and powerful gene-based association test using extended Simes procedure. American journal of human genetics 88, 283-293, (2011).
43 Li, M. X., Kwan, J. S. & Sham, P. C. HYST: a hybrid set-based test for genome-wide association studies, with application to protein-protein interaction-based association analysis. American journal of human genetics 91, 478-488, (2012).
44 Ramasamy, A. et al. Resolving the polymorphism-in-probe problem is critical for correct interpretation of expression QTL studies. Nucleic acids research 41, (2013).
45 Trabzuni, D. et al. Quality control parameters on a large dataset of regionally dissected human control brains for whole genome expression studies. Journal of neurochemistry 119, 275-282, (2011).
46 Gutman, B. A. et al. Maximizing power to track Alzheimer's disease and MCI progression by LDA-based weighting of longitudinal ventricular surface features. NeuroImage 70, 386-401, (2013).
47 Gutman, B. A., Wang, Y. L., Rajagopalan, P., Toga, A. W. & Thompson, P. M. Shape Matching with Medial Curves and 1-D Group-Wise Registration. 2012 9th Ieee International Symposium on Biomedical Imaging (Isbi), 716-719, (2012).
48 Schumann, G. et al. The IMAGEN study: reinforcement-related behaviour in normal brain function and psychopathology. Mol Psychiatry 15, 1128-1139, (2010).
49 Pollard, K. S., Hubisz, M. J., Rosenbloom, K. R. & Siepel, A. Detection of nonneutral substitution rates on mammalian phylogenies. Genome research 20, 110-121, (2010).
50 Cheung, I. et al. Developmental regulation and individual differences of neuronal H3K4me3 epigenomes in the prefrontal cortex. Proc Natl Acad Sci U S A 107, 8824-8829, (2010).
51 Maunakea, A. K. et al. Conserved role of intragenic DNA methylation in regulating alternative promoters. Nature 466, 253-257, (2010).
52 Boyle, A. P. et al. High-resolution mapping and characterization of open chromatin across the genome. Cell 132, 311-322, (2008).
53 Ernst, J. et al. Mapping and analysis of chromatin state dynamics in nine human cell types. Nature 473, 43-49, (2011).
54 Devlin, B. & Roeder, K. Genomic control for association studies. Biometrics 55, 997-1004, (1999).
55 Hager, R., Lu, L., Rosen, G. D. & Williams, R. W. Genetic architecture supports mosaic brain evolution and independent brain-body size regulation. Nature communications 3, 1079, (2012).
56 Schmucker, D. & Chen, B. Dscam and DSCAM: complex genes in simple animals, complex animals yet simple genes. Genes & development 23, 147-156, (2009).
57 Brunet, A., Datta, S. R. & Greenberg, M. E. Transcription-dependent and -independent control of neuronal survival by the PI3K-Akt signaling pathway. Current opinion in neurobiology 11, 297-305, (2001).
Extended Data Figure Legends Extended Data Figure 1. Outline of the genome-wide association meta-analysis. Structural T1-weighted brain MRI and biological specimens for DNA extraction were acquired from each individual at each site. Imaging protocols were distributed to and completed by each site for standardized automated segmentation of brain structures and calculation of intracranial volume. Volumetric phenotypes were calculated from the segmentations. Genome-wide genotyping was completed at each site using commercially available chips. Standard imputation protocols to the 1000 Genomes reference panel (Phase 1 version 3) were also distributed and completed at each site. Each site completed genome-wide association for each of the 8 volumetric brain phenotypes with the listed covariates. Statistical results from GWAS files were uploaded to a central site for quality checking and fixed effects meta-analysis. Extended Data Figure 2. Ancestry inference via multi-dimensional scaling plots. Multi-dimensional scaling (MDS) plots of the Discovery cohorts to HapMap III reference panels of known ancestry are displayed. Ancestry is generally homogeneous within each group. In all discovery samples any individuals with non-European ancestry were excluded before association. The axes have been flipped to the same orientation for each sample for ease of comparison. Reference panels: ASW (African ancestry in Southwest USA); CEU (Utah residents with Northern and Western European ancestry from the CEPH collection); CHD (Chinese in Metropolitan Denver, Colorado); GIH (Gujarati Indians in Houston, Texas); LWK (Luhya in Webuye, Kenya); MEX (Mexican ancestry in Los Angeles, California); MKK (Maasai in Kinyawa, Kenya); TSI (Tuscans in Italy); YRI (Yoruba in Ibadan, Nigeria). Extended Data Figure 3: Genomic function is annotated near novel genome-wide significant loci. For each panel, zoomed-in Manhattan plots (+/- 400 kb from top SNP) are shown with gene models below (GENCODE version 19). Plots below are zoomed to highlight the genomic region that likely harbors the causal variant(s) (r2 > 0.8 from the top SNP). Genomic annotations from the UCSC browser and ENCODE are displayed to indicate potential functionality (see Methods for detailed track information). SNP coverage is low in (f) due to a common genetic inversion in the region. Each plot was made using the LocusTrack software (http://gump.qimr.edu.au/general/gabrieC/LocusTrack/). Extended Data Figure 4. Quantile-quantile and forest plots from meta-analysis of discovery cohorts. (a) Quantile-quantile (QQ) plots show that the observed P-values only deviate from the expected null distribution at the most significant values, implying that population stratification or cryptic relatedness are not unduly inflating the results. This is quantified through the genomic control parameter (lambda; which evaluates whether the median test statistic deviates from expected)54. Lambda values near 1 indicate that the median test statistic is similar to those derived from a null distribution. Corresponding meta-analysis Manhattan plots can be found in Figure 1. (b) Forest plots show the effect at each of the contributing sites to the meta-analysis. The size of the dot is proportional to the sample size, the effect is shown by the position on the x-axis, and the standard error is shown by the line. Sites with a * indicate the genotyping of a proxy SNP (in perfect linkage disequilibrium (LD) calculated from 1000 Genomes) for replication.
Extended Data Figure 5. Influence of patients with neuropsychiatric disease, age and gender on association results. (a) Scatterplot of effect sizes including and excluding patients with neuropsychiatric disorders for nominally significant SNPs. For each of the eight volumetric phenotypes, SNPs with P < 1x10⁻⁵ in the full discovery set meta-analysis were also evaluated excluding the patients. The Beta values from regression, a measure of effect size, are plotted (blue dots) along with a line of equivalence between the two conditions (red line). The correlation between effect sizes with and without patients was very high (r > 0.99), showing that the SNPs with significant effects on brain structure are unlikely to be driven by the diseased individuals. (b) Meta-regression comparison of effect size with mean age at each site. Each site has a corresponding number and colored dot in each graph. The size of each dot is based on the standard error such that bigger sites with more definitive estimates have larger dots (and more influence on the meta-regression). The age range of participants covered most of the life-span (9-97 years), but only one of these eight loci showed a significant relationship with the mean age of each cohort (rs608771 affecting putamen volume). (c) Meta-regression comparison of effect size with the proportion of females at each site. No loci showed evidence of moderation by the proportion of females in a given sample. However, the proportion of females at each site has a very restricted range, so results should be interpreted with caution. Plotted information follows the same convention as described in (b). The sites are numbered in the following order: (1) AddNeuroMed (2) ADNI (3) ADNI2GO (4) BETULA (5) BFS (6) BIG (7) BIG-Rep (8) BrainSCALE (9) BRCDECC (10) CHARGE (11) EPIGEN (12) GIG (13) GSP (14) HUBIN (15) IMAGEN (16) IMpACT (17) LBC1936 (18) Lieber (19) MAS (20) MCIC (21) MooDS (22) MPIP (23) NCNG (24) NESDA (25) neuroIMAGE (26) neuroIMAGE-Rep (27) NIMH (28) NTR-Adults (29) OATS (30) PAFIP (31) QTIM (32) SHIP (33) SHIP-TREND (34) SYS (35) TCD-NUIG (36) TOP (37) UCLA-BP-NL (38) UMCU. Extended Data Figure 6. Cross-structure analyses. (a) Radial plots of effect sizes from the discovery sample for all genome-wide significant SNPs identified in this study. Plots indicate the effect of each genetic variant, quantified as percent variance explained, on the eight volumetric phenotypes studied. As expected, the SNPs identified with influence on a phenotype show the highest effect size for that phenotype: putamen volume (rs945270, rs62097986, rs608771, rs683250), hippocampal volume (rs77956314, rs61921502), caudate volume (rs1318862), and ICV (rs17689882). In general much smaller effects are observed on other structures. (b) Correlation heat map of GWAS test statistics (t-values) and hierarchical clustering55. Independent SNPs were chosen within an LD block based on the highest association in the multivariate cross-structure analysis described in Extended Data Figure 6c. Two heat maps are shown taking only independent SNPs with either P < 1x10⁻⁴ (left) or P < 0.01 (right) in the multivariate cross-structure analysis. Different structures are labeled in developmentally similar regions by the color bar on the top and side of the heat map including basal ganglia (putamen, pallidum, caudate, accumbens; blue), amygdalo-hippocampal complex (hippocampus and amygdala; red), thalamus (turquoise) and intracranial volume (black). Hierarchical clustering showed that developmentally similar regions have mostly similar genetic influences across the entire genome. The low correlation with ICV is due to it being used as a covariate in the subcortical structure GWAS associations. (c) A multivariate cross-structure analysis of all volumetric brain traits. A Manhattan plot (left) and corresponding Quantile-Quantile plot (right) of multivariate GWAS analysis of all traits (volumes of the accumbens, amygdala, caudate, hippocampus, pallidum, putamen and thalamus, and ICV) in the discovery dataset using the TATES method9 is shown.
Multivariate cross-structure analysis confirmed the univariate analyses (see Table 1), but did not reveal any additional loci achieving cross-structure levels of significance.
Extended Data Figure 7. Pathway analysis of GWAS results for each brain structure. A pathway analysis was performed on each brain volume GWAS using KGG42 to conduct gene-based tests and the Reactome database for pathway definition43. Pathway-wide significance was calculated using a Bonferroni correction threshold accounting for the number of pathways and traits tested such that Pthresh = 0.05/(671 pathways x 7 independent traits) = 1.06 x 10⁻⁵ and is shown here as a red-line. The number of independent traits was calculated by accounting for the non-independence of each of the 8 traits examined (described in the Methods). Variants that influence the putamen were clustered near genes known to be involved in DSCAM interactions, neuronal arborization and axon guidance56. Variants that influence intracranial volume are clustered near genes involved in EGFR and PI3K/AKT signaling pathways, known to be involved in neuronal survival57. All of these represent potential mechanisms by which genetic variants influence brain structure. It is important to note that the HYST method for pathway analysis used here can be strongly influenced by a few highly significant genes, as was the case for putamen hits where DCC and BCL2L1 were driving the pathway results. Extended Data Figure 8. Spatio-temporal maps showing expression of genes near the four significant putamen loci over time and throughout regions of the brain. Spatio-temporal gene expression13 was plotted as normalized log2 expression. Different areas of the neocortex (OFC: orbital prefrontal cortex, DFC: dorsolateral prefrontal cortex, VFC: ventrolateral prefrontal cortex, MFC: medial prefrontal cortex, M1C: primary motor cortex, S1C: primary somatosensory cortex, IPC: posterior inferior parietal cortex, A1C: primary auditory cortex, STC: superior temporal cortex, ITC: inferior temporal cortex, V1C: primary visual cortex) as well as subcortical areas (HIP: hippocampus, AMY: amygdala, STR: striatum, MD: mediodorsal nucleus of the thalamus, CBC: cerebellar cortex) are plotted from 10 post-conception weeks (PCW) to over 60 years old. Genes that likely influence putamen volume are expressed in the striatum (STR) at some point during the life-span. After late fetal development, KTN1 is expressed in the human thalamus, striatum, and hippocampus and is more highly expressed in the striatum than the cortex. Most genes appear to have strong gradients of expression across time with DCC most highly expressed during early prenatal life, and DLG2 most highly expressed at mid-fetal periods and throughout adulthood. BCL2L1, which inhibits programmed cell death, has decreased striatal expression at the end of neurogenesis (24-38 PCW), a period marked by increased apoptosis in the putamen15. Extended Data Figure 9. CTCF binding sites in the vicinity of the putamen locus marked by rs945270. CTCF binding sites from the ENCODE project are displayed from the database CTCFBSDB 2.023 from two different cell types: embryonic stem cells (track ENCODE_Broad_H1-hESC_99540) and a neuroblastoma cell line differentiated with retinoic acid (ENCODE_UW_SK-N-SH_RA_97826). A proxy SNP to the top hit within the locus, rs8017172 (r2 = 1.0 to rs945270), lies within a CTCF binding site called based on ChIP-Seq data in the ES cells and near the binding site in neural SK-N-SH cells. As this is the lone chromatin mark in the intergenic region (see Extended Data Figure 3), it suggests that the variant may disrupt a CTCF binding site and thereby influence transcription of surrounding genes.
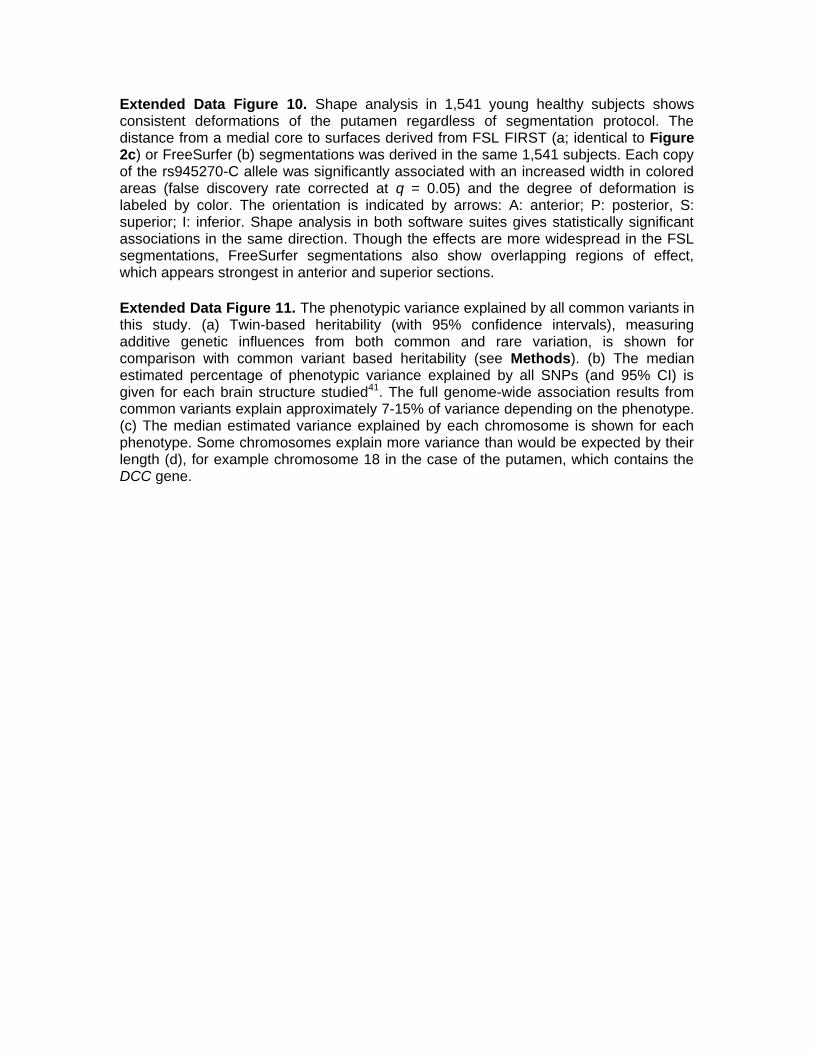
Extended Data Figure 10. Shape analysis in 1,541 young healthy subjects shows consistent deformations of the putamen regardless of segmentation protocol. The distance from a medial core to surfaces derived from FSL FIRST (a; identical to Figure 2c) or FreeSurfer (b) segmentations was derived in the same 1,541 subjects. Each copy of the rs945270-C allele was significantly associated with an increased width in colored areas (false discovery rate corrected at q = 0.05) and the degree of deformation is labeled by color. The orientation is indicated by arrows: A: anterior; P: posterior, S: superior; I: inferior. Shape analysis in both software suites gives statistically significant associations in the same direction. Though the effects are more widespread in the FSL segmentations, FreeSurfer segmentations also show overlapping regions of effect, which appears strongest in anterior and superior sections. Extended Data Figure 11. The phenotypic variance explained by all common variants in this study. (a) Twin-based heritability (with 95% confidence intervals), measuring additive genetic influences from both common and rare variation, is shown for comparison with common variant based heritability (see Methods). (b) The median estimated percentage of phenotypic variance explained by all SNPs (and 95% CI) is given for each brain structure studied41. The full genome-wide association results from common variants explain approximately 7-15% of variance depending on the phenotype. (c) The median estimated variance explained by each chromosome is shown for each phenotype. Some chromosomes explain more variance than would be expected by their length (d), for example chromosome 18 in the case of the putamen, which contains the DCC gene.
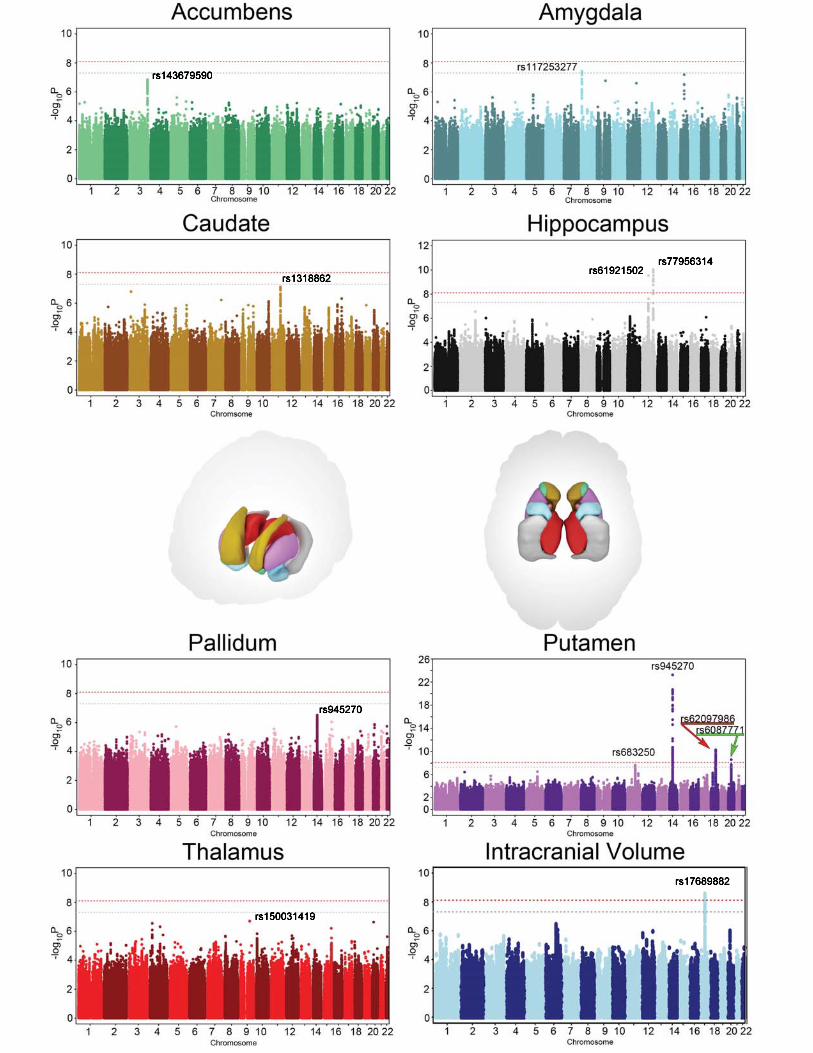
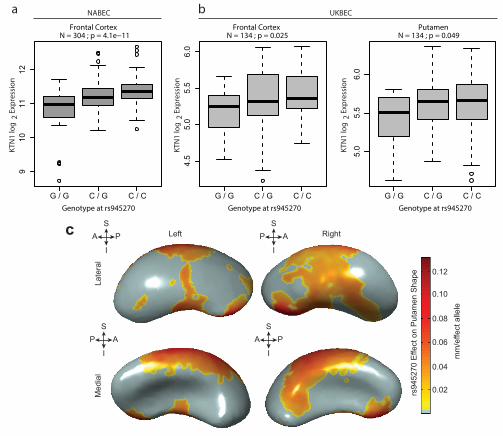
910
1112
Frontal Cortex N = 304 ; p = 4.1e−11
Genotype at rs945270
G / G C / G C / C4.
55.
05.
56.
0
N = 134 ; p = 0.025
Genotype at rs945270
G / G C / G C / C
5.0
5.5
6.0
PutamenN = 134 ; p = 0.049
Genotype at rs945270
G / G C / G C / C
Frontal Cortex
UKBECNABECa bKT
N1
log
2 Ex
pres
sion
KTN
1 lo
g2
Expr
essi
on
KTN
1 lo
g2
Expr
essi
on
Left
Late
ral
Med
ial
Right
0.02
mm
/effe
ct a
llele
c
S
I
P AS
I
A P
S
I
P A
0.04
0.06
0.08
0.10
0.12
S
I
A P
rs94
5270
Effe
ct o
n P
utam
en S
hape