commercial arbors 2020 master plan - … of the honolulu waterfront master plan and the 2010 master...
TRANSCRIPT

Cruise Ship at Pier 9, Honolulu Harbor
COMMERCIAL ARBORS 2020 MASTER PLAN
Prepared by HAWAII STATE DEPARTMENT OF TRANSPORTATION
HARBORS DIVISION 79 South Nimitz Highway Honolulu, Hawaii 96813
www.state.hi.usidot/harbors
May 1997
AR00025010
Table of Contents
OAHU COMMERCIAL HARBORS 2020 MASTER PLAN
• Table of Contents
Chapter
Promulgation Statement, Governor's Approval
Executive Summary
Introduction
Page
iv
vi
I-1
II. Planning Objectives Il-i
III. Economic Impact of Hawaii's Port System III-1
A. Value of the Port System 111-I
1 Economic Activity III-1
2, Employment 111-2
3. Economic Impact Analysis 111-2
B. Hawaii's Dependence on Commercial Harbor Activity 111-3
1. The Commercial Harbor - Hawaii's Primary Infrastructure 111-3
2. Harbor Development and Improvement 111-4
IV. Harbor History IV-!
V. Methodology V- 1
A. Organization V-1
1. Task Force V- 1
• 2. Sub-Groups V- 1
3. Planning Committee V-7
4. Executive Committee V-9
B. Data Gathering V-1 0
C. 2020 Projections V-11
AR00025011

Table of Contents
OAHU COMMERCIAL HARBORS 2020 MASTER PLAN
Table of Contents
Chapter Page
Promulgation Statement, Governor's Approval iv
Executive Summary vi
I. Introduction I- 1
IL Planning Objectives II-I
III. Economic Impact of Hawaii's Port System Ill-1
A. Value of the Port System Ill-1
1. Economic Activity III- 1
2. Employment 111-2
3. Economic Impact Analysis 111-2
B. Hawaii's Dependence on Commercial Harbor Activity 111-3
1. The Commercial Harbor - Hawaii's Primaty Infrastructure 111-3
2. Harbor Development and Improvement 1II-4
IV. Harbor History IV-!
V. Methodology V- 1
A. Organization V-1
1. Task Force V- 1
2. Sub-Groups V- 1
3. Planning Committee V-7
4. Executive Committee V-9
B. Data Gathering V- I 0
C. 2020 Projections V-11
AR0002501 2

Table of Contents
Chapter Page
VI. Planning Committee's Recommended 2020 Plan.
Description of Maritime Activities, Recommendations and Alternatives VI-1
A. Container Cargo Terminal(s) VI-1
B. Berths VI-3
C. Roadways VI-5
D. Cruise Passenger Terminal(s) VI-5
E. Honolulu Harbor Navigation Improvements & Traffic Flow VI-6
F. Barbers Point Expansion Project VI-7
G. Dry Bulk Cargo Terminal(s) VI-8
H. Acquire Daishowa Area At Pier 40 VI-9
I. Liquid Bulk Cargo Terminal(s)
J. Automobile Cargo Terminal(s) VI-10
K. Kewalo Basin Navigation Improvements VI-10
L. Excursion Vessel Passenger Terminal VI-11
M. General Cargo Terminal(s) VI-12
N. Boat Building, Repair and Maintenance VI-12
0. Domestic Fishing Village VI-13
P. Ferry Terminal VI-14
Q. Foreign Garbage Disposal Facility VI-14
R. Maritime Office Building VI-15
S. Multi-Purpose Storage Area VI-15
T. One Stop Shop VI-16
U. Additional Recommendations VI-16
II
AR0002501 3

Table of Contents
Chapter Page
VII. Maps VH-1
A. Honolulu Harbor. V11-2
B. Kewalo Basin VII-2
C. Barbers Point Deep Draft Harbor. VII-3
D. Ala Wai Yacht Harbor VII-3
VIII. Financial Considerations VIII-1
IX. Environmental Considerations IX-1
A. Applicable Environmental Laws, Rules, Regulations and Permits IX-1
B. Potential Environmental Impacts IX-6
X. Acknowledgement of Participants X-1
Appendices
A. Glossary APP:A-1
B. Oahu Cargo Forecasts and Future Port Facility Requirements APP:B-1
C. Preliminary Survey, Questionnaire, List of Interviewed Agencies APP:C-1
AR00025014

ga.:-01(J /31 /117 KAZU HAYAS Director of Transportation Chairman, Executive Committee
Date
Governor's Approval
January 17, 1997
TO: THE HONORABLE BENJAMIN J. CAYETANO GOVERNOR OF HAWAII
FROM: KAZU HAYASBIDA, DIRECTOR OF TRANSPORTATION AND
MURRAY R. "RANDY" GRUNE, EXECUTIVE VICE PRESIDENT HAWAII STEVEDORES, INC.
PLANNING COMMITTEE CHAIRMEN, OAHU COMMERCIAL HARBORS 2020 MASTER PLAN
SUBJECT: OAHU COMMERCIAL HARBORS 2020 MASTER PLAN
The Oahu Commercial Harbors 2020 Master Plan has been prepared as a long-range guide for the development of Oahu's commercial ports. This document updates the commercial harbor plans of the Honolulu Waterfront Master Plan and the 2010 Master Plan for Barbers Point Harbor. The Executive Committee, having jurisdictional concerns and having been duly consulted, recommends the attached plan for your approval.
The Oahu Commercial Harbors 2020 Master Plan represents an involved, cooperative efforts of private enterprise and government service. Hundreds of concerned business operators and harbor users, at one time or another, participated in every step of the plan's development. The Planning Committee, on behalf of all who have assisted, unanimously endorses this plan.
I 57
MURRAY R. "RANDY" GRUNE Date Executive Vice President, Hawaii Stevedores, Inc. Chairman, Planning Committee
iv
AR0002501 5

MAY- 5197 Date
SW 21 1997
EARL I. ANZ Director of Budget & Finance Executive Committee Member
LAWRENCE MIIKE, MD., J.D. Director of Health Executive Committee Member
OPaiuraku„..
Governor's Approval
CONCURRENCE:
Date SEIJI F. NAYA, Director of Business, Economic
Development & Tourism Executive Committee Member
b11/77 ,14/45/1 MICHAEL D. WILSON Director of Land & Natural Resources Executive Committee Member
FEB -5 1997
Date
sr APPROVED 0 DISAPPROVED:
.5747f7 BENJ J. CA T 0 Date Govern r, State of Hawaii
AR0002501 6

Executive Summary
EXECUTIVE SUMMARY
'The Oahu Commercial Harbors 2020 Master Plan is a guide to develop, maintain and enhance Oahu's commercial harbor system to ensure its efficient, safe, accessible and economical operations.
The objectives of the Master Plan are:
To plan the necessary port and harbor facilities to meet the future operational requirements of Oahu's commercial harbor users. Facilities will be planned to preserve or enhance current harbor capacity and to insure a high level of safety, a reliable security system and preservation of the environment.
To promote Hawaii's economy through a focus on facilities for cargo, tourism, and commercial fishing operations in a manner that best relates to and serves the commerce of the State.
To optimize the maritime commercial utilization of port and adjacent resources in creating an efficient, productive, accessible, and 'user friendly' harbor environment.
To actively pursue solutions to commercial harbor problems through the identification, acquisition and development of additional harbors facilities, including but not limited to Keehi Lagoon, Pearl Harbor and Kaneohe Bay."
Planning Committee, August 8, 1995
Geographic forces provided a sheltered refuge for the early trading ships at the mouth of Nuuanu Stream. With the successful development of this protected, coral-reefed basin into one of the world's major commercial harbors, came the subsequent establishment and growth of the port city of Honolulu. Now, as Honolulu prepares to lead Hawaii into the 21st century, it must address the requirements of its base infrastructure - the port system. Oahu's commercial harbors demand comprehensive planning, development and expansion if they are to continue to sustain Hawaii.
The State of Hawaii's 1961 commercial harbor plan, The Honolulu Waterfront, Part One: General Plan For The Honolulu Waterfront Area and Part Two: Development Plan For Maritime Facilities, was based on the needs of the harbor users and the rapid growth of the ocean cargo industry. This planning focus was successfully sustained until the writing of the Honolulu Waterfront Master Plan in 1989. This 1989 general plan altered existing commercial harbor plans in an attempt to enhance the oceanside scenery between Magic Island and the Reef Runway as a supporting visitor attraction.
Since 1989, however, financial support for non-maritime development of the lands surrounding Honolulu Harbor has declined. The spatial, facility and support requirements of Hawaii's life-line ocean cargo carriers, on the other hand, have increased. This shift in trends necessitates the return
Vi
AR0002501 7

Executive Summary
to a focus on the needs and projected growth of the maritime community. The Oahu Commercial Harbors 2020 Master Plan, using current economic indicators to plan the infrastructure required by Hawaii's essential commodity carriers, will be incorporated into and update the Honolulu Waterfront Master Plan, as well as the 2010 master plans for Honolulu and Barbers Point harbors.
Like the 2010 commercial harbor master plan, the 2020 Master Plan will provide a general long-range guide for commercial harbor development, based on the knowledge and experience of the users of the facilities and their anticipation of future trends. The 2020 Master Plan remains flexible, allowing adaptations to changing economic, social, land use policy and other forces that shape harbor developments. Planning documents are usually updated every five years to address such changes.
Honolulu Harbor in the year 2020 is envisioned with a second entrance channel, four container terminals, an inter-island cargo terminal, liquid and dry bulk cargo facilities, neobulk and breakbulk cargo facilities, backlands and pier facilities for automobile shipments, a domestic fishing village, four cruise ship terminals, two ferry terminals, an excursion vessel terminal, a maritime office building, the Foreign Trade Zone "One Stop Shop," adequate berthing for the anticipated number and types of vessels and the necessary roadways to support these operations.
Kewalo Basin's plans reflect a gradual transition to ocean-based tourist activities with commercial fishing being relocated to Honolulu Harbor and Keehi Lagoon. Shoreside land uses will be developed by the Hawaii Community Development Authority (HCDA).
Recommendations for Barbers Point Deep Draft Harbor include the expansion of the harbor with additional piers and yards to accommodate expanded cargo capabilities. Efforts to deepen the harbor and improve the entrance channel will be coordinated with the U. S. Army Corps of Engineers.
Commercial maritime activity is planned for both Ala Wai Boat Harbor and Keehi Lagoon. The former's "front row" is targeted for off-shore activity boats. Two marinas for recreational vessels, commercial fishing boats and mega-yachts as well as other berths for commercial fishing boats and oil spill response vessels are planned for the latter.
Detailed technical and environmental studies will be undertaken before these recommendations are implemented. If these studies prove the recommendations infeasible and result in changes to the proposed scope of improvements, the Harbors Division will again seek input from the users to validate the modifications.
It is said that 80 percent of everything Hawaii uses is imported and that 98.6 percent of these imported goods are shipped by sea. This statement underscores the importance of the port system to the State and its visitors and justifies the provision of resources for the maritime industry as it evolves in response to the changing needs of the people.
VII
AR0002501 8

Chapter I. Introduction
I. INTRODUCTION
The State Department of Transportation is composed of three divisions - Airports, Highways and Harbors. The Harbors Division is responsible for administering the State-owned or controlled harbor facilities used by commercial cargo, passenger and fishing operations. Chapter 266, Hawaii Revised Statutes, delineates this responsibility as the control, management, use and regulation of commercial harbors and their improvements - anchorages, moorings, ports, docks, piers, quays, wharves, bulkheads, landings and roadsteads.
The State of Hawaii receives the bulk of its goods through its commercial harbors, and with the exception of Lanai's Kaumalapau Harbor which is privately-owned, the Harbors Division manages the harbor traffic, berthing, landside use and facility development of these medium and deep-draft commercial harbors.
While past practice has been to develop an individual plan for each harbor, the Oahu Commercial Harbors 2020 Master Plan addresses Honolulu, Kewalo Basin and Barbers Point harbors as dependent harbors, whose activities are closely entwined. The harbor operators' shared use of these three ports warrants this concurrent planning effort.
Kewalo Basin is generally reserved for commercial fishing and passenger cruise operations. Both these industries have exceeded the bounds of this medium draft harbor and are now significant users of Honolulu Harbor.
Honolulu Harbor is the hub of the State's commercial harbor operations. Practically all overseas cargo comes into this harbor before it is distributed throughout the State. Likewise, almost all cargo destined for overseas shipment is consolidated and shipped out of Honolulu Harbor. Berthing and landside accommodations within the Harbor are at a premium, however, and vessel traffic, lack of berths and insufficient operational space are a daily problem.
Conceived to alleviate some of Honolulu Harbors' congestion, Barbers Point Harbor also provides maritime access for the commerce required by Oahu's growing central and leeward communities. It is now apparent that this harbor is also experiencing scheduling problems. In its six years of operations, Barbers Point Harbor has already replaced Kahului Harbor as the State's second busiest harbor. Plans for Barbers Point Harbor reflect its potential as a container and general cargo destination as well as a bulk cargo port.
Plans for either of these three harbors will impact each of the others. The Harbors Division has therefore decided to combine the planning for Honolulu, Kewalo Basin and Barbers Point harbors into a single Master Plan, and treat the planning considerations for these three as an interrelated entity.
I-1
AR0002501 9

Chapter I. Introduction
Until approximately 38 years ago, cargo moved in virtually the same break-bulk or bulk form. Cargo was shipped in either the general cargo or bulk cargo carrier, whose only changing characteristics were a relatively slow growth in size. Harbor facilities were fairly simple and standardized for the predominant general cargo vessels, with specialized berths for the few dry and liquid bulk carriers in operations. With few exceptions, the maritime industry was relatively static and predictable.
However, since August 31, 1958, when Matson pioneered the use of 24-foot containers and revolutionized commercial shipping, the industry's development and operations became dynamic through radical changes. Cargo containers and cargo ships have become highly specialized. Because of these changes, the port industry has implemented significant improvements in its berth and terminal facilities in a relatively short span of time.
Today, ships, cargo and shipping methods continue to evolve, challenging the port industry and placing serious demands on available waterfront properties. This industry-wide concern is reflected in a recent survey by the American Association of Port Authorities, to which responding ports identified facilities development and improvement as their number one strategic planning issue.
Other factors that impact commercial harbor planning include:
O the potential increase in ocean cruise passenger vessels with Hawaii as a planned port-of-call;
O technological advancements in the load carrying capacities of cargo handling equipment, and in larger, faster cargo vessels;
O changes in Federal participation in navigational improvement projects and maintenance of commercial deep draft harbors, where more financial responsibility will be imposed on the State;
O an increased interest in encumbering lands needed for maritime facilities for other non-maritime purposes;
O the declining activity of Hawaii's ship building industry;
O an increase in ocean recreation opportunities for the visitor industry, such as the larger dinner cruise boats; and
O the growing financial responsibility of the Harbors Division to implement and maintain these, and future recommendations.
1-2
AR00025020
Chapter I Introduction
The normal budgetary projection period is five to six years. Seven years have elapsed since the approval of the Honolulu Waterfront Master Plan, The Waterfront Plan's fiscal projections should be reviewed and adjusted to reflect current economic scenarios. The Oahu Commercial Harbors 2020 Master Plan, which will be incorporated into the Waterfront Plan, uses current economic indicators to map out the infrastructure required by the carriers of the State's essential commodities.
Like the 1995 and 2010 Master Plans, the Oahu Commercial Harbors 2020 Master Plan will provide a general long-range guide for commercial harbor development, based on the knowledge and experience of the users of the facilities and their anticipation of future trends. Detailed technical and environmental studies will be undertaken before these recommendations are implemented. If these studies prove the recommendations infeasible and result in alterations to the scope of improvements, the Harbors Division will again seek input from the users to validate the modifications.
A report prepared for the Department of Business, Economic Development and Tourism, Size and Growth Potential of Hawaii's Maritime Industry (Lee and Olive, June 1994), cites Hawaii's dependence on ocean shipping for 98.6 percent of its imported goods. This validation of the port system's value also justifies the provision of resources for the maritime industry as it evolves in response to the changing needs of the people.
1-3
AR00025021

Chapter II. Planning Objectives
II. PLANNING OBJECTIVES
The State DOT Harbors Division's jurisdiction over commercial harbor facilities is primarily directed at the movement of cargo, passenger and fishing vessels entering, leaving, or traveling within the State, and the facilities and supporting services for loading, off-loading, and handling of these vessels, their cargo and passengers. The Oahu Commercial Harbors 2020 Master Plan therefore supports the port system's primary mission with this long-range planning guide for the development of safe, efficient, economically viable harbor facilities. Developed by a consortium of the maritime industry, other ancillary harbor users and government agencies, this Master Plan addresses the desperate need for harbor space by these focal maritime operations which are paramount to the welfare of the State.
Harbor planning covers several broad areas of concern: maritime cargo handling including containerized, general, neobulk, diy and liquid bulk cargoes; passenger vessels including ferries, charter fishing boats, cruise and excursion ships; domestic and foreign commercial fishing; boat building, repair and maintenance operations; navigational concerns; and assorted ancillary activities. Each is significant in that they need either land, water or berths to function - resources which the State has traditionally provided.
This maritime planning effort was conducted in accordance with the following objectives:
I. Plan the proper development of Oahu's commercial harbors, thereby facilitating maritime shipments of the essential commodities required by the State of Hawaii and its citizenry.
2. Optimize the utilization of land and water resources committed to marine cargo, passenger and fishing operations in an economically responsible manner.
3. Provide terminals, other harbor resources and access to these facilities in locations along the Honolulu waterfront, at Barbers Point and other locations in a manner that best relates to and serves Hawaii's port system in an efficient, safe and secure manner.
4. Minimize the impact on environmental quality and recreational opportunities contiguous with port facilities.
AR00025022

Chapter III. Economic Impacts of Hawaii's Port System
III. ECONOMIC IMPACT OF HAWAII'S PORT SYSTEM
The State of Hawaii has come to realize that its economy is fragile and heavily dependent on tourism's revenues. Much emphasis is being afforded the visitor industries with high growth rates and which employ larger segments of the workforce. While this is a necessary strategy, the State must not neglect the infrastructure on which these industries are all dependent - Hawaii's port system.
A. VALUE OF THE PORT SYSTEM
1. ECONOMIC ACTIVITY
In 1992, the major harbor industries produced $1,933,900,000 in direct sales (MacDonald and Deese, 1994; Lee and Olive, 1994, adjusted by SMS Research for major commercial harbor industries.) That year, while Hawaii's Gross State Product amounted to $33 billion, $10.3 billion in imports passed through the State's commercial harbors - a third of the value of goods and services produced in Hawaii. Similarly, a third of the tourists' expenditures in 1992 was on goods that were largely imported through Hawaii's port system,
Commercial harbor activity is best described in these categories: Ocean Transportation; Ship Building & Repair; Commercial Fishing; Ocean Recreation; and other support industries. Harbor users range from the major cargo carriers to commercial fishermen and charter boat operators with a single vessel. Other shipping and manufacturing operations (i.e.; cement distribution and foreign trade zones) also occupy harbor lands.
Ocean Transportation supports every sector of the State's economy by bringing in 98.6 percent of all imported food, building materials, manufactured goods and energy products (Lee and Olive, 1994.) Ocean Transportation activity, understandably, keeps pace with Hawaii's fluctuating economy. Ship Building & Repair, however, is a slower-growth sector of the harbor industries, impacted by the absence of local parts-manufacturers. Parts for building and repairing ships must be ordered and imported from outside the State, resulting in lengthy delays, additional shipping charges and higher costs of doing business.
Commercial Fishing and Ocean Recreation are export industries, bringing overseas income to Hawaii (MacDonald and Deese, 1995.) While both have experienced strong growth, Ocean Recreation's potential appears particularly favorable. Ocean Recreation's charter, excursion and cruise vessels, part of the larger visitor industry sector, transport tourists to some of Hawaii's distinctive and popular attractions. While definitive growth analyses are currently not available, the sentiment is that Ocean Recreation's potential is one of explosive growth.
AR00025023

Chapter III. Economic Impacts of Hawaii's Port System
2. EMPLOYMENT
Harbor industries directly accounted for 8,298 jobs in 1992 (MacDonald and Deese, 1994; Lee and Olive, 1994, adjusted for commercial harbor industries by SMS Research.) Although the number of jobs is relatively small, the harbor industry employment trend reflects Hawaii's dependence on Ocean Transportation. A six-month long dock strike in 1949 led to a surge in unemployment from about 5 percent in 1948 to an annual average of 11 percent in 1949. Reductions in the per capita personal income trend of 10 percent and the Gross Territorial Product trend of 12 percent, occurring in both 1949 and 1950, could be attributed to this dock strike.
Commercial harbor industry employment is therefore indicative of Hawaii's dependence on ocean shipping. Major disruptions in harbor employment impact the flow of maritime commerce with serious implications for the State.
3. ECONOMIC IMPACT ANALYSIS
Commercial harbor facilities have traditionally been developed to satisfy the requirements of harbor users. The Harbors Division convenes User Group meetings to solicit user needs and plan the appropriate improvements. Thus far, Harbors Division's plans and developments have served the users well. Recent slowing economic trends, however, are requiring the justification of Harbors Division's special fund expenditures with the determination of larger economic benefits than project development costs. Because the individual harbor projects do not necessarily generate the income necessary to justify the costs of development, a study to determine the economic value of the entire port system is being conducted. Entitled the Economic Impact Analysis, this study will be produced as a separate report in the spring of 1997.
The Economic Impact Analysis will establish the port system's vital function as an integral component of the State's economy. While it is common knowledge that 98.6 percent of Hawaii's imported goods come through the harbors, it has been extremely difficult to quantify this statement with a dollar value. The Economic Impact Analysis intends to determine and validate the value of each commercial harbor and thus promote the importance of Hawaii's port system.
The Analysis will define the port system's economic worth by examining and documenting sales realized, tax revenues created, incomes generated and jobs provided. These values quantify the economic benefits and will be compiled with the public service functions performed by the entire system into a concise, accountable analysis. This analysis will be used to:
O assess the impact of new commercial harbor facilities construction; O establish the economic benefits of harbor/channel dredging; O assess the impact of intermodal facilities development; O allocate harbor investments;
111-2
AR00025024

Chapter III. Economic Impacts of Hawaii's Port System
O rank facilities investment plans; O justify investments in cruise terminal development; O determine the impacts of master plan development; O develop the harbor's revenue financial model; O link the financial model to the impact models; and O evaluate the effect the port system has on the cost of goods, the consumer and on the State's
overall economy,
B. HAWAII'S DEPENDENCE ON COMMERCIAL HARBOR ACTIVITY
I. THE COMMERCIAL HARBOR - HAWAII'S PRIMARY INFRASTRUCTURE
Lounging idyllically in the midst of the Pacific Ocean, Hawaii enjoys a tranquil separation from continental stresses. Islanders pay for this isolation, however, with a necessary dependence on ocean shipping to supply their everyday needs. Hawaii imports 80 percent of its food and merchandise. 98.6 percent of these imports - food, clothing, building materials, cars, fuel, etc. - is shipped by sea. As there is no feasible alternative to this procurement process, ocean shipping is Hawaii's primary life-sustaining enterprise.
Hawaii's maritime cargo operations have evolved from the use of simple sailing ships and the labor of seamen to incredibly large, specialized ships, with a wide array of shipping containers and mechanized cargo handling methods. This evolution places an urgent demand on the commercial harbor to provide the facilities, space, utilities, roadways and authorizations necessary to facilitate the receipt of Hawaii's essential cargoes. The State's commercial harbors have become shipping's and Hawaii's life-line infrastructure. Ocean cargo carriers, with their specialized requirements, can only deliver their commodities through these commercial harbors.
While attempting to establish the economic importance of the port system, it rapidly became evident that commercial harbor operations are not a normal income-producing activity. The port system does not compete with the revenue streams of industrial warehouses, shopping centers, tourist attractions or restaurants - it provides for the construction., supply and support of these businesses, making them possible. The port system should not be viewed as an economic activity, but as the State's primary infrastructure, sustaining the quality and modernization of Hawaii's lifestyles. The commercial harbor is an island's initial facility requirement,
111-3
AR00025025

Chapter III. Economic Impacts of Hawaii's Port System
2. HARBOR DEVELOPMENT AND IMPROVEMENT
To determine the importance of harbor development and improvement, models of the State's economy were used to estimate the impact of constraints on commercial harbor development/improvement. Preliminary findings from an input/output model developed for Harbors Division (SMS Research, based on 1992 data and the State's input/output models maintained by DBEDT) suggest that the negative impacts of curtailed harbor industry growth are substantial.
Imposing restraints on commercial harbor development/improvement will in turn limit the growth of harbor industries by the aggravation of (a) chronic problems (lower efficiencies of cargo movements, for example); (b) threshold problems (i.e.; a harbor cannot provide enough space for neobulk cargo operations); and (c) emergencies that arise at unforeseen moments and temporarily affect cargo operations. If the result of limiting harbor development/improvement reduces harbor industry growth by even 1 percent per year less than the estimated 2 percent annual increase in the real value of the Gross State Product through the year 2020:
o Sales and employment of the major harbor industries would realize only 76.6 percent of their potential;
o Hawaii's Gross State Product would be 2.1 percent lower; and
o Estimated statewide employment would be reduced by 0.5 percent.'
Harbor development constraints that limit annual harbor industry growth to 1 percent would impact the State's economy by a combined loss of $11.7 billion (1992 dollars) through 2020. While the 1 percent per annum reduction in growth is only an assumption, it is plausible to expect that harbor industries would not grow as quickly without the planned improvements. Ignoring the importance of harbor development and improvement and thus allowing current harbor facilities to fade into obsolescence will prove to be a highly imprudent action.
All estimates are preliminary findings derived from economic studies being developed by SMS Research for Harbors Division. Dollar values are constant 1992 dollars. Assumptions concerning unconstrained growth are from DBEDTs Population and Economic Projections for the State of Hawaii to 2020, June 1996. Constrained growth estimates are based on the input/output model of the State economy in 1992, with analysis of impact scenarios in which demand for major port industries is constrained.
111-4
AR00025026

Chapter IV. Harbor Histoty
IV. HARBOR HISTORY
The Island of Oahu is distinguished by three of the State's nine commercial harbors - Barbers Point, Kewalo Basin and Honolulu harbors. Barbers Point Harbor, on the leeward, westerly side of the island, is in the vicinity of the developing city of Kapolei, while Kewalo Basin and Honolulu Harbor are located on the leeward, south shore, in the only well-sheltered area available for commercial purposes.
Honolulu Harbor is the largest and most singularly important of Oahu's and the State's commercial harbors. Its success as a world-renowned port is responsible for the evolution of an ancient Hawaiian village into the State's capitol city. This city takes its name from the harbor and together, they support the island's 884,000 residents, the heart of the State's business and commercial operations, and the main tourist center.
The city of Honolulu's central business district and government offices grew around Honolulu Harbor and Kewalo Basin. This area, from the Ala Moana Shopping Center swinging around to the Sand Island industrial district, is typically dominated by intensive harbor and waterfront activities. It is characterized by Kewalo Basin's fishing, excursion and dinner cruise vessel facilities, Honolulu Harbor's cargo and passenger terminals, bunkering facilities, marine repair docks, vessel moorings and lay berths, the Aloha Tower Marketplace, the central business district and the Kakaako, Iwilei, Kapalama and Sand Island industrial complexes. A network of highways connects this waterfront area with all of the outlying urban areas.
Honolulu Harbor bears an awesome responsibility as the State's port-of-entry for nearly all imported goods - a figurative umbilical cord sustaining Hawaii's modem life. The harbor facilities supporting this responsibility are complex and myriad and make it difficult to envision the harbor's simple beginnings.
The harbor was created by freshwater flows from Nuuanu Valley which inhibited coral growth within a small, reefed basin and cut several channels through the surrounding reef. The main channel, which was the deepest, was flanked to the west by shallower outlets. Between these outflows, rose occasional spots of earth and coral - the beginnings of Sand Island.
IV-1
AR00025027

Chapter IV. Harbor History
Whether the first Hawaiians were from the Marquesas Islands or from Tahiti, it is generally agreed that the first settlers were Polynesian. While a village of these ancient Hawaiians farmed taro patches at the junction of Nuuanu and Pauoa streams, it seems that Waikiki's oceanfront was much preferred over Nuuanu's. The Hawaiian shallow-draft outrigger canoes did not require deep-water harbors or completely protected anchorages. Foreigners, with their deep-draft vessels, found the best use for the port created by Nuuanu Stream. The influx of these foreign vessels and their trade soon caused a shift of population and the growth of the town around the port where ships lay at anchor.
The first Western use of the harbor occurred in 1794. At the time, the harbor channel was approximately 200 feet wide, three-quarters of a mile long, and about 30 feet deep. A small Hawaiian community was observed along the waterfront in today's downtown area, as were fishponds to the west from Nuuanu Stream to Keehi Lagoon. The Hawaiians referred to the harbor as "Ke Awa 0 Kou" or "the harbor of Kou." In 1796, the harbor was named "Fair Haven," which was later translated into Hawaiian as "Honolulu."
Honolulu Harbor was discovered when fur traders plied the seas. The islands were so situated that they were a popular and convenient port-of-call for ships engaged in the Pacific trade. Hawaii provided a good source of supplies, an ideal place to rest and an excellent winter haven for the fur ships. Because fur traders called at the port of Honolulu so regularly, the neighboring Hawaiian village grew and changed and Honolulu Harbor began its manifest destiny as the Crossroads of the Pacific.
The harbor owed its continued success to the sandalwood spree which closely succeeded the fur trade. As mountainsides were stripped of sandalwood trees and the exquisite wood shipped to China at outrageous prices, Island kings and chiefs reaped great wealth. Honolulu Harbor's importance increased with this flourishing trade, and the neighborhood surrounding the harbor became its principal trading center.
In 1819, two whaling vessels joined the other vessels in Honolulu Harbor. These presaged forty exciting and progressive years of the whaling industry, during which many whaling ships called at Honolulu Harbor. It was only natural that the foreign population was heaviest around the port of Honolulu, where whaling vessels stopped to repair and refit their ships, buy beef, Hawaii-grown Irish potatoes, and other supplies.
Although in 1820, the neighboring village was only an irregular cluster of grass houses, close to the harbor, with perhaps three or four stores and a half dozen buildings of wood or stone in the European style, the little seaport town was taking shape. The entire population at the time numbered between 3,000 and 4,000.
IV-2
AR00025028

Chapter IV. Harbor History
By 1825, the neighboring village's population had already grown to approximately 6,000. This is the year that Honolulu Harbor's first wharf was "developed." This wharf was simply a sunken vessel, floated into place near the foot of Nuuanu Avenue, providing a crude docking structure for Hawaii's growing maritime commerce. It remained the harbor's sole "terminal facility" for eight years. In 1827, a wharf and shipyard was begun in the vicinity of the fort. In 1833, the sunken vessel was replaced by a more substantial dock.
In 1840, efforts were started to deepen the harbor and fill in the surrounding tidelands. From this time forward, harbor improvements became the standard response to
the progressive demands of Hawaii's constantly growing shipping industry.
As modifications to Honolulu Harbor encouraged the growth of maritime commerce, changes in the neighboring village began to intensify. By 1840, the population grew to 9,000, including some 600 foreign residents. While there were great improvements in the grass houses, the village was being taken over by more substantial buildings of wood, stone or adobe. Streets were widened and straightened, houses and stores built, and public works projects initiated.
All community life centered around the harbor. Everything - business, industiy, agriculture - was geared to the needs of the vessels calling in port. Stores materialized to furnish these ships with their staples: flour, sugar, crackers, fresh produce and salt. Other shops provided rope, paint, lumber, canvas and nails. Tradesmen were kept busy with ship repairs. In time, the neighboring village inherited the harbor's name and the town of Honolulu came into being.
In February 1848, a breakwater wall was constructed from the foot of Maunakea Street, going out 940 feet west-southwest, to contain the silt from Nuuanu Stream. While the breakwater was successful in containing the silt, it also cut off harbor development in the area for a number of years.
The 1848 discovery of gold in California started another flurry of activity in Honolulu Harbor. Departing ships were filled first by an exodus of would-be miners, then by goods and food suited to
IV-3
AR00025029

Chapter IV. Harbor Histoly
the California Gold Rush.
Winter reversed the flow of commerce. Miners flocked to Hawaii to escape the rigors of the season. Prices of certain goods escalated to astronomical heights. Because the harbor generated such commercial activity and caused tremendous growth in the surrounding neighborhood, Karnehameha III declared Honolulu to be a city and the capital of his kingdom on August 31, 1850.
The earliest ships were towed to their moorings in Honolulu Harbor by crewmen in oared whaleboats. As the whaling era progressed and the port prospered, a force of hefty natives offered to wade out to catch the ships' lines and pull the ships into their moorings. It was considered progress when a string of oxen replaced this manpower. In 1854, the steam tug Pele easily assumed the task which had grown too great for the oxen. Honolulu's population that year was estimated to have grown to 11,000.
By 1857, Honolulu Harbor possessed five wharves capable of handling ships of 1,500 gross tons, with a total berthing frontage of 600 feet. Between 1857 and 1870, twenty-two acres of reef and tideland between Fort and Alakea Streets were filled in from harbor dredging to form "The Esplanade." The project cost $239,000 and provided an additional 2,000 feet of wharfage.
The discovery of petroleum in 1859 was almost a death blow to the whaling industry. The outbreak of the Civil War caused even further withdrawal of many whalers. Fortunately, the "War Between the States" over-compensated for the loss of whalers by providing an impetus for one of Hawaii's most dynamic agricultural industries - sugar. Hawaiian sugar became a profitable export when the southern states' supply was cut off and prices rose. Hawaii's sugar exports multiplied many times during the course of this war.
The frenzied activity in Honolulu Harbor and along the waterfront included important physical improvements among the many sugar ship sailings. The harbor light was built in 1868 and lit for the first time on August 8, 1869. By 1874, a long harbor seawall was in place, lined with wharves and warehouses. The harbor had been deepened by dredging and the dredged material deposited on the shallow off-shore reef to begin the reclamation of land now known as Sand Island. Initially known as Quarantine Island and used to isolate ships with cases of contagious diseases on-board, Sand Island now houses the State's major container terminals.
Honolulu Harbor's ability to service increasing numbers of larger ships resulted in incredible commercial activity. This bolstered the importance of the port's city. Honolulu grew into a metropolis with one-fourth of Hawaii's population and one-half of the foreigners. In 1875, it was the home of 15,000 people, the seat of government, the center of commerce, and the repository of intellectual and religious activity.
A commercial reciprocity treaty with the United States was negotiated to allow Hawaiian sugar into American markets duty-free. The signing of this treaty in 1876 prompted another spurt of economic
IV-4
AR00025030

Chapter IV. Harbor History
and harbor activity. Existing sugar plantations went into maximum production while new sugar companies blossomed. Hawaii's government increased their inventory of wharves to fifteen by 1892. That same year, $200,000 was appropriated for dredging the harbor to a depth of 30 feet and creation of a 200-foot wide entrance channel. The Oahu Railway & Land Company also erected a coaling station in 1892, another wharf in 1895, Piers 17 and 18 in 1901, and Piers 19 and 20 by 1916. Some of this infrastructure was in response to the needs of the other major agricultural industry that had established itself and had begun to experience success - pineapple.
On August 12, 1898, Honolulu Harbor became an American Port when Hawaii was annexed to the United States.
By 1900, the eastern portion of the harbor was considered fully developed with short wharves and piers and a 200-by-120-foot Channel Wharf (Pier 2) with a full-length, 80-foot wide storage shed. Private interests had developed the western half of the harbor for their operations and the lands that lay between both ends of the harbor were also being brought into use.
Around this time, the schooner Santa Paula pioneered the oil trade to Hawaii. Along the major sea lanes, steam had replaced sail, and oil was displacing coal as a steam-producing fuel. Facilities for loading and discharging oil were required and provided. Realizing the economic potential, more and more people flocked to Honolulu, and its population swelled to 39,306 in 1900.
In 1905, Honolulu Harbor was 3,000-3,500 feet long, 800 feet wide, 25-30 feet deep, with an entrance channel 200 feet wide and 35 feet deep at low tide. In 1907, the Corps of Engineers widened Kapalama Basin to 1,200 feet, increasing its capacity by 50%, lengthened Kapalama Channel to 400 feet, and dredged both Kapalama Basin and Kapalama Channel to 35 feet. Concurrent with these improvements was the filling and development of Quarantine (Sand) Island. The population in the city of Honolulu also increased and reached 52,183 in 1910.
By 1911, a shed and marine railway were in place at Pier 3 and the front of what is now Piers 18,
AR00025031

Chapter IV. Harbor History
19 and 20 had been developed for berthing with the addition of three small sheds.
In 1912, the first wharf in Honolulu Harbor using reinforced concrete piles and a concrete deck was constructed at Pier 1.
World War I (1914-1918) seriously disrupted the flow of maritime commerce. Nearly all the steamers on the Hawaii-west coast line were conscripted into service on the Atlantic Ocean. Tourist traffic almost ceased. Food shortages raised the cost of living. As Hawaii's dependency on ocean shipping was realized, the commitment to harbor improvements intensified.
Piers 26 and 27 were built in 1917 for use as bunkering stations. By 1918, Piers 24, 25 and 26 were constructed and used by inter-island and overseas shipping operations. Their sheds were built later.
In 1919, Kapalama Channel was enlarged to a width of 800 feet, a length of 1,000 feet and a depth of 35 feet. Beginning that year and continuing through 1928, the passenger terminals at Piers 8, 9, 10/11 were rebuilt.
Honolulu's population followed suit and grew to 127,000 in 1920.
Kewalo Basin, a harbor of approximately 55 acres including ocean acreage, was first constructed in the 1920's to ease the congestion in Honolulu Harbor and provide docking for lumber schooners. By the time the concrete wharf was finished in 1926, lumber schooners had begun to fade out and commercial fishing operations moved into Kewalo Basin.
Construction of Aloha Tower, the landmark of Honolulu's waterfront, began in 1921 and was completed in 1926. In Honolulu Harbor, Pier 11 was
reconstructed the following year, 1927.
IV-6
AR00025032

Chapter IV. Harbor History
In 1928, to accommodate tanker operations, two 73-foot long concrete aprons separated by an 84- foot space were constructed at Pier 30. The space was filled solid in 1951.
Half of the bulkhead along the mauka side of Kewalo Basin was built in 1928. Honolulu Harbors Pier 4 reconstruction was completed by 1929. As the pineapple industry continued to develop and dedicated facilities were needed for inter-island shipments of fresh pineapples, Pier 35 was constructed in 1929 and Pier 36 in 1931.
Piers 13 and 14 were reconstructed in 1931. The remainder of Kewalo Basin's mauka bulkhead was constructed in 1934. In 1935, Honolulu Harbor's entrance channel was expanded to a width of 500 feet with a depth of 40 feet, and the turning basin widened from 1,200 to 1,520 feet. Piers 27, 28, 29, 31, 31A and 32 were constructed in 1938.
Hawaii was reminded of its dependence on ocean shipping when a 1938 dock strike interrupted the normal line of supply. Once the strike was resolved, improvements to shipping's infrastructure, the commercial harbor, continued at a steady pace, as did the city's population - 154,000 in 1939; 179,358 in 1940; and 200,00 in 1941. Unfortunately, as Hawaii continues to modernize, its dependence on ocean shipping only increases. The State remains vulnerable to any disruption in maritime commerce.
Pier 29 was further improved in 1941 with the addition of a shed. Material dredged from Keehi Lagoon's seaplane channel was utilized to expand Sand Island to its current 513+ acres between 1940 and 1945. A dirt causeway connecting Sand Island with the Kapalama mainland was constructed in 1943.
Just prior to the December 7, 1941, attack on Pearl Harbor, the outer Kapalama Basin was begun. Completed in 1943, this project greatly improved the harbor's capacity. Also completed in 1943, Piers 39 and 40 were constructed as concrete sheet pile bulkhead wharves, with a portion of the apron on piles. In 1944, Piers 51-53 were constructed as a
IV-7
AR00025033

Chapter IV. Harbor History
4,000-foot marginal wharf on the harbor side of Sand Island.
During the war, dredging widened the first 1,000 feet of Kapalama Channel to 1,000 feet, and the remaining (Ewa) section of 2,400 feet to 600 feet with a controlling depth of 35 feet. The Kapalama turning basin was also dredged to a depth of 35 feet and grew to 1,000 feet wide by 3,400 feet long. Kewalo Basin was similarly dredged and expanded.
In the final years of the war, the dredge repair basin and support facilities were constructed along the mauka shoreline of Sand Island. Pier 31A was extended in 1948. During the post-war boom, Honolulu's population climbed to 248,000 and $46.7 million of construction projects were started in 1950.
An oil pipeline system connecting all government piers to the oil companies and Hawaiian Electric Company's Honolulu power station was renewed in 1950. Kewalo Basin's Waikiki bulkhead was constructed in 1951. In 1952, Piers 21, 22 and 23 were reconstructed for tug maintenance and bulk grain shipments in Honolulu Harbor.
A steel-frame, aluminum siding shed was built on Pier 21.
In 1954, Pier 38 was constructed to provide a direct loading area for refined petroleum products, a slip 1,000 feet long and 35 feet deep was dredged at Pier 39, and the berth at Pier 34 was reconstructed to accommodate oil tankers and bulk cement shipments. Kewalo Basin's fishing gear shed and paving on the Waikiki side of the mooring basin were also completed in 1954. In 1955, approximately eight acres of filled land was deposited along the makai side of Kewalo Basin to form a peninsula protected by rock revetment.
Maritime commerce continued to grow by leaps and bounds. It was apparent that a large terminal was necessary to meet the demands of post-war shipping. Beginning with land-acquisition proceedings in 1947, moving into the redecking of the concrete wharf, reconstruction of Pier 2, and
'v-8
AR00025034

Chapter IV. Harbor History
construction of the general cargo shed, the project ended with the christening of the deluxe "Diamond Head Terminal" on May 22, 1955.
Bulk sugar handling facilities were constructed in the back of berths 18, 19 and 20 in 1955. Kewalo Basin's wooden herringbone pier was also constructed about this time. In 1956, Honolulu Harbor's Pier 15 was rebuilt and refrigerated fish storage facilities added, while Pier 23 was dredged and developed for bulk storage of feeds. The federal government announced plans to return most of Fort Armstrong and Sand Island to the Territory of Hawaii.
With the amount of commerce shipped through Honolulu Harbor from 1845 to 1959, the city's economy grew significantly. Sugar, pineapple and diversified farming flourished. The tourist trade enjoyed an even more impressive increase. Many diversified industries developed (construction, oil refinery, steel mill, cement plant, garment industry, furniture, etc.) and the military poured money and personnel into Oahu's military bases to establish a strong presence in the islands.
Port facilities were continuously improved and expanded to meet the needs of the commercial shipping industry. The HC&D Company wharf in Keehi Lagoon was built on State land in 1959 for inter-island barge shipping of aggregates. In Kapalama Basin, the Hawaiian Dredging and Construction Company and the Kapalama Shipyards facilities consisted of piers, a floating dry-dock, a repair shop, open storage areas and the marine railway.
With the advent of Statehood on August 21, 1959, Hawaii's economy changed and continued to grow. Buoyed by the additional capabilities of the harbor, the city's population breached 294,000 and construction topped $164 million in 1960.
Container handling facilities at Pier 2 commenced that year and were continually expanded into the Pier 1, Fort Armstrong area to create additional container yard facilities.
A 9-acre barge harbor was constructed on Campbell Estate lands at Barbers Point in 1961. This small harbor enabled neighboring industries to ship their products by barge to the other islands. Because of its size and surge problems, however, the harbor realized only limited barge use and was more popular for recreational fishing. Government efforts would later transform this barge harbor into the Barbers Point Deep Draft Harbor.
In 1962, the Corps of Engineers completed dredging a second entrance channel to Honolulu Harbor through Keehi Lagoon, including the removal of the causeway and construction of a two-lane bascule bridge to serve Sand Island.
While Pier 2 container facilities were being expanded even further into Pier 1, Governor Burns dedicated the Look Laboratory of Oceanographic Engineering at Kewalo Basin on July 28, 1964.
117-9
AR00025035

Chapter IV Harbor History
In 1965, construction of another container freight station at Fort Armstrong was completed, the parking area at Piers 5 and 6 paved, and Piers 8, 9, and 10 remodelled with the construction of a second passenger arrival deck, office area, upper deck driveway, two customs buildings, a bridge, and 70,000 square feet of additional cargo area. Cargo carriers brought in the materials and equipment for $219,3 million of new construction projects throughout the island.
In 1966, a 175-foot rock jetty and an additional 7 acres of pavement were constructed at Pier 1, and Foreign Trade Zone No. 9 opened for business at Pier 39.
To accommodate another container shipping service and to provide more expeditious handling of cargo, a commercial ship facility on Sand Island was completed and activated in 1967, and proceedings to acquire 85.56 acres of privately-owned harbor land from the Dillingham Corporation were initiated.
Pier Ts sheetpile bulkhead was constructed in 1968, as was an extension to Kewalo Basin's wharf.
In 1969, the second container shipping operation began service to Hawaii, Container Freight Station No. 2 was extended, Pier 2's parking area paved, Pier 35's back-up area graded and paved, and the Sand Island Wharf demolished, dredged and reconstructed to accommodate container vessels. In Kewalo Basin, the concrete herringbone pier and larger concrete catwalks were constructed along the Ala Moana Boulevard face and along the seaward face of Kewalo.
At Piers 5 and 6 in Honolulu Harbor, construction of a paved parking lot, rock bulkhead and revetment, cement rubble masonry wall, concrete anchor blocks and dolphins, installation of water, sewer, drainage, telephone, lighting and power systems was accomplished in 1970. Another concrete-decked catwalk was installed in Kewalo Basin, Recent harbor developments encouraged
IV-10
AR00025036

Chapter IV. Harbor History
the city's population growth to 324,871 and island construction was valued at $386.7 million.
In 1971, about 20 berths in Honolulu Harbor were dredged to restore their required depths. Some maintenance dredging was also completed to ensure a 40-foot depth in the Fort Armstrong channel and a 35-foot depth in the two turning basins, Kalihi and Kapalama channels.
In 1972, while repairs to Kewalo Basin's rockwall, jetty and aku catwalks were being completed, Fort Armstrong's container yard was improved and expanded by another 6,000 yards, Pier 34 was reconstructed, Piers 22 and 23 upgraded with new dolphins, bulkhead and pavement, the final phase of Harbors Division's Baseyard facilities completed, Sand Island Wharf extended from 680 to 1,236 feet and 6,800 square yards of additional container storage area paved. The first section of the Energy Corridor, a State-controlled right-of-way for transporting oil through pipelines from the new Barbers Point Industrial Complex to Honolulu Harbor, was ushered into service.
In 1973, 13 additional acres at Pier 51C (Sand Island Wharf) were cleared, graded and fenced, a new entrance to Piers 31-33 constructed, and renovations to Pier 11 offices, Piers 20 and 24-26 sheds completed.
In 1974, U.S. Lines shifted its container operations from Pier 39 to Sand Island, while Matson began operating from both the Diamond Head Terminal at Pier 2 and the Sand Island container facility. Two mooring dolphins were constructed at Pier 7, Piers 24-25's fenders were replaced, and Kewalo Basin's Herringbone Pier renovated.
Pier 8's jetfoil inter-island ferry facilities were completed, Piers 24-28 storage area improved, and Pier 20's shed modified in 1975. By this time, 344,000 people resided in Honolulu and the estimated value of construction that year reached $495.8 million.
In 1976, Pier 51B was extended by 120 feet, Pier 35's fender system replaced, Fort Armstrong's pavement rehabilitated, and Pier 20 improved with the construction of new pavement.
A commercial fishing area known as the Kewalo Basin Annex was established at the newly constructed Piers 17 and 18 in Honolulu Harbor, additional finger piers at Pier 21 provided, Piers 31- 33 refaced, and the Piers 22-23 bulkhead repaired in 1977-1978. At Kewalo Basin, catwalk 119-120 and the marginal wharfs fender system were replaced.
In 1980-81, Honolulu Harbor's depth was increased by five feet through dredging, and container handling facilities were constructed to consolidate Matson Navigation and U.S. Lines freight operations on Sand Island. These included a paved, 35-acre container storage area, lighting and underground utilities, a 60-foot wide by 1,400-foot long concrete wharf with berths for two container ships and a container freight station. These improvements paved the way for the city's population growth to 365,000 and $745.6 million worth of additional construction projects.
IV- 11
AR00025037

Chapter IV. Harbor History
While planning for Oahu's second deep-draft harbor at Barbers Point began in 1958, the joint Federal-State dredging project did not begin until 1982. When the project was completed, the Corps of Engineers turned control of the harbor over to the State on May 2, 1986. It consisted of a total 387 acres with an entrance channel (450 feet wide, 4,280 feet long, and 42 feet deep), a harbor basin (114 acres, with a depth of 38 feet), and a 4,700-foot wave and energy absorber along the northern and western periphery of the main basin. Located 19 nautical miles west of Honolulu Harbor near the southwestern tip of the island, Barbers Point Harbor serves to alleviate some of the strain placed on Honolulu Harbor by its growing cargo activities.
In July 1986, Marisco moored a 516-foot drydock in Barbers Point Harbor. It was first located in the northeast corner but later moved to its present location adjacent to the southwestern edge of the main basin, mauka of the barge harbor, to allow the construction of Piers P-5 and P-6.
Also in 1986, Honolulu Harbor's 377-foot Pier 16 and 265-foot Pier 37 were constructed as berthing for transient fishing vessels, and the Sand Island container handling complex was expanded by an additional 14 acres. New 40- and 50-foot concrete catwalks and aku boat catwalks were constructed to replace Kewalo Basin's herringbone pier and other structures.
Major projects completed in Honolulu Harbor in 1988 included the maintenance dredging of the berthing area at Piers 8-11, repairing of the concrete substructure at Pier 26, partial demolition and modification of the Pier 24-26 shed, repairing of the roof of the passenger terminal building at Piers 8-11, reconstructing the fender system at Piers 13-14, and repairing of the fender system at Piers 34 and 36. The Hawaii Maritime Museum was established at Pier 7 the same year. At Kewalo Basin, the building housing the offices of the charter boat operators was renovated and the surrounding area landscaped.
Barbers Point Harbor officially opened on May 31, 1990, with the completion of a 1,600-foot pier and 30-acre cargo handling yard. In conjunction with the construction of the new pier, a total of 16 petroleum product pipelines were installed. These lines may be used for bunkering as well as the handling of petroleum products.
In 1990-1991, Honolulu Harbor's Pier 18 was reconstructed with concrete, and bulk off-loading operations were established at Barbers Point Harbor to transfer coal from the ships to a coal generation plant in Campbell Industrial Park.
In 1992, maritime commerce continued to enjoy enormous gains in activity, spurring the economy and promoting the city of Honolulu's ranking in Smith and Englander's "The Best Place to Live in America" to 7th out of 300. The city's population grew to 377,000 as construction projects that year approached $1.2 billion.
In 1993, the Sand Island container yard was expanded by 15 acres, and a pier and parking area for ferry and service vessels were constructed at Barbers Point Harbor.
IV-12
AR00025038

Chapter IV. Harbor History
In 1994, the Aloha Tower Marketplace opened, making Honolulu the only harbor in the nation to combine a visitor attraction, retail and restaurant outlets, and working commercial harbor facilities at a single location.
In 1995, Pier 53 was dredged and extended by 330 feet, its container yard expanded by 10 acres, and the open areas of segmented Pier 34 were filled to provide a continuous 540-foot pier.
Pier 39 received a new shed, strengthened pier aprons, a new container yard and a new roll-on roll-off pier, and Barbers Point Harbor received a four-acre expansion of the cargo handling yard, a new 36,000-square-foot cargo shed and concrete pavement around the shed in 1996.
Efforts continue to build a new shed at Pier 40, strengthen its aprons, improve storage and cargo handling yards, extend Pier 51 by about 681 feet and improve its cargo yard, construct a harbor entrance at the intersection of Auiki and Libby streets, and improve the Waiakamilo-Nimitz Highway entrance. Barbers Point Harbor is being improved with a 600-by-1,100-foot expansion area, a 300- foot extension of P-5, and construction of a dedicated fuel dock.
Today, 70 percent of the State's maritime cargo activity is attributed to Oahu's commercial harbors. Honolulu Harbor not only continues to function as the hub of Port Hawaii, receiving, consolidating and distributing practically all overseas cargo shipments, but finds itself catering to passenger and fishing operations and distraught with countless requests for additional accommodations.
Geographic forces provided a sheltered refuge for the early trading ships at the mouth of Nuuanu Stream. With the successful development of this protected, coral-reefed basin into one of the world's major commercial harbors, came the subsequent establishment and growth of the port city of Honolulu. Now, as Honolulu prepares to lead Hawaii into the next millennium, it must address the requirements of its base infrastructure - the port system. Oahu's commercial harbors demand comprehensive planning, development and expansion if they are to continue to sustain Hawaii.
Surrounding and nurturing us, the sea serves not only as a source of food, fun and employment, but as our principal highway. In our island State, it is as important to develop a harbor as it is to build a road in continental U.S.A. As the city looks to the harbor for its cherished influx of trade and essential commodities, the port in turn asks for the city's support in satisfying the needs of the commercial cargo, passenger and fishing industries.
1V-13
AR00025039

Chapter V. Methodology
V. METHODOLOGY
A. ORGANIZATION
"Hili hewa ka mana'o ke 'ole ke kukakuka." Ideas run wild without discussion.
"He 'ike 'ana ia i ka pono." It is a recognizing of the right thing.
The Harbors Division has always operated in consideration of the users of its facilities and with the acknowledgement that its developments have direct and immediate effects on these users. With this in mind, the Harbors Division hosts periodic user group meetings to discuss the operations, deficiencies, designs, progress and modification of harbor projects. The 2020 Master Plan was constructed in this consultative manner.
Developing a proper long-range plan for Hawaii's intricate port system is a complex undertaking. The vast number of interests concerned with either the workings of the life-sustaining commercial harbor or the prime waterfront locations occupied by harbor facilities present a wide and often conflicting array of desires. In the belief that an organized forum of these interests would be able to ferret out the best solution, a massive Task Force was created to state the problems, resolve the conflicts and plan the critical future of Oahu's commercial harbors.
1. TASK FORCE
The Oahu Commercial Harbors 2020 Master Plan is a concerted effort of the maritime industry, associated harbor users and government service. Representatives of these interests met as a massive Task Force in the initial orientation meeting on May 15, 1995. An extraordinary amount of time and effort was expended by many of the participants between the time of the initial Task Force meeting and the Governor's signing of the Plan.
The Task Force was organized into an Executive Committee, a Planning Committee and six Sub-Groups to establish a functional hierarchy, facilitate the interactions within the legion of concerned agencies and enable manageability of this massive group.
2. SUB-GROUPS
The six Sub-Groups were organized by area of expertise: Ocean-Based/Navigation; Terminal Operators; Other Land-Based Operations; Tourist-Related Operations; Commercial Fishing; and Government Agency. The Sub-Groups were initially tasked with soliciting their members' specialized needs and documenting their concerns for the planning, development and operation of Oahu's
V-1
AR00025040

Chapter V. Methodology
commercial harbors. Once the issues and needs were stated, the Sub-Groups were asked to assist the Planning Committee by ranking these concerns.
The following list of issues and needs were determined by extensive discussions among the members of the Sub-Groups. Often, participants found it necessary to take the issue(s) to their associates for consideration and concurrence. While this practice of conferring with harbor users is standard procedure for the Harbors Division, the number and size of the Sub-Groups complicated this effort.
FACILITIES
CRUISE PASSENGER TERMINAL Develop Piers 5 & 6 for cruise vessels. Plan sufficient facility to accommodate growth due to shipboard gambling. Automated baggage handling. Airport-type jetways. Security screening. Separation of foreign cruise passengers. Adequate parking facilities. Suggested: Parking structure at site of HECO power plant. Ingress/Egress for buses.
ALTERNATE CRUISE PASSENGER TERMINAL Develop Piers 5 & 6 for cruise vessels. Plan sufficient facility to accommodate growth due to shipboard gambling. Automated baggage handling. Airport-type jetways. Security screening. Separation of foreign cruise passengers. Adequate parking facilities. Suggested: Parking structure at site of HECO power plant. Ingress/Egress for buses.
EXCURSION PASSENGER TERMINAL Plan sufficient facility to accommodate growth due to shipboard gambling. Automated baggage handling. Airport-type jetways. Security screening. Adequate parking facilities. Suggested: Parking structure at site of HECO power plant. Ingress/Egress for buses.
V-2
AR00025041

Chapter V. Methodology
FERRY TERMINAL Automated baggage handling. Airport-type jetways. Security screening. Adequate parking facilities. Suggested: Parking structure at site of HECO power plant. Ingress/Egress for buses.
FISHING VILLAGE Cold storage and ice. Waste oil disposal. Fish disposal. Fish handling/processing space. Unloading facility/space. Storage area.
GENERAL CARGO TERMINAL(S) More space. Traffic control. Infrastructure. Stevedore concerns: more space; parking.
CONTAINER CARGO TERMINAL(S) Fort Armstrong - return to Harbors jurisdiction. More space. Traffic control. Infrastructure. Stevedore concerns: more space; parking.
DRY BULK CARGO TERMINAL(S) More space for flour mill, grain elevator and warehouse at pier 23. More space. Traffic control. Infrastructure. Stevedore concerns: more space; parking.
LIQUID BULK CARGO TERMINAL(S) Chevron: Pier 30-35. Unocal: Pier 34, pipeline easements. More space. Traffic control, Infrastructure.
V-3
AR00025042

Chapter V. Methodology
AUTOMOBILE CARGO TERMINAL(S) More space. Traffic control. Infrastructure. Stevedore concerns: more space; parking.
BERTHS Build the berthing space, they will come. Berths for small business (vessels less than 100') at Honolulu Harbor, Aloha Tower. Passenger loading docks for vessels less than 100'. Enhanced ability to use Aloha Tower for passenger loading. Private vessels over 100' need facilities. More commercial slips. Include sewer links to piers and docking. Utility infrastructure. Further develop Sand Island for space - additional berths makai of the AT&T ship. Better docking, loading/unloading, servicing facilities. Provide a place in Ala Wai Canal for water taxis to Convention Center. Provide electric/solar power for water taxis. More berthing space for commercial fishing vessels. More bunker berths. Improve bunkering capabilities Piers 29-34. Moorings and anchorages. Pier 51 extension to bridge. Cargo vessels. Passenger vessels. Commercial fishing vessels. Support vessels. Research vessels. Emergency vessels: Oil Response; Hazmat; Coast Guard; Fire Fighting. Fendering.
"ONE STOP SHOP" Central cargo inspection/examination facility. Fumigation. Customs' house. Office Space. Food and Drug.
V-4
AR00025043

Chapter V. Methodology
SHIP BUILDING, REPAIR AND MAINTENANCE FACILITY Location for submarine repairs and maintenance. Ship maintenance facilities. Maintenance area for cruise, excursion boats. Vessel servicing/maintenance/repair.
ROADWAYS Ingress/Egress to piers. Internal roadways. Connect Kapalama to Pier 40 Young Brothers. Sand Island Access Road tunnel under Kapalama Channel.
MARITIME OFFICE BUILDING
MULTI-PURPOSE STORAGE AREA. Storage area for off-shore mining operation. Equipment Storage at Kewalo.
FOREIGN GARBAGE/DISPOSAL FACILITY.
HONOLULU HARBOR NAVIGATION IMPROVEMENTS Channel widths and depths. Turning basins (maintain and enhance). Dual entrance at Keehi Lagoon. Harbor dredging. Disposal of dredged spoils. Water depth alongside piers. Water depth Pier 51A ewa to bridge. Surge, piers 1-8.
KEWALO BASIN NAVIGATION IMPROVEMENTS Turning basin. Surge and waves. Entrance channel current. Water circulation,
BARBERS POINT EXPANSION PROJECT Dredging: mauka-Diamond Head and makai-Diamond Head corners turning basin entrance channel. Jetty to help eliminate cross currents at entrance and some of the surge. Lights for night navigation. 40-foot allowable dredge depth and additional channel.
V-5
AR00025044

Chapter V. Methodology
Navigational landing for dock entry next to Barbers Point. 1,000 feet of bermed beach at Barbers point to service petroleum hoses. Concrete pier to service petroleum hoses at Barbers point. Petroleum berth at Barbers Point,
ACQUIRE DAISHOWA AREA AT PIER 40.
BACK-UP LAND FOR HMR SCRAP METAL STORAGE
OPERATIONS
Ability to do more commercial land-based business out of Kewalo Basin. Signs for charter businesses on Kewalo Basin's back piers. Enhance Kewalo Basin booth design and regulations. Harbor Master's office serves as "fishing czar." Therefore, he should accept this role and exercise the necessary authority. More efficient if Harbors Division would approach the fishing industry as a business and provide accommodations and services in a pro-active manner. More Kewalo Basin night security. Security. Compatibility with other users. Must get used to sharing docks/berthing space. Make the ports more welcome - State, Coast Guard, Customs. Better communication. Opportunity for constant communication. Set up User Group to discuss issues on a regular basis. Suggested regular fishing user group meetings to voice concerns and receive updates. Change of Harbors' attitude - positive strokes. A location for the USS Missouri at Honolulu Harbor. Explore alternatives to improve safety along piers and backup areas.
OTHER ISSUES & NEEDS
Expand usage of Foreign Trade Zone to include trans-shipment of commercial fishing. Re-evaluation of wharfage and tariff system to attract commercial fishing companies to Hawaii. Realistic methodology for determining lease rents, not by market value. Issues licenses instead of revocable permits where acceptable to lessor and lessee. DOT data and record keeping. Develop Marketing Plan for cruise ships, DBEDT to develop. Environmental concerns. DOH contamination waste water, effluent restrictions. Utilize West Loch.
V-6
AR00025045

Chapter V. Methodology
Electrical power facility at Sand Island. Make Honolulu a free port. Relocate Coast Guard. Development and better utilization of Keehi Lagoon. Clear up jurisdictional responsibilities at Keehi Lagoon. Recreational development. Continuation of Kakaako makai mixed use redevelopment plan. Commercial and recreational overlap.
The other responsibilities of the Sub-Groups included review, correction and approval of the Planning Committee's recommended 2020 plan.
3. PLANNING COMMITTEE
The Planning Committee was comprised of the Chairpersons of the Sub-Groups (both Chair and Vice-Chair in the case of the Terminal Operators Sub-Group), the Chairperson of the Chamber of Commerce Maritime Committee, representatives of the Office of the Governor, State Department of Land and Natural Resources' Land Management Division, the State Department of Business, Economic Development and Tourism's Aloha Tower Development Corporation, Hawaii Community Development Authority, Waterfront Project, State Department of Transportation Harbors Division and the Aloha Tower Associates. This membership insured a fair representation of the key elements of private industry and government service with direct concerns for the island's commercial harbors.
Planning Committee meetings were open to the public and were often attended by a Coast Guard representative and other interested members of the maritime community. Beginning with the election of its Chairperson and Vice-Chairperson, the Planning Committee then developed its Mission Statement:
"The Oahu Commercial Harbors 2020 Master Plan is a guide to develop, maintain and enhance Oahu's commercial harbor system to ensure its efficient, safe, accessible and economical operations.
The objectives of the Master Plan are:
To plan the necessary port and harbor facilities to meet the figure operational requirements of Oahu's commercial harbor users. Facilities will be planned to preserve or enhance current harbor capacity and to insure a high-level of safety, a reliable security system and preservation of the environment.
To promote Hawaii's economy through a focus on facilities for cargo, tourism, and commercial fishing operations in a manner that best relates to and serves the commerce of the State.
V-7
AR00025046

Chapter V. Methodology
To optimize the maritime commercial utilization of port and adjacent resources in creating an efficient, productive, accessible, and "user _friendly" harbor environment.
To actively pursue solutions to commercial harbor problems through the identification, acquisition and development of additional harbors facilities, including but not limited to Keehi Lagoon, Pearl Harbor and Kaneohe Bay."
The Planning Committee then proceeded to organize the lengthy list of Sub-Groups' issues and needs into twenty groupings ("Operations" and "Other Issues and Needs" were omitted from the prioritization process.) The following list indicates the order in which each item was addressed and not the importance of the facility.
1. Container Cargo Terminal(s), Including Off-Dock Container Yards 2. Berths 3. Roadways 4. Cruise Passenger Terminal(s) 5. Honolulu Harbor Navigation Improvements & Traffic Flow 6. Barbers Point Harbor Expansion Project 7. Dry Bulk Cargo Terminal(s) 8. Acquire Daishowa Area at Pier 40 9. Liquid Bulk Cargo Terminal(s) 10. Automobile Cargo Terminal(s) 11. Kewalo Basin Navigation Improvements 12. Excursion Passenger Terminal 13. General Cargo Terminal(s): Breakbullc, Lumber 14. Ship Building, Repair and Maintenance Facility 15. Domestic Fishing Village 16. Ferry Terminal 17. Foreign Garbage Disposal Facility 18. Maritime Office Building
19, Multi-Purpose Storage Area
20. One Stop Shop
Using this list, the Planning Committee developed its preferred 2020 scenario, which was presented to the Sub-Groups for their deliberation and returned to the Planning Committee for refinement into a recommended 2020 plan. The recommended 2020 plan was forwarded to the Executive Committee for its consideration.
V-8
AR00025047

TASK FORCE AND
SUB-GROUPS
PLANNING COMMITTEE MARITIME USERS &
BUSINESS
COMMERCIAL FISHING
TOURIST RELATED
GOVERNMENT
GOVERNMENT
TERMINAL OPERATORS
OTHER LAND BASED OPERATORS
OCEAN BASED/
NAVIGATION
Chapter V. Methodology
4. EXECUTIVE COMMITTEE
The Executive Committee was established to provide the 2020 planning effort with State policy guidance and address any unresolved conflicts between State agencies. The Directors of Budget & Finance (B&F), Business, Economic Development & Tourism (DBEDT), Health (DOH), Land & Natural Resources (DLNR), and Transportation (DOT) comprised the membership of this committee which also provided final review and recommendation of the plan for the Governor's approval.
It is hoped that this method of organization captured the greatest possible participation by all concerned agencies and maximized their contribution to the planning effort.
ORGANIZATION CHART
EXECUTIVE COMMITTEE 11VD8110D
V-9
AR00025048

Chapter V. Methodology
B. DATA GATHERING
Investigations and data gathering efforts in support of the planned harbor developments included mailed questionnaires, personal interviews and research. Research was conducted on the prior studies, related planning documents, current and historical wharfage statistics, associated data compilations and socio-economic studies listed below:
Harbors Division 2010 Plans for Honolulu and Barbers Point Harbors Barber's Point Development Plan Keehi Lagoon Recreation Plan The Honolulu Waterfront, "Charette for the Honolulu Waterfront Reawakening" Water Transit System for Oahu Development Plan: Downtown and Barbers Point Ferry Terminals, Oahu, Hawaii, March 1992, R.M.Towill Corporation Statewide Planning for Marina Facilities, Michael S. Chu, January 1989 Strategic Maritime Master Plan for Watetfront Redevelopment, Vickerman, Zachary, Miller, February 1988 Archaeological Inventoly Survey of the Proposed Barbers Point Harbor Expansion (Draft), Hammatt, Shideler, Heidel and Stride, June 1994 State of Hawaii Data Book Harbors Division wharfage statistics US. Army Corps of Engineers' Waterborne Commerce of the United States Report to the Director Identifying and Evaluating Revenue Opportunities for the State Department of Transportation; Venture Associates, Inc. Bank of Hawaii Annual Economic Reports Honolulu Waterfront Project Special Study Harbors Planning, January 1989 Cargoes, Matson's First Century in the Pacific, William Worden Interisland Ocean Freight Services in Hawaii, 1975 P.V. Garrod Assessment of Coal Technology Options and Implications for the State of Hawaii; Decision and Information Sciences Division, Argonne National Laboratory, December 1993 Final Environmental Impact Statement for AES-Barbers Point, Inc. Coal-Fired Co-Generation Facility; Belt Collins & Associates, June 1989 The Feasibility and Potential Impact of Manganese Nodule Processing in the Puna and Kohala Districts of Hawaii, DPED & NOAA, November 1981 Foreign Flag Fishing Vessel Expenditures in the Port of Honolulu 1986-88; Linda E. Lucias, Robert T.B. Iverson Saluting the Aloha Spirit American Hawaii's First Decade; Allan E. Jordan, 1990 Size and Growth Potential of Hawaii's Maritime Industry; Donna J. Lee and Cristina A. Olive, Department of Agricultural and Resource Economics and Sea Grant College Program, June 1994 The Proposed Hawaii Inter-Island Sea Ferry System; Economic Research Center, UH, March 1965
V-10
AR00025049

Chapter V. Methodology
Hawaiian Inter-Island Ferry Study, Final Report, Parsons, Brinckerhoff, Quade & Douglas, April 1962 DBEDT Quarterly Statistical & Economic Reports Hawaii Fisheries Plan, 1990-1995, Prepared for Division of Aquatic Resources Department of Land and Natural Resources, State of Hawaii by LMR Fisheries Research, Inc, June 1992 Kakaako Makai Area Plan, Final Supplemental Environmental Impact Statement, Hawaii Community Development Authority, January 1990 Building Honolulu, Clarence L. Hodge, Ph.D. and Peggy Ferris, Copyright 1950, The Advertiser Publishing Co. Ltd. The City and County of Honolulu, A Governmental Chronicle, Donald D. Johnson, Copyright 1991, University of Hawaii Press Hawaii; A Students' Guide to Localized History, Gerrit P. Judd, Copyright 1966, Teachers College Press. A History of Hawaii, Ralph Kuykendall, Copyright 1926, The Macmillan Company. 'Olelo No'eau, Mary Kawena Pukui, Copyright 1983, Bishop Museum Press.
Data collected and documented through this research was valuable in establishing past trends and methods of operation. Efforts to ascertain current market and operating data was conducted in part through questionnaires and personal interviews. Seventeen major port users were interviewed. The users were assured that any confidential information provided would not be divulged, therefore only a list of the interviewed agencies and the questions used as a basis for the interviews are located at Appendix C. In an additional effort to obtain valid data and suggestions for harbor development, a questionnaire was sent to 50 other harbor users. This Questionnaire for the Oahu Commercial Harbors 2020 Master Plan and the Preliminary Survey that was distributed during the initial Task Force meeting are also included in Appendix C.
C. 2020 PROJECTIONS
While the research and data collection efforts produced volumes of pertinent cargo information, substantiating data for maritime tourist operations could not be obtained. This is due to a lack of documented data and the unwillingness of the bulk of the industry to share sensitive information. It was not possible to develop 2020 projections for this industry without that data. While records of commercial fishing activity are available, it is difficult to project future quantities/locations of pelagic fish, and therefore difficult to project the size of this industry and its required 2020 facilities as well.
Cargo statistics were abundant, but reported in a wide range of categories and units. Once all the cargo data was organized in a logical and consistent format, the task of establishing valid correlations between this data and approved socio-economic indices began. Because Oahu's commercial harbors support the entire State through the receipt, distribution, consolidation and shipment of practically all its overseas cargo, it was agreed that valid statewide socio-economic data was required. The information found in a collection of DBEDT's "The State Data Book" provided the correlatives.
V-Il
AR00025050

Chapter V. Methodology
With correlations established between the significant cargo categories and historical socio-economic indices, the search for valid 2020 socio-economic assumptions was initiated. Normally the DBEDT's "Population and Economic Projections for the State of Hawaii to 2010 (Series M-K)" would have provided the valid socio-economic indices. But this Master Plan pushes the planning horizon ten years beyond these projections, and DBEDT's 2020 M-K projections were not available. In lieu of this, two differing sets of 2020 assumptions were considered:
1) The DOT Statewide Transportation Planning Office's (STP) revised 2020 assumptions for the counties of Hawaii, Maui and Kauai; and
2) The Oahu Metropolitan Planning Organization's (OMPO) 2020 base assumptions for its Oahu Regional Transportation Plan.
There were concerns over the use of these assumptions. First, the methodology used to establish STP's 2020 assumptions differed from OMPO's methodology. Both assumptions would have to be combined to produce statewide assumptions for the cargo projections. The validity of adding two separate assumptions developed by different methodologies to produce another assumption is questionable. Second, it could not be ascertained that either STP or OMPO assumptions were based on the information contained in the State Data Book. Cargo statistics were correlated with this data, and a deviation from the use of this data could invalidate harbor facility projections. Third, both assumptions were limited in their assortment of variables, aggravating the correlation of data. Fourth, both STP and OMPO assumptions build on DBEDT's 2010 M-K projections which were deemed obsolete. Finally, neither set of assumptions were developed in complete five-year intervals, which is necessary for incremental port facility development.
On September 8, 1995, the Office of State Planning provided the DBEDT Preliminary Baseline Forecast of Hawaii's Gross State Product, State Output, State Employment, State Personal Income, State Population, the Counties' Population, Personal Income and Employment, and other Exogenous Variables for Harbors Division's consideration. The Preliminary Baseline Forecast was based on historical records of the State Data Book and offered statewide assumptions for a wider range of variables in five year increments through the year 2025. Although this forecast was far from being finalized and the visitor arrival and de facto population projections were missing, it was acknowledged that the Preliminary Forecast was congruent with developed correlating factors and would produce the most acceptable future port facility requirements.
Cargo activities that were correlated with historical socio-economic indices were then applied to the appropriate, incremental, 2020 baseline forecasts to establish future quantities of cargo. The spatial requirements for handling the forecast cargo volumes were determined by the application of commonly used port planning formulae to these projected cargo quantities. These spatial requirements are contained in the Oahu Cargo Forecasts and Future Port Facility Requirements (Appendix B) which were updated when DBEDT produced its December 1995, Preliminary
V-12
AR00025051

Chapter V. Methodology
Population and Economic Projections for the State of Hawaii to 2020 (Series MK2020) and further refined by the June 1996, Revised Preliminary.
V-13
AR00025052

Chapter VI. Planning Committee's Recommended 2020 Plan
VI. PLANNING COMMITTEE'S RECOMMENDED 2020 PLAN Discussion of Maritime Activities, Recommendations and Alternatives
The discussions, recommendations and alternatives of this chapter are organized according to the Planning Committee's prioritized list of issues and needs (See Chapter V. Methodology, section A. Organization, part 3. Planning Committee, page V-8.)
A. CONTAINER CARGO TERMINAL(S)
DISCUSSION
Hawaii depends almost entirely on the ocean shipping industry to import its essential commodities (food, clothing, fiiel, building materials, automobiles, etc.) and export local products (pineapple, sugar, molasses, livestock, diversified agriculture, etc.) to and from the neighbor islands, the mainland, and various foreign countries. Developed island economies are typically dependent on ocean shipping for their sustenance.
The importance of cargo shipping to our State cannot be overstated. This Master Plan therefore begins with the facilities and services required by the overseas cargo carriers. While the economic value of commercial fishing, ocean mining, passenger cruises, excursions and ferries, etc. cannot be denied, commercial harbor planning must first address Hawaii's life-sustaining cargo operations. The requirements of the ocean cargo carriers must be given priority.
Based on the throughput of containers (counted in 20-foot equivalent units or TEUs) the American Association of Port Authorities ranked Honolulu Harbor as the tenth busiest of all 75 North American container ports in 1995. Yet, in a selected study of thirteen of these comparable ports (SMS Research, 1996), Honolulu Harbor's cargo acreage places it in the lower 31 percent of this range. This discrepancy between the large number of containers handled and the limited cargo acreage available suggests that Honolulu Harbor's cargo handling efficiencies are constrained by a lack of space.
A recent evolution in the method of retail inventory management further exacerbates the cargo movement problem. Supplies are now ordered and scheduled to arrive "just in time" to replenish depleted stocks. This practice reduces the need for individual storage facilities, but places the burden of timely delivery on the cargo carriers. The commercial harbor cargo yards, therefore, have been transformed into the State's "warehouses," further complicating the orchestration of cargo movements.
"Just in time" shipping also limits the potential for direct overseas cargo shipments to the neighbor islands. Container vessels have such large capacities that it would take weeks to fill a ship with a
VI-1
AR00025053

Chapter VI. Planning Committee's Recommended 2020 Plan
neighbor island's orders and justify a direct shipment. Merchants (especially grocers) will not tolerate such infrequent deliveries of their merchandize.
An integral step in the development of a valid 2020 plan was the substantiation of the cargo carriers' facility requirements. This was accomplished by projecting cargo volumes through the year 2020 and conceptualizing the facilities necessary to support this amount of cargo.
Projections of future cargo volumes, however, proved a strenuous task. In examinations of past cargo records, it was discovered that cargo shipments were recorded in various modes (short tons, revenue tons, TEUs, etc.), separated into multitudinous categories (liquid propane, crude oil, jet fuel, diesel, coal, clinkers, sand, breakbulk, general cargo, cars, livestock, etc.). The volume of cargo alone made this one of the more time consuming tasks of this planning effort. Once the past cargo records were organized and documented in a consistent format, correlating socio-economic projections were applied to establish a valid 2020 prognosis of the volume of cargo expected in Oahu's commercial harbors. The projected volume of cargo was then applied to commonly used port planning formulae to determine the space required to manage this amount of cargo.
The estimates of space required by the year 2020 are considerably greater than the land currently available for port operations. Oceanfront property on Oahu is a valuable and scarce commodity, and cargo carriers have had to make do with the little that is available. This plan attempts to adjust the space requirements for the projected 2020 volume of cargo, acknowledging that cargo carriers must continue to make the best use of allotted space, devise appropriate operational schemes and attempt to deal with the inefficiencies associated with this lack of space.
The need for services that support shipping is largely determined by the demand for shipping, and the demand for shipping is dictated by the local economy. Current projections for Hawaii's economy in the year 2020 dictate the development of significant, consistently well-planned commercial harbor facilities. Otherwise, competition for scarce resources, such as berthing and backup lands for cargo handling, can slow industry growth, causing congestion in the harbor and on the roadways, raising the costs of merchandise.
RECOMMENDATIONS
In 1986, 613,000 TEUs of overseas containers moved through Hawaii's port system. The volume of container shipments grew to 876,000 TEUs by 1991, and reached 1,005,000 TEUs in 1996. The overseas container volume is projected to top 1,338,000 TEUs in the year 2020. When computed into berth and acreage requirements, the 1,338,000 TEUs amount to two double-berth container modules and two single-berth container modules (see page APP:B -24 for the definition of container module).
0 To satisfy these requirements, 2020 container operations are recommended at Pier 1 (Fort Armstrong), ICapalama Military Reservation (KMR) and Piers 51-53 on Sand Island.
VI-2
AR00025054

Chapter VI. Planning Committee's Recommended 2020 Plan
0 Although overflow container shipments may be directed to Barbers Point Harbor, cargo carriers cannot justify the costs of maintaining separate terminals at both Honolulu and Barbers Point harbors. Furthermore, container shipments to Barbers Point Harbor will displace other cargo activities.
B. BERTHS
DISCUSSION
To satisfy the existing number of maritime vessels and insure their safe and efficient operations, Harbors Division Operations staff, in an informal poll, felt that they could use an additional 120 berths (1 container ship berth., 1 cruise ship berth, 1 auto carrier berth, 6 barge berths, 2 fueling berths, 110 fishing/excursion vessel berths). There are an untold number of additional requests for berthing that are regularly denied because of a lack of facilities. As an example, one ships' agent reported being approached in 1990 by a number of owners of foreign flag tuna longliners seeking to homeport vessels in Honolulu. Beginning with 25-30 tuna longliners, many more could be expected if the initial homeportings are successful. The owners prefer to leave their vessels nearer to the fishing grounds and fly the crews back and forth between their country of origin. The agent said that he could not encourage the owners in this endeavor because of uncertainties over future dock sites available to longliners. The ability to provide such berthing would assist the Harbors Division in fulfilling its legal mandate, and the additional income from such berthing would help offset the costs of harbor development.
RECOMMENDATIONS*
The projections of 2020 cargo activity also stipulate specific berthing requirements, which are satisfied by the following berth allocations.
O 6 container berths at Fort Armstrong, KMR and Sand Island and an alternative container berth at Barbers Point Harbor.
O 2 neobulk barge berths at Honolulu Harbor's Piers 31-34 and Barbers Point Harbor's Pier P-5. An alternative neobulk barge berth is possible along Piers 19-20.
O 2 bulk-unloader berths at Piers P-6 and P-7, Barbers Point Harbor.
O 2 liquid bulk berths at Pier 51, Sand Island and Pier P-4, Barbers Point Harbor. Other liquid bulk transfer berths are available at Honolulu Harbor's Pier 30 and 34, and Barbers Point Harbor's Piers P-5, P-6 and barge harbor.
VI-3
AR00025055

Chapter VI. Planning Committee's Recommended 2020 Plan
O 1,055 hours/year of roll-on/roll-off (RO/R0) automobile carrier berthing at Piers 31-33. Pier P-7, Barbers Point Harbor, provides an alternative RO/RO automobile carrier berth. Berths for containerized automobile shipments are available at Fort Armstrong, KMR, Sand Island and Barbers Point Harbor.
O Inter-island cargo vessel berths are provided at the inter-island cargo facility, Piers 39-40.
Additional berthing capability is proposed by the construction and allocation of these facilities:
O Finger piers in the area of Piers 12-18 for the larger domestic commercial fishing boats.
O Lay berths in Keehi Lagoon along Lagoon Drive for commercial fishing boats (both foreign and domestic), barges and other vessels, including provisions of water, electricity and security fencing. Access to these lay berths will be provided by dredging an access channel across the Keehi Lagoon "triangle" and by dredging Seaplane Lane 8-26 to a depth of -25 feet.
O Marginal wharves for oil response vessels in Keehi Lagoon, also along Lagoon Drive, including electricity, water and telephone service. Alternative berthing for these oil response vessels is available at Barbers Point barge harbor. While surge and surf problems currently prohibit this arrangement, hydrographic model tests indicate that the proposed entrance channel jetty will make the Barbers Point Harbor barge harbor berth a viable alternative.
O Five cruise ship berths at Piers 2 (two berths), 9, 10-11 and 19-20.
O Piers 28-29 are added to the existing bunker berths along Piers 31-34.
O Modifying the front row of Ala Wai Yacht Harbor's inner basin to accommodate berthing for off-shore activity vessels, water taxis and loading dock facilities. Although the front row of Ala Wai Boat Harbor is currently targeted for commercial activity, other portions of the harbor may provide viable alternatives. Displaced occupants of these berths will move to either of two proposed recreational marinas in Keehi Lagoon. Mega-yacht berths will be included in the marinas.
* Other than at Kewalo Basin/Annex, berthing within the State's commercial harbors is generally not permanently assigned. Vessels entering port are directed to their berths according to the shoreside facilities required and the availability of such berths.
The recommended berth allocations contained in this chapter serve as an informal guide for vessel placement. More importantly, these allocations indicate the facilities required to accommodate the kinds and numbers of vessels anticipated by the year 2020.
VI-4
AR00025056

Chapter VI. Planning Committee's Recommended 2020 Plan
C. ROADWAYS
DISCUSSION
Roadways are an integral component of the commercial harbor infrastructure. Sufficiently-sized entrances/exits to cargo yards, convenient access to major thoroughfares, and the reduction or elimination of traffic congestion are all necessary for efficient cargo movement between ship and store.
RECOMMENDATIONS
The 2020 Master Plan recommends:
O The improvement of all supporting roadways by widening and the addition of turning and stacking lanes;
O The development of a perimeter roadway around Honolulu Harbor to alleviate traffic on Nimitz Highway;
O Provision of better roadway access to KMR;
O Coordination with DOT Highways Division's proposed Nimitz Highway viaduct project;
O Modification/realignment of the existing roadways at Fort Armstrong and Kewalo Basin;
O A new access road at Barbers Point Harbor; and
O A tunnel under Kalihi Channel to replace the Sand Island bridges and re-open Kalihi Channel for vessel movement. An alternative recommendation is the construction of a bridge high enough to allow vessels under it, similarly opening Kalihi Channel as a second entrance/exit. If airport runway height restrictions prohibit a suitable bridge at the current site, the higher bridge will have to connect Sand Island to another location within the harbor.
D. CRUISE PASSENGER TERMINAL(S)
DISCUSSION
In anticipation of a "boom" in the number of ocean cruise passengers, the international cruise industry is building a record number of new passenger ships. The domestic cruise industry, reportedly experiencing saturation of the Caribbean market and the Alaskan market's approach of its limit, is reaching out to new markets. As these cruise lines investigate new destinations, local ship agents are
VI-5
AR00025057

Chapter VI. Planning Committee's Recommended 2020 Plan
receiving increased inquiries for new and additional cruise ship calls. Hawaii's inter-island cruise line, acting on internal market studies and near-capacity bookings of its existing ship, is actively pursuing the acquisition of a second vessel. Recognizing the potential growth of this industry, the Chamber of Commerce of Hawaii has agreed to promote Hawaii as a destination for both foreign and domestic cruises.
RECOMMENDATIONS
0 While Hawaii offers an excellent destination for cruise passengers, cruise terminal facilities are largely lacking. This discrepancy is addressed by the recommendation to improve or construct four cruise ship terminals at Pier 2 (two berths), Pier 9, Piers 10-11 and Piers 19-20. These terminals provide berthing for five cruise ships.
E. HONOLULU HARBOR NAVIGATION IMPROVEMENTS & TRAFFIC FLOW
DISCUSSION
Honolulu Harbor's congestion limits the operational efficiencies of every harbor user. Ever since the bascule bridge's motors were removed and the bridge was locked in 1988, the harbor has operated as a virtual "cul-de-sac." Harbor traffic is relegated to only the main entrance channel, and the delay in arrivals and departures is at times intolerable. Adding to the harbor's navigational problems is the substantial increase in number and size of vessels. Honolulu Harbors' turning basins and channel widths have become subsequently restrictive.
The Harbors Division intends to convene user group meetings with recreational boaters to solicit their input and address their concerns over possible impacts of the proposed navigational improvements.
RECOMMENDATIONS
The following alterations are recommended to ease the harbor's navigational problems.
0 Re-open Kalihi Channel to vessels entering/exiting the harbor, thereby relieving the main channel congestion and reducing the larger vessels' use of the turning basins. This is accomplished in part by the construction of a vehicular tunnel under Kalihi Channel to Sand Island. An alternative to the tunnel is a higher Sand Island bridge, which would also provide a second harbor entrance/exit. If Federal Aviation Administration height restrictions prohibit a suitable bridge at this location, the higher bridge will have to connect to Sand Island from elsewhere within the harbor. The effort to re-open Kalihi Channel will be coordinated with the U. S. Army Corps of Engineers.
VI-6
AR00025058

Chapter VI. Planning Committee's Recommended 2020 Plan
0 Dredging Kalihi Channel to a width of 500 feet and a depth of -45 feet is required before the larger vessels can utilize the second entrance/exit. Further rounding of the corners and dredging of a turning basin (seaward of the second entrance) is necessary to allow these ships to come into the prevailing winds as they enter Honolulu Harbor through Kalihi Channel. These actions also require coordination with the U. S. Army Corps of Engineers.
o KMR must also be dredged 100 feet inland to make the turn from the Kapalama Basin into Kalihi Channel viable, especially when container vessels are berthed at Pier 42.
F. BARBERS POINT EXPANSION PROJECT
DISCUSSION
Hawaii's cargo volumes continue to increase. To ease the congestion within Honolulu Harbor, the "hub" of Port Hawaii, , bulk cargo shipments are directed toward Barbers Point Deep Draft Harbor. In the scant six years that Barbers Point Harbor has been in operation, however, competition for berths has grown rigorous and shippers are concerned about potential delays and the resultant revenue losses. Already, ships are sometimes forced to anchor off-shore while other vessels are loading and discharging their cargo. Barbers Point Harbor only has two piers and the surge-ridden barge harbor available for cargo operations, and many bulk cargo vessels require substantial time at berth to complete their operations. (Scrap metal loading requires 8-10 days, 5 days are usually necessary to discharge coal, clinker ships normally are at berth for 4 days, as are ships carrying naphtha.) These delays can cost shippers between $20,000 and $50,000 per day, depending on the charter rate in use.
RECOMMENDATIONS
The increased use and importance of Barbers Point Harbor as Honolulu Harbor's supplement, coupled with the growth of the communities in Oahu's Ewa, Central and Leeward areas, necessitate Harbors Division's current plans for the deep-draft harbor.
O Perimeter lighting and construction of a control tower on the Pier P-4 peninsula are proposed as navigational aids, enabling 24-hour operations.
O To allow safer entry and exit, the 2020 Master Plan proposes dredging and flaring of the harbor's entrance channel and construction of a jetty to attenuate cross-currents. These projects will be coordinated with the U. S. Army Corps of Engineers.
O Plans for dredging the turning basin to accommodate deeper draft vessels will also be coordinated with the U. S. Army Corps of Engineers. A depth of-45 feet is recommended to allow fuller bulk loads into the harbor.
V1-7
AR00025059

Chapter VI. Planning Committee's Recommended 2020 Plan
O A triangular section of land is targeted for dredging to form a 90 degree corner between Pier P-4 and Pier P-5, which allows greater berthing flexibility at Pier P-5.
O A 300-foot seaward extension of Pier P-5 is planned to follow the dredging of the Pier P-4/P-5 corner.
O The proposed harbor expansion, approximately 1,100 feet by 1,100 feet along the northeast margin, will provide additional space for cargo and dry-dock operations. All efforts will be taken to develop the full I,100-by-1,100-foot expansion. Only if this cannot be accomplished in a single project will the phased development (Pier P-5 extension, 1,100-by-600-foot expansion; Pier P-7 construction; 1,100-by-500-foot expansion; relocation of the dry dock; construction of the Pier P-4 fuel dock) be considered.
O Following completion of the harbor expansion, construction of Pier P-7 is planned as a 1,100- foot marginal wharf for bulk cargo.
O A dedicated petroleum dock is proposed at Pier P-4, displacing the dry-dock operation which will be relocated to the northwest area of the expansion project.
O A new harbor access road, wide and strong enough for industrial loads, with the requisite lighting and overhead clearances, is planned to connect the Pier P-7 yard to Kalaeloa Boulevard.
G. DRY BULK CARGO TERMINAL(S)
DISCUSSION
Dry bulk cargo includes grain, fertilizer, sand, gypsum, clinkers, cement, coal and scrap metal, and constitutes a significant percentage of the total cargo tonnage. Dry bulk cargo imported by HFM FoodService provides the State's flour, cattle feed and fertilizer. Hawaiian Cement's dry bulk cargo of cement and concrete products, is the construction industry's "building blocks."
AES' Barbers Point plant imports coal as an alternative energy source, diversifying Hawaii's fuel sources. An added benefit is that the ash resulting from coal combustion is used by cement producers. The Hawaii Metal Recycling Company's thy bulk exports are in the form of processed scrap metal from vehicles and demolition projects.
RECOMMENDATIONS
0 Bulk grain shipments will continue at Pier 23. In order to better utilize this pier, a continuous marginal wharf needs to be constructed and dredging is also required.
VI-8
AR00025060

Chapter VI. Planning Committee's Recommended 2020 Plan
O Barbers Point Harbor's Piers P-5, P-6 and P-7 are targeted for bulk shipments of coal, cement and scrap metal.
O Bulk cement will continue to be shipped out of Pier 34 and Barbers Point Harbor.
o Bulk shipments of sand will be received at Pier 34, at a proposed finger pier at Pier 60 and at Barbers Point Harbor,
H. ACQUIRE DAISHOWA AREA AT PIER 40
DISCUSSION
The Daishowa property is a natural expansion area for the inter-island cargo operations at Piers 39- 40.
RECOMMENDATIONS
O Eventual acquisition of this privately-owned parcel is recommended to allow its development for commercial harbor use and incorporation into the inter-island cargo terminal at Piers 39- 40.
I. LIQUID BULK CARGO TERMINAL(S)
DISCUSSION
In view that the State will not be rehabilitating its petroleum distribution system because of the huge capital cost and the liability involved, the areas designated for bunkering and petroleum product transfers are essentially at Kewalo Basin by truck and through private pipelines at Piers 29 to 34, Piers 51A and 51B, Barbers Point Harbor's Piers P-4, P-5 and P-6, and the off-shore mooring at Barbers Point. The consolidation of such operations reduces the total length of pipelines needed to service the vessels, and requires that the vessels be berthed only at these designated piers. The reduction in the total amount of petroleum lines also reduces the probability of lines leaking and increases the chances of immediate detection of such line failures.
An innovative alternative to the above is the barge bunkering service. The flexibility of such service, i.e., the bunkering at any berth and bunkering vessels off port, makes this an attractive service.
RECOMMENDATIONS
Although there are valid concerns over the existing petroleum storage facilities in Honolulu Harbor, it is understood that the cost to relocate these facilities to a more remote area is prohibitive. In any
VI-9
AR00025061

Chapter VI. Planning Committee's' Recommended 2020 Plan
case, some means of bulk storage is still needed in the vicinity for vessel bunkering and ultimate distribution to the downtown Honolulu area and airport.
O Additional bunkering facilities are planned for Piers 28 and 29, in an effort to avail the existing bunker berths at Piers 31-34 for cargo vessel berthing and access to the backlands.
O A dedicated petroleum dock is recommended at Barbers Point Harbor's Pier P-4.
O Liquid bulk transfers are also possible at Piers 30, 51A, 51B, P-5 and P-6, Barbers Point Harbor, Liquid bulk storage sites are located at Pier 30 and mauka of Pier 38,
J. AUTOMOBILE CARGO TERMINAL(S)
DISCUSSION
Automobiles are shipped in 40-foot containers and on RO/RO container ships, as well as on specialized automobile carriers. All methods of shipping automobiles require automobile storage at the terminal.
RECOMMENDATIONS
O The requisite backlands and pier facilities for automobile shipments are at Fort Armstrong, Piers 31-33, Piers 39-40, KNIR and Sand Island.
O Barbers Point Harbor's Pier P-7 provides an optional site for automobile shipments, however, dust from the nearby coral stockpiles may present a problem.
K. KEWALO BASIN NAVIGATION IMPROVEMENTS
DISCUSSION
Problems of cross currents, eddies and high surf at Kewalo Basin's entrance channel need to be studied. Vessel operators experience great difficulty in maneuvering their craft in and out of Kewalo Basin during episodes of high surf.
RECOMMENDATIONS
O If applicable, jetties and channel dredging will be included in the 2020 development scheme to eliminate or attenuate problems of cross currents, eddies and high surf.
VI-10
AR00025062

Chapter VI. Planning Committee's Recommended 2020 Plan
L. EXCURSION VESSEL PASSENGER TERMINAL
DISCUSSION
Excursion vessels constitute a growing population of commercial harbor occupant. Included in this grouping are the "barefoot" cruises, sunset dinner cruises, submarine tours and charter fishing operations. A trend towards larger excursion vessels is developing. Already, large vessels such as the Navatek, Alii Kai and Rella Mae are home-ported in Honolulu Harbor and the Star of Honolulu is just barely able to turn around in Kewalo Basin. Additionally, these large boats require extensive land support areas to accommodate the many tour buses needed to transport their passengers. A fully loaded Star of Honolulu will accommodate 1,500 passengers. This is the equivalent of 34 bus loads at 45 passengers per bus. As Hawaii's tourists continually seek new avenues of recreation, Kewalo Basin and Honolulu Harbor receive more and more requests for excursion vessel facilities.
RECOMMENDATIONS
0 The Excursion Vessel Passenger Terminal is proposed at Piers 26-27. If the additional excursion vessel berthing provided by this proposal proves insufficient, some excursion vessels may have to motor from their berths in other locations to load and discharge their passengers at the Terminal.
0 Excursion vessel accommodations are also possible at Piers 5-7, with the continuance of the maritime museum on the western side of Pier 7.
M. GENERAL CARGO TERMINAL(5)
DISCUSSION
This classification is used for inter-island cargo and for neobulk commodities moving in large, unitized loads. Although inter-island and neobulk cargoes are increasingly shipped in containers, certain commodities such as newsprint, lumber, steel, construction components, heavy equipment and vehicles can be efficiently loaded and transported without containerization, and continue to move in unitized form.
The inter-island system of cargo distribution is the principal means by which neighbor island communities receive and export their cargo. This system has Honolulu Harbor as its hub or point of distribution and consolidation. Because of Oahu's large population and the corresponding high demand for goods, container vessels are used to reduce the costs of shipping to Honolulu. In Honolulu Harbor, containers are off-loaded by destination. Oahu's cargo is loaded onto trucks for delivery. Cargoes destined for the neighbor islands are transferred onto barges for shipment. Until the neighbor islands' demand for commerce or volumes of exports qualify for similar direct overseas
VI-11
AR00025063

Chapter VI. Planning Committee's Recommended 2020 Plan
shipments, this system of distribution will remain an integral part of the neighbor island economy.
Like the overseas cargo trade, operating and capital costs will influence the trend of more container use in the inter-island trade. Also similar to the overseas trade, inter-island shipping's operational and capital investment costs are leading to larger vessels and larger capacity handling equipment. The growth of diversified agriculture could lead to more inter-island cargo traffic in terms of frequency as well as tonnage, due to the time sensitiveness of agricultural products. Growth of the neighbor islands' populations, tourist industries, construction activities and general economies will affect inter-island shipping in a similar manner. Facility improvement plans for inter-island operations consider these trends.
RECOMMENDATIONS
The 2020 projections for general cargo total 3,919,800 short tons, which when computed into berth and acreage requirements, result in two berths and 40 acres of cargo yard in addition to the inter-island cargo facilities at Piers 39-40.
0 To satisfy this requirement, general cargo terminals, including inter-island and neobulk shipments, are recommended at Piers 31-34, Piers 39-40, and Barbers Point Harbor's Pier P-5. Piers 19-20, the site of a cruise passenger terminal, is also designated as a general cargo terminal. It is this plan's intent to establish both cargo and passenger facilities in this area.
N. BOAT BUILDING, REPAIR AND MAINTENANCE
DISCUSSION
Two companies in Hawaii have dry dock facilities and handle all of the major commercial repair jobs on Oahu. Another operation maintains a repair yard at Kewalo Basin and repairs commercial fishing vessels. Twenty-five other independent firms handle what is classified as "minor" ship repair. The dry dock and repair facilities located in harbors around the islands are accessible to the smaller and medium-sized vessels only. While extensive ship repair facilities are located in Pearl Harbor, the Navy is currently unwilling to allow commercial ship building, repair and maintenance facilities there. Thus, commercial ship building and a majority of the repair work for Hawaii vessels occur outside of Hawaii. Ship and boat building facilities in Hawaii will always be limited by the lack of manufacturing facilities and the subsequent cost of transporting parts.
Hawaii's fleet of medium-sized vessels including tugs, barges, commercial fishing boats, excursion boats and other miscellaneous water craft will continue to require local marine repair facilities. The nearest alternative repair facilities are located on the west coast. Considering the travel time and subsequent loss of revenues, it is evident that local shipyard service is preferred.
V1-12
AR00025064

Chapter VI. Planning Committee's Recommended 2020 Plan
RECOMMENDATIONS
O By the year 2020, a joint/cooperative boat repair and maintenance facility is proposed at the Barbers Point Harbor expansion area.
O A submarine maintenance facility is planned at Pier 15.
O Anticipated alternative locations for these operations may be possible within Pearl Harbor.
0. DOMESTIC FISHING VILLAGE:
DISCUSSION
Since 1985, the fishery picture in Hawaii has changed rapidly and in unforeseen ways. The tuna cannery closed, resulting in a substantial decline in landings for what once was the largest fishery for the State - the aku (skipjack tuna) pole-and-line fishery. Hawaii did not become a base and trans-shipment point for purse seine-caught tuna and troll-caught albacore. Foreign longliners were excluded from the Unites States 200-mile Exclusive Economic Zone (EEZ) surrounding the State and have been replaced by a fleet of American longline vessels employing new methods for targeting bigeye tuna and broadbill swordfish.
With few exceptions, however, the catch of pelagic fish has increased greatly in landings and value. Hawaii's commercial landings are at a record high in value with some estimates for 1990 near $50 million. Exports of tuna and swordfish to Japan and the U.S. account for a large percentage of the catch. New and improved facilities are likewise required to support this lucrative industry.
While it is difficult to project future quantities/locations of pelagic fish and subsequently difficult to project the size of the commercial fishing industry and its required 2020 facilities, the proposed commercial maritime visitor industry use of Kewalo basin necessitates the following plans for a consolidated Domestic Fishing Village.
RECOMMENDATIONS
O The 2020 Master Plan targets Pier 36 as a site for the Domestic Fishing Village, which consolidates fish auction, fish processing, ice house and fueling operations. While proximate location of the Domestic Fishing Village's operations is preferred, both Kewalo Basin and the Pier 36 site may be simultaneously utilized during the transition until the appropriate facilities are completely constructed and operational. Larger fishing vessels will be provided berths by the planned construction of finger piers in the area of Piers 12-18 and by lay berths planned for Keehi Lagoon along Lagoon Drive. The smaller fishing boats will be provided berthing in both proposed Keehi Lagoon recreational marinas at Pier 60 and along Lagoon Drive.
VI-13
AR00025065

Chapter n Planning Committee's Recommended 2020 Plan
P. FERRY TERMINAL
DISCUSSION
The objective of a ferry system is to offer a scheduled, comfortable, speedy, and inexpensive mass surface transportation service for people, automobiles, and limited cargo (under specified conditions) between the major islands of Kauai, Oahu, Molokai, Maui, and Hawaii, and between designated points on the island of Oahu - - an oceanic highway offering an alternative to costly air travel and congested overland routes.
The purpose of the intra-island ferry system is to minimize traffic congestion on land by providing an alternate means of transportation between commuter destinations on Oahu's southern coastline. Although an attempt to establish this ferry system did not attract the number of riders necessary to sustain the operations, reintroduction of an intra-island passenger ferry remains a possibility. There have been periodic inquiries from interested parties, including the City and County of Honolulu, assessing the viability of such a service.
Although interest in the establishment of an inter-island ferry service has existed for a number of years, it was not until about 1955 that this interest developed into definitive studies of the possibilities. Initially, consideration was largely confined to water transportation which would provide a faster and more frequent service than that furnished by the existing barge lines and at rates competitive with the airlines. Essentially, a passenger and vehicle ferry service was envisioned with the additional possibility of carrying perishables and high-value freight.
RECOMMENDATIONS
0 The 2020 Master Plan proposes to combine the Inter-Island Ferry Terminal with the Excursion Vessel Terminal at Piers 26-27.
0 Pier 8 remains the designated Intra-Island Terminal.
Q. FOREIGN GARBAGE DISPOSAL FACILITY
DISCUSSION
The Planning Committee agreed that the State is not responsible for the development of such a facility, rather that this is a privately contracted service. This service, however, is required as part of the Coast Guard Certificate of Adequacy. Without this certification, the Coast Guard can stop foreign vessels from entering the harbor, putting the burden of providing such service on the State.
VI-14
AR00025066

Chapter VI. Planning Committee's Recommended 2020 Plan
RECOMMENDATIONS
O This issue is eliminated from the State's list of harbor facility requirements.
R. MARITIME OFFICE BUILDING
DISCUSSION
As envisioned, this Maritime Office Building will house the various maritime services located within Oahu's commercial harbors. This consolidates the maritime community (including Harbors Division, DOT) into a single, central structure, effectively utilizing a multi-story building to alleviate some of the spatial congestion caused by the wide dispersal of maritime services within Oahu's port facilities.
RECOMMENDATIONS
O A proposed site for the Maritime Office Building is in the cruise vessel terminal at Piers 10- 11.
Possible alternatives for construction of a multi-use facility that houses maritime office space are:
O The commercial development in the northeast corner of Fort Armstrong;
O The cruise vessel terminal at Piers 19-20; and
O The Excursion Vessel and Inter-Island Ferry Terminal at Piers 26-27.
S. MULTI-PURPOSE STORAGE AREA
DISCUSSION
The harbor users requested a multi-purpose storage area for stevedore equipment, commercial fishing gear, newsprint and vehicles. A consolidated storage facility, like the Maritime Office Building, would result in more space being made available for other services and an increase in operational efficiency.
RECOMMENDATIONS
O Piers 19-20, 23-25 and 31-35 are suggested as potential sites for the Multi-Purpose Storage Area.
VI-15
AR00025067

Chapter VI. Planning Committee's Recommended 2020 Plan
T. ONE STOP SHOP
DISCUSSION
The concept of a One Stop Shop consolidates a few complementary services within a single facility. These services include Foreign Trade Zone operations, cargo handling and storage, fumigation, and U.S. Customs inspections.
Hawaii's Foreign-Trade Zone No. 9, headquartered at Pier 2 in Honolulu Harbor, administers one of the largest and most diversified of the 174 Zones in the United States. For over a quarter of a century Hawaii's Zone, operated by the State of Hawaii Department of Business, Economic Development & Tourism, Foreign-Trade Zone Division has been instrumental in making Hawaii an attractive, cost-effective place to do business.
Hawaii's Foreign-Trade Zone No. 9 provides warehouse storage at monthly rates and rental of warehouse handling equipment and labor at hourly rates. Users also rent warehouse space for merchandise assembly, manipulation, or manufacturing on a daily, monthly, or annual basis. Office and exhibition space are also available for rent.
Cargo-handling equipment includes heavy lift tractors, six 30-ton diesel forklift trucks, carriers and trailers. Additional stevedore and rental equipment are available as required. Bulk storage, container storage and break-bulk facilities are located nearby.
RECOMMENDATIONS
O A possible location for this One-Stop Shop is in a commercial development in the northeast corner of Fort Armstrong, which may be separated from the container yard by an extension of Ilalo Street connecting to South and Punchbowl streets. If this site proves untenable, other locations within Fort Armstrong will be considered.
U. ADDITIONAL RECOMMENDATIONS
O Develop a freight-forwarding facility in the Keehi Industrial Park Association (KIPA) area.
O Relocate the University of Hawaii marine research programs from Snug Harbor to Pier 38.
O Provide office space for tugboat operations on a section of Pier 24.
VI-16
AR00025068

Chapter VII. Maps
VII. MAPS
VII-1
AR00025069

HA
RB
OR
CR
AF
T
EX
CU
RS
ION
BO
AT
MA
INT
EN
AN
CE
CO
MM
ER
CIA
L F
ISH
ING
-1"---g 13SNI as
0
0 0 2 < 0
GE
NE
RA
UN
EO
BU
LK C
AR
GO
NO
T T
O S
CA
LE
• ■•
al z
1--
13_
Z 0
—E 0
y 07
co < _J
D G.)
LI
ca 5
w cc 0
)-- 12
Ill 0 >
E E 12 0 0 0 0 ir
z — Ll 0
........
44* w z wi- OOZLL z 0 < WI 0 trIC°1—
11 -s`
• '54 I'
.gtn ' .- %
X * 6 % ik%
'11 1
*°1*.
4 \
Z
0.
(0 \
= 0C C
_
"11 o<E, 03 it
5>.
.. ...
HO
NO
LU
LU
HA
RB
OR
C-4
AR00025070

NO
T TO
SC
ALE
ALA
WA
I BO
AT
HA
RB
OR
BA
RB
ER
S P
OIN
T H
AR
BO
R
0
FU
TU
RE
CO
NT
RO
L T
OW
ER
FU
TU
RE
JE
TT
Y
CO
0
-J
EIZ CO cc'-j >.
0 W CC W 20Q.
EL
HA
RB
OR
CR
AF
T/F
ER
RY
INT
ER
ISLA
ND
CA
RG
O
SH
IPY
AR
D/B
OA
TY
AR
D
EX
CU
RS
ION
BO
AT
S
GE
NE
RA
L C
AR
GO
..•■■••■•.
AR00025071

Chapter VIII, Financial Considerations
VIII. FINANCIAL CONSIDERATIONS
Implementation costs for this Master Plan have been estimated to be $956 million (1996 dollars) including private and public sector projects. Thus, financial considerations will play an important role in implementing the recommendations of the 2020 Master Plan. Oahu Commercial Harbor 2020 Master Plan projects may be classified into three general categories of funding, based on the nature of the benefits incurred and on their revenue potential. The three categories are:
1. Basic Infrastructure Projects Without Revenue Potential; 2. Capital Projects With Revenue Potential; 3. Potential Public Private Partnerships.
A discussion of these three categories follows.
I. Basic Infrastructure Projects Without Revenue Potential: These are generally projects which do not generate revenue directly, but which will deliver common economic and financial benefits to all or most port users. As such, they would be more appropriately funded by traditional public funding sources (i.e., government grants-in-aid), possibly supplemented by new sources of earmarked funding which could be derived from all private port users (such as a port-wide improvement district) or from other beneficiary groups not directly located within the port (e.g., tourism businesses, auto rental companies, etc.). Preliminary estimated cost for projects in this category is $465 million.
2. Capital Projects With Revenue Potential: These are projects which generate user revenues in the form of rents, fees, or tolls, but which are judged either unlikely to generate sufficient revenues to attract a private investor/developer, or which for other reasons may be more appropriately owned and operated directly on a fee for service basis by the Harbors Division, or by a tenant of the Harbors Division. Because they generate revenues for the Harbors Division (either directly or through rental income), these projects could potentially be funded by a combination of traditional public sources and revenues. Revenues could be either directly earned by the Harbors Division where the Division is the operator, or as rental income where the Division rents the facility on a contract basis to a private operator. Revenues could be used directly or they could possibly be used to support port development revenue bonds, either on an individual project basis or on a pooled basis. It is likely that any such bonds would require further guarantees from the State. Projects falling into this category are estimated to cost $248 million.
3. Potential Public Private Partnerships: These are projects which are judged to have the potential to generate sufficient revenues (or other financial benefits) such that a private investor/developer could be induced to make an investment. Such investments could take a number of forms, but it is considered likely that any such investment would involve a public-
AR00025072

Chapter VIII. Financial Considerations
private partnership. The basic mechanism for soliciting such investments would probably be through an RFP process. Preliminary estimated cost for projects in this category is $243 million.
Traditionally, development of other harbor features including land acquisition and construction of buildings, yards and piers has been done using State and Corps of Engineers funds. However, due to the size of the Oahu Commercial Harbors 2020 Master Plan cost estimates and the limited resources of the Harbors Division, alternative financing may be required. The following possibilities may provide the means to finance implementation of the Oahu Commercial Harbors 2020 Master Plan projects.
Commercial Harbor User Fees. These are user fees which the Harbors Division levies on harbor users for the use of harbor facilities. Typical fees include dockage and wharfage.
Commercial Harbor Rentals. The second largest source of Harbors Division revenues comes from the lease and rental of lands (including storage and pipeline easements) under its jurisdiction.
Corps of Engineers. Through the U. S. Army Corps of Engineers, the federal government has participated in the financing and construction of basic harbor features such as entrance channels, turning basins and breakwaters. Usually, the Harbors Division is required to provide a "local match" to the federal funds required.
Federal Highway Administration. These funds are administered by the Federal Highway Administration (FHWA) and the State Highways Division and can be used for roadway and highway projects. Similar to Corps of Engineers projects, FHWA projects require local matching funds.
Private Sector Funds. Several projects will be attractive to the private sector and could be constructed with private funds, possibly through lease arrangements.
The selection of the means of financing to implement the Oahu Commercial Harbors 2020 Master Plan will be on a case by case basis. Different financing plans would be appropriate to the different types of projects proposed.
VIII-2
AR00025073

Chapter IX Environmental Assessment
IX. ENVIRONMENTAL CONSIDERATIONS
A. APPLICABLE ENVIRONMENTAL LAWS, RULES, REGULATIONS AND PERMITS
Any project that proposes work or discharges material in U.S. navigable waters must demonstrate compliance with a number of Federal laws and Executive Orders, which include:
O Section 10 of the Rivers and Harbors Act, Sections 401 and 404 of the Federal Clean Water Act Amendments (P.L. 95-217), and applicable implementing regulations. These laws stipulate that a permit is required for work performed in or affecting navigable waters which will have an impact on navigable capacity and for certain discharges of dredged or fill material into waters of the United States. This is of particular concern to the Federal Government.
O Section 307 of the Coastal Zone Management (CZM) Act (P.L. 92-583), as amended and applicable implementing regulations;
O Noise Pollution and Abatement Act (PI. 91-604) and applicable implementing regulations;
O Clean Air Act (P.L. 90-148), as amended, and applicable implementing regulations;
O Section 208 of the Federal Water Pollution and Control Act Amendments (P.L. 92-500), Safe Drinking Water Act (P.L. 93-523), and applicable implementing regulations;
O National Historic Preservation Act (P.L• 89-665), and applicable implementing regulations;
A number of State plans, policies and controls provide guidelines for development within the State of Hawaii. These guidelines include the Hawaii State Plan, State Functional Plans, State Land Use Plan, Kakaako Community Development District Plan and Conservation District Law.
The Hawaii State Plan was developed to serve as a guide for future development of the State of Hawaii in the areas of population growth, economic benefits, enhancement and preservation of the physical environment, facility systems maintenance and development, and socio-cultural advancement. The Plan identifies, in general, the goals, objectives, policies and priorities for the development and growth of the State. Guidelines have been provided in the Plan to give direction to the overall development of the State. The following describes the relationship and compatibility of the proposed project with the overall plans for the State of Hawaii as set forth in the Hawaii State Plan, Chapter 226 of the Hawaii Revised Statutes, as amended:
Population (HRS Section 226-5);
IX-1
AR00025074

Chapter IX Environmental Assessment
Economy (HRS Section 226-6, -8, and -10);
Physical Environment (HRS Section 226-11, -12, and -13);
Facility Systems (HRS Section 226-14 through -18);
Socio-Cultural Advancement (HRS Section 226-20, -21, -23, -24, -25, -26 and -27).
Twelve State Functional Plans were adopted by the State legislature in April 1984. These plans were formulated to specify in greater detail the policies, guidelines and priorities set forth in the Hawaii State Plan. The twelve functional plans include: Energy, Transportation, Water Resources, Historic Preservation, Recreation, Health, Education, Housing, Conservation Lands, Higher Education, Agriculture and Tourism. Except for the Housing Functional Plan, which is a part of the Kakaako Mauka Area Plan, and the Agricultural Functional Plan, all of the plans relate directly to the proposed Makai Area Plan.
The purpose of the Kakaako Makai Area Rules is to enable the Hawaii Community Development Authority (HCDA) to implement the policies and programs relating to the Kakaako district. The current makai area rules have been developed as a separate document which supports the recommendations of the Honolulu Waterfront Master Plan and the revised Makai Area Plan.
The Honolulu Waterfront Master Plan is a result of the 1988 Legislative Session's tasking of the Office of State Planning to prepare a comprehensive master plan for development and improvement of 1,550 acres - a six mile coastal stretch of the Honolulu waterfront, from Ala Wai Yacht Club to the Honolulu International Airport.
The State Land Use Commission designates land use. Projects will be developed in accordance with rules and regulations thereof.
The Conservation District Use Law consists of five subzones which include: 1) "Protective" (P), 2) "Limited" (L), 3) "Resource" (R), 4) "General" (G), and 5) "Special" (S). The conservation area of the Kakaako waterfront is seaward of the shoreline and is categorized as "Resource" subzone. The objective of this subzone is "to develop, with proper management, areas to ensure sustained use of the natural resources of those areas." Permitted uses in this subzone include all permitted uses stated in the Protective and Limited subzones; aquaculture; artificial reefs; and commercial fishing operations.
Other County or State approvals that may be required for individual projects include:
0 Building Permit - City/County Building Department;
0 Special Management Area (SMA) Permit - City/County Council;
1X-2
AR00025075

Chapter IX Environmental Assessment
O Grading/Grubbing Permit - City/County Dept. of Public Works;
O Approval of Drainage Outfall - State Dept. of Health;
O Conservation District Use Permit - State Board of Land and Natural Resources (BLNR);
O Use of State Land - BLNR and State Dept, of Transportation;
O Shorewaters Construction Permit - State Dept. of Land and Natural Resources;
O Permit for Industrial Wastewater Discharge - City/County Dept, of Public Works;
O Shoreline Variance Permit - Dept. of Land Utilization.
The Coastal View Study was prepared to identify significant views from within the SMA boundary islandwide. The focus of this report is the scenic and open space objective of the CZM Act and SMA Permit, and elaborates on implementation of the objectives and policies. The Study divided the island into seven viewsheds which include: 1) North Shore, 2) Koolauloa, 3) Koolaupoko, 4) East Honolulu, 5) Primary Urban Center, 6) Ewa, and 7) Waianae.
The Office of Environmental Quality Control, State Dept. of Health, requires that Environmental Assessments be prepared to determine whether proposed projects produce significant environmental impacts. The eight conditions which stipulate the preparation of an Environmental Assessment and which may trigger the resultant need for an Environmental Impact Statement Preparation Notice are:
O Use of State or County lands or funds;
O Use within Conservation District Lands;
O Use within the Shoreline Setback Area;
O Use within any Historic Site or District;
O Use within the Waikiki Special District;
O Amendments to a County General Plan (except for those initiated by the County);
O Reclassification of Conservation Lands; and
O Construction or modification of helicopter facilities.
IX-3
AR00025076

Chapter IX Environmental Assessment
The following permits and approvals may be required prior to project construction:
Federal
U.S. Corps of Engineers
O Department of the Army Permit (Section 10 or Section 404) for construction of structures or work in navigable waters.
State of Hawaii
Department of Land and Natural Resources
O Conservation District Use (CDUA) Permit;
O Concurrence of this Department regarding historic sites;
O Notice of Intent to Drill;
O Right of Entry approval for planning and construction work on State-owned lands.
Department of Transportation
O Written permit for any project involving permanent or temporary construction (Highways Ala Moana Boulevard and Nimitz Highway);
O Approval for utilities and traffic rerouting.
Office of Planning, Department of Business, Economic Development and Tourism
O Compliance with the Coastal Zone Management Program guidelines.
Department of Health
O National Pollutant Discharge Elimination System (NPDES) Permit;
O Noise Variance Permit;
O Variance for 24-Hour construction;
O Permit for Air Emissions;
IX-4
AR00025077

Chapter IX. Environmental Assessment
O Notification of work on sewer lines; (Wastewater generated by harbor activities must be collected and transmitted to the City's wastewater facilities. All wastewater plans must conform to applicable provisions of the Department of Health's Administrative Rules, Chapter 1 1 -62, "Wastewater Systems.")
O Section 401 Water Quality Certification.
City and County of Honolulu
Department of Land Utilization
O Permit for the construction of any structure within the Shoreline Management Area (SMA);
O Shoreline setback variance for construction in the shoreline area.
Department of Public Works
O Stockpiling Permit;
O Grubbing Permit;
0 Grading Permit;
O Demolition Permit;
O Dewatering Permit;
O Excavation Permit.
Building Department
O Building Permit.
Others
Hawaiian Telephone Company
O Permit or concurrence regarding work on utility lines.
Hawaiian Electric Company
O Permit or concurrence regarding work on utility lines.
IX-5
AR00025078

Chapter IX Environmental Assessment
Gas Company
O Permit or concurrence regarding work on utility lines.
Cable TV
O Permit or concurrence regarding work on utility lines.
Board of Water Supply
O Notification of drilling project area.
Energy Corridor
O Fuel easement crossings.
B. POTENTIAL ENVIRONMENTAL IMPACTS
In today's environmentally sensitive society, major construction projects are construed as the perpetrators of harmful, environmental actions. Because the recommendations contained in the 2020 Master Plan have the potential for adverse environmental impacts, a cursory environmental assessment of the 2020 proposals is provided in this section. This informal assessment further serves to establish the plan's feasibility by addressing potential regulatory constraints.
Port development projects are typically regulated by both federal and State environmental policies, and occasionally by specific city/county permit procedures. While none of the 2020 plan's recommendations appear to be overwhelmingly intrusive and thus infeasible, the environmental laws, rules, regulations and permits listed under section A of this chapter will be addressed before the Harbors Division proceeds to construct the proposed 2020 projects.
Many of the anticipated environmental impacts are temporary and short-term. Natural processes restore these temporary conditions to their original states. In most cases, it is possible to mitigate adverse environmental impacts and construct the projects within acceptable tolerance levels. The remaining, long-term, adverse environmental impacts are counterbalanced by the essential benefits provided to the general public by the construction of these harbor projects.
Dredging is proposed at Honolulu Harbor's Piers 22-23, Kalihi Channel, within Keehi Lagoon and at Barbers Point Harbor's entrance channel and turning basin. Environmental considerations for these dredging projects include surface water quality, hydrology, vibration, biological impacts, groundwater contamination and disposal of dredged spoils. Most of the environmental impacts are short-term and can be mitigated.
IX-6
AR00025079

Chapter 1X. Environmental Assessment
Both the Barbers Point Harbor Expansion Project and the re-opening of Kalihi Channel require excavation of significant fast land acreage. Noise, vibration, dust, water quality, groundwater contamination and disposal of dredged spoils require prudent, mitigating actions.
The construction of jetties to attenuate ocean surge at Kewalo Basin and Barbers Point Harbor requires that attention be given to surface water quality, hydrologic and biological impacts. Periodic strong surge at both harbors currently restrict maritime activities. The jetties will allow commercial vessels continuous access to the harbors for essential operations and are thus justified by an overall benefit to the public. Short-term, temporary impacts will be mitigated. There does not appear to be any practical alternative to the jetties.
Construction of other improvements within harbor waters, i.e.; marginal wharves, finger piers, moorings and marinas, must consider water quality, vibration, noise and biological impacts, which have historically been mitigated.
Landside development projects must address air, water and noise emissions, traffic and biological impacts, water quality, land use issues, and site contamination. Mitigation of these environmental impacts is possible and necessary.
Conversely, an environmental benefit of the 2020 recommendations is the potential for ancillary enhancement of the environment. The proposed dredging and excavation projects in Keehi Lagoon, for example, could enhance the water circulation and purging of the Lagoon.
As the Harbors Division does not foresee any overwhelming adverse environmental impacts resulting from the pursuit of the 2020 recommendations, no insurmountable regulatory obstacles are expected. Approvals through the normal regulatory processes are therefore anticipated. Such approvals have already been granted for similar projects, setting the appropriate precedents. Comprehensive environmental studies of each site will be completed and the necessary approvals secured before individual projects are started.
IX-7
AR00025080

Chapter X Acknowledgement of Participants
X. ACKNOWLEDGEMENT OF PARTICIPANTS
Oahu's commercial harbors are the maritime industry's infrastructure for the receipt and distribution of the State's commerce. Hawaii's economic and social structure is almost totally dependent on the goods imported through its harbors and the services provided by the commercial shippers. The complexities of the various operations found within these harbors replicate the intricacies of the State's technological lifestyle and almost defy attempts to consolidate them into a single master plan.
This planning effort would not be possible were it not for the generous cooperation of the individual members of Hawaii's maritime community and the fact that within this community are many that willingly assume the lead in isolating the problem issues and pursuing tasks to reconcile these differences. Of noteworthy mention are: Deme Panagopulos (formerly of Jardine Shipping Agencies); Mike Clarity (Inchcape Shipping Services); Randy Grune (Hawaii Stevedores, Inc.); Charles Pires (Honolulu Marine, Inc.); Bob Murray (Matson Navigation Company); Jeff Low (Young Brothers Ltd.); Terry O'Halloran (Atlantis Submarines); Kurt Pruitt (Sea-Land Service); Bill Thayer (Waldron Steamship Company); Tyrone Tahara (International Longshoremen's and Warehousemen's Union); Ken Tagawa (Matson Navigation Company); Bill Anonsen (American Hawaii Cruises); Steven Yoshizawa (Oceanic Global Trading); Steve Baker (Hawaii Pilots Association); and Alden Zecha (formerly of Sea-Land Service.)
All the tenants and users of Oahu's commercial harbors were invited to participate in this cooperative effort with the gamut of involved government agencies to establish a long-range planning guide for the development of essential harbor facilities. We proudly wish to acknowledge the overwhelming number of participants who are responsible for this plan:
Aala Ship Service - Rodney Tamamoto Alii Kai Catamarans All Hawaii Cruises Aloha Cargo Agency Services Aloha Cargo Transport - Fred T. Miura, Jim Warner Aloha Petroleum - Ron Everett, Sam Olson Aloha Tower Associates - David Schmidt, Eric Smith Aloha Tower Development Coporation - Ronald Hirano American Divers Inc. / American Workboats - Rusty Nall American Hawaii Cruises - William Anonsen Arneron HC&D - Linda Goldstein, William R. Kerby, Steve Proctor Applied Energy Services - Bill Ruccius Atlantis Reef Divers Atlantis Submarines Hawaii LP - Jon Chapman, Doug Fry, Terry O'Halloran
X- 1
AR00025081

Chapter X Acknowledgement of Participants
BHP Hawaii Inc. - Mike Canite, Lesley Brey, Bill Heddaeus, Susan Kusunoski, Pete Latham, Mike Latham, Darrell Young
C & H Sugar Co. - Fred Stammen Campbell Estate - Tim Brauer, David Franzel, Tom Heiden Chevron Shipping Co. - Clarence Chong Chevron U. S. A., Inc. - Richard Bertero, Dave Koning, Tim Potter, Wilson Rivera China Seas Dragon Enterprises - David Hoe City & County of Honolulu Department of Planning - Tim Hata, Cheryl Soon City & County of Honolulu Department of Public Works - Darwin Hamatnoto, Kenneth Sprague City & County of Honolulu Department of Transportation Services - Toni Hamayasu Clean Islands Council - Kim Beasley CON-FAB Corp. - Robert Patterson Cook Inlet Region, Inc. - David Shibata Dae Han Shipping Agency Inc. - James J. Su Dan's Dive Shop Davies Marine - Dave Davies Dream Cruises - Frank Alexich, Mike Watson BMW Enterprises Engineering Concepts Inc. - Ken Ishizaki, Dana Yamamoto Engineering Services Co. - Jason Lembeck FN Havana - Tom Webster Fisherman's Wharf. Sonny Morihara Fleming Foods - Roger Godfrey Hawaii Community Development Authority - Alex Achimore, Lori Hoo, Eric Matsutomi,
Jan Yokota Hawaii Maritime Center Hawaii Metal Recycling Co. - Jim Banigan, Lawrence Kalilikane Hawaii Ocean Industry - Mete Pochereva, Terry White Hawaii Pilots Association - Steven G. Baker, Frederick Hoppe Hawaii Responder - Tom Collins Hawaii Stevedores Inc. - Murray Grune, Randy Grune, Wendall Kiaha, Keith Inouye,
Rusty Leonard Hawaii Transportation Association - Gareth Sakakida Hawaiian Cement - John Shin, Frank Steinmiller Hawaiian Crane & Rigging Ltd. - C. Mack Rolison Hawaiian Electric Company - John Fitzmaurice, Ken Fong, Art Seki Hawaiian Independent Refineries, Inc. - Jim Kappel Hawaiian Milling Corp. - Cody Lee Mark Hawaiian Power Boats, Inc. - Vern Cassell Hawaiian Sugar Planters Association - Ruth Yamato Hawaiian Tug & Barge Corp. / Young Brothers Ltd. - Glenn Hong, Jeff Low, Kent Whitman,
Frank Yuen
X-2
AR00025082

Chapter X Acknowledgement of Participants
Hawaiian Tuna Packers - Stanley I. Hara HFM First In Foods - Leland Blackburn, Mike Fujimoto, Ken Nygard, Alan Yoshikami Honolulu Agency - Edward G.Araki Honolulu Marine Inc. - Charles Pires Honolulu Shipyard Inc. - Bill Clifford, Arthur Onikama Honolulu Shipyard Inc. / Island Navigation Co. - Jim Cummings Inchcape Shipping Services - Mike Clarity International Longshoremen's & Warehousemen's Union - Dean Chung, Henry Kreutz,
Nathan Lum, Tyrone Tahara Island Maritime Agencies, Inc. - Patrick Sarnbueno Jardine Shipping Agencies - Skip Howard, Deme Panagopulos Jet Tours Hawaii Jorgensen Steel & Aluminum - Kerry Batchelder Leahi Catamaran Lockheed Air Terminal Manuiwa Catamaran - Mary Bigler, Steven Bigler Marine Spill Response Commission - John Seltenright Marine Surveyors and Consultants, Ltd. Marisco - Fred Anawati Matson Navigation Co. - Rich Bliss, Bob Murray, Ken Tagawa McCabe, Hamilton & Renny Co., Ltd. - Tim Guard Mid Pacific Shipping - Carl Hatakeyama MTI Vacations - Randy Christensen Nautical Service Hawaii - Buzz Willauer Nautilus Subsea Adventure - Ted Bush, Debbie Huneke Nittaku Investment Inc. / Fisherman's Wharf- Gordon Yoshida Norko Marine Agency - Norman L. Cheu Oahu Metropolitan Planning Organization - Gordon Lum Oceanic Global Trading - Steven M. Yoshizawa Office Of The Governor - James Yamamoto P & R Water Taxi - Charles Pires Pacific Marine - Michael Schmicher Pacific Marine & Supply Co. Ltd. / Royal Hawaiian Cruises - Debra C. Chun Pacific Ocean Adventure, Inc. Pacific Ocean Producers - Jim Cook, Sean Martin Paradise Cruise Ltd. - Reg White Parsons, Brinckerhoff, Quade and Douglas Inc. - David Atkin, Bruno Garunkstis, Larissa Sato,
Jason Yazawa Pomare, Ltd. - Jim Romig Port Pilots of Hawaii Rainbow Management Group Royal Hawaiian Cruises - Susan Matsuura
X-3
AR00025083

Chapter X Acknowledgement of Participants
R. M. Towill Corp. - Colette Sakoda Sailaway Club - Robert Keller Sause Brothers Ocean Towing, Inc. - Ace Clarke, Brad Rimmel, Douglas Won Sea Angel, Inc. Sea Breeze Parasail, Ltd. - Jeffery J. Krantz Sea Engineering, Inc. Seafood Hawaii Sea-Land Service - Kurt Pruitt, John Sutherland, Clint Taylor, Alden Zecha Serve° Pacific, Inc. - Carol Lam Shell Oil Co. - Keith Belknap Smith Maritime - Gordon Smith SMS Research - John Kirkpatrick, Kaala Souza State Department of Budget & Finance - Earl Anzai State Department of Business, Economic Development - Chris Chung, Athline Clark, Rick Egged,
Dr. Pearl Imada-Iboshi, Paul Kobata, Dr. Craig MacDonald, Brad Mossman, Dr. Seiji Naya, Dan Orodenker, Gordon Trimble
State Department of Health - Dr. Bruce Anderson, Bryce Hataoka, Dr. Lawrence Miike State Department of Land & Natural Resources - Glenn Abe, John Dooling, Dave Parsons,
Cecil Santos, Jim Schoocraft, Steve Thompson, Michael Wilson, W. Mason Young State Department of Transportation - Marshall Ando, John Blackburn, Felipe Cabana,
Nathan Chang, Chris Dasch, Thomas Fujikawa, Maurice Fujimoto, Kazu Hayashida, Barry Kim, Randal Leong, Derrick Lining, Sharon Matsuda, Alan Murakami, Harry Murakami, Fred Nunes, Fred Pascua, Clarence Okamura, Hugh Ono, Ben Schlapak, Glenn Soma, Elton Teshima, Patrick Tones, Julia Tsumoto, Ron Tsuzuki
State Office of Environmental Quality Control - Gary Gill Submarines Hawaii Subsea Adventures Texaco - Rand Shannon Tow Boat Services & Management, Inc. - Joe Almony Transmarine Navigation Corp. - David Burrows, Kevin Kinemey, Bob Kitagawa, Bill Nickson United Fishing Agency - Frank Goto, Wayne Higashi, Daniel Otani, Brooks Takenaka University of Hawaii - Bill Coste, Charles Helsley, Richard Longfield, Christine Woolaway UNOCAL - Ken Higa U. S. Coast Guard District 14 - Timothy Beltz, Susan L. Papuga U. S. Army Corps of Engineers - Mike Lee, Paul Mizue, Milton Yoshimoto U. S. Customs - Patrick Burke, Harley Carter, Creighton Goldsmith, Emily Narciso Voyager Submarines - J.C. Merrill Waldron Steamship Co. Ltd. - Troy Brown, Eddie Koga, Kimo Pierson, Bruce Swartz,
Bill Thayer Welekahao Catamarans, Inc. - Frank Lambeth Wind and Sea Charters Windjammer Cruises - Bob Halero, D. J. Haler°
X-4
AR00025084

Appendices
WRAF Corp. Wyland Galleries - William Wyland Yacht Marketing Yasuko Lunchwagon Robert Austin Matt Battista David Brice Chris H. Graff Scott Locke Steve Louie Susan Matsuura Wally Parcels Steven Ruble Dave Strong P. Michael Watson
X-5
AR00025085

Appendices
APPENDIX A GLOSSARY
ABSORPTION (OR CHARGES): Accrued charges, such as cartage and storage. Sometimes assumed by the carrier for some purpose.
ACCESSORIAL SERVICES: Service rendered by a terminal operator or carrier which is subordinate to the principal function or transportation or movement of freight across a terminal (includes weighing, packing, warehousing, etc.)
AD VALOREM (Al) VAL): According to value. Usually applied to a custom's duty charged upon the value only of goods that are dutiable.
AISLE SPACE: Space in cargo sheds or warehouses found necessary by operating experience; also usually required by fire regulation.
ANCHORAGE: That portion of a harbor (or designated area outside of harbors) in which ships are permitted to lie at anchor.
APRON: That portion of a wharf or pier between the waterfront edge and the (transit) shed. Strictly speaking, from the view point of construction, that portion of the wharf carried on piles beyond the solid fill. Also called Apron Wharf and Wharf Apron.
BALE CLAMP: See Cotton Squeezer
BARGE-ON-BOARD: LASH/SEABEE/BACAT - Use of specially designed barges or lighter, in which cargo is loaded directly in the barge. The barge is then moved via river and canal networks to a port area to await arrival of an ocean-going barge carrying ship; then hoisted aboard the ship by cranes or elevators.
BASE: I) Home depot of container or trailer. 2) the Floor of a container.
BASIN, TURNING: An area of water or enlargement of a channel used for the turning around of vessels.
BAY, TERMINAL: An area in a transit shed or warehouse between posts or columns or the area between lateral ceiling beams or trusses projected downward to wharf or warehouse floor, the beams, trusses, columns or posts being numbered or lettered and used to designate the location of goods on wharf in warehouse.
APP:A-1
AR00025086

Appendices
BERTH: The water area, at the waterfront edge of a wharf, reserved for a vessel, including the wharf accessories such as bollard.
BOOKINGS; The reservations or assignments of space or accommodation aboard a vessel for specific cargo or passengers.
BOX (BX): Slang term for container, RO/RO - enclosed container. LASH barge designed with square bow and stern.
BREAK-BULK CARGO: General cargo conventionally stevedored and stowed as opposed to bulk, unitized or containerized cargo.
BREAKWATER: An engineering structure to afford shelter from wave action; may also be called mole, jetty.
BROKEN STOWAGE: The waste in any given stowage space or container caused by irregularity in the size and shape of packages.
BULK CARGO: Cargo stowed without benefit of package or container, i.e., shipped loose, as in grains or liquid.
BULK CONTAINER: Containers of various lengths designed for carriage of liquid or dry commodities in bulk. See Container Types.
BULLRAIL: A guard, wooden, concrete or metal, placed along the outer edge of a pier wharf to prevent operating equipment from sliding.
CARRIED-ON AND CARRIED-OFF (CO/C0): Breakbulk cargo which is carried on and off the ship by fork-lifts as opposed to LO/LO or RO/RO or bulk loading techniques.
CARTAGE: The trucking, draying or carting of freight.
CELLULAR CONTAINER VESSEL: Ship specially constructed for the stowage of containers in vertical stacks or cells. Normally 6-7 high below decks and 3-4 high above decks.
CHANNEL: The buoyed, dredged and policed fairway through which ships proceed from the sea to their berth or from one berth to another within a harbor.
CHASSIS: Special trailer or undercarriage on which containers or RO/RO cargoes are moved over-the-road.
APP:A-2
AR00025087

Appendices
CONSIGNEE: Person or company to whom goods are sent, often the owner of the cargo, when purchase is made F.O.B. country of export.
CONSIGNOR: Person who consigns or sends goods to another.
CONSOLIDATED CARGO: To combine more than one shipment in a container unit, or pallet for more than one consignee.
CONTAINER: A single rigid, non-disposable cargo box and as the case may be: ventilated, insulated, reefer, flat rack, vehicle rack or open top container with/without wheels or bogies attached not less than 20 feet in length, having a closure or permanently-hinged door, that allow ready access to the cargo. All types of containers will have construction, fittings and fastenings able to withstand, without permanent distortion, all the stresses that may be applied in normal service use of continuous transportation.
CONTAINER EQUIVALENTS (FEU/TEU): Forty-foot equivalents; twenty-foot equivalents. The internationally recognized standard conversion basis enabling to make the number of containers of a lot (only as number and not as weight) comparable with other lots.
CONTAINER FREIGHT STATION (C.F.S.): The physical facility where goods are received by carrier for loading into containers or unloading from containers and where carrier assembles, holds or stores its containers or trailers.
CONTAINER YARD (C.Y.): The location at all container terminals designated by carrier in the port.
CONTAINER (TYPES): DRY CARGO CONTAINERS: a) end-loading, fully enclosed; Basic container, equipped with end doors; suitable for general cargo not requiring environmental control while en route. b) Side loading, fully enclosed: Equipped with side doors for use in stowing and discharge of cargo where it is not practical to use end doors, c) Open top: Used for carriage of heavy, bulky or awkward items where loading or discharging of the cargo through end or side doors is not practical. d) Ventilated: Equipped with ventilating ports on ends or sides and used for heat generating cargoes or cargoes requiring protection from condensation damage, e) Insulated: For cargoes which should not be exposed to raped or sudden temperature changes. SPECIAL PURPOSE CONTAINERS: f) Refrigerated; Insulated and equipped with a built-in refrigeration system, g) Dry Bulk: designed for carriage of thy bulk cargoes, such as dry chemicals and grains. h) Flat Rack: Used for lumber, mill products, large heavy or bulky items or machinery and vehicles. j) Automotive: For carriage of vehicles. k) livestock: Configured for the nature of livestock carried. 1) Collapsible: Configured for stowage when not in use.
APP:A-3
AR00025088

Appendices
CONTAINERIZED CARGO: Cargo that can fit physically, conveniently, and economically into a container.
COTTON SQUEEZER: 1) Specialized attachment which enables a forklift to pick up four bales of cotton at a time. 2) Also called Bale Clamp and is used for handling of wool.
CRANE: A machine for hoisting weights or cargo moving them vertically/horizontally for limited distances and lowering them to new locations.
CRANE, CARGO: A crane especially adapted to the transferring of cargo between a vessel's hold and a wharf or lighter.
CRANE, GANTRY: A crane or hoisting machine mounted on a frame or structure spanning an intervening space.
CRANE, WHARF: Any crane, located on a wharf or pier designed to serve the vessel alongside.
DEAD HEADING: Moving containers in one direction without revenue cargo in container. Standard term throughout U.S. transportation industry.
DELIVERY: Transfer of care and custody of containers (full or empty) and/or cargo from carrier to shipper/consignee and/or their legal representative.
DEMURRAGE: Penalty charged shippers or receivers of freight, usually at a stated sum per day for detention beyond the free time provided for loading or unloading.
DISCHARGE: To remove or unload cargo from a vessel.
DOCK: The water area alongside a pier or wharf.
DOCK, FLOATING: Submersible platform taking ships on board, enabling the repairing of ships.
DOCK, DRY: Basin enabling the repairing of ships by pumping the water outside of it.
DOCKAGE: Charge levied against the vessel for the use of berthing area.
DOLPHIN: An isolated cluster of piles used as a support of mooring devices or marker lights.
DRAFT: The depth of a vessel below the waterline, measured to the lowest point of the hull, the bottom of the propeller, or other reference point.
APP:A-4
AR00025089

Appendices
DREDGE: 1) To excavate material from the bottom of a body of water. 2) A machine for excavating material from the bottom of a body of water classified by types of excavating equipment used thereon, as bucket dredges, dipper, hopper, hydraulic.
DREDGE SPOILS: Byproduct of dredging process; the residual accumulated silt that must be disposed of.
DRY CONTAINER: Containers of various lengths designed for carrier of general cargo (See container types), other than for liquid cargo.
DRY FREIGHT: Non-liquified cargo not requiring controlled temperature protection.
DUNNAGE: Material used in stowing cargo within a container to prevent movement.
FENDER PILE: A pile driven close to a structure of the pier to prevent contact between vessel and structure.
FLAT CONTAINER (FLAT RACK): 1) Open-sided container, usually designed with corner posts for structural supports. Used for carriage of special commodities, such as lumber, tractors, etc. 2) Collapsible container.
FORK PACKETS.: Openings in the bottom supports of containers for the entry of the forks of lift truck.
FORKLIFT (F.L.): Unit used for lifting and handling container units, etc.
FREE ON BOARD (F.O.B.): Delivered (by the seller) aboard the train, ship, etc. at the point of shipment, without charge to the buyer.
FREIGHT HANDLING AREA: Square meters (or feet) of surface floor space between the waterfront edge of the wharf and the line where freight is customarily piled, plus the area of lanes or roadways reserved for the trucking or handling of cargo to and from shipside.
FR_EIGHTLINER: Name first employed by British Railways for their container hauling operation now being used by Transportation Industry generally to denote a fast, specialized container cartage service.
FULL CONTAINER LOAD (F.C.L.): Where the load carried in a container equals one of the two operating maxima in weight or volume.
APP :A-5
AR00025090

Appendices
HARBOR: An area of water affording a natural or artificial haven for ships. In a proper and more limited sense, an area separated by natural or artificial indentations of shore line from the main body of water, as the area within two headlines or points between which run the main ship channels leading to an open sea.
HOPPER: A temporary container for bulk material shaped like a funnel, but with four flat tapering sides arranged like an inverted truncated pyramid, with the large end up and generally open and the small end down and generally closed by a gate or valve.
INSULATED CONTAINER: Container possessing protective insulation to minimize effect of external temperatures on the cargo.
INTERMODAL: Used to denote ability of containers to change from rail to truck to ship in any order.
JETTY: An engineering structure at the mouth of a river or harbor or elsewhere to control the water flow and currents, to maintain depth of channel, to protect harbor or beach.
LIFT-ON/LIFT-OFF (LO/L0): Cargo loaded/unloaded by either ship or shore cranes.
LIGHTER: A barge or other small craft used in transferring cargo from ship to ship, ship to shore, or vice versa.
LIGHTERING: A process in which a barge or smaller vessel transfers cargo between ship and shore.
MAKAI: Hawaiian term for "towards the ocean".
MAUKA: Hawaiian term for "towards the mountains."
MOORING: A place at which or an object to which a craft can be moored, or made fast.
PALLET: Basic feature in the mechanized handling of freight. Standard size platform, on which loads can be stacked, constructed for easy movement by forklift or sling. In Europe 1,200 X 1,000 mm pallet is in general use. The English equivalent is 48 in. X 40 in. Growing popularity is the 48 in. X 48 in. pallet.
PALLETIZED CARGO: Individual items of cargo loaded on a pallet.
PAYLOAD: The carrying capacity of a container.
APP:A-6
AR00025091

Appendices
PIER: The location in a seaport at which cargo arrives or departs. A dock for loading or unloading ships or vessels. A type of wharf; running at an angle with the shore line of the body of water.
PORT OF ENTRY (U.S.): Point designated by the President, Secretary of Treasury or Acto of Congress at which Customs Officer is assigned with authority to accept entries of merchandise, to collect duties and enforce various provisions of the Customs and Navigation Laws.
PUSH TUG/BOAT: Towboat with square shaped bow and push knees utilized with pushing barges in tow and to load/discharge mother vessel.
ROLL-ON/ROLLOFF (RO/R0): Cargo which is rolled or driven on and off the ships, as opposed to CO/CO. LO/LO or bulk loading methods.
STERN RAMP: RO/RO and Ferry-ramp enters into or protrudes from stem aperture along center line or at an angle to the center line vessel.
STORAGE, WHARF: Goods given warehouse accommodation and warehousing rates and conditions on same are in the wharf shed set aside for that purpose.
STRADDLE CARRIER (STRAD): A vehicle on wheels, open in the middle, that can straddle a container or container on chassis and over it from one place to another in a container yard. Capable of straddling rows of containers, two to three high.
STUFFING: Loading containers.
TEU: Twenty-foot-equivalent unit. The common unit used in indicating the capacity of a container vessel or terminal. A 40-foot container is equal to two TEUs.
TERMINAL: 1) A berthside area where cargo is loaded to and discharged from vessels. 2) A depot - usually inland where containers are brought for devanning.
TON (T) (Tn) (seldom used): A unit of measure, may be short ton (St), (2,000 pounds), long ton (Lt) (2,240 pounds); metric ton (Met.ton) (2,204.6 pounds); measurement ton (Mt) (40 cubic feet of space); revenue ton (Rt) (any combination above, as manifested or producing the greatest revenue).
TOW TRACTOR: A tractive unit used to tow containers.
TRANSIT TIME: A time period for cargo to move between two points (e.g. from a consignor to a consignee). Total transit time is usually calculated by adding the sea time between two given ports, the port handling time, the inland movement time and half of the service frequency.
APP:A-7
AR00025092

Appendices
TRANSIT SHED: Wharf structure for the short-time storage of merchandise in transit.
TRIPLE STACKER (T.S.): Forklift capable of handling containers three high.
TURN-AROUND TIME: The period during which a transport vehicle is confined to port, terminal or warehouse, loading or unloading.
APP:A-8
AR00025093

Appendices
APPENDIX B
OAHU CARGO FORECASTS AND FUTURE COMMERCIAL PORT FACILITY REQUIREMENTS
Prepared in Support of: State of Hawaii Department of Transportation Harbors Division
OAHU COMMERCIAL HARBORS 2020 MASTER PLAN
Prepared by: Parsons Brinckerhoff Quade & Douglas, Inc.
and Ogden Beeman and Associates, Inc.
August 1996
APP:B - 1
AR00025094

Appendices
TABLE OF CONTENTS
Page 1. INTRODUCTION APP:B-5
2. COMPILATION OF EXISTING DATA APP:B-6
2.1 Cargo Data APP:B-6
2.1.1 Major Cargo Categories APP:B-6
2.1.1.1 Automobiles APP:B-6
2.1.1.2 Overseas Containers APP:B-6
2.1.1.3 Neobulk APP:B-8
2.1.1.4 Bulk Unloader Commodities APP:B-8
2.1.1.5 Petroleum Products APP:B-9
2.1.1.6 Inter-Island Cargo APP:B-9
2.1.2 Summary of Cargo Data APP:B-10
2.2 Passenger Data APP:B-10
2.3 Socio-Economic Data APP:B-13
3. FORECAST METHODOLOGY AND RESULTS APP:B-14
3.1 General Approach APP:B-14
3.2 Prediction Categories APP:B-16
3.3 Forecast Models APP:B-16
3.3.1 Overseas Automobiles APP:B-16
3.3.2 Overseas Cargo APP:B-17
3.3.3 Bulk Unloader Commodities APP:B-17
3.3.4 Petroleum Products APP:B-17
3.3.5 Inter-Island Cargo APP:B-21
3.4 Cargo Projections APP:B-21
4. FACILITY CAPACITIES APP:B-21
4.1 Definition of Capacity APP:B-23
4.2 Capacity By Commodity Type APP:B-23
4.2.1 Automobiles APP:B-23
4.2.2 Containerized Cargo APP:B-24
APP:B-2
AR00025095

Appendices
4.2.3 Neobulk APP:B-24
4.2.4 Bulk Unloader Commodities APP:3-25
4.2.5 Petroleum Products APP:B-25
4.2.6 Inter-Island Cargo APP :B-25
5. FUTURE FACILITY REQUIREMENTS APP:B-26
5.1 Requirements by Commodity Type APP:B-26
5.1.1 Overseas Container APP:B-26
5.1.2 RO/RO Automobile APP:B-28
5.1.3 Neobulk APP:B-28
5.1.4 Bulk Unloader Commodities APP:B-28
5.1.5 Petroleum Products APP:B-29
5.1.6 Inter-Island (Piers 39-40) APP:B-29
5.2 Single- Versus Multi-Purpose Facilities APP:B-29
5.3 Provisions for Non-Cargo Uses APP:B-30
6. CONCLUSION APP:B-31
7. Methodology For Calculating Berth And Land Capacities APP:B-32
8. Worktables For Berth And Land Requirements APP:B-39
APP:B-3
AR00025096

Appendices
List of Tables
Page
Table 1 Re-Categorization of HDACS APP:B-7
Table 2 Overseas Cargo Movements, 1983-1994 APP:B-11
Table 3 Inter-Island Cargo Movements, 1983-1994 APP:B-12
Table 4 Socio-Economic Variables APP:B-15
Table 5 Forecast Equations APP:B-18
Table 6 Forecast Equation Statistics APP:B-20
Table 7 Cargo Projections APP:B-22
Table 8 Berth and Land Requirements APP:B-27
List of Figures
Figure 1 Cruise Ship Passengers (Embark and Disembark), 1983-1994 APP:B-13
APP:B-4
AR00025097

Appendices
I. INTRODUCTION
The State of Hawaii Department of Transportation Harbors Division (HD) is preparing a long-range plan for Honolulu Harbor, Barbers Point Harbor, and Kewalo Basin to the year 2020. Called the Oahu Commercial Harbors 2020 Master Plan (OCHMP), this plan will update the Honolulu Waterfront Master Plan and 2010 long-range plans that were previously prepared for Honolulu Harbor and Barbers Point Harbor. An important element of OCHMP is to analytically estimate future harbor facility needs, in terms of berth and land requirements, based on projections of commodity tonnages, and if possible, numbers of passengers that will use cruise ship and excursion boat harbor facilities.
To estimate future berth and land requirements for cargo movements, the following general methodology is being applied:
1. Estimate gross berth and land requirements for future analysis years using projected cargo movements for those years and throughput capacity estimates of generic terminals.
2. Subtract from the gross requirement berths and land space in the harbor currently dedicated to cargo movement and anticipated to still be functional in the future analysis years.
3. The remaining future berth and land requirements represent new berths and land which should to be developed to meet the projected demand.
This report describes the approach to and results of the first step of this methodology. The remaining two steps are being performed by Harbors Division.
This report is organized into four sections:
1. Compilation and organization of historic cargo and passenger data, relevant historic socio-economic parameters, and official projections of socio-economic parameters.
2. Based on historical associations between cargo movement and socio-economic parameters, development of models estimating future cargo movements as a function of projected socio-economic parameters, followed by projection of cargo volumes for future analysis years.
3. Estimation of terminal throughput capacities of berths and storage yards for different types of cargo.
4. Determination of future gross berth and land requirements for the years 2000, 2005, 2010, 2015 and 2020.
A draft of this report, submitted to Harbors Division in May 1996, provided cargo projections and estimates of future facility requirements based on preliminary 2020 MK Projections. Since this submittal, a revision of these 2020 MK Projections prompted adjustments to the draft results, and these results are provided in this report.
APP:B-5
AR00025098

Appendices
2. COMPILATION OF EXISTING DATA
2.1 Cargo Data
Harbors Division's annual cargo statistics (HDACS) for Honolulu Harbor, Barbers Point Harbor and Kewalo Basin were used to obtain historic data on cargo volumes. Only cargo statistics for fiscal years 1983 to 1994 were used. Statistics prior to fiscal year 1983 were not comparable to the more recent data because they were collected using different methods. For example, prior to 1983, short tons (ST) and revenue tons were used interchangeably.
In order to make the cargo data more suitable for forecasting, the HDACS data were aggregated into the following categories:
• automobiles; • break bulk / general cargo; • neobulk cargo; • containerized cargo; • dry bulks; • bulk unloader commodities; • liquid bulks (other than petroleum); and • petroleum products.
Table 1 shows the specific conversions from the categories found in the HDACS data into the categories above. Short tonnages for each of the cargo categories were summed across all of the piers in the study area, and separated by place of origin / destination, i.e. overseas (domestic and foreign) and inter-island.
2.1.1 Major Cargo Categories
This section briefly describes Oahu's major commodities and how they are presently handled at the commercial ports.
2.1.1.1 Automobiles
Some automobiles arrive and depart Honolulu Harbor in 40-foot containers and the remainder arrive on ships with RO/RO capabilities, including specialized automobile carriers. All arrival and departure modes require automobile storage at the terminal. For container movements, automobiles require parking before or after devanning, and for RO/RO movements, they require parking for short-term storage.
2.1.1.2 Overseas Containers
Overseas (domestic and foreign) movements of general cargo arriving and departing Honolulu Harbor are primarily containerized. Shipping containers in the Hawaii trade range from 8-foot x 8-foot x 20-foot, to 45-foot. Each 8-foot x 8-foot x 20-foot container is called a twenty foot equivalent unit, or TEU. A 40-foot container is counted as two TEUs. Hawaii has a
APP:B-6
AR00025099

Appendices
Table 1 Re-Categorization of HDACS
New Category Data Category in 111:104:y :
Automobiles (Containerized and Ro-Ro) "automobile container/frame" and "automobile other"
Break Bulk / General Cargo "general merchandise", "scrap metal", or specific item, such as "explosives" and "livestock", etc.
Neobuik "lumber", "vehicles, trucks, trailers"
Containerized Cargo "shipping device" in sizes of 10-, 20-, 24-, 40- and 45-feet
Dry Bulks "sugar" is specifically listed as a type of cargo, however, other dry bulks are generically categorized as "dry bulk cargo". Therefore, the only other dry bulks counted for this category are "dry bulk cargo" at Pier 23, the dedicated pier for grain shipments
Bulk Unloader Commodities "dry bulk cargo" at all piers other than Pier 23 and "cement"
Liquid Bulks (non-petroleum) "molasses" and "chemical products"
Petroleum Products "diesel", "fuel oil", "gasoline", "jet fuel", etc.
APP:B-7
AR00025100

Appendices
preponderance of inbound cargo, resulting in large outbound shipments of empty containers (MTs).
Containers arriving at Honolulu may follow one of several routes. Generally, an arriving container is unloaded from the ship or barge and stacked in the container yard (CY) of the terminal. From the CY the container may be reloaded to a barge at the same facility for inter-island delivery, trucked to another facility for barge transshipment to inter-island destinations, trucked directly to consignees on Oahu, or unstuffed and its contents in turn delivered by truck on Oahu.
MTs resulting from any of the above delivery patterns can also follow one of several routes. They can be returned to the CY and redispatched for loading and ultimate outbound shipment or returned to the CY and loaded onto a ship empty for either mainland or foreign destinations. Containers strictly in the inter-island trades are stuffed on Oahu and barged to another island where they can be reloaded or returned to Oahu as an MT.
2.1.1.3 Neobulk
This classification is used for commodities moving in large, unitized loads to promote efficient handling and storage of the commodity. Although break bulks (small lot) / general cargo are increasingly becoming containerized, certain commodities such as lumber, steel, and construction components and equipment can be efficiently transported and unloaded without containerization, and continue to move in unitized form. In Honolulu Harbor, this tends to be lumber, steel and other building products, along with a mixture of RO/RO cargo such as heavy equipment and vehicles.
RO/RO cargo generally arrives by ship from foreign destinations and by barge from the mainland. Barges are generally unloaded by forklifts running on and off the vessel on ramps, or by pass-pass, a method in which forklifts on the barge place cargo on a perch on the pier and forklifts on the pier take the cargo off the perch.
2.1.1.4 Bulk Unloader Commodities
Dry bulks are commodities which arrive or depart in bulk (non-unitized) form. Some dry bulks are suitable for handling by high speed devices such as marine legs or clam buckets discharging to conveyor systems, such as coal, cement and clinker. For example, the coal and clinker arriving at Barbers Point Harbor is handled by a continuous ship unloader. The coal is conveyed to off-site storage areas. Inbound dry bulks arrive at Barbers Point Harbor in handy-size and Panamax carriers. The Panamax carriers must generally be light loaded to accommodate a draft restriction in Barbers Point Harbor, resulting in inefficiencies. The other general types of dry bulks, predominately grain and sugar, have their own dedicated facilities at Piers 23 and 19, respectively. Because of differing facility requirements, dry bulks were separated into two categories: bulk unloader commodities (predominately coal, clinker and cement) and other dry bulks.
APP:B-8
AR00025101

Appendices
2.1.1.5 Petroleum Products
In the Hawaii trade, petroleum products are carried in product carrier vessels that are usually around 35,000 dead weight tons (DWT) and in petroleum barges which may reach 10,000 DWT. Most petroleum products are handled at Barbers Point Harbor and Honolulu Harbor's Piers 29 to 34. Inbound jet fuel is unloaded at Pier 51A on Sand Island. This category was separated from other liquid bulks, predominately molasses and chemical products, because of their differing facility requirements. This category does not include bunker fuel and crude oil which are unloaded at the privately-owned Barbers Point offshore moorings.
2.1.1.6 Inter-Island Cargo
Inter-island cargo consists primarily of commodities that are transshipped through the Matson Navigation container terminal (Piers 51B, 52 and 53) and commodities moving through the Young Brothers facilities at Piers 24-29 and 39 (Hilo operations). The cargo consists of containers transshipped from foreign and domestic origins, containers originating in Honolulu, automobiles, neobulks and break bulk / general cargo. At the Young Brothers facility, the latter commodity is generally stuffed into G vans or 20-foot open racks which can receive loose or palletized cargo. It is anticipated that the Young Brothers operation will increasingly be containerized based on market trends as well as the recent change in tariffs that favor containers over traditional shipping methods. This change should carry with it an increase in the amount of container stuffing done "off-site" at either the shipper's place of business or at freight consolidation areas. However, it may take some time for the amount of "off-site" container stuffing to increase in response to the relatively recent change in tariff structure.
The HDACS data had to be adjusted for neighbor island transshipments occurring at the Matson Navigation terminal because transshipments at this terminal are not subject to wharfage charges, and the HDACS data system was designed primarily to track wharfage fees due to Harbors Division. Therefore, outbound neighbor island movements from the Sand Island Terminal are not reported in the HDACS data set. Inbound data for containers and automobiles at Matson Navigation's neighbor island piers (Hilo Harbor's Pier 1, Kawaihae Harbor's Pier 2, Kahului Harbor's Pier 1, and Nawiliwili Harbor's Pier 2) were aggregated, and this amount was assumed to be the same as the outbound movement from the Matson Navigation Sand Island terminal. However, following this exercise, large imbalances were noticed between outbound and inbound TEUs. For example, in fiscal year 1994, outbound TEUs (data from neighbor islands ports' HDACS) were 58,772 greater than inbound TEUs (data from Honolulu Harbor's HDACS). This implies that a very large number of containers would be accumulating on the neighbor islands. Therefore, the neighbor islands ports' HDACS were also used to determine the Matson Navigation Sand Island terminal's inbound traffic, resulting in outbound and inbound TEUs becoming almost equal.
APP:B-9
AR00025102

Appendices
2.1.2 Summary of Cargo Data
Overseas and inter-island cargo data used subsequently, adjusted as described above, are displayed on Tables 2 and 3. Data from fiscal year 1984 is not included on these tables because it was not used in the subsequent analysis.' In summary, average annual growth rates from 1983 to 1994 for overseas automobiles, containers, bulk unloader commodities and petroleum products were 6.8%, 4.4%, 36%, and 18.8%, respectively. Average annual growth rates of these commodities for inter-island movements during the same time period were 9.9%, 8.1%, 26.8% and 21.67%, respectively.
2.2 Passenger Data
There are two general types of passenger activities occurring at Oahu's port facilities: cruise ship (domestic, foreign and inter-island) and excursion boat. Although cruise ships of foreign or domestic origin / destination call at Honolulu Harbor, and passengers disembark for short stays, 2 the inter-island cruise ship market--weekly cruises around the islands--has historically dominated this industry. According to the HDACS, the annual number of total passengers (boarding and disembarking) between 1984 and 1994 ranged from a low of 150,689 in 1993 to a high of 190,130 in 1989, with a median of about 167,000 (see Figure 1). Inter-island cruise ship passengers comprised 80% to 93% of these totals. However, with only two vessels operating in this market over this time period, there is essentially a fixed capacity. Because of this restriction, there was no growth in this market, although increases in socio-economic indicators that one might reasonably expect to correlate with cruise ship demand, such as visitor arrivals and expenditures, suggest growth in latent demand.
Excursion or "dinner cruise" boats operate out of both Honolulu Harbor and Kewalo Basin. The cruises last a few hours, often include meals and entertainment, and are popular with tourists. Since excursion boat operators do not pay fees based on passenger counts to Harbors Division, as do cruise ship operators, comprehensive data were not readily available on the annual number of excursion boat passengers. Attempts to obtain comprehensive data directly from the excursion boat operators were not successful.
1 For undetermined reasons, the cargo data for fiscal year 1984 is grossly out of line with the data for the previous and succeeding years. 2 The Jones Act prohibits a foreign-owned or foreign-built cruise vessel from calling at two or more U.S. ports unless the vessel calls at a higher number of foreign ports. According to industry experts, this Act effectively limits the number of cruise vessels calling at Honolulu Harbor.
APP:B-10
AR00025103

CO CO
Co 0 CV
co co Co
cs.)
co Lo
C) co
N. N- co- N-
N.
1.0 CC5
C
Lr)
Co
r--
OD
CN CD-
c
▪
o
CO co Co
co QD
CO
7c-Ci
N.
co
N- (N Lo-a)
1.0 IN N. CO-
co co (1:5 CO IN
co co
Lr) cr) CD
CO
N- CO
CO
L
▪
U
1-05
co N.
CO
CO
CO N.
Co
CO CO' CO
N- CO Co
CO
co Co -zr 0- is)
Lr) Co
4.
co CO
0; CO
CN CD CO
co co co
CO
L•)
Lc)
aD
Cr)
-zr7 co L.c)
Co 1-
0.; OD IN
CO cs) CO
..cfr
CO N- N cri CO
CD
tri CO CD
CO
CD
N. CV N.
••1:.
co
Lri
tr) co
N. IN
CO C\J-
CD
IN
Co
Lri
LU Lc)
Lr) CV
N.
cci CO Lc) CO
co Lr)
c0.
CO
CD
CO
CD CV
L0
CO
CI)
N.
CO
CO co
co Lc; CO
CO-
N.
a; N.
N. CO
N. ' CO
1.7 E) co
CO
•zr CDT
co C) CO co
a)
N: La
N- O
co cv Lc; co
CO 0 Lc; Lc)
N. CO CD CD
co
Co
Co
N.
CO N-
CO
CO co CO
N- 03 CO CO
107)
CO
1.0
N.
La
Lc)
1.0 LC) 05 CN
0)
AR00025104

0 0 0 CO
0 0
co
Co LU
Co C\
cd cJ
co co
-
co N-
cc Co N- N-
co L Co
CO CO LU
0 Co co cc
N- co co-
N- CO I- CS)
CO
co
0-
co 14-)
Co
co_ c\i CNI
CO
LU
co Co
00 0) 05 (.0
LU
co
LU co N- cc.
co co cc LU
CO
co co co
co
Ln
to-
CO
N- L6 CO
co
co
cc co
LU
co 0 C\J
co 140
CO CO
co
CJ
CO CO CO Cl) •1- 1-
co tr) Lc)
cc
0 C?
Not
es: N
A:
No
t Ava
ilab
le
CO Cr) CD
AR00025105

1983 1984 1985 1986 1987 1988 1989 1990
1991 1992 1993
1994
200,000
180,000
160,000
140,000
120,000
100,000
80,000
60,000
40,000
20,000
Appendices
Figure 1 Cruise Ship Passengers (Embark and Disembark), 1983-1994
Source: State of Hawaii Department of Transportation Harbors Division, Annual Cargo Statistics (1983 to 1994)
2.3 Socio-Economic Data
Many economic and demographic parameters over the period 1983 - 1994 were obtained from the State of Hawaii Department of Business, Economic Development and Tourism (DBEDT).
. Although a range of parameters were available, only those socio-economic parameters for which forecasts are available are useful for purposes of this project. Therefore, because forecasts currently exist for only a few of the parameters, the range of potentially useful parameters is reduced substantially.
APP:B-13 13
AR00025106

Appendices
At the time forecasting models were being developed as part of this study, the most recent official projections approved for planning purposes were the 1988 Series MK Projections, which were prepared by DBEDT. These projections extend to the year 2010. At about the same time, an effort to update the MK Projections to the year 2020 was initiatedby the DBEDT and the Office of State Planning (OSP) 3 . Preliminary 2020 projections were received from OSP in September, 1995. These preliminary projections contained a limited number of parameters, which narrowed the field of potentially usable socio-economic parameters to the following:
• Resident Population (Oahu and neighbor islands) • Gross State Product • Personal Income per Capita (by island) • Direct Visitor Expenditures • Agricultural Output • Construction Output
The Revised Preliminary 2020 MK Projections were released in June, 1996 and replaced the preliminary unofficial projections that were used for the projections in the draft report. The values of the above parameters for the years 1983 to 1994, and their Revised Preliminary MK Projections in five year increments for the years 2000 to 2020 are displayed on Table 4.
3. FORECAST METHODOLOGY AND RESULTS
3.1 General Approach
Historic economic and demographic parameters (see Section 2.3) comprised a set of candidate indicators that enabled many forecast models to be developed and tested. The models attempted to correlate past socioeconomic data (independent variable(s))with past cargo / passenger data (dependent variable). The models were evaluated for statistical validity, and a "best" model for each category was selected based on statistical and economic criteria. An advanced statistical package for microcomputers was used to develop and assess the statistical equations.
Once a model was selected, forecasts of the selected socio-economic variable(s) (independent variables) were substituted into the equation to arrive at the forecast. The credibility of these cargo forecasts hinges on the validity of the model and the quality of the socio-economic forecasts. For example, if historical trends indicate that population is highly correlated with certain cargo volumes, then forecasts of the volume of this cargo will be accurate only if population projections are also accurate and other factors remain the same.
3 The Office of State Planning has changed to the Office of Planning under the administration of the • DBEDT. It was previously under the administration of the Governor's Office.
APP:B-14 14
AR00025107
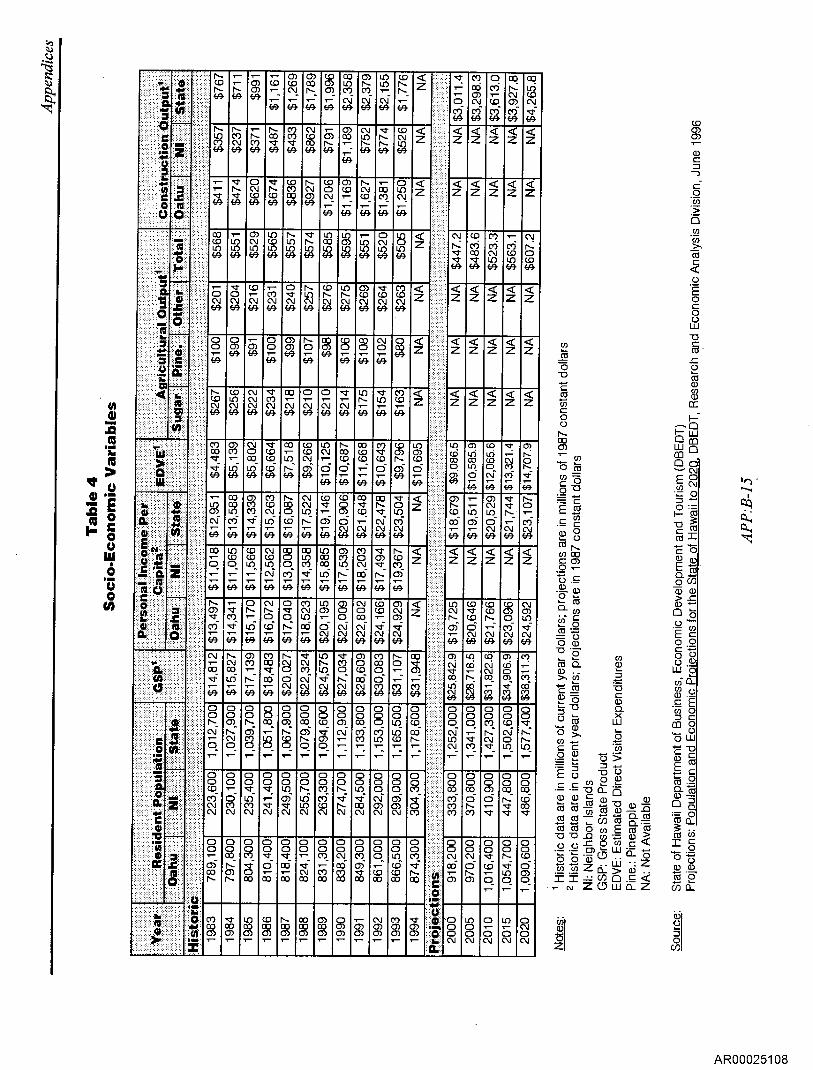
CO CO
C LO CV 1.0 L.C) 64 64
LO 0
69- N.:
69.
co co CU 69.
CD CD CV N 69- .64
co •Z CO CU CC
.r- .64 69
01 CD
LO LO
69. 69.
co
,-
C1)
N- N
Lti
CD
N-
0„ CU 0
0 co CY"; 0-
CY) CU
CD 00
CO 'V 0 0) N CO- N.
N- CO CO 17) *- 69
r N. CO N. 00 CO CO Tr Ni-ta ER 64
0 1- CD CV N. CO CO CD CO 69. 69, 64
0) CO N.- CV CD LO
LO QC) 69.' 69. 69
40 "r-' 0 T CO CU N CU 69. ea. ER
r CD 0 0) 0 0)
r 609. 69
CV .4' CO CV CO r CV CV CV 64 .69 69.
LO N- CO 0) LO LO 64 ER 69
N. (D 14) lf) CV CV CV .69 69. 69
CO CD 0 0) CD T ER +- 64 69
0 0 'I"
CU N N ER 64 64
< < ' < Z Z Z
r N CO CO N- (U <C 0 in in co .609. 69.
< < < Z Z Z
<< < Z Z Z
CO CO
.17 69 69.
69 69.
CO
N. ai 69
CD co oi
CC
CD
C
'Cr C74 CU 0 CD CO
Lo cr) (NI
co co Lc) c.c5 C')
CU
N. co o5
IC) cri .<73.
CD CV CO CD CD 0 Lg. in 0
cri 69
0 CV 0 N- N. "
0 0 L15 65 N.7
T
tO "ct CV CO LO 0 CUN-CV CV CV 6•9. 69. ta.
0 0 0 0 0 0 CO CO 0)
N- N. Cr) 'I-- 0- 0-
0 0 0 0 0 0
T 05 N CO CO CO CO oo.
CD CO CM C.0 a) C) N._ o ..- .64(s4 EON 69
0 0 0 0 0 0 1- N.- CD (i5
in a) 000
co
CO
N- CO
0
N- CU
N.
69. 3
CD
a
0 CU
0
679
CO LS) CU
CD
69
N. 64
17. 0) (0
'4" N
N- CO N- 64
CD N. N.
C,)
N LO N.
69. 69.
N CO (b.. Cr)
69 .69
CD
LO
0 LO CU-
CD 1- CD
cv
Lr) CU
CO
N. CO Cg
CU
CD Lri
co co
cq CV
8
Co_
co co co oo
N- o)
C')
CU C N.
C) CU CO-
'CIT)
0 0 0 0 CO 0
co in
00 0 0 LO 0
CU U) 0) CV CV
CU
CU
N- O
69
Lo
CD
0 0 0 C)- CU
La Q5 CD oo
CO
Cr).
;7)
0 CO 05 N.
a) C m -3 C
.0 Fr) _ 5
CD 0 - (/) >4
TO C < (..) . _ E co C o 0
Lu P
E.' a as clzs _c
D c171 "E Cl)
co co Cl) Vo CC C o 1-'- 0 - CD N. i-- L ,,1 co 0 on a) LLA 0 ,- CO
co- o
F- CO
2 8 ct
co i co co „.,.,- C a) Cl) a.) V E ,„s
"c5 •c a o ci) CC
,.9. ''ca > ..a CL 0.., CD
c 8
ca -....- E c( ) = 0 o a)
0.Q
co o 0
c B a 2 o - Lu 0 >, E2 o
cri' CL-
. s_ 73 CL CT) 0 o 'cry L
co
D C CO 0
13 ci.,, 8 '6 Luc) CE - =
'-6 0
(.7,, E. .5 . ..._. E c E In 0
-=
(1) (1) WI cD p cl.)
L.D _o 0 • a j co - cr) To' LI- .
:. 0 . a_
ri 75 O u) E at ct 3
.a o co a < co bi
o c.) ,_ ._ I D lf, , o o o
(1 y Z p ..
.) ) _ > (Li „ co .co
i i -7- 0) 0 .0 < 76 ff , Z 0 Lu a_ z COD..
CO NI' 03 03 (3)
T
LO CO N. 00 CO CO 0) 0) 0) T 1-
co a) co co co a) cs)
CV 0) 0) 0) 0)
CO :a se
1. a.
0 CU
C) CU
0 If) 0 '4•-• 0,1 0 0 0 N CU CV
AR00025108

Appendices
3.2 Prediction Categories
Because of differing terminal requirements for different classes of cargo, forecasts were developed for the following commodity categories:
• Overseas (domestic and foreign) automobiles • Overseas container and neobulk cargo • Overseas and inter-island bulk unloader commodities • Overseas and inter-island petroleum products • Inter-island cargo (automobiles, containers, break bulk / general cargo, and neobulk)
As used here, "overseas" means "out-of-state," and includes both foreign movements and movements to the U.S. Mainland.
Projections were not performed for sugar, grain, molasses and chemicals because:
• sugar production on Oahu is expected to cease in the near future, making outbound sugar shipments from Pier 19 unnecessary (it is assumed that sugar shipments would go directly from the neighbor islands to California);
• facilities for grain (Pier 23) and molasses (mostly at Sand Island) are adequate; and, • the volume of chemical cargo is small.
As will be described in Section 3.3.2, overseas break bulks / general cargo were combined with overseas containers and neobulks to develop a single projection model. Post-projection processing eliminated the overseas break bulks / general cargo category because of the assumption of increasing containerization (See Section 3.3.2).
Cruise ship passenger forecasts were also not made because a statistically valid regression model could not be developed. As shown on Figure 1 and described in Section 2.2, supply side constraints from 1983 to 1994 prevented logical explanatory parameters from influencing the level of cruise ship activity. Therefore, a projection model could not be developed. Prediction models for excursion boat passengers also could not be developed because of inadequate historic data.
3.3 Forecast Models
The forecast equations and their statistical parameters are summarized in Tables 5 and 6. The following sections describe the statistical work used to derive the projections.
3.3.1 Overseas Automobiles
The best model was a simple bivariate linear model with residential population as the explanatory variable. This model projected that automobile activity would grow more rapidly than population. This trend could occur in the short run since the data includes both inbound and
APP:B-16 16
AR00025109

Appendices
outbound movements, and because the model does not capture automobile activity associated with the car rental fleet market or changes in the level of in-state military activity. Further, automobile ownership rates per capita are continuing to rise across the nation, meaning that automobile ownership increases somewhat faster than population. Nonetheless, it is reasonable to assume that saturation would occur at some point, so that the rate of growth would slow down relative to population. For that reason, overseas automobile activity was constrained to increase at the same rate as population after 2010.
3.3.2 Overseas Cargo
Overseas container, break bulk / general cargo, and neobulk tonnages were combined to form a single category, "containerizable" cargo, for regression purposes. The container share of total "containerizable" cargo, excluding automobiles and neobulk, has steadily and substantially increased since 1983 when it was about 62%. By 1994, the share had risen to nearly 85%. Therefore, when correlating containers against socio-economic parameters, coefficients appeared too high because the containerization rate was also increasing. By forecasting total "containerizable" cargo rather than just containers, the containerization rate is "controlled", and more realistic results are produced. The best explanatory variable for overseas "containerizable" cargo was real gross state product. Post-processing of the projections distributed the projected total among containers and neobulks, assuming that essentially all break bulk / general cargo will eventually be containerized. Containers were assumed to constitute a constant 94.14% of the total overseas cargo across all the increment years, based on recent historical market shares.
3.3.3 Bulk Unloader Commodities
The best explanatory variable for overseas bulk unloader commodities was total state population. A weighted least squares (WLS) procedure was used in the model because of instability in earlier years' data. The WLS procedure allowed the more recent data to be more heavily weighted. For inter-island bulk unloader commodities, two explanatory parameters were used: neighbor islands' population and value of building permits. The latter explanatory variable was adjusted to account for discontinuities between historic and forecasted values.
3.3.4 Petroleum Products
For petroleum products (both overseas and inter-island), gasoline prices were used as an explanatory variable in addition to socio-economic parameters: statewide and neighbor islands population. Similar to overseas automobiles projections, overseas and inter-island petroleum movements were constrained to increase at the same rate as population after 2010. It is reasonable to assume that by 2010, conservation and alternative energy sources would be used more widely than today. Even with economic growth, or perhaps stimulated by economic growth, alternative energy sources may increasingly become more efficient and demand for alternative energy will increase. Furthermore, conservation will slow the rate of increase in energy consumption.
APP:B-17 17
AR00025110

U)
0
Y =
-4,
164
+ 4
. 162
782
( X)
Ove
rsea
s A
uto
mo
bile
s
V =
-84
1.6
41
38
4+
AR00025111

4):
TA d. co ra as Q ts . U)> _ E cp.) c _ " 0 'V 0 " 0 ''''
• 413'.— Cti 0 -C . 0) ... 1-,5 u, E
0cn— ow ai 0 N ..-. m 0 .0 - N (i) a ,- > -- c\I "cs 0 o - 0 c) e)
-0 c72, oDE c .71 L., 4 a • c a) t
N 0 ()) ,_ 0 ccl L,__
o 0 .5 -__. _ - ,.. (..) ,. _o 2 .> _c a (.6' .2 2 .°) 8_ ()Q) co a; ._ 0 0c— b- _• N 4--. c o 0 0 a) c\i 'V (a 13 c pc-,-,m 7,6 c • -cti E$ „ 0 =
I-0 175 ca) c 0) '5
N 0 m .t./2 u_ 0_
II
g o a 4.„ , e e. cq Lo. to E ( hL ' eb," 9 In 0 N. N.: (1) ;.= 1M 1-1-) Cej N Jr(0 89. cr E — a in
a) -c, • a ,,, ii ,9 11 ,- 0 -- II (3 4_, 0 CO 0 0 0.) >, . • m 92 :5 a) co0c-iascooLi gio .c •-e E E Fa Cr) 2 500 0 a) -.E0 450
< C.) Z ° en a-c; CD ° < 0
0
Ci: a
. ks
c0 cr) ,-.
a)
ct 03 7...- 0 co a) > -0 d >, P tz E (1) -0 E S' '- 7 , .2
-0 co 45 < 3 0
.o
(D C o Z
_0 a) 13 = =
"5 . .•-• .. 5
o 2 o co t c a) 0 0 0 o (75 -:',7. 004-cc 2 4-2' 1"1 (-,d 0 C —
tri 0 r*-- 0 CO
+ Li) o
CO 1 CV .--- --.. .
oi --• CO
(9- S 8 co ,- II r- c)-- >- r•-: •:1-
c o co 1--
+ co CO
•1- ..---, ',,J r-- - .. 7 ..".
r•-• 1— T C CO 0 (IDCO 0
7 N I--
o - ii • 00 0 N >- .1- N
+ ± (0
..• Lr) .---.. 0 ••
CO -,..., ......., N.: cc_ys g)) .1- "Too co is) 11 N CO
>- C0 d
c
CL-
•
u) U) LI -c
CO CL
0 F5 . C u) -5
co Q.,
a) - .- c al Li o (1)
(I) tig cc ll li
— CL ...-...
0 a) o
ca. -c -0 CO EL
CU C cn — CO ,_ - ,.,„
- o) .E . To 5 o 0 z fi CC ii it
— --, - a
...._.• EL -.._.-
_c
.,..... m a_ CO im..
P CO Ef2
7 ccl 5 _,,,0 - 0 - .._, i- n ---. c0
3 0 o 15 Z 0 ca
H 11 c 0 .--,, la ,-, -__ = c_ .___. a_ --, C
• :
*PP i
•-: C.
a 2
■•:-
E ci
T5 .....
0_ caw co Cl) 45 En 0 ' -0 55 > 2 0 a
E = U) 2
4 6
P ca W TO 0 " 7) • a) 0 ..... _
I)
o
C' 171
P
° rip 1,
'E' waozco
0 22 cu 0 =- c (
CD ci) .......
15 a) = E . F1 0 4E' no cE/ 5 0 (I) 22
AR00025112

Pa
rson
s B
rinc
kerh
off Q
uad
e &
Dou
gla
s, I
nc.
, A
ugus
t 19
96
c.q
0
a)
iE 0 a) 2 -a f) C o C — co
E "c71 E
<C0zeo
Ove
rsea
s P
etro
leum
Pro
duct
s
Inte
r-Is
land
Pe t
role
um P
rodu
cts
*IP
• 5
•••••cr):-..0):: • • !Mr • •
la- • pi
•
:41:•:c::: 0: •
"•tr-
•
(Y)
(Y)
c\J
Ove
rsea
s A
uto
mo
bile
s
co cv
ci
0.1 0 0 0
AR00025113

Appendices
3.3.5 Inter-Island Cargo
Similar to the overseas cargo projections, inter-island cargo for automobiles, break bulk / general cargo, containers and neobulk were combined, and a single projection model was developed. As described above, separate inter-island projections were made for bulk unloader commodities and petroleum products. Neighbor islands population and statewide building permits were the best explanatory parameters for inter-island cargo. Post-processing of the projections distributed the total to the four categories based on the assumption that containerization rates would continue to increase, and that the percentage of automobiles shipped to the neighbor islands as a percentage of the total amount of cargo would also increase. By 2020, it was assumed that containerized cargo and automobiles will comprise 67.5%, and 7.5% of total inter-island cargo, respectively. Their shares in 1994 were 52% and 5%, respectively. For the years between 2000 and 2020, their shares were interpolated. For example, for the years 2000, 2005, 2010, and 2015, the container shares were assumed to be 53.5%, 57%, 60.5%, and 64%, respectively. The share of neobulks was assumed to remain constant at 10%. The share of break bulk / general cargo would be the remainder. Therefore, its share of total inter-island cargo is projected to progressively decrease.
3.4 Cargo Projections
The cargo projections produced by the forecast models are summarized in Table 7. Forecasts were made in five year increments for the years 2000 to 2020.
4. FACILITY CAPACITIES
To define berth and land requirements for the years 2000 to 2020, analyses were made of the existing requirements for several types of cargo currently shipped through Honolulu and Barbers Point Harbors. However, history has shown that both commodities and cargo handling methods change significantly over time, and changes taking place over a 25-year planning horizon cannot be anticipated with confidence. For example, economies of scale associated with containerization have continued the shift of most general cargo to that mode, resulted in significant changes in land and berth requirements. Therefore, although this section provides facility capacities for different cargo commodities, it cannot be assumed that these capacities will be constant over 25 years. The analyses presented in this section are for the purpose of allocating land for port development. They are not intended to set design criteria or explain the operation for a specific facility. Facility design should reflect the requirements and practices of the individual user or users of the facility.
The commodities and facility capacities analyzed in this section include foreign and domestic containers, automobiles, neobulks, inter-island cargo, bulk unloader commodities and petroleum products. Since most commodities fit into one of these categories, it was found unnecessary to provide facility capacities for other commodities that move in relatively small quantities. Further, berth and land requirements for cruise ships, fishing boats and ancillary uses were not analyzed. The methodology and calculations used to determine facility capacities for each commodity are presented in section 7. Methodology for Calculating Berth and Land Capacities.
APP:B-21 21
AR00025114

Appendices
Table 7 Cargo Projections
(1000s of Short Tons)
ComModitV -,Year
. 20001. : 2005 : 2010 2015::'. •. 2020 , .
Overseas Cargo Containers 4,898.2 5,702.7 6,571.2 7,434.1 8,386.6 Neobulk 304.9 355.0 409.0 462.8 522.0
Overseas Automobiles 282.3 320.7 357.9 376.7 395,5
Bulk Unloader Commodities Inter-Island 484.1 628.0 784.2 929.6 1,083.6 Overseas 1,047.3 1,417.8 1,777.0 2,090.5 2,401.9
Petroleum Products Inter-Island 1,477.4 1,848.3 2,250.3 2,452.4 2,666.0 Overseas 2,718.8 3,407.3 4,075,0 4,290.0 4,503.5
Inter-Island General/Break Bulk 789.9 744.5 676.8 575.3 448.0 Automobiles 167.1 203.1 244.4 287.7 336.0 Containers 1,625.3 1,929.0 2,274.8 2,630.1 3,023.8 Neobulk 303.8 338.4 376.0 410.9 448.0
Source: Parsons Brinckerhoff Quade & Douglas, Inc., August 1996
APP:B-22
AR00025115

Appendices
4.1 Definition of Capacity
For land use planning purposes, the goal is to project waterfront land requirements rather than to design a specific facility. Therefore, a generic approach to defining capacity is used to derive berth and land requirements. It is generic because the specifics of the facilities and their exact configuration and operating practices are not known at the time of study. Although this type of analysis can be useful for land planning, the results may not be correct for any specific facility or for a specific user. The results are more representative of the facilities in aggregate.
One critical factor in any capacity calculations is berth occupancy, the percentage of time during the year or planning period when vessels are occupying all or a portion of a berth. Berth occupancy is often analyzed using simulation studies and other numerical methods which consider a number of variables, such as the number of berths in a terminal, whether the facility is single user or multi-user, and the capital intensity and schedules of the ships using the berth. These types of analyses normally provide a good understanding of the range of occupancies that are likely to be economic for different types of facilities.
In this analysis, berth occupancies were selected based on professional experience. To achieve better definitions of occupancies would require an economic analysis such as a queuing model. However, this would go beyond the level of analysis typically used for land use planning.
4.2 Capacity By Commodity Type
Berth and land capacities for the major commodity classifications, using current operations of Oahu terminals as the basis, are provided in this section. For each commodity type, a description of the berth and upland requirements is provided. Supporting calculations are presented in section 7. Methodology for Calculating Berth and Land Capacities.
4.2.1 Automobiles
Berth requirements for containerized automobiles are the same as for other containerized cargo. For purpose-built automobile carriers, an unloading rate of 50 vehicles per hour is achievable depending on facility layout and labor productivity. Dividing the annual number of RO/RO automobiles by 50 will provide the hours of annual berth occupancy required for their unloading.
Land or storage requirements, regardless of the shipment method, should be based on a throughput of 7,200 units (vehicles) per acre per year plus a 20% allowance for ancillary facilities, such as for devanning. For automobiles transshipped to the neighbor islands at the container facility, a throughput of one acre for every 19,000 units per year is proposed. This movement has a higher throughput per acre because it has shorter average dwell times.
APP :B-23 23
AR00025116

Appendices
4.2.2 Containerized Cargo
It is assumed that within the space allocated to a container facility, the operator will provide sufficient ancillary facilities and equipment to allow the facility to reach the "capacity" constraints of the berth and CY. Therefore, at this level of investigation, it is not necessary to size the gate, lay out the yard or anticipate the amount of equipment needed for the facility.
For planning purposes, the following capacity figures are proposed (see section 7. Methodology for Calculating Berth and Land Capacities for the assumptions and calculations used to derive the capacity figures):
• Berth Capacity = 245,000 TEUs per year. This figure includes both full and MTs since it is solely based on container moves and is independent of tonnage.
• CY Requirement = 30 acres per berth, or an annual throughput of 8,212 TEUs per acre. • Automobile MTs Following Devanning = annual throughput of 31,536 TEUs per acre. • Ancillary Facilities = 10 acres per one- or two-berth facility. This includes land for the
gate house, offices, maintenance buildings and container freight station. Further, additional land may also be required for storing automobiles that are devanned on-site (see Section 4.2.1).
A two-berth facility is described as the planning unit, or "module", because of land, equipment and scale efficiencies associated with a two-berth terminal. This facility would have the following characteristics:
• Berth length: minimum of 1,000 feet per berth or 2,000 feet for two berths. Adjacent waterfront for mooting dolphins and ship overhang should be reserved.
• Total land area: nominally set at 70 acres for a two-berth facility to accommodate the CY and ancillary facilities. Additional land would be added for automobile storage as required.
A single-berth facility would have 1,000 feet of frontage plus 40 acres of land to accommodate the CY and ancillary facilities.
4.2.3 Neobulk
For planning purposes, the following capacity figures can be used:
• Berth capacity = 300,000 ST per year (barge berth). • Land Requirement = 20 acres, which includes ancillary facilities, for every 300,000 ST
per year.
A typical neobulk facility would consist of two barge berths that can accommodate 400-foot ocean going barges or be at least 900 feet in length to allow for space between barges. This facility could also accommodate a single ship and serve as a multi-purpose facility for foreign and domestic barges and ships, and other cargo such as dry bulks, automobiles and containers carried in small lots. Should this neobulk facility be used to handle other commodities, the
APP:B-24 24
AR00025117

Appendices
above capacity figures can be used to derive the utilization percentage of the facility required to move neobulk commodities.
4.2.4 Bulk Unloader Commodities
Capacity for this commodity was based on the unloader at Barbers Point Harbor which works at a rate of 650 ST per gross hour. At 50% berth occupancy, the capacity of the unloader berth is approximately 3 million ST per year. Since this facility can be used for other commodities, berth occupancies for handling bulk unloader commodities can simply be added to berth occupancies for other commodities until the 50% occupancy is reached. For facility planning purposes, bulk un1oader berths should be able to accommodate dry bulk carriers of Panamax size which typically have lengths in the range of 750 to 800 feet. Storage allowances may be desirable but are not required at the facility since these commodities can be stored at off-site areas, as is done at Barbers Point Harbor for coal.
4.2.5 Petroleum Products
Actual loading and unloading rates at petroleum facilities will vary depending on the number and size of hoses to the vessel and the pressure applied at the pump. Typical pumping rates are in the range of 4,200 barrels or 600 ST per hour for an 8-inch hose. As volumes increase, efforts should be made to increase the overall average loading / unloading rates to 900 ST per gross hour to reduce time at berth and demand for facilities. Present pumping rates on Oahu are significantly below this capacity figure.
Berth occupancy for the petroleum products will be governed by the same factors affecting bulk unloader commodities, with the possible difference that the petroleum vessels could have a lower degree of randomness. However, the 50% berth occupancy figure suggested for bulk unloader commodities is also applicable to petroleum where two berths are available. At 900 ST per gross hour, this results in throughputs of nearly 4 million tons per berth per year. Berth lengths suitable for dry bulk ships will also be suitable for the petroleum ships. Storage allowances are also not necessary at the petroleum terminal since petroleum products can be stored at off-site areas.
4.2.6 Inter-Island Cargo
The report Inter-Island Barge Terminal. Piers 39 and 40 Master Plan (Lum, 1992) detailed projected cargo and facility requirements for inter-island cargo to 2010. Table 24 of the Lum report suggests the need for 700,000 square feet of storage area for 2005 which rises to 937,000 square feet in 2010. It projects saturation at the year 2006 when approximately 773,000 square feet will be available and required. The design criteria for the Piers 39/40 inter-island terminal apparently anticipates a total 2.8 million ST of cargo plus 78,441 vehicle units per year. Converting the vehicles to tonnage at a factor of 1.5 tons per vehicle will bring this total to 2.9 million ST of cargo, the capacity of the new facility.
No additional allowances need to be made for inter-island container transshipments taking place at overseas container terminals. These containers are already accounted for in terms of CY
APP:B-25 25
AR00025118

Appendices
capacity since they only use the CY once on the inbound and once on the outbound trip. The berth time for the barges carrying these containers has not been calculated. However, with the design capacity of the terminals set at 50% berth occupancy, this should allow the terminal operator to plan barge movements around ship calls without interfering with scheduled ship operations.
If Piers 39/40 become saturated and additional inter-island facilities are required, a throughput of 12,000 TEUs per acre per year would be realistic as a reflection of the reduced dwell time of these containers as compared to the calculation for overseas container facilities. This throughput is about 1.5 times the throughput for overseas container facilities as described earlier.
5. FUTURE FACILITY REQUIREMENTS
Based on the cargo projections and facility capacity estimates described in this report, land and berth requirements for the following facility types were determined for the years 2000 to 2020:
• overseas container; • RO/RO automobile; • neobulk; • bulk unloader commodities; • petroleum products; and • inter-island (Piers 39-40).
This section describes how the cargo projections and facility capacity figures were applied to determine future facility requirements. The results of the work are summarized in Table 8 which provides both berth and land requirements for the facility types listed above. Worktables used to arrive at these figures can be found in Appendix B. In some cases, the provision of partial berths and facilities is not possible. Thus, requirements were generally rounded upward to the nearest full berth and attendant upland requirement.
5.1 Requirements by Commodity Type
5.1.1 Overseas Container
As described in Section 4.2, an overseas container facility can handle both overseas cargo and automobile containers. In defining capacity, TEU was used as the measuring unit. Therefore, projections of overseas cargo and automobile containers (inbound and outbound) in short tons had to be converted to TEUs. For cargo containers, a stowage factor of 7 ST per TEU was used to determined total projected TEUs (full and MTs) for this movement (see Appendix C for calculation of stowage factors). For automobiles, as per direction from Harbors Division with input from terminal operators, it was assumed that the distribution between container and RO/RO automobile shipments would be 80:20. The 80% share of the total short tons for containerized automobiles were than converted to TEUs by assuming 1.5 tons per automobile and 1.5 automobiles per TEU. Following these exercises, the total projected TEUs can be calculated by adding the two results.
APP:B-26 26
AR00025119

2000 . . 2010 2015 2020
4 4 5 5 6 108.4 122.8 148.3 163.5 180.4
N .A. 3 N .A. 3 N .A. 3 N.A. 3 N .A. 3 29.3 33.7 38 40.8 43.7
753 855 954 1,005 1,055 6.3 7.1 8 8.4 8.8
2 2 2 2 2 40 40 40 40 40
1 1 1 1 2 N .A. 4 N.A.4 N .A. 4 N .A. 4
1 2 2 2 2 N.A. 4 N .A. 4 N .A. 4 N .A. 4 N .A. 4
None5 Nones None5 None5 None5
Overseas Container Facility Containers
Berth Requirements Storage Requirements (Acres) 1
Automobiles Berth Requirements Storage Requirements (Acres) 2
RO/RO Automobile Facility Berth Requirements (Hours) Storage Requirements (Acres)
Neobulk Facility Berth Requirements (Barge Berths) Storage Requirements (Acres)
Bulk Unloader Facility Berth Requirements Storage Requirements
Petroleum Products Facility Berth Requirements Storage Requirements
Inter4sland (Piers 39140) Facility Additional Facility Requirements
Appendices
Table 8 Berth and Land Requirements
Notes: 1 Includes storage for automobile MTs. 2 Includes storage for inter-island automobile transshipments. 3 No additional requirement beyond that for container moves. 4 May be desirable but not required. 5 Even with sensitivity analysis--see text.
Source: Parsons Brinckerhoff Quade & Douglas, Inc., August 1996
APP:B-27
AR00025120

Appendices
Dividing the projected TEUs by 245,000 (see Section 4.2.2) yields the berth requirements. This number was rounded upward where applicable. Based on this figure, the number of two-berth and one-berth terminal "modules" was determined by matching the number of required berths with a combination of two-berth and one-berth "modules". In matching, two-berth "modules" were favored because of gceater efficiencies.
CY requirements were calculated by dividing the projected TEUs by a throughput of 8,212 TEUs per acre per year, and automobile MTs following devanning were divided by a throughput of 31,536 TEUs per acre per year (see Section 4.2.2). Combining these two figures derives the minimum number acres required to store full containers and MTs. Ancillary facility requirements, set at 10 acres per module, are then added to this amount to come up with a total requirement for the projected throughput of TEUs.
As described in Section 4.2.1, automobile storage at the overseas terminal serves distribution on Oahu and inter-island transshipments. The minimum storage requirements for the former were obtained by dividing the number of vehicles projected to be shipped by containers by 7,200 units per acre per year plus 20% allowance for ancillary facilities. For the latter, it was assumed that the market share between the overseas container terminal and the inter-island terminal (Piers 39/40) would be 60:40, based on market shares from 1992 to 1994. Tonnages were then converted to units, as described above, and then divided by 19,000 to arrive at minimum storage requirements for inter-island automobile transshipments.
5.1.2 RO/RO Automobile
As described above, automobiles were separated into two categories: containerized (80%) and RO/RO (20%). Although RO/RO automobiles do not require container yard-like berths, i.e. gantry cranes, they do require similar storage facilities. The remaining 20% share of overseas automobile movements was divided by 50 vehicles per hour to derive berth requirements measured in hours. Storage requirements were calculated by dividing projected RO/RO automobiles by 7,200 units per acre per year plus 20% allowance for ancillary facilities.
5.1.3 Neobulk
Projected short tons of neobulk cargo were divided by the capacity of the neobulk "module", 600,000 ST per year. As long as the calculated figure does not significantly exceed 1, a single terminal "module" would be adequate.
5.1.4 Bulk Unloader Commodities
Individual projections for overseas and inter-island bulk unloader commodities were combined because both types of movements are assumed to use the same facilities. This combined projection was divided by 3 million ST per year to derive annual berth requirements. As described in Section 4.2.4, no allowances were made for storage directly upland of the berth.
APP. B-28 28
AR00025121
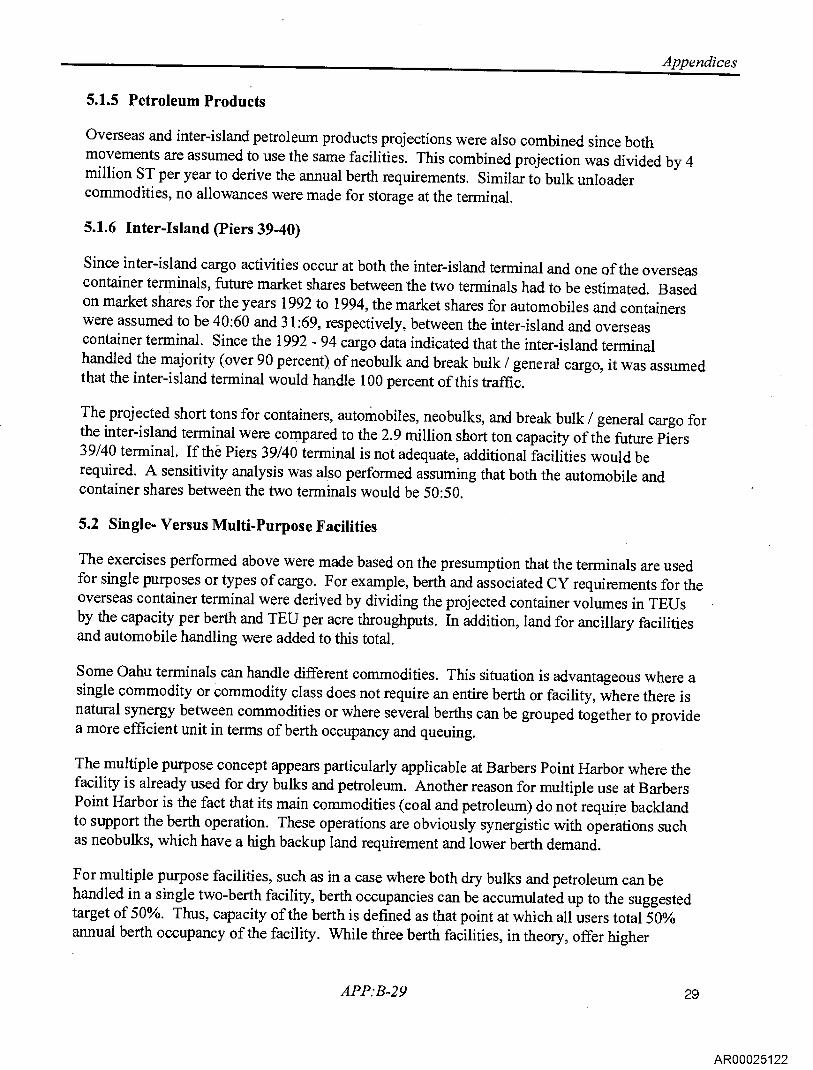
Appendices
5.1.5 Petroleum Products
Overseas and inter-island petroleum products projections were also combined since both movements are assumed to use the same facilities. This combined projection was divided by 4 million ST per year to derive the annual berth requirements. Similar to bulk unloader commodities, no allowances were made for storage at the terminal.
5.1.6 Inter-Island (Piers 39-40)
Since inter-island cargo activities occur at both the inter-island terminal and one Qf the overseas container terminals, future market shares between the two terminals had to be estimated. Based on market shares for the years 1992 to 1994, the market shares for automobiles and containers were assumed to be 40:60 and 31:69, respectively, between the inter-island and overseas container terminal. Since the 1992 - 94 cargo data indicated that the inter-island terminal handled the majority (over 90 percent) of neobulk and break bulk / general cargo, it was assumed that the inter-island terminal would handle 100 percent of this traffic.
The projected short tons for containers, automobiles, neobulks, and break bulk / general cargo for the inter-island terminal were compared to the 2.9 million short ton capacity of the future Piers 39/40 terminal. If the Piers 39/40 terminal is not adequate, additional facilities would be required. A sensitivity analysis was also performed assuming that both the automobile and container shares between the two terminals would be 50:50.
5.2 Single- Versus Multi-Purpose Facilities
The exercises performed above were made based on the presumption that the terminals are used for single purposes or types of cargo. For example, berth and associated CY requirements for the overseas container terminal were derived by dividing the projected container volumes in TEUs by the capacity per berth and TEU per acre throughputs. In addition, land for ancillary facilities and automobile handling were added to this total.
Some Oahu terminals can handle different commodities. This situation is advantageous where a single commodity or commodity class does not require an entire berth or facility, where there is natural synergy between commodities or where several berths can be grouped together to provide a more efficient unit in terms of berth occupancy and queuing.
The multiple purpose concept appears particularly applicable at Barbers Point Harbor where the facility is already used for dry bulks and petroleum. Another reason for multiple use at Barbers Point Harbor is the fact that its main commodities (coal and petroleum) do not require backland to support the berth operation. These operations are obviously synergistic with operations such as neobulks, which have a high backup land requirement and lower berth demand.
For multiple purpose facilities, such as in a case where both dry bulks and petroleum can be handled in a single two-berth facility, berth occupancies can be accumulated up to the suggested target of 50%. Thus, capacity of the berth is defined as that point at which all users total 50% annual berth occupancy of the facility. While three berth facilities, in theory, offer higher
APP:B-29 29
AR00025122

Appendices
potential berth occupancies at constant levels of economic efficiency, it is often difficult to actually create the three berth facility since it means extension of pipelines, rails, conveyors and other special purpose facilities to cover three berths. For that reason, the two berth unit is considered a better selection for planning purposes.
5.3 Provisions for Non-Cargo Uses
As described earlier, one purpose of the numerical calculations in this report is to convert projected cargo movements into berth and land area requirements for long-range planning purposes. There are a number of non-cargo maritime users of the harbor which would also be accommodated in such a plan. Experience suggests that such users generally exceed the space available, particularly if pricing is not used as a factor to allocate available space or create new space. For this reason, projecting land or waterfront needs on a numerical basis as was done for cargo is not possible for these non-cargo uses. Therefore, the provision of waterfront land for non-cargo users should be a matter of public policy. Possible policy considerations include:
• Are there historic uses of the harbor which should be preserved for cultural, aesthetic or other reasons?
• Are there economic development opportunities which are important to prioritize in terms of harbor usage? These could include ship repair, ship bunkering, lay berth and provisioning of deep draft or shallow draft fleets.
• Are there tourism developments, which are also economic development opportunities, that are important in terms of harbor usage? These could include expansion or preservation of the excursion boat and cruise ship industry.
• Are there waterfront uses, in addition to the above, which may enhance the value of upland areas for retail, tourism or other purposes?
• Are there competing needs for other waterfront dependent uses such as recreation?
It is apparent that choosing between these opportunities is not a matter of calculating the future "need" in the same sense that was done for cargo-related demand. It is instead a matter of prioritizing by public policy. Such policy may be driven by multiple considerations, one of which may be direct financial return, such as charges against the ship or boat and rent, or another may be indirect economic return, such as expenditures made by arriving passengers.
Further, it is evident that the demands for these other uses will be closely related to tariff charges. For example, it is possible that the fishing industry cannot pay the true cost, considering alternative uses, of providing berthage and upland area for the use of fishing boats. It is also possible that by setting rates low enough to protect certain historic or indigenous users, other forms of demand for harbors land will be encouraged based on this pricing structure.
One way to approach this issue from a master planning standpoint is to give first priority to cargo needs since this affects every citizen in the state. With that done, surplus harbor or waterfront lands can then be addressed from a policy standpoint, i.e. what public interests are served by the various development scenarios.
APP:B-30 30
AR00025123

Appendices
6. CONCLUSION
This report provides one of the bases for planning berth and land requirements for future cargoes that will be handled in Oahu's commercial harbors. Similar analysis for future passenger traffic was not possible because of historic market constraints and inadequate data. These analyses should only be considered a planning guideline for the identification of shortfalls and surpluses in berth and upland areas, and to help in defining overall harbor needs. An equally interesting issue will be to define the facilities which for technological or market reasons are no longer responsive to the market. Some of these facilities can be converted to the uses described in this report and some will likely no longer be appropriately sized or configured for cargo handling purposes.
This entire process should be iterative. Cases will be found where the strict application of this report's figures and conclusions will result in numbers which may seem out of line with the situation. For those cases, the numbers should be reexamined with the specific case in mind to see if further refinement is necessary or required. However, caution should be exercised knowing that the efforts described in this report were made for a land use planning program and not for a terminal design.
APP:B-31 31
AR00025124

Appendices
7. METHODOLOGY FOR CALCULATING BERTH AND LAND CAPACITIES
The calculations presented below are for land use planning with the intended purpose of allocating land for port development. They are not intended for use in the design of a specific facility.
OVERSEAS CONTAINER FACILITY
Berth Capacity
For calculating berth capacity of a mainline container facility, the following is a commonly used calculation:
Berth Capacity (TEUs per year) = berth occupancy x number of cranes in operation x crane moves per gross hour x gross hours per work day x days per week x weeks per year x number of TEUs per crane move
Below are descriptions of the variables and the figures that were used in the calculation:
• Berth occupancy, stated in percent, has to be less than 100% to allow for variance in ship arrivals and working periods, provide allowance for peak periods versus average periods, and for scheduled container lines to avoid ship queuing for berth. Further, facility demand is a function of carrier scheduling. For example, a berth may be available on Fridays but the carrier(s) may not have a vessel schedule that fits with that availability. Therefore, for purposes of the calculation, occupancy has been set at 50%. Incidentally, multiple user facilities would likely have berth occupancy rates that are lower than single user facilities rates. This is due to the greater control over ship scheduling at the single user facility.
• The number of cranes in operation is nominally set at two although many berths will have and will work three or four cranes against the ship. However, over the full cycle of ship operations it is more likely to average out at a lower figure than the maximum number of cranes available.
• Crane moves per ho_ur is nominally set at 22.5 per hour to reflect some non-productive berth occupancy time including docking and undocking the ship and removing hatch covers.
• Hours per_day is set at two 10 hour shifts or 20 hours per day, seven days per week, and 52 weeks per year, all in accordance with present practices in Honolulu Harbor.
• Number of TEUs per crane move is set at 1.5, reflecting a mix of one 20-foot container to one 40-foot container. This is somewhat below the existing situation which may be closer to 1.6. Increasing the ratio favoring larger boxes will increase facility capacity.
The results of the calculation that determined berth capacity is:
APP:B-32
AR00025125

Appendices
Berth Capacity = 0.5 x 2 x 22.5 x 20 x 7 x 52 x 1.5 -= 245,700 TEUs per berth
This figure includes both full and empty containers (MTs) since it is solely based on container moves and is independent of tonnage.
Container Yard (CY) Capacity
For calculating CY capacity, the following are commonly used equations to determine container throughput per acre and acres required per berth:
TEUs per acre per year = storage slots in TEUs per acre x 365 days x (capacity factor ÷ dwell time) x peaking factor
Acres per berth = berth capacity ÷ TEUs per acre per year
Below are descriptions of the variables and the figures that were used in the above calculations:
• Storage slots, measured in TEUs per acre, depend on the technology employed in the CY and the size of the yard. For example, for a pure chassis operation, a factor of 90 TEUs per acre can be used, whereas for a straddle operation, a factor of twice that or 180 TEUs per acre is a reasonable average. For high stacking, such as for MTs, a figure of 360 TEUs can easily be obtained. For this calculation, an average of 135 TEUs per acre was used in anticipation that some facilities would have higher TEUs per acre storage slots and some lower. Some facilities with low density would be expected to have larger land areas or use a higher density stack for MTs.
• Capacity factor is set at 80% to reflect the fact that the yard can never be full, otherwise there would be no room to unload a ship at berth or receive containers.
• Dwell time is set at 4 days reflecting the reported situation in Honolulu Harbor.
• Peaking factor is set at 1.2 to reflect the peak month over average month utilization.
Based on the above variables, the following calculations were made to determine throughput, measured as TEUs per acre per year, and acres required to match berth capacity:
1. TEUs per acre per year = 135 x 365 x 0.8 ÷ 4 x 1.2 = 8,212
2. Acres required to support a berth throughput of 245,700 TEUs = 245,700 ÷ 8,212 — 30 acres. This the amount of land area required to balance the CY and berth requirements for the average operation for an average berth.
Ancillary facilities
In addition to berth and container yard requirements as calculated above, additional land area would be required for ancillary facilities, such as the gate house, offices, maintenance buildings and container freight station. For planning purposes, an additional 10 acres per high volume one
APP:B-33
AR00025126

Appendices
or two berth facility should be allowed. In the case of Oahu ports, additional land may also be required for storing automobiles which are devanned on-site. This land allowance can be made as shown under the commodity "Automobiles".
Facility Description
A two-berth facility is described as a planning unit because of the land, equipment and scale efficiencies associated with a two berth terminal. A modern container facility fitting the above analysis would have the following characteristics:
• Berth length: minimum of 1,000 feet per berth or 2,000 feet for two berths, with adjacent waterfront area for mooring dolphins and ship overhang as necessary.
• Total land area: nominally set 70 acres for a two berth facility to accommodate CY and ancillary facilities. Additional land for automobiles to be added as required.
• Ideal site layout: rectangular, 2,000 feet site width x 1520 feet site depth.
• Single-berth facility: 1,000 feet frontage plus 40 acres of land to accommodate. CY and ancillary facilities.
AUTOMOBILES
Berth Capacity
For setting berth requirements, rates for containerized automobiles will the same as for other containerized cargo. For purpose-built automobile carriers, an unloading rate of 50 vehicles per hour is achievable depending on facility layout and labor productivity. Dividing the number of vehicles per year by 50 will provide the hours of berth occupancy per year required for automobile unloading. For example, if a RO/RO facility will handle 75,000 automobiles per year it will have 1,500 hours of berth occupancy for the automobiles.
Yard Capacity
The following is a commonly used equation to calculate the capacity of an acre land to store automobiles:
Units per acre of land per year = maximum number of units per acre x 365 days x operational factor ÷ dwell time
It is assumed that automobiles can be landed or devanned and stored at 200 units to per acre. An operational factor of 0.4 would be used reflecting the peak loading associated with ship arrivals, and an average dwell time of four days is assumed based current experience in Honolulu Harbor. The result of the calculation is:
Unit throughput per acre per year — 200 x 365 x 0.4 x 4 = 7,200.
APP:B-34
AR00025127

Appendices
In addition, a 20% land allowance should be added for ancillary facilities such as devanning, loading and other activities. Therefore, a facility handling either containerized or RO/RO automobiles should be sized at the rate of one acre for 7,200 units per year plus 20% additional land for ancillary facilities. For example, a container or mixed use terminal handling 29,000 units per year should be provided with four additional acres of storage plus one additional acre for ancillary activities for a total of five acres to handle the automobiles.
For automobile inter-island transshipments occurring at mainline container terminals, a shorter dwell time of 1.5 days is assumed. The calculation is:
Unit throughput per acre per year = 200 x 365 x 0.4 x 1.5 = 19,000
NEOBULK CARGO
Berth Capacity
Berth capacity for neobulk cargo can be estimated by assuming a 120 short tons (ST) per hour loading or unloading rate. For example, a barge loaded with 6,000 ST would take 50 hours to unload. Berth capacity is estimated as follows:
Berth capacity (ST per year) — berth occupancy (0.33) x 20 hours per day x 365 days per year x 120 tons per hour
This will equal 289,000 ST rounded up to 300,000 ST per year, and is for one barge berth. Berth occupancy is set lower than other facility berths because of the multi-user nature of the berth and the randomness of arrival of the barges or ships.
Yard Capacity
Storage areas vary widely with the type of cargo but generally storage densities for neobulk cargo are lower than for containerized cargo due to lower stack height and the need for numerous access aisles for storage and later recovery of the cargo. Since barges tend to arrive irregularly and at long intervals, this results in a large surge of cargo that needs to be accommodated in the storage area at one time.
Given the present cargo mix, a rate of 16,000 ST per acre per year is considered a reasonable planning criterion. Some percentage of this will be covered depending on the cargo mix at the time of facility design. Based on this variable and the calculated berth capacity, the following calculation was made to determine the acres required to match berth capacity:
Acres required to support a neobulk barge berth = 300,000 ST ÷ 16,000 ST per acre = 18.75 acres, which can be rounded to 20 acres which would include land for ancillary facilities.
Since a typical facility would consist of two barge berths, this number would need to be doubled.
APP:B-35
AR00025128

Appendices
BULK UNLOADER COMMODITIES
The existing ship unloader in Barbers Point Harbor has a rated capacity of 1,556 ST per hour and an operating history of handling over 900 ST per working hour. This translates to 18,000 ST per 24 hours based on a 20-hour workday or an average production of 750 ST per working hour at berth. Another 6 hours is allowed for docking, undocking and removing hatches. Assuming an average vessel load of 40,000 ST, unloading time for these commodities can be calculated as follows:
Gross Time at Berth = 6 hours (for docking, etc.) + 40,000 ÷ 750 (for unloading) = 60 hours
Effective production rate = 40,000 ST ÷ 60 = 667 ST per hour, round to 650 ST per hour
Berth occupancy in hours per year can be calculated by dividing ST of bulk unloader commodities by 650 ST per hour. It is suggested that this rate be used to calculate berth occupancy through the year 2005. An increase in dry bulk tonnages and the age of the unloader at that time will likely justify an upgrading in capacity which would increase the effective production rate to 1,000 ST per hour with an accompanying decrease in berth occupancy.
Economic levels of berth occupancies for dry bulks will vary with the number of berths available and the randomness of ship arrivals. For planning purposes, a two berth facility is the minimum which should be anticipated to support a dry bulk operation with different users and some randomness of ship calls. Queuing theory predicts 12% and 22% queuing time to working time ratios for a two berth facility with 50% and 60% occupancy, respectively, with arrivals something less than random. Applying that to this case, a 50% berth occupancy is a reasonable planning goal. Note that a two berth facility at 50% would provide annual capacity for nearly six million tons of dry bulks at the 650 ST per hour rate. Given the situation at Barbers Point Harbor, it is apparent that dry bulks will probably continue to be a joint berth user with other commodities.
PETROLEUM PRODUCTS
Actual loading and unloading rates will vary depending on the number and size of hoses to the vessel and the pressure applied at the pump. Typical pumping rates may be in the range of 4,200 bbls. or 600 ST per hour for an 8" hose. As volumes increase, efforts should be made to increase the overall average loading/unloading rates for petroleum products to 900 ST per gross hour at berth to reduce time at berth and demand for facilities. Present pumping rates are significantly below these figures and the differences must be explained before further berth planning can be accomplished.
Berth occupancy for the petroleum products will be governed by the same factors affecting dry bulks with the possible difference that the petroleum vessels could show a lower degree of randomness. However, the 50% berth occupancy figure suggested for dry bulks is also applicable to petroleum.
APP:B-36
AR00025129

Appendices
INTER-ISLAND CARGO
The report inter-Island "Barge Terminal. Piers 39 and 40 Master Plan (Lum, 1992) detailed the projected cargo and facility requirements for inter-island cargo to 2010. Unfortunately, much of the cargo projections go back and forth between revenue and short tons and units of cargo. In an attempt to sort this out, the cargo volumes shown in Table 17 of that report in revenue tons have been converted to short tons and units by use of the conversion factors shown in Table 18, resulting in the following numbers for 2010.
Cargo Revenue Tons Containers, Domestic origin 4,689,462 RT Containers, Foreign origin 99,650 RT Cars and Trucks 941,292 RT G vans 185,488 RT General Cargo 1,228,120 RT Reefer Containers 493,514 RT
Short Tons Conversion 1,846,244 ST
29,746 ST 78,441 units
44,163 ST 735,401 ST 147,317 ST
This totals 2.8 million ST of cargo plus 78,441 vehicle units. Converting the vehicles to tonnage at a factor of 1.5 tons per vehicle will bring this total to 2.9 million ST of cargo. The report (Table 24) suggests the need for 700,000 square feet of storage area for 2005 rising to 937,000 in 2010. It projects saturation at the year 2006 when approximately 773,000 square feet will be available and required. The ST per acre throughput of the facility translates to 2,900,000 ST within the 937,000 square feet of the facility acre or 133,333 ST per acre. At the capacity year 2006, this will translate to about 2.4 million ST. In addition, another 10 acres are provided for ancillary operations and circulation.
The operational efficiencies required to accomplish this throughput are obviously high. For example, the overseas container facility calculation shown above is based on 8,212 TEUs per acre per year. At an average load of 8 tons per TEU (including MTs) this works out to about 66,000 ST per acre or about half the throughput required for the proposed inter-island terminal. This can be partially explained by several factors used in the container yard calculation. First, the average dwell time in the calculation was four days, whereas the frequency of inter-island service suggests several sailings per destination per week which means that its dwell time may be as low as two days, on average. Second, the container stacking used in the container yard calculation was based on a medium density stack. In a land intensive RO/RO operation, such as the inter-island terminal, it will be possible and necessary to use a higher density stack such as the three and four high block stow seen in the present inter-island operation. In conclusion, the design capacities suggested in the Linn report are suitable for land planning purposes up to saturation of the proposed facility.
It is anticipated that the Young Brothers operation will be increasingly containerized based on trends as well as the recent change in tariffs which favor containers over traditional shipping methods. This change should carry with it an increase in the amount of container stuffing done "off-site" at either the shipper's place of business or at freight consolidation areas.
APP:B-37
AR00025130

Appendices
In conclusion, a throughput of 133,333 ST (or say 16,666 TEUs) seems high even for an operation as intensive as that planned at Piers 39/40. However, since this is the design criteria for the project it seems appropriate to use it for land use planning purposes. For additional inter-island facilities, a throughput of 12,000 TEU per acre would be realistic as a reflection of the reduced dwell time of the containers compared to the calculation for foreign and domestic container facilities. This is about 1.5 times the figure used for domestic and international container facilities which reflects the shorter dwell time.
It is noted that there is other inter-island cargo which is received and shipped at the mainline container terminals. These containers are already accounted for in terms of CY capacity since they only use the CY once on the inbound and once on the outbound trip. The berth time for the barges carrying these containers has not been calculated. However, with the design capacity of the terminals set at 50% berth occupancy, this should allow the terminal operator to plan barge movements around ship calls without interfering with scheduled ship operations. Thus, no additional allowance is made for inter-island operations taking place at mainline container terminals.
APP:B-38
AR00025131

Appendices
8. Worktables for Berth and Land Requirements
APP:B-39
AR00025132

Ove
rsea
s C
onta
ine r
Fac
il ity
Req
uire
men
ts W
orkt
able
'
Yea
r
0 ci N
N....."
+.0 ,-1 in ,-1 ces v r- ■6 oo kr) 1/4a a, 0 oo oo a., CIN ce m M ■-■ en e•-; a' ,—I en
■• ...0. .-1 . gy 1■I e,,li c.,1 ,-1
in so tr;
en 0 0 vs in en +,0 cm ON cr. 01 oo
■—■ kr) et os Or • en tri in en •Th hl ,--1 ,-1 N
,n
N
-0 N 00 N 00
et ez en e—i d ,—, —1 ._7.
01 in
hi .-I 0 en N 01 in rn• 0 '.0 %,0 ,—.
■-t (:: 4 t•-: ,-1 • en in kr; e-:
,-1 1..0 ', ■■1 rl .../
20
10
I
N N en N N N 0
ir- en in "1. '141 N ■CI in ON en oo 6 —1 0 .6 cn tr, ,—;"
eh In N ,-I 0 en 0 in a, o en en en enin kr) in
,-1e4 ....r -, . en oo ,-.1 . ,-0
in
C N
CD
N N N VD ■-I 0 IN
0 ,-I N - ,^I hi r- 00 en en' ■-■'' ,-I Cs% in
00 el'
N 0 0 N 1/40 00. I./Z. •-• 0 00 00 en
c•4 cr: c•-; r, v:i ‘,..:1;
,-1 GIN hl hi "'-' hi lei ,_, ,..... ,-t
0 C:1 0 hi
N N en eh en et ...,
vs as 00 0 0 00 %4C) hi ocr 6' —1 co
00 in "z1 ■-i .-I
en et rei 0Ci (7+ hi
0'.0 6 6
N 0 0 N el CA en 0 N N el
N kr; en 0 oi■ t"-: " ei et: "it 00 hi 0 0 N
,_, . ■■1
Proj
ected
Ove
rsea
s C
argo
Co n
tain
ers (
1,00
0s o
f Sho
rt T
ons)
2 Pr
ojec
ted TE
Us
(1,0
00s )
3 Pr
ojec
ted O
vers
eas
Aut
omob
iles
(1, 0
00s
of S
hort
Ton
s)
Num
ber o
f Au t
omo b
iles
(Uni
ts)4
C
onta
iner
ize d
Aut
omo b
iles5
Pr
ojec
ted
TE
Us
Du e
to A
uto m
obile
s (1
,000
s)6
Total P
roje
cted
TE
Us
(1,0
00s)
Ber
th R
equi
rem
ents
for
Pro
j ect
ed T
EU
s (m
in. 1
,000
linea
r fee
t)7
Ber
t h R
equ i
rem
ents
for
Proj
ecte
d T
EU
s (m
in. 1
,000
line
a r fe
et)
( Rou
nded
)
.
Min
imum
Sto
rag e
Req
uire
men
ts (A
cres
) O
vers
eas
Car
go C
onta
iner
s9
Em
p ty
Aut
o C
onta
inere
Aut
omob
iles 1
1 T
otal
Ex
cess
(D
efic
ienc
y)12
A
ncil
larv
Fa
cilit
y R
en
air
em
en
tc f
Acr
ea)1
3
AR00025133

a...) Zi
al.)
1 I + ,. p.
8 8
z., N-, . .2..), • a.)
1
'8 1 t g .1°?' S°
.4 O 04)0 11 g(1) C4
tg t 41)
40 1-1
0 IV e(L)
A El 6 g .4
cle
u 4 t1 4 5 0
O :a
1 8
U O . en
0. 1 •
.0 4:4 §e 8 0, O . 0 a
En N
to g 4 Al a.,0 at ,
,.. g
1 2 0,
1 2 g g g) :0 0 r 1 v
1 b.n at E
0.9 0
es R rd '5 4- o g 0
g 2 g R II 0
8 0
a) '8 42 4 &
r0
•
CS WI Cr■ .8 g ,....,
. 4 III -1- '8 ; '''' ....,
00 iaw
i§g c.11:1 .4 2 • -. .0 .0...,. p . ,,c4 • cn'c' W ': . .8
i 1 to 0 7)1 N Ng?
.i 174
c) o ci 4 0 g 4 U
v , 0
1 ..
g .0
g "g 1:1
g o 6 g . o
• t:., ,......,
. .g I g ,T, 1 6 >. ,L•4 71 51 do
E h..
pi •i••• h. = O. 0 co '''''
0
2 g vl 8 g, 0 I v0 c4.40 4-1 4 aFi t 8 ........ ,.4
0 1 8 d.) a grg :IS 1:1 gEli g al $. e 11 = 4 8
s
•
M 1 0 . E
o 0 .0 A.4.Z.430 475 . gd to !io .. 2. g . . ° e.. O
4-1 0
g 74. 1.-, • o
L. 0 ,5,3 illi 1/40 ▪ 0 0 OA
4 c g ,,
t•-•e4" ou g too eVa
6 1 VS 18 i 4. g g U2 0 0 g g a 12 1
1 Wa °.." 1•814.1° ° U = •0 a) 8N,06111H
.--i lr el
•
rn -I L., uc, c■,( r- oo -.4 cc cr, ... ::,
▪
-. r4 4":- ■ '''' a U
AR00025134

Ro
Ro
Au
tom
o bile
Fac
ility
Req
uir
emen
ts W
orkt
able
(O
vers
eas)
1
Yea
r I
0 eV 0 ra
en
en
,-1
en VD eV
(NI
eV in
en
--I
en In 00
In •-••1
1-- ‘6 en
CO ka
vl In
eNi en 0 tr1
en 2 1■1
0 •zi: r...: ,.., el- cci
o .—. 0 nl
Ces ...._. r" en
rl t-.. tn 00 en t-N1
',et ■-1 ir-- h- el•
•■r? in cs
VD 4:,
on ,—;
0 06
In 0 0 eN
C--
en
V:)
1.- en ■-1 eV
en
l•-• ni ..*
In
00
CA eN ■—■
2000
I
en rsi
.1. 0
00
.-1 •=1*
en
en In
e-4 ir;
0. ,_,
en ,ti,
Au t
omo b
iles
(in
1,00
0s o
f sho
r t to
ns)
Tota
l Aut
o mob
iles
(uni
ts)2
R
o R
o A
u tom
obile
s3
Ann
u al B
ert h
Req
u ire
men
t (H
ours
)4
Ons
hore
Req
uire
men
t (A
c res
)5
Lan
d R
equi
red
for
Stor
age
of A
uto m
obile
s R
equ i
rem
ent f
o r A
ncill
ary
Faci
litie
s T
ota l
r•11
911
ti.L14:4
AR00025135

ti § a t 00 2.P., ,...eu U .4 net I:
g44 I .1
i g a . .g
o 8 4 0
-ou Z Z • co ci a - 44e7 Al c›, .1
le! I 1 a. cl ,--1 c, 0 0
g ti '01 g V .4
in" P.,
1 1 1 2 g fral•I'i
1
lift! a a
o 0 .--
1 c0 0 g co 0 0 fg
c ' T1 a g us 3 g 0:g. 4 5 g 0.11 0.11 0 • .-1 VI
• E . e . :. g 14' 1+" 1 i
. .§ cei c.)
1 ,..
0 . 4 a . ...71 ..z e.-,
; i i I Id
c4., 0. 0, q..,
.1QAAA9 g . % h .i 1 i 4
1 111'21 0 8
gL:
Inte
ris l
and
Aut
omob
ile T
rans
ship
men
ts a
t O
vers
eas
Con
tain
er F
acili
ties
Wor
ktab
le
it4 © ea
co os, ,-, _,.: -1 sir In a ea ,-1 t-: -7 oc;
,-1" rn ■—i .-4 ■—i
in ,-■ © "
N No 00 _.,1 ,'"4 tN rei CD 0 .—I
cv`c iKc' inx" Z -0 ce, -•
co ea ru
C IN ..: ,—ION CeICA ,-1
4 'e„ 4 • in ,--7 is:; id: c; in
c'00
in ez co ea
-1 ez re; esi d
In ai -I ON en ..el: 6 in en 6 iii
eat- oo No
a a co ea
-, .i,t, en _,,. In r- ea as so. In as, -.4 en 6 ..ii e‘i co en
-4 VD in ■ii In
Tot
al I
n ter
isla
nd A
utom
o bile
s (i
n 1,
000s
of s
hort
tons
) A
mou
nt in
Mai
nlin
e Fa
cilit
y (u
nits
) (60
%)1
.2 A
mou
nt in
Ma i
nlin
e Fa
c ilit
y (u
nits
) (50
%)1
'3 A
nnu a
l Ber
th R
equi
rem
ent (
Hou
rs)4
A
ddit
iona
l Req
uire
men
t at M
ainl
ine
Con
tain
er F
acili
ty ( A
cres
)5 60 Pe
rcen
t Mar
ket S
hare
L
and
Req
uire
d fo
r St
orag
e of
Aut
omob
iles
Rea
uire
men
t for
An
cilla
ry F
acili
ties
AR00025136

Neo
bulk
Fac i
lity
Req
u ire
me n
ts W
orkt
a ble
'
>-,
a © (-1
el 0 Inr9
in
tD (NI
00 csi 6 Ti- va er
r A
0 .1.
20
05
I
C VZ) ■-•4 cl 0 iri 6 -4- tn rn
I 20
00 i
cr. in —1 (NI ©
© rn
Proj
ecte
d N
eobu
lk C
a rgo
(1,
000s
of Sh
ort T
ons)
R
equi
rem
ents
for
Neo
bulk
Mod
ules
2 N
umbe
r of M
odul
es
Nu m
ber o
f Mo d
ules
(R
ound
ed)
Num
ber o
f Bar
ge B
ert h
s (m
in. 4
00 lim
. ft.
) Bas
ed o
n R
ound
ed M
odu l
es
Lan
d A
rea
Req
uire
men
ts (
Ac r
es) B
ased
on
Rou
n de d
Mod
u les
c.4
AR00025137

AR00025138
00 r...1 00 0 00 00 kei N .14
N."
Bul
k U
n loa
der
Com
mo d
itie
s Fa
c ilit
y R
equ i
rem
ents
Wor
kta b
lel
rig
In-00
,—t
%.0 lun re"; tri
0 00 00
N

Pe t
role
um P
rodu
c ts
Fac
ility
Req
u ire
men
ts W
orkt
a ble
i Yea
r I
I 2
02
0 I
r•-, v:i a■ 0 ‘t) ■0
.11' Nr:
Cr% ni
• ,-1 ,_<..1 A
0 e"s1
in
O. '''t 'tl- tn el-
.er eV 1/40
Fij €1
•
0
0 ("1
-
11
0 rn en tti 6 tri I.-- In eV 0 el en
CO eq 41 ■-o
..:4
In
0 es1
‘ en en 4, N. eie In 0 .1, In mt, 00 eq
■-.1 rl en ■- i
4.2e
I 2
00
0 1
00 "el• eN oes i-.: ■c; . N Ch
In ■-1 ci ,i
4.4
Proj
ecte
d Pe
trol
eum
Pro
duct
s (1
,000
s o f
Sho
rt T
ons)
O
vers
eas
Inte
r isl
and
Tota
l
Ber
th R
equ i
rem
ents
2 B
erth
Req
u ire
men
ts ( R
oun d
ed)
Up l
and St
orag
e A
rea
Req
uire
men
ts3
■,z).
AR00025139

Appendices
Total Interisland Cargo Forecastsl .... Year
2000 2005 2010 2015 2020 General/Break Bulk 789.9 744.5 676.8 575.3 448.0 Automobiles 167.1 203.1 244.4 287.7 336.0 Containers 1,625.3 1,929.0 2,274.8 2,630.1 3,023.8 Neobulk 303.8 338.4 376.0 410.9 448.0 Total 2,886.0 3,215.0 3,572.0 3,904.0 4255.7
Interisland Facility Req uirementsWorktablel" Year -
2000 2005 2010 2015 2020 General/Break Bulk 789.9 744.5 676.8 575.3 448.0 Automobiles 66.8 81.2 97.8 115.1 134.4 Containers 503.8 598.0 705.2 815.3 937.4 Neobulk 303.8 338.4 376.0 410.9 448.0 Total 1,664.3 1,762.1 1,855.7 1,916.7 1,967.7 Pier 39/40 Terminal Capacity 5 2,900 2,900 2,900 2,900 2,900 Excess (Deficiency) 1,236 1,138 1,044 983 932 Additional Facility Requirements (in Acres) None None None None None
Interisland Facility Requirements Worktable(Sensitivity Anal sis 1 '3 '4
Year 2000 2005 2010 2015 2020
General/Break Bulk 789.9 744.5 676.8 575.3 448.0 Automobiles 83.5 101.5 122.2 143.8 168.0 Containers 812.6 964.5 1137.4 1315.0 1511.9 Neobulk 303.8 338.4 376.0 410.9 448.0 Total 1,989.8 2,149.0 2,312.4 2,445.1 2,575.8 Pier 39/40 Terminal Capacity 5 2,900 2,900 2,900 2,900 2,900 Excess (Deficiency) 910.2 751.0 587.6 454.9 324.2 Additional Facility Requirements (in Acres) None None None None None
Notes: 1 In 1,000s of short tons 2 Assumes the future market share for YB would be approximately the same as the average market share experienced during the period 1992 to 1994: 40% for automobiles, 31% for containers, and 100% for general bulk/break bulk and neobulk (YB handled over 90% of the market for general bulk and neobulk for the period between 1992 and 1994). 3 Sensitivity Analysis assumes the future market share for YB would be a 50% share in the automobile and container market and 100% share in the general bulk/break bulk and neobulk market. 4 Interisland facility requirements are strongly affected by Matson's market share. Matson is able to handle interisland movements at Sand Island with minimal additional yard and berth space (beyond the requirements for overseas movements). 5 The future Piers 39/40 terminal is assumed to have a capacity of 2.9 million short tons. This is based on the report, Inter-Island Barge Terminal, Piers 39 and 40 Master Plan (Thomas Lum and Associates, Inc., 1992).
APP:B-47
AR00025140

Appendices
APPENDIX C
PRELIMINARY SURVEY
Oahu Commercial Harbors 2020 Master Plan Meeting
Your Name:
Your Phone No.:
Please complete this survey and return to:
1. Describe your current operations.
Planning Office Harbors Division 79 South Nimitz Highway Honolulu, Hawaii 96813
2. What harbor improvements are needed to increase the efficiency of your current operations?
3. What harbor improvements are needed to accommodate your operations through the year 2020?
4. What method(s) would you use justify/validate/quantify your need for additional facilities? (Please do not justify at this time.)
5. What areas of concern are critical for you? Facilities, schedules, safety, delays, others?
APP: C-1
AR00025141

Appendices
QUESTIONNAIRE FOR OAHU COMMERCIAL HARBORS 2020
MASTER PLAN
Your Name
Your Comp any
Your Phone No
Date of your response
I. CARGO/PASSENGERS
A. What is the current volume (tons) of cargo (by commodity/year) or passengers handled in the last ten years?
B. How much of this is trans-shipped to/from the neighbor islands?
C. What is the estimated throughput capacity?
D. When will this throughput capacity be reached?
APP. C-2
AR00025142

Appendices
E. What are your cargo or passenger forecasts:
2000:
2005:
2010:
2015:
2020:
II. SHIP REPAIR
A. Where are all the operations located?
B. Describe the current operations.
C. Number of vessels repaired per year for the last ten years.
D. Projected number of vessels repaired in
2000:
2005:
2010:
2015:
2020:
E. Is there a need for ship construction facilities in Hawaii?
F. Any plans for ship construction?
G. What is required for this operation?
APP. C-3
AR00025143

Appendices
III. SPACE
A. Current Terminal Area:
B. Current Operational Area:
C. Current Storage Area:
D. Current Other Area:
E. TOTAL CURRENT AREA:
F. 2020 Terminal Area:
G. 2020 Operational Area:
H. 2020 Storage Area:
2020 Other Area:
J. TOTAL 2020 AREA:
Covered Storage Area:
APP:C-4
AR00025144

Appendices
IV. Vessels
A. What vessels are currently included in your operations? Please list and include vessel length, breadth, draft, dwt.
B. What is the current vessel schedule?
C. Do you plan to include different vessels? Please describe and include length, breadth, draft, dwt. Any possible future schedules for these vessels?
V. FACILITIES
A. Which piers do you utilize or prefer to utilize?
B. What are the limitations of these piers?
C. How many additional berths are required by 2020?
APP: C-5
AR00025145

Appendices
D. What facility improvements are needed to increase the efficiency of current operations?
E. What facility improvements are needed to accommodate your projected 2020 operations?
VI. OTHER ISSUES
A. What are the navigational problems? Any costs associated with these problems?
B. What are the operational problems? Any costs associated with these problems (i.e., costs of scheduling delays, moves due to lack of berthing, etc.)?
C. Do you have any suggestions for the future development of Honolulu Harbor, Kewalo Basin or Barbers Point Harbor?
VII. Describe any other comments or issues which the 2020 Master Plan should consider.
THANK YOU FOR YOUR ASSISTANCE
APP:C-6
AR00025146

Appendices
LIST OF INTERVIEWED AGENCIES
Aloha Cargo Transporters American Hawaiian Cruises Briggs Pacific Industries (BPI) Hawaiian Cement Hawaii Transportation Association Hawaii Stevedores, Inc. Honolulu Agency, Inc. International Longshoremen's & Warehousemen's Union Lavin° Shipping Agencies Marisco, Ltd. Matson Navigation McCabe Hamilton & Renny Norko Marine Sause Brothers Sea-Land Service, Inc. Waldron Steamship Company Young Brothers, Ltd./Hawaiian Tug & Barge
INFORMATION NEEDED FROM SHIPPING LINES (SEA-LAND, MATSON, NYK, ACT) - CONTAINER OPERATIONS
A. EXISTING CONDITIONS
1. TOTAL TERMINAL AREA
2, WORK (STORAGE YARD) AREA AND PRESENT OPERATIONS
3. BERTHING LENGTH/NO. OF BERTHS
4. ARE EXISTING FACILITIES ADEQUATE FOR TODAY'S CARGO?
5. WHAT IMPROVEMENTS ARE NEEDED TO HANDLE TODAY'S CARGO?
6. HOW MANY SHIPS CAN BE HANDLED SIMULTANEOUSLY?
APP:C-7
AR00025147

Appendices
7. NO. OF CONTAINERS (OR TEU) HANDLED IN THE LAST 10 YEARS
a) EXPORT (TO US MAINLAND)
b) EXPORT (TO OVERSEAS LOCATIONS)
c) IMPORT (FROM US MAINLAND)
d) IMPORT (FROM OVERSEAS LOCATIONS)
8. NO. OF CONTAINERS TRANS-SHIPPED TO/RECEIVED FROM NEIGHBOR ISLANDS
9. PERCENTAGE OF EMPTY CONTAINERS HANDLED
10. PRESENT SHIP ROUTES
a) HAWAII - US MAINLAND
b) HAWAII - OVERSEAS LOCATIONS
11. PRESENT SHIP SCHEDULE
12. PRESENT SHIP SIZES AND TEU CAPACITY OF SHIPS
13. AVERAGE NO. OF CONTAINERS LOADED/UNLOADED PER SHIP
14. PRESENT YARD STORAGE CAPACITY (NO. OF TEU)
15. ESTIMATED TERMINAL CAPACITY (NO. OF TEU/YEAR)
16. WHEN WILL EXISTING TERMINAL CAPACITY BE REACHED?
17. WHERE IS THE BOTTLENECK (IF ANY)?
a) SHIP TO SHORE TRANSFER?
b) YARD?
c) ACCESS TO TERMINAL?
18. ARE THERE ANY NAVIGATIONAL PROBLEMS?
APP:C-8
AR00025148
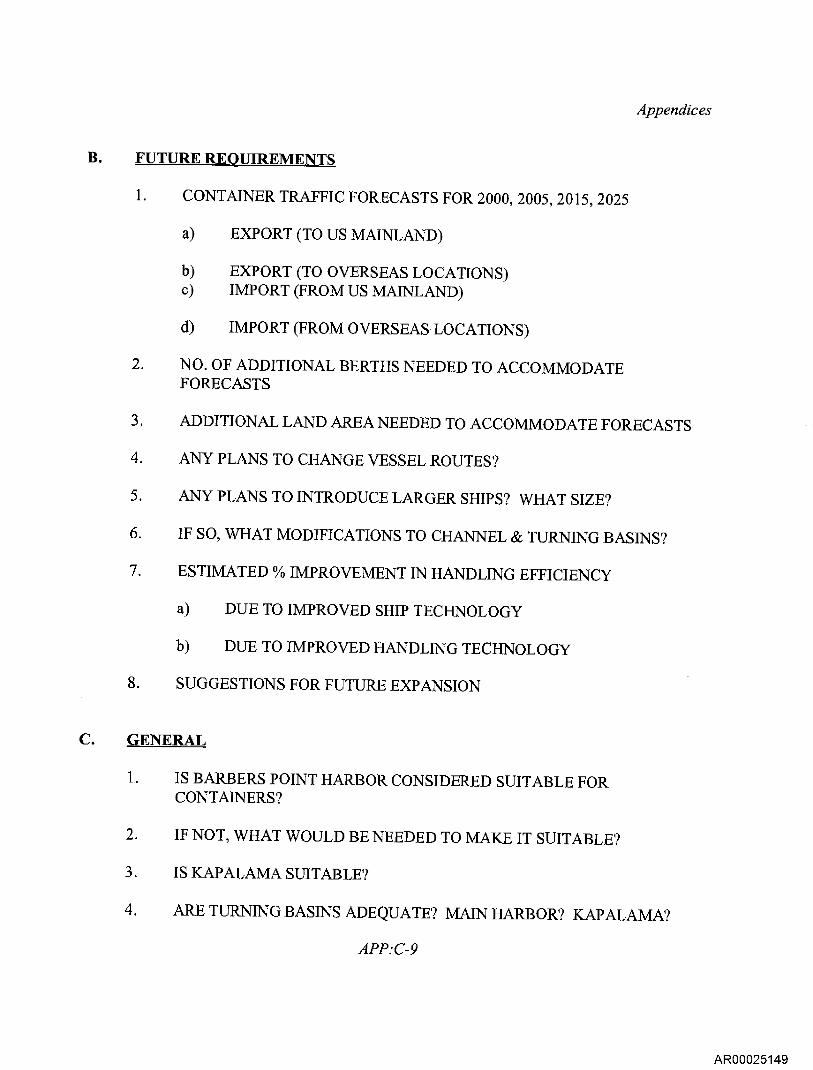
Appendices
B. FUTURE REQUIREMENTS
1. CONTAINER TRAFFIC FORECASTS FOR 2000, 2005, 2015, 2025
a) EXPORT (TO US MAINLAND)
b) EXPORT (TO OVERSEAS LOCATIONS) c) IMPORT (FROM US MAINLAND)
d) IMPORT (FROM OVERSEAS LOCATIONS)
2. NO. OF ADDITIONAL BERTHS NEEDED TO ACCOMMODATE FORECASTS
3. ADDITIONAL LAND AREA NEEDED TO ACCOMMODATE FORECASTS
4. ANY PLANS TO CHANGE VESSEL ROUTES?
5. ANY PLANS TO INTRODUCE LARGER SHIPS? WHAT SIZE?
6. IF SO, WHAT MODIFICATIONS TO CHANNEL & TURNING BASINS?
7. ESTIMATED % IMPROVEMENT IN HANDLING EFFICIENCY
a) DUE TO IMPROVED SHIP TECHNOLOGY
b) DUE TO IMPROVED HANDLING TECHNOLOGY
8. SUGGESTIONS FOR FUTURE EXPANSION
C. GENERAL
1. IS BARBERS POINT HARBOR CONSIDERED SUITABLE FOR CONTAINERS?
2. IF NOT, WHAT WOULD BE NEEDED TO MAKE IT SUITABLE?
3. IS KAPALAMA SUITABLE?
4. ARE TURNING BASINS ADEQUATE? MAIN HARBOR? KAPALAMA?
APP:C-9
AR00025149

Appendices
5. ARE THERE ANY PLANS FOR DIRECT TRANSPORT
a) BETWEEN MAINLAND AND NEIGHBOR ISLANDS?
b) BETWEEN OVERSEAS LOCATIONS AND NEIGHBOR ISLANDS?
6. IF SO, HOW MUCH TRAFFIC (TEU) WOULD BE DIVERTED FROM HONOLULU?
7. ARE THERE ANY PLANS TO USE HONOLULU AS TRANS-SHIPMENT PORT
a) IN ASIA - US MAINLAND TRADE?
b) IN ASIA - SOUTH AMERICA TRADE?
e) IN SOUTH PACIFIC TRADE?
INFORMATION NEEDED FROM GENERAL CARGO, DRY BULK AND LIQUID BULK CARGO HANDLERS (INCLUDING PETROLEUM)
A. EXISTING CONDITIONS
1. TOTAL TERMINAL AREA
2. WORK AREA AND PRESENT OPERATIONS
3. BERTHING LENGTH/NO. OF BERTHS, WHERE LOCATED
4. SHIP SIZES - LENGTH, DRAFT, DWT
5. PRESENT SCHEDULE
6. VOLUMES OF CARGO HANDLED IN THE LAST 10 YEARS (TONS)
7. VOLUMES TRANS-SHIPPED TO/FROM NEIGHBOR ISLANDS
8. ARE EXISTING FACILITIES ADEQUATE FOR TODAY'S CARGO?
APP.- C-10
AR00025150

Appendices
9. ARE IMPROVEMENTS NEEDED TO HANDLE TODAY'S CARGO?
10, ESTIMATED THROUGHPUT CAPACITY
11. WHEN WILL THE THROUGHPUT CAPACITY BE REACHED?
12. WHERE ARE THE BOTTLENECKS (IF ANY)
13. ANY NAVIGATIONAL PROBLEMS?
B. FUTURE REQUIREMENTS
1. CARGO FORECASTS FOR 2000, 2005, 2015, 2025
2. NO. OF ADDITIONAL BERTHS NEEDED TO ACCOMMODATE FORECASTS
3. ADDITIONAL LAND AREA NEEDED TO ACCOMMODATE FORECASTS?
4, ANY PLANS TO EMPLOY DIFFERENT VESSELS IN THE FUTURE?
5. ESTIMATED % IMPROVEMENT IN FUTURE HANDLING EFFICIENCY
6. SUGGESTIONS FOR FUTURE EXPANSION
C. GENERAL
1. IS BARBERS POINT SUITABLE FOR FUTURE OPERATIONS? IF NOT, WHY?
APP: C-11
AR00025151
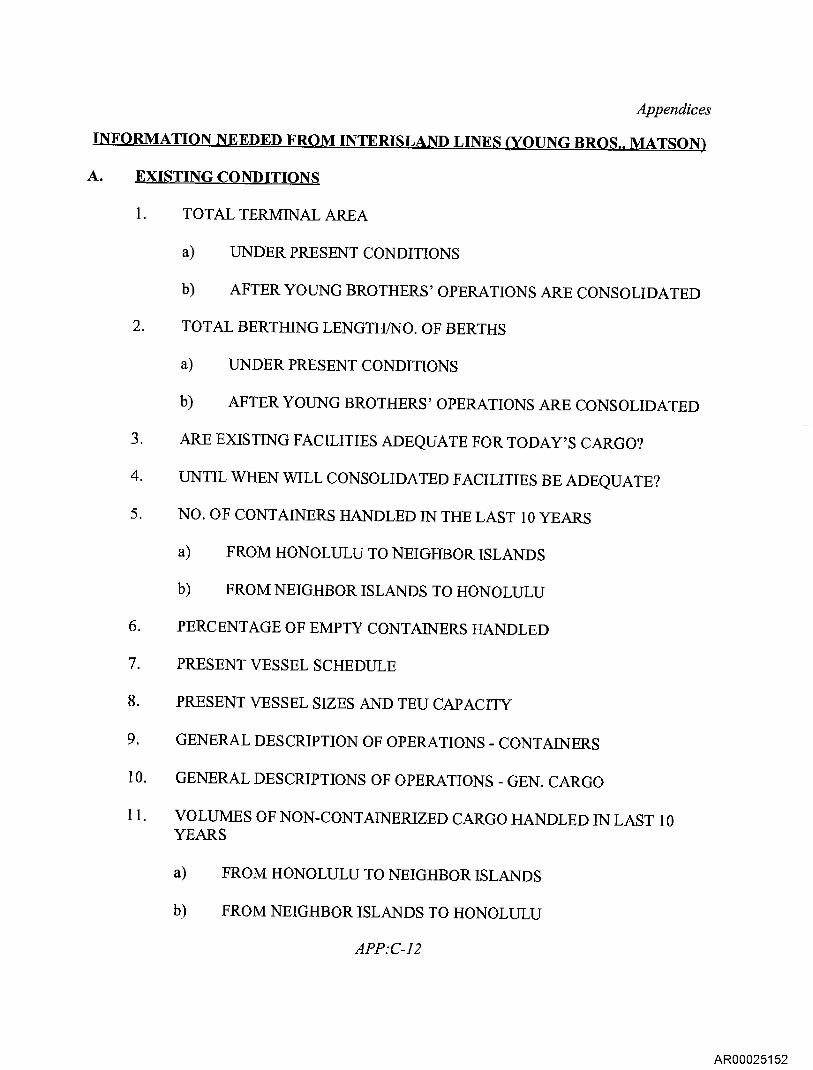
Appendices
INFORMATION NEEDED FROM INTERISLAND LINES (YOUNG BROS.. MATSON)
A. EXISTING CONDITIONS
1. TOTAL TERMINAL AREA
a) UNDER PRESENT CONDITIONS
b) AFTER YOUNG BROTHERS' OPERATIONS ARE CONSOLIDATED
2. TOTAL BERTHING LENGTH/NO. OF BERTHS
a) UNDER PRESENT CONDITIONS
b) AFTER YOUNG BROTHERS' OPERATIONS ARE CONSOLIDATED
3. ARE EXISTING FACILITIES ADEQUATE FOR TODAY'S CARGO?
4. UNTIL WHEN WILL CONSOLIDATED FACILITIES BE ADEQUATE?
5. NO. OF CONTAINERS HANDLED IN THE LAST 10 YEARS
a) FROM HONOLULU TO NEIGHBOR ISLANDS
b) FROM NEIGHBOR ISLANDS TO HONOLULU
6, PERCENTAGE OF EMPTY CONTAINERS HANDLED
7. PRESENT VESSEL SCHEDULE
8, PRESENT VESSEL SIZES AND TEU CAPACITY
9. GENERAL DESCRIPTION OF OPERATIONS - CONTAINERS
10. GENERAL DESCRIPTIONS OF OPERATIONS - GEN. CARGO
11. VOLUMES OF NON-CONTAINERIZED CARGO HANDLED IN LAST 10 YEARS
a) FROM HONOLULU TO NEIGHBOR ISLANDS
b) FROM NEIGHBOR ISLANDS TO HONOLULU
APP:C-12
AR00025152

Appendices
12. WHERE IS THE BOTTLENECK AT PRESENT?
13. WHERE WILL THE BOTTLE NECK BE AFTER CONSOLIDATION?
14. WHERE WILL TUGS BE BERTHED AFTER CONSOLIDATION?
15. HOW MANY TUGS MAY BE BERTHED SIMULTANEOUSLY?
16. HOW MUCH CONTAINER l'RAFFIC DEMAND GENERATED ON OAHU?
17. HOW MUCH GENERAL CARGO TRAFFIC DEMAND GENERATED ON OAHU?
18. HOW MUCH CARGO IS CONTAINERIZED (IN % BY WEIGHT)?
B. FUTURE REQUIREMENTS
1. TRAFFIC FORECASTS FOR 2000, 2005, 2015, 2025
a) CONTAINERS - EXPORT & IMPORT TO & FROM NEIGHBOR ISLANDS
b) GENERAL CARGO - EXPORT & IMPORT TO & FROM NEIGHBOR ISLANDS
2. NO. OF ADDITIONAL BERTHS NEEDED TO ACCOMMODATE FORECASTS
3. ADDITIONAL LAND AREA NEEDED TO ACCOMMODATE FORECASTS
4. ANY PLANS TO EMPLOY DIFFERENT VESSELS IN THE FUTURE?
5. ESTIMATED % IMPROVEMENT IN HANDLING EFFICIENCY IN THE FUTURE
a) DUE TO IMPROVED SHIP TECHNOLOGY
b) DUE TO IMPROVED HANDLING TECHNOLOGY
6. SUGGESTIONS FOR FUTURE EXPANSION
APP:C-13
AR00025153

Appendices
C. GENERAL
I. IS BARBERS POINT HARBOR SUITABLE FOR INTERISLAND OPERATIONS?
2. IF NOT, WHAT IS NEEDED TO MAKE IT SUITABLE?
INFORMATION NEEDED FROM FISHING COMPANIES
A. EXISTING CONDITIONS
I. AT WHAT LOCATIONS IN THE HARBOR ARE FISHING FACILITIES SITUATED?
2. FISHING FACILITY AREA AT EACH LOCATION
3. BERTH LENGTH AT EACH LOCATION
4. PRESENT FISHING FLEET
a) NO. OF BOATS, TYPE
b) SIZE OF BOATS
5. HOW MANY BOATS ARE BERTHED AT A GIVEN TIME
6. DESCRIPTION OF OPERATIONS
7. ARE EXISTING FACILITIES ADEQUATE FOR PRESENT OPERATIONS?
8. WHAT ONSHORE FACILITIES ARE NEEDED (VEHICLE ACCESS AND PARKING, RETAIL OPERATIONS, MAINTENANCE, ETC.)?
9. WHERE IS THE BOTTLENECK (IF ANY)
B. FUTURE REQUIREMENTS
1. FISHING FLEET FORECASTS FOR 2000, 2005, 2015, 2025
APP. C-14
AR00025154

Appendices
2. ADDITIONAL BERTH LENGTH NEEDED TO ACCOMMODATE FORECASTS
3. ADDITIONAL LAND AREA NEEDED TO ACCOMMODATE FORECASTS
4. ANY PLANS TO CHANGE VESSEL SIZES & TYPES AND OPERATIONS
5. SUGGESTIONS FOR FUTURE EXPANSION
C. GENERAL
1. SHOULD FISHING OPERATIONS BE CONSOLIDATED?
2. WOULD KEWALO BASIN BE A PREFERRED LOCATION FOR CONSOLIDATION?
INFORMATION NEEDED FROM CRUISE SHIP OPERATORS AND SIGHTSEEING/DINNER BOATS (ALSO INCLUDING RECREATIONAL BOATING
AS APPLICABLE)
A. EXISTING CONDITIONS
1. AT WHAT LOCATIONS ARE EXISTING FACILITIES SITUATED?
2, AREA USED AT EACH LOCATION
3. BERTH LENGTH AT EACH LOCATION AND NO. OF BERTHS
4. SHORESIDE FACILITIES (PASSENGER TERMINAL, BAGGAGE HANDLING, VEHICLE ACCESS AND PARKING, MAINTENANCE, RETAIL OPERATIONS, ETC.)
5. NUMBER AND SIZE OF VESSELS
6. DESCRIPTION OF OPERATIONS (INCLUDING NUMBER OF PASSENGERS PER VESSEL)
7. ARE EXISTING FACILITIES ADEQUATE FOR PRESENT OPERATIONS
8. WHAT BOTTLENECKS (IF ANY) EXIST
APP:C-15
AR00025155

Appendices
B. FUTURE REQUIREMENTS
1. FORECASTS FOR INCREASE IN TRAFFIC IN THE YEARS 2000, 2005, 2015, 2025
2. ADDITIONAL VESSELS REQUIRED TO ACCOMMODATE FUTURE FORECASTS
3. ADDITIONAL LAND AREA REQUIRED TO ACCOMMODATE FUTURE FORECASTS
4. ADDITIONAL BERTHING LENGTH REQUIRED TO ACCOMMODATE FUTURE FORECASTS.
5. ADDITIONAL SHORESIDE FACILITIES REQUIRED TO ACCOMMODATE FUTURE FORECASTS
6. ANY PLANS TO CHANGE VESSEL SIZES & TYPES
7. DESCRIPTION OF ANTICIPATED FUTURE OPERATIONS
8. SUGGESTIONS FOR FUTURE EXPANSION, INCLUDING LOCATION
C. GENERAL
I. SHOULD ALL PASSENGER OPERATIONS BE CONSOLIDATED?
2, IS KEWALO BASIN A GOOD LOCATION FOR SIGHTSEEING/DINNER BOATS?
3. COULD BARBERS POINT BE USED FOR SOME OPERATIONS?
4. FUTURE FERRY TERMINAL NEEDS (DA COMMENT: NOT SURE THIS QUESTION APPROPRIATE TO THIS GROUP)
APP:C-16
AR00025156

Appendices
INFORMATION NEEDED FROM SHIP REPAIR YARDS
A. EXISTING CONDITIONS
1. TOTAL LAND AREA & BERTH LENGTH
2. ARE ALL THE OPERATIONS PERFORMED AT ONE LOCATION?
1 IF NOT, WHERE ELSE?
4. DESCRIPTION OF PRESENT OPERATIONS (INCLUDING SHIP SIZE, ETC.)
5. ARE EXISTING FACILITIES ADEQUATE FOR PRESENT BUSINESS?
6. IF NOT, WHAT IS MISSING?
7. WHAT ONSHORE FACILITIES ARE NEEDED?
8. WHAT BOTTLENECKS (IF ANY) EXIST?
9. TOTAL NUMBER OF VESSELS REPAIRED IN THE LAST 10 YEARS
B. FUTURE REQUIREMENTS
1. FUTURE BUSINESS FORECASTS FOR THE YEARS 2000, 2005, 2015, 2025
2. ADDITIONAL AREA REQUIRED TO ACCOMMODATE FUTURE FORECASTS
3. ADDITIONAL BERTHS REQUIRED TO ACCOMMODATE FUTURE FORECASTS
4. ADDITIONAL SHORESIDE FACILITIES REQUIRED TO ACCOMMODATE FUTURE FORECASTS
5. ARE THERE ANY PLANS TO DO SHIP CONSTRUCTION?
6. IF SO, WHAT ARE SPECIFIC REQUIREMENTS FOR IT
7. SUGGESTIONS FOR FUTURE EXPANSION
APP:C-17
AR00025157

Appendices
C. GENERAL
1. NEED FOR SHIP CONSTRUCTION FACILITIES IN HAWAII
2. IF NEEDED, WHAT IS THE BEST LOCATION?
INFORMATION NEEDED FROM SHIP REPAIR YARDS
A. EXISTING CONDITIONS
1. TOTAL LAND AREA & BERTH LENGTH
2. ARE ALL THE OPERATIONS PERFORMED AT ONE LOCATION?
3. IF NOT, WHERE ELSE?
4. DESCRIPTION OF PRESENT OPERATIONS (INCLUDING SHIP SIZE, ETC.)
5. ARE EXISTING FACILITIES ADEQUATE FOR PRESENT BUSINESS?
6. IF NOT, WHAT IS MISSING?
7. WHAT ONSHORE FACILITIES ARE NEEDED?
8. WHAT BOTTLENECKS (IF ANY) EXIST?
9. TOTAL NUMBER OF VESSELS REPAIRED IN THE LAST 10 YEARS
B. FUTURE REQUIREMENTS
1. FUTURE BUSINESS FORECASTS FOR THE YEARS 2000, 2005, 2015, 2025
2. ADDITIONAL AREA REQUIRED TO ACCOMMODATE FUTURE FORECASTS
3. ADDITIONAL BERTHS REQUIRED TO ACCOMMODATE FUTURE FORECASTS
4. ADDITIONAL SHORESIDE FACILITIES REQUIRED TO ACCOMMODATE FUTURE FORECASTS
APP:C-18
AR00025158

Appendices
5. ARE THERE ANY PLANS TO DO SHIP CONSTRUCTION?
6. IF SO, WHAT ARE SPECIFIC REQUIREMENTS FOR IT
7. SUGGESTIONS FOR FUTURE EXPANSION
C. GENERAL
1. NEED FOR SHIP CONSTRUCTION FACILITIES IN HAWAII
2. IF NEEDED, WHAT IS THE BEST LOCATION?
INFORMATION NEEDED FROM HARBORS DIVISION
A. EXISTING CONDITIONS
1. NUMBER AND SIZE OF TUGS
2. NUMBER AND SIZE OF GENERAL HARBOR CRAFT
3. NUMBER AND SIZE OF PILOT BOATS
4. LOCATIONS WHERE (1), (2) & (3) ARE ACCOMMODATED
5. ARE EXISTING AREA ADEQUATE FOR EXISTING OPERATIONS?
6. ARE EXISTING BERTHS ADEQUATE FOR EXISTING OPERATIONS?
7. IF NOT, WHAT ADDITIONAL AREAS/BERTHS ARE NEEDED?
8. WHAT BOTTLE NECKS EXIST, IF ANY?
B. FUTURE REQUIREMENTS
1. FORECASTS OF TUGS, HARBOR CRAFT (GENERAL) AND PILOT BOATS IN THE YEARS 2000, 2005, 2015, 2025
2. ADDITIONAL LAND AREA REQUIRED TO ACCOMMODATE FORECASTS
APP:C-19
AR00025159

Appendices
3. ADDITIONAL BERTHS REQUIRED TO ACCOMMODATE FORECASTS
4. ADDITIONAL SHORESIDE FACILITIES REQUIRED TO ACCOMMODATE FORECASTS
5. ANY PLANS TO USE OTHER TYPES OF HARBOR CRAFT?
6. SUGGESTIONS FOR FUTURE EXPANSION (LOCATIONS, ETC.)
C. GENERAL
1. ARE PILOTS & TUGS SENT FROM HONOLULU TO BARBERS POINT? (DA COMMENT: I THINK SO)
2. ANY PROVISIONS AT BARBERS POINT FOR ABOVE? (DA COMMENT: FUTURE TUG PIER WHICH IS PART OF PB DESIGN CONTRACT)
3. PLANNED IMPROVEMENTS TO ACCESS ROADS TO HARBORS (DA COMMENT: WE HAVE SOME OF THIS INFORMATION FOR ACCESS TO HONOLULU HARBOR FROM NIMITZ HIGHWAY, AND FUTURE ACCESS TO BARBERS POINT HARBOR)
4. HARBOR DEEPENING PLANS (DA COMMENT: WE HAVE SOME OF THIS INFORMATION AS REPORTED BY THE ACOE)
APP:C-20
AR00025160

Appendices
INFORMATION NEEDED FOR PORT TRAFFIC FORECASTS (TO BE PROVIDED BY THE HARBORS DIVISION FOR THE YEARS 1995. 2000, 2005, 2010, 2015, 2020. 2025)
B. CARGO TRAFFIC
B1. CARGO STATISTICS ON ANNUAL BASIS SINCE 1959 IN TONS (CONTAINERS ALSO IN TETI)
Foreign Exports
Foreign Imports
To U.S. Mainland
From U.S. Mainland
Interisland from Oahu
Interisland to Oahu
Break Bulk/General Cargo
Neobulk
_Containerized*
Dry Bulk _
Liquid Bulk
Bunker Fuels
Military Cargo
NOTES:
*SHOW EMPTIES SEPARATELY
NEOBULK: VEHICLES & LUMBER
DRY BULK: IN SILOS & LOOSE
LIQUID BULK: PETROLEUM, PETROLEUM PRODUCTS, MOLASSES, CHEMICALS
B2. CARGO FORECASTS FOR THE YEARS 1995, 2000. 2005, 2010, 2015. 2020, 2025 (AS AVAILABLE)
CARGO FORECASTS WILL BE MADE BY PARSONS BRINCKERHOFF, BUT AVAILABLE FORECASTS MADE BY OTHERS SHOULD BE PROVIDED BY THE HARBORS DIVISION,
APP:C-21
AR00025161

Appendices
B3. HISTORICAL DATA ON CARGO TRANSPORT BY AIR VERSUS BY WATER FOR THE STATE OF HAWAII
ANY AVAILABLE DATA (% OF TOTAL) WOULD BE HELPFUL.
INFORMATION NEEDED FOR PORT TRAFFIC FORECASTS (TO BE PROVIDED BY THE HARBORS DIVISION FOR THE YEARS 199 , 2000. 2005. 2010, 2015, 2020,2025)
A.' ECONOMI DATA
Al. STATISTICAL INFORMATION ON ANNUAL BASIS SINCE 1959 FOR (1) OAHU. (2) OTHER ISLANDS. (3) TOTAL
• RESIDENT POPULATION
• RESIDENT PER CAPITA INCOME
• NUMBER OF VISITORS/TOURISTS
• VISITOR/TOURIST SPENDING
• AGRICULTURAL OUTPUT BY MAJOR COMMODITY GROUP
• CONSTRUCTION ACTIVITY
• INDUSTRIAL OUTPUT
• RATE OF ECONOMIC GROWTH
A2. ECONOMIC DATA PROJECTIONS FOR THE YEARS 1995, 2000, 2005, 2010. 2015. 2020. 2025. FOR (1) OAHU. (2) OTHER ISLANDS, (3) TOTAL
• RESIDENT POPULATION
• RESIDENT PER CAPITA INCOME
• NUMBER OF VISITORS/TOURISTS
• VISITOR/TOURIST SPENDING
APP:C-22
AR00025162

Appendices • AGRICULTURAL OUTPUT BY MAJOR COMMODITY GROUP
• CONSTRUCTION ACTIVITY
• INDUSTRIAL OUTPUT
• RATE OF ECONOMIC GROWTH
C. PASSENGER TRAFFIC
CI. PASSENGER I RAFFIC STATISTICS ON ANNUAL BASIS SINCE 195 9
• NUMBER OF VISITORS COMING TO HAWAII
• NUMBER OF CRUISE SHIP PASSENGERS
• NUMBER OF VISITORS TRAVELING BY AIR TO NEIGHBOR ISLANDS
• NUMBER OF VISITORS USING SIGHTSEEING/DINNER BOATS
• NUMBER OF INTERISLAND CRUISE SHIPS
• NUMBER OF SIGHTSEEING/DINNER BOATS
Cl PASSENGER TRAFFIC FOR THE YEARS 1995. 2000. 2005. 2010. 2015, 2020. 2025 (AS AVAILABLE)
Passenger traffic forecasts will be made by Parsons Brinckerhoff, but avqilable forecasts made by others (number of visitors forecast to come to Hawaii) should be provided by the Harbors Division.
D. OTHER NEEDED INFORMATION
It is expected that other information needed to determine future requirements (e.g. fishing fleet, shipyard, misc. harbor craft, etc.) will be obtained from interviews. However, any available information relative to future requirements should be provided by the Harbors Division.
APP:C-23
AR00025163