commencement day: six-year effects of a freshman learning
TRANSCRIPT

O P e n i n g D O O R s
COmmENCEmENT dAYSix-Year Effects of a Freshman Learning Community Program at Kingsborough Community College
Colleen SommoAlexander K. mayerTimothy Rudddan Cullinan
July 2012


Commencement Day
Six-Year Effects of a Freshman Learning Community Program
at Kingsborough Community College
Colleen Sommo Alexander K. Mayer
Timothy Rudd Dan Cullinan
with
Hannah Fresques
July 2012
Funders of the Opening Doors Project
The Annie E. Casey Foundation Charles Stewart Mott Foundation Ford Foundation The George Gund Foundation The James Irvine Foundation The Joyce Foundation KnowledgeWorks Foundation Lumina Foundation for Education MacArthur Foundation Research Network on Socioeconomic Status and Health MacArthur Foundation Research Network on Transitions to Adulthood National Institutes of Health, National Institute of Child Health and Human Development
(RO1 HD046162) Princeton University Industrial Relations Section Robin Hood Foundation The Spencer Foundation U.S. Department of Education U.S. Department of Labor The William and Flora Hewlett Foundation William T. Grant Foundation
The long-term follow-up at Kingsborough Community College, presented in this report, was supported by the Institute of Education Sciences, U.S. Department of Education, through Grant No. R305A100066-11 to MDRC.
Dissemination of MDRC publications is supported by the following funders that help finance MDRC’s public policy outreach and expanding efforts to communicate the results and implica-tions of our work to policymakers, practitioners, and others: The Annie E. Casey Foundation, The George Gund Foundation, Sandler Foundation, and The Starr Foundation. In addition, earnings from the MDRC Endowment help sustain our dissemination efforts. Contributors to the MDRC Endowment include Alcoa Foundation, The Ambrose Monell Foundation, Anheuser-Busch Foundation, Bristol-Myers Squibb Foundation, Charles Stewart Mott Foundation, Ford Foundation, The George Gund Foundation, The Grable Foundation, The Lizabeth and Frank Newman Charitable Foundation, The New York Times Company Founda-tion, Jan Nicholson, Paul H. O’Neill Charitable Foundation, John S. Reed, Sandler Foundation, and The Stupski Family Fund, as well as other individual contributors.
The findings and conclusions in this report do not necessarily represent the official positions or policies of the funders.
For information about MDRC and copies of our publications, see our Web site: www.mdrc.org.
Copyright © 2012 by MDRC.® All rights reserved.
iii
Overview
In today’s economy, postsecondary credentials are increasingly important to labor market success. Community colleges provide a key pathway to these credentials for many, including low-income and nontraditional students. Unfortunately, many community college students leave before earning a degree or credential, especially those who enter underprepared for college-level work.
As part of MDRC’s multisite Opening Doors demonstration, Kingsborough Community College in Brooklyn, New York ― a large, urban college in the City University of New York (CUNY) system ― tested a one-semester learning community program. The program placed freshmen into groups of up to 25 students who took three classes together during their first semester: a develop-mental or college-level English course, an academic course required for the student’s major, and a freshman orientation course. It also provided enhanced counseling and tutoring as well as text-book vouchers.
MDRC is using a random assignment research design to study the effects of the Opening Doors Learning Communities program, compared with Kingsborough’s standard services and courses. An earlier MDRC report followed the students in this study for two years and found that the program improved students’ college experience and some short-term educational outcomes. This report extends the follow-up through six years after students entered the program and examines whether the program led to long-term academic success. Key findings include:
• The Opening Doors Learning Communities program increased the proportion of students who earned a degree by 4.6 percentage points after six years.
• The Opening Doors Learning Communities program is cost-effective. In particular, the cost per degree earned was lower per program group member than it was per control group member.
This report provides evidence that learning communities with enhanced supports can affect community college students’ short- and long-term academic success. These improvements are particularly noteworthy, given the short duration and cost-effectiveness of the program. This analysis, however, may not be representative of the effects of learning communities more general-ly. Another MDRC report on findings from the Learning Communities Demonstration, released by the National Center for Postsecondary Research, looked at three semesters of follow-up at six learning community programs targeted to developmental education students and generally found only modest short-term results.
Several factors, however, distinguish the Opening Doors Learning Communities at Kingsborough. Most notably, they were particularly comprehensive. They linked three courses and provided enhanced services; some of the services extended into the trailing summer or winter intersession. In addition, the research sample had important distinguishing characteristics. The program explicitly recruited students intending to enroll in college full time and included both developmen-tal and college-ready English students. The Opening Doors program also had unusually strong support from the college leadership. Therefore, while the Kingsborough results are encouraging, it is not clear that its positive impacts can be readily replicated at other institutions.


v
Contents
Overview iii List of Exhibits vii Preface ix Acknowledgments xi Executive Summary ES-1 Chapter 1 Introduction 1
Background and Related Studies 2 Organization of This Report 4
2 Data Sources and Sample Description 5 Identifying, Recruiting, and Randomly Assigning Students 5 Eligibility Criteria 6 Characteristics of the Sample 7 Data Sources 12
3 Implementation of Opening Doors Learning Communities and Early Findings 15 Kingsborough Community College and Its Environment 16 The Opening Doors Learning Communities Model 16 Implementing Opening Doors Learning Communities 18 Early Findings 20
4 Long-Term Impacts 25 Main Findings for Academic Outcomes After Six Years 25 A Closer Look at the Impacts 27 Subgroup Analyses 33 Summary 41
5 Cost-Effectiveness of Learning Communities at Kingsborough 43 Methodology 43 Direct Cost 44 Base Cost 47 Indirect Cost 48 Net Cost 49 Cost-Effectiveness Analysis 49 Conclusion 50

vi
6 Conclusion 53 Placing These Findings in the Context of Broader Research on Learning
Communities 53 Implications 54 What’s Next 55
Appendix A Supplementary Table for Chapter 2 57 B Data Processing 63 C Supplementary Tables for Chapter 4 69 D Statistical Model 81 E Cost Details 85 References 91 Earlier MDRC Publications on Opening Doors 93

vii
List of Exhibits
Table
2.1 Selected Characteristics of Sample Members at Baseline 8
2.2 Selected Characteristics of Kingsborough Student Body and Opening Doors Sample 11
2.3 Baseline Test Performance 12
3.1 Features of Opening Doors Learning Communities and Regular College Services During the First Semester 21
3.2 Academic Outcomes at Kingsborough Community College, Program Semester and Two Years After Random Assignment 22
4.1 Key Academic Outcomes, Six Years After Random Assignment 26
4.2 Key Academic Outcomes by English Skills Assessment at Baseline, Six Years After Random Assignment 37
4.3 Key Academic Outcomes by Fall Versus Spring Cohort, Six Years After Random Assignment 40
5.1 Direct Cost per Program Group Member (in 2011 dollars) 46
5.2 Net Cost of Education per Sample Member at Any CUNY College, Six Years After Random Assignment (in 2011 dollars) 48
5.3 Cost-Effectiveness, Six Years After Random Assignment (in 2011 dollars) 50
A.1 Characteristics of Sample Members at Baseline, by Research Group 59
B.1 Data Source Characteristics 66
C.1 Cumulative Credits Attempted and Earned at Any CUNY College, Years One Through Six 71
C.2 Cumulative Credits Earned at Any CUNY College by English Skills Assessment at Baseline, Years One Through Six 72
C.3 Earned a Degree at Any College by English Skills Assessment at Baseline, Years One Through Six 74
C.4 Cumulative Number of Semester Enrollments at Any College, Years One Through Six 75
C.5 Continuously Enrolled at Any College, Years One Through Six 76
C.6 Cumulative Number of Intersession Enrollments at Any CUNY College, Years One Through Six 77
viii
Table
C.7 Cumulative Intersession Credits Earned at Any CUNY College, Years One Through Six 78
C.8 Earned a Degree at Any College, Years One Through Six 79
Figure
ES.1 Earned a Degree at Any College, Years One Through Six ES-5
ES.2 Cumulative Credits Earned at Any CUNY College, Years One Through Six ES-6
4.1 Cumulative Number of Semester Enrollments at Any College, Years One Through Six 28
4.2 Continuously Enrolled at Any College, Years One Through Six 30
4.3 Cumulative Credits Earned at Any CUNY College, Years One Through Six 31
4.4 Cumulative Number of Intersession Enrollments at Any CUNY College, Years One Through Six 33
4.5 Cumulative Intersession Credits Earned at Any CUNY College, Years One Through Six 34
4.6 Earned a Degree at Any College, Years One Through Six 35
5.1 Calculation of Cost per Degree Earned (in 2011 dollars) 51
E.1 How Class Size Affects the Cost of Learning Communities, Based on a Hypothetical Situation 88
Box
3.1 Timing of Academic Semesters 19
3.2 How to Read the Impact Tables in This Report 23
5.1 Key Cost Terms 45
ix
Preface
Learning communities are a popular instructional reform community colleges are using to help students succeed academically. Small cohorts of students are placed together in two or more thematically linked courses, usually for one semester. The theory is that the relationships formed among students and with instructors and the connections between the linked courses will enhance students’ engagement with school and their mastery of the subject matter, making it more likely that they will complete their courses, stay in college, and graduate.
As part of MDRC’s multisite Opening Doors demonstration and random assignment evaluation, Kingsborough Community College in Brooklyn, New York ― a large, urban college in the City University of New York (CUNY) system ― tested a one-semester learning communi-ty program. Groups of up to 25 students took three classes together during their first semester: a developmental or college-level English course, an academic course required for the student’s major, and a freshman orientation course. The program also provided enhanced counseling and tutoring as well as textbook vouchers. An earlier MDRC report followed the students in this study for two years and found that the program improved students’ college experience and some short-term educational outcomes.
With six years of follow-up, this report demonstrates that the Opening Doors Learning Communities at Kingsborough had a 4.6 percentage point impact on graduation rates. The program was also cost-effective — the cost per degree earned was lower per program group member than it was per control group member. These encouraging findings suggest that a well-implemented one-semester learning community program, with additional supports, can have important long-term effects. However, Kingsborough’s program may not be typical. A new report from the Learning Communities Demonstration (published by the National Center for Postsec-ondary Research and MDRC), which tested learning communities for developmental students at six institutions, found only modest short-term impacts. As this report describes, the Opening Doors Learning Communities program at Kingsborough was unusually comprehensive; it included three courses, rather than two, and recruited both developmental and college-ready students who intended to enroll in college full time. These differences, as well as others, may account for Kingsborough’s stronger results.
At the end of the day, this study is one of the first to demonstrate that a comprehensive, short-term intervention can substantially improve the academic trajectory of community college students — no small feat when only a third of first-time students who enroll in community colleges earn a degree or certificate within six years.
Gordon L. Berlin President


xi
Acknowledgments
The long-term follow-up at Kingsborough Community College, presented in this report, was supported by the Institute of Education Sciences, U.S. Department of Education, through Grant No. R305A100066-11 to MDRC. The opinions expressed are those of the authors and do not represent the views of the Institute or the U.S. Department of Education. We are very apprecia-tive of the Institute’s generous support.
The original work on the Opening Doors demonstration received support from a num-ber of foundations and government agencies, which are listed at the front of this report. We are grateful for their generous backing and ongoing commitment. We particularly thank the Robin Hood Foundation, which provided special funding to support the Opening Doors program at Kingsborough Community College. We also owe special thanks to the members of the Mac-Arthur Foundation-funded Network on Transitions to Adulthood, our research partners on Opening Doors, who helped us conceptualize the study and participated in the design of the 12-month survey.
We are also grateful to the many administrators, faculty, and staff at Kingsborough who have made Opening Doors a success. There is not enough space to mention everyone who has played a role in the program and the study, but we particularly want to acknowledge some individuals. Byron McClenney, who was the president of Kingsborough through 2003, decided to join the Opening Doors project, and his leadership was crucial in successfully launching the program. Interim President Fred Malamet continued to support the project during his tenure. Current President Regina Peruggi, whose tenure began in the fall of 2004, enthusiastically championed Opening Doors and worked to expand the program to serve most of the college’s freshmen. Vice President of Academic Affairs and Provost Stuart Suss and former Dean of Student Services Norman Toback provided valuable support and assistance throughout the project.
Rachel Singer, former Director of Academic Affairs, and Peter Cohen, Associate Dean for Student Affairs, were terrific partners from the inception of the project. Their dedication and passion were inspirational and invaluable. Additionally, current Director of Academic Affairs Marissa Schlesinger was an insightful and informative partner to us as this analysis neared completion. The Opening Doors faculty, coordinators, and case managers brought the program model to life. We cannot mention them all by name, but faculty members Marcia Babbitt, Rebecca Arliss, Kate Garretson, and Barbara Walters deserve special recognition for their contribution. The Opening Doors coordinators, Barbara Fairweather and Susan Richards, and the case managers, Nora Bita and Zuleika Rodriguez, operated the program day to day. All these individuals contributed in valuable ways to the research as well.
xii
Several people were instrumental in providing student transcript and test score data to MDRC over the course of the study. Special thanks are due to Dean Richard Fox, Linda Biancorosso, Anatoly Shvartsman, and Habibe Ilingi. Finally, Dean Loretta DiLorenzo has also made valuable contributions to the project, as have Cindy Ho, Katherine Wu, Sally Ricottone, and Jeanine Graziano-King.
Many MDRC staff members have contributed to the Opening Doors project and to this report. Shane Crary-Ross and former MDRC employee Katherine Morriss coordinated the report production process, created exhibits, and conducted fact-checking. Elijah de la Campa and Melvin Gutierrez assisted with the programming of the data. Gordon Berlin, Rob Ivry, Thomas Brock, Lashawn Richburg-Hayes, Dan Bloom, Sue Scrivener, John Hutchins, Mary Visher, Mike Weiss, Evan Weissman, and Victoria Deitch all provided thoughtful reviews of earlier drafts of the report. In addition, the MDRC Education Studies Committee offered helpful feedback and suggestions on an earlier version of the report. Margaret Bald edited the report, and Stephanie Cowell and David Sobel prepared it for publication.
Finally, we would like to thank the hundreds of students who participated in the study at Kingsborough and, in particular, those who answered surveys or participated in interviews or panel discussions. We hope that the findings from Kingsborough and the other sites in Opening Doors will be used to improve college programs and services for them and others in the future.
The Authors

ES-1
Executive Summary
In today’s economy, postsecondary credentials are increasingly important to labor market success. Community colleges provide a key pathway to these credentials for many, including low-income and nontraditional students. Unfortunately, many community college students leave before earning a degree or credential, especially those who enter underprepared for college-level work. Among first-time students who enrolled in community colleges during the 2003-2004 academic year, only about a third earned a degree or certificate in six years.1
In 2003, MDRC launched the Opening Doors demonstration, in which six community colleges operated innovative programs aimed at increasing students’ achievement and persis-tence. As part of this demonstration, Kingsborough Community College in Brooklyn, New York — a large, urban college in the City University of New York (CUNY) system — tested a one-semester learning community program, with enhanced supports, from 2003 to 2005. The program targeted freshmen, most of whom needed developmental (or remedial) English, based on their scores on skills assessment tests.
An earlier MDRC report followed the students in this study for two years and found that the program improved students’ college experience and some short-term educational outcomes. This report extends the follow-up through six years after students entered the program and examines whether the program led to long-term academic success. The main finding from this report is: The Opening Doors Learning Communities program increased the proportion of program group students who earned a degree after six years.
Opening Doors Learning Communities Program Model
The Opening Doors Learning Communities model at Kingsborough had several components:
• Linked courses and student cohorts. Groups of up to 25 students took three linked courses together during the first semester, or “program semes-ter,” forming a learning community. The linked courses consisted of an Eng-lish course, either college-level or developmental, an academic course re-quired for the student’s major, and a one-credit freshman orientation course.
• Faculty collaboration and instructional practices. Faculty who taught linked courses were given one hour of reassigned time, allowing them to
1U.S. Department of Education, National Center for Education Statistics. 2011. Web Tables — Community College Student Outcomes: 1994-2009 (NCES 2012-253). Washington, DC: U.S. Department of Education.

ES-2
meet regularly during the semester to discuss students’ progress and identify strategies to assist students having difficulty. This extra time was also meant to allow faculty to integrate their course curricula and coordinate assign-ments.
• Student supports. The Opening Doors Learning Communities program in-cluded some other components designed to address students’ barriers to re-tention in college and academic success:
• Enhanced counseling and support. An Opening Doors counselor (called a “case manager”) taught the freshman orientation course that was part of the learning community. Typically, each Opening Doors case manager was responsible for three or four learning communities (75 to 100 students in all). The case managers worked proactively to help stu-dents overcome obstacles and develop strategies for success in college, and were expected to meet regularly with the other faculty members in a learning community to identify students who might be in need of assis-tance.
• Enhanced tutoring. Each learning community in the program was as-signed a tutor, who attended the English course and, in many cases, the subject matter course as well. The hope was that by attending courses, tu-tors would become familiar with the course material and the students.
• Textbook vouchers. Students in the program group were given a $150 textbook voucher for the initial 12-week main session and a $75 textbook voucher for the subsequent six-week winter or summer intersession.2 The vouchers were redeemable at the campus bookstore.
Evaluation and Research Sample
MDRC is using a random assignment research design to study the impacts (or effects) of the Opening Doors Learning Communities program, compared with Kingsborough’s standard services and courses. Opening Doors was the first large-scale evaluation to use random assign-ment to study community college programs.
2During the 2003-2004 academic year, the textbook vouchers were worth up to $200 during the 12-week
session and up to $100 during the six-week session.
ES-3
Kingsborough targeted its Opening Doors Learning Communities program to students who met the following criteria:
• Was a first-time incoming freshman who planned to attend college full time during the day
• Did not test into English as a Second Language (that is, tested into either de-velopmental English or college-level English)
• Was age 17 to 34
Students who met all of the eligibility criteria and were interested in participating in the research study were randomly assigned either to a program group that was eligible to participate in Opening Doors Learning Communities or to a control group that received standard college courses and services.
Short-Term Findings
An earlier MDRC report followed the students in this study for two years.3 The report included an implementation analysis, findings from a 12-month student survey, and impacts on academic outcomes for two years.4 To very briefly summarize, the key short-term findings include:
• The Opening Doors Learning Communities program was well imple-mented.
All the key features were in place and remained in place throughout the study period. However, there was variation in content, class size, and the degree to which the faculty worked together and integrated their courses. Thus, the study provides a strong test of the structural features of the learning community, but it may not fully detect the effects of tightly integrating course curricula.
• The program improved some educational outcomes during the program semester, and the program group remained ahead on some key out-comes at the end of two years.
The program group experienced a significant “boost” on important academic measures during the program semester. For example, the program group earned an additional 1.2 credits,
3Susan Scrivener, Dan Bloom, Allen LeBlanc, Christina Paxson, Cecilia Elena Rouse, and Colleen Som-mo with Jenny Au, Jedediah J. Teres, and Susan Yeh. 2008. A Good Start: Two Year Effects of a Freshman Learning Community Program at Kingsborough Community College. New York: MDRC.
4Academic outcomes from the two-year report were based on courses taken at Kingsborough only.
ES-4
on average, and was more likely to make progress through their developmental English re-quirements. While increases in credits earned slowed after the program semester, the program group increased their lead in this domain and was ahead by 2.4 credits, on average, after two years (representing about an 8 percent increase in credits earned over the control group). All of these differences are “statistically significant,” meaning they are not likely due to chance.
In addition, based on results from the student survey, assignment to the program group significantly improved a student’s college experience in terms of a sense of integration and belonging, suggesting that learning communities change a student’s perceptions of the college experience.
Long-Term Findings
Looking at academic measures for six years shows that the program affected long-term out-comes as well. The key findings from this report are:5
• More students in the program group earned a degree than students in the control group after six years.
After six years, 35.9 percent of the program group earned a degree from any institution, compared with 31.3 percent of the control group. The 4.6 percentage point gain represents about a 15 percent increase in degrees earned over the control group rate. As discussed below, the program also influenced credit accumulation and some dimensions of enrollment, which may have led to the increase in degrees earned. The effect on degrees was most evident for students who placed into college-level English, although there is evidence that the program also positive-ly affected long-term outcomes for students with the greatest developmental needs in English.
Figure ES.1 shows cumulative degree receipt rates for the full sample by research group, by year. The black bars represent the program group mean and the white bars represent the control group mean. As illustrated, both groups began earning degrees in year 2, with a large jump occurring in year 3. The pattern of differences between the program group and the control group suggests that the program group was earning degrees at a higher rate throughout the follow-up period, though this difference is not statistically significant until year 6.
5The long-term outcomes use National Student Clearinghouse and CUNY Institutional Research Data-
base (IRDB) data for the impact analysis. Measures that report on credits or intersessions are based on CUNY data only.

ES-5
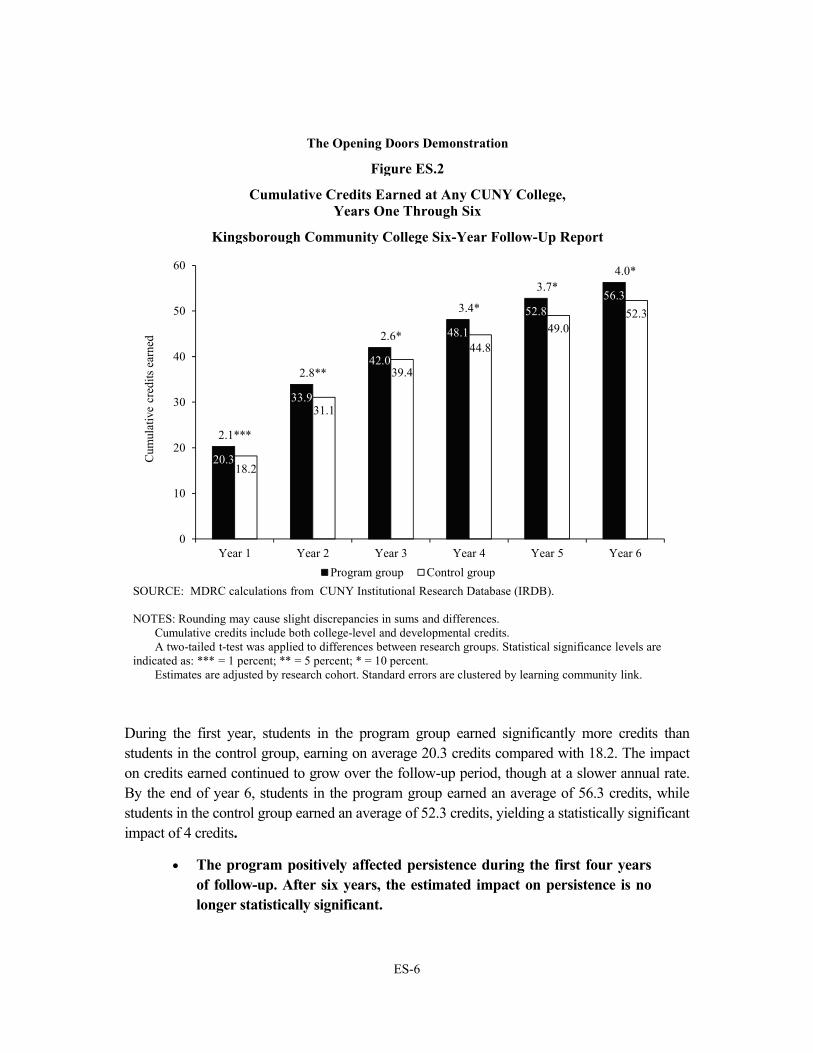
• The program had a positive impact on total credits earned over the follow-up period.
Figure ES.2 compares the annual growth in cumulative total credits earned for the pro-gram and control groups, an important indicator of academic success. As shown, the opportuni-ty to participate in the Opening Doors Learning Communities led to immediate short-term gains in credit accumulation, and these gains persisted throughout the six-year follow-up period.
Kingsborough Community College Six-Year Follow-Up Report
The Opening Doors Demonstration
Figure ES.1
Earned a Degree at Any College, Years One Through Six
6.1
20.226.5
31.835.9
5.4
16.9
23.728.1
31.3
0.0 0.8
3.3 2.8
3.7 4.6*
0
10
20
30
40
50
60
70
80
90
100
Year 1 Year 2 Year 3 Year 4 Year 5 Year 6
Earn
ed a
deg
ree
(%)
Program group Control group
SOURCE: MDRC calculations from CUNY Institutional Research Database (IRDB) and National Student Clearinghouse data.
NOTES: Rounding may cause slight discrepancies in sums and differences.A two-tailed t-test was applied to differences between research groups. Statistical significance levels are
indicated as: *** = 1 percent; ** = 5 percent; * = 10 percent.Estimates are adjusted by research cohort. Standard errors are clustered by learning community link.No one with a known degree type earned a certificate, although there may have been a small number of
certificate earners whose degree type was unknown.
ES-6
During the first year, students in the program group earned significantly more credits than students in the control group, earning on average 20.3 credits compared with 18.2. The impact on credits earned continued to grow over the follow-up period, though at a slower annual rate. By the end of year 6, students in the program group earned an average of 56.3 credits, while students in the control group earned an average of 52.3 credits, yielding a statistically significant impact of 4 credits.
• The program positively affected persistence during the first four years of follow-up. After six years, the estimated impact on persistence is no longer statistically significant.
Kingsborough Community College Six-Year Follow-Up Report
Cumulative Credits Earned at Any CUNY College,
Figure ES.2
Years One Through Six
The Opening Doors Demonstration
20.3
33.9
42.0
48.1
52.856.3
18.2
31.1
39.4
44.849.0
52.3
2.1***
2.8**
2.6*
3.4*
3.7*4.0*
0
10
20
30
40
50
60
Year 1 Year 2 Year 3 Year 4 Year 5 Year 6
Cum
ulat
ive
cred
its e
arne
d
Program group Control groupSOURCE: MDRC calculations from CUNY Institutional Research Database (IRDB).
NOTES: Rounding may cause slight discrepancies in sums and differences.Cumulative credits include both college-level and developmental credits.A two-tailed t-test was applied to differences between research groups. Statistical significance levels are
indicated as: *** = 1 percent; ** = 5 percent; * = 10 percent.Estimates are adjusted by research cohort. Standard errors are clustered by learning community link.
ES-7
After six years, the difference between the program and control group on number of semesters enrolled in any college is small and not statistically significant. However, statistically significant differences were evident in the first four years. In addition, the program group was more likely to enroll continuously.6 This impact was evident as early as the students’ first year in college, and persisted for many years. There was no evidence of the program affecting transfer rates to four-year colleges.
• The program had a positive impact on student enrollment and credit ac-cumulation in summer and winter “intersessions.”
At Kingsborough, all students can enroll in courses during six-week intersessions that follow the main fall and spring sessions. Most students who enroll full time during a main session — regardless of their assignment to the program or control groups — can enroll in the subsequent intersession at no additional cost. Beginning in year 1 and continuing throughout the follow-up period, the program group enrolled in more cumulative intersessions and earned more credits during these periods, on average, compared with the control group. About a quarter of the overall impact on credits earned after six years came from credits earned during intersessions.
The increase in intersession enrollment may be related to the program model. Some components of the program, such as enhanced counseling and the use of textbook vouchers, were available for the full first semester, including the subsequent intersession. It is possible that these services, plus advice and encouragement from the Opening Doors case managers, enticed more program group students to give intersessions a try and eventually realize their value.
• The Opening Doors Learning Communities program was cost-effective. In particular, the cost per degree earned was lower per program group member than it was per control group member.
During the program semester, the Opening Doors Learning Communities program cost just under $1,600 per program group member to operate. This investment proved worthwhile: It increased the number of students who earned a college degree. Although more total money was spent on students in the program group, the impact on degrees more than offset these costs. The cost per degree earned among program group members was 2.6 percent less than the cost per degree earned among control group members. As a result, the learning communities program was a cost-effective enhancement to the usual college services at Kingsborough.
6Sample members are considered “continuously enrolled” if they enrolled in all available semesters through the end of a given year without “stopping” out, or if they had earned their first degree by the given year, after having been continuously enrolled before they earned that degree.
ES-8
Conclusions and What’s Next
The Opening Doors Learning Communities program at Kingsborough was designed to promote student involvement, persistence, and academic success by placing groups of students in learning communities for one semester and offering them enhanced supports. This report finds that the program increased students’ six-year graduation rates by an estimated 4.6 percentage points and increased the total credits they earned over six years by an estimated 4.0 credits. The gain in degrees earned marks a substantial improvement, particularly given the relatively short duration of the program.
This analysis, however, may not be representative of the effects of learning communi-ties more generally. The National Center for Postsecondary Research (NCPR) — of which MDRC is a partner — evaluated six learning communities programs that were selected to represent a variety of programs as typically offered by community colleges across the country. A final report looked at three semesters of follow-up for students in developmental education who participated in the study at five of the six Learning Communities sites, plus a subset of the Opening Doors Learning Communities sample presented here (that is, those in need of devel-opmental English).7 The report finds that the developmental education learning communities evaluated had a small (half-credit) impact on credits earned in the targeted subject (English or math), no impact on credits outside that subject, and a half-credit effect on total credits earned. There was no effect on semester-to-semester persistence.
Several factors distinguish the Opening Doors Learning Communities at Kingsborough. Most notably, Opening Doors Learning Communities were particularly comprehensive. They linked three courses and provided enhanced counseling, tutoring, and textbook vouchers, and some of these services extended into the trailing intersession. In addition, the Opening Doors Learning Communities research sample had important distinguishing characteristics. For example, the evaluation explicitly recruited students intending to enroll in college full time and included both developmental and college-ready English students. The Opening Doors program also had unusually strong support from the college leadership. Therefore, while the Kings-borough results are encouraging, it is not clear that the positive impacts can be readily replicated at other institutions.
This report also demonstrates the importance of long-term follow-up for evaluating community college programs in two ways. First, it shows that it is possible for short-term, modest impacts to grow into important long-term gains. Over the first two years, the impact on
7Mary Visher, Michael Weiss, Evan Weissman, Timothy Rudd, and Heather Wathington with Jedediah Teres and Kelley Fong. 2012. The Effects of Learning Communities for Students in Developmental Education: A Synthesis of Findings from Six Community Colleges. New York: National Center for Postsecondary Research.
ES-9
credits earned grew slowly, and it was unclear whether the program would lead to long-term academic gains. However with the ability to analyze six years of follow-up data, it is apparent that this program did lead to a very important outcome: increase in degree receipt. Second, as shown in Figure ES.1, the differences in degree receipt between the program and control groups grew over time but did not reach statistical significance until year 6. An important implication of this report is that relatively long follow-up periods may be necessary to identify interventions that have an impact on graduation, particularly for students who enter college with developmen-tal education needs.
MDRC will continue to follow the Opening Doors Learning Communities research sample. A future report will present findings on longer-term academic outcomes, including seven-year graduation rates, and earnings and employments effects.

1
Chapter 1
Introduction
In today’s economy, postsecondary credentials are increasingly important to labor market success. Community colleges provide a key pathway to these credentials for many, including low-income and nontraditional students. Unfortunately, many community college students leave before earning a degree or credential, especially those who enter underprepared for college-level work. Among first-time students who enrolled in community colleges during the 2003-2004 academic year, only about a third earned a degree or certificate in six years.1
In 2003, MDRC launched the Opening Doors demonstration, in which six community colleges operated innovative programs aimed at increasing students’ achievement and persis-tence. As part of this demonstration, Kingsborough Community College in Brooklyn, New York — a large, urban college in the City University of New York (CUNY) system — tested a one-semester learning community program from 2003 to 2005. Learning communities typically place groups of students in two or more linked courses with mutually reinforcing themes and assignments. By enabling groups of students to take multiple courses together, learning com-munities aim to build relationships among students and promote students’ involvement and persistence. The curricula of the linked courses are generally connected by some overarching theme, allowing students to apply what is being learned in one course to what is being learned in another and thereby gain a deeper understanding of their course work.2
The Opening Doors Learning Communities program at Kingsborough placed freshmen into groups of up to 25 students who took three classes together during their first semester: either a college-level or developmental English course, an academic course required for the student’s major, and a freshman orientation course. It also provided enhanced counseling and tutoring, as well as textbook vouchers. Using a rigorous research design, MDRC randomly assigned students either to a program group that was eligible to participate in Opening Doors Learning Communities or to a control group that received standard college courses and services. An earlier MDRC report followed the students in this study for two years and found that the program improved students’ college experience and some educational outcomes, such as credits earned. In addition, the program moved students more quickly through their developmental English requirements.
1U.S. Department of Education (2011). 2Engstrom and Tinto (2008).
2
In 2010, MDRC received a grant from the U.S. Department of Education’s Institute of Education Sciences to conduct longer-term follow-up on students in two of the Opening Doors sites, including those in the learning communities program at Kingsborough.3 The primary research question for this long-term research is: Did the programs help more students stay in school and earn degrees over the long run?
This report extends the follow-up through six years after students entered the program and examines whether the program led to long-term academic success. It also presents the costs of operating this program and reports on its cost-effectiveness. In summary, the main finding from this report is: After six years, more students in the Opening Doors Learning Communities program earned a degree than their counterparts in the control group. While this evaluation cannot identify the specific mechanisms that led to increased degree completion, it does suggest that programs capable of improving important short-term outcomes may indeed translate into long-term gains. Moreover, the cost-effectiveness analysis described in the report suggests that the program was a cost-effective use of funds over the long term.
Background and Related Studies As noted above, Kingsborough’s learning communities program was part of a national demon-stration project known as Opening Doors. MDRC launched the demonstration in response to two pressing problems: low rates of persistence among community college students and a dearth of reliable evidence about effective strategies to improve students’ retention in college and academic success.4 After meeting with community college experts and students from around the country, MDRC identified three broad strategies hypothesized to produce better student outcomes: (1) changes in curriculum or instruction that would help students master the basic skills needed to succeed in college; (2) increased financial aid that would give students an incentive to succeed and help them cover expenses; and (3) enhancements to academic counsel-ing and other student services that would help students understand the “rules of the game” and remove barriers to success. MDRC then looked for states and community colleges that had promising program models or ideas that were consistent with one or more of these strategies and that were interested in participating in a rigorous, random assignment evaluation. Ultimate-ly, MDRC evaluated four programs for this demonstration, all of which addressed two or more of the strategies named above.
3In addition to the long-term analysis for Kingsborough, a four-year report was released in 2011 on the Opening Doors program that operated at Chaffey College. This program included a student success course and enhanced supports and was targeted to students on academic probation. See Weiss et al. (2011).
4For an early history of the Opening Doors demonstration, see Brock and LeBlanc (2005).
3
The Opening Doors programs were evaluated using a random assignment design, which has long been considered the “gold standard” for evaluations of welfare reform, health care, and other kinds of interventions. Opening Doors was the first large-scale evaluation to use random assignment to study community college programs. MDRC released a series of reports on the effectiveness of the Opening Doors programs between 2006 and 2009. Most of these reports followed students for one or two years after random assignment, though the report on the enhanced student services program in Ohio tracked students for three years.5 All the programs produced at least some positive impacts on credits earned or other measures.
Building on the early positive findings from the Opening Doors program at Kings-borough, the National Center for Postsecondary Research (NCPR) — of which MDRC is a partner — launched the Learning Communities Demonstration to test the effectiveness of learning communities in increasing academic progress for students at six colleges across the country. Five of the six models of learning communities targeted incoming students in need of developmental math or English, and the sixth model targeted continuing students in several career tracks. The learning communities in the study varied in content and quality but are likely typical of how learning communities are usually operated in community colleges. While some included a student success course or tutoring component, none included enhanced supports (such as enhanced counseling, enhanced tutoring, and textbook vouchers) that approached the level of those found in the Opening Doors program at Kingsborough. In addition, while Kings-borough linked three courses, most of the programs in the Learning Communities Demonstra-tion linked two courses.
The Learning Communities Demonstration programs were also evaluated using a ran-dom assignment design. A final report looked at three semesters of follow-up for nearly 7,000 developmental education students who participated in the study at five of the six Learning Communities sites, plus a subset of the Opening Doors Learning Communities sample present-ed here.6 The report finds that the developmental learning communities evaluated have a small (half-credit) impact on credits earned in the targeted subject (English or math), no discernible impact on credits outside that subject, and a half-credit effect on total credits earned (driven by developmental credits earned in the subject) after three semesters of follow-up. There was no discernible effect on semester-to-semester persistence. Therefore, while the Kingsborough results are encouraging, it is not clear that the positive impacts can be easily replicated at other institutions.
5For an overview of Opening Doors findings, see Scrivener and Coghlan (2011). Full reports on individu-al Opening Doors programs are available at http://www.mdrc.org/project_31_2.html.
6Opening Doors Learning Communities sample members who failed one or more English tests at baseline were included in the Learning Communities Demonstration synthesis report (Visher et al., 2012).
4
Organization of This Report The subsequent chapters examine the educational trajectories of Kingsborough students who were randomly assigned to the Opening Doors Learning Communities program or to the control group. Chapter 2 describes the study sample and data sources used to track students’ progress. Chapter 3 describes the program model and summarizes the implementation research and early impact findings. Chapter 4 looks at educational impacts over the full six-year follow-up period and also explores variation across student subgroups. Chapter 5 presents information on program costs, and Chapter 6 gives an overall summary and outlines implications for policy-makers and community college practitioners.

5
Chapter 2
Data Sources and Sample Description
This evaluation used a random assignment research design to estimate the effects of the Open-ing Doors Learning Communities program at Kingsborough Community College, compared with the college’s regular classes and services. This chapter describes how students became part of the research sample at Kingsborough and presents some characteristics of the sample members. It also discusses the data sources used in this report.1
Identifying, Recruiting, and Randomly Assigning Students To enroll students in the study, MDRC and Kingsborough staff worked together to insert the recruitment and random assignment procedures into the college’s student registration process. This was a considerable challenge, as large community colleges must process many student registrations in a short time. In addition, this was the first time that a large-scale random assignment study had been conducted at a community college. The design and research proce-dures were based on past studies set in other contexts, but they had to be adapted to disrupt the normal college processes as little as possible. The Kingsborough administrators’ and staff members’ commitment to the study, coupled with their creativity and flexibility, were critical to the success of the research sample recruitment and intake processes.
Potential study participants were identified during the weeks before the start of each semester. Kingsborough staff began by reviewing lists of applicants who had already taken the City University of New York (CUNY) skills assessment tests. Scores on the reading and writing tests that are administered before enrollment determine most students’ English placements. Applicants whose scores placed them in a developmental English course for native English speakers or in freshman English were invited to come to campus to register early for classes.2
Students who came in to register received a brief, general description of the Opening Doors program at Kingsborough and were told that the program had sufficient funding to serve about half of eligible freshmen. Further, they were told that the program was part of a study, that it was open only to students who agreed to be in the study, and that a random process would be used to determine which study participants would be placed in the program. Students who
1The majority of information presented in the chapter is adapted from Scrivener et al. (2008). 2Students whose scores placed them in English as a Second Language (ESL) were not included in Kings-
borough’s Opening Doors study, as they were eligible for the college’s ESL learning communities program.

6
agreed to participate in the study signed an informed consent form, provided some baseline demographic information, and completed a brief confidential survey. They received a $20 transit card as an incentive and as compensation for their time, and they were then randomly assigned either to the program group or to the control group and were given appropriate assistance registering for classes.3
The sequence described above was the ideal recruitment process. However, in reality, most Kingsborough freshmen apply and take the CUNY skills assessment tests so close to the start of the semester that they were unable to attend an early-registration appointment. As a result, the majority of sample members entered the study during four or five large registration sessions that occurred in the few weeks before each semester began. Opening Doors Learning Communities and MDRC staff attended these sessions and “intercepted” freshmen who had just learned their test scores and were about to register for classes. Potential study participants heard the explanation about the research and the learning communities program. If they were interest-ed, they completed the research paperwork in small groups, rather than individually. Random assignment was conducted on the spot (typically through a phone call to MDRC’s office), and students proceeded to register for classes.
Students were brought into the research sample in four different groups, or cohorts, just before four different semesters: fall 2003, spring 2004, fall 2004, and spring 2005. Throughout the study, a total of 1,534 students were randomly assigned at Kingsborough (769 program group students, 765 control group students).
Eligibility Criteria Kingsborough targeted its Opening Doors Learning Communities program to students who met the following criteria:
• Was a first-time incoming freshman who planned to attend college full time during the day
• Did not test into ESL (that is, tested into either developmental English or col-lege-level English)
3It is worth noting that students who came to a random assignment appointment and who were placed in
the control group — like the program group students — were allowed to register for classes earlier than most Kingsborough freshmen, and they received advice on the registration process from Opening Doors staff. These slightly enhanced control group services are not perfectly representative of the status quo, but it was deemed unethical and impractical to bring students to campus and then not allow them to register for classes.

7
• Was age 17 to 344
Students in four “career majors,” for whom a separate learning community operated, were also excluded for the first year of the study.5 The career learning community program ended after the 2003-2004 academic year, and after that, students in those majors could partici-pate in Opening Doors. In designing Opening Doors Learning Communities, Kingsborough’s administrators were especially interested in targeting liberal arts majors, because they believed that many students in that group do not have clear academic or career goals and so might benefit from a model that provided enhanced structure and support. In addition, they made an effort to target students who had missed the CUNY systemwide application deadline and applied directly to Kingsborough, often just weeks or even days before the start of classes. College data showed that these two overlapping groups of students tended to have poor outcomes, suggesting that they might benefit from Opening Doors.
Characteristics of the Sample Table 2.1 presents some characteristics of the sample members at Kingsborough, based on the questionnaire that they completed just before random assignment: the Baseline Information Form. As the table shows, just over half of the sample members are female. The research sample is racially and ethnically diverse: 37.7 percent of the sample members identified themselves as black (non-Hispanic), 26.9 percent as white (non-Hispanic), and 20.4 percent as Hispanic.
As incoming freshmen, the sample members were quite young when they entered the study: 44.5 percent were either 17 or 18, and only 21.3 percent were 21 or older. Very few of the Kingsborough sample members were married or had children. Almost three-fourths reported being financially dependent on their parents, and roughly one-third were working when they entered the study.
Most of the sample members (70.2 percent) had received their high school diploma or General Educational Development (GED) certificate in the year before entering the study. A small minority (7 percent) received their diploma or GED certificate more than five years before
4During the first semester of program operations, Kingsborough’s Opening Doors program was open only
to students between ages 18 and 34 who reported household income below 250 percent of the federal poverty level. In subsequent semesters, the income criterion was removed, having been deemed unnecessary because such a large proportion of Kingsborough students are from low- or moderate-income families, and 17-year-olds were admitted to the program with parental consent.
5Career majors included accounting, business, mental health, and early childhood education.

8
FullCharacteristic (%) Sample
GenderMale 45.4Female 54.6
Age 17-18 years old 44.519-20 years old 34.221-34 years old 21.3
Marital statusMarried 3.9Unmarried 96.1
Race/ethnicitya
Hispanic/Latino 20.4Black, non-Hispanic 37.7White, non-Hispanic 26.9Asian or Pacific Islander 8.6Other 6.4
Has one or more children 8.7
Household receiving any government benefitsb 28.4
Financially dependent on parents 74.2
Ever employed 78.2
Currently employed 35.5
Diplomas/degrees earnedc
High school diploma 70.9General Educational Development (GED) certificate 28.6Occupational/technical certificate 2.0
Date of high school graduation/GED receiptDuring the past year 70.2Between 1 and 5 years ago 22.8More than 5 years ago 7.0
Main reason for enrolling in collegec
To complete a certificate program 2.8To obtain an associate's degree 29.7To transfer to a 4-year college/university 50.2To obtain/update job skills 10.8Other 8.4
(continued)
The Opening Doors Demonstration
Table 2.1
Selected Characteristics of Sample Members at Baseline
Kingsborough Community College Six-Year Follow-Up Report
9
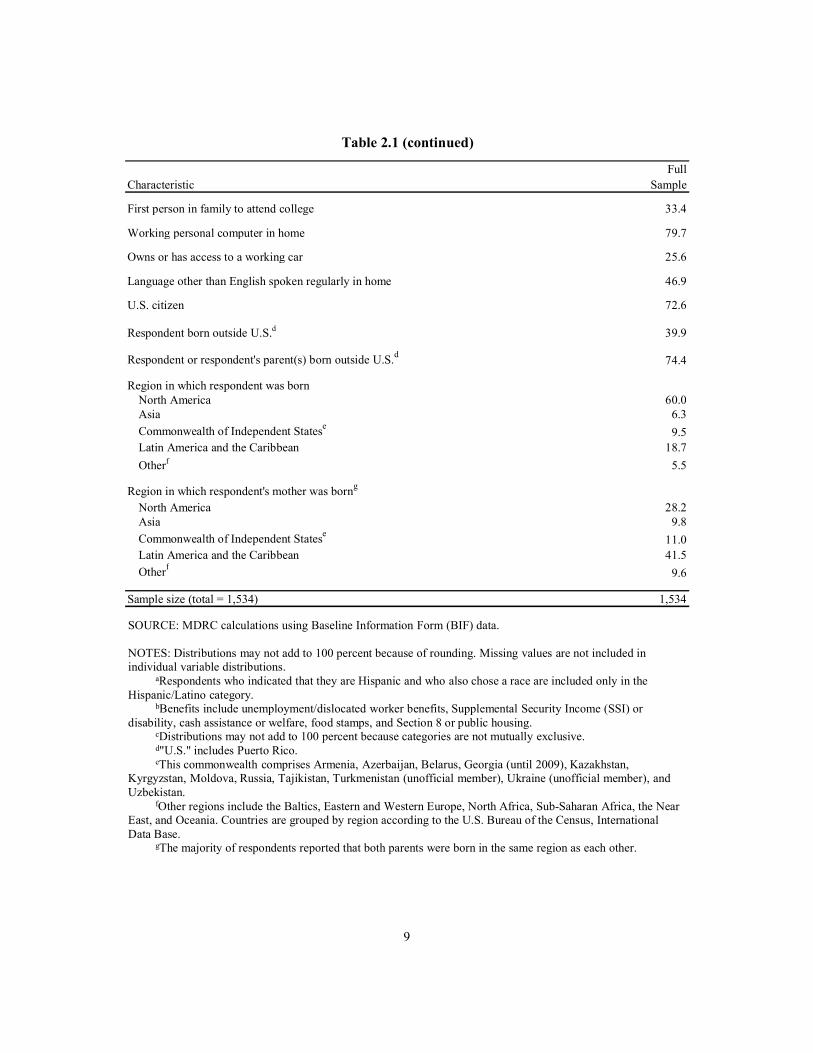
FullCharacteristic Sample
First person in family to attend college 33.4
Working personal computer in home 79.7
Owns or has access to a working car 25.6
Language other than English spoken regularly in home 46.9
U.S. citizen 72.6
Respondent born outside U.S.d 39.9
Respondent or respondent's parent(s) born outside U.S.d 74.4
Region in which respondent was bornNorth America 60.0Asia 6.3Commonwealth of Independent Statese 9.5Latin America and the Caribbean 18.7Otherf 5.5
Region in which respondent's mother was borng
North America 28.2Asia 9.8Commonwealth of Independent Statese 11.0Latin America and the Caribbean 41.5Otherf 9.6
Sample size (total = 1,534) 1,534
Table 2.1 (continued)
SOURCE: MDRC calculations using Baseline Information Form (BIF) data.
NOTES: Distributions may not add to 100 percent because of rounding. Missing values are not included in individual variable distributions.
aRespondents who indicated that they are Hispanic and who also chose a race are included only in the Hispanic/Latino category.
bBenefits include unemployment/dislocated worker benefits, Supplemental Security Income (SSI) or disability, cash assistance or welfare, food stamps, and Section 8 or public housing.
cDistributions may not add to 100 percent because categories are not mutually exclusive.d"U.S." includes Puerto Rico.eThis commonwealth comprises Armenia, Azerbaijan, Belarus, Georgia (until 2009), Kazakhstan,
Kyrgyzstan, Moldova, Russia, Tajikistan, Turkmenistan (unofficial member), Ukraine (unofficial member), and Uzbekistan.
fOther regions include the Baltics, Eastern and Western Europe, North Africa, Sub-Saharan Africa, the Near East, and Oceania. Countries are grouped by region according to the U.S. Bureau of the Census, International Data Base.
gThe majority of respondents reported that both parents were born in the same region as each other.

10
entering the study. Almost four-fifths of the sample members reported that their main reason for enrolling in college was either to obtain an associate’s degree or to transfer to a four-year institution. One-third of the students in the study said that they were the first in their family to attend college.
When they entered the study, almost half of the sample members reported speaking a language other than English at home. A full 39.9 percent of the students in the study were born outside the United States: 18.7 percent were born in Latin America or the Caribbean; 9.5 percent were born in what is now known as the Commonwealth of Independent States (a group of former republics in the Soviet Union); and 6.3 percent were born in Asia. Almost three-fourths of the sample members reported that either they or at least one of their parents were born outside the United States.
Appendix Table A.1 shows the complete list of characteristics that were collected on the Baseline Information Form. The table shows the characteristics for the full sample, the program group, and the control group. An asterisk in the right-most column of the table indi-cates that the proportion of program group members with that characteristic is significantly different from the proportion of control group members. As the table shows, there are some small differences between the two research groups, but no more than would be expected to occur randomly.6
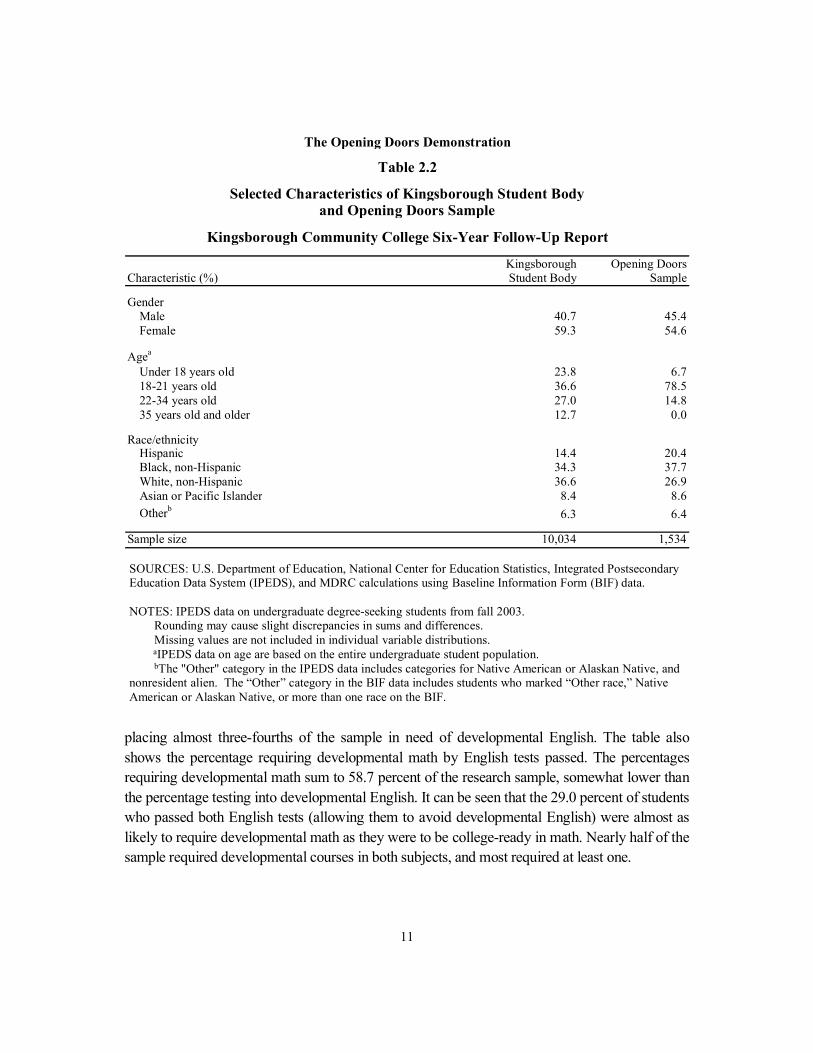
Table 2.2 compares the research sample with the degree-seeking student body at Kingsborough on a few demographic characteristics. Males are slightly overrepresented in the research sample (45.4 percent of the research sample versus 40.7 percent of the student body). The research sample’s age distribution lies predominantly between the ages of 18 and 21, while the student body has larger proportions that are both older and younger than that range, with 12.7 percent over the age of 34. Owing to the eligibility criteria, none of the research sample was over 34 at baseline. The research sample has a higher proportion of minority students than the student body, particularly black and Hispanic minorities (58.1 of the research sample versus 48.7 percent of the student body). The research sample, which consisted of students who met program eligibility criteria and agreed to participate, should not be considered representative of the broader Kingsborough student body.
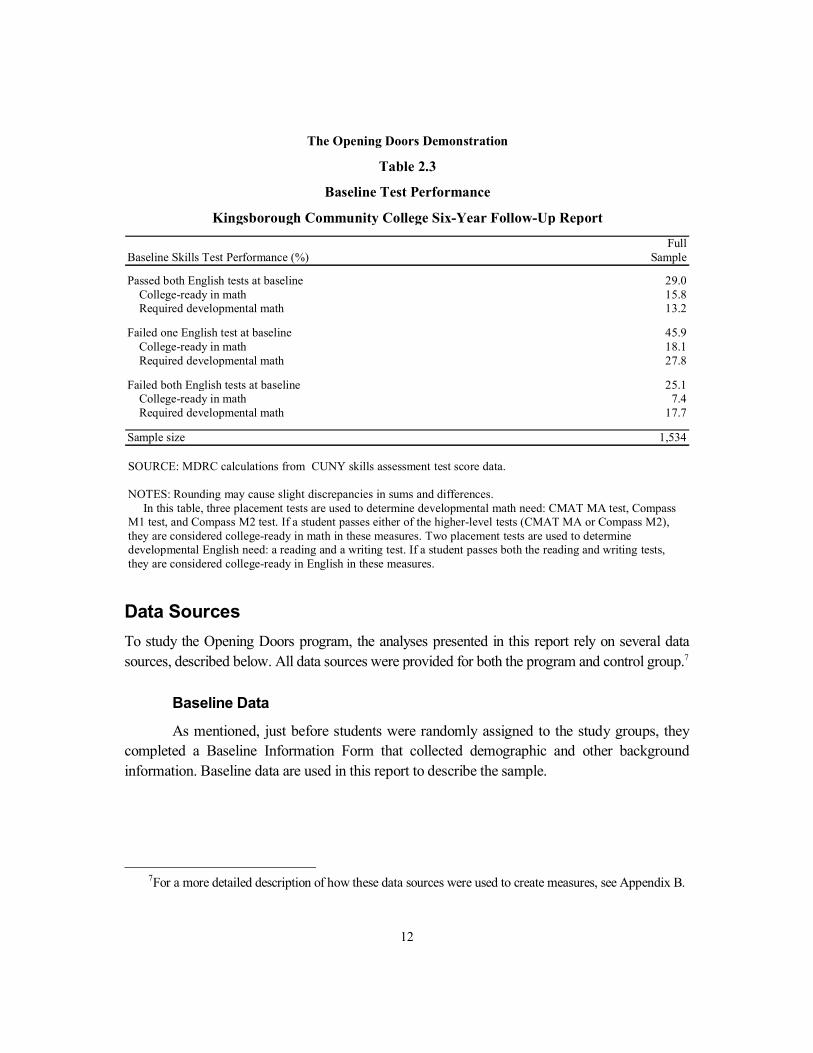
As noted above, students at Kingsborough are required to take CUNY skills assessment tests before they begin classes. As Table 2.3 shows, 25.1 percent of the research sample failed both English placement tests, and an additional 45.9 percent failed one of the English tests,
6An additional statistical test (an omnibus F-test, applied to evaluate the joint significance of the individual characteristics in Appendix Table A.1) does not suggest that the two groups differed significantly.
11
placing almost three-fourths of the sample in need of developmental English. The table also shows the percentage requiring developmental math by English tests passed. The percentages requiring developmental math sum to 58.7 percent of the research sample, somewhat lower than the percentage testing into developmental English. It can be seen that the 29.0 percent of students who passed both English tests (allowing them to avoid developmental English) were almost as likely to require developmental math as they were to be college-ready in math. Nearly half of the sample required developmental courses in both subjects, and most required at least one.
Kingsborough Opening DoorsCharacteristic (%) Student Body Sample
Gender Male 40.7 45.4Female 59.3 54.6
Agea
Under 18 years old 23.8 6.718-21 years old 36.6 78.522-34 years old 27.0 14.835 years old and older 12.7 0.0
Race/ethnicity Hispanic 14.4 20.4Black, non-Hispanic 34.3 37.7White, non-Hispanic 36.6 26.9Asian or Pacific Islander 8.4 8.6Otherb 6.3 6.4
Sample size 10,034 1,534
The Opening Doors Demonstration
Table 2.2
Selected Characteristics of Kingsborough Student Body
Kingsborough Community College Six-Year Follow-Up Report
and Opening Doors Sample
SOURCES: U.S. Department of Education, National Center for Education Statistics, Integrated Postsecondary Education Data System (IPEDS), and MDRC calculations using Baseline Information Form (BIF) data.
NOTES: IPEDS data on undergraduate degree-seeking students from fall 2003. Rounding may cause slight discrepancies in sums and differences.Missing values are not included in individual variable distributions.aIPEDS data on age are based on the entire undergraduate student population. bThe "Other" category in the IPEDS data includes categories for Native American or Alaskan Native, and
nonresident alien. The “Other” category in the BIF data includes students who marked “Other race,” Native American or Alaskan Native, or more than one race on the BIF.
12
Data Sources To study the Opening Doors program, the analyses presented in this report rely on several data sources, described below. All data sources were provided for both the program and control group.7
Baseline Data
As mentioned, just before students were randomly assigned to the study groups, they completed a Baseline Information Form that collected demographic and other background information. Baseline data are used in this report to describe the sample.
7For a more detailed description of how these data sources were used to create measures, see Appendix B.
FullBaseline Skills Test Performance (%) Sample
Passed both English tests at baseline 29.0College-ready in math 15.8Required developmental math 13.2
Failed one English test at baseline 45.9College-ready in math 18.1Required developmental math 27.8
Failed both English tests at baseline 25.1College-ready in math 7.4Required developmental math 17.7
Sample size 1,534
The Opening Doors Demonstration
Table 2.3
Baseline Test Performance
Kingsborough Community College Six-Year Follow-Up Report
SOURCE: MDRC calculations from CUNY skills assessment test score data.
NOTES: Rounding may cause slight discrepancies in sums and differences.In this table, three placement tests are used to determine developmental math need: CMAT MA test, Compass
M1 test, and Compass M2 test. If a student passes either of the higher-level tests (CMAT MA or Compass M2), they are considered college-ready in math in these measures. Two placement tests are used to determine developmental English need: a reading and a writing test. If a student passes both the reading and writing tests, they are considered college-ready in English in these measures.

13
CUNY Transcript Data
Kingsborough provided MDRC with transcript data from the CUNY Institutional Re-search Database (IRDB). These data include information on courses taken, such as course name, credits, and grades, and degrees earned from all CUNY institutions. The analyses for this report include data through the fall 2010 semester, which represents six years of follow-up for the full sample. However, CUNY degree data were available only through spring 2010. Tran-script data are used in Chapter 4 to help describe the impacts of the program and in Chapter 5 to inform the cost analysis.
CUNY Skills Assessment Test Score Data
Students are required to take the CUNY reading, writing, and math skills assessment tests before they begin classes at Kingsborough. MDRC collected test score data for all sample members who took the tests at Kingsborough or any other institution in the CUNY system. Test score data are available only for the first year and a half, or three semesters, of follow-up. In this report, baseline test score data are used to define subgroups of sample members for analysis and to recap short-term findings.8
Kingsborough Transcript Data
Kingsborough provided MDRC with transcript data for the sample members in the study. These data are used in Chapter 3, where the short-term impacts from the previous report are recapped, and are also the source of information about the learning community links. All other transcript outcomes are drawn from CUNY transcript data.
Kingsborough Financial Data
To determine the direct cost of operating the Opening Doors Learning Communities program, Kingsborough provided MDRC with budget documents for the program. Kings-borough worked with MDRC through phone calls and e-mails to clarify descriptions of spend-ing to ensure that all financial data were portrayed appropriately.
National Student Clearinghouse Data
The National Student Clearinghouse, a nonprofit organization, collects and distributes enrollment, degree, and certificate data from more than 3,300 colleges that enroll more than 96
8A chi-squared test of independence found no statistical difference between research groups on placement into subgroups based on English test pass rates.
14
percent of the nation’s college students.9 The Clearinghouse data are used in Chapters 4 and 5 to provide degree and enrollment information about students in the study who may have attended a postsecondary institution other than Kingsborough. The Clearinghouse data are available for the six-year follow-up period.
Integrated Postsecondary Education Data System (IPEDS)
IPEDS gathers information from every college, university, and technical and vocational institution that participates in federal student financial aid programs.10 IPEDS data are used to describe the Kingsborough student population in Chapter 2. In addition, the Kingsborough operating budget and the number of annual credit hours attempted at the college are pulled from IPEDS. These data are used to estimate the amount of resources that are typically invested in students at Kingsborough. The cost-effectiveness study is presented in Chapter 5 and includes additional details about how this information is employed.
Field Research
During the study period, MDRC periodically interviewed the administrators and staff involved in Opening Doors and observed meetings between counselors and students. During spring 2005, MDRC staff conducted a series of field research visits to Kingsborough. MDRC interviewed many college administrators, faculty, and staff, including those involved in Open-ing Doors. Furthermore, interviews were conducted with 23 students from the program and control groups at Kingsborough to learn about their experiences in college and the factors that affected their ability to stay in school.
9National Student Clearinghouse (2012). 10Integrated Postsecondary Education Data System (2012).

15
Chapter 3
Implementation of Opening Doors Learning Communities and Early Findings
This chapter describes the Opening Doors program model and summarizes the implementation findings. It also recaps the key impact findings from MDRC’s two-year report on the Opening Doors Learning Communities program.1
The key findings are:
• The Opening Doors Learning Communities program was well implemented at Kingsborough. All of the key features were in place and remained in place throughout the study period.
• Although all of the learning communities had the same basic structure, there was variation in content, class size, and the degree to which faculty worked together and integrated their courses. Thus, the study provides a strong test of the structural features of the learning communities, but it may not fully detect the effects of tightly integrating course curricula.
• During the program semester, program group students earned 1.2 more cred-its, on average, than their control group counterparts and progressed through their developmental education English requirements more quickly (program group students were 6 percentage points more likely to have completed these requirements by the end of the program semester).
• While increases in credits earned slowed after the program semester, at the end of two years, the program group had increased their lead in this domain and was ahead by 2.4 credits on average.
• At the end of two years, there was a small statistically significant impact on number of semesters enrolled (the program group was enrolled for 2.8 se-mesters, on average, compared with 2.7 semesters for the control group).
1The information presented in the chapter is adapted from Scrivener et al. (2008). The estimates reviewed in this chapter may be smaller than corresponding estimates presented elsewhere in this report. Scrivener et al. (2008) used Kingsborough transcript data only to examine students’ academic outcomes, whereas this report uses CUNY Institutional Research Database data, which include all CUNY institutions, and National Student Clearinghouse data.
16
Kingsborough Community College and Its Environment Kingsborough Community College is the only community college in Brooklyn, the largest borough of New York City, with a population of roughly 2.5 million people. Brooklyn is ra-cially diverse, and close to half of all Brooklyn residents speak a language other than English at home.2
Kingsborough was founded in 1963 and is one of seven community colleges in the City University of New York (CUNY), the nation’s largest urban university system.3 A large urban college, Kingsborough’s 70-acre campus boasts an unexpectedly scenic location next to a quiet residential neighborhood at the southern tip of Brooklyn, on the Atlantic Ocean. Kingsborough serves about 39,000 credit and noncredit students annually, who, like the inhabitants of Brook-lyn, are quite diverse.4
Kingsborough’s first learning communities program began in the mid-1990s and target-ed English as a Second Language (ESL) students who were entering degree programs. Later, the college created another learning community program that targeted students in four “career majors”: accounting, business, mental health, and early childhood education. Data collected by the college showed that students in the learning communities had higher rates of course comple-tion and semester-to-semester retention and higher grade point averages than students at Kings-borough who were not in a learning community. Based on this positive experience, the leader-ship at Kingsborough was eager to expand learning communities to a broader group of students. MDRC approached the college’s leadership in 2002 about the possibility of rigorously testing the effects of learning communities by participating in Opening Doors. Kingsborough agreed and developed the Opening Doors Learning Communities program and started operating it in fall 2003.
The Opening Doors Learning Communities Model The research sample participated in the Opening Doors Learning Communities program be-tween fall 2003 and spring 2005 (known as the “study period”). After the study period ended, Kingsborough expanded the program, offering it to most entering freshmen, and made some modest changes to the model. When this report was written, about half of entering full-time
2The statistics in this paragraph are from the 2010 American Community Survey (U.S. Census Bureau,
2010a) and the 2010 U.S. Census (U.S. Census Bureau, 2010b). 3CUNY also includes 11 four-year institutions, an honors college, a graduate school, a journalism school, a
law school, a school of professional studies and a school of public health. (City University of New York, 2012). 4Kingsborough Community College (2012).

17
freshmen participated in Opening Doors Learning Communities. This chapter discusses the model and operations only during the study period.
The Opening Doors Learning Communities model had several components:
• Linked courses and student cohorts. Groups of up to 25 students took three linked courses together during their first semester in the study, referred to as the “program semester,” forming a learning community. The linked courses consisted of an English course, with the level determined by the stu-dent’s scores on the CUNY reading and writing skills assessment tests ad-ministered before enrollment; an academic course required for the student’s major; and a one-credit freshman orientation course. The orientation class is open to all Kingsborough freshmen and teaches time management, study skills, college rules and procedures, and other topics relevant to new students. Typically, the linked courses met one after the other, or with a lunch break in between.
• Faculty collaboration and instructional practices. Faculty who taught linked courses were given one hour of reassigned time, allowing them to meet regularly during the semester to discuss students’ progress and identify strategies to assist students having difficulty. This extra time was also meant to allow faculty to inte-grate their course curricula and coordinate assignments.
• Student supports. The Opening Doors Learning Communities program in-cluded some other components designed to address students’ barriers to re-tention in college and academic success:
• Enhanced counseling and support. An Opening Door counselor (called a “case manager”) taught the freshman orientation course that was part of the learning community. Typically, each Opening Doors case manager was responsible for three or four learning communities (75 to 100 stu-dents in all). The case managers worked proactively to help students overcome barriers to good attendance and academic success and were ex-pected to meet regularly with the other faculty members in a given learn-ing community to identify students who might be in need of assistance.
• Enhanced tutoring. Each learning community in the program was as-signed a tutor, who attended the English course and, in many cases, the subject matter course as well. The hope was that by attending courses, tu-tors would become familiar with the course material and the students.
18
• Textbook vouchers. Students in the program group were given a $150 textbook voucher for the initial 12-week main session and a $75 textbook voucher for the subsequent six-week winter or summer intersession (see Box 3.1).5 The vouchers were redeemable at the campus bookstore.
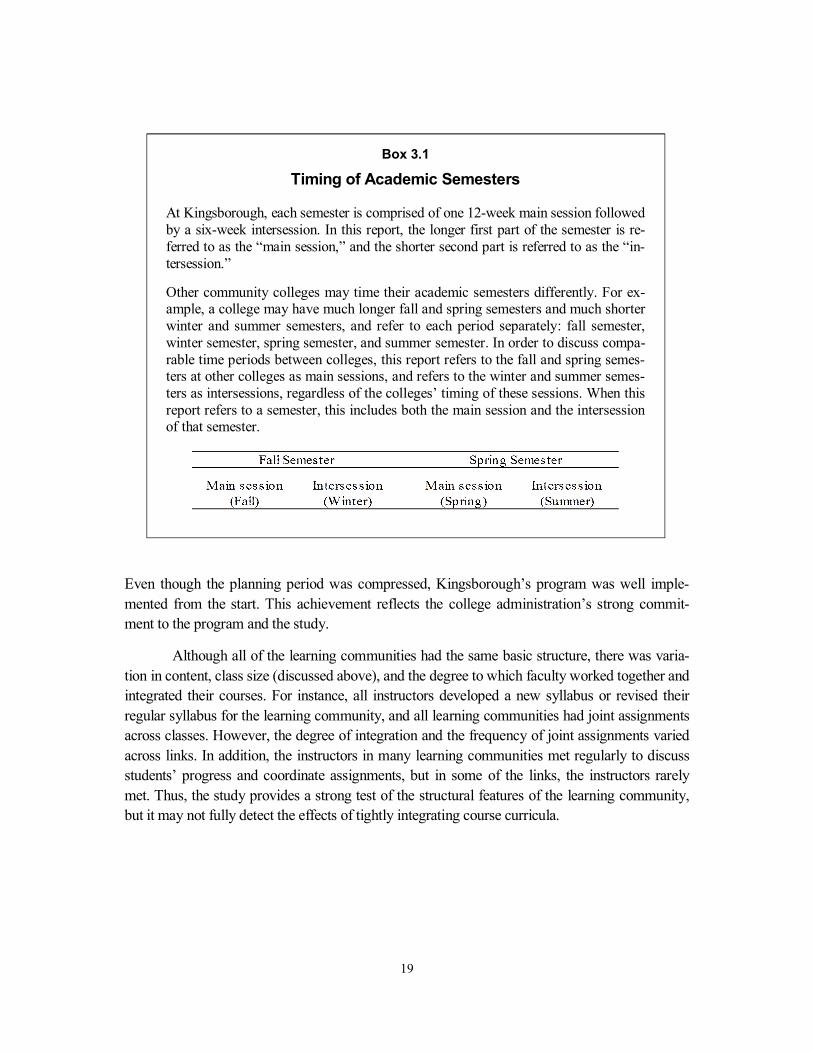
At Kingsborough, each semester is divided into two “sessions.” The main session is 12 weeks long, and the intersession is six weeks long. Though not mandatory, both sessions are open to all students, and most students who attend the main session full time can attend the sub-sequent six-week intersession for no additional cost.6 See Box 3.1 for more information on the timing of academic semesters at Kingsborough. Opening Doors Learning Communities operated only during a student’s first semester at Kingsborough, and the linked classes existed only dur-ing the main session. However, case managers encouraged program group members to take courses during the subsequent intersession. Those who did were still assigned to their Opening Doors case manager and could receive a second textbook voucher. There were also some social events designed to help students make the transition from Opening Doors to the regular college environment. Finally, while active counseling ended after the student’s first semester, an “open door” policy remained in effect, allowing program students to drop by the counseling office in subsequent semesters, though they were encouraged to move on to their new academic advisers.
Implementing Opening Doors Learning Communities As discussed in Chapter 2, Opening Doors staff recruited and randomly assigned 1,534 students to the program or control group over four semesters (fall 2003 through spring 2005). Over the four semesters, Kingsborough ran 40 learning communities for the study: 31 with developmen-tal English and 9 with college-level English. Because there were challenges in managing regis-tration and predicting how many students would test into each level of English, class size varied from 6 to 25 students, with an average of 17.7
The key structural features of the program operated as intended, with minor glitches, throughout the study period. The overwhelming majority of students in the program group en-rolled in linked classes (85.3 percent); tutors and case managers with relatively small caseloads were assigned to each learning community; and textbook vouchers were distributed as planned.
5During the 2003-2004 academic year, the textbook vouchers were worth up to $200 during the 12-week
session and up to $100 during the six-week session. 6Kingsborough Community College (2012). 7For a more complete discussion of the implementation research conducted for this program, see Scrivener
et al. (2008).
19
Even though the planning period was compressed, Kingsborough’s program was well imple-mented from the start. This achievement reflects the college administration’s strong commit-ment to the program and the study.
Although all of the learning communities had the same basic structure, there was varia-tion in content, class size (discussed above), and the degree to which faculty worked together and integrated their courses. For instance, all instructors developed a new syllabus or revised their regular syllabus for the learning community, and all learning communities had joint assignments across classes. However, the degree of integration and the frequency of joint assignments varied across links. In addition, the instructors in many learning communities met regularly to discuss students’ progress and coordinate assignments, but in some of the links, the instructors rarely met. Thus, the study provides a strong test of the structural features of the learning community, but it may not fully detect the effects of tightly integrating course curricula.
Box 3.1
Timing of Academic Semesters
At Kingsborough, each semester is comprised of one 12-week main session followed by a six-week intersession. In this report, the longer first part of the semester is re-ferred to as the “main session,” and the shorter second part is referred to as the “in-tersession.”
Other community colleges may time their academic semesters differently. For ex-ample, a college may have much longer fall and spring semesters and much shorter winter and summer semesters, and refer to each period separately: fall semester, winter semester, spring semester, and summer semester. In order to discuss compa-rable time periods between colleges, this report refers to the fall and spring semes-ters at other colleges as main sessions, and refers to the winter and summer semes-ters as intersessions, regardless of the colleges’ timing of these sessions. When this report refers to a semester, this includes both the main session and the intersession of that semester.

20
In addition to the question of implementation, it is important to know how the program differed from the college’s usual services. Table 3.1 summarizes the key differences between the Opening Doors Learning Communities at Kingsborough and the regular college environ-ment (that is, the control group environment). The contrast is clearest with respect to course as-signments and scheduling. Opening Doors Learning Communities students took three linked courses that were scheduled in a block, and all of them took an English course and the freshman orientation class. Control group students took whatever courses were available to them, at what-ever times those courses met, and were not required to take English or the freshman orientation. There was almost certainly no attempt by the regular college faculty to link the subject matter across courses. Other key differences included smaller class sizes, the use of textbook vouchers, and enhanced tutoring in the Opening Doors Learning Communities program. However, it is important to note that the enhanced tutoring component attracted the most consistently negative reviews from program group students, many of whom resented having to work with tutors.
It is more complicated to define the treatment differences with respect to student ser-vices. Kingsborough is a service-rich environment and offers an extensive network of supports to both research groups. The key difference was that, presumably, the services in the Opening Doors Learning Communities were more proactive and intensive.
Early Findings An earlier report followed the research sample for two years after sample members were ran-domly assigned.8 These early findings are summarized in Table 3.2 and are discussed below. Box 3.2 explains how to read Table 3.2, as well as the tables presented in Chapter 4.
The top panel of Table 3.2 shows select outcomes from the program semester. As seen here, participation in the program was high — 85.3 percent of the program group enrolled in a learning community and were still enrolled as of the end of the add/drop period. Virtually no control group members participated in a learning community (less than 1 percent). During the program semester, program group students earned 1.2 more credits, on average, than their con-trol group counterparts and progressed through their developmental education English require-ments more quickly. At the end of the program semester, 52.3 percent of the program group had passed both English skills assessment tests, compared with 46.3 percent of the control group, yielding a statistically significant impact of 6 percentage points.
8See Scrivener et al. (2008).

21
Feature Opening Doors Learning Communities Regular College Environment
Block scheduling Cohort of up to 25 students took 3 courses together (in a group called a "learning community"); courses met one after the other.
Students took courses whenever they were offered and available, with different students in each class.
Curricular integration Curricula for the linked courses were integrated.
There was no integration across courses.
Class size Each course had a maximum of 25 students.
English courses typically had 25 students; content courses averaged 30 to 35 students.
Student development course
All Opening Doors Learning Community students took 1-credit freshman orientation class.
Freshman orientation class was encouraged but not required.
English courses All Opening Doors Learning Community students took English, with the level being based on their scores on the City University of New York skills assessment tests.
Students were encouraged, but not required, to take an English course, with the level being based on their scores on the City University of New York skills assessment tests.
Tutoring Tutors were assigned to each learning community and attended classes.
Tutors were assigned to developmental courses; otherwise, tutoring was accessed through central lab.
Counseling An Opening Doors Learning Community counselor was assigned to each learning community; each counselor was responsible for 75 to 100 students; counselors worked proactively to identify and resolve students' barriers to good attendance and academic performance.
Students could access counseling on their own initiative; caseload for freshmen counselors was roughly 500:1; counseling role was reactive.
Textbook voucher Voucher had a value of $225 during the first semester.
No voucher was offered.
Kingsborough Community College Six-Year Follow-Up Report
The Opening Doors Demonstration
Table 3.1
Features of Opening Doors Learning Communities and Regular College ServicesDuring the First Semester
SOURCE: MDRC field research data.
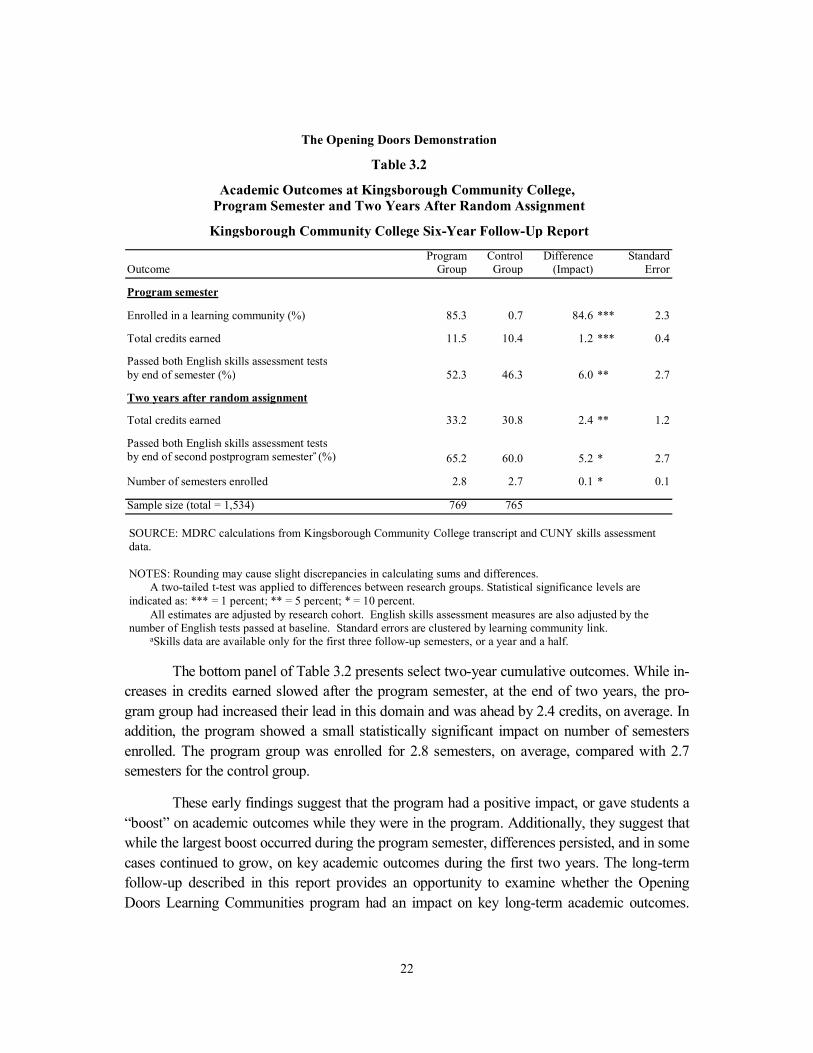
22
The bottom panel of Table 3.2 presents select two-year cumulative outcomes. While in-
creases in credits earned slowed after the program semester, at the end of two years, the pro-gram group had increased their lead in this domain and was ahead by 2.4 credits, on average. In addition, the program showed a small statistically significant impact on number of semesters enrolled. The program group was enrolled for 2.8 semesters, on average, compared with 2.7 semesters for the control group.
These early findings suggest that the program had a positive impact, or gave students a “boost” on academic outcomes while they were in the program. Additionally, they suggest that while the largest boost occurred during the program semester, differences persisted, and in some cases continued to grow, on key academic outcomes during the first two years. The long-term follow-up described in this report provides an opportunity to examine whether the Opening Doors Learning Communities program had an impact on key long-term academic outcomes.
Program Control Difference StandardOutcome Group Group (Impact) Error
Program semester
Enrolled in a learning community (%) 85.3 0.7 84.6 *** 2.3
Total credits earned 11.5 10.4 1.2 *** 0.4
Passed both English skills assessment testsby end of semester (%) 52.3 46.3 6.0 ** 2.7
Two years after random assignment
Total credits earned 33.2 30.8 2.4 ** 1.2
Passed both English skills assessment testsby end of second postprogram semestera (%) 65.2 60.0 5.2 * 2.7
Number of semesters enrolled 2.8 2.7 0.1 * 0.1
Sample size (total = 1,534) 769 765
The Opening Doors Demonstration
Table 3.2
Academic Outcomes at Kingsborough Community College,
Kingsborough Community College Six-Year Follow-Up Report
Program Semester and Two Years After Random Assignment
SOURCE: MDRC calculations from Kingsborough Community College transcript and CUNY skills assessment data.
NOTES: Rounding may cause slight discrepancies in calculating sums and differences.A two-tailed t-test was applied to differences between research groups. Statistical significance levels are
indicated as: *** = 1 percent; ** = 5 percent; * = 10 percent.All estimates are adjusted by research cohort. English skills assessment measures are also adjusted by the
number of English tests passed at baseline. Standard errors are clustered by learning community link.aSkills data are available only for the first three follow-up semesters, or a year and a half.
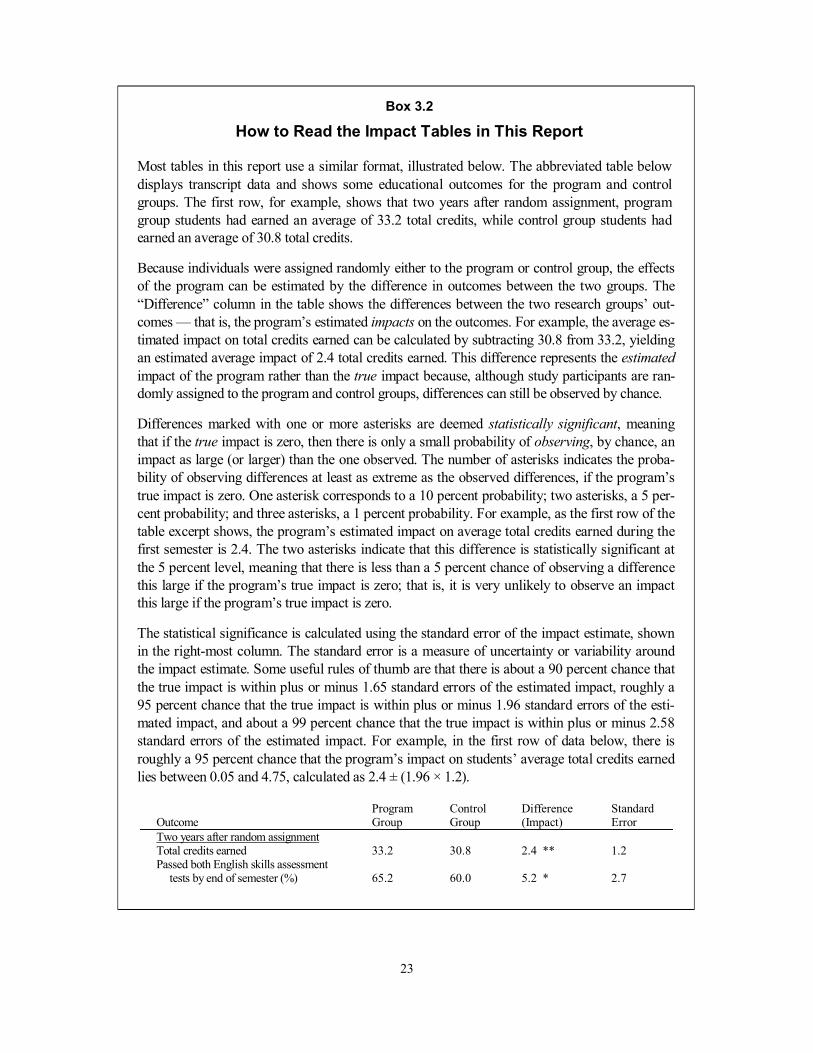
23
Box 3.2
How to Read the Impact Tables in This Report
Most tables in this report use a similar format, illustrated below. The abbreviated table below displays transcript data and shows some educational outcomes for the program and control groups. The first row, for example, shows that two years after random assignment, program group students had earned an average of 33.2 total credits, while control group students had earned an average of 30.8 total credits.
Because individuals were assigned randomly either to the program or control group, the effects of the program can be estimated by the difference in outcomes between the two groups. The “Difference” column in the table shows the differences between the two research groups’ out-comes — that is, the program’s estimated impacts on the outcomes. For example, the average es-timated impact on total credits earned can be calculated by subtracting 30.8 from 33.2, yielding an estimated average impact of 2.4 total credits earned. This difference represents the estimated impact of the program rather than the true impact because, although study participants are ran-domly assigned to the program and control groups, differences can still be observed by chance.
Differences marked with one or more asterisks are deemed statistically significant, meaning that if the true impact is zero, then there is only a small probability of observing, by chance, an impact as large (or larger) than the one observed. The number of asterisks indicates the proba-bility of observing differences at least as extreme as the observed differences, if the program’s true impact is zero. One asterisk corresponds to a 10 percent probability; two asterisks, a 5 per-cent probability; and three asterisks, a 1 percent probability. For example, as the first row of the table excerpt shows, the program’s estimated impact on average total credits earned during the first semester is 2.4. The two asterisks indicate that this difference is statistically significant at the 5 percent level, meaning that there is less than a 5 percent chance of observing a difference this large if the program’s true impact is zero; that is, it is very unlikely to observe an impact this large if the program’s true impact is zero.
The statistical significance is calculated using the standard error of the impact estimate, shown in the right-most column. The standard error is a measure of uncertainty or variability around the impact estimate. Some useful rules of thumb are that there is about a 90 percent chance that the true impact is within plus or minus 1.65 standard errors of the estimated impact, roughly a 95 percent chance that the true impact is within plus or minus 1.96 standard errors of the esti-mated impact, and about a 99 percent chance that the true impact is within plus or minus 2.58 standard errors of the estimated impact. For example, in the first row of data below, there is roughly a 95 percent chance that the program’s impact on students’ average total credits earned lies between 0.05 and 4.75, calculated as 2.4 ± (1.96 × 1.2).
Outcome Program Group
Control Group
Difference (Impact)
Standard Error
Two years after random assignment Total credits earned 33.2 30.8 2.4 ** 1.2 Passed both English skills assessment
tests by end of semester (%) 65.2 60.0 5.2 * 2.7


25
Chapter 4
Long-Term Impacts
This chapter examines whether the Opening Doors Learning Communities program at Kings-borough helped improve students’ long-term academic outcomes. The short-term impacts reviewed in Chapter 3 suggest that the program positively affected students’ academic out-comes, leading to short-term gains with the potential to improve important long-term outcomes, such as persistence, credit accumulation, and degree completion. This chapter first presents findings for the long-term impacts and then explores intermediate outcomes to further examine how the program’s initial short-term effects may have translated into long-term gains. This chapter also considers whether impacts may have differed across student subgroups.
Six years after random assignment, the key finding is that more students in the program group earned a degree than students in the control group. The estimated impact on degrees is 4.6 percentage points, a considerable impact for a one-semester program. This chapter considers a variety of analyses to help unpack this result. The next section of the chapter discusses the main findings related to earned degrees, earned credits, and persistence. The subsequent section explores the long-term impacts in greater detail and considers how the impacts evolved over time. The chapter concludes by examining how the program’s impacts may have varied for different student subgroups.
Main Findings for Academic Outcomes After Six Years Table 4.1 presents estimates for the program’s impact on key academic outcomes six years after random assignment (Box 3.2 discusses how to read Table 4.1 and other tables in this chapter).
Earned Degrees
The program substantially increased the number of students earning degrees. As shown in the top row of Table 4.1, program group students graduated from college at a rate 4.6 percentage points higher than that of students in the control group, a difference that is statistical-ly significant at the 0.1 level. Among students assigned to the program group, 35.9 percent earned a degree, compared with 31.3 percent of students assigned to the control group. Table 4.1 also shows that the overall increase in earned degrees appears to be evenly distributed over two-year degrees and four-year degrees. Program group students earned four-year degrees

26
at a rate 2.4 percentage points higher than students in the control group, and they earned two-year degrees at a rate 2.2 percentage points higher than students in the control group, although neither of these differences are statistically significant.1
Total Credits Earned
The program also increased the average number of total credits that students earned.2 Ta-ble 4.1 shows that after six years, program group students earned an estimated 4.0 total credits
1These rates refer to students’ highest degree earned. 2Total credits, also referred to as cumulative credits, include both college-level and developmental credits.
Developmental credits are associated with developmental reading, writing, and math courses, English as a (continued)
Program Control Difference StandardOutcome Group Group (Impact) Error
Earned a degreea (%) 35.9 31.3 4.6 * 2.7
Highest degree earnedb (%)Bachelor's degree or higher 11.8 9.4 2.4 1.8Associate's degree 23.3 21.1 2.2 2.2
Number of semesters enrolled 6.1 5.9 0.2 0.2
Total credits earnedc 56.3 52.3 4.0 * 2.3
Ever enrolled in a four-year institution (%) 42.4 42.0 0.4 2.7
Sample size (total = 1,534) 769 765
The Opening Doors Demonstration
Table 4.1
Key Academic Outcomes, Six Years After Random Assignment
Kingsborough Community College Six-Year Follow-Up Report
SOURCE: MDRC calculations from CUNY Institutional Research Database (IRDB) and National Student Clearinghouse data.
NOTES: Rounding may cause slight discrepancies in sums and differences.A two-tailed t-test was applied to differences between research groups. Statistical significance levels are
indicated as: *** = 1 percent; ** = 5 percent; * = 10 percent.Estimates are adjusted by research cohort. Standard errors are clustered by learning community link.Degree and enrollment measures include outcomes from any college. Credits measure refers to credits earned at
any CUNY college.aNo one with a known degree type earned a certificate, although there may have been a small number of
certificate earners whose degree type was unknown.bPercentage who earned bachelor's degree or higher and percentage who earned associate's degree do not add
up to total because degree-earners whose degree type was unknown were excluded. cTotal credits include both college-level and developmental credits.
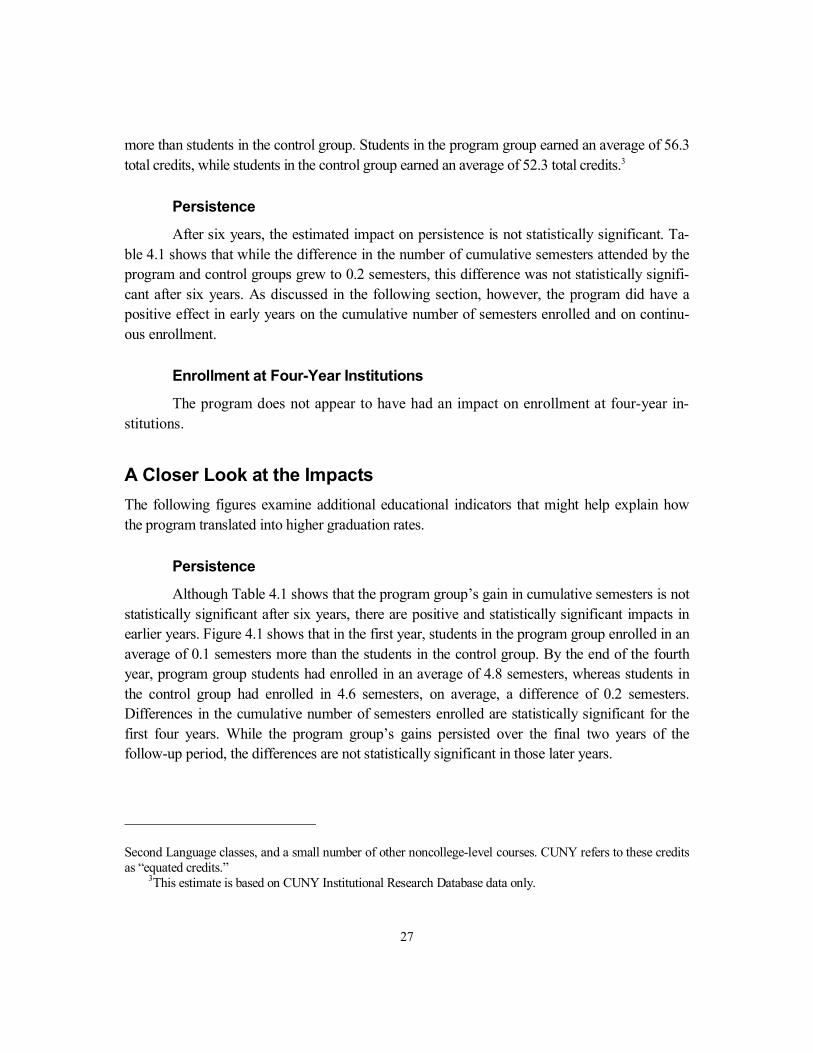
27
more than students in the control group. Students in the program group earned an average of 56.3 total credits, while students in the control group earned an average of 52.3 total credits.3
Persistence
After six years, the estimated impact on persistence is not statistically significant. Ta-ble 4.1 shows that while the difference in the number of cumulative semesters attended by the program and control groups grew to 0.2 semesters, this difference was not statistically signifi-cant after six years. As discussed in the following section, however, the program did have a positive effect in early years on the cumulative number of semesters enrolled and on continu-ous enrollment.
Enrollment at Four-Year Institutions
The program does not appear to have had an impact on enrollment at four-year in-stitutions.
A Closer Look at the Impacts The following figures examine additional educational indicators that might help explain how the program translated into higher graduation rates.
Persistence
Although Table 4.1 shows that the program group’s gain in cumulative semesters is not statistically significant after six years, there are positive and statistically significant impacts in earlier years. Figure 4.1 shows that in the first year, students in the program group enrolled in an average of 0.1 semesters more than the students in the control group. By the end of the fourth year, program group students had enrolled in an average of 4.8 semesters, whereas students in the control group had enrolled in 4.6 semesters, on average, a difference of 0.2 semesters. Differences in the cumulative number of semesters enrolled are statistically significant for the first four years. While the program group’s gains persisted over the final two years of the follow-up period, the differences are not statistically significant in those later years.
Second Language classes, and a small number of other noncollege-level courses. CUNY refers to these credits as “equated credits.”
3This estimate is based on CUNY Institutional Research Database data only.

28
The Opening Doors Demonstration
Figure 4.1
Cumulative Number of Semester Enrollments at Any College,
Kingsborough Community College Six-Year Follow-Up Report
Years One Through Six
SOURCE: MDRC calculations from CUNY Institutional Research Database (IRDB) and National Student Clearinghouse data.
NOTES: Rounding may cause slight discrepancies in sums and differences.A two-tailed t-test was applied to differences between research groups. Statistical significance levels are
indicated as: *** = 1 percent; ** = 5 percent; * = 10 percent.Estimates are adjusted by research cohort. Standard errors are clustered by learning community link.See Appendix Table C.4 for standard errors.
1.7
3.0
4.04.8
5.56.1
1.7
2.9
3.84.6
5.35.9
0.1*
0.1**
0.2*0.2*
0.2 0.2
0
2
4
6
8
10
12
Year 1 Year 2 Year 3 Year 4 Year 5 Year 6
Cum
ulat
ive
num
ber o
f sem
este
r enr
ollm
ents
Program group Control group
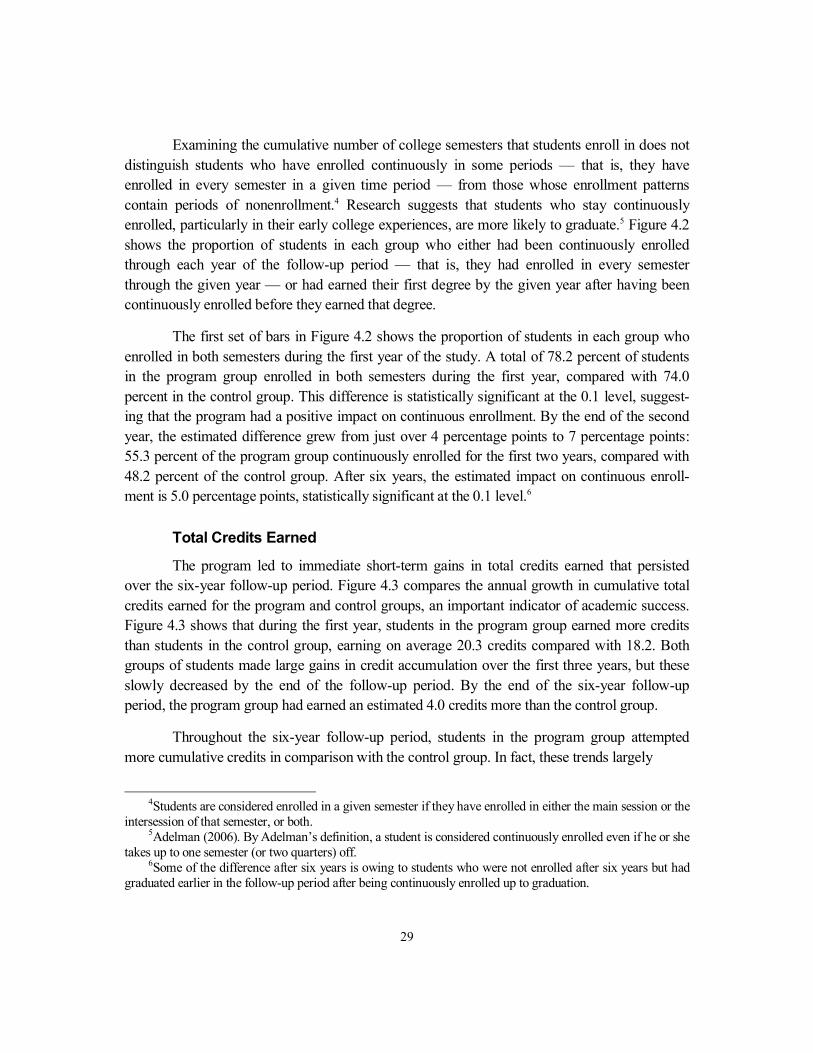
29
Examining the cumulative number of college semesters that students enroll in does not distinguish students who have enrolled continuously in some periods — that is, they have enrolled in every semester in a given time period — from those whose enrollment patterns contain periods of nonenrollment.4 Research suggests that students who stay continuously enrolled, particularly in their early college experiences, are more likely to graduate.5 Figure 4.2 shows the proportion of students in each group who either had been continuously enrolled through each year of the follow-up period — that is, they had enrolled in every semester through the given year — or had earned their first degree by the given year after having been continuously enrolled before they earned that degree.
The first set of bars in Figure 4.2 shows the proportion of students in each group who enrolled in both semesters during the first year of the study. A total of 78.2 percent of students in the program group enrolled in both semesters during the first year, compared with 74.0 percent in the control group. This difference is statistically significant at the 0.1 level, suggest-ing that the program had a positive impact on continuous enrollment. By the end of the second year, the estimated difference grew from just over 4 percentage points to 7 percentage points: 55.3 percent of the program group continuously enrolled for the first two years, compared with 48.2 percent of the control group. After six years, the estimated impact on continuous enroll-ment is 5.0 percentage points, statistically significant at the 0.1 level.6
Total Credits Earned
The program led to immediate short-term gains in total credits earned that persisted over the six-year follow-up period. Figure 4.3 compares the annual growth in cumulative total credits earned for the program and control groups, an important indicator of academic success. Figure 4.3 shows that during the first year, students in the program group earned more credits than students in the control group, earning on average 20.3 credits compared with 18.2. Both groups of students made large gains in credit accumulation over the first three years, but these slowly decreased by the end of the follow-up period. By the end of the six-year follow-up period, the program group had earned an estimated 4.0 credits more than the control group.
Throughout the six-year follow-up period, students in the program group attempted more cumulative credits in comparison with the control group. In fact, these trends largely
4Students are considered enrolled in a given semester if they have enrolled in either the main session or the
intersession of that semester, or both. 5Adelman (2006). By Adelman’s definition, a student is considered continuously enrolled even if he or she
takes up to one semester (or two quarters) off. 6Some of the difference after six years is owing to students who were not enrolled after six years but had
graduated earlier in the follow-up period after being continuously enrolled up to graduation.

30
The Opening Doors Demonstration
Figure 4.2
Continuously Enrolled at Any College, Years One Through Six
Kingsborough Community College Six-Year Follow-Up Report
78.2
55.3
39.3
33.8 32.0 30.4
74.0
48.2
35.2
29.026.7 25.4
4.2*
7.0**
4.14.8* 5.3** 5.0*
0
10
20
30
40
50
60
70
80
90
100
Year 1 Year 2 Year 3 Year 4 Year 5 Year 6
Con
tinuo
usly
enr
olle
d (%
)
Program group Control group
SOURCE: MDRC calculations from CUNY Institutional Research Database (IRDB) and National Student Clearinghouse data.
NOTES: Rounding may cause slight discrepancies in sums and differences.A two-tailed t-test was applied to differences between research groups. Statistical significance levels are
indicated as: *** = 1 percent; ** = 5 percent; * = 10 percent.Estimates are adjusted by research cohort. Standard errors are clustered by learning community link.See Appendix Table C.5 for standard errors.
31
parallel the differences in accumulated credits, suggesting that an important aspect of the program’s impact may be its effect on credits attempted (see Appendix Table C.1).
Intersessions
The program had a positive impact on student enrollment in intersessions and credit ac-cumulation through intersessions. At Kingsborough, all students can enroll in courses during six-week intersessions. Most students who enrolled full time during a main fall or spring session — regardless of their assignment to the program or control groups — could enroll in the subsequent intersession at no additional cost. Every year, there are two such intersessions: one
Kingsborough Community College Six-Year Follow-Up Report
Cumulative Credits Earned at Any CUNY College,
Figure 4.3
Years One Through Six
The Opening Doors Demonstration
20.3
33.9
42.0
48.1
52.856.3
18.2
31.1
39.4
44.849.0
52.3
2.1***
2.8**
2.6*
3.4*
3.7*4.0*
0
10
20
30
40
50
60
Year 1 Year 2 Year 3 Year 4 Year 5 Year 6
Cum
ulat
ive
cred
its e
arne
d
Program group Control groupSOURCE: MDRC calculations from CUNY Institutional Research Database (IRDB).
NOTES: Rounding may cause slight discrepancies in sums and differences.Cumulative credits include both college-level and developmental credits.A two-tailed t-test was applied to differences between research groups. Statistical significance levels are
indicated as: *** = 1 percent; ** = 5 percent; * = 10 percent.Estimates are adjusted by research cohort. Standard errors are clustered by learning community link.See Appendix Table C.1 for standard errors.

32
in the winter after the main session in the fall and before the main session in the subsequent spring, and one in the summer after the main session in the spring and before the main session in the subsequent fall. Research also suggests that progress during these types of intersessions may be an important factor in students’ success. 7 Students in the Opening Doors Learning Communities were encouraged to enroll in the intersession following the program session, and they received a textbook voucher if they did enroll, potentially making it easier for them to attend classes by reducing the costs (see Box 3.1 for more details on intersessions).
Figure 4.4 shows the average cumulative number of intersessions in which program and control group students had enrolled as of the end of each year of the follow-up period. On average, program group students enrolled in more intersessions compared with control group students throughout the study. In the first year of the follow-up period, on average, students in the program group enrolled in 1.1 out of the two available intersessions, while students in the control group enrolled in 0.9 intersessions. The estimated impact of 0.1 intersessions is statisti-cally significant at the 0.01 level.8 After six years, the estimated impact grew to 0.3 interses-sions.
Figure 4.5 shows that program group students also earned more credits on average dur-ing intersessions. It shows that during the first year, students in the program group averaged an estimated 0.5 credits more than students in the control group during intersessions. The figure also shows that these gains continued throughout the follow-up period, by the end of which students in the Opening Doors Learning Communities had earned an average of 10.3 credits through courses during intersessions, compared with an average of 9.2 credits for students in the control group.
Earned Degrees
Program group students earned more degrees in early years of the follow-up period, but these gains are not statistically significant until the sixth year. Figure 4.6 shows that these gains are associated with an impact on earned degrees, but the figure also demonstrates the im-portance of long-term follow-up: The positive impact is not statistically significant until after the sixth year of follow-up. With a shorter follow-up period, there would be less evidence to support the positive impact on degree completion. The statistically significant finding in the
7Adelman (2006). 8Estimates are rounded to the nearest 0.1.

33
sixth year — and the consistently increasing pattern of impacts over the full follow-up period — provides strong evidence that program group students earned degrees at a higher rate than control group students.
Subgroup Analyses The remainder of this chapter examines whether the program’s impacts may have varied across different student subgroups. Several plausible reasons may explain the findings described below,
The Opening Doors Demonstration
Figure 4.4
Cumulative Number of Intersession Enrollments at Any CUNY College,Years One Through Six
Kingsborough Community College Six-Year Follow-Up Report
1.11.8 2.1 2.4 2.5 2.7
0.91.6 2.0 2.1 2.3 2.40.1***
0.2*** 0.2** 0.3*** 0.3*** 0.3***
0
2
4
6
8
10
12
Year 1 Year 2 Year 3 Year 4 Year 5 Year 6
Cum
ulat
ive
num
ber o
f int
erse
ssio
ns e
nrol
led
Program group Control group
SOURCE: MDRC calculations from CUNY Institutional Research Database (IRDB).
NOTES: Rounding may cause slight discrepancies in sums and differences.Cumulative credits include both college-level and developmental credits.A two-tailed t-test was applied to differences between research groups. Statistical significance levels are
indicated as: *** = 1 percent; ** = 5 percent; * = 10 percent.Estimates are adjusted by research cohort. Standard errors are clustered by learning community link.See Appendix Table C.6 for standard errors.
34
and this evaluation cannot fully explain the observed variation in impacts. The nature of these different impacts, moreover, was not fully anticipated in advance of the study, although some of the subgroups were pre-specified in advance of the evaluation. Consequently, these subgroup analyses should be interpreted cautiously. They do, however, represent interesting and provocative findings, with potentially important implications for both practitioners and researchers.
The Opening Doors Demonstration
Figure 4.5
Cumulative Intersession Credits Earned at Any CUNY College,Years One Through Six
Kingsborough Community College Six-Year Follow-Up Report
4.26.9 8.2 9.2 9.8 10.3
3.76.3 7.7 8.3 8.8 9.20.5***
0.6* 0.6 0.9** 1.0** 1.0**
0
10
20
30
40
50
60
Year 1 Year 2 Year 3 Year 4 Year 5 Year 6
Cum
ulat
ive
inte
rses
sion
cre
dits
ear
ned
Program group Control group
SOURCE: MDRC calculations from CUNY Institutional Research Database (IRDB).
NOTES: Rounding may cause slight discrepancies in sums and differences.Cumulative credits include both college-level and developmental credits.A two-tailed t-test was applied to differences between research groups. Statistical significance levels are
indicated as: *** = 1 percent; ** = 5 percent; * = 10 percent.Estimates are adjusted by research cohort. Standard errors are clustered by learning community link.See Appendix Table C.7 for standard errors.

35
English Placement Level
As noted in Chapter 3, results from English assessment tests — administered before random assignment — determined the learning communities that were available to incoming students. Students who passed both tests were placed in freshman English; students who passed only one test (generally the reading test) were placed into the highest level of developmental English; and students who failed both tests were placed into one of the two lowest levels of
Kingsborough Community College Six-Year Follow-Up Report
The Opening Doors Demonstration
Figure 4.6
Earned a Degree at Any College, Years One Through Six
6.1
20.226.5
31.835.9
5.4
16.9
23.728.1
31.3
0.0 0.8
3.3 2.8
3.7 4.6*
0
10
20
30
40
50
60
70
80
90
100
Year 1 Year 2 Year 3 Year 4 Year 5 Year 6
Earn
ed a
deg
ree
(%)
Program group Control group
SOURCE: MDRC calculations from CUNY Institutional Research Database (IRDB) and National Student Clearinghouse data.
NOTES: Rounding may cause slight discrepancies in sums and differences.A two-tailed t-test was applied to differences between research groups. Statistical significance levels are
indicated as: *** = 1 percent; ** = 5 percent; * = 10 percent.Estimates are adjusted by research cohort. Standard errors are clustered by learning community link.No one with a known degree type earned a certificate, although there may have been a small number of
certificate earners whose degree type was unknown.See Appendix Table C.8 for standard errors.
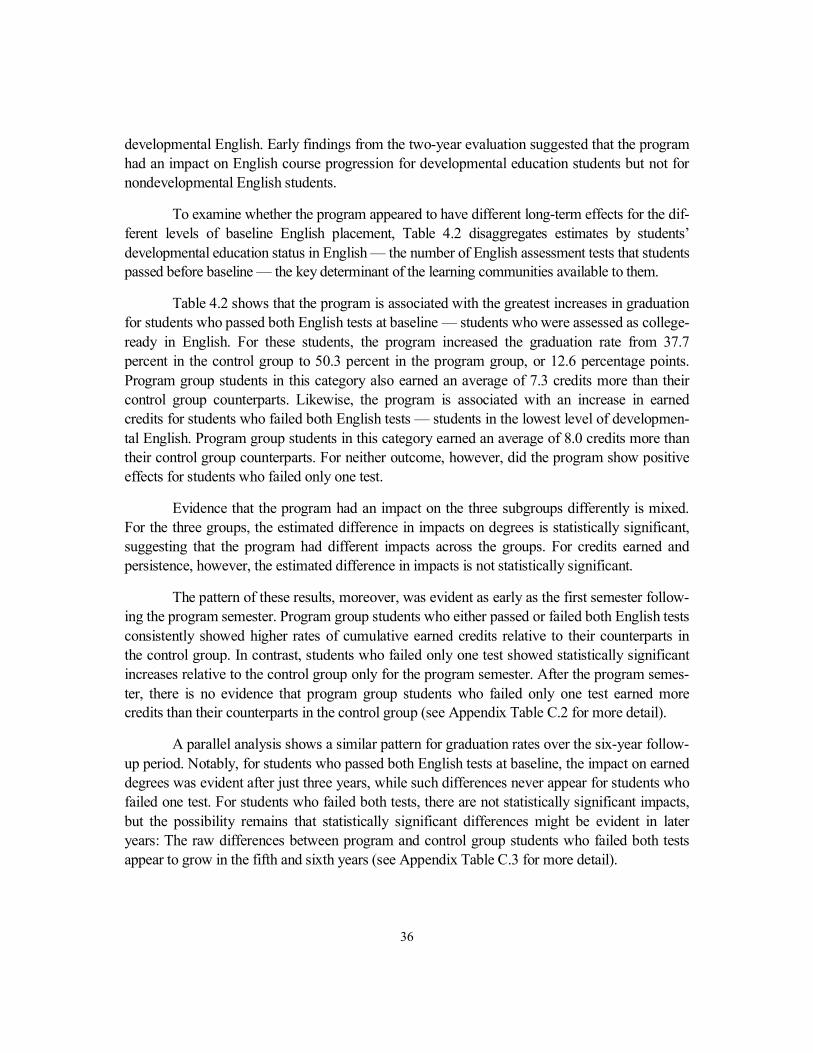
36
developmental English. Early findings from the two-year evaluation suggested that the program had an impact on English course progression for developmental education students but not for nondevelopmental English students.
To examine whether the program appeared to have different long-term effects for the dif-ferent levels of baseline English placement, Table 4.2 disaggregates estimates by students’ developmental education status in English — the number of English assessment tests that students passed before baseline — the key determinant of the learning communities available to them.
Table 4.2 shows that the program is associated with the greatest increases in graduation for students who passed both English tests at baseline — students who were assessed as college-ready in English. For these students, the program increased the graduation rate from 37.7 percent in the control group to 50.3 percent in the program group, or 12.6 percentage points. Program group students in this category also earned an average of 7.3 credits more than their control group counterparts. Likewise, the program is associated with an increase in earned credits for students who failed both English tests — students in the lowest level of developmen-tal English. Program group students in this category earned an average of 8.0 credits more than their control group counterparts. For neither outcome, however, did the program show positive effects for students who failed only one test.
Evidence that the program had an impact on the three subgroups differently is mixed. For the three groups, the estimated difference in impacts on degrees is statistically significant, suggesting that the program had different impacts across the groups. For credits earned and persistence, however, the estimated difference in impacts is not statistically significant.
The pattern of these results, moreover, was evident as early as the first semester follow-ing the program semester. Program group students who either passed or failed both English tests consistently showed higher rates of cumulative earned credits relative to their counterparts in the control group. In contrast, students who failed only one test showed statistically significant increases relative to the control group only for the program semester. After the program semes-ter, there is no evidence that program group students who failed only one test earned more credits than their counterparts in the control group (see Appendix Table C.2 for more detail).
A parallel analysis shows a similar pattern for graduation rates over the six-year follow-up period. Notably, for students who passed both English tests at baseline, the impact on earned degrees was evident after just three years, while such differences never appear for students who failed one test. For students who failed both tests, there are not statistically significant impacts, but the possibility remains that statistically significant differences might be evident in later years: The raw differences between program and control group students who failed both tests appear to grow in the fifth and sixth years (see Appendix Table C.3 for more detail).
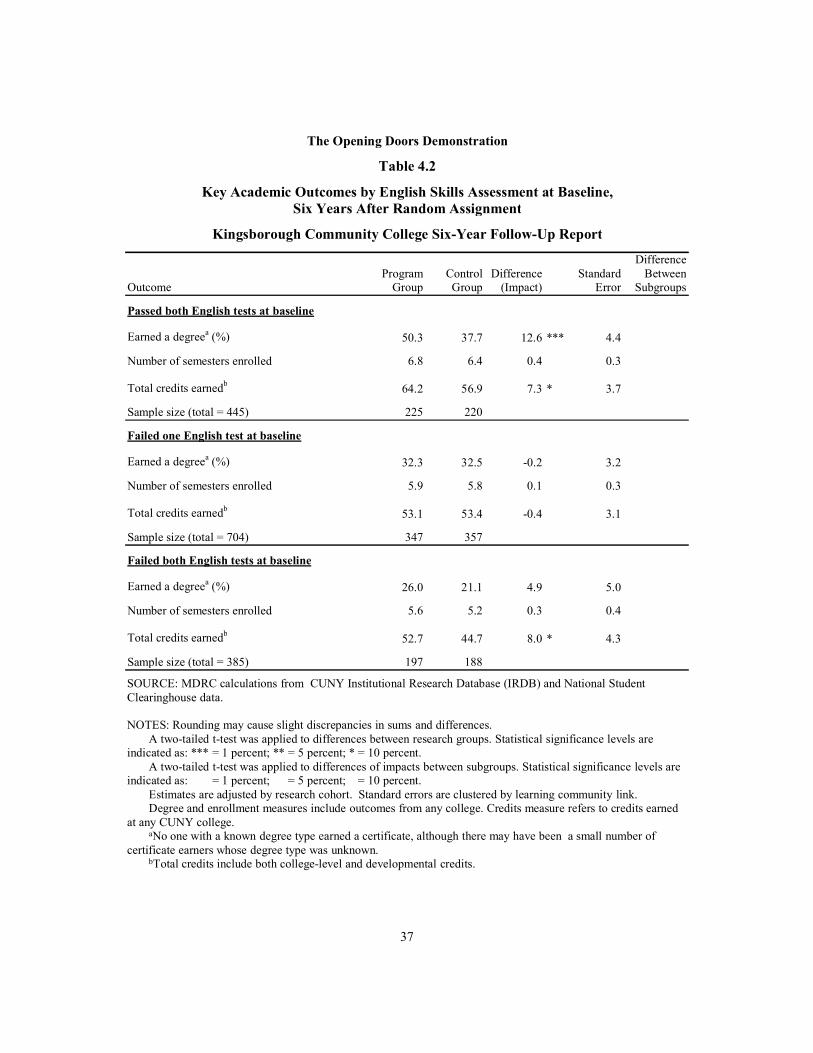
37
DifferenceProgram Control Difference Standard Between
Outcome Group Group (Impact) Error Subgroups
Passed both English tests at baseline
Earned a degreea (%) 50.3 37.7 12.6 *** 4.4 †
Number of semesters enrolled 6.8 6.4 0.4 0.3
Total credits earnedb 64.2 56.9 7.3 * 3.7
Sample size (total = 445) 225 220
Failed one English test at baseline
Earned a degreea (%) 32.3 32.5 -0.2 3.2 †
Number of semesters enrolled 5.9 5.8 0.1 0.3
Total credits earnedb 53.1 53.4 -0.4 3.1
Sample size (total = 704) 347 357
Failed both English tests at baseline
Earned a degreea (%) 26.0 21.1 4.9 5.0 †
Number of semesters enrolled 5.6 5.2 0.3 0.4
Total credits earnedb 52.7 44.7 8.0 * 4.3
Sample size (total = 385) 197 188
The Opening Doors Demonstration
Table 4.2
Key Academic Outcomes by English Skills Assessment at Baseline,
Kingsborough Community College Six-Year Follow-Up Report
Six Years After Random Assignment
SOURCE: MDRC calculations from CUNY Institutional Research Database (IRDB) and National Student Clearinghouse data.
NOTES: Rounding may cause slight discrepancies in sums and differences.A two-tailed t-test was applied to differences between research groups. Statistical significance levels are
indicated as: *** = 1 percent; ** = 5 percent; * = 10 percent.A two-tailed t-test was applied to differences of impacts between subgroups. Statistical significance levels are
indicated as: ††† = 1 percent; †† = 5 percent; † = 10 percent.Estimates are adjusted by research cohort. Standard errors are clustered by learning community link.Degree and enrollment measures include outcomes from any college. Credits measure refers to credits earned
at any CUNY college.aNo one with a known degree type earned a certificate, although there may have been a small number of
certificate earners whose degree type was unknown.bTotal credits include both college-level and developmental credits.
38
Together, these analyses suggest positive program impacts for students who either passed both tests or failed both tests, but there is no evidence that the program improved outcomes for students who passed only one test. This pattern is somewhat unexpected: The least-prepared students and the most-prepared students both seem to be positively affected by the program; in contrast, moderately prepared students appear unaffected.9
One possible explanation for the results reported here is that the variation is being driv-en by differences in implementation of the Opening Doors Learning Communities model. A faculty survey conducted for only one cohort suggests that there was less collaboration among some faculty teaching learning communities links for students who failed one test during that semester. A small student survey conducted for only one cohort also suggests potentially different experiences for these students, although a much larger student survey conducted one year after random assignment does not.10 Another possible explanation is that the students who failed only one test differed in important ways compared with the other groups of students, in addition to their baseline English skills.
Ultimately, these data are too limited to provide conclusive evidence. This evaluation cannot determine whether the pattern of results in Table 4.2 stems from differences in program implementation for the three subgroups, differences in students’ characteristics or academic preparation, chance, or other factors.
Fall Versus Spring Cohorts
Another potentially important distinction relates to the semester in which students first enroll in college. First-time students at Kingsborough can begin in either the fall or spring semesters. The students followed in this study entered the Opening Doors Learning Communi-ties evaluation in whichever semester they first enrolled at Kingsborough. The characteristics of students who first enroll in the spring may fundamentally differ from those who first enroll in the fall. In the Opening Doors Learning Communities sample, for example, the spring cohorts contained a higher proportion of males, and they may also differ on characteristics that
9Existing studies are mixed with respect to how well students with different levels of academic need are served by developmental education more generally. Using data from Tennessee, Boatman and Long (2010) argue that developmental education can sometimes have a positive impact on students with the greatest needs but has primarily negative impacts on developmental education students who are the most prepared. Martorell and McFarlin (2007) use data from Texas and also argue that developmental education may have a negative impact on better-prepared developmental education students. In contrast, Calcagno and Long (2008) analyze student outcome data from Florida and suggest that for developmental education students who are better prepared, developmental education has positive short-term effects, but not necessarily long-term impacts. None of these studies, however, uses a randomized controlled design, so it is possible that other factors influence the conclusions.
10See Scrivener et al. (2008) for more information on these data sources.

39
are unobservable. Therefore, they may simply be more or less likely to drop out of school, and they may be more or less likely to be affected by the Opening Doors Learning Communities program. The program might also provide extra support that helped students persist over the summer intersession — where the period between semesters is longest and may lead to lower rates of persistence — and re-enroll in the fall. In fact, nonexperimental research on learning communities suggests that they may be associated with better outcomes in spring terms than in fall terms.11 It is unclear, however, whether to expect the Opening Doors Learning Communi-ties program to have a different impact on students who first enroll in college in one semester or the other.
Table 4.3 shows estimates for the primary outcomes grouped by whether students first enrolled at Kingsborough — and also the Opening Doors Learning Communities evaluation — in the fall or spring semesters.
The outcomes for the control groups in Table 4.3 do show that in the absence of the program, students who enroll in the fall generally earn more degrees, enroll in more semesters, and earn more total credits compared with students who enroll in the spring. In contrast to this pattern, however, the table suggests that the program had a greater impact on persistence for students who first enrolled in spring semesters, compared with those who first enrolled in fall semesters. For the total number of semesters enrolled in any college, the estimated impact on students who first enrolled in the spring is about 0.7 semesters on average, whereas in the fall, the estimated impact on this measure is not statistically significant. The difference between these two estimates, moreover, is statistically significant, suggesting that the program had different impacts across the fall and spring semesters.
The program is also associated with greater increases in earned credits and earned de-grees for students who first enrolled in the spring. Program group students who first enrolled in the spring had a rate of degree completion 9.4 percentage points higher than students in the control group and also earned an average of 8.0 total credits more than their counterparts in the control group. In contrast, program group students in the fall did not show gains over their counterparts in the control group on these measures. Although the estimated impacts for the spring cohorts alone are statistically significant for both earned credits and earned degrees, the estimated difference in impacts between fall and spring cohorts is not statistically significant.
11Tinto (1997).

40
Other Subgroups
In addition to the analyses described above, analyses of subgroups associated with race and ethnicity, gender, parental education, and degree-seeking status did not show evidence of statistically significant differential impacts.
DifferenceProgram Control Difference Standard Between
Outcome Group Group (Impact) Error Subgroups
Fall cohorts (fall 2003, fall 2004)
Earned a degreea (%) 34.9 33.5 1.5 3.7
Number of semesters enrolled 6.1 6.1 0.0 0.2 †
Total credits earnedb 57.7 56.4 1.3 3.0
Sample size (total = 918) 458 460
Spring cohorts (spring 2004, spring 2005)
Earned a degreea (%) 37.3 27.9 9.4 ** 3.7
Number of semesters enrolled 6.1 5.4 0.7 ** 0.3 †
Total credits earnedb 54.0 46.1 8.0 ** 3.4
Sample size (total = 616) 311 305
The Opening Doors Demonstration
Table 4.3
Key Academic Outcomes by Fall Versus Spring Cohort,
Kingsborough Community College Six-Year Follow-Up Report
Six Years After Random Assignment
SOURCE: MDRC calculations from CUNY Institutional Research Database (IRDB) and National Student Clearinghouse data.
NOTES: Rounding may cause slight discrepancies in sums and differences.A two-tailed t-test was applied to differences between research groups. Statistical significance levels are
indicated as: *** = 1 percent; ** = 5 percent; * = 10 percent.A two-tailed t-test was applied to differences of impacts between subgroups. Statistical significance levels are
indicated as: ††† = 1 percent; †† = 5 percent; † = 10 percent.Standard errors are clustered by learning community link.Degree and enrollment measures include outcomes from any college. Credits measure refers to credits earned
at any CUNY college.aNo one with a known degree type earned a certificate, although there may have been a small number of
certificate earners whose degree type was unknown.bTotal credits include both college-level and developmental credits.
41
Summary Overall, the program increased the number of students earning degrees and students’ total earned credits. Notably, the impact on earned degrees would have been less convincing if the evaluation had not collected data on students for the full six-year follow-up period. The program also increased continuous enrollment and credits earned through intersessions. The effect on degrees was most evident for students who placed into college-level English, although there is evidence that the program also positively affected long-term outcomes for students with the greatest developmental needs in English. There is also some evidence that the program had a positive impact on students who entered college in the spring semester but not those who entered in the fall semester. This evaluation, however, cannot determine the source of these differences.

43
Chapter 5
Cost-Effectiveness of Learning Communities at Kingsborough
This chapter is designed to address questions regarding the decision to invest in a program similar to the Opening Doors Learning Communities program at Kingsborough. Key questions include: How much did it cost to operate the Opening Doors Learning Communities program? Which components of the program were most and least expensive? How did the cost of the program compare with the cost of the usual college services? What is the effect of class size on the cost of the program? And, was the program cost-effective? Specifically, did the additional resources the college invested in the program produce more desired outcomes per dollar than the usual college services?
The key findings are:
• During the program semester, the Opening Doors Learning Communities program at Kingsborough cost just under $1,600 per program group member to operate. The most expensive components of the Opening Doors Learning Communities program during the program semester were increased instruc-tional costs (about $770 per program group member) and increased program support and student services (about $490 per program group member).
• When the additional costs of educating students are considered, over the six years of follow-up, the college invested nearly $3,600 more per program group member than it did per control group member.
• When program costs are compared with program impacts on degrees earned, the program appears less expensive than the usual college services without the program. Specifically, the cost per degree earned for the program group is $2,480 (2.6 percent) less costly than the cost per degree earned for the con-trol group.
Methodology
This chapter estimates the cost-effectiveness of the Opening Doors Learning Communities program at Kingsborough that took place from September 2003 to August 2005. All costs are considered from the perspective of society and are displayed in real 2011 dollars. These costs are estimated using college financial information, but since all funds (such as tuition paid by students, subsidies from various governments, and private donations) are funneled through the
44
college, this approach provides a good estimate of the financial investment of society in these community college students. The analysis aims to exclude costs that are not part of the “steady state” of operation of the program; as a result, start-up and research costs have been excluded. For purposes of presentation, all costs have been classified as either direct costs, base costs, or indirect costs. Please see Box 5.1 for definitions of terms used throughout this chapter.
Direct Cost
The direct cost of the program accounts for the resources required to operate the program during the period of program operation. In this analysis, the period of program operation was the first semester. Outlined in Table 5.1, these costs fall into the following categories:1
• Additional instructional costs: Instructional costs beyond the cost of in-struction for ordinary Kingsborough classes fall into this category. This in-cludes costs of faculty meetings, preparation time to coordinate linked clas-ses, and the cost of curriculum development. It also accounts for the additional cost of instruction owing to smaller class sizes and stipends paid to teachers to establish learning communities.2
• Program support and student services: Case management and tutoring fall into this category.
• Book vouchers: $150 per student for course books during the main session of the program semester and $75 per student to cover books for the following six-week intersession. Also covers the cost of books for tutors.3
1The direct costs outlined in Table 5.1 are based on program budget data combined with the number and
size of learning communities during the four program semesters from fall 2003 to spring 2005. Costs are based on a budget that planned for a program serving 250 students in 10 sections. In order to get an accurate estimate of cost for the appropriate period of operation, each program component was categorized as a fixed cost, a marginal cost based on the number of sections, or a marginal cost based on the number of students. This allowed for a more accurate estimation of program costs based on the actual number of sections and students in the selected semester. This approach has been confirmed with Kingsborough staff. Similarly, Kingsborough staff have confirmed that all start-up and research costs have been identified and excluded from this analysis.
2See Appendix E for an additional discussion of how class size can affect the cost of learning communities. 3Administrators at Kingsborough did not consider the book voucher to be part of the program’s steady
state of operation, since its main purpose was to encourage participation in the research study. Indeed, Kingsborough no longer provides book vouchers as part of its learning community programs. However, since there is no way to disentangle the effect of the book voucher from the overall effect of the program, its cost remains in this analysis.

45
• Meetings and events during intersession: This covers both faculty meet-
ings and student events during the intersession following the learning com-munity.4
4For full-time students, this module was offered at no additional cost; however, the cost to the college is
captured in the cost of credits attempted, since students who participated in the module were attempting credits.
Box 5.1
Key Cost Terms
Direct cost: the cost directly associated with providing program services during the period of program operation, or the cost of the program’s components.
Base cost: the cost of the usual college services in the absence of the program. Base cost = cost per credit x number of credits attempted by the control group. The cost per credit is an estimate of the average amount of resources expended by the college to provide one credit’s worth of instructional activity; it is calculated by dividing the college’s annual operating budget by the number of credits attempted at the college during the year of interest.
Indirect cost: the cost resulting from a behavioral change brought about by the program, such as additional credits attempted by program group members; such costs can extend beyond the period of program operation. Indirect cost of the program = cost per credit x additional credits attempted by program group members.
Program group cost: the total cost of educating program group members over all six years of follow-up. Program group cost = direct cost + base cost + indirect cost. Can be divided by the number of program group members to get the cost per program group member.
Control group cost: The total cost of educating control group members over all six years of follow-up. Control group cost = base cost. Can be divided by the number of control group members to get the cost per control group member.
Net cost: the cost difference between program group members and control group members. Net cost = program group cost – control group cost.
Cost-effectiveness analysis: an evaluation in which the net costs of alternative interven-tions are expressed as the cost per unit of a desired outcome. In this analysis, cost-effectiveness is presented for cost per degree earned.
Cost per degree earned: the amount invested in the research group of interest per degree earned by that research group. For the program group, cost per degree earned = program group cost ÷ number of degrees earned by program group members.
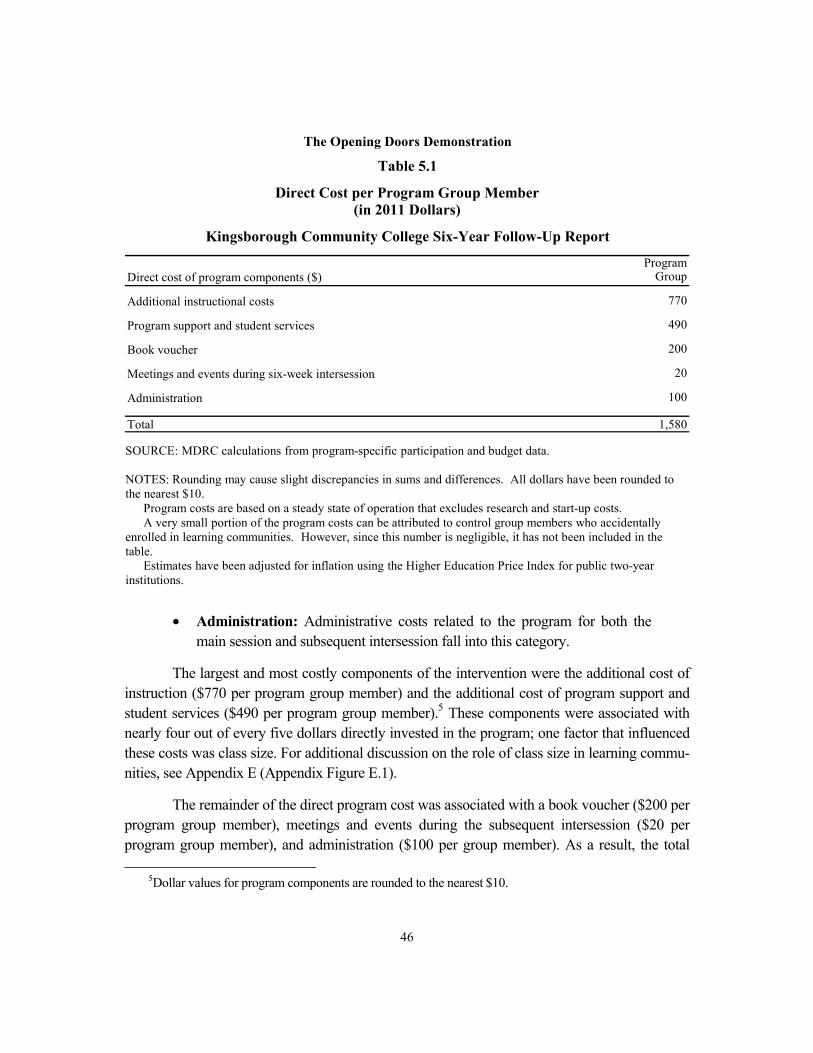
46
• Administration: Administrative costs related to the program for both the
main session and subsequent intersession fall into this category.
The largest and most costly components of the intervention were the additional cost of instruction ($770 per program group member) and the additional cost of program support and student services ($490 per program group member).5 These components were associated with nearly four out of every five dollars directly invested in the program; one factor that influenced these costs was class size. For additional discussion on the role of class size in learning commu-nities, see Appendix E (Appendix Figure E.1).
The remainder of the direct program cost was associated with a book voucher ($200 per program group member), meetings and events during the subsequent intersession ($20 per program group member), and administration ($100 per group member). As a result, the total
5Dollar values for program components are rounded to the nearest $10.
ProgramDirect cost of program components ($) Group
Additional instructional costs 770
Program support and student services 490
Book voucher 200
Meetings and events during six-week intersession 20
Administration 100
Total 1,580
The Opening Doors Demonstration
Table 5.1
Direct Cost per Program Group Member
Kingsborough Community College Six-Year Follow-Up Report
(in 2011 Dollars)
SOURCE: MDRC calculations from program-specific participation and budget data.
NOTES: Rounding may cause slight discrepancies in sums and differences. All dollars have been rounded to the nearest $10.
Program costs are based on a steady state of operation that excludes research and start-up costs.A very small portion of the program costs can be attributed to control group members who accidentally
enrolled in learning communities. However, since this number is negligible, it has not been included in the table.
Estimates have been adjusted for inflation using the Higher Education Price Index for public two-year institutions.
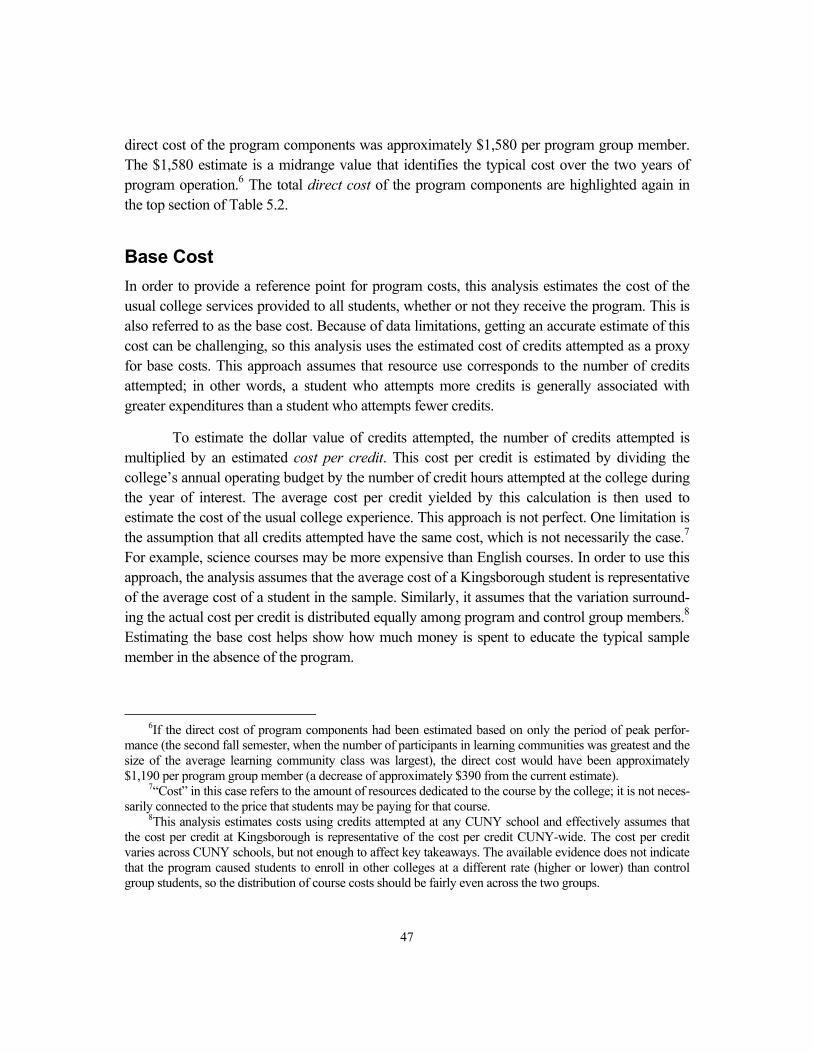
47
direct cost of the program components was approximately $1,580 per program group member. The $1,580 estimate is a midrange value that identifies the typical cost over the two years of program operation.6 The total direct cost of the program components are highlighted again in the top section of Table 5.2.
Base Cost
In order to provide a reference point for program costs, this analysis estimates the cost of the usual college services provided to all students, whether or not they receive the program. This is also referred to as the base cost. Because of data limitations, getting an accurate estimate of this cost can be challenging, so this analysis uses the estimated cost of credits attempted as a proxy for base costs. This approach assumes that resource use corresponds to the number of credits attempted; in other words, a student who attempts more credits is generally associated with greater expenditures than a student who attempts fewer credits.
To estimate the dollar value of credits attempted, the number of credits attempted is multiplied by an estimated cost per credit. This cost per credit is estimated by dividing the college’s annual operating budget by the number of credit hours attempted at the college during the year of interest. The average cost per credit yielded by this calculation is then used to estimate the cost of the usual college experience. This approach is not perfect. One limitation is the assumption that all credits attempted have the same cost, which is not necessarily the case.7 For example, science courses may be more expensive than English courses. In order to use this approach, the analysis assumes that the average cost of a Kingsborough student is representative of the average cost of a student in the sample. Similarly, it assumes that the variation surround-ing the actual cost per credit is distributed equally among program and control group members.8 Estimating the base cost helps show how much money is spent to educate the typical sample member in the absence of the program.
6If the direct cost of program components had been estimated based on only the period of peak perfor-
mance (the second fall semester, when the number of participants in learning communities was greatest and the size of the average learning community class was largest), the direct cost would have been approximately $1,190 per program group member (a decrease of approximately $390 from the current estimate).
7“Cost” in this case refers to the amount of resources dedicated to the course by the college; it is not neces-sarily connected to the price that students may be paying for that course.
8This analysis estimates costs using credits attempted at any CUNY school and effectively assumes that the cost per credit at Kingsborough is representative of the cost per credit CUNY-wide. The cost per credit varies across CUNY schools, but not enough to affect key takeaways. The available evidence does not indicate that the program caused students to enroll in other colleges at a different rate (higher or lower) than control group students, so the distribution of course costs should be fairly even across the two groups.

48
The middle portion of Table 5.2 presents the base cost of credits attempted at any City
University of New York (CUNY) college. Control group members attempted an average of 73.0 credits over the six years of follow-up, for a total cost of credits attempted (credits attempt-ed multiplied by cost per credit) of approximately $30,410 per group member.9 This represents the cost of the typical college experience for students not enrolled in the program.
Indirect Cost
Indirect cost describes the cost associated with behavioral changes that are a result of the program. Tracking the indirect cost helps determine whether the intervention had any externali-ties that affected costs in the long term. The bottom portion of the Table 5.2 shows the indirect cost of the program or the cost associated with program group members attempting more credits than control group members. Program group members attempted more credits than their control group counterparts in all six years of follow-up. On average, each program group member
9See “Calculating the Value of Credits Attempted” in Appendix E for additional detail.
Program Control DifferenceFeature ($) Group Group (Net)
Direct cost - cost of primary program components 1,580 0 1,580
Base cost - cost of credits attempted in the absence of the program 30,410 30,410 0
Indirect cost - cost of additional credits attempted due to the program 2,000 0 2,000
Total 33,990 30,410 3,580
The Opening Doors Demonstration
Table 5.2
Net Cost of Education per Sample Member at Any CUNY College, Six Years After Random Assignment
Kingsborough Community College Six-Year Follow-Up Report
(in 2011 Dollars)
SOURCE: MDRC calculations from program-specific participation and budget data, Kingsborough financial and enrollment data from IPEDS, and CUNY Institutional Research Database (IRDB) data.
NOTES: Tests of statistical significance were not performed.Rounding may cause slight discrepancies in sums and differences. Values have been rounded to the nearest
$10. Program costs are based on a steady state of operation that excludes research and start-up costs.Credits attempted include all college-level and developmental credits attempted at any CUNY college. Estimates reflect discounting and adjustment for inflation.

49
attempted 77.9 credits by the end of the follow up period; this is 4.8 credits more than the average control group member (credit attempts by year are displayed in Appendix Table C.1). Multiplying the additional 4.8 credits attempted by the corresponding cost per credit gives an indirect cost of the program of $2,000 per program group member.10
Net Cost
The net cost is defined as the difference between the program group cost and the control group cost. The costs of each group are presented in the total line of Table 5.2. Adding the direct cost, base cost, and indirect cost shows that the total cost of educating the average program group member over six years was about $33,990, while the total cost of educating the average control group member was about $30,410. Over the six years of follow-up, the net cost is around $3,580 per program group member.
Cost-Effectiveness Analysis
A cost-effectiveness analysis expresses the costs of alternative interventions as the cost per unit of a desired outcome. In this analysis, cost-effectiveness considers the cost per degree earned. Table 5.3 summarizes the results.
The top row of Table 5.3 presents the total cost per group member (these values were described in the preceding “Net Cost” section of this chapter). The cost per program group member ($33,990) is $3,580 more than the cost per control group member ($30,410). The second row shows the percentage of program and control group members who earned a degree. Specifically, 35.9 percent of program group members earned a degree, while 31.3 percent of control group members earned a degree (this result was highlighted in Table 4.1). The bottom row presents the cost per degree earned for each group: $94,680 per degree for the program group and $97,160 per degree for the control group. Figure 5.1 shows how these values are calculated; specifically, it looks at the total cost of each group and the total number of degree earners in each group in order to estimate the cost per degree earned.11
10See “Value of Revenue from Attempting More Credits” in Appendix E for additional detail. 11For a more detailed explanation of this calculation, see “Calculation of Cost per Degree Earned” in Ap-
pendix E.
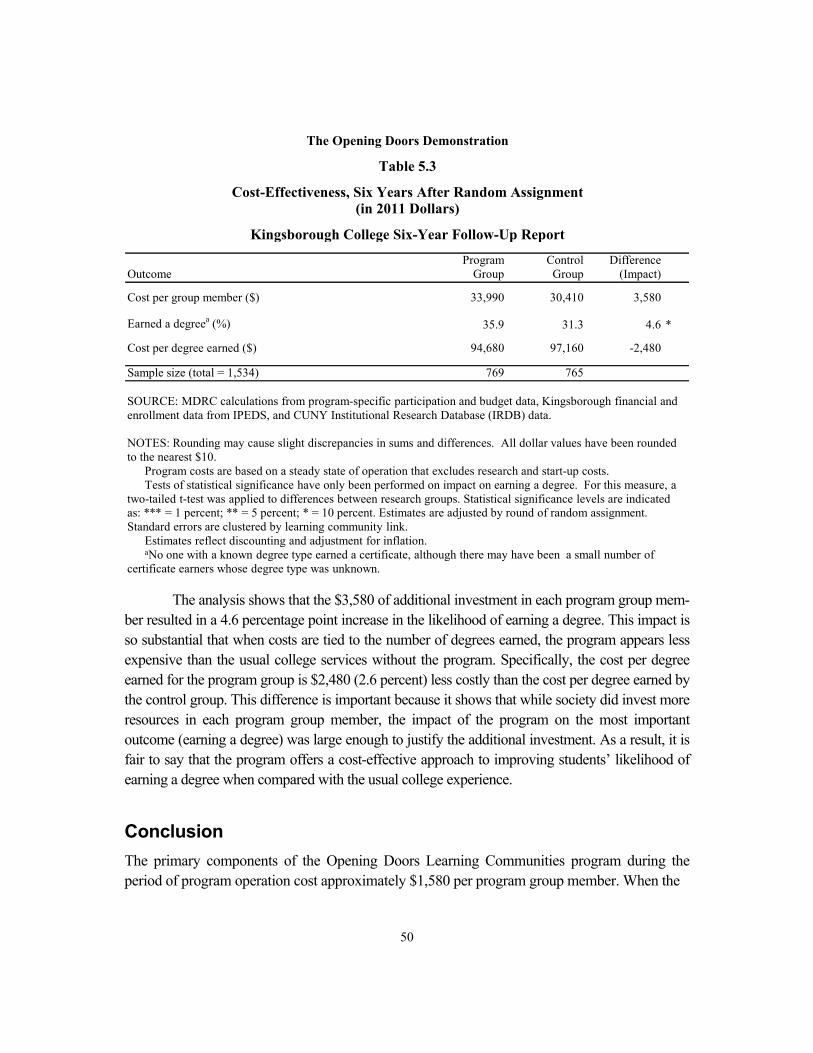
50
The analysis shows that the $3,580 of additional investment in each program group mem-ber resulted in a 4.6 percentage point increase in the likelihood of earning a degree. This impact is so substantial that when costs are tied to the number of degrees earned, the program appears less expensive than the usual college services without the program. Specifically, the cost per degree earned for the program group is $2,480 (2.6 percent) less costly than the cost per degree earned by the control group. This difference is important because it shows that while society did invest more resources in each program group member, the impact of the program on the most important outcome (earning a degree) was large enough to justify the additional investment. As a result, it is fair to say that the program offers a cost-effective approach to improving students’ likelihood of earning a degree when compared with the usual college experience.
Conclusion
The primary components of the Opening Doors Learning Communities program during the period of program operation cost approximately $1,580 per program group member. When the
Program Control DifferenceOutcome Group Group (Impact)
Cost per group member ($) 33,990 30,410 3,580
Earned a degreea (%) 35.9 31.3 4.6 *
Cost per degree earned ($) 94,680 97,160 -2,480
Sample size (total = 1,534) 769 765
The Opening Doors Demonstration
Table 5.3
Cost-Effectiveness, Six Years After Random Assignment
Kingsborough College Six-Year Follow-Up Report
(in 2011 Dollars)
SOURCE: MDRC calculations from program-specific participation and budget data, Kingsborough financial and enrollment data from IPEDS, and CUNY Institutional Research Database (IRDB) data.
NOTES: Rounding may cause slight discrepancies in sums and differences. All dollar values have been rounded to the nearest $10.
Program costs are based on a steady state of operation that excludes research and start-up costs.Tests of statistical significance have only been performed on impact on earning a degree. For this measure, a
two-tailed t-test was applied to differences between research groups. Statistical significance levels are indicated as: *** = 1 percent; ** = 5 percent; * = 10 percent. Estimates are adjusted by round of random assignment. Standard errors are clustered by learning community link.
Estimates reflect discounting and adjustment for inflation.aNo one with a known degree type earned a certificate, although there may have been a small number of
certificate earners whose degree type was unknown.

51
additional costs of educating students are considered, over the six years of follow-up, the college, and society as a whole, invested approximately $3,580 more per program group member than it did per control group member. This investment proved worthwhile: It increased the number of students who earned a college degree, resulting in a cost per degree earned among program group members that was 2.6 percent less than the cost per degree earned among control group members. As a result, the program appears to be a cost effective enhancement to the usual college services at Kingsborough.
Program Group
Control Group
$33,990cost per student
$30,410cost per student
$26,138,310total cost
$23,263,650total cost
$94,680cost per degree
earned
$97,160cost per degree
earned
×
÷
=
×
×
×
=
=
=
=
=÷
The Opening Doors Demonstration
Figure 5.1
Calculation of Cost per Degree Earned
(in 2011 Dollars)
Kingsborough Community College Six-Year Follow-Up Report
35.9%earned a degree
31.3%earned a degree
276degree earners
239degree earners
769students
765students
769students
765students
SOURCE: MDRC calculations from program-specific participation and budget data, Kingsborough financial and enrollment data from IPEDS, and CUNY Institutional Research Database (IRDB) data.
NOTES: Rounding may cause slight discrepancies in sums and differences. All dollar values have been rounded to the nearest $10.
Program costs are based on a steady state of operation that excludes research and start-up costs.No one with a known degree type earned a certificate, although there may have been a small number of
certificate earners whose degree type was unknown.


53
Chapter 6
Conclusion
Learning communities have a long history at Kingsborough Community College. Initiated in 1995 to serve incoming freshman who speak English as a second language (Intensive ESL), and extended through the Opening Doors Learning Communities described in this report, Kings-borough has invested substantially in learning communities, aiming to register most incoming freshmen in learning communities during their first semester. Moreover, in 2007, Kingsborough also developed new learning communities focused on students’ career objectives.1
The Opening Doors Learning Communities program at Kingsborough was designed to promote student involvement and persistence by placing groups of students in three linked courses for one semester. The linked courses had mutually reinforcing themes and assignments, and faculty were given additional time to collaborate, coordinate assignments, and assist students having difficulty. Students were also offered additional supports, including enhanced counseling and tutoring, and were given textbook vouchers.
This report suggests that the program increased students’ graduation rates by an esti-mated 4.6 percentage points and increased the total credits they earned by an estimated 4.0 credits. The gain in earned degrees marks a substantial improvement, particularly given the relatively short duration of the program. In addition, the Opening Doors Learning Communities program at Kingsborough also proved cost-effective.
Placing These Findings in the Context of Broader Research on Learning Communities
These positive impacts, however, may not be representative of the effects of learning communi-ties more generally. The final report on the National Center for Postsecondary Research (NCPR)’s Learning Communities Demonstration investigates the impacts of learning communi-ties on developmental students, and suggests modest short-term impacts, on average, across learning communities at six different community colleges.2 Other research finds that while learning communities may help students pass more courses and persist into subsequent semes-ters, the impacts are generally modest.3
1Kingsborough Community College (2012). 2Visher et al. (2012). 3Tinto (1997); Tinto (1998); Engstrom and Tinto (2007); Engstrom and Tinto (2008).

54
Several factors, however, distinguish the Opening Doors Learning Communities at Kingsborough. Most notably, they were particularly comprehensive. They linked three courses and provided enhanced counseling and tutoring, as well as textbook vouchers, and some of these services extended into the trailing intersession. In addition, the research sample had important distinguishing characteristics. For example, the evaluation explicitly recruited students intending to enroll in college full time and included both developmental and college-ready English students. The Opening Doors program also had unusually strong support from the college leadership. Therefore, while the Kingsborough results are encouraging, it is not clear that the positive impacts can be easily replicated at other institutions.
Implications
This evaluation suggests that the Opening Doors Learning Communities at Kingsborough were a source of short- and long-term improvements in student outcomes. In many cases, learning communities may produce only modest short-term impacts, but the extent to which they may produce long-term impacts is less clear. The final report on the Learning Communities Demon-stration suggests that learning communities involve only a modest cost increase, making them a relatively low-risk investment for community colleges interested in trying out this strategy.4 On the other hand, this report shows how a program that combined learning communities, addition-al supports to assist students, and strong college leadership was a cost-effective approach to improving graduation rates, although the initial investment required was higher.
This report also shows that it is possible for short-term, modest impacts to grow into important long-term gains. For the Opening Doors Learning Communities at Kingsborough, a one-semester intervention produced an estimated impact of 2.8 earned credits after two years.5 This evaluation suggests that after six years, however, the program substantially increased the percentage of students who earned degrees.
The students in this sample were recruited at a two-year institution, yet the main impact on graduation was not evident until the sixth year of follow-up. Six years of follow-up, howev-er, are rare among rigorous evaluations of community colleges. An important implication of this report is that relatively long follow-up periods may be necessary to identify interventions that have effects on graduation, particularly for students who enter college with developmental education needs.
4Visher et al. (2012). 5This number includes credits earned at all CUNY schools, not just Kingsborough.

55
What’s Next
MDRC will continue to follow the Opening Doors Learning Communities research sample. A future report will present findings on longer-term academic outcomes, including seven-year graduation rates, and earnings and employments effects.


Appendix A
Supplementary Table for Chapter 2

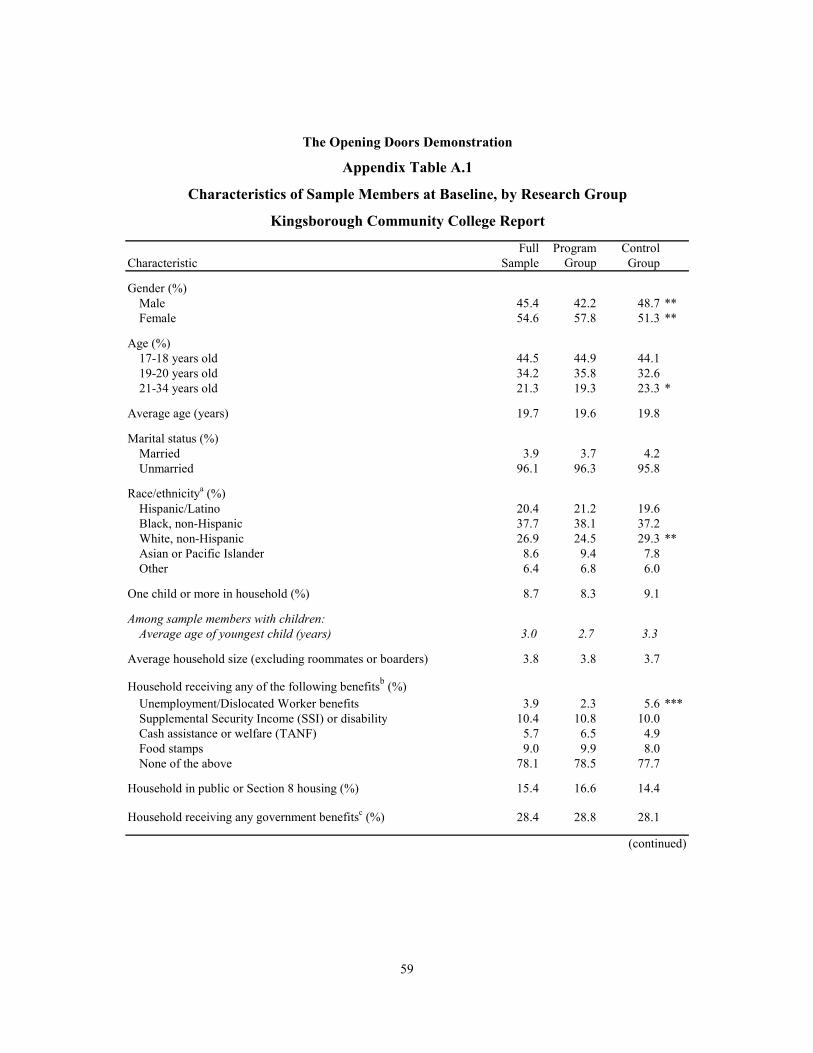
59
Full Program ControlCharacteristic Sample Group Group
Gender (%)Male 45.4 42.2 48.7 **Female 54.6 57.8 51.3 **
Age (%)17-18 years old 44.5 44.9 44.119-20 years old 34.2 35.8 32.621-34 years old 21.3 19.3 23.3 *
Average age (years) 19.7 19.6 19.8
Marital status (%)Married 3.9 3.7 4.2Unmarried 96.1 96.3 95.8
Race/ethnicitya (%)Hispanic/Latino 20.4 21.2 19.6Black, non-Hispanic 37.7 38.1 37.2White, non-Hispanic 26.9 24.5 29.3 **Asian or Pacific Islander 8.6 9.4 7.8Other 6.4 6.8 6.0
One child or more in household (%) 8.7 8.3 9.1
Among sample members with children:Average age of youngest child (years) 3.0 2.7 3.3
Average household size (excluding roommates or boarders) 3.8 3.8 3.7
Household receiving any of the following benefitsb (%)Unemployment/Dislocated Worker benefits 3.9 2.3 5.6 ***Supplemental Security Income (SSI) or disability 10.4 10.8 10.0Cash assistance or welfare (TANF) 5.7 6.5 4.9Food stamps 9.0 9.9 8.0None of the above 78.1 78.5 77.7
Household in public or Section 8 housing (%) 15.4 16.6 14.4
Household receiving any government benefitsc (%) 28.4 28.8 28.1
(continued)
The Opening Doors Demonstration
Appendix Table A.1
Characteristics of Sample Members at Baseline, by Research Group
Kingsborough Community College Report
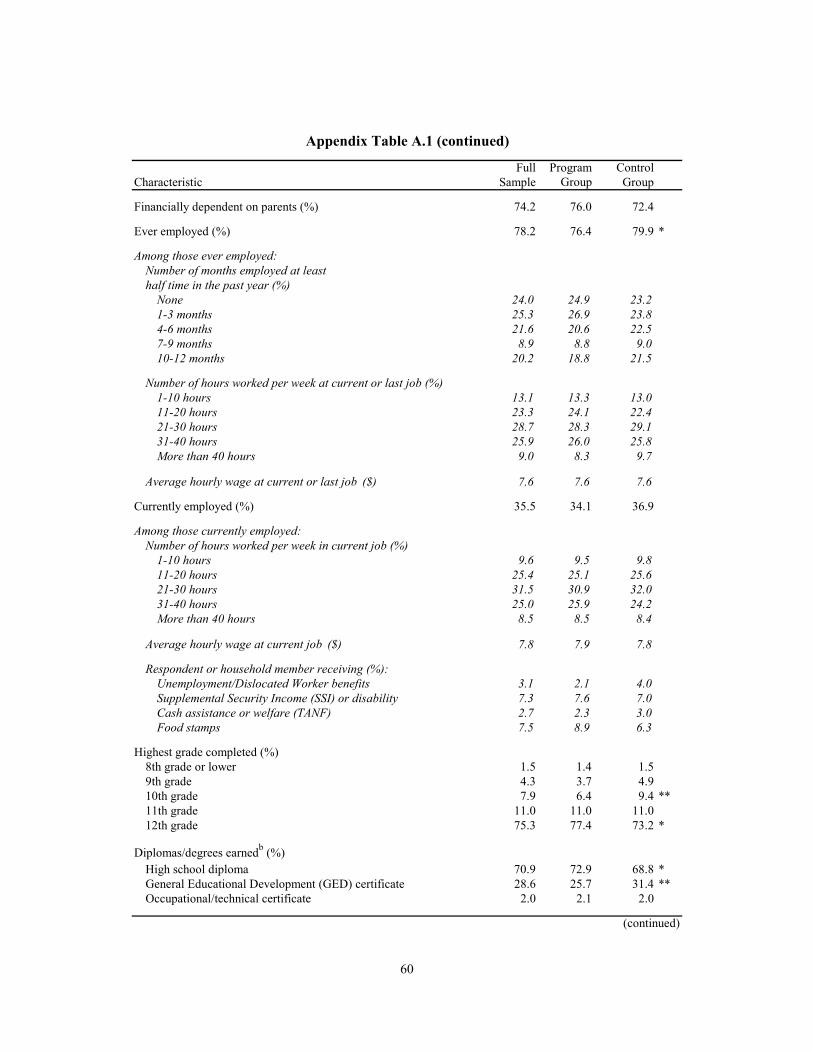
60
Full Program ControlCharacteristic Sample Group Group
Financially dependent on parents (%) 74.2 76.0 72.4
Ever employed (%) 78.2 76.4 79.9 *
Among those ever employed:Number of months employed at leasthalf time in the past year (%)
None 24.0 24.9 23.21-3 months 25.3 26.9 23.84-6 months 21.6 20.6 22.57-9 months 8.9 8.8 9.010-12 months 20.2 18.8 21.5
Number of hours worked per week at current or last job (%)1-10 hours 13.1 13.3 13.011-20 hours 23.3 24.1 22.421-30 hours 28.7 28.3 29.131-40 hours 25.9 26.0 25.8More than 40 hours 9.0 8.3 9.7
Average hourly wage at current or last job ($) 7.6 7.6 7.6
Currently employed (%) 35.5 34.1 36.9
Among those currently employed:Number of hours worked per week in current job (%)
1-10 hours 9.6 9.5 9.811-20 hours 25.4 25.1 25.621-30 hours 31.5 30.9 32.031-40 hours 25.0 25.9 24.2More than 40 hours 8.5 8.5 8.4
Average hourly wage at current job ($) 7.8 7.9 7.8
Respondent or household member receiving (%):Unemployment/Dislocated Worker benefits 3.1 2.1 4.0Supplemental Security Income (SSI) or disability 7.3 7.6 7.0Cash assistance or welfare (TANF) 2.7 2.3 3.0Food stamps 7.5 8.9 6.3
Highest grade completed (%)8th grade or lower 1.5 1.4 1.59th grade 4.3 3.7 4.910th grade 7.9 6.4 9.4 **11th grade 11.0 11.0 11.012th grade 75.3 77.4 73.2 *
Diplomas/degrees earnedb (%)High school diploma 70.9 72.9 68.8 *General Educational Development (GED) certificate 28.6 25.7 31.4 **Occupational/technical certificate 2.0 2.1 2.0
(continued)
Appendix Table A.1 (continued)
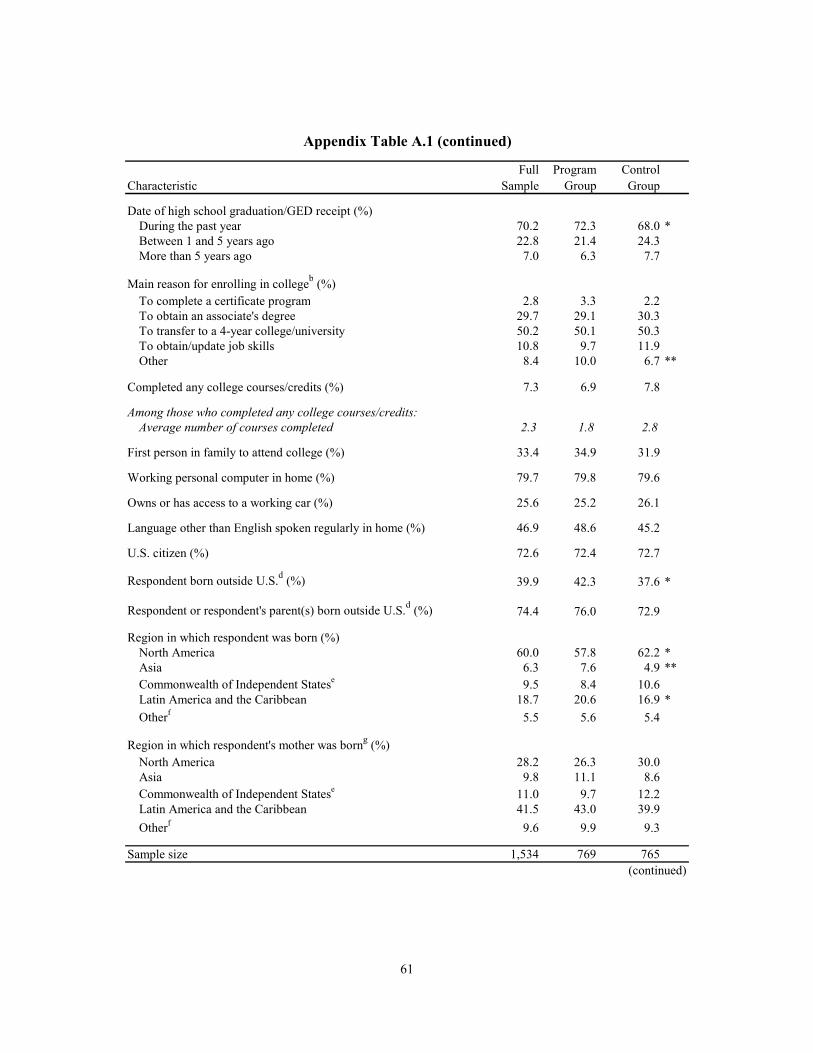
61
Full Program ControlCharacteristic Sample Group Group
Date of high school graduation/GED receipt (%)During the past year 70.2 72.3 68.0 *Between 1 and 5 years ago 22.8 21.4 24.3More than 5 years ago 7.0 6.3 7.7
Main reason for enrolling in collegeb (%)To complete a certificate program 2.8 3.3 2.2To obtain an associate's degree 29.7 29.1 30.3To transfer to a 4-year college/university 50.2 50.1 50.3To obtain/update job skills 10.8 9.7 11.9Other 8.4 10.0 6.7 **
Completed any college courses/credits (%) 7.3 6.9 7.8
Among those who completed any college courses/credits:Average number of courses completed 2.3 1.8 2.8
First person in family to attend college (%) 33.4 34.9 31.9
Working personal computer in home (%) 79.7 79.8 79.6
Owns or has access to a working car (%) 25.6 25.2 26.1
Language other than English spoken regularly in home (%) 46.9 48.6 45.2
U.S. citizen (%) 72.6 72.4 72.7
Respondent born outside U.S.d (%) 39.9 42.3 37.6 *
Respondent or respondent's parent(s) born outside U.S.d (%) 74.4 76.0 72.9
Region in which respondent was born (%)North America 60.0 57.8 62.2 *Asia 6.3 7.6 4.9 **Commonwealth of Independent Statese 9.5 8.4 10.6 Latin America and the Caribbean 18.7 20.6 16.9 *Otherf 5.5 5.6 5.4
Region in which respondent's mother was borng (%)North America 28.2 26.3 30.0Asia 9.8 11.1 8.6Commonwealth of Independent Statese 11.0 9.7 12.2 Latin America and the Caribbean 41.5 43.0 39.9Otherf 9.6 9.9 9.3
Sample size 1,534 769 765(continued)
Appendix Table A.1 (continued)

62
Appendix Table A.1 (continued)
SOURCE: MDRC calculations using Baseline Information Form (BIF) data.
NOTES: A two-tailed t-test was applied to differences between the groups. Statistical significance levels are indicated as: *** = 1 percent; ** = 5 percent; * = 10 percent.
Estimates are adjusted by research cohort. Italics indicate nonexperimental data.Missing values are not included in individual variable distributions. Distributions may not add to 100 percent because of rounding.aRespondents who indicated that they are Hispanic and who also chose a race are included only in the
Hispanic/Latino category.bDistributions may not add to 100 percent because categories are not mutually exclusive. cBenefits include unemployment/dislocated worker benefits, Supplemental Security Income (SSI), or
disability, cash assistance or welfare, food stamps, and Section 8 or public housing.d"U.S." includes Puerto Rico. eThis commonwealth includes Armenia, Azerbaijan, Belarus, Georgia (until 2009), Kazakhstan,
Kyrgyzstan, Moldova, Russia, Tajikistan, Turkmenistan (unofficial member), Ukraine (unofficial member), and Uzbekistan.
fOther regions include the Baltic states, Eastern and Western Europe, North Africa, Sub-Saharan Africa, the Middle East, and Oceania. Countries are grouped by region according to the U.S. Bureau of the Census, International Data Base.
gThe majority of respondents (over 80 percent) reported that both parents were born in the same region.

Appendix B
Data Processing


65
The long-term outcomes in this report use several data sources to better understand the academ-ic experiences of study participants. This appendix provides details on how the data sources were combined to create the measures presented in the long-term impacts chapter of this report. This appendix does not apply to the early findings described in Chapter 3 of this report.
Combining Data Sources
Many different data sources are used throughout this report, all of which are listed in Chapter 2. Of those data sources, two are used to create long-term measures of students’ academic pro-gress. The first of these data sources is school records data from the City University of New York (CUNY) Institutional Research Database (IRDB). This database contains course-level transcript and degree data from all of CUNY’s two-year, four-year, and advanced colleges, including Kingsborough.1 The second data source is the National Student Clearinghouse, which includes data for more than 3,300 colleges, enrolling over 96 percent of U.S. college students. National Student Clearinghouse data provide information on enrollment and degrees earned but do not provide course-level transcript data.2
Both the National Student Clearinghouse and CUNY IRDB data provide information on enrollment and degree attainment. However, the CUNY IRDB data cover only enrollment at and degrees received from schools in the CUNY system, while the National Student Clearing-house data reflect those activities at colleges nationwide. Students in MDRC’s study may enroll in and earn degrees from schools outside the CUNY system, and by using the National Student Clearinghouse data, the academic outcome measures can reflect those actions. While the National Student Clearinghouse contains information from a larger number of colleges, the CUNY IRDB provides greater detail on students’ actions at CUNY. The CUNY IRDB data can be used to create measures of credits attempted and earned, which is impossible using the National Student Clearinghouse data.
In areas where the data sources overlap, they are remarkably consistent; however, some discrepancies do exist. Some discrepancies result from students’ absence from one of the datasets.3 Others result from how the databases handle the fluid nature of academic records data, such as students withdrawing from courses after the add/drop period. The process of assigning dates on the National Student Clearinghouse data to academic semesters, discussed in more detail in the next section, is another source of differences between the data sources.
1Transcript data include titles of courses taken, credits associated with those courses, and grades received for each student, in each semester.
2National Student Clearinghouse (2012). 3For both the CUNY IRDB and the National Student Clearinghouse, students were identified using social
security number, name, and date of birth. On both datasets, this resulted in most, but not all, of the sample being located, with a higher match rate on the CUNY IRDB.

66
As similar information is available from multiple data sources, a decision is required on which data source to use to create outcome measures. Only the CUNY IRDB data have infor-mation on credits attempted and earned, so all credit measures are created using only the CUNY IRDB data, and cover activity only at CUNY schools. For measures presenting enrollment or degrees earned at any U.S. institution, the CUNY IRDB data are generally used for information on enrollment and degrees received at CUNY schools.4 The National Student Clearinghouse data are used to supplement the CUNY IRDB data and provide information on enrollment and degree receipt at non-CUNY schools. Most enrollment measures present enrollment at any college; however, enrollment measures that differentiate between the main session and interses-sion portions of a semester are created only for CUNY colleges. This is done because the necessity of assigning dates on the National Student Clearinghouse data to academic semesters
4Degrees earned at CUNY in fall 2010 were not yet incorporated in the CUNY IRDB when data were
collected, so National Student Clearinghouse data on those degrees are used.
National StudentCUNY IRDB Clearinghouse
Kingsborough Community College All CUNY colleges All U.S. collegesa
Enrollmentb Degree/certificate attainment Course-level transcript informationc
Data available
The Opening Doors Demonstration
Appendix Table B.1
Data Source Characteristics
Kingsborough Community College Six-Year Follow-Up Report
Colleges covered
Data Source
SOURCE: MDRC data sources summary using CUNY Institutional Research Database (IRDB) and National Student Clearinghouse data.
NOTES: aNational Student Clearinghouse data include data for more than 3,300 colleges covering 96 percent of college enrollments. See www.clearinghouse.org.
bEnrollment status using CUNY data is determined using course-level transcript information.cCourse-level transcript data include course name and type, course grade, and credits attempted and
earned in courses students are registered for.

67
makes it more difficult to determine if an enrollment occurred during the main session or the intersession of a given semester.
Time Frames for Measure Creation
In addition to requiring the combination of data sources, creating the academic outcome measures in this report requires assigning enrollment and degree receipt to a specific time frame. This section explains how data are assigned to terms and how the time frames presented in this report are defined.
Students entered the Opening Doors Kingsborough study over the course of four semes-ters, or cohorts. Cohorts were randomly assigned shortly before the start of the fall 2003, spring 2004, fall 2004, and spring 2005 semesters. In order to examine comparable time periods for all cohorts, the analyses in this report look at outcomes relative to when students entered the study.
Additionally, because community colleges use a variety of academic calendars, a stand-ard definition of a semester must be created in order to discuss comparable time periods between colleges. In this report, fall and winter are jointly referred to as one semester, and spring and summer are also combined into one semester. Winter and summer, when discussed separately from fall and spring, are referred to as intersessions. A detailed explanation of the timing of academic semesters can be found in Box 3.1. For example, for the first cohort, the first semester refers to fall 2003 plus winter 2004, the second semester refers to spring 2004 plus summer 2004, and so on. For the second cohort, the first semester refers to spring 2004 plus summer 2004, the second semester refers to fall 2004 plus winter 2005, and so on.
To further simplify the presentation of outcome measures, yearly measures are often presented. Yearly measures combine all data for a given year, relative to the time the student entered the study. For example, the first cohort entered the study in fall 2003, so the first year encompasses all courses taken, credits earned, and degrees earned within fall 2003, winter 2004, spring 2004, and summer 2004. Further, some measures are presented “after six years.” These measures include all activity within years one through six.
CUNY IRDB data explicitly designate the session (for example, spring 2004, summer 2004, fall 2004) when a course was taken or a degree was received. National Student Clearing-house data do not have terms associated with the data. Instead, start and end dates are provided for enrollment records, and degree-earned dates are provided for graduation records. To align these data with the measures presented in this report, it was necessary to assign a term based on these dates.
For National Student Clearinghouse degree data, terms were assigned based on the date of degree receipt. The date of degree receipt generally falls at the end of the term in which the

68
degree was completed; therefore, degrees awarded in October through March are considered to have been earned in the fall/winter semester, and degrees awarded in April through September were considered to be earned in the spring/summer semester.
For National Student Clearinghouse enrollment data, terms were assigned based on the start and end date of enrollment. Only enrollments that lasted at least three weeks were assigned a term, because shorter lengths of enrollment may represent enrolling at a college and then withdrawing from all classes before the end of the add/drop period. Generally, enrollments between August 16 and December 31 are considered fall/winter enrollments, and enrollments between January 1 and August 15 are considered spring/summer enrollments. For the small number of schools with quarter schedules, the periods of enrollment are slightly different.5
5For schools on quarter schedules, enrollment periods are as follows: enrollment between October and
March is a fall/winter enrollment, and between April and September is a spring/summer enrollment.

Appendix C
Supplementary Tables for Chapter 4

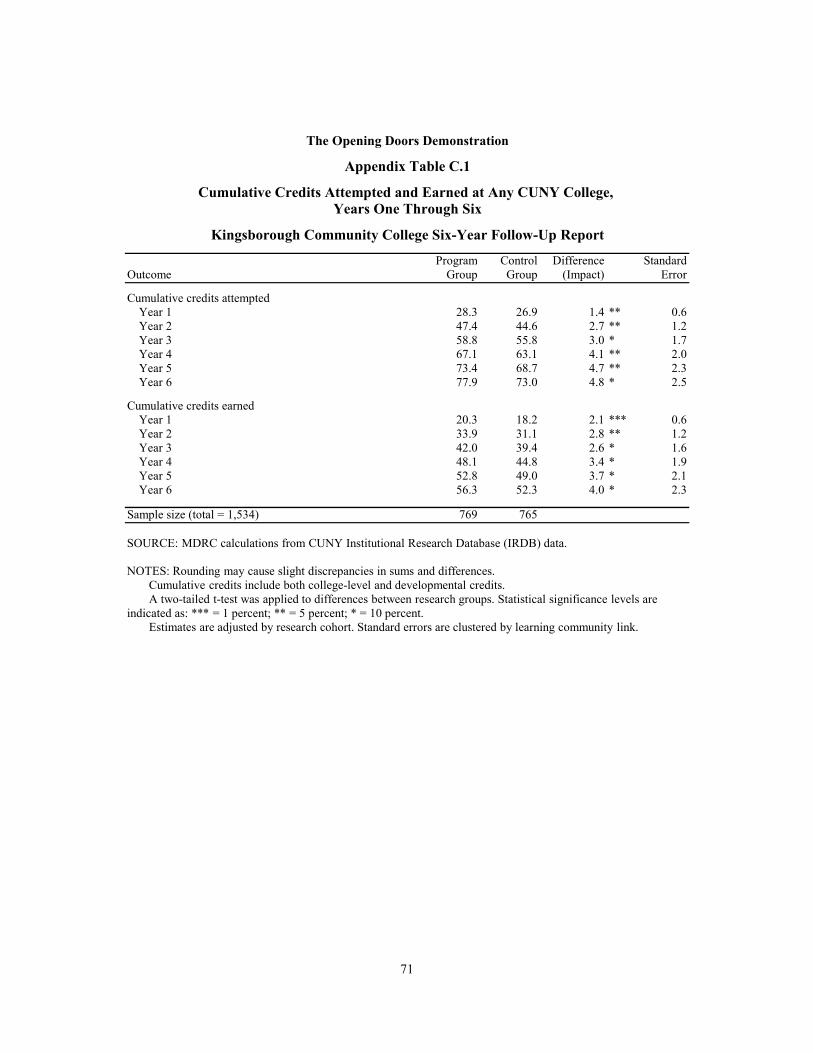
71
Program Control Difference StandardOutcome Group Group (Impact) Error
Cumulative credits attemptedYear 1 28.3 26.9 1.4 ** 0.6Year 2 47.4 44.6 2.7 ** 1.2Year 3 58.8 55.8 3.0 * 1.7Year 4 67.1 63.1 4.1 ** 2.0Year 5 73.4 68.7 4.7 ** 2.3Year 6 77.9 73.0 4.8 * 2.5
Cumulative credits earnedYear 1 20.3 18.2 2.1 *** 0.6Year 2 33.9 31.1 2.8 ** 1.2Year 3 42.0 39.4 2.6 * 1.6Year 4 48.1 44.8 3.4 * 1.9Year 5 52.8 49.0 3.7 * 2.1Year 6 56.3 52.3 4.0 * 2.3
Sample size (total = 1,534) 769 765
The Opening Doors Demonstration
Appendix Table C.1
Cumulative Credits Attempted and Earned at Any CUNY College,
Kingsborough Community College Six-Year Follow-Up Report
Years One Through Six
SOURCE: MDRC calculations from CUNY Institutional Research Database (IRDB) data.
NOTES: Rounding may cause slight discrepancies in sums and differences.Cumulative credits include both college-level and developmental credits.A two-tailed t-test was applied to differences between research groups. Statistical significance levels are
indicated as: *** = 1 percent; ** = 5 percent; * = 10 percent.Estimates are adjusted by research cohort. Standard errors are clustered by learning community link.
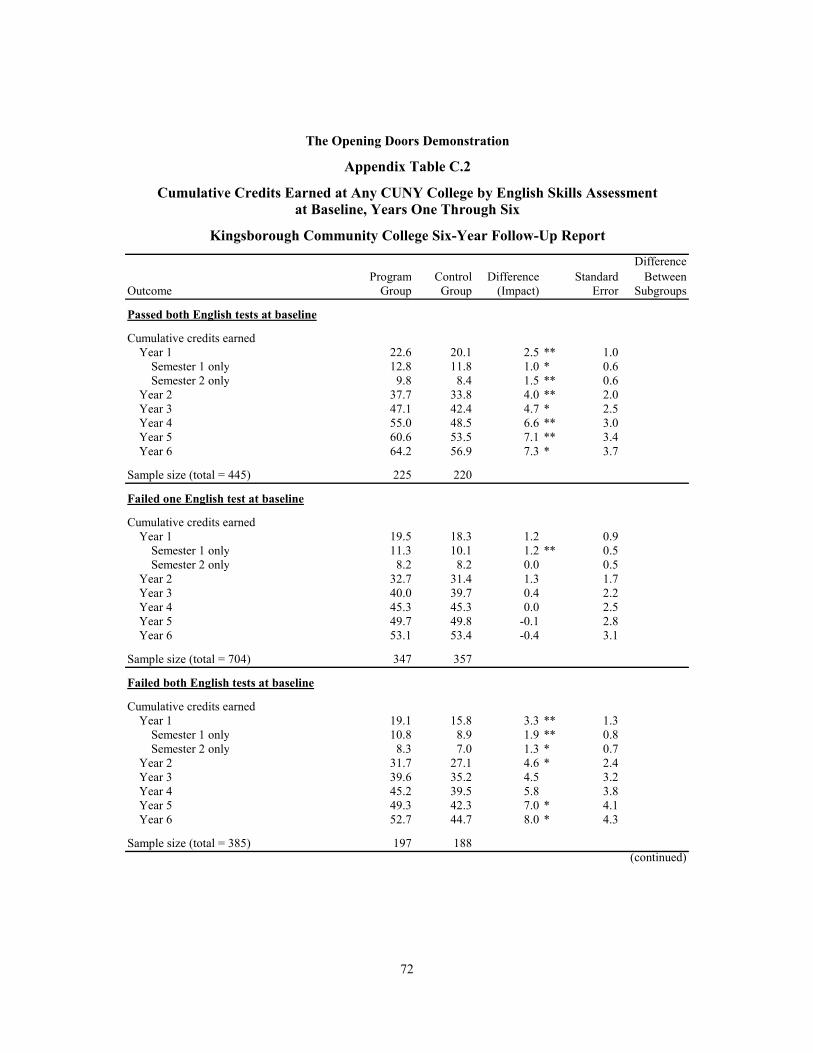
72
DifferenceProgram Control Difference Standard Between
Outcome Group Group (Impact) Error Subgroups
Passed both English tests at baseline
Cumulative credits earnedYear 1 22.6 20.1 2.5 ** 1.0
Semester 1 only 12.8 11.8 1.0 * 0.6 Semester 2 only 9.8 8.4 1.5 ** 0.6
Year 2 37.7 33.8 4.0 ** 2.0 Year 3 47.1 42.4 4.7 * 2.5 Year 4 55.0 48.5 6.6 ** 3.0 Year 5 60.6 53.5 7.1 ** 3.4 Year 6 64.2 56.9 7.3 * 3.7
Sample size (total = 445) 225 220
Failed one English test at baseline
Cumulative credits earnedYear 1 19.5 18.3 1.2 0.9
Semester 1 only 11.3 10.1 1.2 ** 0.5 Semester 2 only 8.2 8.2 0.0 0.5
Year 2 32.7 31.4 1.3 1.7 Year 3 40.0 39.7 0.4 2.2 Year 4 45.3 45.3 0.0 2.5 Year 5 49.7 49.8 -0.1 2.8 Year 6 53.1 53.4 -0.4 3.1
Sample size (total = 704) 347 357
Failed both English tests at baseline
Cumulative credits earnedYear 1 19.1 15.8 3.3 ** 1.3
Semester 1 only 10.8 8.9 1.9 ** 0.8 Semester 2 only 8.3 7.0 1.3 * 0.7
Year 2 31.7 27.1 4.6 * 2.4 Year 3 39.6 35.2 4.5 3.2 Year 4 45.2 39.5 5.8 3.8 Year 5 49.3 42.3 7.0 * 4.1 Year 6 52.7 44.7 8.0 * 4.3
Sample size (total = 385) 197 188(continued)
The Opening Doors Demonstration
Appendix Table C.2
Cumulative Credits Earned at Any CUNY College by English Skills Assessment
Kingsborough Community College Six-Year Follow-Up Report
at Baseline, Years One Through Six
73
Appendix Table C.2 (continued)
SOURCE: MDRC calculations from CUNY Institutional Research Database (IRDB) data.
NOTES: Rounding may cause slight discrepancies in sums and differences.Cumulative credits include both college-level and developmental credits.A two-tailed t-test was applied to differences between research groups. Statistical significance levels are
indicated as: *** = 1 percent; ** = 5 percent; * = 10 percent.A two-tailed t-test was applied to differences of impacts between subgroups. Statistical significance levels
are indicated as: ††† = 1 percent; †† = 5 percent; † = 10 percent. For the measures presented in this table, no statistically significant differences between subgroups were observed.
Estimates are adjusted by research cohort. Standard errors are clustered by learning community link.

74
DifferenceProgram Control Difference Standard Between
Outcome (%) Group Group (Impact) Error Subgroups
Passed both English tests at baseline
Earned a degreeYear 1 0.0 0.0 0.0 0.0Year 2 13.5 8.9 4.6 3.2Year 3 32.1 21.3 10.8 ** 4.8Year 4 40.1 28.6 11.5 ** 4.6 †Year 5 46.7 34.5 12.3 *** 4.4 ††Year 6 50.3 37.7 12.6 *** 4.4 †
Sample size (total = 445) 225 220
Failed one English tests at baseline
Earned a degreeYear 1 0.0 0.0 0.0 0.0Year 2 4.1 5.0 -1.0 1.5Year 3 16.1 16.8 -0.7 2.8Year 4 23.3 23.5 -0.2 3.1 †Year 5 27.4 28.6 -1.2 3.3 ††Year 6 32.3 32.5 -0.2 3.2 †
Sample size (total = 704) 347 357
Failed both English tests at baseline
Earned a degreeYear 1 0.0 0.0 0.0 0.0Year 2 1.5 1.6 -0.1 1.1Year 3 13.9 11.5 2.4 3.6Year 4 17.0 17.9 -0.9 4.1 †Year 5 23.0 19.5 3.5 4.5 ††Year 6 26.0 21.1 4.9 5.0 †
Sample size (total = 385) 197 188
The Opening Doors Demonstration
Appendix Table C.3
Earned a Degree at Any College by English Skills Assessment at Baseline, Years One Through Six
Kingsborough Community College Six-Year Follow-Up Report
SOURCE: MDRC calculations from CUNY Institutional Research Database (IRDB) and National Student Clearinghouse data.
NOTES: Rounding may cause slight discrepancies in sums and differences.A two-tailed t-test was applied to differences between research groups. Statistical significance levels are
indicated as: *** = 1 percent; ** = 5 percent; * = 10 percent.A two-tailed t-test was applied to differences of impacts between subgroups. Statistical significance levels are
indicated as: ††† = 1 percent; †† = 5 percent; † = 10 percent.Estimates are adjusted by research cohort. Standard errors are clustered by learning community link.No one with a known degree type earned a certificate, although there may have been a small number of
certificate earners whose degree type was unknown.

75
Program Control Difference StandardOutcome Group Group (Impact) Error
Cumulative number of semester enrollmentsYear 1 1.7 1.7 0.1 * 0.0Year 2 3.0 2.9 0.1 ** 0.1Year 3 4.0 3.8 0.2 * 0.1Year 4 4.8 4.6 0.2 * 0.1Year 5 5.5 5.3 0.2 0.2Year 6 6.1 5.9 0.2 0.2
Sample size (total = 1,534) 769 765
The Opening Doors Demonstration
Appendix Table C.4
Cumulative Number of Semester Enrollments at Any College,
Kingsborough Community College Six-Year Follow-Up Report
Years One Through Six
SOURCE: MDRC calculations from CUNY Institutional Research Database (IRDB) and National Student Clearinghouse data.
NOTES: Rounding may cause slight discrepancies in sums and differences.A two-tailed t-test was applied to differences between research groups. Statistical significance levels are
indicated as: *** = 1 percent; ** = 5 percent; * = 10 percent.Estimates are adjusted by research cohort. Standard errors are clustered by learning community link.
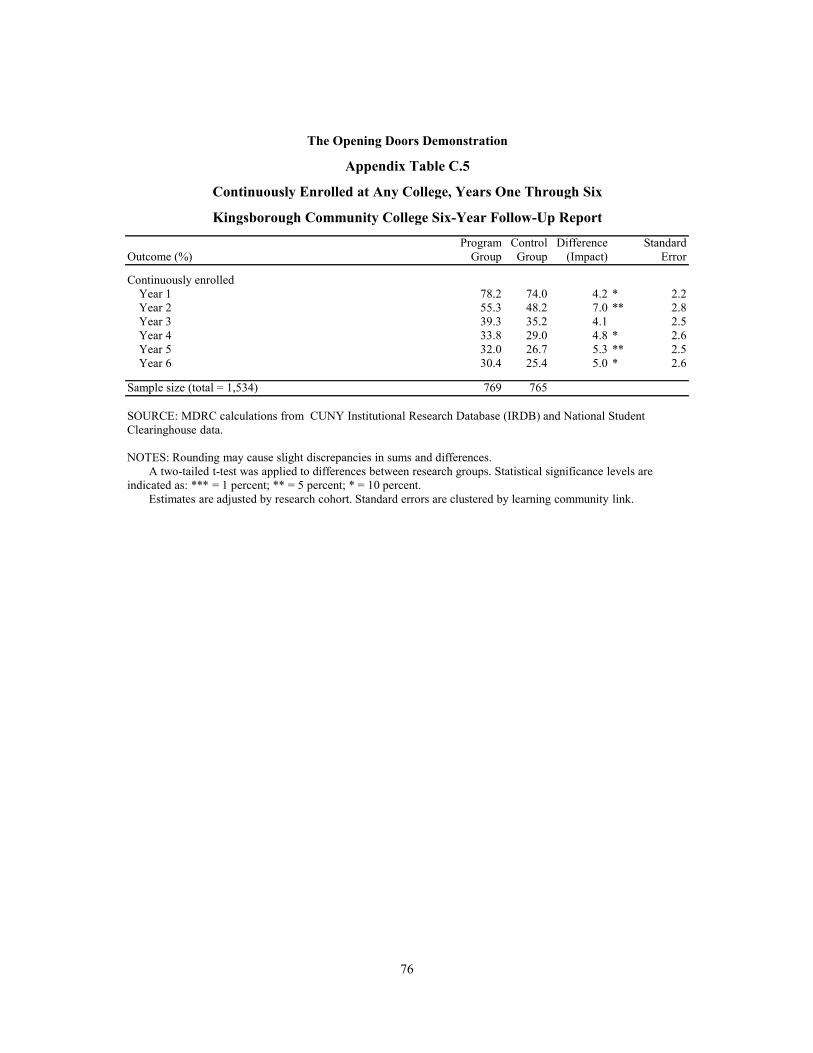
76
Program Control Difference StandardOutcome (%) Group Group (Impact) Error
Continuously enrolledYear 1 78.2 74.0 4.2 * 2.2Year 2 55.3 48.2 7.0 ** 2.8Year 3 39.3 35.2 4.1 2.5Year 4 33.8 29.0 4.8 * 2.6Year 5 32.0 26.7 5.3 ** 2.5Year 6 30.4 25.4 5.0 * 2.6
Sample size (total = 1,534) 769 765
The Opening Doors Demonstration
Appendix Table C.5
Continuously Enrolled at Any College, Years One Through Six
Kingsborough Community College Six-Year Follow-Up Report
SOURCE: MDRC calculations from CUNY Institutional Research Database (IRDB) and National Student Clearinghouse data.
NOTES: Rounding may cause slight discrepancies in sums and differences.A two-tailed t-test was applied to differences between research groups. Statistical significance levels are
indicated as: *** = 1 percent; ** = 5 percent; * = 10 percent.Estimates are adjusted by research cohort. Standard errors are clustered by learning community link.
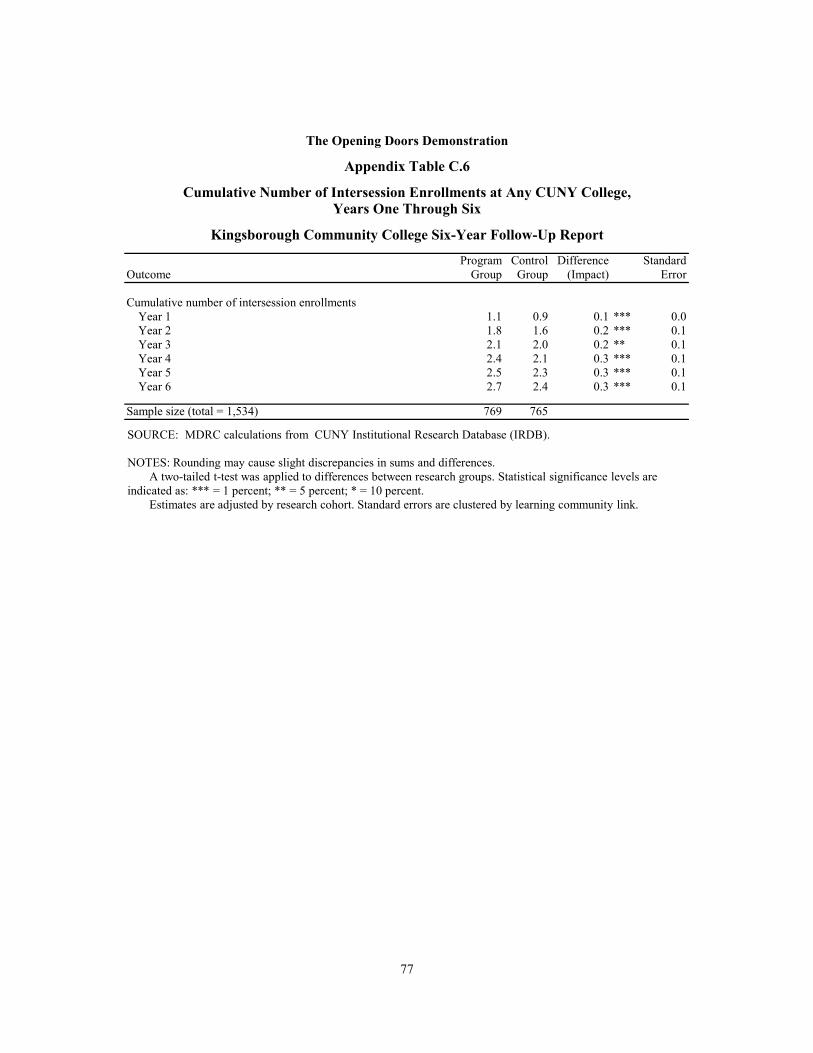
77
Program Control Difference StandardOutcome Group Group (Impact) Error
Cumulative number of intersession enrollments Year 1 1.1 0.9 0.1 *** 0.0Year 2 1.8 1.6 0.2 *** 0.1Year 3 2.1 2.0 0.2 ** 0.1Year 4 2.4 2.1 0.3 *** 0.1Year 5 2.5 2.3 0.3 *** 0.1Year 6 2.7 2.4 0.3 *** 0.1
Sample size (total = 1,534) 769 765
The Opening Doors Demonstration
Appendix Table C.6
Cumulative Number of Intersession Enrollments at Any CUNY College,Years One Through Six
Kingsborough Community College Six-Year Follow-Up Report
SOURCE: MDRC calculations from CUNY Institutional Research Database (IRDB).
NOTES: Rounding may cause slight discrepancies in sums and differences.A two-tailed t-test was applied to differences between research groups. Statistical significance levels are
indicated as: *** = 1 percent; ** = 5 percent; * = 10 percent.Estimates are adjusted by research cohort. Standard errors are clustered by learning community link.

78
Program Control Difference StandardOutcome Group Group (Impact) Error
Cumulative intersession credits earnedYear 1 4.2 3.7 0.5 *** 0.2Year 2 6.9 6.3 0.6 * 0.3Year 3 8.2 7.7 0.6 0.4Year 4 9.2 8.3 0.9 ** 0.4Year 5 9.8 8.8 1.0 ** 0.5Year 6 10.3 9.2 1.0 ** 0.5
Sample size (total = 1,534) 769 765
The Opening Doors Demonstration
Appendix Table C.7
Cumulative Intersession Credits Earned at Any CUNY College,Years One Through Six
Kingsborough Community College Six-Year Follow-Up Report
SOURCE: MDRC calculations from CUNY Institutional Research Database (IRDB).
NOTES: Rounding may cause slight discrepancies in sums and differences.Cumulative credits include both college-level and developmental credits.A two-tailed t-test was applied to differences between research groups. Statistical significance levels
are indicated as: *** = 1 percent; ** = 5 percent; * = 10 percent.Estimates are adjusted by research cohort. Standard errors are clustered by learning community link.

79
Program Control Difference StandardOutcome (%) Group Group (Impact) Error
Earned a degreeYear 1 0.0 0.0 0.0 0.0Year 2 6.1 5.4 0.8 1.5Year 3 20.2 16.9 3.3 2.5Year 4 26.5 23.7 2.8 2.6Year 5 31.8 28.1 3.7 2.8Year 6 35.9 31.3 4.6 * 2.7
Sample size (total = 1,534) 769 765
Kingsborough Community College Six-Year Follow-Up Report
The Opening Doors Demonstration
Appendix Table C.8
Earned a Degree at Any College, Years One Through Six
SOURCE: MDRC calculations from CUNY Institutional Research Database (IRDB) and National Student Clearinghouse data.
NOTES: Rounding may cause slight discrepancies in sums and differences.A two-tailed t-test was applied to differences between research groups. Statistical significance levels are
indicated as: *** = 1 percent; ** = 5 percent; * = 10 percent.Estimates are adjusted by research cohort. Standard errors are clustered by learning community link.No one with a known degree type earned a certificate, although there may have been a small number of
certificate earners whose degree type was unknown.


Appendix D
Statistical Model


83
The basic strategy for the impact analysis is to estimate the difference in outcomes between the treatment and control groups, adjusting for cohorts.1 This generates estimates of the average impact of the opportunity to participate in the Opening Doors Learning Communities program (the intent-to-treat). A linear model is used to estimate the impact of the program on outcomes:
(1) = ℎ + +
where represents an outcome (for example, total credits earned) for student i, are
fixed effects for the cohorts, ℎ is an indicator equal to 1 if student i is in cohort b, and 0 otherwise, is an indicator for student i, set equal to 1 for students randomly assigned to the treatment group and 0 for students randomly assigned to the control group, and is an error term. The main coefficient of interest is β, which reflects the estimated average program impact. A two-tailed t-test is used to assess whether β differs from zero. Standard errors are clustered by learning community link.
1Random assignment of students was conducted for entering cohorts in the fall of 2003, spring of 2004,
fall of 2004, and spring of 2005.


Appendix E
Cost Details

87
This cost appendix provides additional detail about the costs of operating learning communities. It includes discussion of the effects of class size, how the value of credits attempted are estimat-ed, how potential revenues associated with students attempting more credits could be estimated, and an additional explanation of how the cost per degree earned is calculated.
How Class Size Affects the Cost of Learning Communities
Any institution considering developing a learning community-type program that creates formal links between previously independent courses must critically examine the role of class size and how it will influence the costs of such a program. In order to understand how class size can affect costs, imagine a situation at a hypothetical college where 100 students each take one developmental and one regular course (see Figure E.1). In this hypothetical scenario, typical class sizes in regular and developmental courses would be 33 and 25, respectively, so the college would need to operate a total of seven sections (three regular and four developmental). However, if these two courses are linked, then each developmental course will continue to have 25 students but each regular course will also only have 25 students. The college will now need to operate a total of eight sections (four developmental and four regular). Therefore, the hypo-thetical college, and society as a whole, will need to expend additional resources to educate the same 100 students, increasing their per-student costs.1
In practice, however, a college, and society as a whole, may not necessarily spend more money as a result of linking courses. For example, the variety of non-learning-community courses could decrease, or class size in non-learning-community courses could increase to make up for the more intense use of resources within the learning communities. Shifts caused by learning communities operated on a small scale can be virtually impossible to detect, so colleg-es implementing relatively small programs may choose to ignore class size considerations. However, colleges planning to operate large, collegewide learning community programs should view this effect as a real cost.2
The class sizes in the Opening Doors Learning Communities during the evaluation were often much smaller than the typical class size for similar nonlinked courses at the college. The college had planned that the learning community courses would have fewer students than the typical course at the college, but the actual class sizes were even lower than the planned values. Had the program operated at the planned class size, the estimated direct cost per program group
1The figure is meant to be read as a hypothetical illustration of how class size can affect cost in learning communities in general, rather than an estimate of the effect of class size on cost at Kingsborough.
2Although Kingsborough did take into account the effect of smaller class sizes in their budget, it did not run as many additional courses as the logic used in the hypothetical scenario in Figure E.1 would predict.
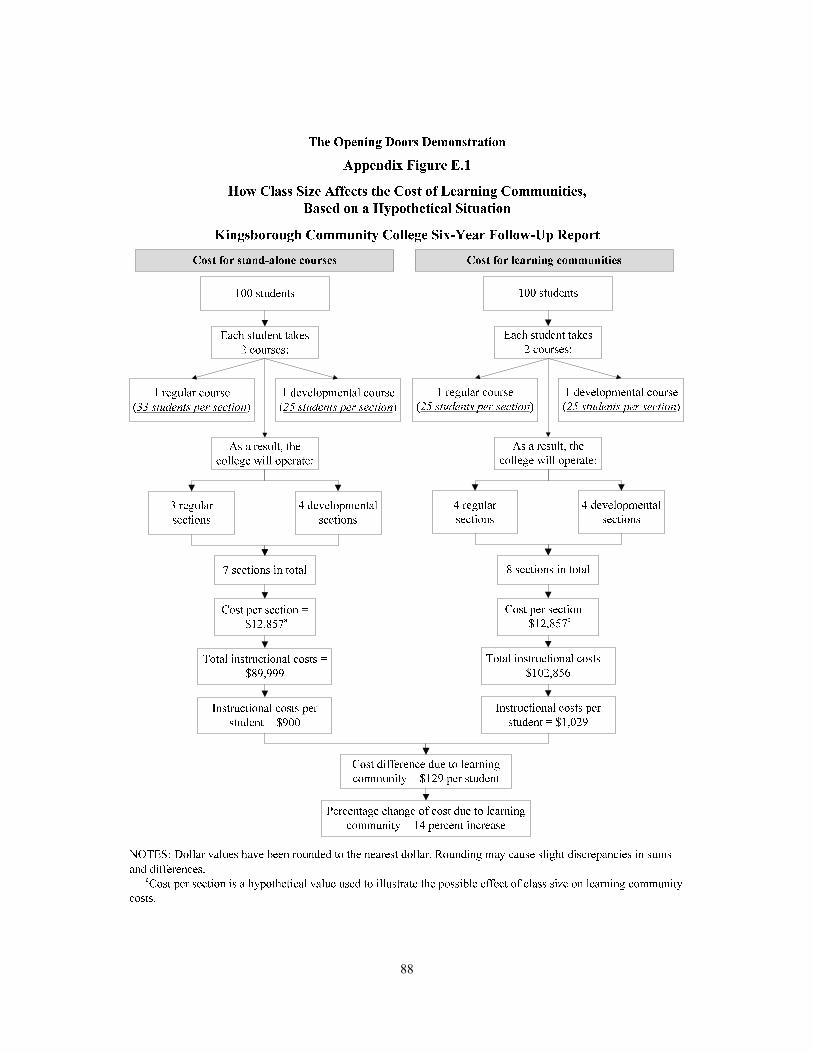
88
89
member would be around $1,120 ($460 less than the current estimate), as fewer sections would have been needed each semester. Two factors, in particular, were driving the small class sizes for the program: First, the random assignment design of the evaluation effectively cut the demand for learning communities in half.3 Second, a class that the college would have normally cut due to low enrollment would not be canceled because doing so would make it harder to detect the impacts of the program. Since the class sizes observed were influenced strongly by the constraints of the experiment, the $1,120 direct cost estimate may be useful as an indication of how much a program like this would cost to operate if it were not being rigorously evaluated. Since both of the factors influencing class size factors were directly related to the evaluation, it’s difficult to say whether class sizes would differ so sharply between learning communities and typical college classes in the long run. In fact, Kingsborough administrators note that there is virtually no difference in class size between their present learning community programs and stand-alone courses.
Calculating the Value of Credits Attempted
The value of credits attempted was calculated by multiplying the number of credits attempted at any City of New York (CUNY) college by a cost per credit estimate at Kingsborough (this value is assumed to be representative of typical CUNY costs). It is based on annual expendi-tures and the annual number of credit hours at Kingsborough, which are pulled from the Integrated Postsecondary Education Data System. The cost per credit observed for the 2003-2004 school year ($353.51) is used as a starting point to estimate the cost per credit during each of the six years of follow-up. These values are adjusted by a 3.5 percent annual discount rate and adjusted by inflation according to the Higher Education Price Index for public two-year institutions. Values are presented in 2011 real dollars.
Value of Revenue from Attempting More Credits
If the college receives additional revenue when students attempt more credits, then the cost of more credit attempts would be offset by additional revenue. As a result, the estimated indirect cost of the program could serve as a high-end estimate of how much revenue Kingsborough could receive from an increase in the number of credits attempted. However, someone within society, that is, the taxpayer or the student, is realizing these costs, and for this reason, additional revenue from increasing the number of credits attempted is not considered in the primary cost analysis.
3The research portion of this project did include recruitment to increase student demand, but the power of
recruitment is unknown, so this phenomenon may have been experienced regardless.

90
Calculation of Cost per Degree Earned
Figure 5.1 shows how the cost per degree presented in Chapter 5 is calculated. The top half of the figure illustrates the calculation for the program group. Specifically, the average program group member was associated with $33,990 worth of resources during the six years of follow-up, and the program group included 769 students. As a result, the cost to educate the program group was approximately $26,138,310. Since 35.9 percent of the 769 program group members earned a degree (276 degree earners), the cost per degree earned for the program group is $94,680 ($26,138,310 ÷ 276).
By comparison, the bottom half of the figure illustrates the calculation for the control group. Specifically, the average control group member was associated with $30,410 worth of resources during the six years of follow-up, and the control group included 765 students. As a result, the cost to educate the control group was approximately $23,263,650. Since 31.3 percent of the 765 control group members earned a degree (239 degree earners), the cost per degree earned for the control group is $97,160 ($23,263,650 ÷ 239).

91
References
Adelman, Clifford. 2006. The Toolbox Revisited: Paths to Degree Completion from High School Through College. Washington, DC: U.S. Department of Education.
Boatman, Angela, and Bridget Terry Long. 2010. Does Remediation Work for All Students? How the Effects of Postsecondary Remedial and Developmental Courses Vary by Level of Academic Preparation. New York: National Center for Postsecondary Research.
Brock, Thomas, and Allen LeBlanc with Casey MacGregor. 2005. Promoting Student Success in Community College and Beyond. New York: MDRC.
Calcagno, Juan Carlos, and Bridget Terry Long. 2008. The Impact of Postsecondary Remediation Using a Regression Discontinuity Approach: Addressing Endogenous Sorting and Noncompli-ance. New York: National Center for Postsecondary Research.
City University of New York. 2012. “About.” Web site: http://www.cuny.edu/about.html.
Engstrom, Catherine, and Vincent Tinto. 2007. Pathways to Student Success: The Impact of Learning Communities on the Success of Academically Under-Prepared College Students. Menlo Park: CA: The William and Flora Hewlett Foundation. Web site: http://www.hewlett.org/uploads/files/PathwaystoStudentSuccess.pdf.
Engstrom, Cathy McHugh, and Vincent Tinto. 2008. “Learning Better Together: The Impact of Learning Communities on the Persistence of Low-Income Students.” Opportunity Matters 1: 5-21.
Integrated Postsecondary Education Data System (IPEDS). 2012. “About IPEDS.” Web site: http://nces.ed.gov/ipeds/about/.
Kingsborough Community College. 2012. Web site: http://www.kbcc.cuny.edu/.
Martorell, Paco, and Isaac McFarlin. 2007. “Help or Hindrance? The Effects of College Remedia-tion on Labor Market Outcomes.” The Review of Economics and Statistics 93, 2: 436-454.
National Student Clearinghouse. 2012. “About the Clearinghouse.” Web site: http://www.studentclearinghouse.org/about/aboutus.htm.
Scrivener, Susan, and Erin Coghlan. 2011. Opening Doors to Student Success: A Synthesis of Findings from an Evaluation at Six Community Colleges. New York: MDRC.
Scrivener, Susan, Dan Bloom, Allen LeBlanc, Christina Paxson, Cecilia Elena Rouse, and Colleen Sommo with Jenny Au, Jedediah J. Teres, and Susan Yeh. 2008. A Good Start: Two-Year Ef-fects of a Freshman Learning Community Program at Kingsborough Community College. New York: MDRC.
Tinto, Vincent. 1997. “Classrooms as Communities: Exploring the Educational Character of Student Persistence.” Journal of Higher Education 68, 6: 599-623.

92
Tinto, Vincent. 1998. Learning Communities and the Reconstruction of Remedial Education in Higher Learning. Paper presented at the Conference on Replacing Remediation in Higher Edu-cation, January 26-27, at Stanford University, Stanford, CA.
U.S. Census Bureau. 2010a. “Language Spoken at Home.” 2010 American Community Survey 1-Year Estimates. Web site: http://factfinder2.census.gov.
U.S. Census Bureau. 2010b. “Race and Hispanic or Latino Origin: 2010.” 2010 Census Summary File 1. Web site: http://factfinder2.census.gov.
U.S. Department of Education, National Center for Education Statistics. 2011. Web Tables — Community College Student Outcomes: 1994-2009 (NCES 2012-253). Washington, DC: U.S. Department of Education.
Visher, Mary, Michael Weiss, Evan Weissman, Timothy Rudd, and Heather Wathington with Jedediah Teres and Kelley Fong. 2012. The Effects of Learning Communities for Students in Developmental Education: A Synthesis of Findings from Six Community Colleges. New York: National Center for Postsecondary Research.
Weiss, Michael, Thomas Brock, Colleen Sommo, Timothy Rudd, and Mary Clair Turner. 2011. Serving Community College Students on Probation: Four-Year Findings from Chaffey Col-lege’s Opening Doors Program. New York: MDRC.

93
EARLIER MDRC PUBLICATIONS ON OPENING DOORS Serving Community College Students on Probation Four-Year Findings from Chaffey College’s Opening Doors Program 2011. Michael Weiss, Thomas Brock, Colleen Sommo, Timothy Rudd, Mary Clair Turner Opening Doors to Student Success A Synthesis of Findings from an Evaluation at Six Community Colleges 2011. Susan Scrivener, Erin Coghlan Getting Back on Track Effects of a Community College Program for Probationary Students 2009. Susan Scrivener, Colleen Sommo, Herbert Collado Rewarding Persistence Effects of a Performance-Based Scholarship Program for Low-Income Parents 2009. Lashawn Richburg-Hayes, Thomas Brock, Allen LeBlanc, Christina Paxson, Cecilia Elena Rouse, Lisa Barrow A Good Start Two-Year Effects of a Freshmen Learning Community Program at Kingsborough Community College 2008. Susan Scrivener, Dan Bloom, Allen LeBlanc, Christina Paxson, Cecilia Elena Rouse, Colleen Sommo with Jenny Au, Jedediah J. Teres, Susan Yeh Helping Low-Wage Workers Persist in Education Programs Lessons from Research on Welfare Training Programs and Two Promising Community College Strategies 2008. Lashawn Richburg-Hayes Enhancing Student Services at Lorain County Community College Early Results from the Opening Doors Demonstration in Ohio 2007. Susan Scrivener, Jenny Au Enhancing Student Services at Owens Community College Early Results from the Opening Doors Demonstration in Ohio 2007. Susan Scrivener, Michael Pih A Whole ’Nother World Students Navigating Community College 2006. Alissa Gardenhire-Crooks, Herbert Collado, Barbara Ray Paying for Persistence Early Results of a Louisiana Scholarship Program for Low-Income Parents Attending Community College 2006. Thomas Brock, Lashawn Richburg-Hayes

94
Building Learning Communities Early Results from the Opening Doors Demonstration at Kingsborough Community College 2005. Dan Bloom, Colleen Sommo Promoting Student Success in Community College and Beyond The Opening Doors Demonstration 2005. Thomas Brock, Allen LeBlanc with Casey MacGregor Support Success Services That May Help Low-Income Students Succeed in Community College 2004. Rogéair Purnell, Susan Blank with Susan Scrivener, Reishma Seupersad Changing Courses Instructional Innovations That Help Low-Income Students Succeed in Community College 2003. Richard Kazis, Marty Liebowitz Money Matters How Financial Aid Affects Nontraditional Students in Community Colleges 2003. Victoria Choitz, Rebecca Widom Supporting CalWORKs Students at California Community Colleges An Exploratory Focus Group Study 2003. Laura Nelson, Rogéair Purnell Opening Doors Students' Perspectives on Juggling Work, Family, and College 2002. Lisa Matus-Grossman, Susan Gooden with Melissa Wavelet, Melisa Diaz, Reishma Seupersad Welfare Reform and Community Colleges A Policy and Research Context 2002. Thomas Brock, Lisa Matus-Grossman, Gayle Hamilton Opening Doors to Earning Credentials Impressions of Community College Access and Retention from Low-Wage Workers 2001. Lisa Matus-Grossman, Susan Tinsley Gooden Opening Doors Expanding Educational Opportunities for Low-Income Workers Published with the National Governors Association Center for Best Practices 2001. Susan Golonka, Lisa Matus-Grossman

About MDRC
MDRC is a nonprofit, nonpartisan social and education policy research organization dedicated to learning what works to improve the well-being of low-income people. Through its research and the active communication of its findings, MDRC seeks to enhance the effectiveness of so-cial and education policies and programs.
Founded in 1974 and located in New York City and Oakland, California, MDRC is best known for mounting rigorous, large-scale, real-world tests of new and existing policies and programs. Its projects are a mix of demonstrations (field tests of promising new program approaches) and evaluations of ongoing government and community initiatives. MDRC’s staff bring an unusual combination of research and organizational experience to their work, providing expertise on the latest in qualitative and quantitative methods and on program design, development, implementa-tion, and management. MDRC seeks to learn not just whether a program is effective but also how and why the program’s effects occur. In addition, it tries to place each project’s findings in the broader context of related research — in order to build knowledge about what works across the social and education policy fields. MDRC’s findings, lessons, and best practices are proac-tively shared with a broad audience in the policy and practitioner community as well as with the general public and the media.
Over the years, MDRC has brought its unique approach to an ever-growing range of policy are-as and target populations. Once known primarily for evaluations of state welfare-to-work pro-grams, today MDRC is also studying public school reforms, employment programs for ex-offenders and people with disabilities, and programs to help low-income students succeed in college. MDRC’s projects are organized into five areas:
• Promoting Family Well-Being and Children’s Development
• Improving Public Education
• Raising Academic Achievement and Persistence in College
• Supporting Low-Wage Workers and Communities
• Overcoming Barriers to Employment
Working in almost every state, all of the nation’s largest cities, and Canada and the United Kingdom, MDRC conducts its projects in partnership with national, state, and local govern-ments, public school systems, community organizations, and numerous private philanthropies.
