combustion chamber liners
DESCRIPTION
a full idea is focusedTRANSCRIPT
Proceedings of ICFD 10: Tenth International Congress of Fluid Dynamics
December 16-19, 2010, Stella Di Mare Sea Club Hotel, Ain Soukhna, Red Sea, Egypt ICFD10-EG-30I3
Keynote Speakers: Dr. S. A. Channiwala & Dr. Digvijay B. Kulshreshtha Page 1 Copyright © 2010 by ICFD 10
NUMERICAL SIMULATION APPROACH AS DESIGN OPTIMIZATION FOR MICRO COMBUSTION CHAMBERS
Dr. S. A. Channwala* & Dr. Digvijay Kulshreshtha#
*In-charge Director & Professor, Mechanical Engineering Department,
S.V. National Institute of Technology, Surat – 395007, India #Assistant Professor, Mechanical Engineering Department,
C. K. Pithawalla College of Engineering and Technology, Surat – 395007, India
We take this opportunity to thank the Organizers of 10th ASME International Congress on Fluid
Dynamics to present a keynote paper to this audience of International Experts in the field of
Fluid Dynamics and Combustion.
INTRODUCTION
The design of gas turbine combustion chamber is based on combined theoretical and empirical
approach and the design of combustion chamber is a less than the exact science. A technical
discussion on combustion technology status and needs will show that the classic impediments
that have hampered progress towards near stoichiometric combustion still exist. The process of
combustor design has taken a new meaning over the past several years as three dimensional
codes and other advanced design and validation tools have finally changed the approach from a
“cut and burn” technique to a much more analytical process.
Mixing processes are of paramount importance in the combustion and dilution zones. In the
primary zone, good mixing is essential for high burning rates and to minimize soot and nitric
oxide formation, whereas the attainment of a satisfactory temperature distribution (pattern factor)
in the exhaust gases is very dependent on the degree of mixing between air and combustion
products in the dilution zone. A primary objective of combustor design is to achieve satisfactory
mixing within the liner and a stable flow pattern throughout the entire combustor, with no
Proceedings of ICFD 10: Tenth International Congress of Fluid Dynamics
December 16-19, 2010, Stella Di Mare Sea Club Hotel, Ain Soukhna, Red Sea, Egypt ICFD10-EG-30I3
Keynote Speakers: Dr. S. A. Channiwala & Dr. Digvijay B. Kulshreshtha Page 2 Copyright © 2010 by ICFD 10
parasitic losses and with minimal length and pressure loss. Successful aerodynamic design
demands knowledge of flow recirculation, jet penetration and mixing, and discharge coefficients
for all types of air admission holes, including cooling slots.
Good amount of literature is available on modeling of the process of combustion for kerosene
and hydrocarbon fuels (Wooley et al. [1], Phillipe et al. [2], Z. Wen et al. [3], E. Reismeier et al.
[4], Sierra et al. [5] B. Zamuner [6], Grinstein et al. [7], Caraeni et al. [8], Gran et al. [9], Shyy et
al. [10, 11], Cooke et al. [12]). Charles K. Westbrook et al. [13] have reviewed the progress in
the field of computational combustion over last 50 years encompassing 3D DNS and LES
approaches. They have observed that many commercial CFD codes uses unstructured grid which
offer the advantage of being more suitable to massively parallel computing environment, as well
as an ability to deal with complex geometries.
The paper presents the design of tubular and annular combustion chamber followed by three
dimensional simulations in tubular and annular combustor with full film cooling to investigate
the velocity profiles, species concentration and temperature distribution within the liner. The fuel
under consideration is hydrogen and primary zone equivalence ratio variation from 0.5 to 1.6
were simulated. Reactive flow calculations were carried out with 19 reversible reactions and nine
species. The computational approach attempts to strike a reasonable balance to handle the
competing aspects of the complicated physical and chemical interactions of the flow and the
requirements in resolving the three-dimensional geometrical constraints of the combustor
contours, cooling slots, and circular dilution holes. The modeling employs non-orthogonal
curvilinear coordinates, second-order accurate discretisation, multi-grid iterative solution
procedure, the SST k -ω turbulence model, and a combustion model comprising of an assumed
probability density function flamelet concept. The complicated mixing process can be better
understood with more detailed information supplied by the numerical simulation. Accordingly,
in present study an attempt has been made through CFD approach using CFX 12 to analyze the
flow patterns within the combustion liner and through different air admission holes, namely,
primary zone, intermediate zone, dilution zone and wall cooling, and from these the temperature
distribution in the liner and at walls as well as the temperature quality at the exit of the
Proceedings of ICFD 10: Tenth International Congress of Fluid Dynamics
December 16-19, 2010, Stella Di Mare Sea Club Hotel, Ain Soukhna, Red Sea, Egypt ICFD10-EG-30I3
Keynote Speakers: Dr. S. A. Channiwala & Dr. Digvijay B. Kulshreshtha Page 3 Copyright © 2010 by ICFD 10
combustion chamber is obtained for tubular and annular combustion chambers designed for gas
turbine engine.
DESIGN OF COMBUSTION CHAMBER
Basic Terminology
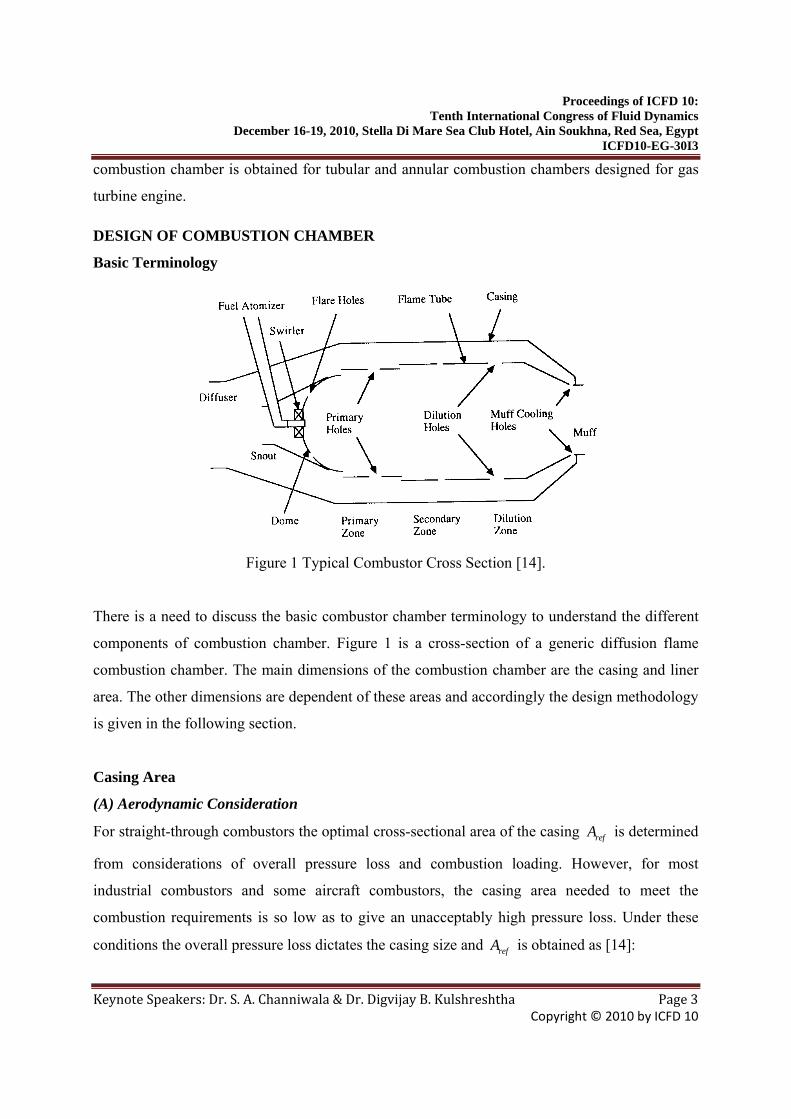
Figure 1 Typical Combustor Cross Section [14].
There is a need to discuss the basic combustor chamber terminology to understand the different
components of combustion chamber. Figure 1 is a cross-section of a generic diffusion flame
combustion chamber. The main dimensions of the combustion chamber are the casing and liner
area. The other dimensions are dependent of these areas and accordingly the design methodology
is given in the following section.
Casing Area
(A) Aerodynamic Consideration
For straight-through combustors the optimal cross-sectional area of the casing refA is determined
from considerations of overall pressure loss and combustion loading. However, for most
industrial combustors and some aircraft combustors, the casing area needed to meet the
combustion requirements is so low as to give an unacceptably high pressure loss. Under these
conditions the overall pressure loss dictates the casing size and refA is obtained as [14]:
Proceedings of ICFD 10: Tenth International Congress of Fluid Dynamics
December 16-19, 2010, Stella Di Mare Sea Club Hotel, Ain Soukhna, Red Sea, Egypt ICFD10-EG-30I3
Keynote Speakers: Dr. S. A. Channiwala & Dr. Digvijay B. Kulshreshtha Page 4 Copyright © 2010 by ICFD 10
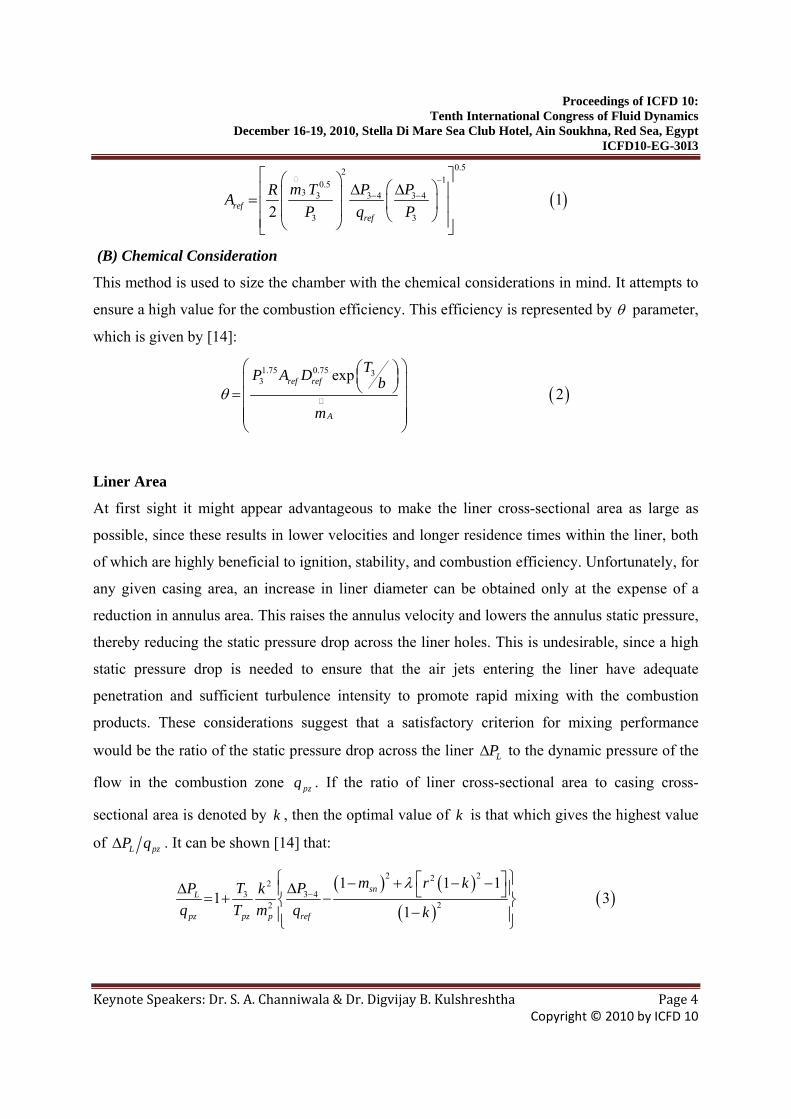
( )
0.5210.5
3 3 3 4 3 4
3 3
12ref
ref
m T P PRAP q P
−
− −
⎡ ⎤⎛ ⎞ ⎛ ⎞Δ Δ⎢ ⎥⎜ ⎟= ⎜ ⎟⎢ ⎥⎜ ⎟ ⎝ ⎠⎢ ⎥⎝ ⎠⎣ ⎦ (B) Chemical Consideration
This method is used to size the chamber with the chemical considerations in mind. It attempts to
ensure a high value for the combustion efficiency. This efficiency is represented by θ parameter,
which is given by [14]:
( )1.75 0.75 3
3 exp2
ref ref
A
TP A D b
mθ
⎛ ⎞⎛ ⎞⎜ ⎟⎜ ⎟⎝ ⎠=⎜ ⎟⎜ ⎟⎜ ⎟⎝ ⎠
Liner Area
At first sight it might appear advantageous to make the liner cross-sectional area as large as
possible, since these results in lower velocities and longer residence times within the liner, both
of which are highly beneficial to ignition, stability, and combustion efficiency. Unfortunately, for
any given casing area, an increase in liner diameter can be obtained only at the expense of a
reduction in annulus area. This raises the annulus velocity and lowers the annulus static pressure,
thereby reducing the static pressure drop across the liner holes. This is undesirable, since a high
static pressure drop is needed to ensure that the air jets entering the liner have adequate
penetration and sufficient turbulence intensity to promote rapid mixing with the combustion
products. These considerations suggest that a satisfactory criterion for mixing performance
would be the ratio of the static pressure drop across the liner LPΔ to the dynamic pressure of the
flow in the combustion zone pzq . If the ratio of liner cross-sectional area to casing cross-
sectional area is denoted by k , then the optimal value of k is that which gives the highest value
of L pzP qΔ . It can be shown [14] that:
( ) ( )( )
( )2 222
3 3 422
1 1 11 3
1
snL
pz pz p ref
m r kT PP kq T m q k
λ−
⎧ ⎫⎡ ⎤− + − −ΔΔ ⎪ ⎪⎣ ⎦= + −⎨ ⎬−⎪ ⎪⎩ ⎭
Proceedings of ICFD 10: Tenth International Congress of Fluid Dynamics
December 16-19, 2010, Stella Di Mare Sea Club Hotel, Ain Soukhna, Red Sea, Egypt ICFD10-EG-30I3
Keynote Speakers: Dr. S. A. Channiwala & Dr. Digvijay B. Kulshreshtha Page 5 Copyright © 2010 by ICFD 10
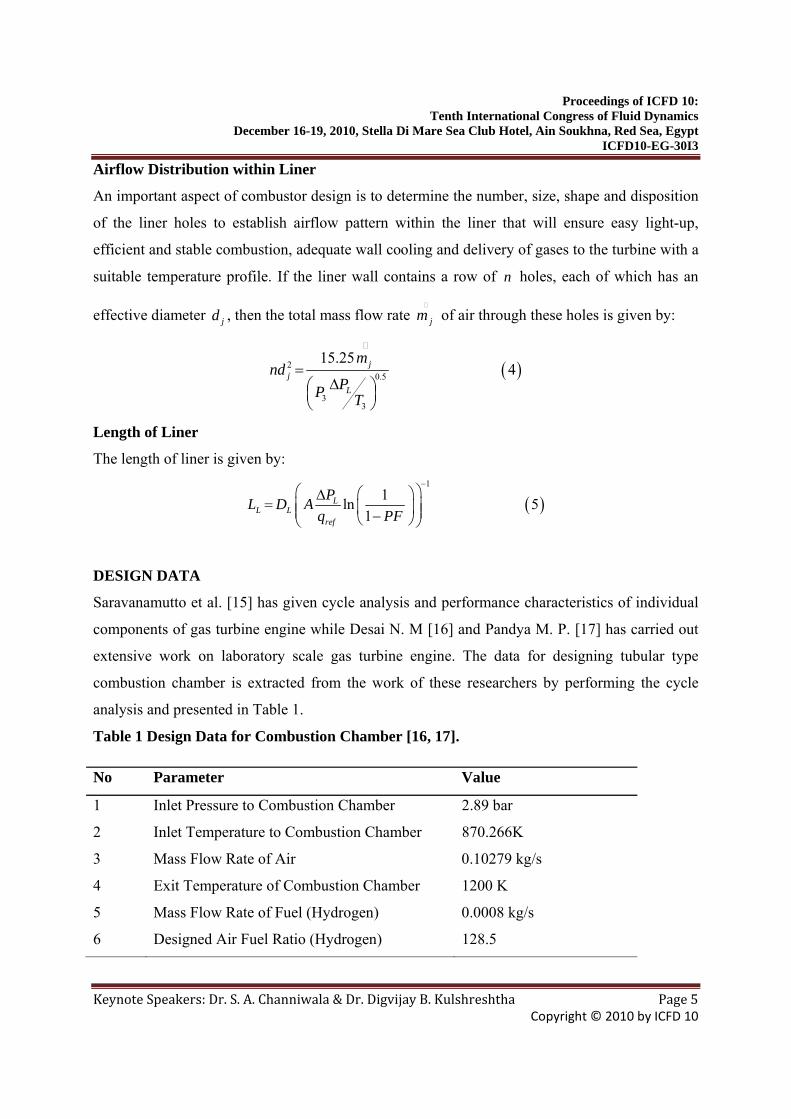
Airflow Distribution within Liner
An important aspect of combustor design is to determine the number, size, shape and disposition
of the liner holes to establish airflow pattern within the liner that will ensure easy light-up,
efficient and stable combustion, adequate wall cooling and delivery of gases to the turbine with a
suitable temperature profile. If the liner wall contains a row of n holes, each of which has an
effective diameter jd , then the total mass flow rate jm of air through these holes is given by:
( )20.5
33
15.254j
jL
mnd
PP T
=Δ⎛ ⎞⎜ ⎟
⎝ ⎠ Length of Liner
The length of liner is given by:
( )1
1ln 51
LL L
ref
PL D Aq PF
−⎛ ⎞⎛ ⎞Δ
= ⎜ ⎟⎜ ⎟⎜ ⎟−⎝ ⎠⎝ ⎠
DESIGN DATA
Saravanamutto et al. [15] has given cycle analysis and performance characteristics of individual
components of gas turbine engine while Desai N. M [16] and Pandya M. P. [17] has carried out
extensive work on laboratory scale gas turbine engine. The data for designing tubular type
combustion chamber is extracted from the work of these researchers by performing the cycle
analysis and presented in Table 1.
Table 1 Design Data for Combustion Chamber [16, 17].
No Parameter Value
1 Inlet Pressure to Combustion Chamber 2.89 bar
2 Inlet Temperature to Combustion Chamber 870.266K
3 Mass Flow Rate of Air 0.10279 kg/s
4 Exit Temperature of Combustion Chamber 1200 K
5 Mass Flow Rate of Fuel (Hydrogen) 0.0008 kg/s
6 Designed Air Fuel Ratio (Hydrogen) 128.5
Proceedings of ICFD 10: Tenth International Congress of Fluid Dynamics
December 16-19, 2010, Stella Di Mare Sea Club Hotel, Ain Soukhna, Red Sea, Egypt ICFD10-EG-30I3
Keynote Speakers: Dr. S. A. Channiwala & Dr. Digvijay B. Kulshreshtha Page 6 Copyright © 2010 by ICFD 10
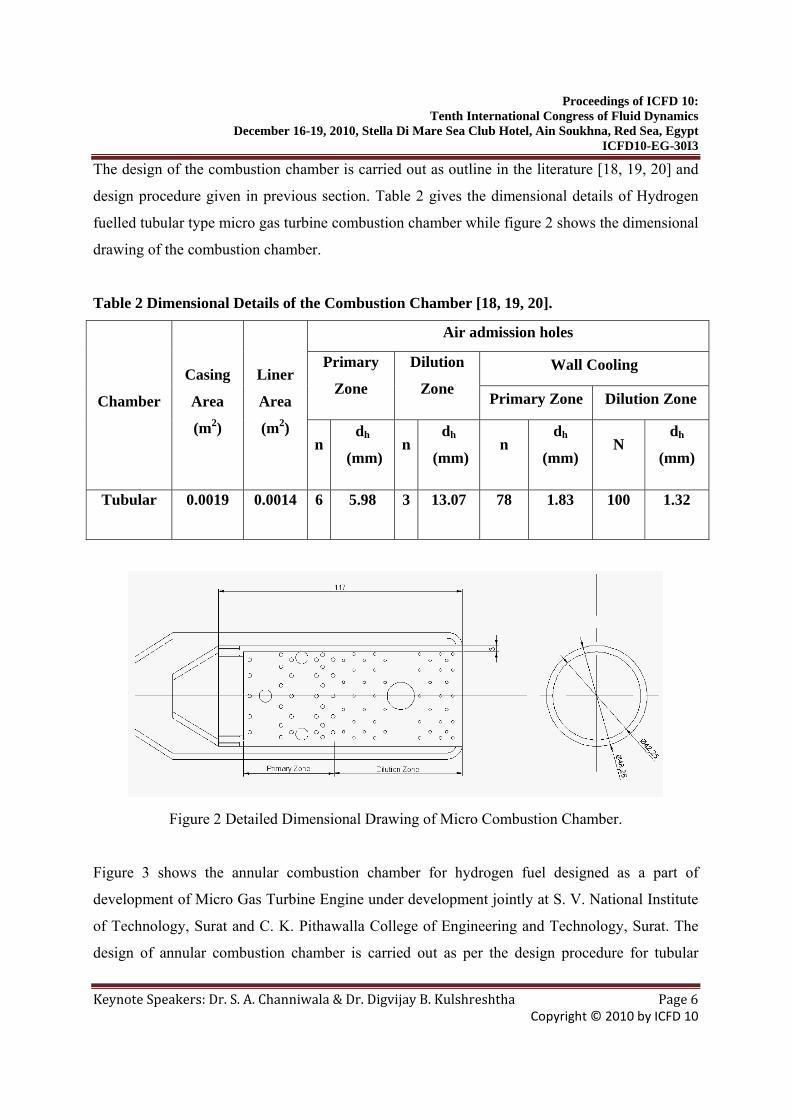
The design of the combustion chamber is carried out as outline in the literature [18, 19, 20] and
design procedure given in previous section. Table 2 gives the dimensional details of Hydrogen
fuelled tubular type micro gas turbine combustion chamber while figure 2 shows the dimensional
drawing of the combustion chamber.
Table 2 Dimensional Details of the Combustion Chamber [18, 19, 20].
Chamber
Casing
Area
(m2)
Liner
Area
(m2)
Air admission holes
Primary
Zone
Dilution
Zone Wall Cooling
Primary Zone Dilution Zone
n dh
(mm) n
dh
(mm) n
dh
(mm) N
dh
(mm)
Tubular 0.0019 0.0014 6 5.98 3 13.07 78 1.83 100 1.32
Figure 2 Detailed Dimensional Drawing of Micro Combustion Chamber.
Figure 3 shows the annular combustion chamber for hydrogen fuel designed as a part of
development of Micro Gas Turbine Engine under development jointly at S. V. National Institute
of Technology, Surat and C. K. Pithawalla College of Engineering and Technology, Surat. The
design of annular combustion chamber is carried out as per the design procedure for tubular
Proceedings of ICFD 10: Tenth International Congress of Fluid Dynamics
December 16-19, 2010, Stella Di Mare Sea Club Hotel, Ain Soukhna, Red Sea, Egypt ICFD10-EG-30I3
Keynote Speakers: Dr. S. A. Channiwala & Dr. Digvijay B. Kulshreshtha Page 7 Copyright © 2010 by ICFD 10
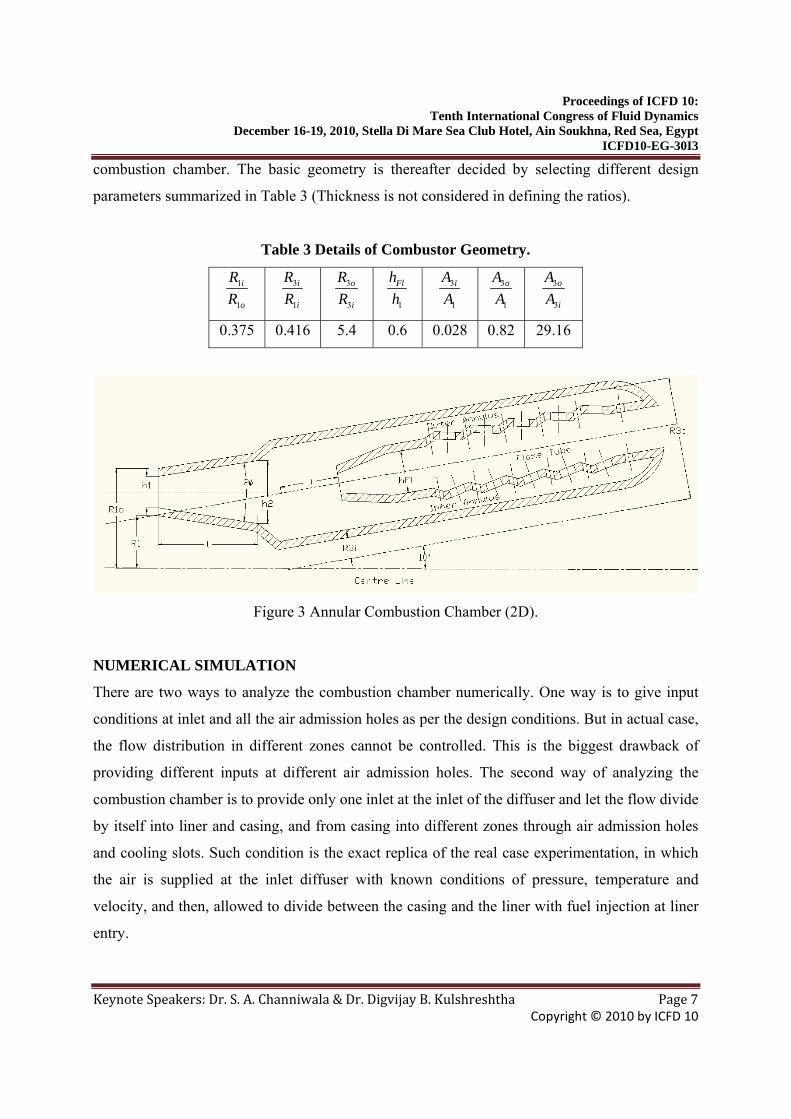
combustion chamber. The basic geometry is thereafter decided by selecting different design
parameters summarized in Table 3 (Thickness is not considered in defining the ratios).
Table 3 Details of Combustor Geometry.
1
1
i
o
RR
3
1
i
i
RR
3
3
o
i
RR
1
Flhh
3
1
iAA
3
1
oAA
3
3
o
i
AA
0.375 0.416 5.4 0.6 0.028 0.82 29.16
Figure 3 Annular Combustion Chamber (2D).
NUMERICAL SIMULATION
There are two ways to analyze the combustion chamber numerically. One way is to give input
conditions at inlet and all the air admission holes as per the design conditions. But in actual case,
the flow distribution in different zones cannot be controlled. This is the biggest drawback of
providing different inputs at different air admission holes. The second way of analyzing the
combustion chamber is to provide only one inlet at the inlet of the diffuser and let the flow divide
by itself into liner and casing, and from casing into different zones through air admission holes
and cooling slots. Such condition is the exact replica of the real case experimentation, in which
the air is supplied at the inlet diffuser with known conditions of pressure, temperature and
velocity, and then, allowed to divide between the casing and the liner with fuel injection at liner
entry.
Proceedings of ICFD 10: Tenth International Congress of Fluid Dynamics
December 16-19, 2010, Stella Di Mare Sea Club Hotel, Ain Soukhna, Red Sea, Egypt ICFD10-EG-30I3
Keynote Speakers: Dr. S. A. Channiwala & Dr. Digvijay B. Kulshreshtha Page 8 Copyright © 2010 by ICFD 10
Basic Assumptions and Boundary Condition
• The combustion chamber is analyzed by a single entry at diffuser
• The flow is allowed to divide by itself into liner and casing, and from casing into different
zones through air admission holes and cooling slots.
• Such condition is the exact replica of the real case experimentation, in which the air is
supplied at the inlet diffuser with known conditions of pressure, temperature and velocity,
and then, allowed to divide between the casing and the liner.
• Majority of the researchers working in the area of computational combustion have selected k
– ε model to capture physics of turbulence [21, 22]. The k – ε model under predicts
separation and is highly inaccurate with swirling flows and flows with strong streamline
curvature. In comparison to k – ε, SST k – ω accounts for the transport of the turbulent shear
stress and gives highly accurate predictions of the onset and the amount of flow separation.
Also, the model can be used with coarser near-wall mesh and produce valid results.
• A large variety of kinetic schemes and mechanisms varying from very complex schemes to
single step fast chemistry is available for hydrocarbon combustion [23, 24]. Few researchers
have observed that reduced kinetic and single step chemistry offers reasonable predictions
with limited computational power [25, 26]. But single step chemistry over predicts the
temperature levels along the combustor and hence gas-phase reaction model for the
combustion of hydrogen and air mixture consists of 19 reversible elementary reactions and
nine species was selected.
• Wall boundary condition and heat loss does influence the flame structure and predictions of
temperature levels in combustion system [27, 28]. In present case, for the 3D calculations
with CFX, the adiabatic system model is used because of large mass flow rate of air through
annulus which keeps wall cooled casing nearly at ambient temperature.
GRID INDEPENDENCY
The three-dimensional grid independent study was carried out with number of nodes varying
from 145000 to 234000 nodes. The simulation results do not vary comprehensively between
nodes of 176000 to 234000 and hence a grid with 195000 nodes was selected for CFD
simulations. The grid spacing selected is similar to the Eulerian grid and is finest at the nozzle
Proceedings of ICFD 10: Tenth International Congress of Fluid Dynamics
December 16-19, 2010, Stella Di Mare Sea Club Hotel, Ain Soukhna, Red Sea, Egypt ICFD10-EG-30I3
Keynote Speakers: Dr. S. A. Channiwala & Dr. Digvijay B. Kulshreshtha Page 9 Copyright © 2010 by ICFD 10
exit and becomes gradually coarser away from the nozzle. Due to unstructured grid high
resolution advection scheme is selected for additional accuracy.
CFD MODELING OF HYDROGEN FUEL
The mixing process occurs within the combustion chamber which is also part of the simulated
region and so a non-premixed model was used. The gas-phase reaction model for the combustion
of hydrogen and air mixture consists of 19 reversible elementary reactions and nine species.
Third body efficiencies for all intermolecular reactions are 2.5 for H2, 16 for H2O, and 1.0 for all
the rest of species, as reported in Tien and Stalker [29]. The combustor modeling is carried out
using eddy dissipation model based on the concept that chemical reaction is fast relative to the
transport processes in the flow. When reactants mix at the molecular level, they instantaneously
form products. The CFD Models are summarized in table 4.
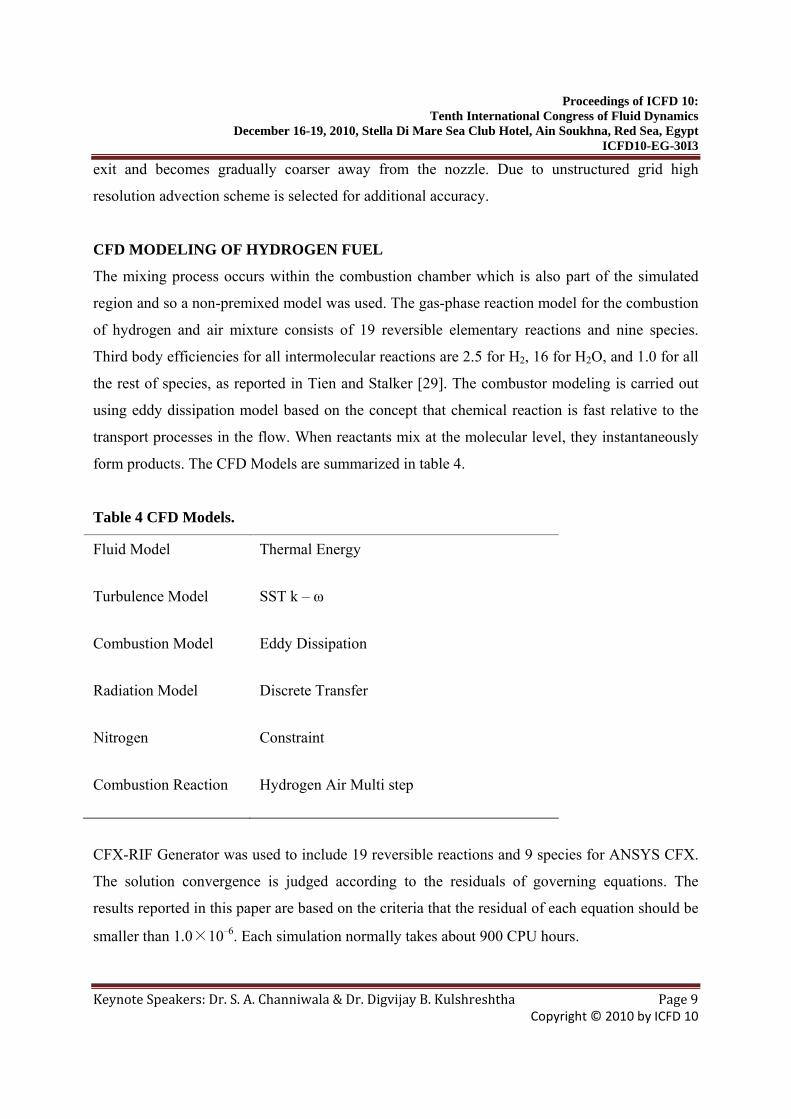
Table 4 CFD Models.
Fluid Model Thermal Energy
Turbulence Model SST k – ω
Combustion Model Eddy Dissipation
Radiation Model Discrete Transfer
Nitrogen Constraint
Combustion Reaction Hydrogen Air Multi step
CFX-RIF Generator was used to include 19 reversible reactions and 9 species for ANSYS CFX.
The solution convergence is judged according to the residuals of governing equations. The
results reported in this paper are based on the criteria that the residual of each equation should be
smaller than 1.0×10⁻⁶. Each simulation normally takes about 900 CPU hours.
Proceedings of ICFD 10: Tenth International Congress of Fluid Dynamics
December 16-19, 2010, Stella Di Mare Sea Club Hotel, Ain Soukhna, Red Sea, Egypt ICFD10-EG-30I3
Keynote Speakers: Dr. S. A. Channiwala & Dr. Digvijay B. Kulshreshtha Page 10 Copyright © 2010 by ICFD 10
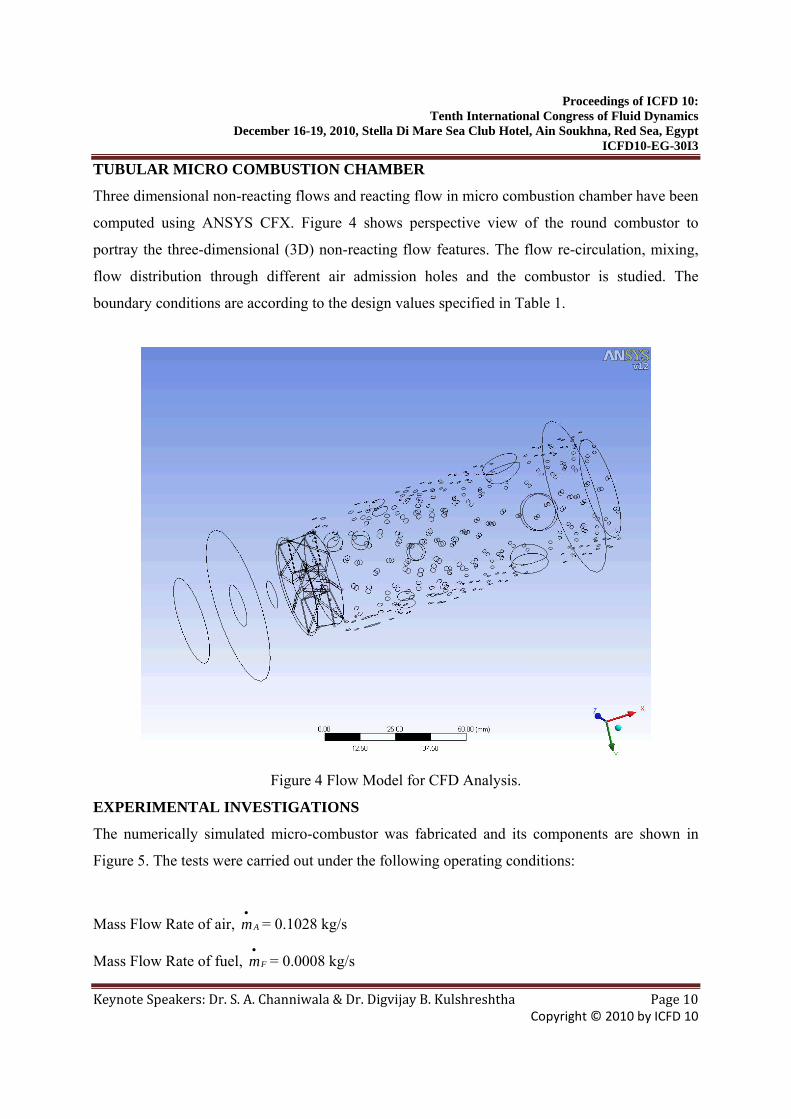
TUBULAR MICRO COMBUSTION CHAMBER
Three dimensional non-reacting flows and reacting flow in micro combustion chamber have been
computed using ANSYS CFX. Figure 4 shows perspective view of the round combustor to
portray the three-dimensional (3D) non-reacting flow features. The flow re-circulation, mixing,
flow distribution through different air admission holes and the combustor is studied. The
boundary conditions are according to the design values specified in Table 1.
Figure 4 Flow Model for CFD Analysis.
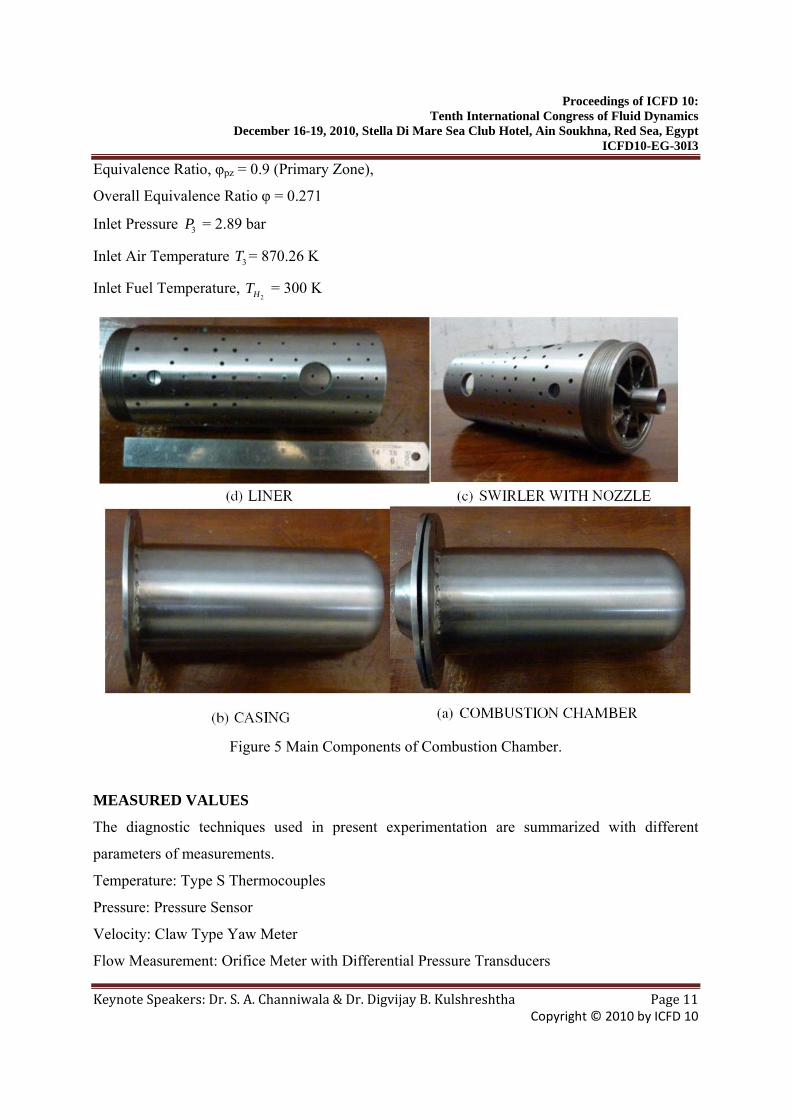
EXPERIMENTAL INVESTIGATIONS
The numerically simulated micro-combustor was fabricated and its components are shown in
Figure 5. The tests were carried out under the following operating conditions:
Mass Flow Rate of air, Am•
= 0.1028 kg/s
Mass Flow Rate of fuel, Fm•
= 0.0008 kg/s
Proceedings of ICFD 10: Tenth International Congress of Fluid Dynamics
December 16-19, 2010, Stella Di Mare Sea Club Hotel, Ain Soukhna, Red Sea, Egypt ICFD10-EG-30I3
Keynote Speakers: Dr. S. A. Channiwala & Dr. Digvijay B. Kulshreshtha Page 11 Copyright © 2010 by ICFD 10
Equivalence Ratio, φpz = 0.9 (Primary Zone),
Overall Equivalence Ratio φ = 0.271
Inlet Pressure 3P = 2.89 bar
Inlet Air Temperature 3T = 870.26 K
Inlet Fuel Temperature, 2HT = 300 K
Figure 5 Main Components of Combustion Chamber.
MEASURED VALUES
The diagnostic techniques used in present experimentation are summarized with different
parameters of measurements.
Temperature: Type S Thermocouples
Pressure: Pressure Sensor
Velocity: Claw Type Yaw Meter
Flow Measurement: Orifice Meter with Differential Pressure Transducers
Proceedings of ICFD 10: Tenth International Congress of Fluid Dynamics
December 16-19, 2010, Stella Di Mare Sea Club Hotel, Ain Soukhna, Red Sea, Egypt ICFD10-EG-30I3
Keynote Speakers: Dr. S. A. Channiwala & Dr. Digvijay B. Kulshreshtha Page 12 Copyright © 2010 by ICFD 10
The uncertainty analysis for temperature, flow measurement, pressure and velocity is carried out
as per ASTM and ASME standards [30, 31]. The uncertainty in measurement is in the range of
±3% maximum with a confidence level of 95%.
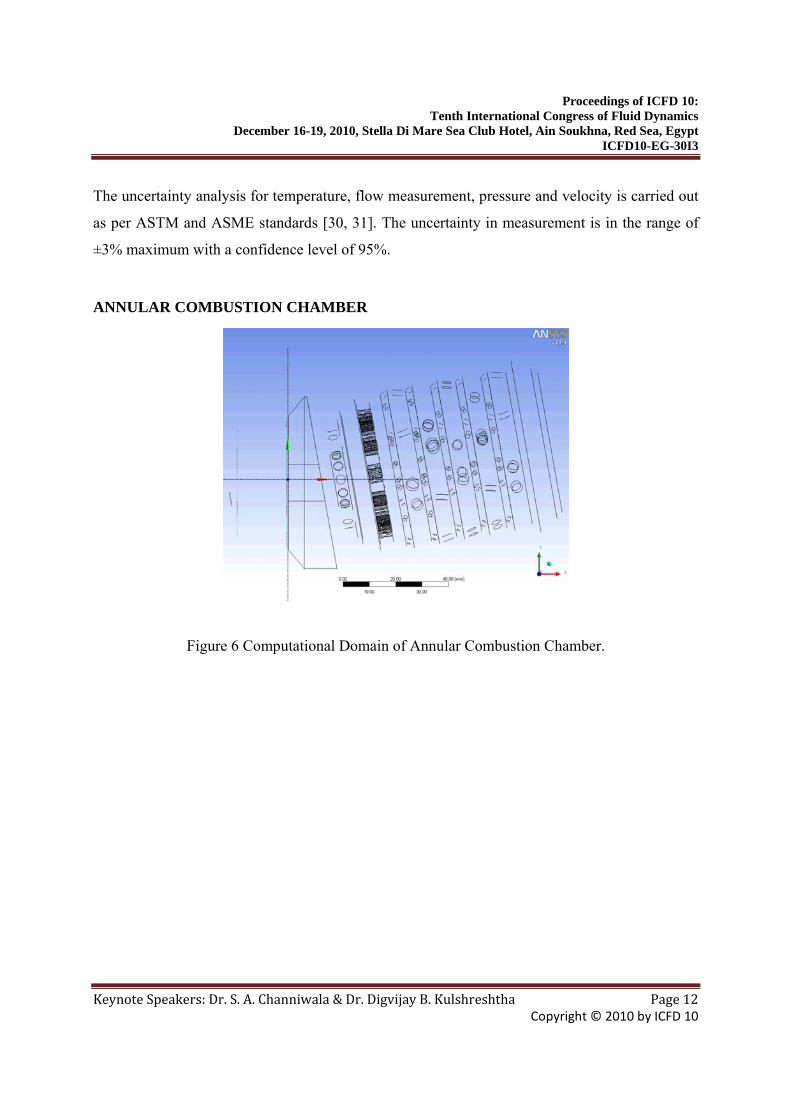
ANNULAR COMBUSTION CHAMBER
Figure 6 Computational Domain of Annular Combustion Chamber.
Proceedings of ICFD 10: Tenth International Congress of Fluid Dynamics
December 16-19, 2010, Stella Di Mare Sea Club Hotel, Ain Soukhna, Red Sea, Egypt ICFD10-EG-30I3
Keynote Speakers: Dr. S. A. Channiwala & Dr. Digvijay B. Kulshreshtha Page 13 Copyright © 2010 by ICFD 10
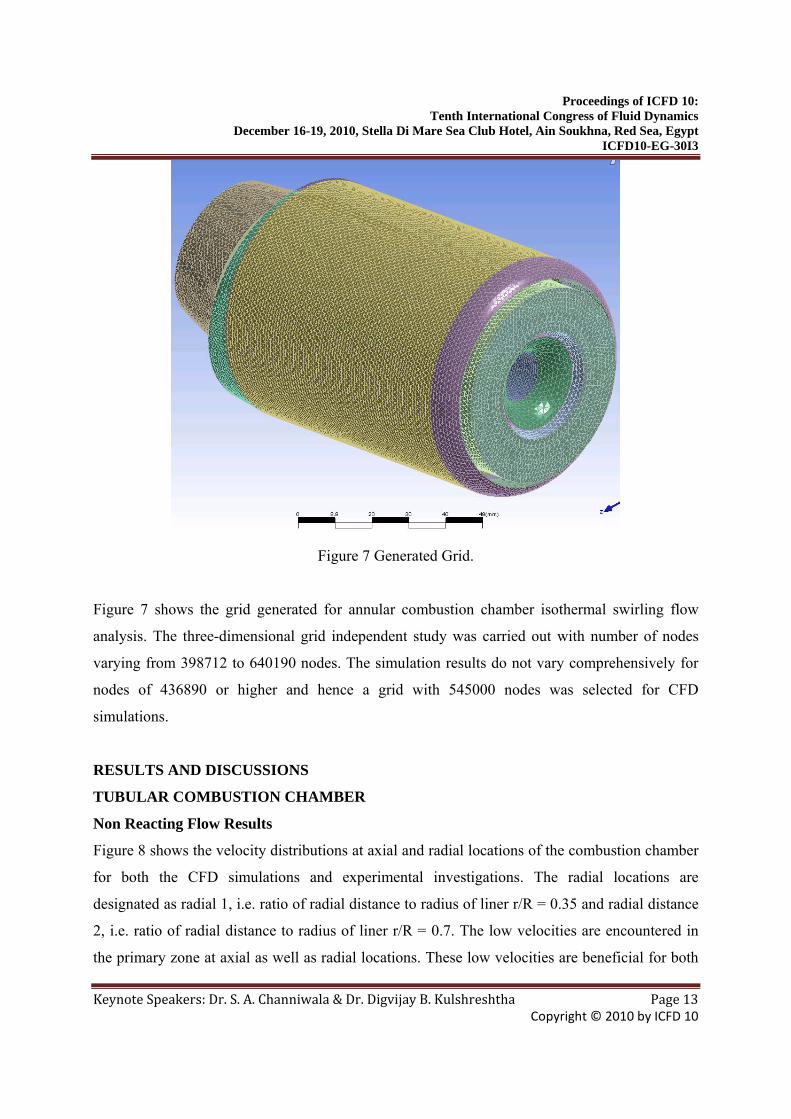
Figure 7 Generated Grid.
Figure 7 shows the grid generated for annular combustion chamber isothermal swirling flow
analysis. The three-dimensional grid independent study was carried out with number of nodes
varying from 398712 to 640190 nodes. The simulation results do not vary comprehensively for
nodes of 436890 or higher and hence a grid with 545000 nodes was selected for CFD
simulations.
RESULTS AND DISCUSSIONS
TUBULAR COMBUSTION CHAMBER
Non Reacting Flow Results
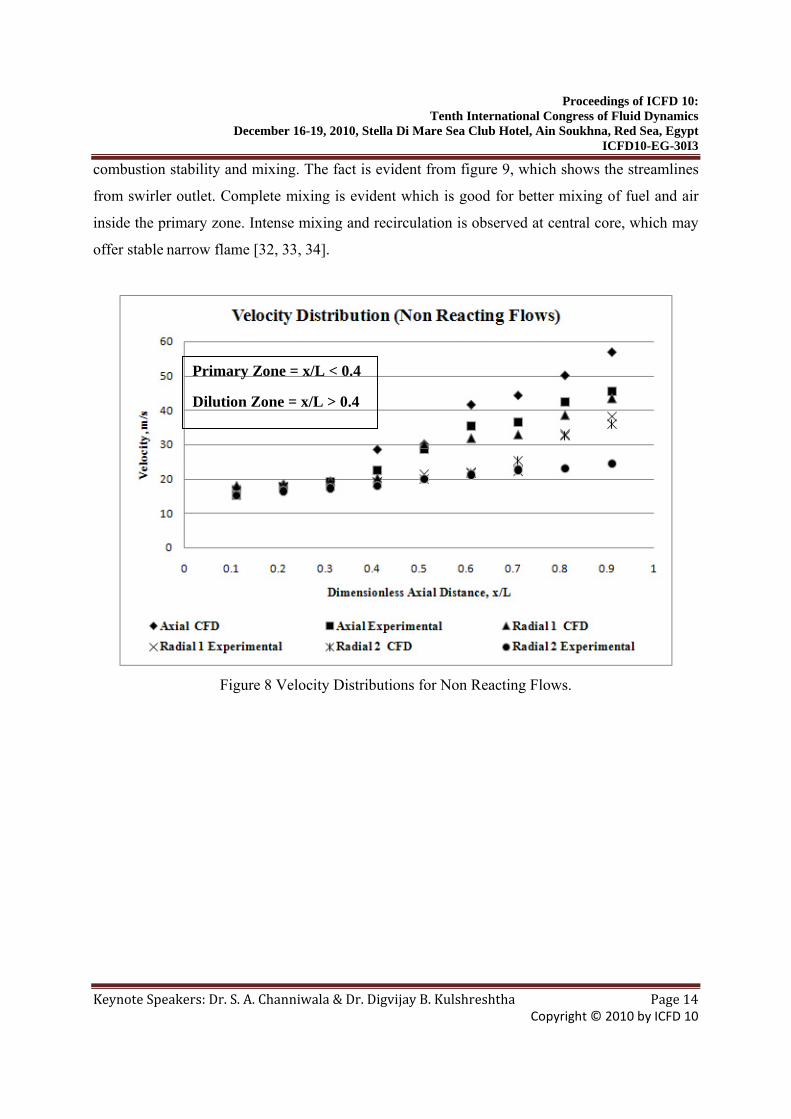
Figure 8 shows the velocity distributions at axial and radial locations of the combustion chamber
for both the CFD simulations and experimental investigations. The radial locations are
designated as radial 1, i.e. ratio of radial distance to radius of liner r/R = 0.35 and radial distance
2, i.e. ratio of radial distance to radius of liner r/R = 0.7. The low velocities are encountered in
the primary zone at axial as well as radial locations. These low velocities are beneficial for both
Proceedings of ICFD 10: Tenth International Congress of Fluid Dynamics
December 16-19, 2010, Stella Di Mare Sea Club Hotel, Ain Soukhna, Red Sea, Egypt ICFD10-EG-30I3
Keynote Speakers: Dr. S. A. Channiwala & Dr. Digvijay B. Kulshreshtha Page 14 Copyright © 2010 by ICFD 10
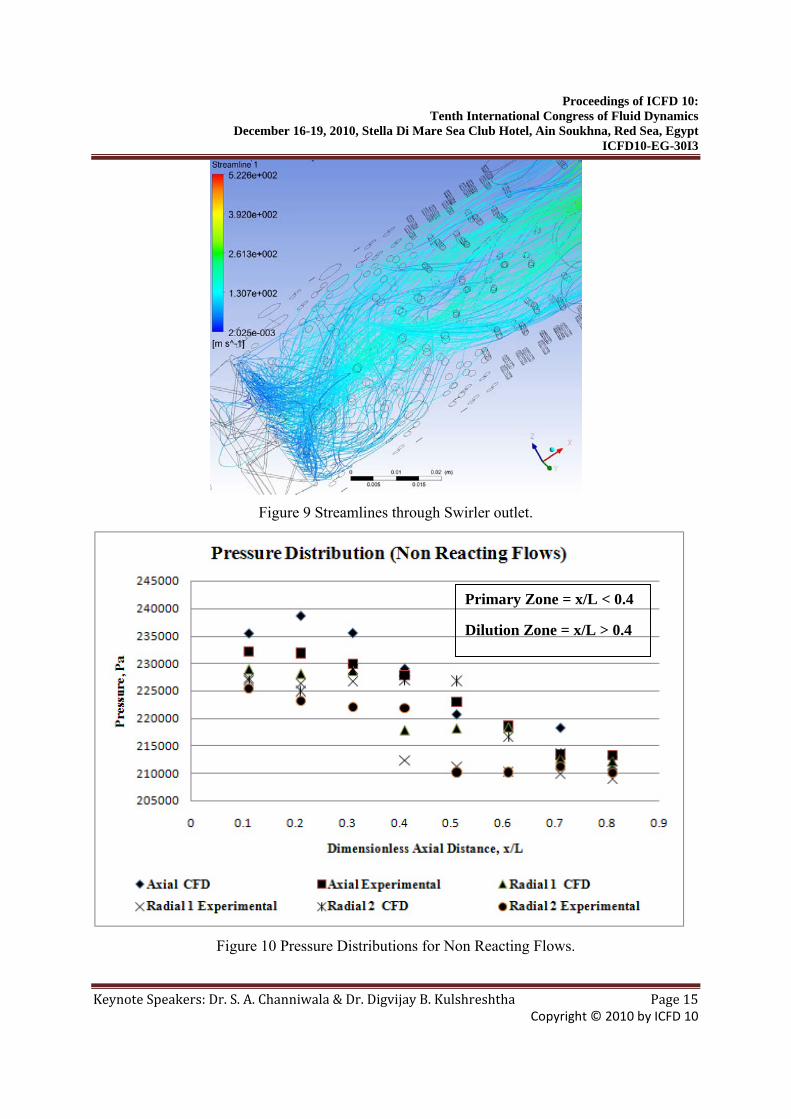
combustion stability and mixing. The fact is evident from figure 9, which shows the streamlines
from swirler outlet. Complete mixing is evident which is good for better mixing of fuel and air
inside the primary zone. Intense mixing and recirculation is observed at central core, which may
offer stable narrow flame [32, 33, 34].
Figure 8 Velocity Distributions for Non Reacting Flows.
Primary Zone = x/L < 0.4
Dilution Zone = x/L > 0.4
Proceedings of ICFD 10: Tenth International Congress of Fluid Dynamics
December 16-19, 2010, Stella Di Mare Sea Club Hotel, Ain Soukhna, Red Sea, Egypt ICFD10-EG-30I3
Keynote Speakers: Dr. S. A. Channiwala & Dr. Digvijay B. Kulshreshtha Page 15 Copyright © 2010 by ICFD 10
Figure 9 Streamlines through Swirler outlet.
Figure 10 Pressure Distributions for Non Reacting Flows.
Primary Zone = x/L < 0.4
Dilution Zone = x/L > 0.4
Proceedings of ICFD 10: Tenth International Congress of Fluid Dynamics
December 16-19, 2010, Stella Di Mare Sea Club Hotel, Ain Soukhna, Red Sea, Egypt ICFD10-EG-30I3
Keynote Speakers: Dr. S. A. Channiwala & Dr. Digvijay B. Kulshreshtha Page 16 Copyright © 2010 by ICFD 10
The velocity levels are slightly higher in the dilution zone compared to the primary zone. As
more air enters through the wall cooling and dilution zone, the velocity levels increases. This
may be due to the fact that pressure drop is manifested in the increased velocity levels for cold
flow studies. This pressure drop is graphically represented in Figure 10. Higher pressure drop is
witnessed in the dilution zone which leads to higher velocities near the exit of the combustion
chamber.
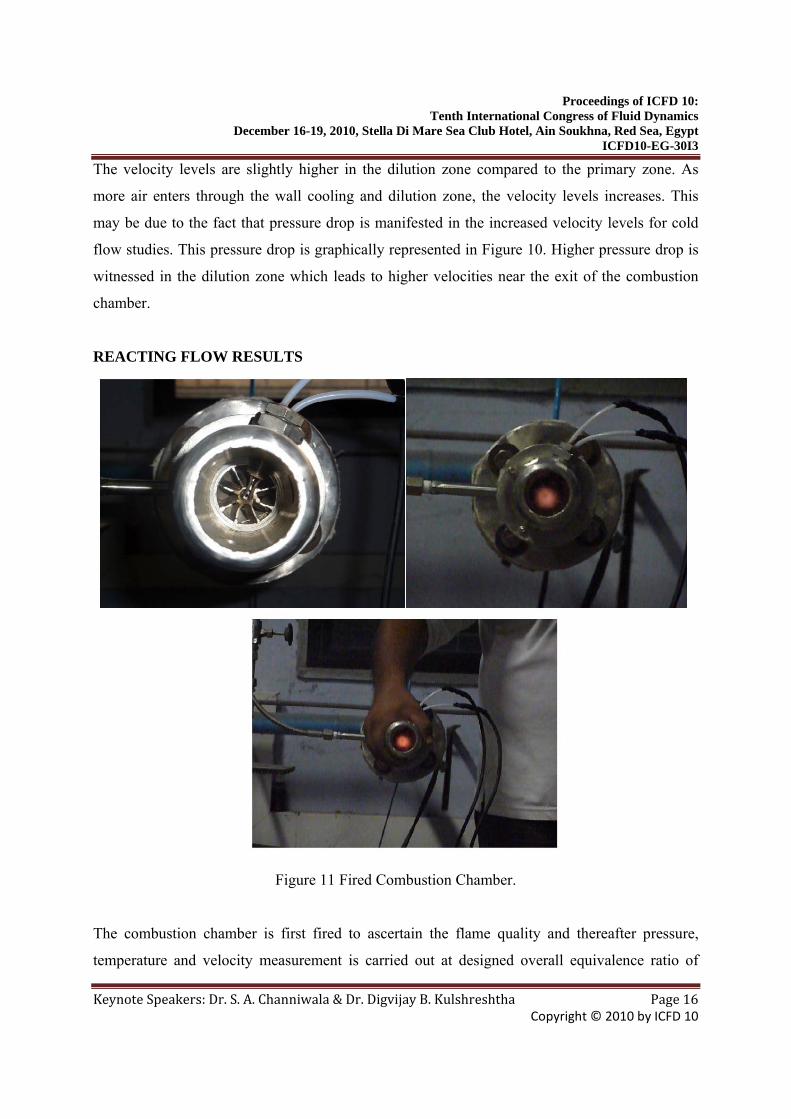
REACTING FLOW RESULTS
Figure 11 Fired Combustion Chamber.
The combustion chamber is first fired to ascertain the flame quality and thereafter pressure,
temperature and velocity measurement is carried out at designed overall equivalence ratio of
Proceedings of ICFD 10: Tenth International Congress of Fluid Dynamics
December 16-19, 2010, Stella Di Mare Sea Club Hotel, Ain Soukhna, Red Sea, Egypt ICFD10-EG-30I3
Keynote Speakers: Dr. S. A. Channiwala & Dr. Digvijay B. Kulshreshtha Page 17 Copyright © 2010 by ICFD 10
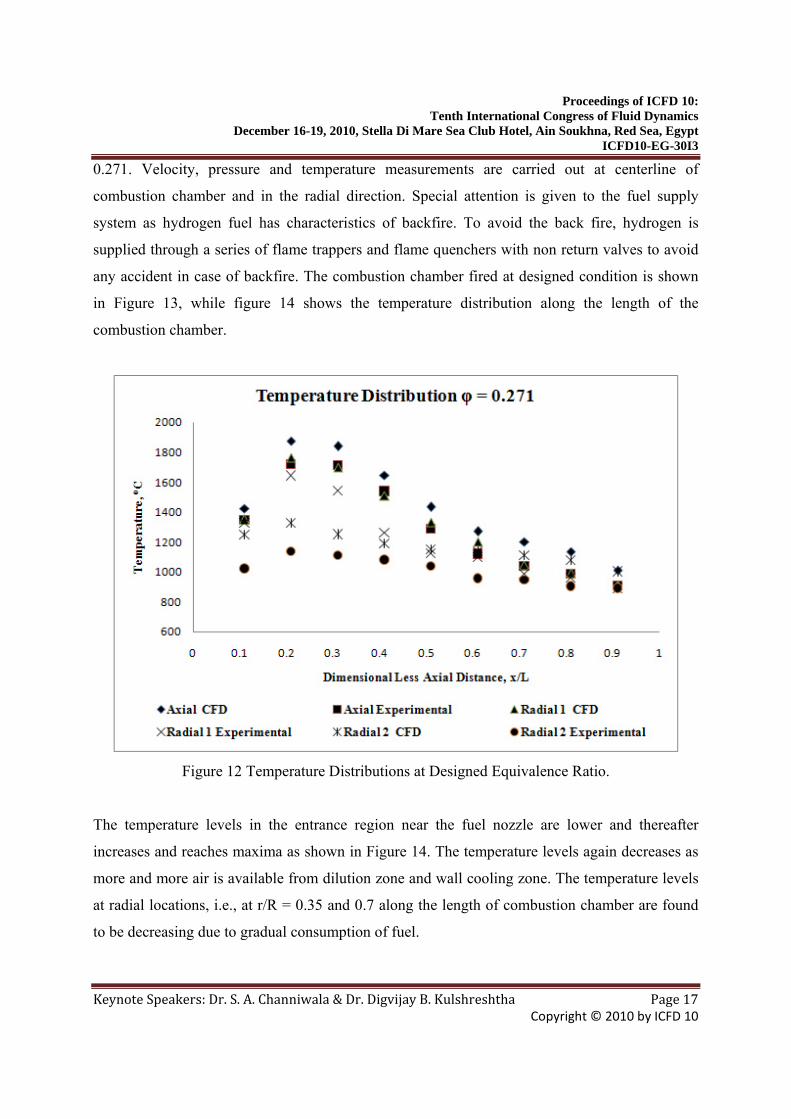
0.271. Velocity, pressure and temperature measurements are carried out at centerline of
combustion chamber and in the radial direction. Special attention is given to the fuel supply
system as hydrogen fuel has characteristics of backfire. To avoid the back fire, hydrogen is
supplied through a series of flame trappers and flame quenchers with non return valves to avoid
any accident in case of backfire. The combustion chamber fired at designed condition is shown
in Figure 13, while figure 14 shows the temperature distribution along the length of the
combustion chamber.
Figure 12 Temperature Distributions at Designed Equivalence Ratio.
The temperature levels in the entrance region near the fuel nozzle are lower and thereafter
increases and reaches maxima as shown in Figure 14. The temperature levels again decreases as
more and more air is available from dilution zone and wall cooling zone. The temperature levels
at radial locations, i.e., at r/R = 0.35 and 0.7 along the length of combustion chamber are found
to be decreasing due to gradual consumption of fuel.
Proceedings of ICFD 10: Tenth International Congress of Fluid Dynamics
December 16-19, 2010, Stella Di Mare Sea Club Hotel, Ain Soukhna, Red Sea, Egypt ICFD10-EG-30I3
Keynote Speakers: Dr. S. A. Channiwala & Dr. Digvijay B. Kulshreshtha Page 18 Copyright © 2010 by ICFD 10
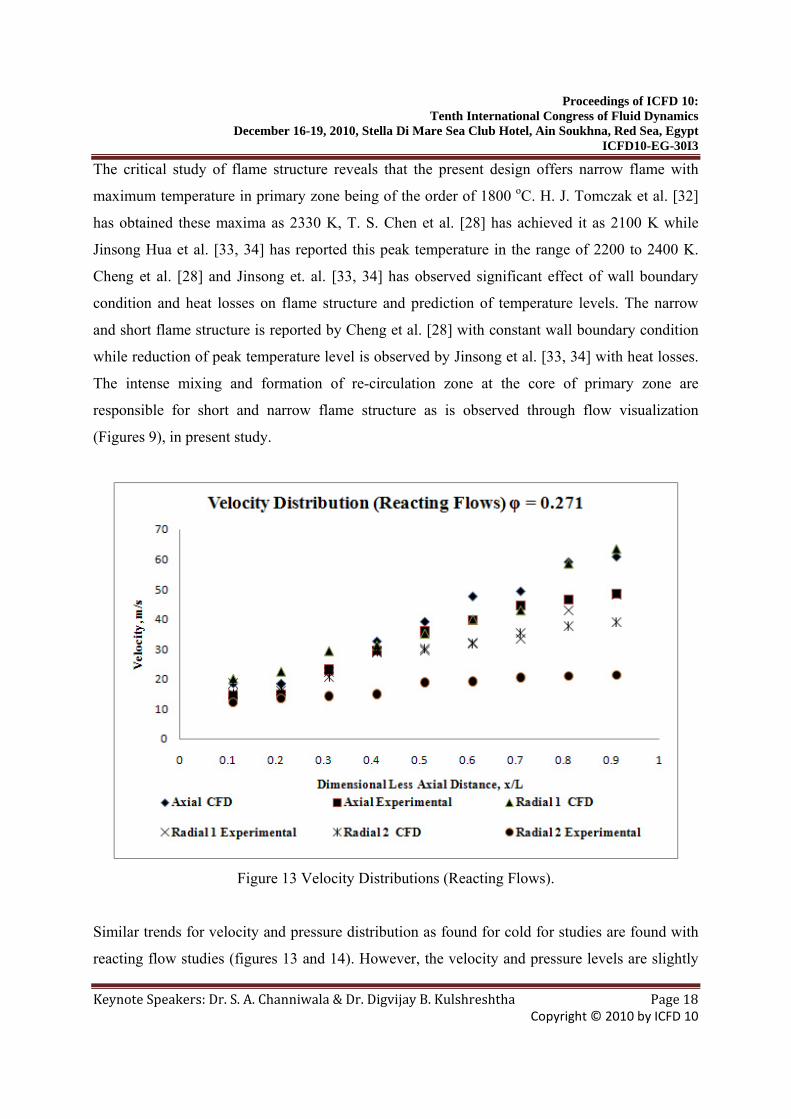
The critical study of flame structure reveals that the present design offers narrow flame with
maximum temperature in primary zone being of the order of 1800 oC. H. J. Tomczak et al. [32]
has obtained these maxima as 2330 K, T. S. Chen et al. [28] has achieved it as 2100 K while
Jinsong Hua et al. [33, 34] has reported this peak temperature in the range of 2200 to 2400 K.
Cheng et al. [28] and Jinsong et. al. [33, 34] has observed significant effect of wall boundary
condition and heat losses on flame structure and prediction of temperature levels. The narrow
and short flame structure is reported by Cheng et al. [28] with constant wall boundary condition
while reduction of peak temperature level is observed by Jinsong et al. [33, 34] with heat losses.
The intense mixing and formation of re-circulation zone at the core of primary zone are
responsible for short and narrow flame structure as is observed through flow visualization
(Figures 9), in present study.
Figure 13 Velocity Distributions (Reacting Flows).
Similar trends for velocity and pressure distribution as found for cold for studies are found with
reacting flow studies (figures 13 and 14). However, the velocity and pressure levels are slightly
Proceedings of ICFD 10: Tenth International Congress of Fluid Dynamics
December 16-19, 2010, Stella Di Mare Sea Club Hotel, Ain Soukhna, Red Sea, Egypt ICFD10-EG-30I3
Keynote Speakers: Dr. S. A. Channiwala & Dr. Digvijay B. Kulshreshtha Page 19 Copyright © 2010 by ICFD 10
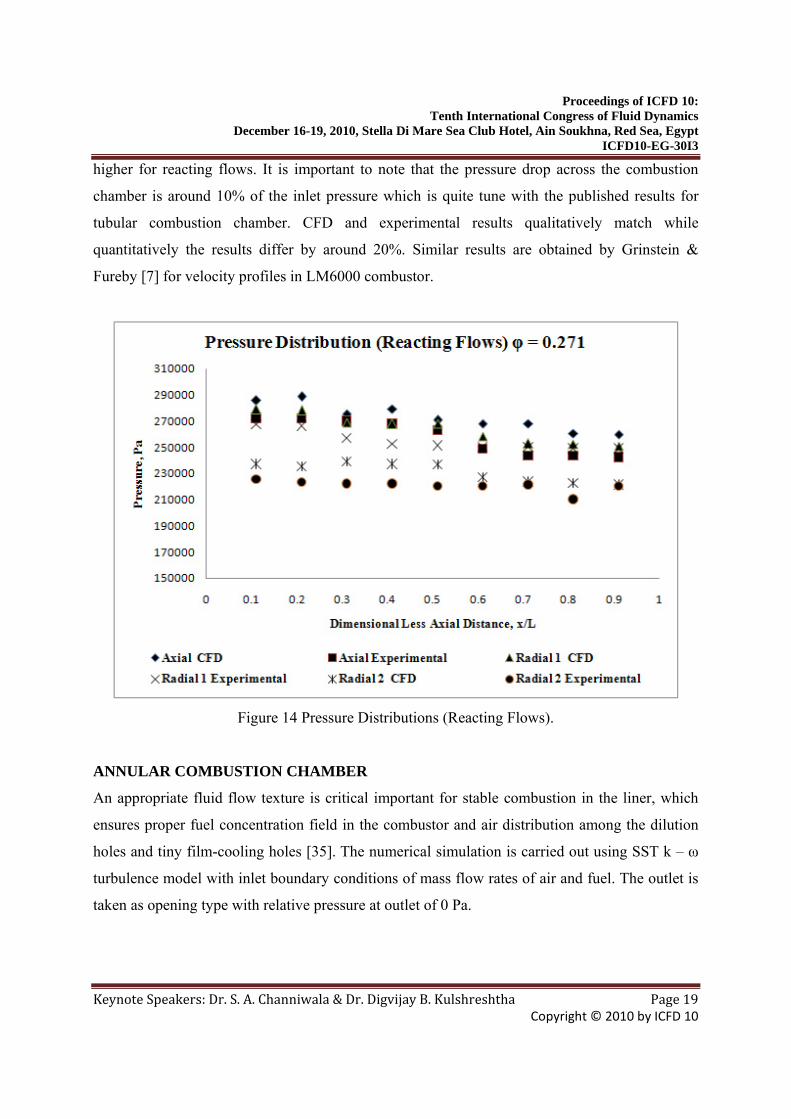
higher for reacting flows. It is important to note that the pressure drop across the combustion
chamber is around 10% of the inlet pressure which is quite tune with the published results for
tubular combustion chamber. CFD and experimental results qualitatively match while
quantitatively the results differ by around 20%. Similar results are obtained by Grinstein &
Fureby [7] for velocity profiles in LM6000 combustor.
Figure 14 Pressure Distributions (Reacting Flows).
ANNULAR COMBUSTION CHAMBER
An appropriate fluid flow texture is critical important for stable combustion in the liner, which
ensures proper fuel concentration field in the combustor and air distribution among the dilution
holes and tiny film-cooling holes [35]. The numerical simulation is carried out using SST k – ω
turbulence model with inlet boundary conditions of mass flow rates of air and fuel. The outlet is
taken as opening type with relative pressure at outlet of 0 Pa.
Proceedings of ICFD 10: Tenth International Congress of Fluid Dynamics
December 16-19, 2010, Stella Di Mare Sea Club Hotel, Ain Soukhna, Red Sea, Egypt ICFD10-EG-30I3
Keynote Speakers: Dr. S. A. Channiwala & Dr. Digvijay B. Kulshreshtha Page 20 Copyright © 2010 by ICFD 10
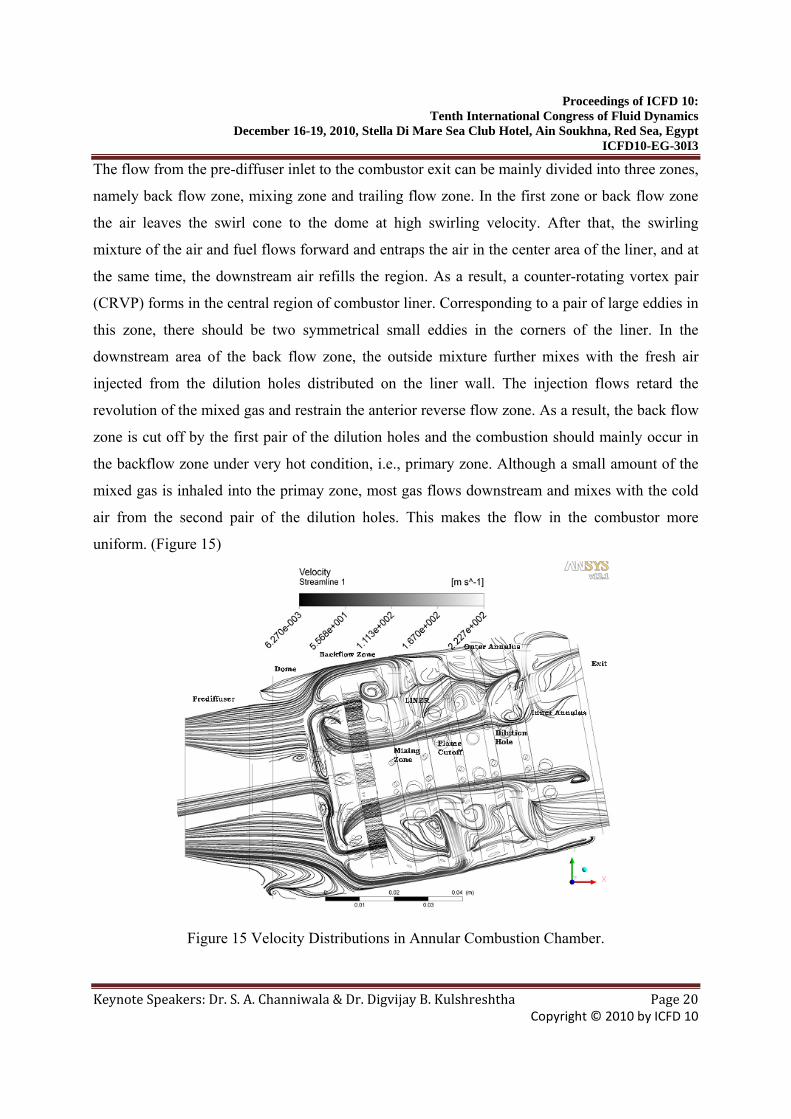
The flow from the pre-diffuser inlet to the combustor exit can be mainly divided into three zones,
namely back flow zone, mixing zone and trailing flow zone. In the first zone or back flow zone
the air leaves the swirl cone to the dome at high swirling velocity. After that, the swirling
mixture of the air and fuel flows forward and entraps the air in the center area of the liner, and at
the same time, the downstream air refills the region. As a result, a counter-rotating vortex pair
(CRVP) forms in the central region of combustor liner. Corresponding to a pair of large eddies in
this zone, there should be two symmetrical small eddies in the corners of the liner. In the
downstream area of the back flow zone, the outside mixture further mixes with the fresh air
injected from the dilution holes distributed on the liner wall. The injection flows retard the
revolution of the mixed gas and restrain the anterior reverse flow zone. As a result, the back flow
zone is cut off by the first pair of the dilution holes and the combustion should mainly occur in
the backflow zone under very hot condition, i.e., primary zone. Although a small amount of the
mixed gas is inhaled into the primay zone, most gas flows downstream and mixes with the cold
air from the second pair of the dilution holes. This makes the flow in the combustor more
uniform. (Figure 15)
Figure 15 Velocity Distributions in Annular Combustion Chamber.
Proceedings of ICFD 10: Tenth International Congress of Fluid Dynamics
December 16-19, 2010, Stella Di Mare Sea Club Hotel, Ain Soukhna, Red Sea, Egypt ICFD10-EG-30I3
Keynote Speakers: Dr. S. A. Channiwala & Dr. Digvijay B. Kulshreshtha Page 21 Copyright © 2010 by ICFD 10
Actually, the back flow zones can be regarded the areas where the fuel are ignited and the
combustion flame is stably held, or the flow back zones serve as igniters and flame-holder while
the CRVP downstream the second pair of the dilution holes may be a cut-valve to the flame. The
flow behavior in the combustor, including the flow back zones, eddies, and their size and
intensity, will apparently control the combustion behavior and then the performance of the
engine. The simulation and experimental results indicate the main inlet flow plays a critically
important role in forming a very well organized combustion, while the flows from the dilution
holes further assist and complete fuel combustion in later stage [18].
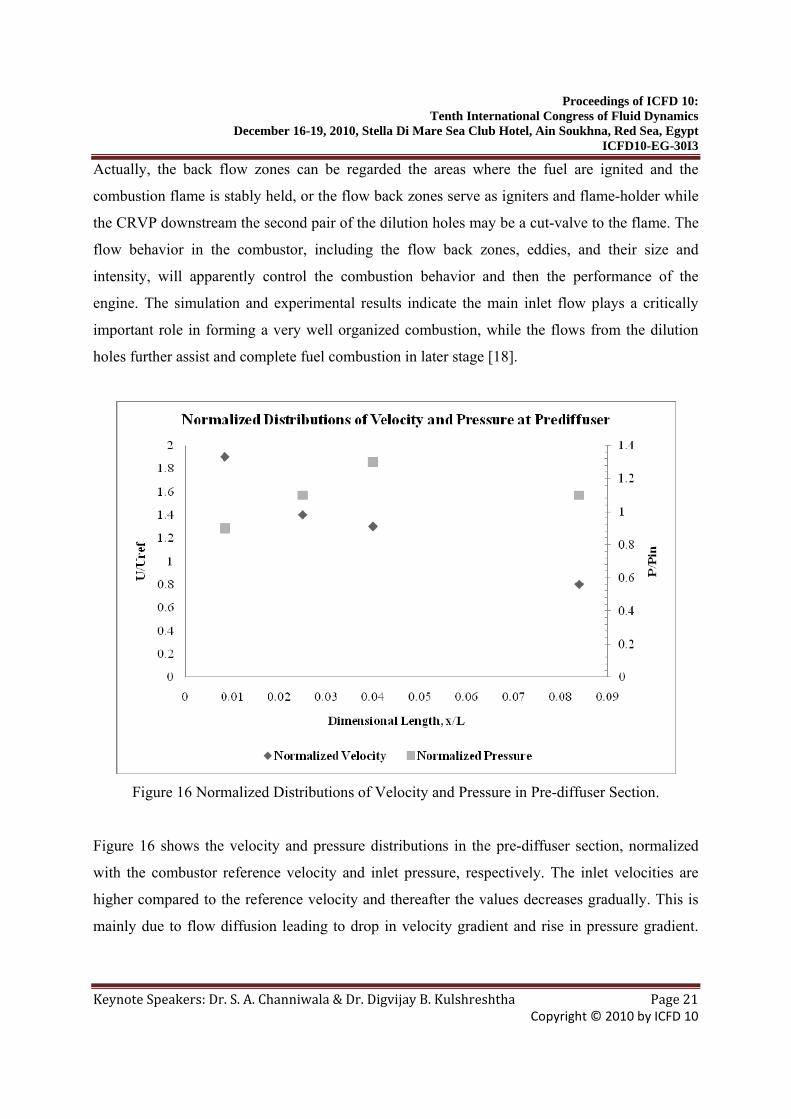
Figure 16 Normalized Distributions of Velocity and Pressure in Pre-diffuser Section.
Figure 16 shows the velocity and pressure distributions in the pre-diffuser section, normalized
with the combustor reference velocity and inlet pressure, respectively. The inlet velocities are
higher compared to the reference velocity and thereafter the values decreases gradually. This is
mainly due to flow diffusion leading to drop in velocity gradient and rise in pressure gradient.
Proceedings of ICFD 10: Tenth International Congress of Fluid Dynamics
December 16-19, 2010, Stella Di Mare Sea Club Hotel, Ain Soukhna, Red Sea, Egypt ICFD10-EG-30I3
Keynote Speakers: Dr. S. A. Channiwala & Dr. Digvijay B. Kulshreshtha Page 22 Copyright © 2010 by ICFD 10
But there is a drop in pressure rise at the pre-diffuser exit, probably due to diffuser losses mainly
due to skin friction losses.
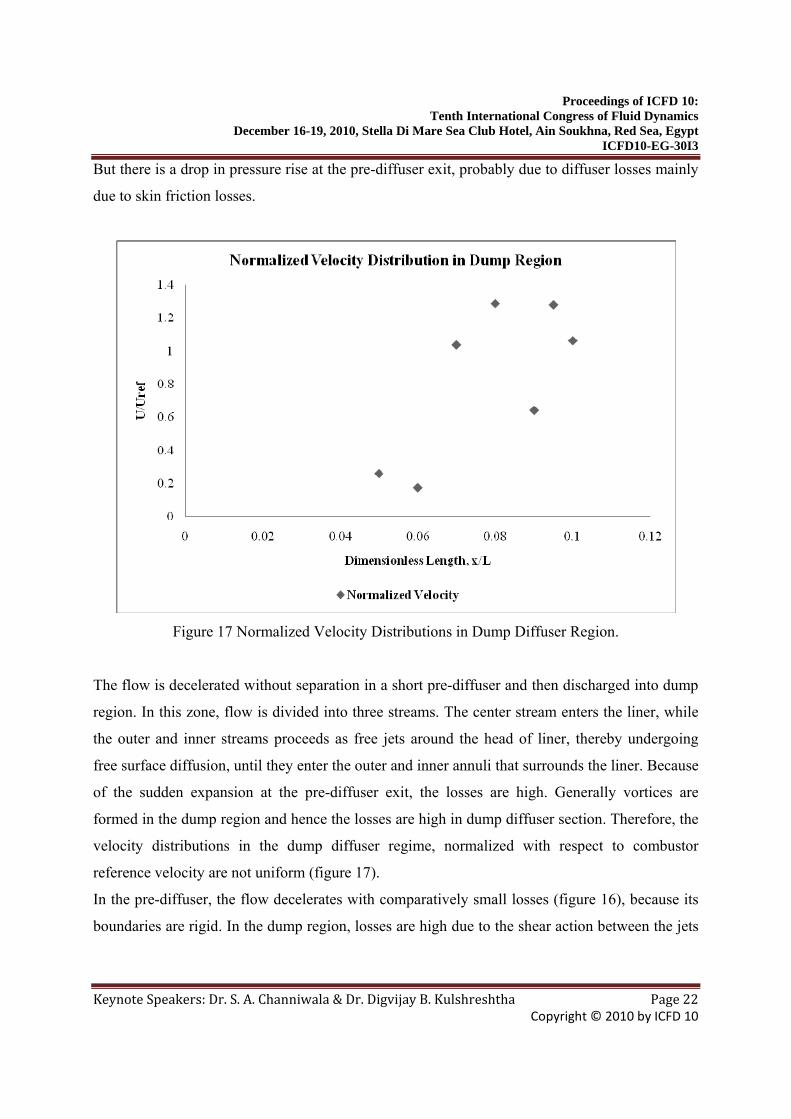
Figure 17 Normalized Velocity Distributions in Dump Diffuser Region.
The flow is decelerated without separation in a short pre-diffuser and then discharged into dump
region. In this zone, flow is divided into three streams. The center stream enters the liner, while
the outer and inner streams proceeds as free jets around the head of liner, thereby undergoing
free surface diffusion, until they enter the outer and inner annuli that surrounds the liner. Because
of the sudden expansion at the pre-diffuser exit, the losses are high. Generally vortices are
formed in the dump region and hence the losses are high in dump diffuser section. Therefore, the
velocity distributions in the dump diffuser regime, normalized with respect to combustor
reference velocity are not uniform (figure 17).
In the pre-diffuser, the flow decelerates with comparatively small losses (figure 16), because its
boundaries are rigid. In the dump region, losses are high due to the shear action between the jets
Proceedings of ICFD 10: Tenth International Congress of Fluid Dynamics
December 16-19, 2010, Stella Di Mare Sea Club Hotel, Ain Soukhna, Red Sea, Egypt ICFD10-EG-30I3
Keynote Speakers: Dr. S. A. Channiwala & Dr. Digvijay B. Kulshreshtha Page 23 Copyright © 2010 by ICFD 10
and the stagnant air and due to large flow turning imposed by the head of liner. These high losses
are manifested in sudden drop of velocity at x/L locations of 0.06 and 0.09 (figure 17).
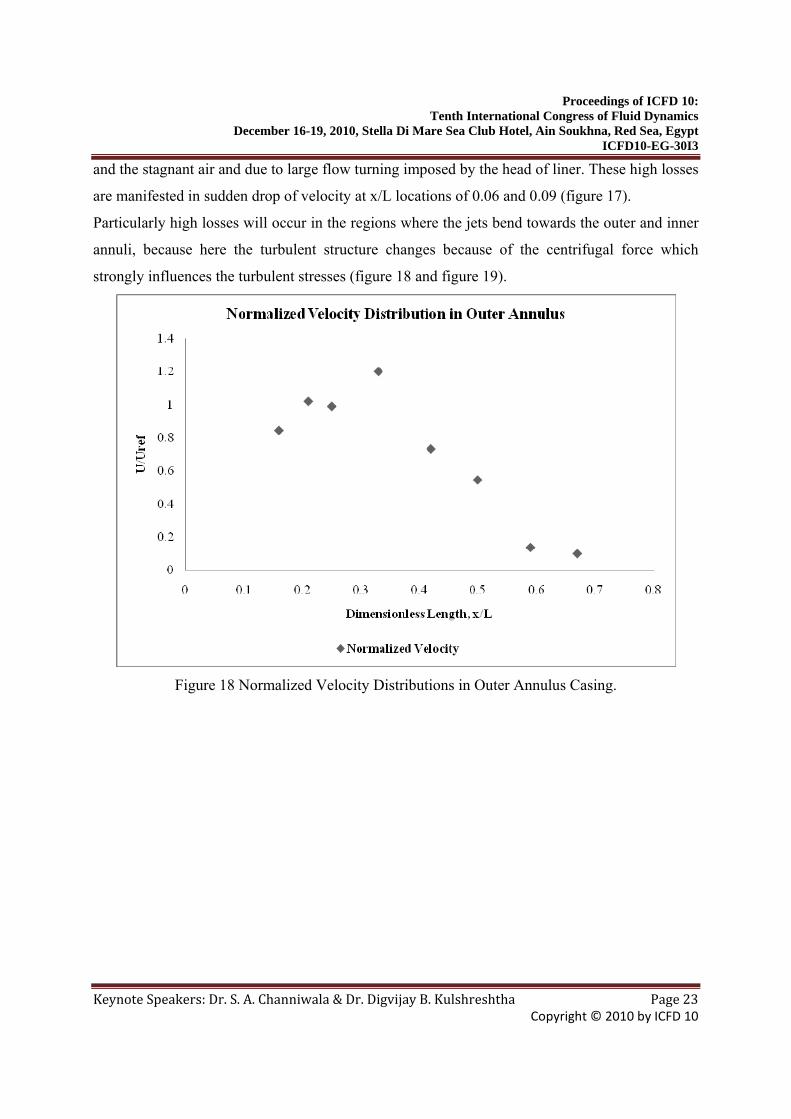
Particularly high losses will occur in the regions where the jets bend towards the outer and inner
annuli, because here the turbulent structure changes because of the centrifugal force which
strongly influences the turbulent stresses (figure 18 and figure 19).
Figure 18 Normalized Velocity Distributions in Outer Annulus Casing.
Proceedings of ICFD 10: Tenth International Congress of Fluid Dynamics
December 16-19, 2010, Stella Di Mare Sea Club Hotel, Ain Soukhna, Red Sea, Egypt ICFD10-EG-30I3
Keynote Speakers: Dr. S. A. Channiwala & Dr. Digvijay B. Kulshreshtha Page 24 Copyright © 2010 by ICFD 10
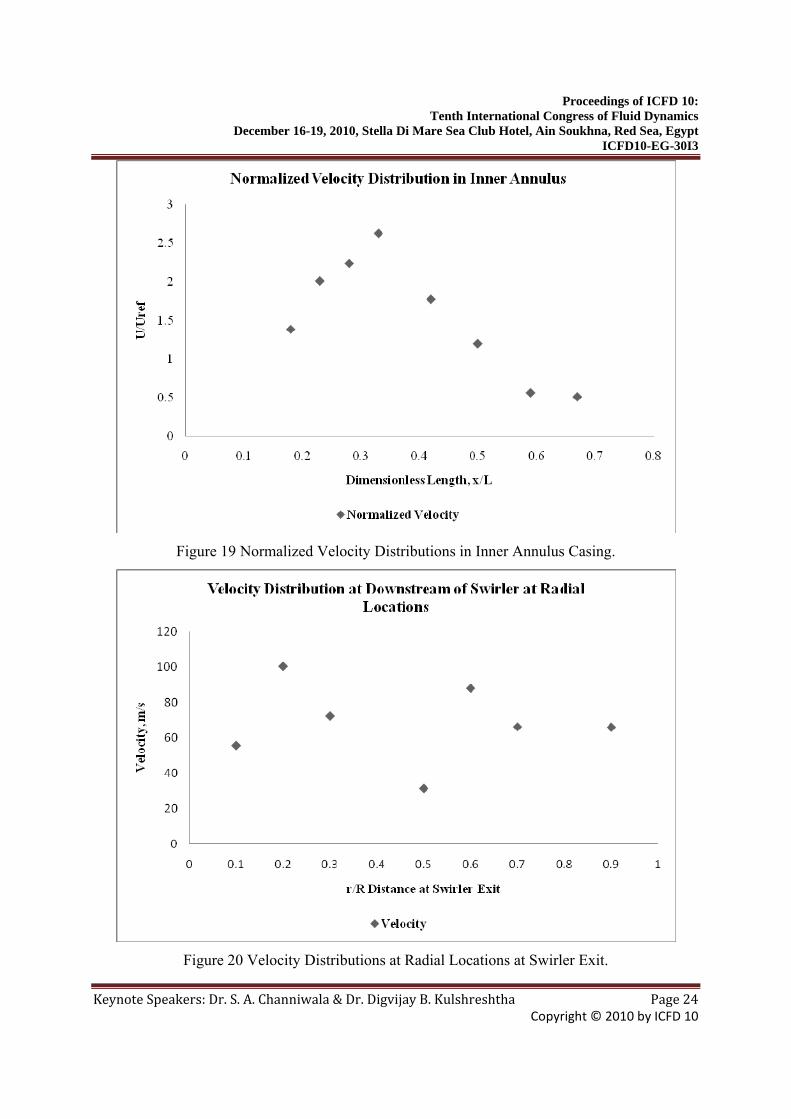
Figure 19 Normalized Velocity Distributions in Inner Annulus Casing.
Figure 20 Velocity Distributions at Radial Locations at Swirler Exit.
Proceedings of ICFD 10: Tenth International Congress of Fluid Dynamics
December 16-19, 2010, Stella Di Mare Sea Club Hotel, Ain Soukhna, Red Sea, Egypt ICFD10-EG-30I3
Keynote Speakers: Dr. S. A. Channiwala & Dr. Digvijay B. Kulshreshtha Page 25 Copyright © 2010 by ICFD 10
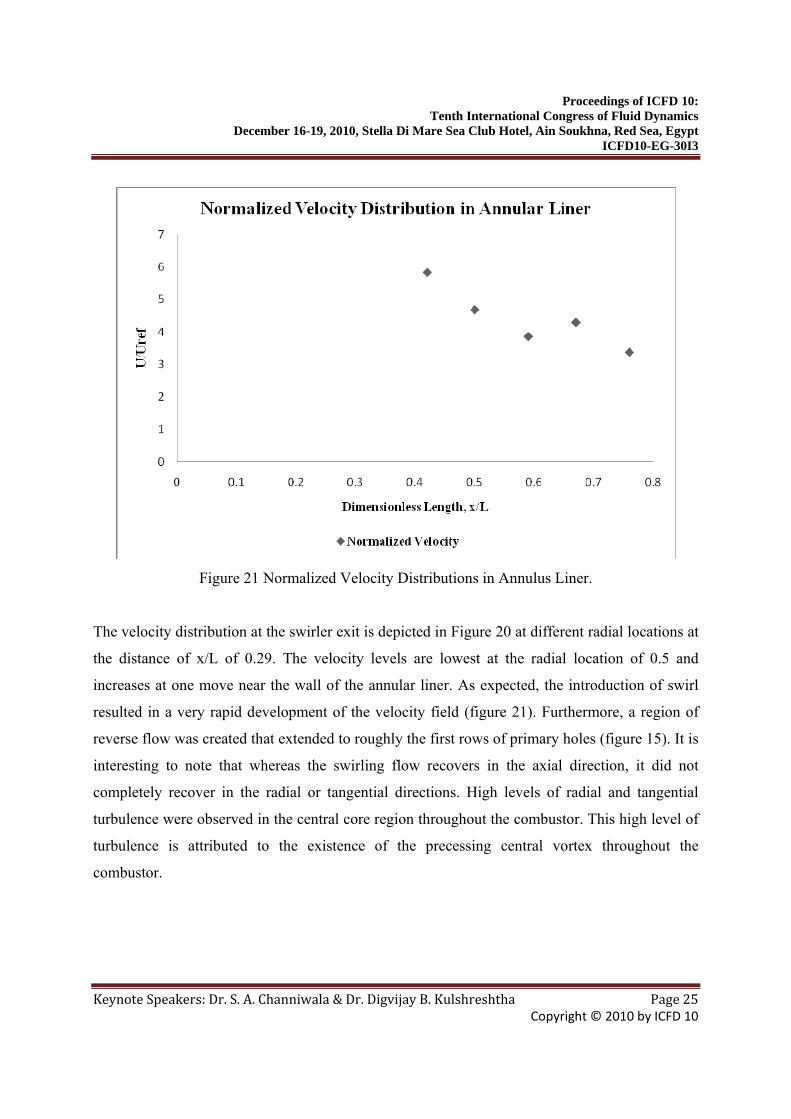
Figure 21 Normalized Velocity Distributions in Annulus Liner.
The velocity distribution at the swirler exit is depicted in Figure 20 at different radial locations at
the distance of x/L of 0.29. The velocity levels are lowest at the radial location of 0.5 and
increases at one move near the wall of the annular liner. As expected, the introduction of swirl
resulted in a very rapid development of the velocity field (figure 21). Furthermore, a region of
reverse flow was created that extended to roughly the first rows of primary holes (figure 15). It is
interesting to note that whereas the swirling flow recovers in the axial direction, it did not
completely recover in the radial or tangential directions. High levels of radial and tangential
turbulence were observed in the central core region throughout the combustor. This high level of
turbulence is attributed to the existence of the precessing central vortex throughout the
combustor.
Proceedings of ICFD 10: Tenth International Congress of Fluid Dynamics
December 16-19, 2010, Stella Di Mare Sea Club Hotel, Ain Soukhna, Red Sea, Egypt ICFD10-EG-30I3
Keynote Speakers: Dr. S. A. Channiwala & Dr. Digvijay B. Kulshreshtha Page 26 Copyright © 2010 by ICFD 10
CONCLUSIONS
The design of micro gas turbine combustion chamber is carried out using hydrogen as fuel and
the design is then validated using Numerical and Experimental Approach. The qualitative and
quantitative agreement of CFD results with the Experimental Results suggests that the basic
assumptions and boundary conditions as well as the problem definition for CFD analysis can be
applied to understand the flow phenomena, temperature contours and air flow distribution for
combustion chamber. The consistent centerline temperatures achieved along the centerline of
combustion chamber validates the design methodology proposed and presented in this paper.
The maximum centerline temperature recorded by CFD simulation is in the vicinity of 1876 oC
while for Experimental Investigations is around 1700 oC. The pressure loss along the combustion
chamber is 10% of the inlet pressure. The velocity profiles show an increasing trend along the
length of combustion chamber, but low velocities are encountered in primary zone which is
beneficial for combustion stability.
A numerical CFD simulation was made to investigate the isothermal swirling flow characteristics
in an annular combustor for micro gas turbine engine. Three dimensional model is investigated
to study the flow behavior in pre-diffuser, dump region, liner, inner and outer annuli and swirler
exit. High Grid densities were specified to obtain best resolution for the various components of
the combustor, such as fuel and air inlet fluid boundary. The SST k – ω model were employed to
describe the fluid flow and cooling behavior of the combustor. The fluid flow in the tube can be
mainly divided into back flow zone, mixing zone and trailing fluid zone. This fluid flow texture
ensures the proper flow field in the combustor and affects the air distribution through different
air admission holes. High levels of radial and tangential turbulence were observed in the central
core region throughout the combustor. High losses are encountered in the dump region and
where the jets bend towards the outer and inner annuli. The design of these zones needs to be
taken utmost care to reduce the losses in the combustor. The flow behavior in the combustor,
including the flow back zones, eddies, and their size and intensity, will apparently control the
combustion behavior and then the performance of the engine. High velocity from primary and
dilution air admission holes of the order of 110 m/s is witnessed. Such high velocity from the air
admission holes ensures high static pressure drop, which is advantageous in mixing through air
Proceedings of ICFD 10: Tenth International Congress of Fluid Dynamics
December 16-19, 2010, Stella Di Mare Sea Club Hotel, Ain Soukhna, Red Sea, Egypt ICFD10-EG-30I3
Keynote Speakers: Dr. S. A. Channiwala & Dr. Digvijay B. Kulshreshtha Page 27 Copyright © 2010 by ICFD 10
admission holes. The formation of counter rotating vortices from the second row of primary zone
ensures cutoff of flame.
NOMENCLATURE
A Geometrical area
,h effA Total effective liner hole area
,h goemA Hole area, geometric
b Temperature dependence of reaction rates
DC Discharge Co-efficient
D Diameter
d Diameter
k Ratio of liner to casing area
L Length
m Mass flow rate
pm Ratio of primary-zone air flow to total chamber air flow
snm Ratio of air entering snout to total chamber air flow
n Number of holes
P Pressure
PF Pattern factor or Temperature traverse quality
q Dynamic pressure
r Radius
R Gas constant
T Temperature
LPΔ Liner pressure differential
λ Diffuser pressure-loss co-efficient
φ Equivalence ratio
Proceedings of ICFD 10: Tenth International Congress of Fluid Dynamics
December 16-19, 2010, Stella Di Mare Sea Club Hotel, Ain Soukhna, Red Sea, Egypt ICFD10-EG-30I3
Keynote Speakers: Dr. S. A. Channiwala & Dr. Digvijay B. Kulshreshtha Page 28 Copyright © 2010 by ICFD 10
SUBSCRIPT
A Air
a Air
f Fuel
F Fuel
j Jet value
L Liner
PZ Primary-zone
ref Reference value
3 Combustor inlet plane
4 Combustor exit plane
REFERENCES
1. Robert M. Woolley, Michael Fairweather & Yunardi, Conditional Moment Closure Modeling of Soot Formation in Turbulent, Non-Premixed Methane and Propane Flames, Fuel, Vol. 88 pp. 393–407, 2009.
2. Philippe Dagaut & Michel Cathonnet, The Ignition, Oxidation and Combustion of Kerosene: A Review of Experimental and Kinetic Modeling, Progress in Energy and Combustion Science, Vol. 32, pp. 48–92, 2006.
3. Z. Wen, S. Yun, M.J. Thomson & M.F. Lightstone, Modeling Soot Formation in Turbulent Kerosene/Air Jet Diffusion Flames, Combustion and Flame, Vol. 135, pp. 323 – 340, 2003.
4. E. Riesmeier, S. Honnet & N. Peters, Flamelet Modeling of Pollutant Formation in A Gas Turbine Combustion Chamber Using Detailed Chemistry for A Kerosene Model Fuel, ASME Journal of Engineering for Gas Turbine and Power, Vol. 126, pp. 899 – 905, 2004.
5. F.Z. Sierra, J. Kubiak, G. Gonza´lez & G. Urquiza, Predictions of Temperature Front in a Gas Turbine Combustion Chamber, Journ. Applied Thermal Engineering, Vol. 25, pp. 1127–1140, 2005.
6. B. Zamuner, P. Gilbank, D. Bissières and C. Berat, Numerical Simulation of the Reactive Two-Phase Flow in A Kerosene/Air Tubular Combustor, Aerospace Science and Technology, Vol. 6, pp. 521–529, 2002.
Proceedings of ICFD 10: Tenth International Congress of Fluid Dynamics
December 16-19, 2010, Stella Di Mare Sea Club Hotel, Ain Soukhna, Red Sea, Egypt ICFD10-EG-30I3
Keynote Speakers: Dr. S. A. Channiwala & Dr. Digvijay B. Kulshreshtha Page 29 Copyright © 2010 by ICFD 10
7. F. F. Grinstein & C. Fureby, LES Studies of The Flow in A Swirl Gas Combustor Proceedings of the Combustion Institute, Vol. 30, pp. 1791–1798, 2005
8. D. Caraeni, C. Bergström & L. Fuchs, Modeling of Liquid Fuel Injection, Evaporation and Mixing in a Gas Turbine Burner Using Large Eddy Simulations, Flow, Turbulence and Combustion, Vol. 65, pp. 223 – 244, 2000
9. I. R. Gran, M. C. Melaaen and B. F. Magnussen, Numerical Simulation of Local Extinction Effects in Turbulent Combustor Flows of Methane and Air, Twenty-Fifth Symposium (International) on Combustion, Combustion Institute, pp. 1283-1291, 1994
10. W. Shyy, S. M. Correa and M. E. Braaten, Computation of Flow in a Gas Turbine Combustor, Combustion Sci. & Tech., Vol. 58, pp. 97 – 117, 1988
11. W. Shyy, M. E. Braaten & D. L. Burrus, Study of Three-Dimensional Gas-Turbine Combustor Flows, Int. J. Heat and Mass Transfer. Vol. 32, No. 6, pp. 1155-1164, 1989.
12. James A. Cooke, Matteo Bellucci, Mitchell D. Smooke, Alessandro Gomez, Angela Violi, Tiziano Faravelli & Eliseo Ranzi, Computational and Experimental Study of JP8, A Surrogate, and its Components in Counter-Flow Diffusion Flames, Proc. of the Combustion Institute, Vol. 30, pp. 439 – 446, 2005
13. Charles K. Westbrook, Yasuhiro Mizobuchi, Thierry J. Poinsot, Phillip J. Smith & Jurgen Warnatz, Computational Combustion, Proceeding of Combustion Institute, Vol. 30, pp. 125 – 157, 2005
14. Lefebvre A. H., Gas Turbine Combustion, Taylor and Francis, 2nd ed., 1999 ISBN 1 –
56032 – 673 – 5.
15. Saravanamutto H, Cohen H, and Rogers G, Gas turbine theory, 6th ed., ISBN 978 – 0 –
13 – 22437 – 6, 2008
16. Nirav M. Desai, Thermal and Mechanical Design Optimization and Dynamic Analysis of
A Centrifugal Compressor Stage, M. Tech. Dissertation, S V National Institute of
Technology, Surat, 2004
17. Mehul P. Pandya, Design Optimization and Simulation of Radial Inflow Gas Turbine in
Small Capacity Range, M. Tech. Dissertation, S V National Institute of Technology,
Surat, 2004
18. Kulshreshtha D. B. & Channiwala S. A., Simplified Design of Combustion Chamber for
Small Gas Turbine Applications. Proc. of International Mechanical Engineering
Congress and Exposition 2005, Paper Code IMECE2005 – 79038.
19. Mellor A. M., Design of Modern Turbine Combustors, ACADEMIC PRESS INC, 1990.
Proceedings of ICFD 10: Tenth International Congress of Fluid Dynamics
December 16-19, 2010, Stella Di Mare Sea Club Hotel, Ain Soukhna, Red Sea, Egypt ICFD10-EG-30I3
Keynote Speakers: Dr. S. A. Channiwala & Dr. Digvijay B. Kulshreshtha Page 30 Copyright © 2010 by ICFD 10
20. Jack Mattingly, William Heiser & David Pratt, Aircraft Engine Design 2nd ed., AIAA
Education Series, 2002.
21. F. Harlow & P. I. Nakayama, Transport of Turbulence Energy Decay Rate, Los Alamos
Scientific Laboratory Report, LA – 4086, 1968.
22. B. E. Launder & D. B. Spalding, Mathematical Models of Turbulence, Academic Press,
New York, 1972.
23. Jones W. P & Lindstedt R. P, Global Reaction Schemes for Hydrocarbon Combustion,
Combustion and Flame, Vol. 73, pp. 222 – 233, 1988.
24. John M. Simmie, Detailed Chemical Kinetic Models for Combustion of Hydrogen Fuels,
Progress in Energy and Combustion Science, Vol. 29, pp. 599 – 634, 2003.
25. B. Varatharajana, M. Petrova, F.A. Williams & V. Tangirala, Two-Step Chemical-Kinetic
Descriptions for Hydrocarbon–Oxygen-Diluent Ignition and Detonation Applications,
Proceedings of the Combustion Institute Vol. 30, pp. 1869–1877, 2005.
26. Eduardo Fernandez-Tarrazo, Antonio L. Sánchez, Amable Linan & Forman A. Williams,
A Simple One –Step Chemistry Model for Partially Pre-mixed Hydrocarbon Combustion.
Combustion and Flame, Vol. 147, pp. 32 – 28, 2006.
27. A. H. Lefebvre, & M. V. Herbert, Heat-Transfer Processes in Gas-Turbine Combustion
Chambers. Proc. of IMechE, Vol 17, pp. 463 – 478, 1960.
28. T.S. Cheng, C.Y Wu, C. P Chen, Y. H Li, Y.C Chao, T. Yuan & T.S. Leu, Detailed
Measurement on Assessment of Laminar Hydrogen Jet Diffusion Flames. Combustion
and Flame, Vol. 146, pp. 268 – 282, 2006.
29. Tien, J.H., Stalker, R.J., Release of chemical energy by combustion in a supersonic
mixing layer of hydrogen and air. Combustion and Flame 130, 329–348, 2002 30. ASTM 220-07a, Standard Test Method for Calibration of Thermocouples By Comparison
Techniques, 2007
31. ASME PTC 19.1-1998, Test Uncertainty, Instruments and Apparatus, Supplement to the
ASME Performance Test Codes, 1998.
32. H. J. Tomczak, G Benelli, L Carrai & D Cecchini, Investigation of A Gas Turbine
Combustion System Fired With Mixtures of Natural Gas and Hydrogen. IFRF
Combustion Journal, 2002.
Proceedings of ICFD 10: Tenth International Congress of Fluid Dynamics
December 16-19, 2010, Stella Di Mare Sea Club Hotel, Ain Soukhna, Red Sea, Egypt ICFD10-EG-30I3
Keynote Speakers: Dr. S. A. Channiwala & Dr. Digvijay B. Kulshreshtha Page 31 Copyright © 2010 by ICFD 10
33. Jinsong Hua, MengWu & Kurichi Kumar, Numerical Simulation of The Combustion Of
Hydrogen–Air Mixture in Micro-Scaled Chambers PART I: Fundamental Study,
Chemical Engineering Science, Vol. 60, pp. 3497 – 3506, 2005.
34. Jinsong Hua, MengWu & Kurichi Kumar, Numerical Simulation of the Combustion Of
Hydrogen–Air Mixture in Micro-Scaled Chambers PART II: CFD Analysis for Micro
Combustor. Chemical Engineering Science, Vol. 60, pp. 3507 – 3515, 2005.
35. L. Li, T. Liu, X.F. Peng, Flow Characteristics in an Annular Burner with Fully Film
Cooling, Applied Thermal Engineering 25, 3013–3024, 2005