combining big social media data and fca for crisis responseshura.shu.ac.uk/9590/1/andrews combining...
TRANSCRIPT
Combining Big Social Media Data and FCA for Crisis Response
GIBSON, Helen <http://orcid.org/0000-0002-5242-0950>, ANDREWS, Simon <http://orcid.org/0000-0003-2094-7456>, DOMDOUZIS, Konstantinos <http://orcid.org/0000-0003-3679-3527>, HIRSCH, Laurence <http://orcid.org/0000-0002-3589-9816> and AKHGAR, Babak <http://orcid.org/0000-0003-3684-6481>
Available from Sheffield Hallam University Research Archive (SHURA) at:
http://shura.shu.ac.uk/9590/
This document is the author deposited version. You are advised to consult the publisher's version if you wish to cite from it.
Published version
GIBSON, Helen, ANDREWS, Simon, DOMDOUZIS, Konstantinos, HIRSCH, Laurence and AKHGAR, Babak (2014). Combining Big Social Media Data and FCA for Crisis Response. In: 2014 IEEE/ACM 7th International Conference on Utility and Cloud Computing. The Institute of Electrical and Electronics Engineers, 690-695.
Copyright and re-use policy
See http://shura.shu.ac.uk/information.html
Sheffield Hallam University Research Archivehttp://shura.shu.ac.uk
Combining big social media data and FCA for crisis
response
Helen Gibson, Simon Andrews, Konstantinos Domdouzis, Laurence Hirsh, Babak Akhgar
CENTRIC
Sheffield Hallam University, UK
{h.gibson, s.andrews, k.domdouzis, l.hirsch, b.akhgar}@shu.ac.uk
Abstract—The use of social media is now prevalent in all
aspects of society. Each and every major news event is
accompanied by a stream of real-time social media posts,
creating a vast and ever changing data supply - a hallmark of big
data. The aim of the ATHENA project is to turn this stream of
information into a vital resource for the public and first
responders during a crisis. ATHENA recognizes that citizens are
currently under-utilized in crises and that they are often willing
to engage in the response effort. Social media provides a robust
platform for this interaction. Due to the volume and fast paced
nature of the incoming data streams, the challenges for ATHENA
system are how to integrate and process this data and then how
to transform it into intelligence to be used by law enforcement
agencies and the public alike. This paper introduces potential
applications within the ATHENA project, in particular, those
based on a technique known as formal concept analysis.
Keywords— formal concept analysis; social media; crisis
response; data processing; disaster management
I. INTRODUCTION
Most major news events are now accompanied by a real-
time social media-based commentary. These comments are
made by law enforcement agencies (LEAs), news outlets and
the public who act as witnesses, reporters and innocent
bystanders. However, a single person can only casually
browse the most recent or popular posts which, if they are
caught up in the disaster, may not be pertinent to their current
predicament. Further, LEAs and emergency responders need
up-to-date information and intelligence to provide situational
awareness to coordinate their efforts for intervention and
rescue. The value, however, does not just lie in the posts
themselves - they are just the building blocks - it lies in the
aggregation and analysis of the data, the essence - but often
missing - component of the big data revolution, and how this
is presented to both the public and the LEAs.
ATHENA is a current European FP7 project that utilizes
social media to enhance the ability of LEAs, emergency
responders and citizens to react in times of crisis. ATHENA
provides a suite of web-based applications for both citizens
and LEAs to facilitate efficient and effective communication
which will contribute to the security of the citizens and the
swift resolution of the current crisis situation.
The paper proceeds as follows, firstly we discuss the
ATHENA project, its background and motivations, and place
in context the ATHENA project with other crisis response
systems. Section III discuss in detail the crisis information
processing centre (CIPC) that forms a key part of the
ATHENA system. It proposes methods for data extraction
using text analytics and pre-processing for use within a
Formal Concept Analysis (FCA) application. Section IV
proposes potential uses of FCA within ATHENA including a
technique for summarizing crisis information through
combining attribute reduction with a fault tolerant approach
that reduces concepts. A second method to enable the
monitoring of crisis dynamics is also put forward. Section V
concludes the paper.
II. THE ATHENA PROJECT
ATHENA recognizes that citizens are under-utilized
during crisis situations but it is only with the proliferation of
smartphones and an always-on internet connection coupled
with the openness of social media that the use of social media
has grown and its ability to assist in times of crisis can be
explored. ATHENA aims to go further than other emergency
response systems by providing with a complete system
directly linking the public to LEAs; a connection
demonstrated as being vital during previous crises such as the
Queensland floods [1] and the 2010 Haitian earthquake [2].
During a crisis, citizens, who are first on the scene, have
proven to be creative and resourceful in coordinating the crisis
relief effort. ATHENA wants to harness this enthusiasm and
resourcefulness by giving them access to real-time
information and by encouraging them to feed back current
situational information to other citizens and to those in
command and control. The ATHENA vision is to have all
these components working in synchronization to achieve an
effective crisis response through empowering citizens and
giving them a voice in the crisis management process.
ATHENA aims to explore and evaluate the results of this
process against a backdrop of crisis scenarios including an
airline disaster, a public order incident, a terrorist incident, a
health epidemic and a natural disaster. These scenarios will be
used to validate and evaluate the tools developed and provide
feedback for further developments of the system.
A. Social Media in Crisis Management
Social media has now become the 'go-to' place when
looking for quick, up-to-date news about anything. Aside from
2014 IEEE/ACM 7th International Conference on Utility and Cloud Computing
978-1-4799-7881-6/14 $31.00 © 2014 IEEE
DOI
690
news, sports results and day-to-day life commentaries it is also
now a place where people both post and seek information
during an emergency. Social media is a well-known source of
big data due to its vast size and its pace of change. This
matches the Gartner's big data definition of high volume, high
velocity and high variety [3].
From social media a number of platforms have grown
which aim to aid both citizen reports and tracking of the crisis.
One of the first major crises to make use of crowd-sourced
information extensively was the Haiti earthquake of 2010. The
earthquake claimed hundreds of thousands of lives and
destroyed much of the infrastructure and buildings in the
region [4]. However, it was also one of the initial deployments
of the Ushahidi project [5] to assist with the crisis response.
Ushahidi [6] is an ever growing platform that utilizes
crowdsourcing for crisis response. Originally built for the
Kenyan elections the crisis map housed SMS reports sent by
users to Ushahidi volunteers who would verify and place them
on the map. By the time of the Haitian earthquake, Ushahidi
was integrated with social media and became Crowdmap, a
stand-alone platform that any developer can deploy to
collaboratively map crisis events through users 'checking-in'
and leaving reports. Ushahidi also incorporates the SwiftRiver
platform, which is utilized by FirstToSee [7], for fast, real-
time, data analysis and the recently released CrisisNET which
provides a consolidated source of crisis data [8]. Ushahidi is
now a collection of both hardware and software resources that
can be utilized in a crisis.
By building on the lessons learnt, such as the difficulties
in classifying information accurately [9], from Ushahidi came
the Standby Task Force. The Standby Task Force is a group
of volunteers that offer, amongst other things, semi-automatic
classification of crisis data through a team known as the
MicroMappers [10], [11]. Tweets are collected automatically
but then forwarded to the volunteers who classify the tweets
manually.
AIDR (Artificial Intelligence for Disaster Response) [12]
is an extension of this idea but aims to use artificial
intelligence to automatically classify microblog messages and
has been show to achieve accuracy of up to 80% when
classifying informative versus non-informative tweets;
however, even in this case the classification for the training
sets must still be done by humans.
In the midst of the 2011 Queensland Floods the
engagement of the public with social media, and the ability of
them to not only engage with their friends and associates but
also with law enforcement agencies (LEAs) and other relief
agencies proved to be crucial. The @QPSMedia Twitter
account became a trusted source for situational awareness
information while the #qldflood hashtag generated discussion
both around the topic of the floods and provided support for
those looking to engage in and coordinate fundraising and
relief efforts [1].
The American Red Cross has also released a series of its
own apps mainly to help citizens in crises [13]. Further, they
provide a gamified volunteer app in which volunteers receive
information and instructions on the help and support that they
can give whilst earning badges and other rewards. Google
also offers its own crisis response system [14] and has recently
integrated its Google Now service with Twitter [15] in order
to provide Tweets that are relevant to the users' location and
the current crisis situations that they may need to be aware of.
Crowdhelp [16], [17] is a tool which combines a gateway
for public reporting with a service layer that can be used by
disaster management professionals accessed both as an app
and through a website. The app has a strong health focus and
uses the crowd-sourced inputs for triage operations in order to
prioritize the treatment of patient and casualties. Crowdhelp
also uses the machine learning platform WEKA [18] to cluster
the data and enable the analysis of the features of this data in
relation to these clusters.
Nevertheless, the problem that remains is not how to
extract information from social media but how to assesses the
utility of these posts and utilize them to support an effective
crisis response [19], exactly the same problem big data faces.
That is, how do we approach the challenge of extracting
meaning from these posts [20] and, further, meaning that is
relevant to both crisis responders and LEAs? This is where a
system such as ATHENA can provide the means to detect and
extract the social media posts and also to filter, analyze and
turn them into actionable and useful information.
B. ATHENA Prototype System
One of the principal aims of ATHENA is to develop a
suite of prototype software tools to assist in the management
of the crisis situation. These tools will be composed of a crisis
information processing centre (CIPC), a crisis mobile
application, a crisis command and control intelligence
dashboard (CCCID), and the ATHENA cloud.
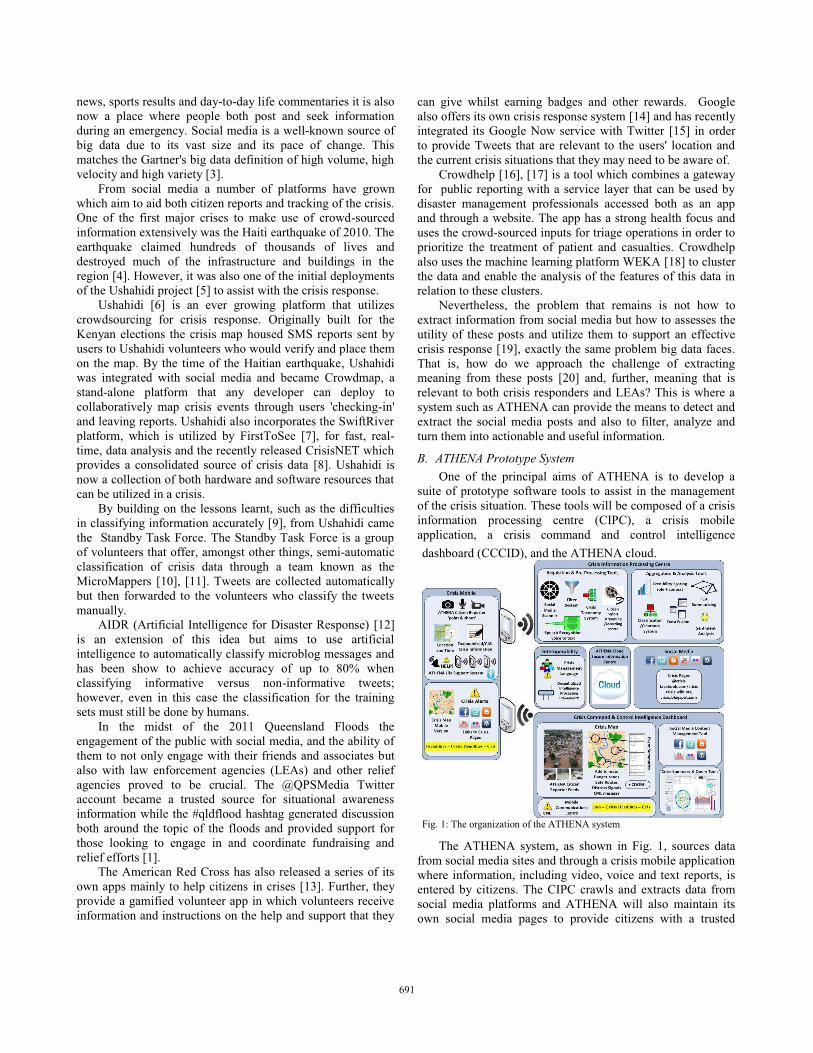
Fig. 1: The organization of the ATHENA system
The ATHENA system, as shown in Fig. 1, sources data
from social media sites and through a crisis mobile application
where information, including video, voice and text reports, is
entered by citizens. The CIPC crawls and extracts data from
social media platforms and ATHENA will also maintain its
own social media pages to provide citizens with a trusted
691
resource and a place for interaction. Ultimately, the ATHENA
system will be used as a crowdsourcing platform for collecting
data directly related to the crisis.
The CIPC then fuses and processes the data ready for
analysis. The analysis phase will make use of techniques such
as natural language processing and text mining to produce
summaries, judge sentiment and screen the content for
credibility. This will be achieved by applying techniques such
as Formal Concept Analysis (FCA), rule-based inference, and
other clustering and classification methods. Further
information on the CIPC and its functions is given in the next
sections.
Once processed, this information will be disseminated
through a number of channels to the public, LEAs and
emergency responders. Summaries will be posted to the
ATHENA social media pages and geo-located data will be
presented in the mobile map. This map will house much of the
information that has been received from the analysis phase
and post it to the map. Building on ideas from Healthmap
[21], CrowdHelp [16] and Ushahidi the map will contain key
locations of incidents, safe routes through the city or disaster
area, and cries and offers of help from citizens. A
comprehensive version of the map will be replicated as part of
the CCCID. The dashboard also displays further information
showing timelines of events, key videos and images, crisis
headlines and alerts and sentiment analyses of the public’s
reaction and the emergency response. The ATHENA cloud acts as an intermediary between these
interfaces, storing data generated by the crawlers, the social media sites and the results of the processed data. The cloudenables ATHENA to maintain a consistent, central datarepository implementing clearance protocols to ensure that operationally sensitive data does not enter the public domain.
III. DATA INTEGRATION IN THE CRISIS INFORMATION
PROCESSING CENTRE (CIPC)
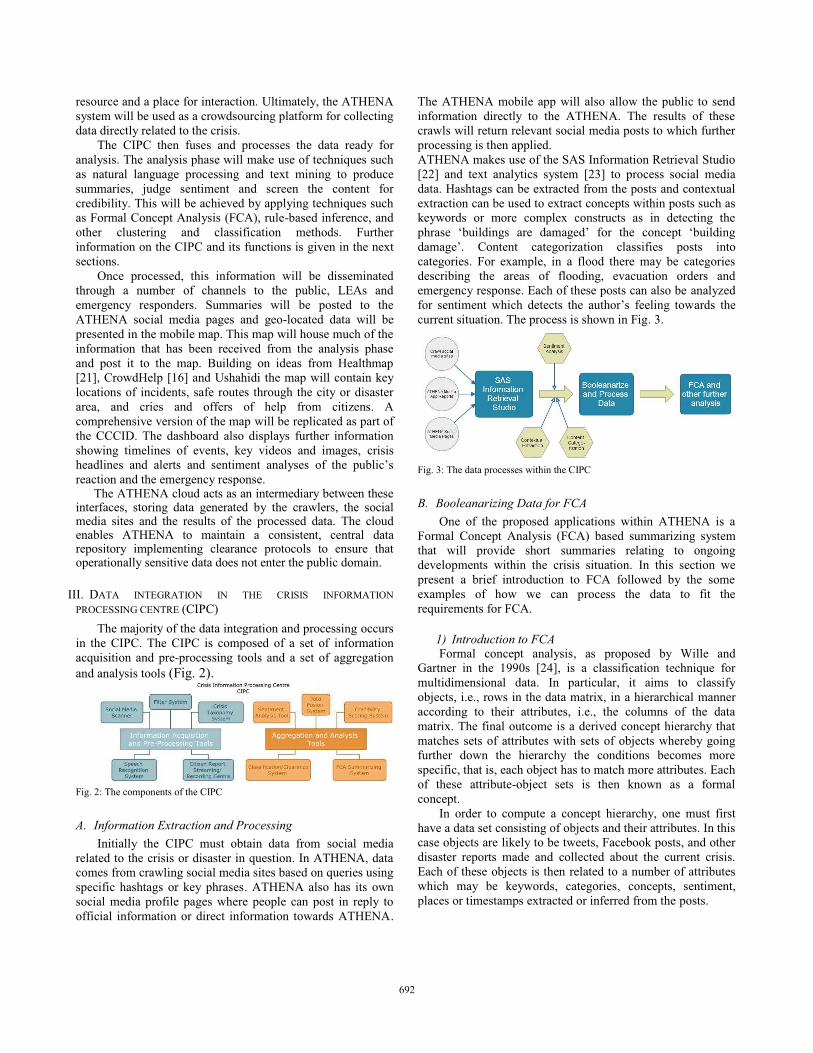
The majority of the data integration and processing occurs
in the CIPC. The CIPC is composed of a set of information
acquisition and pre-processing tools and a set of aggregation
and analysis tools (Fig. 2).
Fig. 2: The components of the CIPC
A. Information Extraction and Processing
Initially the CIPC must obtain data from social media
related to the crisis or disaster in question. In ATHENA, data
comes from crawling social media sites based on queries using
specific hashtags or key phrases. ATHENA also has its own
social media profile pages where people can post in reply to
official information or direct information towards ATHENA.
The ATHENA mobile app will also allow the public to send
information directly to the ATHENA. The results of these
crawls will return relevant social media posts to which further
processing is then applied.
ATHENA makes use of the SAS Information Retrieval Studio
[22] and text analytics system [23] to process social media
data. Hashtags can be extracted from the posts and contextual
extraction can be used to extract concepts within posts such as
keywords or more complex constructs as in detecting the
phrase ‘buildings are damaged’ for the concept ‘building
damage’. Content categorization classifies posts into
categories. For example, in a flood there may be categories
describing the areas of flooding, evacuation orders and
emergency response. Each of these posts can also be analyzed
for sentiment which detects the author’s feeling towards the
current situation. The process is shown in Fig. 3.
Fig. 3: The data processes within the CIPC
B. Booleanarizing Data for FCA
One of the proposed applications within ATHENA is a
Formal Concept Analysis (FCA) based summarizing system
that will provide short summaries relating to ongoing
developments within the crisis situation. In this section we
present a brief introduction to FCA followed by the some
examples of how we can process the data to fit the
requirements for FCA.
1) Introduction to FCA Formal concept analysis, as proposed by Wille and
Gartner in the 1990s [24], is a classification technique for
multidimensional data. In particular, it aims to classify
objects, i.e., rows in the data matrix, in a hierarchical manner
according to their attributes, i.e., the columns of the data
matrix. The final outcome is a derived concept hierarchy that
matches sets of attributes with sets of objects whereby going
further down the hierarchy the conditions becomes more
specific, that is, each object has to match more attributes. Each
of these attribute-object sets is then known as a formal
concept.
In order to compute a concept hierarchy, one must first
have a data set consisting of objects and their attributes. In this
case objects are likely to be tweets, Facebook posts, and other
disaster reports made and collected about the current crisis.
Each of these objects is then related to a number of attributes
which may be keywords, categories, concepts, sentiment,
places or timestamps extracted or inferred from the posts.
692
Computing the hierarchy requires a cross matrix to be
formed. A cross matrix is the equivalent of a boolean matrix
whereby each row describes an object and each column an
attribute. A cross (X) is made in the corresponding matrix
entry if that particular object has that particular attribute. An
example cross matrix is shown in Table 1 where each row is
an object and each column represents an attribute. A cross
indicates the presence of attribute for that particular object.
The cross matrix shows that in FCA, there is not only a
restriction that the data has to be multidimensional, there is
also a restriction on the data type within each dimension, that
is, it has to be able to be expressed as a boolean value, i.e.,
each object either has an attribute or it does not. However,
real-world data often does not fall into these neat binary
categories but takes on multiple forms. For example, there
may be continuous variable, such as the sentiment score, or
multi-category data that need transforming into boolean data,
as will be the case if tweets contain multiple concepts or are
classified into multiple categories. Therefore techniques are
needed to manipulate these attributes in to the boolean format.
TABLE 1:EXAMPLE OF AN FCA CROSS-MATRIX WITH 10 OBJECTS
AND SIX ATTRIBUTES
a b c d e f
1 X . . . X .
2 . X . X X X
3 X . X . . X
4 X . . . . X
5 . X X . . .
6 X . . X . X
7 . . X . X .
8 X . X . X .
9 . . . X X .
10 X X . . . X
2) Booleanarizing GPS locations An example relevant to environmental disasters is how to
process GPS location data for use with FCA. A tweet or report
made using the mobile app will often have GPS location data
reported as latitude and longitude coordinates. We may wish
to make use of this data as attributes; however, individual
coordinates are too fine-grained to form categories
themselves. Therefore each pair of coordinates could be
assigned to a particular attribute area and, further, areas do not
have to be distinct but instead they may be contained inside or
intersect with other areas.
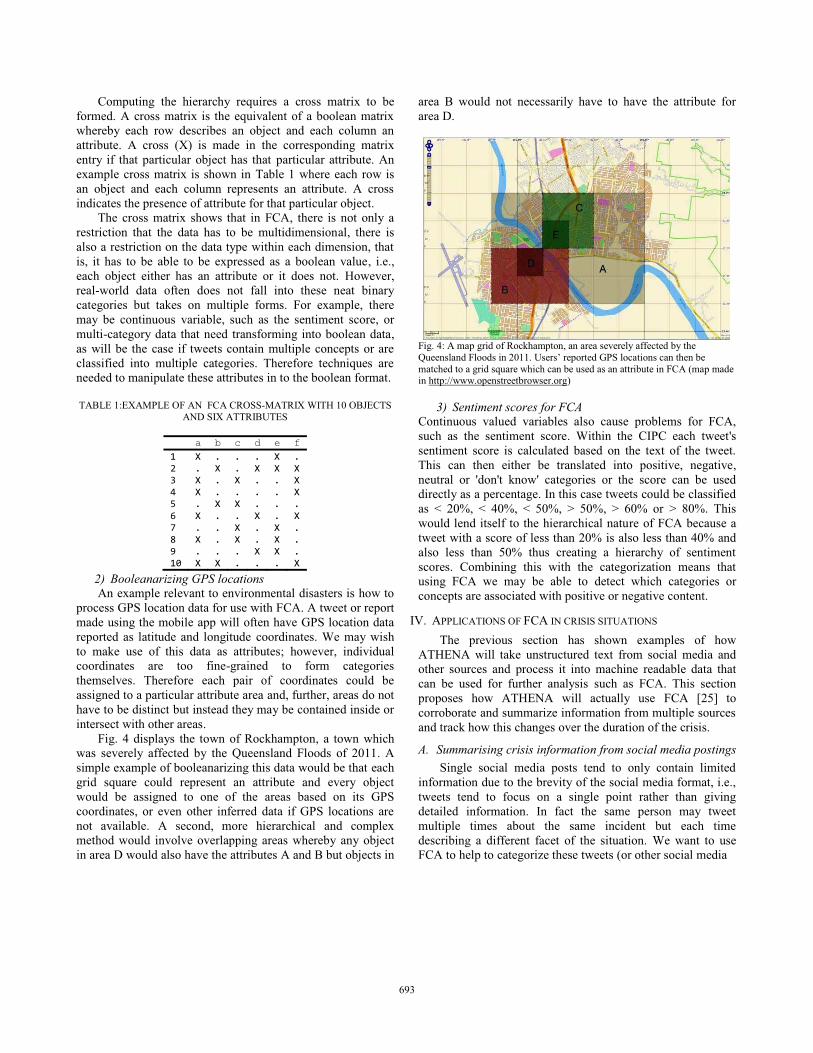
Fig. 4 displays the town of Rockhampton, a town which
was severely affected by the Queensland Floods of 2011. A
simple example of booleanarizing this data would be that each
grid square could represent an attribute and every object
would be assigned to one of the areas based on its GPS
coordinates, or even other inferred data if GPS locations are
not available. A second, more hierarchical and complex
method would involve overlapping areas whereby any object
in area D would also have the attributes A and B but objects in
area B would not necessarily have to have the attribute for
area D.
Fig. 4: A map grid of Rockhampton, an area severely affected by the
Queensland Floods in 2011. Users’ reported GPS locations can then be
matched to a grid square which can be used as an attribute in FCA (map made in http://www.openstreetbrowser.org)
3) Sentiment scores for FCA Continuous valued variables also cause problems for FCA,
such as the sentiment score. Within the CIPC each tweet's
sentiment score is calculated based on the text of the tweet.
This can then either be translated into positive, negative,
neutral or 'don't know' categories or the score can be used
directly as a percentage. In this case tweets could be classified
as < 20%, < 40%, < 50%, > 50%, > 60% or > 80%. This
would lend itself to the hierarchical nature of FCA because a
tweet with a score of less than 20% is also less than 40% and
also less than 50% thus creating a hierarchy of sentiment
scores. Combining this with the categorization means that
using FCA we may be able to detect which categories or
concepts are associated with positive or negative content.
IV. APPLICATIONS OF FCA IN CRISIS SITUATIONS
The previous section has shown examples of how
ATHENA will take unstructured text from social media and
other sources and process it into machine readable data that
can be used for further analysis such as FCA. This section
proposes how ATHENA will actually use FCA [25] to
corroborate and summarize information from multiple sources
and track how this changes over the duration of the crisis.
A. Summarising crisis information from social media postings
Single social media posts tend to only contain limited
information due to the brevity of the social media format, i.e.,
tweets tend to focus on a single point rather than giving
detailed information. In fact the same person may tweet
multiple times about the same incident but each time
describing a different facet of the situation. We want to use
FCA to help to categorize these tweets (or other social media
693
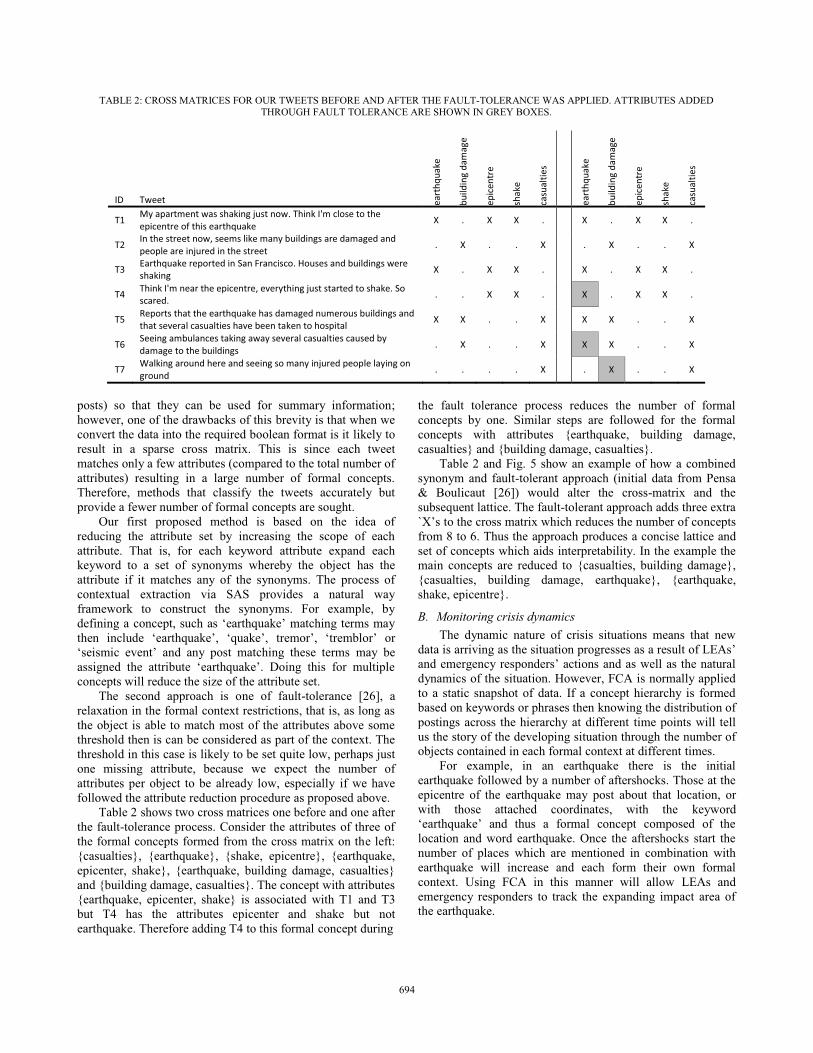
TABLE 2: CROSS MATRICES FOR OUR TWEETS BEFORE AND AFTER THE FAULT-TOLERANCE WAS APPLIED. ATTRIBUTES ADDED
THROUGH FAULT TOLERANCE ARE SHOWN IN GREY BOXES.
ID Tweet ea
rth
qu
ake
bu
ild
ing
da
ma
ge
ep
ice
ntr
e
sha
ke
casu
alt
ies
ea
rth
qu
ake
bu
ild
ing
da
ma
ge
ep
ice
ntr
e
sha
ke
casu
alt
ies
T1 My apartment was shaking just now. Think I'm close to the
epicentre of this earthquake X . X X . X . X X .
T2 In the street now, seems like many buildings are damaged and
people are injured in the street . X . . X . X . . X
T3 Earthquake reported in San Francisco. Houses and buildings were
shaking X . X X . X . X X .
T4 Think I'm near the epicentre, everything just started to shake. So
scared. . . X X . X . X X .
T5 Reports that the earthquake has damaged numerous buildings and
that several casualties have been taken to hospital X X . . X X X . . X
T6 Seeing ambulances taking away several casualties caused by
damage to the buildings . X . . X X X . . X
T7 Walking around here and seeing so many injured people laying on
ground . . . . X . X . . X
posts) so that they can be used for summary information;
however, one of the drawbacks of this brevity is that when we
convert the data into the required boolean format is it likely to
result in a sparse cross matrix. This is since each tweet
matches only a few attributes (compared to the total number of
attributes) resulting in a large number of formal concepts.
Therefore, methods that classify the tweets accurately but
provide a fewer number of formal concepts are sought.
Our first proposed method is based on the idea of
reducing the attribute set by increasing the scope of each
attribute. That is, for each keyword attribute expand each
keyword to a set of synonyms whereby the object has the
attribute if it matches any of the synonyms. The process of
contextual extraction via SAS provides a natural way
framework to construct the synonyms. For example, by
defining a concept, such as ‘earthquake’ matching terms may
then include ‘earthquake’, ‘quake’, tremor’, ‘tremblor’ or
‘seismic event’ and any post matching these terms may be
assigned the attribute ‘earthquake’. Doing this for multiple
concepts will reduce the size of the attribute set.
The second approach is one of fault-tolerance [26], a
relaxation in the formal context restrictions, that is, as long as
the object is able to match most of the attributes above some
threshold then is can be considered as part of the context. The
threshold in this case is likely to be set quite low, perhaps just
one missing attribute, because we expect the number of
attributes per object to be already low, especially if we have
followed the attribute reduction procedure as proposed above.
Table 2 shows two cross matrices one before and one after
the fault-tolerance process. Consider the attributes of three of
the formal concepts formed from the cross matrix on the left:
{casualties}, {earthquake}, {shake, epicentre}, {earthquake,
epicenter, shake}, {earthquake, building damage, casualties}
and {building damage, casualties}. The concept with attributes
{earthquake, epicenter, shake} is associated with T1 and T3
but T4 has the attributes epicenter and shake but not
earthquake. Therefore adding T4 to this formal concept during
the fault tolerance process reduces the number of formal
concepts by one. Similar steps are followed for the formal
concepts with attributes {earthquake, building damage,
casualties} and {building damage, casualties}.
Table 2 and Fig. 5 show an example of how a combined
synonym and fault-tolerant approach (initial data from Pensa
& Boulicaut [26]) would alter the cross-matrix and the
subsequent lattice. The fault-tolerant approach adds three extra
`X’s to the cross matrix which reduces the number of concepts
from 8 to 6. Thus the approach produces a concise lattice and
set of concepts which aids interpretability. In the example the
main concepts are reduced to {casualties, building damage},
{casualties, building damage, earthquake}, {earthquake,
shake, epicentre}.
B. Monitoring crisis dynamics
The dynamic nature of crisis situations means that new
data is arriving as the situation progresses as a result of LEAs’
and emergency responders’ actions and as well as the natural
dynamics of the situation. However, FCA is normally applied
to a static snapshot of data. If a concept hierarchy is formed
based on keywords or phrases then knowing the distribution of
postings across the hierarchy at different time points will tell
us the story of the developing situation through the number of
objects contained in each formal context at different times.
For example, in an earthquake there is the initial
earthquake followed by a number of aftershocks. Those at the
epicentre of the earthquake may post about that location, or
with those attached coordinates, with the keyword
‘earthquake’ and thus a formal concept composed of the
location and word earthquake. Once the aftershocks start the
number of places which are mentioned in combination with
earthquake will increase and each form their own formal
context. Using FCA in this manner will allow LEAs and
emergency responders to track the expanding impact area of
the earthquake.
694
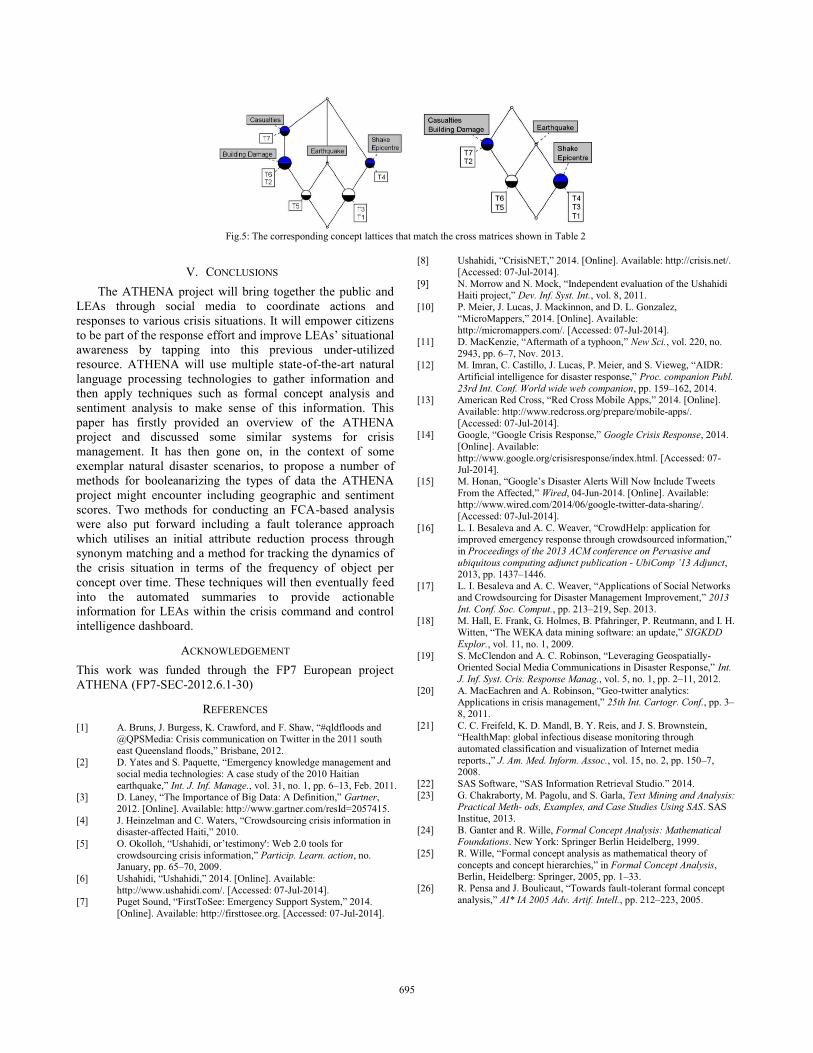
Fig.5: The corresponding concept lattices that match the cross matrices shown in Table 2
V. CONCLUSIONS
The ATHENA project will bring together the public and
LEAs through social media to coordinate actions and
responses to various crisis situations. It will empower citizens
to be part of the response effort and improve LEAs’ situational
awareness by tapping into this previous under-utilized
resource. ATHENA will use multiple state-of-the-art natural
language processing technologies to gather information and
then apply techniques such as formal concept analysis and
sentiment analysis to make sense of this information. This
paper has firstly provided an overview of the ATHENA
project and discussed some similar systems for crisis
management. It has then gone on, in the context of some
exemplar natural disaster scenarios, to propose a number of
methods for booleanarizing the types of data the ATHENA
project might encounter including geographic and sentiment
scores. Two methods for conducting an FCA-based analysis
were also put forward including a fault tolerance approach
which utilises an initial attribute reduction process through
synonym matching and a method for tracking the dynamics of
the crisis situation in terms of the frequency of object per
concept over time. These techniques will then eventually feed
into the automated summaries to provide actionable
information for LEAs within the crisis command and control
intelligence dashboard.
ACKNOWLEDGEMENT
This work was funded through the FP7 European project
ATHENA (FP7-SEC-2012.6.1-30)
REFERENCES
[1] A. Bruns, J. Burgess, K. Crawford, and F. Shaw, “#qldfloods and
@QPSMedia: Crisis communication on Twitter in the 2011 south
east Queensland floods,” Brisbane, 2012.[2] D. Yates and S. Paquette, “Emergency knowledge management and
social media technologies: A case study of the 2010 Haitian
earthquake,” Int. J. Inf. Manage., vol. 31, no. 1, pp. 6–13, Feb. 2011. [3] D. Laney, “The Importance of Big Data: A Definition,” Gartner,
2012. [Online]. Available: http://www.gartner.com/resId=2057415.
[4] J. Heinzelman and C. Waters, “Crowdsourcing crisis information in disaster-affected Haiti,” 2010.
[5] O. Okolloh, “Ushahidi, or’testimony': Web 2.0 tools for
crowdsourcing crisis information,” Particip. Learn. action, no. January, pp. 65–70, 2009.
[6] Ushahidi, “Ushahidi,” 2014. [Online]. Available:
http://www.ushahidi.com/. [Accessed: 07-Jul-2014]. [7] Puget Sound, “FirstToSee: Emergency Support System,” 2014.
[Online]. Available: http://firsttosee.org. [Accessed: 07-Jul-2014].
[8] Ushahidi, “CrisisNET,” 2014. [Online]. Available: http://crisis.net/.
[Accessed: 07-Jul-2014].
[9] N. Morrow and N. Mock, “Independent evaluation of the Ushahidi Haiti project,” Dev. Inf. Syst. Int., vol. 8, 2011.
[10] P. Meier, J. Lucas, J. Mackinnon, and D. L. Gonzalez,
“MicroMappers,” 2014. [Online]. Available: http://micromappers.com/. [Accessed: 07-Jul-2014].
[11] D. MacKenzie, “Aftermath of a typhoon,” New Sci., vol. 220, no.
2943, pp. 6–7, Nov. 2013. [12] M. Imran, C. Castillo, J. Lucas, P. Meier, and S. Vieweg, “AIDR:
Artificial intelligence for disaster response,” Proc. companion Publ.
23rd Int. Conf. World wide web companion, pp. 159–162, 2014. [13] American Red Cross, “Red Cross Mobile Apps,” 2014. [Online].
Available: http://www.redcross.org/prepare/mobile-apps/.
[Accessed: 07-Jul-2014]. [14] Google, “Google Crisis Response,” Google Crisis Response, 2014.
[Online]. Available:
http://www.google.org/crisisresponse/index.html. [Accessed: 07-Jul-2014].
[15] M. Honan, “Google’s Disaster Alerts Will Now Include Tweets
From the Affected,” Wired, 04-Jun-2014. [Online]. Available: http://www.wired.com/2014/06/google-twitter-data-sharing/.
[Accessed: 07-Jul-2014].
[16] L. I. Besaleva and A. C. Weaver, “CrowdHelp: application for improved emergency response through crowdsourced information,”
in Proceedings of the 2013 ACM conference on Pervasive and
ubiquitous computing adjunct publication - UbiComp ’13 Adjunct,2013, pp. 1437–1446.
[17] L. I. Besaleva and A. C. Weaver, “Applications of Social Networks and Crowdsourcing for Disaster Management Improvement,” 2013
Int. Conf. Soc. Comput., pp. 213–219, Sep. 2013.
[18] M. Hall, E. Frank, G. Holmes, B. Pfahringer, P. Reutmann, and I. H. Witten, “The WEKA data mining software: an update,” SIGKDD
Explor., vol. 11, no. 1, 2009.
[19] S. McClendon and A. C. Robinson, “Leveraging Geospatially-Oriented Social Media Communications in Disaster Response,” Int.
J. Inf. Syst. Cris. Response Manag., vol. 5, no. 1, pp. 2–11, 2012.
[20] A. MacEachren and A. Robinson, “Geo-twitter analytics: Applications in crisis management,” 25th Int. Cartogr. Conf., pp. 3–
8, 2011.
[21] C. C. Freifeld, K. D. Mandl, B. Y. Reis, and J. S. Brownstein, “HealthMap: global infectious disease monitoring through
automated classification and visualization of Internet media
reports.,” J. Am. Med. Inform. Assoc., vol. 15, no. 2, pp. 150–7, 2008.
[22] SAS Software, “SAS Information Retrieval Studio.” 2014.
[23] G. Chakraborty, M. Pagolu, and S. Garla, Text Mining and Analysis: Practical Meth- ods, Examples, and Case Studies Using SAS. SAS
Institue, 2013.
[24] B. Ganter and R. Wille, Formal Concept Analysis: Mathematical Foundations. New York: Springer Berlin Heidelberg, 1999.
[25] R. Wille, “Formal concept analysis as mathematical theory of
concepts and concept hierarchies,” in Formal Concept Analysis,Berlin, Heidelberg: Springer, 2005, pp. 1–33.
[26] R. Pensa and J. Boulicaut, “Towards fault-tolerant formal concept
analysis,” AI* IA 2005 Adv. Artif. Intell., pp. 212–223, 2005.
695