com - graduate center, cuny€¦ · com . clacls center for latin american, caribbean & latino...
TRANSCRIPT
com
CLACLS Center for Latin American, Caribbean & Latino Studies
Center for Latin American, Caribbean & Latino Studies Graduate Center City University of New York 365 Fifth Avenue Room 5419 New York, New York 10016 212-817-8438 [email protected] http://web.gc.cuny.edu/lastudies
Trends in Poverty Rates among Latinos in New York City and the
United States, 1990 - 2011
Justine Calcagno Ph.D. Candidate
Social & Personality Psychology Ph.D. Program
Quantitative Research Associate, Center for
Latin American, Caribbean & Latino Studies
Graduate Center, CUNY
Latino Data Project - Report 55 - November 2013
The Center for Latin American, Caribbean and Latino Studies is a research institute that works for the advancement of the study of Latin America, the Caribbean, and Latinos in the United States in the doctoral programs at the CUNY Graduate Center. One of its major priorities is to provide funding and research opportunities to Latino students at the Ph.D. level. The Center established and helps administer an interdisciplinary specialization in Latin American, Caribbean and Latino Studies in the Masters of Arts in Liberal Studies program. The Latino Data Project was developed with the goal of making information available on the dynamically growing Latino population of the United States and especially New York City through the analysis of extant data available from a variety of sources such as the U.S. Census Bureau, the National Institute for Health, the Bureau of Labor Statistics, and state and local-level data sources. All Latino Data Project reports are available at http://web.gc.cuny.edu/lastudies/
For additional information you may contact the Center at 212-817-8438 or by e-mail at [email protected].
Staff:
Laird W. Bergad, Distinguished Professor, Latin American and Puerto Rican Studies, Lehman College, Ph.D. Program in History, Executive Director, CLACLS Teresita Levy, Assistant Professor, Department of Latin American, Latino and Puerto Rican Studies, Lehman College, Associate Director Laura Limonic, Administrative Director and Director of Quantitative Research Victoria Stone-Cadena, Director of Outreach and Special Projects Lawrence Cappello, Research Associate Justine Calcagno, Quantitative Research Associate Mila Burns, Website Developer
Copyright @ 2013 Center for Latin American, Caribbean and Latino Studies
Room 5419 Graduate Center
City University of New York 365 Fifth Avenue
New York, New York 10016 212-817-8438 [email protected]
http://web.gc.cuny.edu/lastudies

Poverty Rates Among Latinos in New York City and the U.S. 3
Latino Data Project Report 55 October 2013
Table of Contents
Guide to Tables ............................................................................................................... 4
Guide to Figures .............................................................................................................. 5
Executive Summary ........................................................................................................ 7
Trends in Poverty Rates by Race/Ethnicity, 1990 - 2011 .............................................. 10
Trends in Poverty Rates by Latino Nationality, 1990 - 2011 .......................................... 23
Conclusion .................................................................................................................... 33
Statistical Appendix ....................................................................................................... 34
Methodological Appendix .............................................................................................. 36
Poverty Rates Among Latinos in New York City and the U.S. 4
Latino Data Project Report 55 October 2013
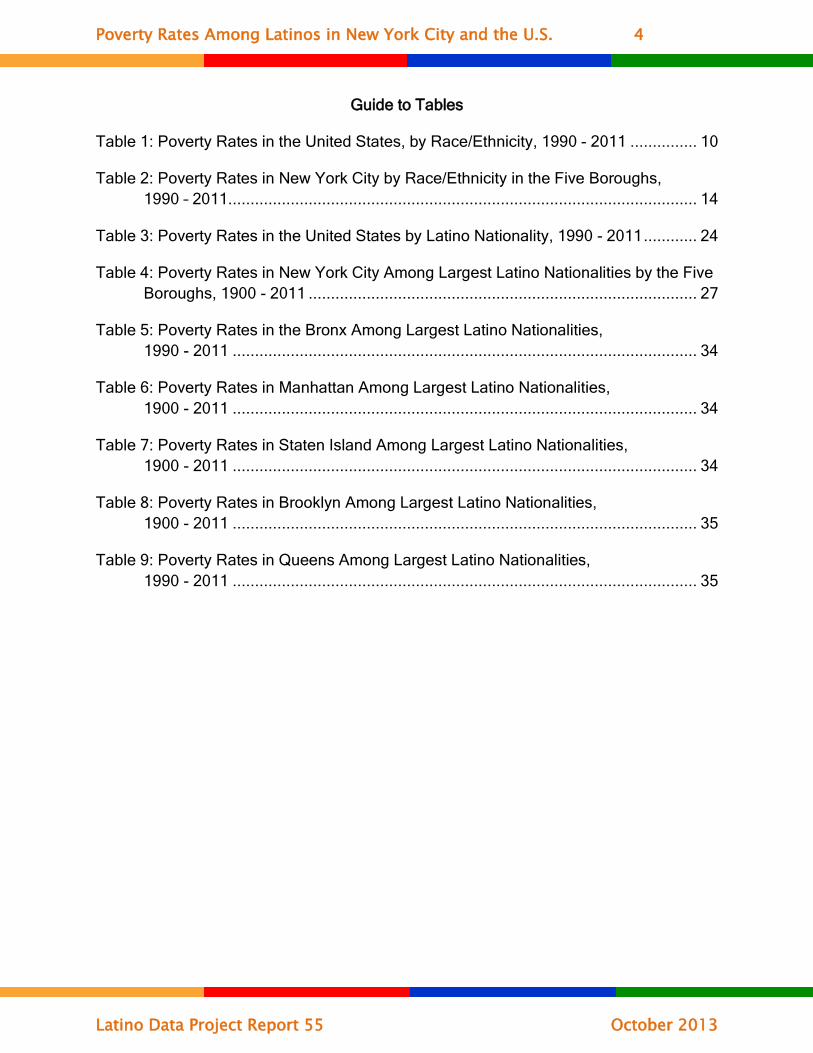
Guide to Tables
Table 1: Poverty Rates in the United States, by Race/Ethnicity, 1990 - 2011 ............... 10
Table 2: Poverty Rates in New York City by Race/Ethnicity in the Five Boroughs, 1990 – 2011 ......................................................................................................... 14
Table 3: Poverty Rates in the United States by Latino Nationality, 1990 - 2011 ............ 24
Table 4: Poverty Rates in New York City Among Largest Latino Nationalities by the Five Boroughs, 1900 - 2011 ....................................................................................... 27
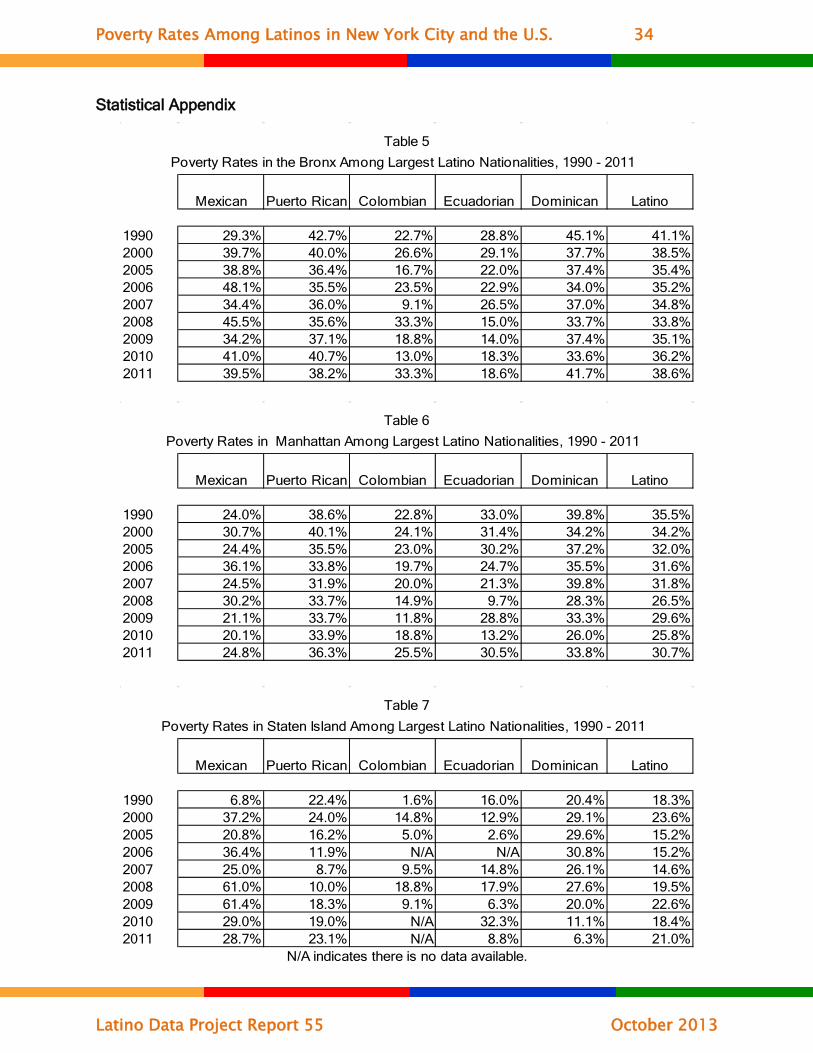
Table 5: Poverty Rates in the Bronx Among Largest Latino Nationalities, 1990 - 2011 ........................................................................................................ 34
Table 6: Poverty Rates in Manhattan Among Largest Latino Nationalities, 1900 - 2011 ........................................................................................................ 34
Table 7: Poverty Rates in Staten Island Among Largest Latino Nationalities, 1900 - 2011 ........................................................................................................ 34
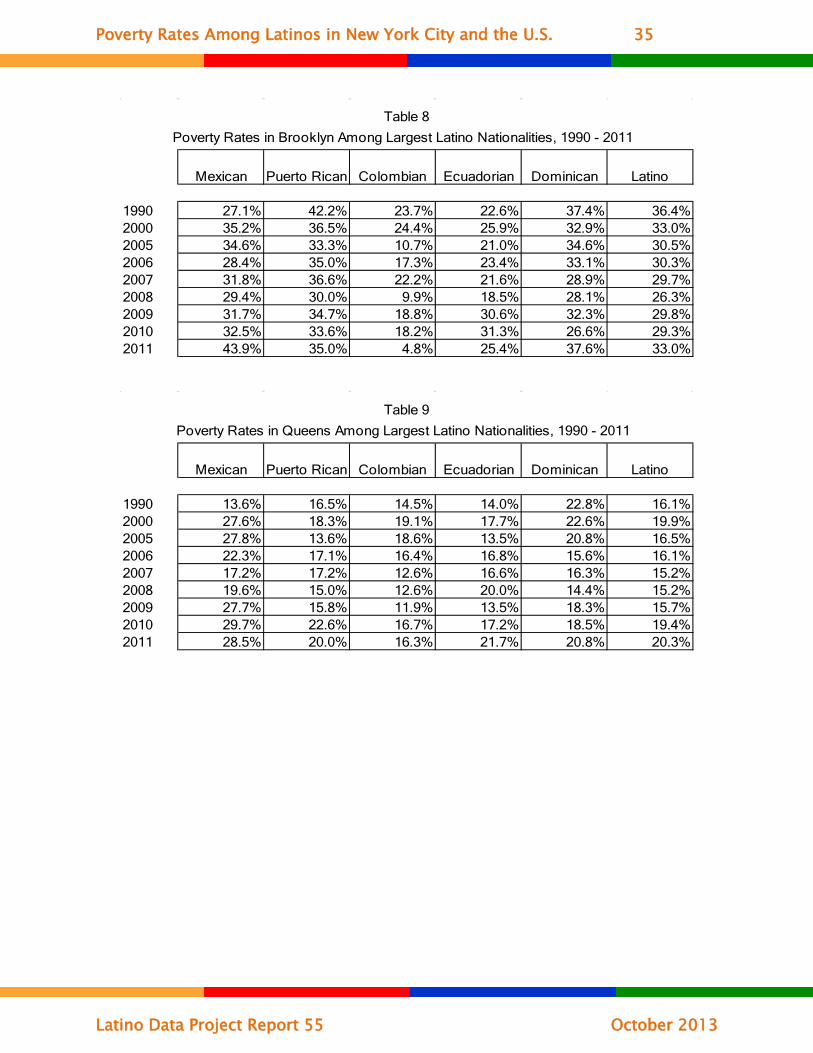
Table 8: Poverty Rates in Brooklyn Among Largest Latino Nationalities, 1900 - 2011 ........................................................................................................ 35
Table 9: Poverty Rates in Queens Among Largest Latino Nationalities, 1990 - 2011 ........................................................................................................ 35
Poverty Rates Among Latinos in New York City and the U.S. 5
Latino Data Project Report 55 October 2013
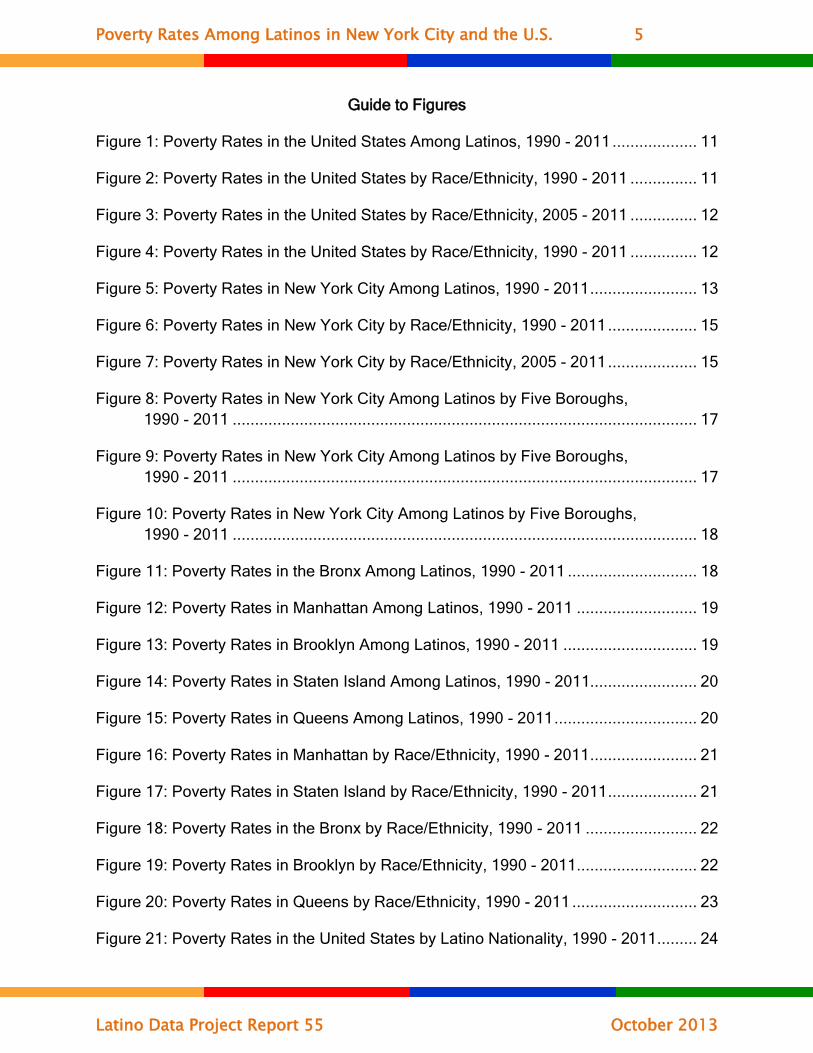
Guide to Figures
Figure 1: Poverty Rates in the United States Among Latinos, 1990 - 2011 ................... 11
Figure 2: Poverty Rates in the United States by Race/Ethnicity, 1990 - 2011 ............... 11
Figure 3: Poverty Rates in the United States by Race/Ethnicity, 2005 - 2011 ............... 12
Figure 4: Poverty Rates in the United States by Race/Ethnicity, 1990 - 2011 ............... 12
Figure 5: Poverty Rates in New York City Among Latinos, 1990 - 2011 ........................ 13
Figure 6: Poverty Rates in New York City by Race/Ethnicity, 1990 - 2011 .................... 15
Figure 7: Poverty Rates in New York City by Race/Ethnicity, 2005 - 2011 .................... 15
Figure 8: Poverty Rates in New York City Among Latinos by Five Boroughs, 1990 - 2011 ........................................................................................................ 17
Figure 9: Poverty Rates in New York City Among Latinos by Five Boroughs, 1990 - 2011 ........................................................................................................ 17
Figure 10: Poverty Rates in New York City Among Latinos by Five Boroughs, 1990 - 2011 ........................................................................................................ 18
Figure 11: Poverty Rates in the Bronx Among Latinos, 1990 - 2011 ............................. 18
Figure 12: Poverty Rates in Manhattan Among Latinos, 1990 - 2011 ........................... 19
Figure 13: Poverty Rates in Brooklyn Among Latinos, 1990 - 2011 .............................. 19
Figure 14: Poverty Rates in Staten Island Among Latinos, 1990 - 2011........................ 20
Figure 15: Poverty Rates in Queens Among Latinos, 1990 - 2011 ................................ 20
Figure 16: Poverty Rates in Manhattan by Race/Ethnicity, 1990 - 2011 ........................ 21
Figure 17: Poverty Rates in Staten Island by Race/Ethnicity, 1990 - 2011 .................... 21
Figure 18: Poverty Rates in the Bronx by Race/Ethnicity, 1990 - 2011 ......................... 22
Figure 19: Poverty Rates in Brooklyn by Race/Ethnicity, 1990 - 2011 ........................... 22
Figure 20: Poverty Rates in Queens by Race/Ethnicity, 1990 - 2011 ............................ 23
Figure 21: Poverty Rates in the United States by Latino Nationality, 1990 - 2011 ......... 24
Poverty Rates Among Latinos in New York City and the U.S. 6
Latino Data Project Report 55 October 2013
Figure 22: Poverty Rates in the United States by Latino Nationality, 2005 - 2011 ......... 25
Figure 23: Poverty Rates in the United States by Latino Nationality, 1990 - 2011 ......... 25
Figure 24: Poverty Rates in New York City by Latino Nationality, 1990 - 2011 ............. 28
Figure 25: Poverty Rates in New York City by Latino Nationality, 2005 - 2011 .............. 28
Figure 26: Poverty Rates in New York City by Latino Nationality, 1990 - 2011 ............. 29
Figure 27: Poverty Rates in the Bronx by Latino Nationality, 1990 - 2011 ..................... 30
Figure 28: Poverty Rates in Manhattan by Latino Nationality, 1990 - 2011 ................... 31
Figure 29: Poverty Rates in Staten Island by Latino Nationality, 1990 - 2011 ............... 31
Figure 30: Poverty Rates in Brooklyn by Latino Nationality, 1990 - 2011 ...................... 32
Figure 31: Poverty Rates in Queens by Latino Nationality, 1990 - 2011 ....................... 32
Poverty Rates Among Latinos in New York City and the U.S. 7
Latino Data Project Report 55 October 2013
Executive Summary
A United States Census Bureau report released in September 2013 indicted that poverty rates among the U.S. population have remained stagnant or increased 2000 to 2012. The report suggested that the national poverty rate rose in response to the economic crisis in the United States, which began in late 2007, and that despite the official end of the recession in June 2009, these rates have not declined.1
This report explores trends in poverty from 1990 to 2011 within New York City and the United States with special emphasis on Latinos in comparative perspective with poverty among other race/ethnic groups. Changing poverty rates among Latino nationalities are also examined.2
The analyzed data indicate that the poverty rate among the national population over the last two decades increased. However, there were nuanced and complex trends within both New York City and the United States when race/ethnicity and Latino nationalities are examined separately and compared.
Among Latinos in the United States, poverty rates in 2011 were identical to what they had been in 1990, suggesting that the 2007-2009 recession was less important than long-term trends. However, the recession did result in increasing poverty among Latinos in the short-term.
1 See Carmen DeNavas-Walt, Bernadette D. Proctor, Jessica C. Smith, “Income, Poverty, and Health Insurance Coverage in the United States: 2012” (U.S. Department of Commerce, Economics and Statistics Administration, U.S. Census Bureau, September 2013) available on the internet at http://www.census.gov/prod/2013pubs/p60-245.pdf. See the article in the New York Times of September 17, 2013 “Household Incomes Remain Flat Despite Improving Economy” available on the internet at http://www.nytimes.com/2013/09/18/us/median-income-and-poverty-rate-hold-steady-census-bureau-finds.html?pagewanted=1&_r=1. 2 This study uses the American Community Survey PUMS (Public Use Microdata Series) data for all years considered here released by the Census Bureau and reorganized for public use by the Minnesota Population Center, University of Minnesota, IPUMSusa, (https://usa.ipums.org/usa/index.shtml). See Public Use Microdata Series Steven Ruggles, J. Trent Alexander, Katie Genadek, Ronald Goeken, Matthew B. Schroeder, and Matthew Sobek. Integrated Public Use Microdata Series: Version 5.0 [Machine-readable database]. Minneapolis: University of Minnesota, 2010. These data are different from those used by the Census Bureau in its report which was based on data from the Census Bureau’s Current Population Survey. (See methodological appendix for an explanation). While the poverty rates presented here differ from the Census Bureau’s report, the trends are similar. Poverty rates are calculated by the Census Bureau. Detailed information about the calculation of poverty reports can be found at http://www.census.gov/hhes/www/poverty/about/datasources/ factsheet.html and http://camerondcampbell.me/blog/2011/11/using-comparison-of-means-to-calculate-proportions-at-ipums-usa/
Poverty Rates Among Latinos in New York City and the U.S. 8
Latino Data Project Report 55 October 2013
In contrast to nation-wide trends, Latinos in New York City experienced a long-term decline in poverty rates between 1990 and 2011, despite the fact that there was a clear increase in these rates as a result of the economic crisis of 2007 – 2009.
It is apparent that at the national level Latinos may have been more impacted by the 2007 economic downturn than other race/ethnic groups. Poverty among the nation’s Latino population began to increase in 2008, while Asians and non-Hispanic blacks did not see increases until 2009. Latino poverty rates have also increased more dramatically than Asians and non-Hispanic whites in the wake of the crisis. No race/ethnic group has recovered to their pre-recession poverty rates.
In New York City, Latinos experienced increases in poverty rates in 2009, later than among non-Hispanic whites, non-Hispanic blacks, and Asians, whose rates increased in 2008. This was somewhat different than the timing found throughout the country.
While nationally the poverty rate among Latinos was lower than among non-Hispanic blacks, Latinos had the highest poverty rates in New York City and within each borough but Staten Island. The disparities in poverty levels between the City’s race/ethnic groups were stable between 1990 and 2011, and this was the case throughout the U.S. The poverty rates among all race/ethnic groups in the City increased because of the 2007 economic crisis and none have recovered to their pre-recession poverty rates.
There were different poverty rates among the nation’s major Latino nationalities and the way these rates changed in response to the 2007 – 2009 recession. Throughout the nation, Mexican and Ecuadorian poverty rates were higher in 2011 than in 1990 and 2000. Among Puerto Ricans and Dominicans, poverty rates were higher in 2011 than in 2000 but lower than in 1990. However, the poverty rate among Colombians was actually lower in 2011 than in 1990 or 2000.
Yet, among all five Latino nationalities, national poverty rates increased following the economic crisis. Mexicans were the first to see rises in poverty rates, in 2008; the other groups saw increases beginning in 2009. The disparities between Latino nationalities were stable. Colombians consistently had the lowest poverty rates, and Mexicans and Dominicans had the highest poverty rates of the Latino national subgroups in the U.S.
In New York City, poverty rates among the five largest Latino nationalities rose in response to the 2007 – 2009 economic crisis. Poverty rates among Mexicans and Dominicans in 2011 were higher than in 2000; and Mexicans were the first to experience a rise in the poverty rate, beginning in 2008. Colombians and Ecuadorians did not experience increases in poverty rates until 2010. Additionally, poverty among Colombians and Puerto Ricans actually declined between 2000 and 2011. This indicates that the recession did not have a long-term impact on poverty levels among
Poverty Rates Among Latinos in New York City and the U.S. 9
Latino Data Project Report 55 October 2013
Colombians and Puerto Ricans in the City, although the precise reasons are not clear from the data examined for this study.
One striking conclusion when the Latino nationalities are examined separately and compared is that Mexicans and Dominicans clearly had higher poverty rates in both the U.S. and New York City than Puerto Ricans, Colombians, and Ecuadorians. In New York City and the U.S., Mexicans and Dominicans may also have fared worse in response to the economic crisis. These findings may be party attributed to migration patterns. The influx of foreign-born Mexican migrants with poorer skill levels and lower educational attainment profiles may have contributed to higher poverty rates and a greater reaction to the 2007 – 2009 economic downturn. This may have been the case among New York City’s Dominicans as well, who continued to arrive in significant numbers after 2000.
Poverty Rates Among Latinos in New York City and the U.S. 10
Latino Data Project Report 55 October 2013
1990 2000 2005 2006 2007 2008 2009 2010 2011
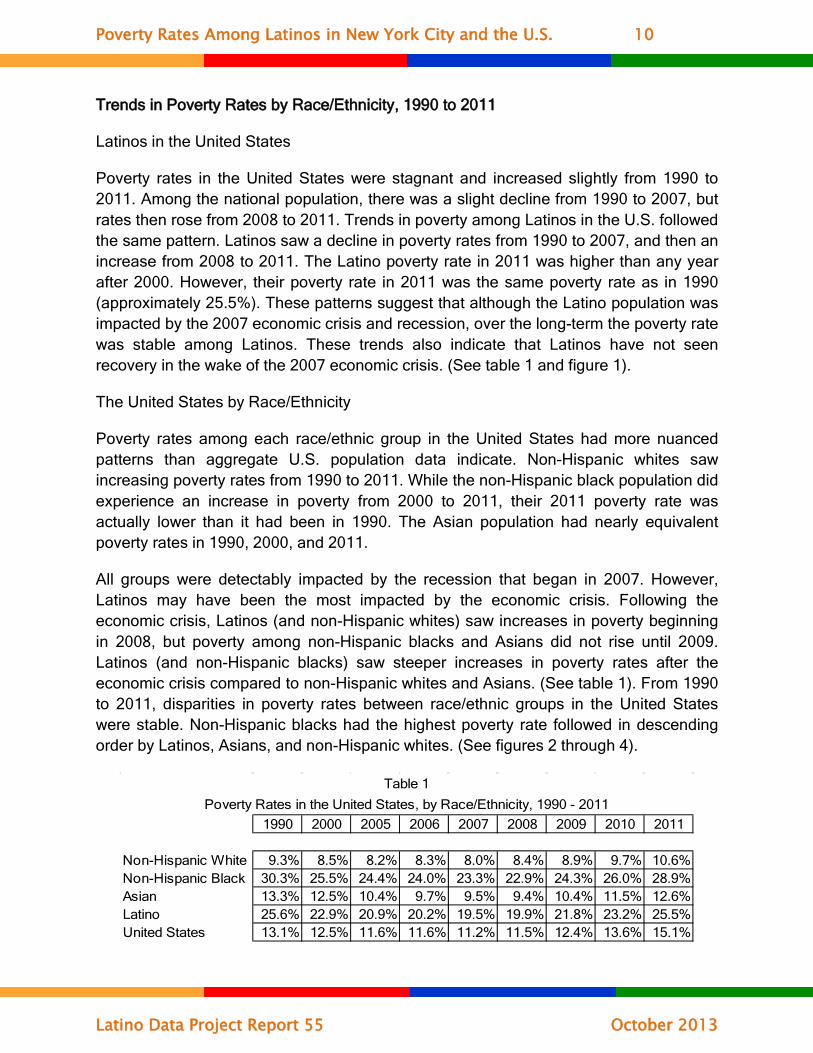
Non-Hispanic White 9.3% 8.5% 8.2% 8.3% 8.0% 8.4% 8.9% 9.7% 10.6%Non-Hispanic Black 30.3% 25.5% 24.4% 24.0% 23.3% 22.9% 24.3% 26.0% 28.9%Asian 13.3% 12.5% 10.4% 9.7% 9.5% 9.4% 10.4% 11.5% 12.6%Latino 25.6% 22.9% 20.9% 20.2% 19.5% 19.9% 21.8% 23.2% 25.5%United States 13.1% 12.5% 11.6% 11.6% 11.2% 11.5% 12.4% 13.6% 15.1%
Poverty Rates in the United States, by Race/Ethnicity, 1990 - 2011
Table 1
Trends in Poverty Rates by Race/Ethnicity, 1990 to 2011
Latinos in the United States
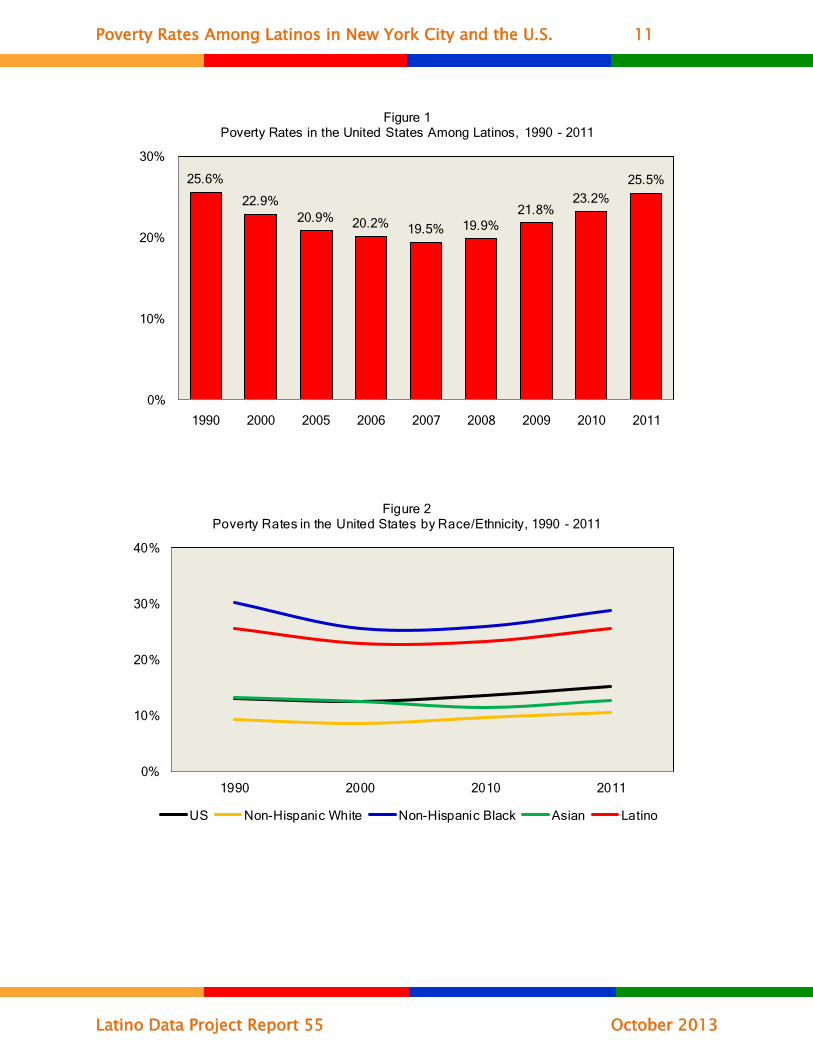
Poverty rates in the United States were stagnant and increased slightly from 1990 to 2011. Among the national population, there was a slight decline from 1990 to 2007, but rates then rose from 2008 to 2011. Trends in poverty among Latinos in the U.S. followed the same pattern. Latinos saw a decline in poverty rates from 1990 to 2007, and then an increase from 2008 to 2011. The Latino poverty rate in 2011 was higher than any year after 2000. However, their poverty rate in 2011 was the same poverty rate as in 1990 (approximately 25.5%). These patterns suggest that although the Latino population was impacted by the 2007 economic crisis and recession, over the long-term the poverty rate was stable among Latinos. These trends also indicate that Latinos have not seen recovery in the wake of the 2007 economic crisis. (See table 1 and figure 1).
The United States by Race/Ethnicity
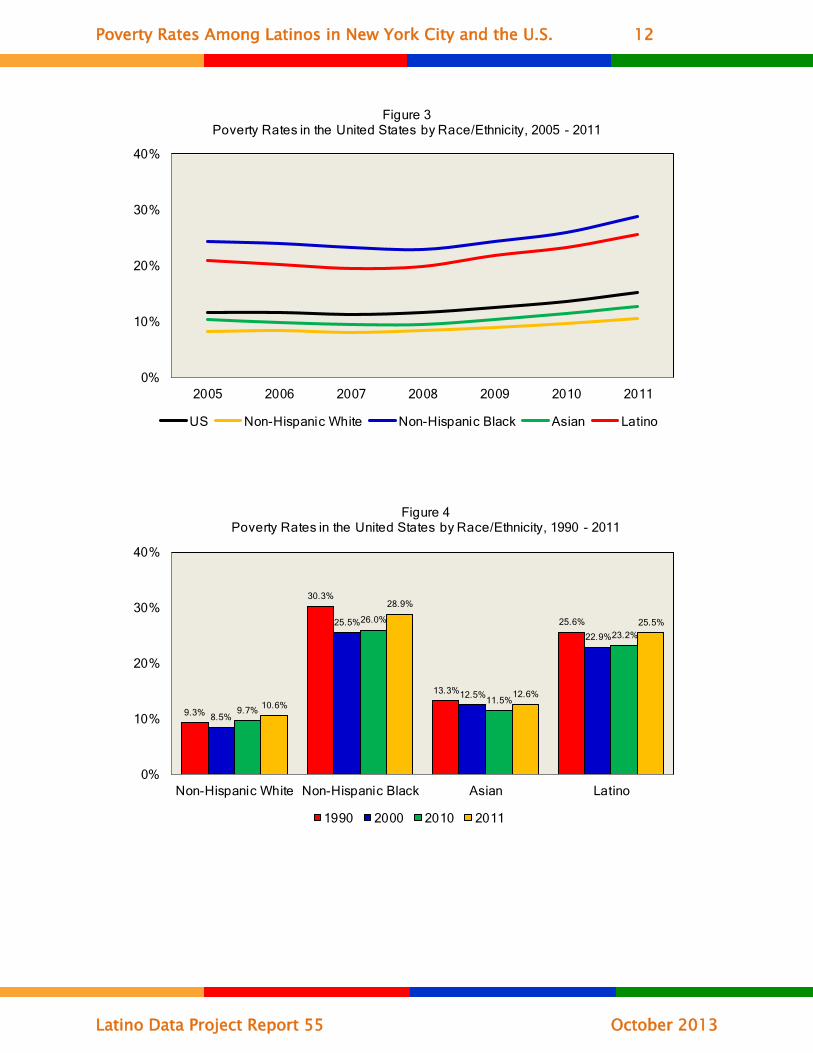
Poverty rates among each race/ethnic group in the United States had more nuanced patterns than aggregate U.S. population data indicate. Non-Hispanic whites saw increasing poverty rates from 1990 to 2011. While the non-Hispanic black population did experience an increase in poverty from 2000 to 2011, their 2011 poverty rate was actually lower than it had been in 1990. The Asian population had nearly equivalent poverty rates in 1990, 2000, and 2011.
All groups were detectably impacted by the recession that began in 2007. However, Latinos may have been the most impacted by the economic crisis. Following the economic crisis, Latinos (and non-Hispanic whites) saw increases in poverty beginning in 2008, but poverty among non-Hispanic blacks and Asians did not rise until 2009. Latinos (and non-Hispanic blacks) saw steeper increases in poverty rates after the economic crisis compared to non-Hispanic whites and Asians. (See table 1). From 1990 to 2011, disparities in poverty rates between race/ethnic groups in the United States were stable. Non-Hispanic blacks had the highest poverty rate followed in descending order by Latinos, Asians, and non-Hispanic whites. (See figures 2 through 4).
Poverty Rates Among Latinos in New York City and the U.S. 11
Latino Data Project Report 55 October 2013
0%
10%
20%
30%
40%
1990 2000 2010 2011
Figure 2 Poverty Rates in the United States by Race/Ethnicity, 1990 - 2011
US Non-Hispanic White Non-Hispanic Black Asian Latino
25.6%
22.9%20.9% 20.2% 19.5% 19.9%
21.8%23.2%
25.5%
0%
10%
20%
30%
1990 2000 2005 2006 2007 2008 2009 2010 2011
Figure 1Poverty Rates in the United States Among Latinos, 1990 - 2011
Poverty Rates Among Latinos in New York City and the U.S. 12
Latino Data Project Report 55 October 2013
0%
10%
20%
30%
40%
2005 2006 2007 2008 2009 2010 2011
Figure 3Poverty Rates in the United States by Race/Ethnicity, 2005 - 2011
US Non-Hispanic White Non-Hispanic Black Asian Latino
9.3%
30.3%
13.3%
25.6%
8.5%
25.5%
12.5%
22.9%
9.7%
26.0%
11.5%
23.2%
10.6%
28.9%
12.6%
25.5%
0%
10%
20%
30%
40%
Non-Hispanic White Non-Hispanic Black Asian Latino
Figure 4Poverty Rates in the United States by Race/Ethnicity, 1990 - 2011
1990 2000 2010 2011
Poverty Rates Among Latinos in New York City and the U.S. 13
Latino Data Project Report 55 October 2013
32.6%31.2%
28.0% 27.7% 27.1%25.5%
27.4% 27.9%30.4%
0%
10%
20%
30%
40%
1990 2000 2005 2006 2007 2008 2009 2010 2011
Figure 5Poverty Rates in New York City Among Latinos, 1990 - 2011
Latinos in New York City
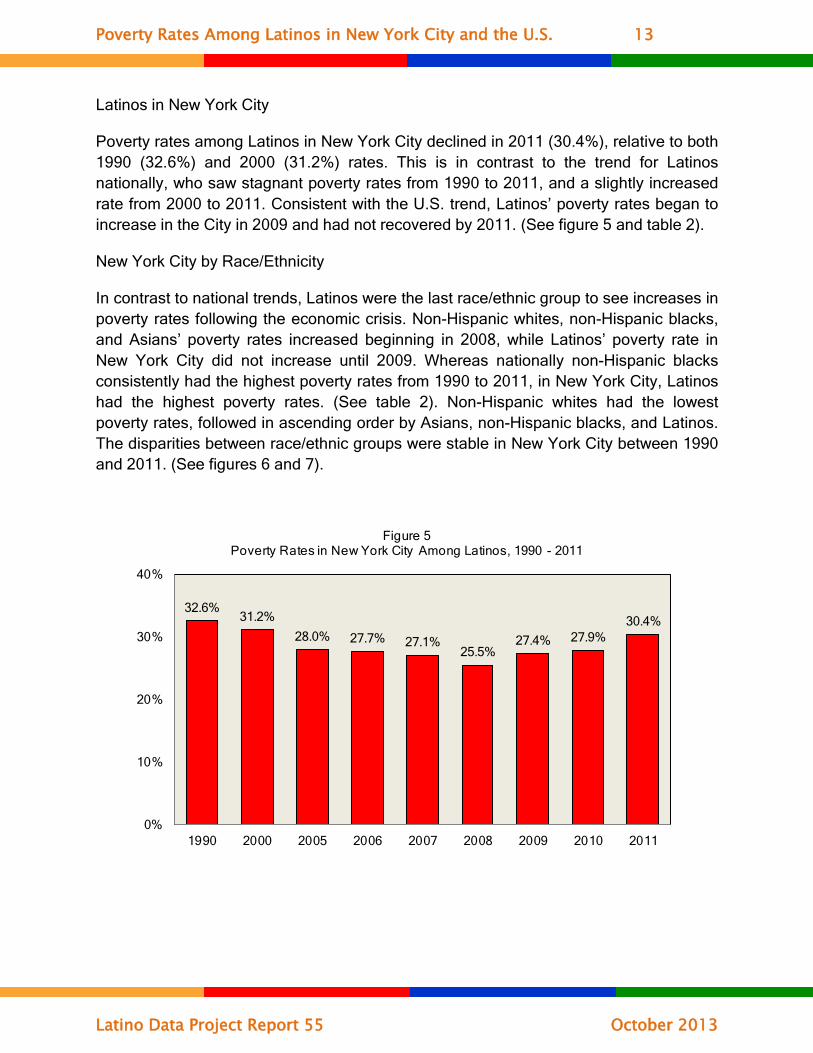
Poverty rates among Latinos in New York City declined in 2011 (30.4%), relative to both 1990 (32.6%) and 2000 (31.2%) rates. This is in contrast to the trend for Latinos nationally, who saw stagnant poverty rates from 1990 to 2011, and a slightly increased rate from 2000 to 2011. Consistent with the U.S. trend, Latinos’ poverty rates began to increase in the City in 2009 and had not recovered by 2011. (See figure 5 and table 2).
New York City by Race/Ethnicity
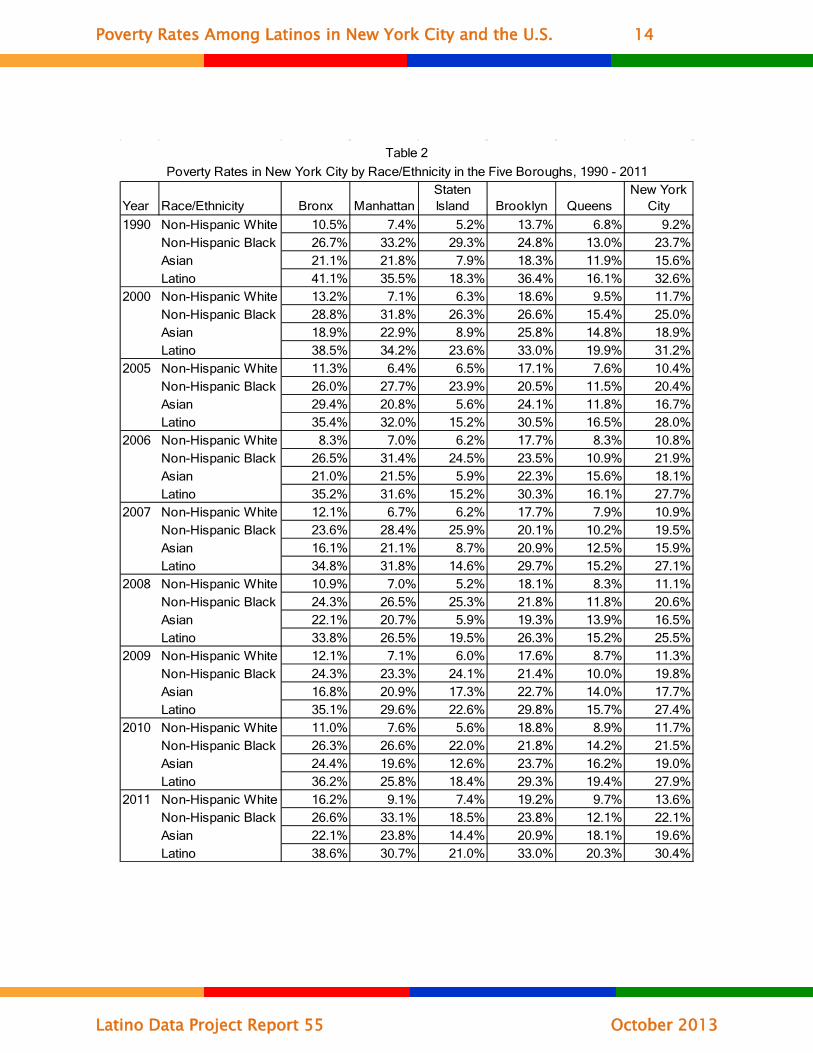
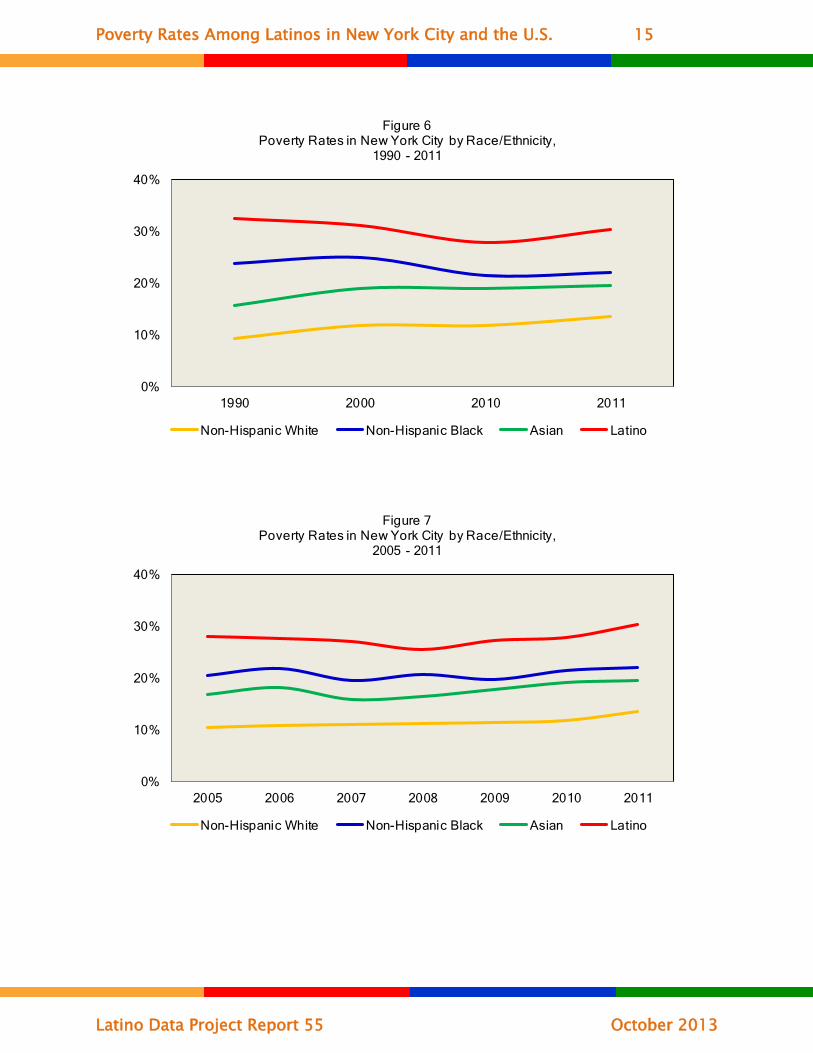
In contrast to national trends, Latinos were the last race/ethnic group to see increases in poverty rates following the economic crisis. Non-Hispanic whites, non-Hispanic blacks, and Asians’ poverty rates increased beginning in 2008, while Latinos’ poverty rate in New York City did not increase until 2009. Whereas nationally non-Hispanic blacks consistently had the highest poverty rates from 1990 to 2011, in New York City, Latinos had the highest poverty rates. (See table 2). Non-Hispanic whites had the lowest poverty rates, followed in ascending order by Asians, non-Hispanic blacks, and Latinos. The disparities between race/ethnic groups were stable in New York City between 1990 and 2011. (See figures 6 and 7).
Poverty Rates Among Latinos in New York City and the U.S. 14
Latino Data Project Report 55 October 2013
Year Race/Ethnicity Bronx ManhattanStaten Island Brooklyn Queens
New York City
1990 Non-Hispanic White 10.5% 7.4% 5.2% 13.7% 6.8% 9.2%Non-Hispanic Black 26.7% 33.2% 29.3% 24.8% 13.0% 23.7%Asian 21.1% 21.8% 7.9% 18.3% 11.9% 15.6%Latino 41.1% 35.5% 18.3% 36.4% 16.1% 32.6%
2000 Non-Hispanic White 13.2% 7.1% 6.3% 18.6% 9.5% 11.7%Non-Hispanic Black 28.8% 31.8% 26.3% 26.6% 15.4% 25.0%Asian 18.9% 22.9% 8.9% 25.8% 14.8% 18.9%Latino 38.5% 34.2% 23.6% 33.0% 19.9% 31.2%
2005 Non-Hispanic White 11.3% 6.4% 6.5% 17.1% 7.6% 10.4%Non-Hispanic Black 26.0% 27.7% 23.9% 20.5% 11.5% 20.4%Asian 29.4% 20.8% 5.6% 24.1% 11.8% 16.7%Latino 35.4% 32.0% 15.2% 30.5% 16.5% 28.0%
2006 Non-Hispanic White 8.3% 7.0% 6.2% 17.7% 8.3% 10.8%Non-Hispanic Black 26.5% 31.4% 24.5% 23.5% 10.9% 21.9%Asian 21.0% 21.5% 5.9% 22.3% 15.6% 18.1%Latino 35.2% 31.6% 15.2% 30.3% 16.1% 27.7%
2007 Non-Hispanic White 12.1% 6.7% 6.2% 17.7% 7.9% 10.9%Non-Hispanic Black 23.6% 28.4% 25.9% 20.1% 10.2% 19.5%Asian 16.1% 21.1% 8.7% 20.9% 12.5% 15.9%Latino 34.8% 31.8% 14.6% 29.7% 15.2% 27.1%
2008 Non-Hispanic White 10.9% 7.0% 5.2% 18.1% 8.3% 11.1%Non-Hispanic Black 24.3% 26.5% 25.3% 21.8% 11.8% 20.6%Asian 22.1% 20.7% 5.9% 19.3% 13.9% 16.5%Latino 33.8% 26.5% 19.5% 26.3% 15.2% 25.5%
2009 Non-Hispanic White 12.1% 7.1% 6.0% 17.6% 8.7% 11.3%Non-Hispanic Black 24.3% 23.3% 24.1% 21.4% 10.0% 19.8%Asian 16.8% 20.9% 17.3% 22.7% 14.0% 17.7%Latino 35.1% 29.6% 22.6% 29.8% 15.7% 27.4%
2010 Non-Hispanic White 11.0% 7.6% 5.6% 18.8% 8.9% 11.7%Non-Hispanic Black 26.3% 26.6% 22.0% 21.8% 14.2% 21.5%Asian 24.4% 19.6% 12.6% 23.7% 16.2% 19.0%Latino 36.2% 25.8% 18.4% 29.3% 19.4% 27.9%
2011 Non-Hispanic White 16.2% 9.1% 7.4% 19.2% 9.7% 13.6%Non-Hispanic Black 26.6% 33.1% 18.5% 23.8% 12.1% 22.1%Asian 22.1% 23.8% 14.4% 20.9% 18.1% 19.6%Latino 38.6% 30.7% 21.0% 33.0% 20.3% 30.4%
Table 2Poverty Rates in New York City by Race/Ethnicity in the Five Boroughs, 1990 - 2011
Poverty Rates Among Latinos in New York City and the U.S. 15
Latino Data Project Report 55 October 2013
0%
10%
20%
30%
40%
1990 2000 2010 2011
Figure 6Poverty Rates in New York City by Race/Ethnicity,
1990 - 2011
Non-Hispanic White Non-Hispanic Black Asian Latino
0%
10%
20%
30%
40%
2005 2006 2007 2008 2009 2010 2011
Figure 7Poverty Rates in New York City by Race/Ethnicity,
2005 - 2011
Non-Hispanic White Non-Hispanic Black Asian Latino
Poverty Rates Among Latinos in New York City and the U.S. 16
Latino Data Project Report 55 October 2013
Latinos in the Five New York City Boroughs
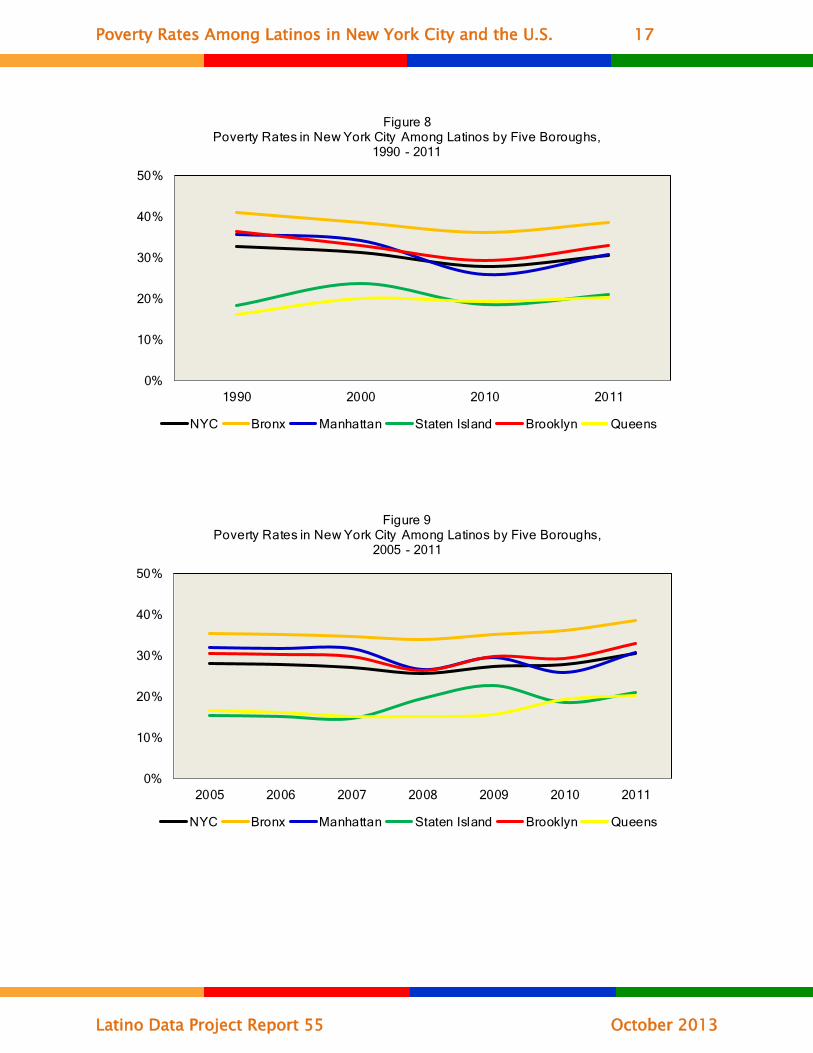
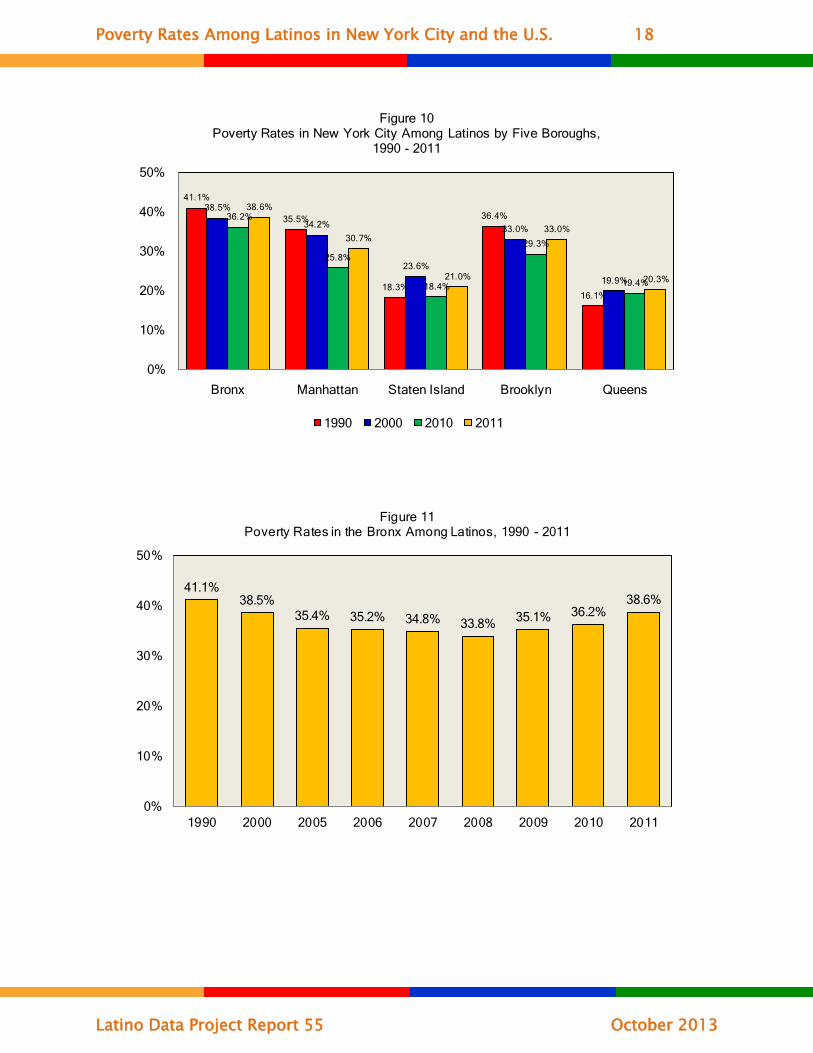
From 1990 to 2011, there were some differences in poverty rates between each of the five New York City boroughs among Latinos. (See figures 8 through 10).
Latinos in the Bronx had the highest poverty rates compared to Latinos residing in the other four boroughs. Although poverty rates increased after the onset of the recession in 2007, Latinos in the Bronx had lower poverty rates in 2011 than in 1990. (See figure 11).
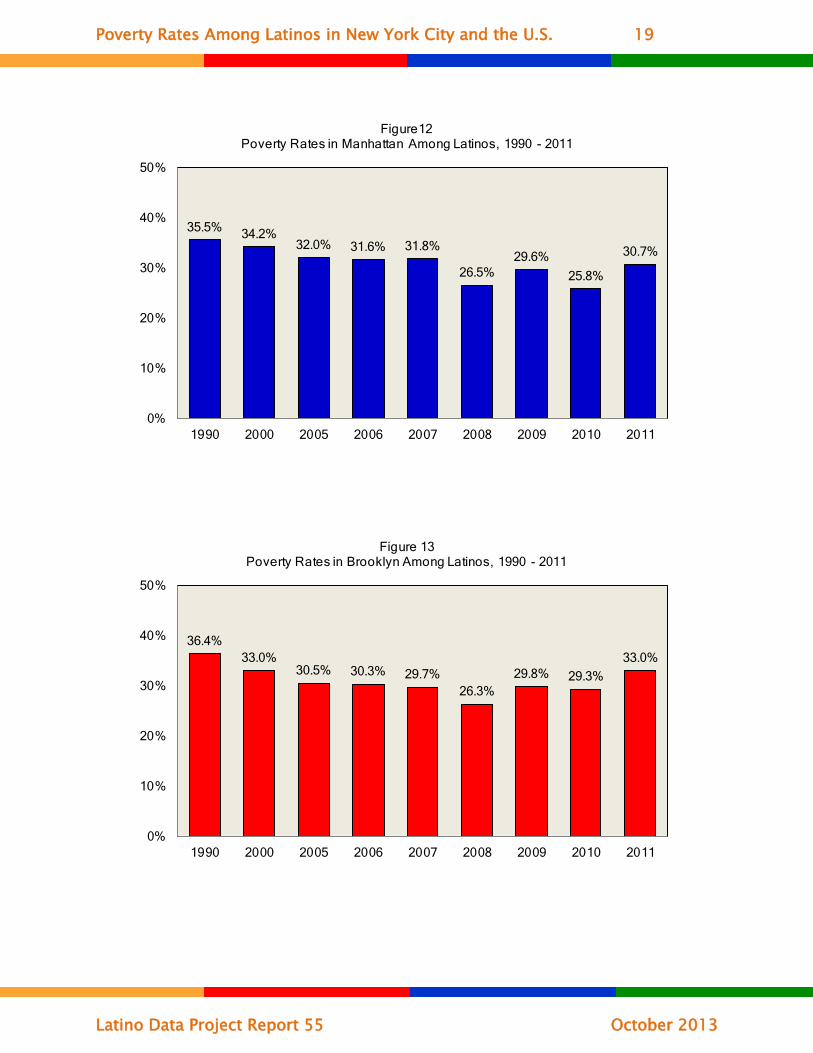
Latinos had relatively similar poverty rates from 1990 to 2011 in Manhattan and Brooklyn. Although poverty rates increased in response to the 2007 crisis among Latinos in the Manhattan and Brooklyn, the two groups had lower poverty rates in 2011 than in 1990. (See figures 12 and 13).
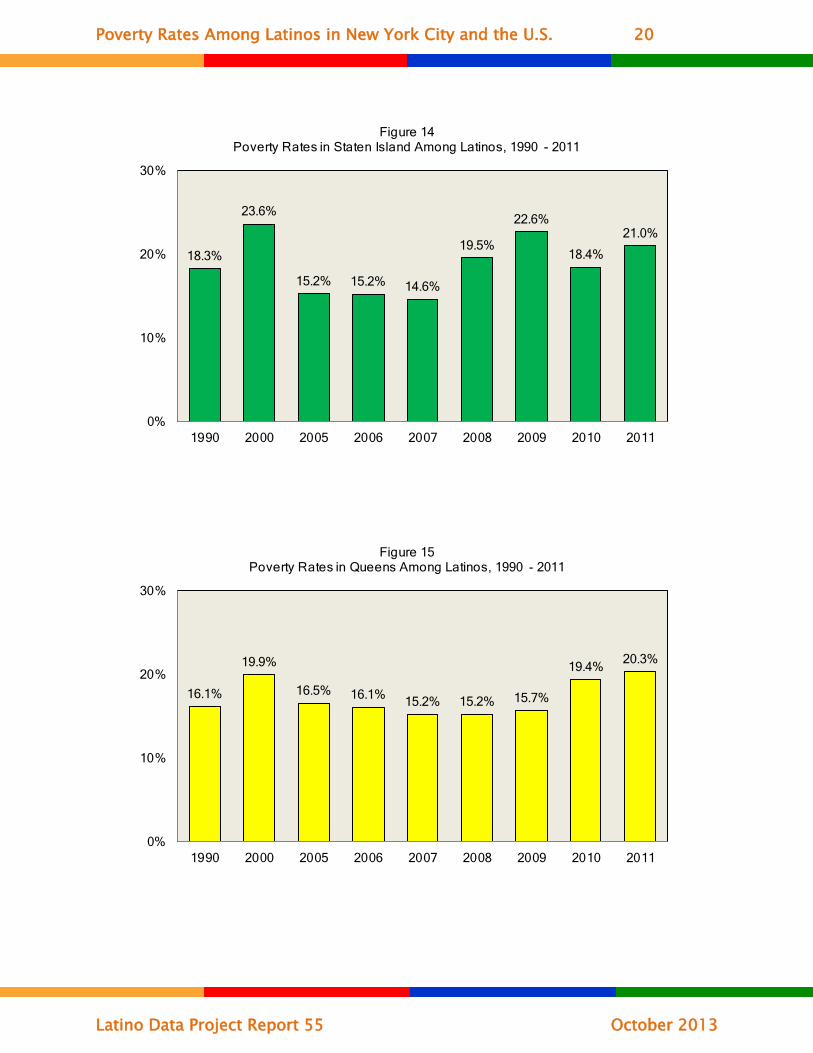
Poverty rates among Latinos in Staten Island and Queens fluctuated between 1990 and 2011. In 2011, poverty rates among Latinos in both boroughs were higher than in 1990 and nearly identical to rates in 2000. (See figures 14 and 15).
Poverty rates began to increase in 2008 within each of the five boroughs, consistent with national and City-wide trends. At the same time, the data indicate that across New York City’s boroughs, Latinos have not experienced a substantial recovery from the economic crisis.
The Five New York City Boroughs by Race/Ethnicity
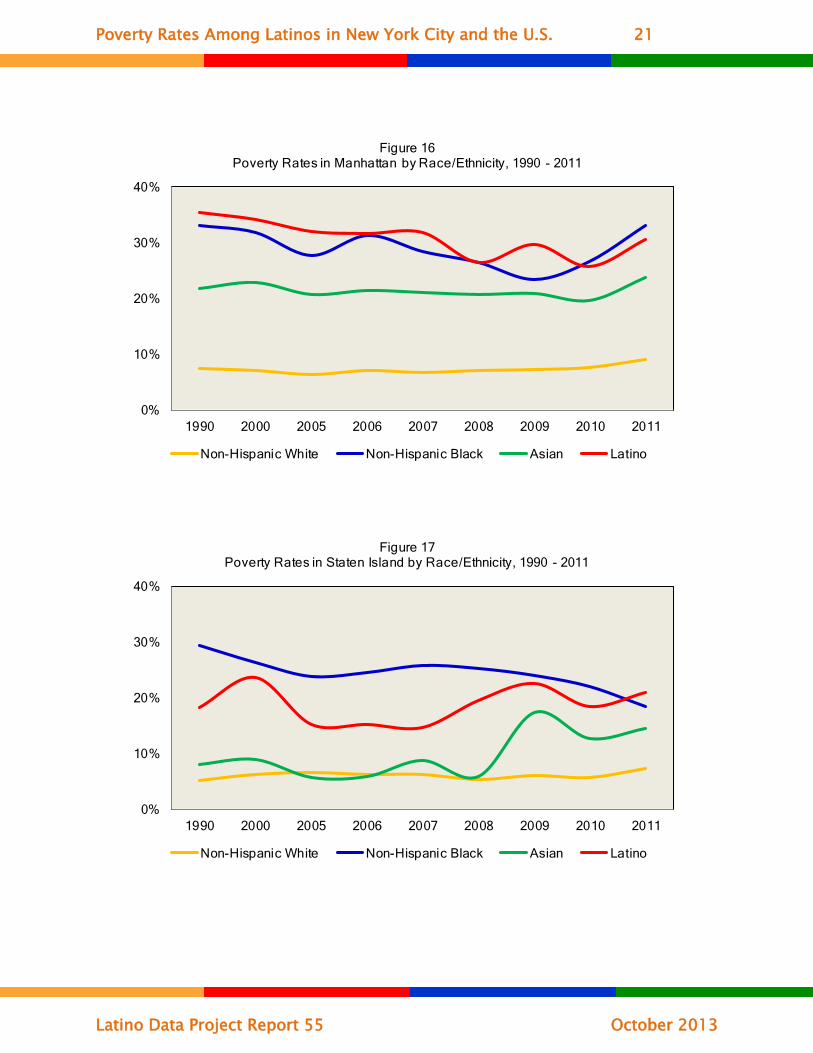
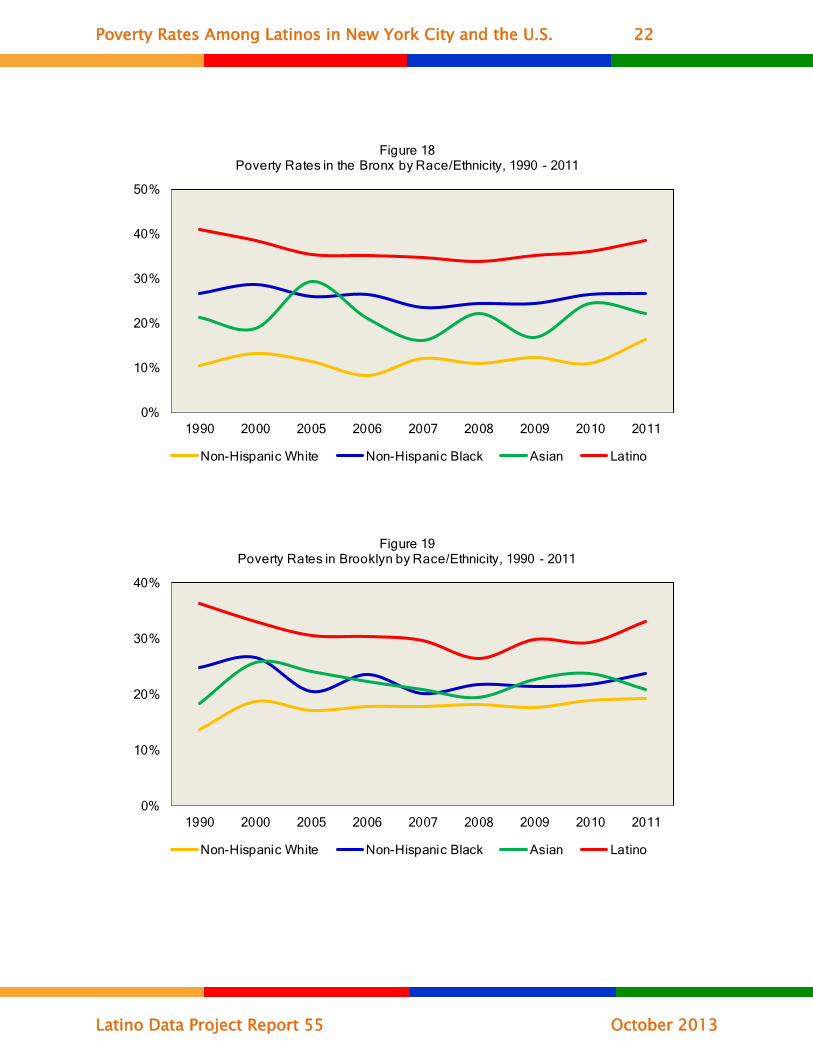
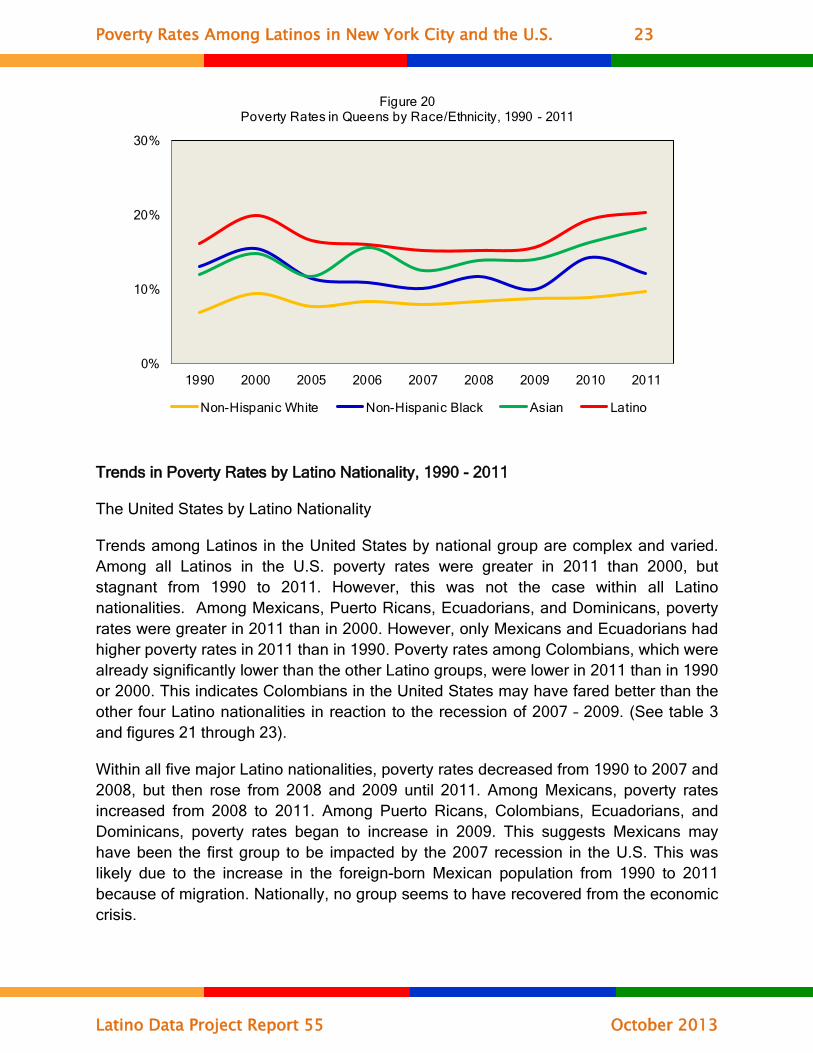
In Manhattan, Latinos had the highest poverty rates of all race/ethnic groups from 1990 to 2009. Yet, in both 2010 and 2011 the Latino poverty rate dropped below that of non-Hispanic blacks. (See figure 16). In Staten Island, Latinos had the second highest poverty rate from 1990 until 2010; however, in 2011 Latinos’ poverty rate increased, and they had the highest poverty rate of all groups. (See figure 17). Within the Bronx, Brooklyn, and Queens, Latinos had the highest poverty rates of all major race/ethnic groups from 1990 from 2011. (See figures 18 through 20). While within each of the five boroughs there were some small differences from the City-wide trends between 1990 and 2011, Latinos still tended to have higher poverty rates than other groups.
Poverty Rates Among Latinos in New York City and the U.S. 17
Latino Data Project Report 55 October 2013
0%
10%
20%
30%
40%
50%
1990 2000 2010 2011
Figure 8Poverty Rates in New York City Among Latinos by Five Boroughs,
1990 - 2011
NYC Bronx Manhattan Staten Island Brooklyn Queens
0%
10%
20%
30%
40%
50%
2005 2006 2007 2008 2009 2010 2011
Figure 9Poverty Rates in New York City Among Latinos by Five Boroughs,
2005 - 2011
NYC Bronx Manhattan Staten Island Brooklyn Queens
Poverty Rates Among Latinos in New York City and the U.S. 18
Latino Data Project Report 55 October 2013
41.1%38.5%
35.4% 35.2% 34.8% 33.8% 35.1% 36.2%38.6%
0%
10%
20%
30%
40%
50%
1990 2000 2005 2006 2007 2008 2009 2010 2011
Figure 11Poverty Rates in the Bronx Among Latinos, 1990 - 2011
41.1%
35.5%
18.3%
36.4%
16.1%
38.5%
34.2%
23.6%
33.0%
19.9%
36.2%
25.8%
18.4%
29.3%
19.4%
38.6%
30.7%
21.0%
33.0%
20.3%
0%
10%
20%
30%
40%
50%
Bronx Manhattan Staten Island Brooklyn Queens
Figure 10Poverty Rates in New York City Among Latinos by Five Boroughs,
1990 - 2011
1990 2000 2010 2011
Poverty Rates Among Latinos in New York City and the U.S. 19
Latino Data Project Report 55 October 2013
35.5% 34.2%32.0% 31.6% 31.8%
26.5%29.6%
25.8%
30.7%
0%
10%
20%
30%
40%
50%
1990 2000 2005 2006 2007 2008 2009 2010 2011
Figure12Poverty Rates in Manhattan Among Latinos, 1990 - 2011
36.4%33.0%
30.5% 30.3% 29.7%26.3%
29.8% 29.3%33.0%
0%
10%
20%
30%
40%
50%
1990 2000 2005 2006 2007 2008 2009 2010 2011
Figure 13Poverty Rates in Brooklyn Among Latinos, 1990 - 2011
Poverty Rates Among Latinos in New York City and the U.S. 20
Latino Data Project Report 55 October 2013
18.3%
23.6%
15.2% 15.2% 14.6%
19.5%
22.6%
18.4%
21.0%
0%
10%
20%
30%
1990 2000 2005 2006 2007 2008 2009 2010 2011
Figure 14Poverty Rates in Staten Island Among Latinos, 1990 - 2011
16.1%
19.9%
16.5% 16.1% 15.2% 15.2% 15.7%
19.4% 20.3%
0%
10%
20%
30%
1990 2000 2005 2006 2007 2008 2009 2010 2011
Figure 15Poverty Rates in Queens Among Latinos, 1990 - 2011
Poverty Rates Among Latinos in New York City and the U.S. 21
Latino Data Project Report 55 October 2013
0%
10%
20%
30%
40%
1990 2000 2005 2006 2007 2008 2009 2010 2011
Figure 16Poverty Rates in Manhattan by Race/Ethnicity, 1990 - 2011
Non-Hispanic White Non-Hispanic Black Asian Latino
0%
10%
20%
30%
40%
1990 2000 2005 2006 2007 2008 2009 2010 2011
Figure 17Poverty Rates in Staten Island by Race/Ethnicity, 1990 - 2011
Non-Hispanic White Non-Hispanic Black Asian Latino
Poverty Rates Among Latinos in New York City and the U.S. 22
Latino Data Project Report 55 October 2013
0%
10%
20%
30%
40%
50%
1990 2000 2005 2006 2007 2008 2009 2010 2011
Figure 18Poverty Rates in the Bronx by Race/Ethnicity, 1990 - 2011
Non-Hispanic White Non-Hispanic Black Asian Latino
0%
10%
20%
30%
40%
1990 2000 2005 2006 2007 2008 2009 2010 2011
Figure 19Poverty Rates in Brooklyn by Race/Ethnicity, 1990 - 2011
Non-Hispanic White Non-Hispanic Black Asian Latino
Poverty Rates Among Latinos in New York City and the U.S. 23
Latino Data Project Report 55 October 2013
0%
10%
20%
30%
1990 2000 2005 2006 2007 2008 2009 2010 2011
Figure 20Poverty Rates in Queens by Race/Ethnicity, 1990 - 2011
Non-Hispanic White Non-Hispanic Black Asian Latino
Trends in Poverty Rates by Latino Nationality, 1990 - 2011
The United States by Latino Nationality
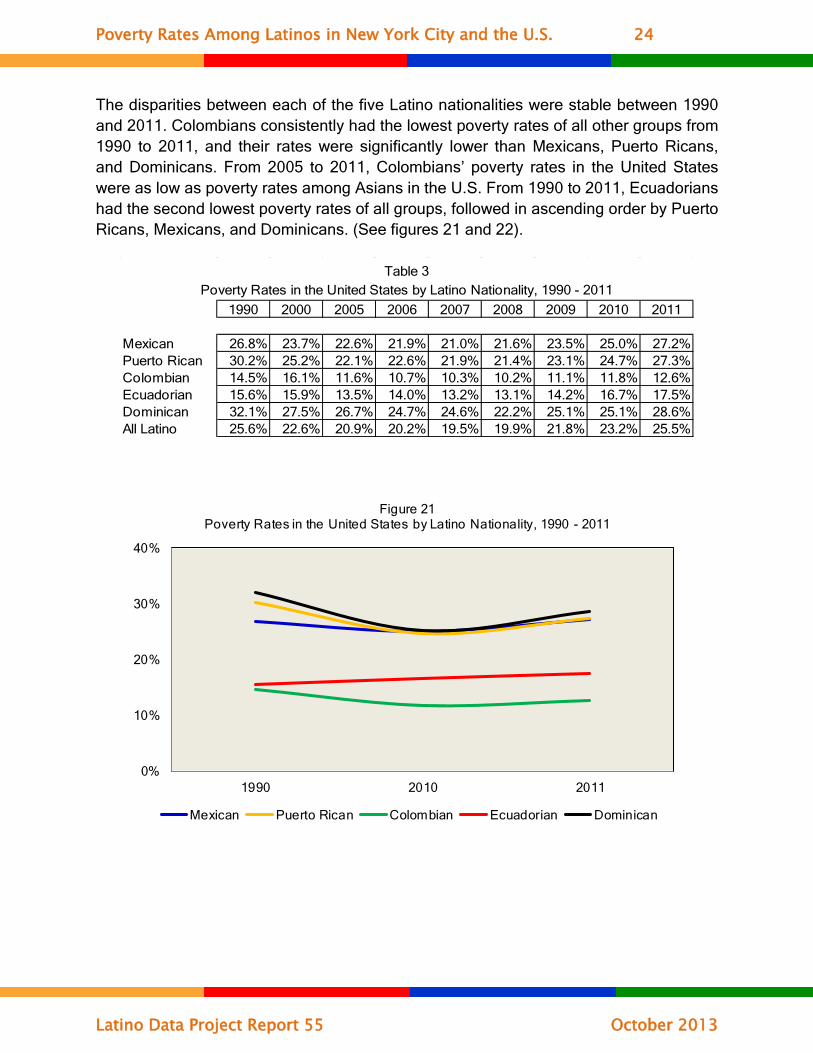
Trends among Latinos in the United States by national group are complex and varied. Among all Latinos in the U.S. poverty rates were greater in 2011 than 2000, but stagnant from 1990 to 2011. However, this was not the case within all Latino nationalities. Among Mexicans, Puerto Ricans, Ecuadorians, and Dominicans, poverty rates were greater in 2011 than in 2000. However, only Mexicans and Ecuadorians had higher poverty rates in 2011 than in 1990. Poverty rates among Colombians, which were already significantly lower than the other Latino groups, were lower in 2011 than in 1990 or 2000. This indicates Colombians in the United States may have fared better than the other four Latino nationalities in reaction to the recession of 2007 – 2009. (See table 3 and figures 21 through 23).
Within all five major Latino nationalities, poverty rates decreased from 1990 to 2007 and 2008, but then rose from 2008 and 2009 until 2011. Among Mexicans, poverty rates increased from 2008 to 2011. Among Puerto Ricans, Colombians, Ecuadorians, and Dominicans, poverty rates began to increase in 2009. This suggests Mexicans may have been the first group to be impacted by the 2007 recession in the U.S. This was likely due to the increase in the foreign-born Mexican population from 1990 to 2011 because of migration. Nationally, no group seems to have recovered from the economic crisis.
Poverty Rates Among Latinos in New York City and the U.S. 24
Latino Data Project Report 55 October 2013
0%
10%
20%
30%
40%
1990 2010 2011
Figure 21Poverty Rates in the United States by Latino Nationality, 1990 - 2011
Mexican Puerto Rican Colombian Ecuadorian Dominican
1990 2000 2005 2006 2007 2008 2009 2010 2011
Mexican 26.8% 23.7% 22.6% 21.9% 21.0% 21.6% 23.5% 25.0% 27.2%Puerto Rican 30.2% 25.2% 22.1% 22.6% 21.9% 21.4% 23.1% 24.7% 27.3%Colombian 14.5% 16.1% 11.6% 10.7% 10.3% 10.2% 11.1% 11.8% 12.6%Ecuadorian 15.6% 15.9% 13.5% 14.0% 13.2% 13.1% 14.2% 16.7% 17.5%Dominican 32.1% 27.5% 26.7% 24.7% 24.6% 22.2% 25.1% 25.1% 28.6%All Latino 25.6% 22.6% 20.9% 20.2% 19.5% 19.9% 21.8% 23.2% 25.5%
Poverty Rates in the United States by Latino Nationality, 1990 - 2011Table 3
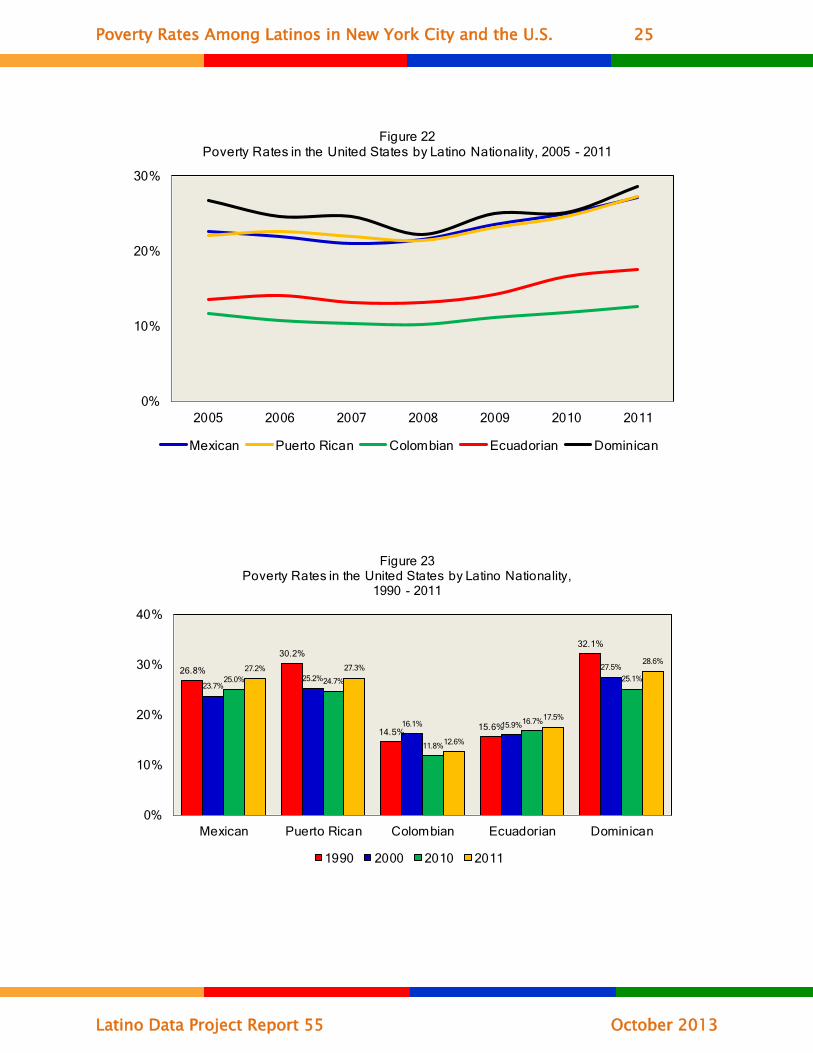
The disparities between each of the five Latino nationalities were stable between 1990 and 2011. Colombians consistently had the lowest poverty rates of all other groups from 1990 to 2011, and their rates were significantly lower than Mexicans, Puerto Ricans, and Dominicans. From 2005 to 2011, Colombians’ poverty rates in the United States were as low as poverty rates among Asians in the U.S. From 1990 to 2011, Ecuadorians had the second lowest poverty rates of all groups, followed in ascending order by Puerto Ricans, Mexicans, and Dominicans. (See figures 21 and 22).
Poverty Rates Among Latinos in New York City and the U.S. 25
Latino Data Project Report 55 October 2013
0%
10%
20%
30%
2005 2006 2007 2008 2009 2010 2011
Figure 22Poverty Rates in the United States by Latino Nationality, 2005 - 2011
Mexican Puerto Rican Colombian Ecuadorian Dominican
26.8%
30.2%
14.5% 15.6%
32.1%
23.7%25.2%
16.1% 15.9%
27.5%
25.0% 24.7%
11.8%
16.7%
25.1%27.2% 27.3%
12.6%
17.5%
28.6%
0%
10%
20%
30%
40%
Mexican Puerto Rican Colombian Ecuadorian Dominican
Figure 23Poverty Rates in the United States by Latino Nationality,
1990 - 2011
1990 2000 2010 2011
Poverty Rates Among Latinos in New York City and the U.S. 26
Latino Data Project Report 55 October 2013
New York City by Latino Nationality
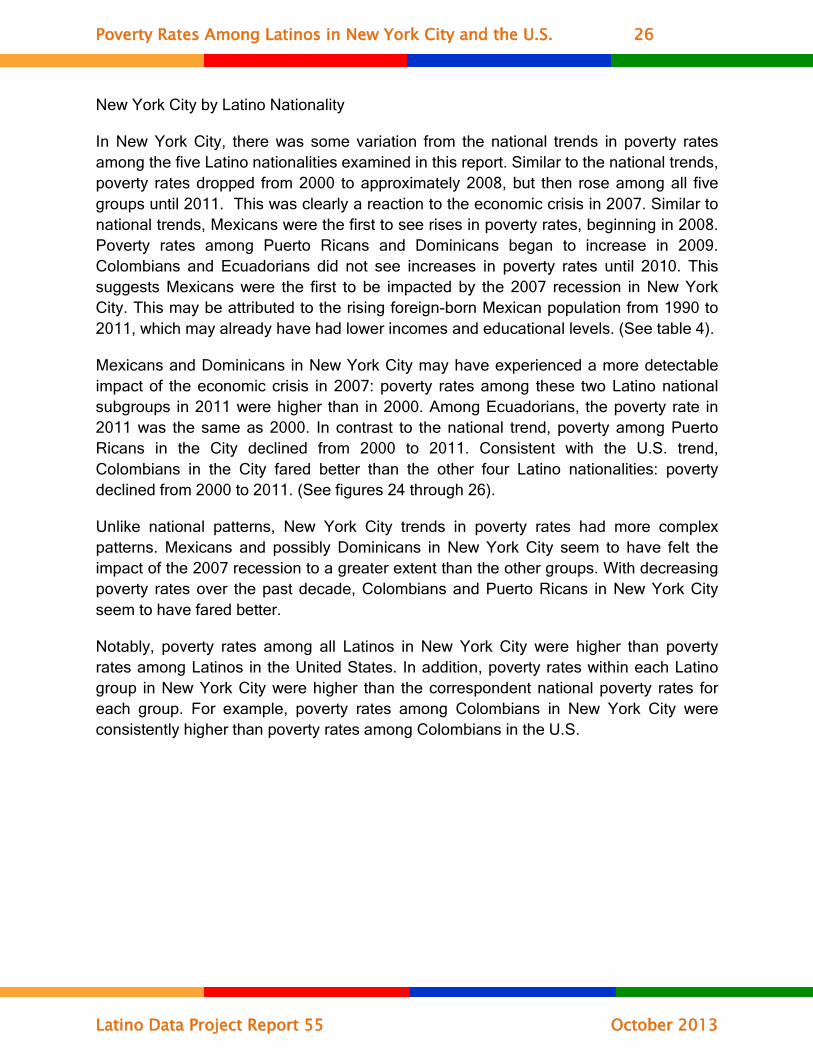
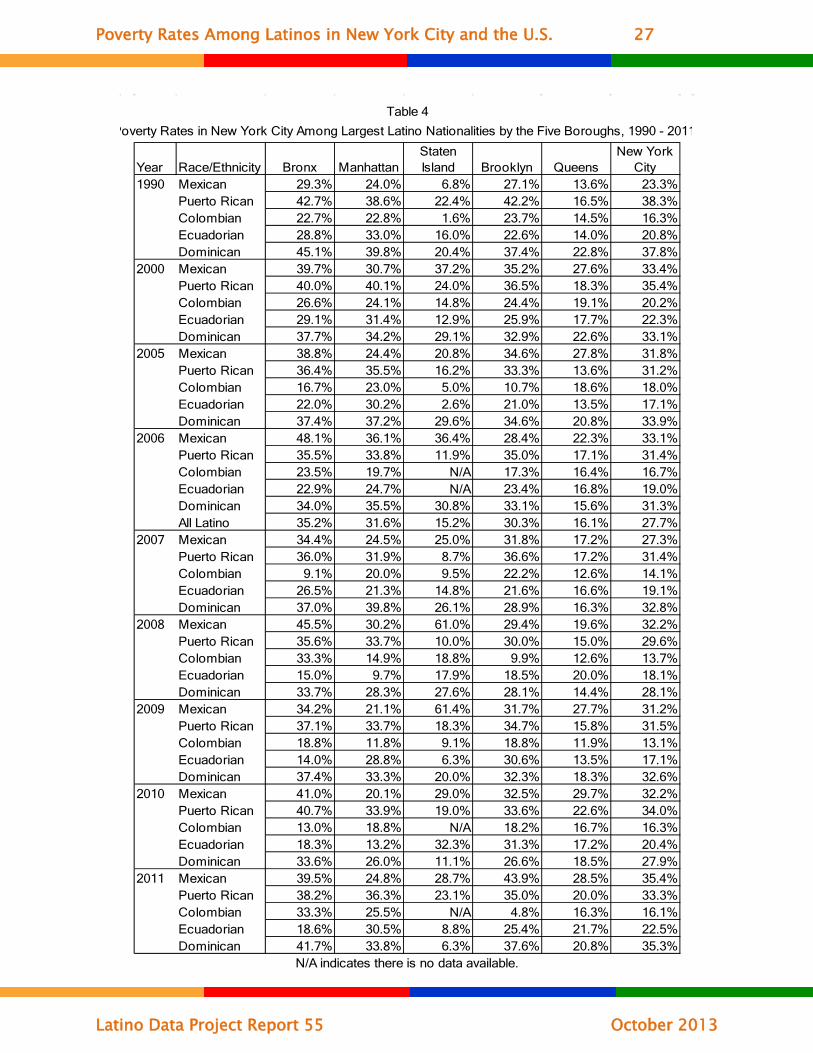
In New York City, there was some variation from the national trends in poverty rates among the five Latino nationalities examined in this report. Similar to the national trends, poverty rates dropped from 2000 to approximately 2008, but then rose among all five groups until 2011. This was clearly a reaction to the economic crisis in 2007. Similar to national trends, Mexicans were the first to see rises in poverty rates, beginning in 2008. Poverty rates among Puerto Ricans and Dominicans began to increase in 2009. Colombians and Ecuadorians did not see increases in poverty rates until 2010. This suggests Mexicans were the first to be impacted by the 2007 recession in New York City. This may be attributed to the rising foreign-born Mexican population from 1990 to 2011, which may already have had lower incomes and educational levels. (See table 4).
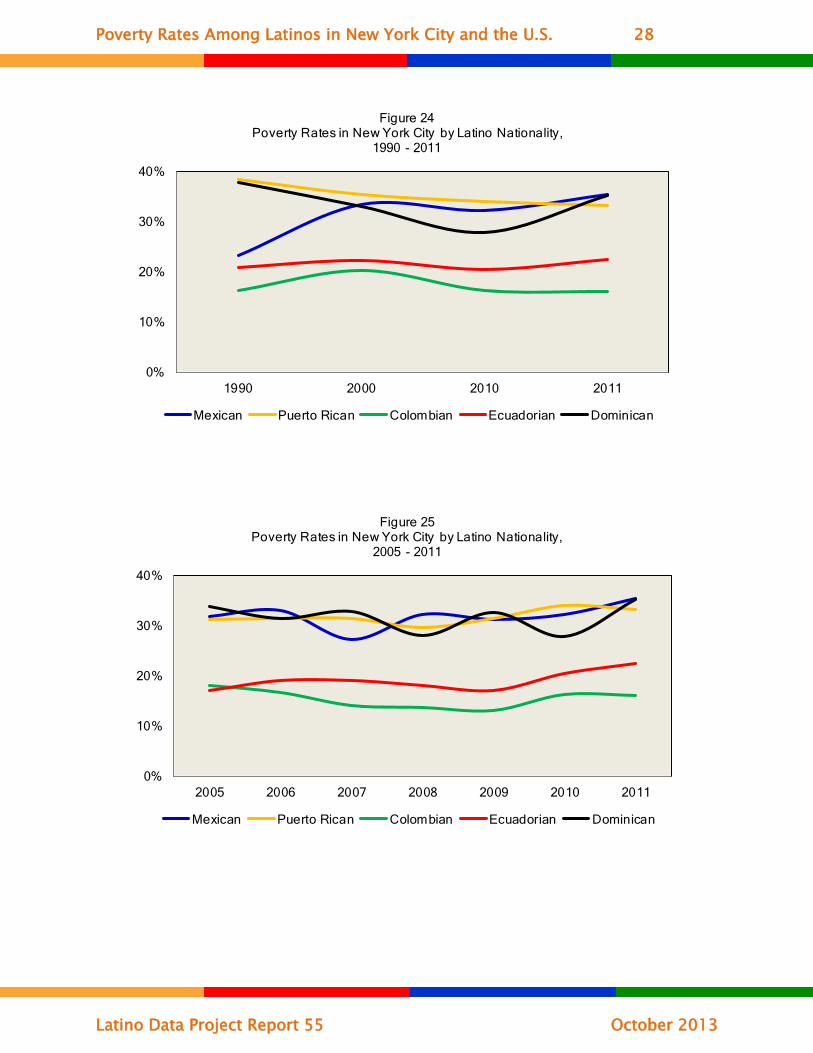
Mexicans and Dominicans in New York City may have experienced a more detectable impact of the economic crisis in 2007: poverty rates among these two Latino national subgroups in 2011 were higher than in 2000. Among Ecuadorians, the poverty rate in 2011 was the same as 2000. In contrast to the national trend, poverty among Puerto Ricans in the City declined from 2000 to 2011. Consistent with the U.S. trend, Colombians in the City fared better than the other four Latino nationalities: poverty declined from 2000 to 2011. (See figures 24 through 26).
Unlike national patterns, New York City trends in poverty rates had more complex patterns. Mexicans and possibly Dominicans in New York City seem to have felt the impact of the 2007 recession to a greater extent than the other groups. With decreasing poverty rates over the past decade, Colombians and Puerto Ricans in New York City seem to have fared better.
Notably, poverty rates among all Latinos in New York City were higher than poverty rates among Latinos in the United States. In addition, poverty rates within each Latino group in New York City were higher than the correspondent national poverty rates for each group. For example, poverty rates among Colombians in New York City were consistently higher than poverty rates among Colombians in the U.S.
Poverty Rates Among Latinos in New York City and the U.S. 27
Latino Data Project Report 55 October 2013
Year Race/Ethnicity Bronx ManhattanStaten Island Brooklyn Queens
New York City
1990 Mexican 29.3% 24.0% 6.8% 27.1% 13.6% 23.3%Puerto Rican 42.7% 38.6% 22.4% 42.2% 16.5% 38.3%Colombian 22.7% 22.8% 1.6% 23.7% 14.5% 16.3%Ecuadorian 28.8% 33.0% 16.0% 22.6% 14.0% 20.8%Dominican 45.1% 39.8% 20.4% 37.4% 22.8% 37.8%
2000 Mexican 39.7% 30.7% 37.2% 35.2% 27.6% 33.4%Puerto Rican 40.0% 40.1% 24.0% 36.5% 18.3% 35.4%Colombian 26.6% 24.1% 14.8% 24.4% 19.1% 20.2%Ecuadorian 29.1% 31.4% 12.9% 25.9% 17.7% 22.3%Dominican 37.7% 34.2% 29.1% 32.9% 22.6% 33.1%
2005 Mexican 38.8% 24.4% 20.8% 34.6% 27.8% 31.8%Puerto Rican 36.4% 35.5% 16.2% 33.3% 13.6% 31.2%Colombian 16.7% 23.0% 5.0% 10.7% 18.6% 18.0%Ecuadorian 22.0% 30.2% 2.6% 21.0% 13.5% 17.1%Dominican 37.4% 37.2% 29.6% 34.6% 20.8% 33.9%
2006 Mexican 48.1% 36.1% 36.4% 28.4% 22.3% 33.1%Puerto Rican 35.5% 33.8% 11.9% 35.0% 17.1% 31.4%Colombian 23.5% 19.7% N/A 17.3% 16.4% 16.7%Ecuadorian 22.9% 24.7% N/A 23.4% 16.8% 19.0%Dominican 34.0% 35.5% 30.8% 33.1% 15.6% 31.3%All Latino 35.2% 31.6% 15.2% 30.3% 16.1% 27.7%
2007 Mexican 34.4% 24.5% 25.0% 31.8% 17.2% 27.3%Puerto Rican 36.0% 31.9% 8.7% 36.6% 17.2% 31.4%Colombian 9.1% 20.0% 9.5% 22.2% 12.6% 14.1%Ecuadorian 26.5% 21.3% 14.8% 21.6% 16.6% 19.1%Dominican 37.0% 39.8% 26.1% 28.9% 16.3% 32.8%
2008 Mexican 45.5% 30.2% 61.0% 29.4% 19.6% 32.2%Puerto Rican 35.6% 33.7% 10.0% 30.0% 15.0% 29.6%Colombian 33.3% 14.9% 18.8% 9.9% 12.6% 13.7%Ecuadorian 15.0% 9.7% 17.9% 18.5% 20.0% 18.1%Dominican 33.7% 28.3% 27.6% 28.1% 14.4% 28.1%
2009 Mexican 34.2% 21.1% 61.4% 31.7% 27.7% 31.2%Puerto Rican 37.1% 33.7% 18.3% 34.7% 15.8% 31.5%Colombian 18.8% 11.8% 9.1% 18.8% 11.9% 13.1%Ecuadorian 14.0% 28.8% 6.3% 30.6% 13.5% 17.1%Dominican 37.4% 33.3% 20.0% 32.3% 18.3% 32.6%
2010 Mexican 41.0% 20.1% 29.0% 32.5% 29.7% 32.2%Puerto Rican 40.7% 33.9% 19.0% 33.6% 22.6% 34.0%Colombian 13.0% 18.8% N/A 18.2% 16.7% 16.3%Ecuadorian 18.3% 13.2% 32.3% 31.3% 17.2% 20.4%Dominican 33.6% 26.0% 11.1% 26.6% 18.5% 27.9%
2011 Mexican 39.5% 24.8% 28.7% 43.9% 28.5% 35.4%Puerto Rican 38.2% 36.3% 23.1% 35.0% 20.0% 33.3%Colombian 33.3% 25.5% N/A 4.8% 16.3% 16.1%Ecuadorian 18.6% 30.5% 8.8% 25.4% 21.7% 22.5%Dominican 41.7% 33.8% 6.3% 37.6% 20.8% 35.3%
Table 4
Poverty Rates in New York City Among Largest Latino Nationalities by the Five Boroughs, 1990 - 2011
N/A indicates there is no data available.
Poverty Rates Among Latinos in New York City and the U.S. 28
Latino Data Project Report 55 October 2013
0%
10%
20%
30%
40%
1990 2000 2010 2011
Figure 24Poverty Rates in New York City by Latino Nationality,
1990 - 2011
Mexican Puerto Rican Colombian Ecuadorian Dominican
0%
10%
20%
30%
40%
2005 2006 2007 2008 2009 2010 2011
Figure 25Poverty Rates in New York City by Latino Nationality,
2005 - 2011
Mexican Puerto Rican Colombian Ecuadorian Dominican
Poverty Rates Among Latinos in New York City and the U.S. 29
Latino Data Project Report 55 October 2013
23.3%
38.3%
16.3%
20.8%
37.8%
33.4%35.4%
20.2%22.3%
33.1%32.2%
34.0%
16.3%
20.4%
27.9%
35.4%33.3%
16.1%
22.5%
35.3%
0%
10%
20%
30%
40%
Mexican Puerto Rican Colombian Ecuadorian Dominican
Figure 26Poverty Rates in New York City by Latino Nationality,
1990 - 2011
1990 2000 2010 2011
The Five New York City Boroughs by Latino Nationality
Among Latinos in New York City, there was much variation in poverty rates within each borough and across the five Latino nationalities examined in this report from 1990 to 2011.3
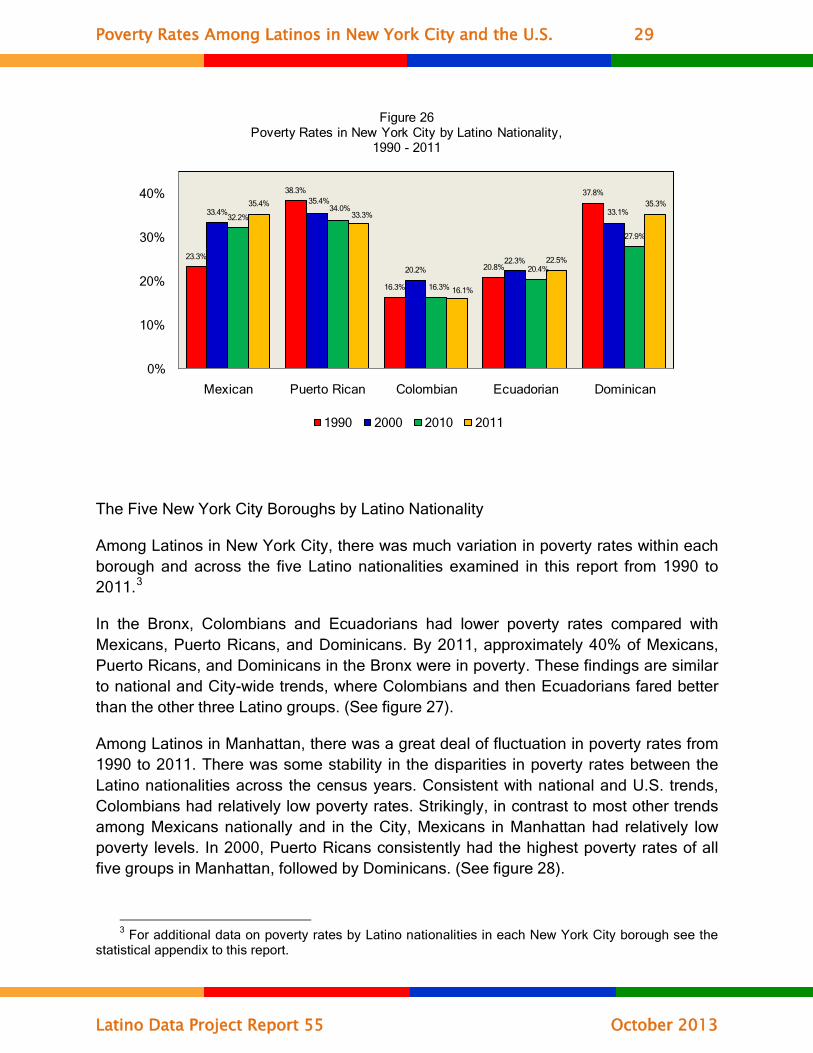
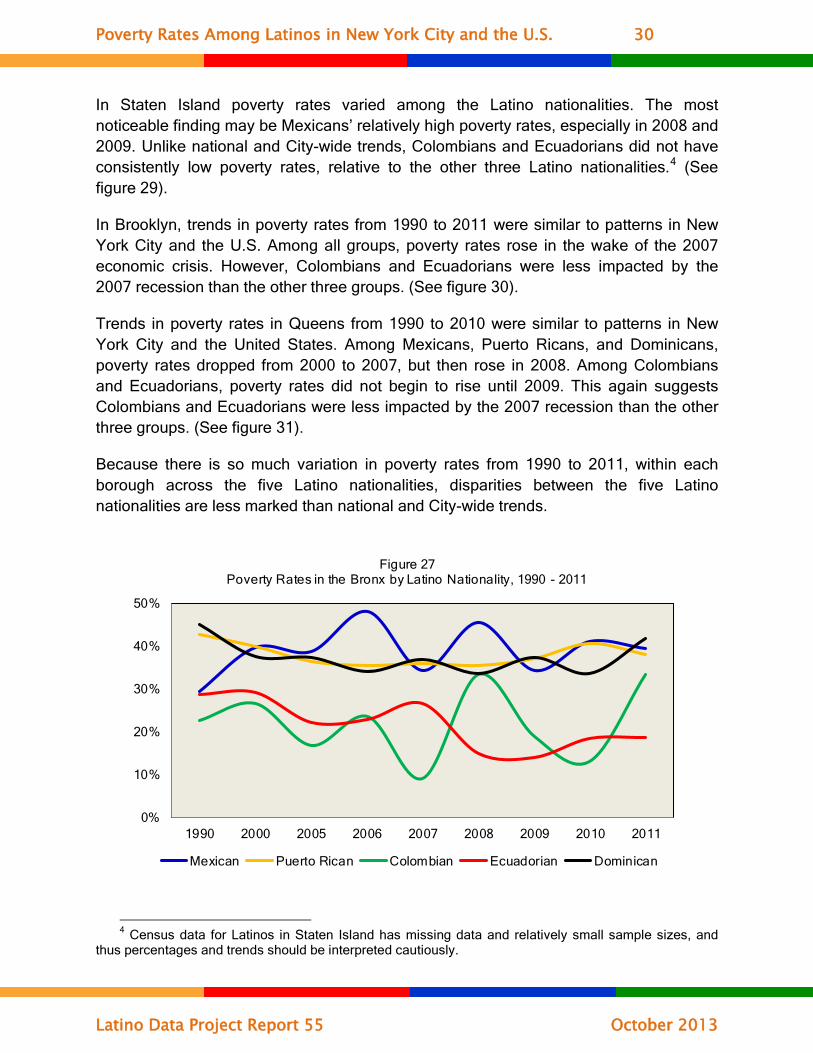
In the Bronx, Colombians and Ecuadorians had lower poverty rates compared with Mexicans, Puerto Ricans, and Dominicans. By 2011, approximately 40% of Mexicans, Puerto Ricans, and Dominicans in the Bronx were in poverty. These findings are similar to national and City-wide trends, where Colombians and then Ecuadorians fared better than the other three Latino groups. (See figure 27).
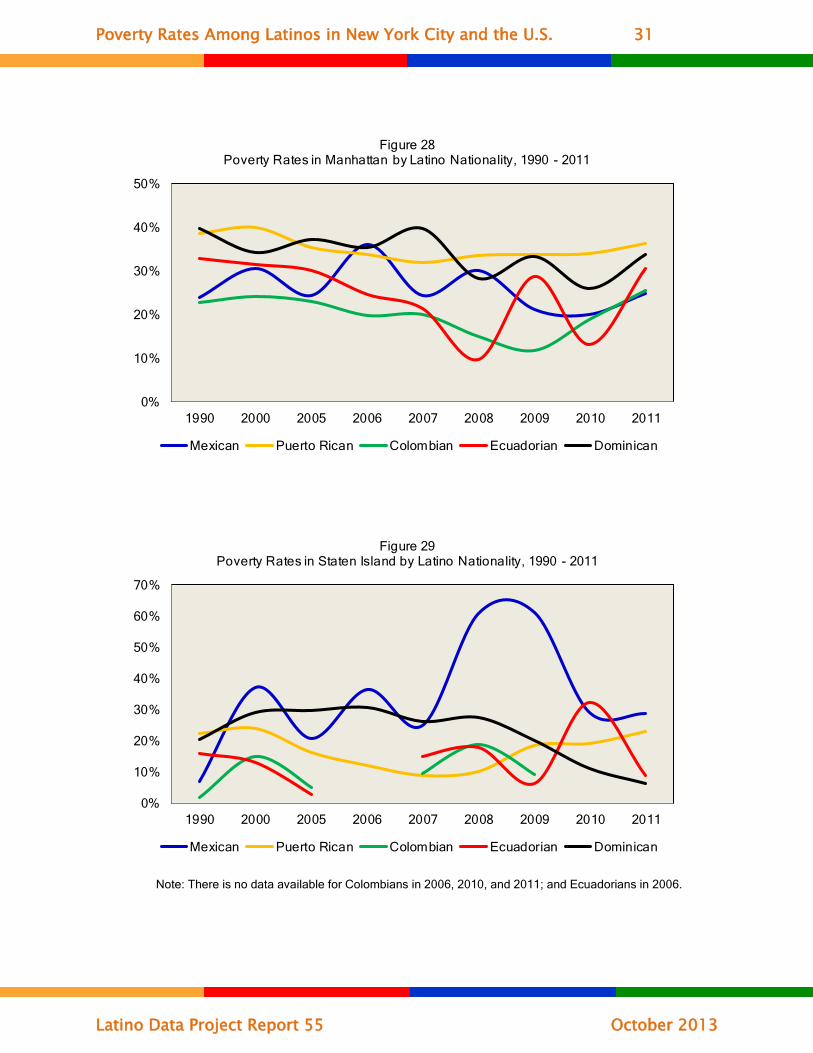
Among Latinos in Manhattan, there was a great deal of fluctuation in poverty rates from 1990 to 2011. There was some stability in the disparities in poverty rates between the Latino nationalities across the census years. Consistent with national and U.S. trends, Colombians had relatively low poverty rates. Strikingly, in contrast to most other trends among Mexicans nationally and in the City, Mexicans in Manhattan had relatively low poverty levels. In 2000, Puerto Ricans consistently had the highest poverty rates of all five groups in Manhattan, followed by Dominicans. (See figure 28).
3 For additional data on poverty rates by Latino nationalities in each New York City borough see the
statistical appendix to this report.
Poverty Rates Among Latinos in New York City and the U.S. 30
Latino Data Project Report 55 October 2013
0%
10%
20%
30%
40%
50%
1990 2000 2005 2006 2007 2008 2009 2010 2011
Figure 27Poverty Rates in the Bronx by Latino Nationality, 1990 - 2011
Mexican Puerto Rican Colombian Ecuadorian Dominican
In Staten Island poverty rates varied among the Latino nationalities. The most noticeable finding may be Mexicans’ relatively high poverty rates, especially in 2008 and 2009. Unlike national and City-wide trends, Colombians and Ecuadorians did not have consistently low poverty rates, relative to the other three Latino nationalities.4 (See figure 29).
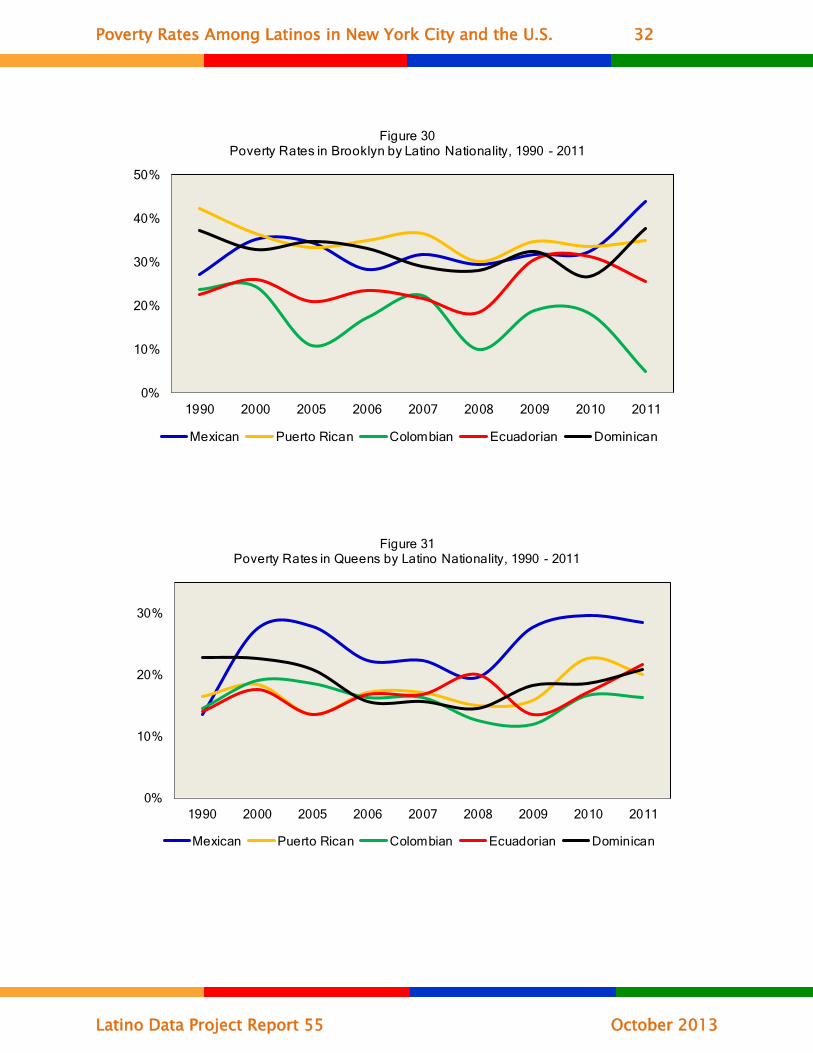
In Brooklyn, trends in poverty rates from 1990 to 2011 were similar to patterns in New York City and the U.S. Among all groups, poverty rates rose in the wake of the 2007 economic crisis. However, Colombians and Ecuadorians were less impacted by the 2007 recession than the other three groups. (See figure 30).
Trends in poverty rates in Queens from 1990 to 2010 were similar to patterns in New York City and the United States. Among Mexicans, Puerto Ricans, and Dominicans, poverty rates dropped from 2000 to 2007, but then rose in 2008. Among Colombians and Ecuadorians, poverty rates did not begin to rise until 2009. This again suggests Colombians and Ecuadorians were less impacted by the 2007 recession than the other three groups. (See figure 31).
Because there is so much variation in poverty rates from 1990 to 2011, within each borough across the five Latino nationalities, disparities between the five Latino nationalities are less marked than national and City-wide trends.
4 Census data for Latinos in Staten Island has missing data and relatively small sample sizes, and
thus percentages and trends should be interpreted cautiously.
Poverty Rates Among Latinos in New York City and the U.S. 31
Latino Data Project Report 55 October 2013
0%
10%
20%
30%
40%
50%
1990 2000 2005 2006 2007 2008 2009 2010 2011
Figure 28Poverty Rates in Manhattan by Latino Nationality, 1990 - 2011
Mexican Puerto Rican Colombian Ecuadorian Dominican
0%
10%
20%
30%
40%
50%
60%
70%
1990 2000 2005 2006 2007 2008 2009 2010 2011
Figure 29Poverty Rates in Staten Island by Latino Nationality, 1990 - 2011
Mexican Puerto Rican Colombian Ecuadorian Dominican
Note: There is no data available for Colombians in 2006, 2010, and 2011; and Ecuadorians in 2006.
Poverty Rates Among Latinos in New York City and the U.S. 32
Latino Data Project Report 55 October 2013
0%
10%
20%
30%
40%
50%
1990 2000 2005 2006 2007 2008 2009 2010 2011
Figure 30Poverty Rates in Brooklyn by Latino Nationality, 1990 - 2011
Mexican Puerto Rican Colombian Ecuadorian Dominican
0%
10%
20%
30%
1990 2000 2005 2006 2007 2008 2009 2010 2011
Figure 31Poverty Rates in Queens by Latino Nationality, 1990 - 2011
Mexican Puerto Rican Colombian Ecuadorian Dominican
Poverty Rates Among Latinos in New York City and the U.S. 33
Latino Data Project Report 55 October 2013
Conclusion
The poverty rate data provided by the U.S. Census Bureau indicate nuanced and complex patterns in New York City and the United States. Poverty rates were stagnant and increased slightly from 1990 to 2011 and have not recovered from the 2007 - 2009 economic crisis.
While poverty increased among Latinos in the United States from 2000 to 2010, Latinos in New York City saw a decline in poverty rates by 2011, relative to poverty rates in both 1990 and 2000. In the U.S. and New York City, the poverty rate among all Latinos did not recover from the 2007 - 2009 economic crisis. However, there were some instances of slight recovery within two Latino nationalities: Puerto Ricans and Colombians in New York City saw declining or stagnant poverty rates by 2011.
One striking finding is the disparity between Latino national subgroups. Mexicans, and to a lesser degree Dominicans, in New York City and the U.S. fared worse over the long-term and after the economic crisis that began in 2007. Colombians had consistently lower poverty rates than the other groups over the long-term, and fared better in terms of recovery from the economic crisis. These findings may be attributed to migration patterns. The influx of lesser skilled and educated foreign-born Mexicans may have contributed to their higher poverty rates because of the economic downturn. Pre-existing differences in levels of education and income may also have determined which groups fared better through the crisis.
While the national population experienced an increase in poverty rates following the 2007 - 2009 economic crisis, race and ethnicity were important determinants of the impact of the crisis on poverty rates. Latinos may have been more affected nationally by the 2007 economic downturn; they saw increases in poverty after the onset of the crisis sooner and to a greater degree than other race/ethnic groups. Yet, in the U.S. and New York City, all race/ethnic groups were detectably impacted by the economic crisis and none have recovered to their pre-recession poverty rates.
Poverty Rates Among Latinos in New York City and the U.S. 34
Latino Data Project Report 55 October 2013
Mexican Puerto Rican Colombian Ecuadorian Dominican Latino
1990 29.3% 42.7% 22.7% 28.8% 45.1% 41.1%2000 39.7% 40.0% 26.6% 29.1% 37.7% 38.5%2005 38.8% 36.4% 16.7% 22.0% 37.4% 35.4%2006 48.1% 35.5% 23.5% 22.9% 34.0% 35.2%2007 34.4% 36.0% 9.1% 26.5% 37.0% 34.8%2008 45.5% 35.6% 33.3% 15.0% 33.7% 33.8%2009 34.2% 37.1% 18.8% 14.0% 37.4% 35.1%2010 41.0% 40.7% 13.0% 18.3% 33.6% 36.2%2011 39.5% 38.2% 33.3% 18.6% 41.7% 38.6%
Poverty Rates in the Bronx Among Largest Latino Nationalities, 1990 - 2011
Table 5
Mexican Puerto Rican Colombian Ecuadorian Dominican Latino
1990 24.0% 38.6% 22.8% 33.0% 39.8% 35.5%2000 30.7% 40.1% 24.1% 31.4% 34.2% 34.2%2005 24.4% 35.5% 23.0% 30.2% 37.2% 32.0%2006 36.1% 33.8% 19.7% 24.7% 35.5% 31.6%2007 24.5% 31.9% 20.0% 21.3% 39.8% 31.8%2008 30.2% 33.7% 14.9% 9.7% 28.3% 26.5%2009 21.1% 33.7% 11.8% 28.8% 33.3% 29.6%2010 20.1% 33.9% 18.8% 13.2% 26.0% 25.8%2011 24.8% 36.3% 25.5% 30.5% 33.8% 30.7%
Table 6
Poverty Rates in Manhattan Among Largest Latino Nationalities, 1990 - 2011
Mexican Puerto Rican Colombian Ecuadorian Dominican Latino
1990 6.8% 22.4% 1.6% 16.0% 20.4% 18.3%2000 37.2% 24.0% 14.8% 12.9% 29.1% 23.6%2005 20.8% 16.2% 5.0% 2.6% 29.6% 15.2%2006 36.4% 11.9% N/A N/A 30.8% 15.2%2007 25.0% 8.7% 9.5% 14.8% 26.1% 14.6%2008 61.0% 10.0% 18.8% 17.9% 27.6% 19.5%2009 61.4% 18.3% 9.1% 6.3% 20.0% 22.6%2010 29.0% 19.0% N/A 32.3% 11.1% 18.4%2011 28.7% 23.1% N/A 8.8% 6.3% 21.0%
N/A indicates there is no data available.
Table 7
Poverty Rates in Staten Island Among Largest Latino Nationalities, 1990 - 2011
Statistical Appendix
Poverty Rates Among Latinos in New York City and the U.S. 35
Latino Data Project Report 55 October 2013
Mexican Puerto Rican Colombian Ecuadorian Dominican Latino
1990 27.1% 42.2% 23.7% 22.6% 37.4% 36.4%2000 35.2% 36.5% 24.4% 25.9% 32.9% 33.0%2005 34.6% 33.3% 10.7% 21.0% 34.6% 30.5%2006 28.4% 35.0% 17.3% 23.4% 33.1% 30.3%2007 31.8% 36.6% 22.2% 21.6% 28.9% 29.7%2008 29.4% 30.0% 9.9% 18.5% 28.1% 26.3%2009 31.7% 34.7% 18.8% 30.6% 32.3% 29.8%2010 32.5% 33.6% 18.2% 31.3% 26.6% 29.3%2011 43.9% 35.0% 4.8% 25.4% 37.6% 33.0%
Table 8
Poverty Rates in Brooklyn Among Largest Latino Nationalities, 1990 - 2011
Mexican Puerto Rican Colombian Ecuadorian Dominican Latino
1990 13.6% 16.5% 14.5% 14.0% 22.8% 16.1%2000 27.6% 18.3% 19.1% 17.7% 22.6% 19.9%2005 27.8% 13.6% 18.6% 13.5% 20.8% 16.5%2006 22.3% 17.1% 16.4% 16.8% 15.6% 16.1%2007 17.2% 17.2% 12.6% 16.6% 16.3% 15.2%2008 19.6% 15.0% 12.6% 20.0% 14.4% 15.2%2009 27.7% 15.8% 11.9% 13.5% 18.3% 15.7%2010 29.7% 22.6% 16.7% 17.2% 18.5% 19.4%2011 28.5% 20.0% 16.3% 21.7% 20.8% 20.3%
Table 9
Poverty Rates in Queens Among Largest Latino Nationalities, 1990 - 2011
Poverty Rates Among Latinos in New York City and the U.S. 36
Latino Data Project Report 55 October 2013
Methodological Appendix
The report issued by the U.S. Census Bureau, Carmen DeNavas-Walt, Bernadette D. Proctor, Jessica C. Smith, “Income, Poverty, and Health Insurance Coverage in the United States: 2012” (U.S. Department of Commerce, Economics and Statistics Administration, U.S. Census Bureau, September 2013), utilizes data from the Current Population Survey (CPS). This report uses data from the American Community Survey (ACS).
One major difference in the two data sets is the size of the sample. The CPS collects data over the course of a year from about 100,000 ‘addresses’ across the United States. The ACS collects data on about 3,000,000 ‘addresses’ in the same time frame.
The CPS is conducted by telephone and personal-visit interviews, asks a detailed series of questions on income, and is voluntary. The ACS is mandatory and includes responses obtained by mail, telephone, and personal-visit interviews. (See “Fact Sheet - Differences Between CPS ASEC and ACS” at:
http://www.census.gov/hhes/www/poverty/about/datasources/factsheet.html
Because of the larger sample size the ACS was used as the raw data for this report. This is especially important because the samples from New York City are significantly larger, and the ACS permits an analysis of the City’s major Latino nationalities which the CPS does not because of its small sample size.
The raw data from the ACS were analyzed using IBM SPSS Statistics (formerly SPSS, Statistical Package for the Social Sciences).
For the purposes of this report a larger time frame has been utilized so that trends may be established for both longer (1990 – 2011) and shorter (2005 – 2011) time periods. The former establishes long-term trends and the latter more clearly depicts the impact of the post-2007 recession.
This report ends in 2011 because the ACS data for 2012 were not released by IPUMS as of the writing of this report.
All poverty rates are calculated by the Census Bureau. Detailed information about the calculation of poverty reports can be found at http://www.census.gov/hhes/www/ poverty/about/datasources/factsheet.html and http://camerondcampbell.me/blog/ 2011/11/using-comparison-of-means-to-calculate-proportions-at-ipums-usa