colored titanium passive films
TRANSCRIPT
INFORMATION TO USERS
This manuscript has been reproduced from the microfilm master. UMI films the text directly from the original or copy submitted. Thus, some thesis and dissertation copies are in typewriter face, while others may be from any type of computer printer.
The quality of this reproduction is dependent upon the quality of the copy submitted. Broken or indistinct print, colored or poor quality illustrations and photographs, print bieedthrough, substandard margins, and improper alignment can adversely affect reproduction.
In the unlikely event that the author did not send UMI a complete manuscript and there are missing pages, these will be noted. Also, if unauthorized copyright material had to be removed, a note will indicate the deletion.
Oversize materials (e.g., maps, drawings, charts) are reproduced by sectioning the original, beginning at the upper left-hand comer and continuing from left to right in equal sections with small overlaps.
Photographs included in the original manuscript have been reproduced xerographically in this copy. Higher quality 6" x 9” black and white photographic prints are available for any photographs or illustrations appearing in this copy for an additional charge. Contact UMI directly to order.
ProQuest Information and Learning 300 North Zeeb Road, Ann Arbor, Ml 48106-1346 USA
800-521-0600
Reproduced with permission of the copyright owner. Further reproduction prohibited without permission.

Reproduced with permission of the copyright owner. Further reproduction prohibited without permission.

NOTE TO USERS
This reproduction is the best copy available.
UMI'
Reproduced with permission of the copyright owner. Further reproduction prohibited without permission.

Reproduced with permission of the copyright owner. Further reproduction prohibited without permission.
COLORED TITANIUM PASSIVE FILMS.
PREPARATION, CHARACTERIZATION, APPLICATIONS, AND SURFACE
MODIFICATION
by
Sabahudin Hrapovic
Thesis submitted to the Departement de chimie
in fulfillment of the requirements for the degree of master es sciences (M. Sc.)
FACULTE DES SCIENCES
UNIVERSITE DE SHERBROOKE
Sherbrooke, Quebec, Canada, July 2000
- ' C - '
Reproduced with permission of the copyright owner. Further reproduction prohibited without permission.
1*1 National Library of Canada
Acquisitions and Bibliographic Services385 WaHnglon Strast Ottawa ON K1A0N4 Canada
BUiotMque rationale du Canada
Acquisitions et sendees bibliographiques395. rua WaKngton Ottawa ON K1A0N4 Canada
Y o u rm V a m r m m v
The author has granted a nonexclusive hcence allowing the National Library of Canada to reproduce, loan, distribute or sell copies of this diesis in microform, paper or electronic formats.
The author retains ownership of the copyright in this thesis. Neither the thesis nor substantial extracts from it may be printed or otherwise reproduced without the author’s permission.
L’auteur a accorde une licence non exclusive permettant a la Biblioth&que nadonale du Canada de reproduire, preter, distribuer ou vendre des copies de cette these sous la forme de microfiche/film, de reproduction sur papier ou sur format electronique.
L’auteur conserve la propriete du droit d’auteur qui protege cette these. Ni la these ni des extraits substantiels de celle-ci ne doivent etre imprimes ou autrement reproduits sans son autorisation.
0-612-67288-3
CanadaReproduced with permission of the copyright owner. Further reproduction prohibited without permission.
Le !& $l/7D, le jury suivant a accepte ce memoire dans sa version finale.date
President-rapporteur: M. Jean LessardDepartement de chimie
Membre:
Membre:
Membre:
Membre:
M. Jean-Marc Chapuzet Departement de chimie
M. Gregory Jerkiewicz Departement chimie
M. Dennis Dong Huron Tech.
M. Zbigniew Twandowski Kvaemer Chemetics Ltd
Reproduced with permission of the copyright owner. Further reproduction prohibited without permission.
SOMMAIRE
L’application de la polarisation par courant altematif (CA) sur le titane dans le NH4BF4 aq. a
permis d’obtenir des couches passives colorees brillantes et uniformes. Ces types de films
revelent une gamme de couleurs plus etendue comparativement a ceux obtenus par la
technique de la passivation en phase gazeuse aux temperatures elevees. De plus, ces couches
peuvent etre formees en quelques secondes contrairement aux heures ou meme aux joumees
necessaires avec un traitement thermique en phase gazeuse sous atmosphere d’oxygene. Ces
films demontrent de nouvelles proprietes comme protectrices et decoratives.
L’influence des differents parametres experimentaux (ex.: le pH et la concentration de
l’electrolyte, le temps de polarisation et le type de voltage applique) sur la coloration,
runiformite et la brillance du film ainsi que sa morphologie a ete etudiee. La comparaison
avec la polarisation par courant constant (CC) etait egalement effectuee.
Les resultats experimentaux demontrent que les couches passives colorees adherent bien au
substrat de Ti et ne peuvent en etre arrachees. Les analyses au moyen du microscope optique
et du microscope a balayage electronique (MEB), confirment que la polarisation par un
courant altematif a forme des couches passives compactes ne revelant pas de fracture ou de
fissure contrairement aux couches formees thermiquement en phase gazeuse. L’adherence du
film passif depend du pre-traitement mecanique du Ti metallique avant sa formation. En
general, l’adherence est meilleure quand les films sont formes sur une surface rugueuse
obtenue par decapage. Dans le cas d’un film forme sur une surface de Ti polie
mecaniquement, 1’adherence est plus faible et le polissage ou le frottement provoque le
detachement du film.
La caracterisation par spectrometrie des photoelectrons (XPS) des couches passives colorees,
revele que la composition chimique de la surface depend du voltage lors de la polarisation CA.
ii
Reproduced with permission of the copyright owner. Further reproduction prohibited without permission.
Les principaux constituants de la couche passive sont TF, O2' et F (z varie de 4 a 2 selon la
profondeur du film). Le fluorure dans le film provient de la decomposition du NH4BF4
s’accumulant a 1’interface entre le metal et le film. L’etude de la variation de la composition
chimique en fonction de la profondeur nous montre que plus le voltage applique est eleve, plus
la couche passive est epaisse.
La combinaison de la coloration electrochimique du Ti avec la technique de masquage utilisee
dans l’industrie des semi-conducteurs a mene au developpement de la lithographie
electrochimique du titane. Cette technique pourrait etre utile dans l’industrie de la decoration
et aussi pour l’industrie des semi-conducteurs et des circuits imprimes.
Les proprietes electrochimiques des couches passives colorees du Ti sont determinees en
enregistrant des courbes de polarisation dans la region de - 0,8 a 3,2 V selon par rapport
d’electrode reversible a hydrogene (ERH) et aussi en realisant des courbes de Tafel dans la
region de la reaction de degagement d’hydrogene (RDH) dans une solution aqueuse d’H2S04
1.0 M. Les courbes de polarisation demontrent que le potentiel de corrosion des couches
passives colorees se deplace vers des potentiels moins negatifs, montrant que ces couches sont
plus stables que le titane dans les memes conditions. Les courbes de Tafel pour la RDH
demontrent que les couches passives ont une activite beaucoup plus elevee que le Ti pour cette
reaction. La relation de Tafel revele de nouvelles proprietes qui peuvent etre associees a
1’alteration / decomposition de la couche passive, a 1’absorption d’hydrogene ou a la formation
d’hydrure de titane. Les couches passives peuvent aussi etre utilisees comme barriere
interfaciale contre la diffusion d’hydrogene.
Des etudes morphologiques et des caracterisations electrochimiques de l’Ebonex® ont aussi ete
menees. Ebonex® est un materiau ceramique produit a partir des suboxydes de titane de type
Magneli. Ce materiau possedant des caracteristiques physico-chimiques specifiques est tres
difficile a mouler en pieces precises, ce qui n’est pas le cas des couches passives colorees de
iii
Reproduced with permission of the copyright owner. Further reproduction prohibited without permission.
Ti. Ebonex® a ete utilise pour comparer ses proprietes electrochimiques a celles des couches
passives de Ti et aussi a celles des couches passives modifiees de Ti.
L’un des objectifs specifiques de ces travaux etait de modifier la surface de ces films de Ti par
deposition d’oxyde de ruthenium et/ou d’oxyde d’iridium. Dans I’industrie chloro-alcaline, le
role et 1’importance des electrodes de RuOz et/ou de IrOz sont bien connus. La methodologie
de modification de la surface des couches passives colorees implique une technique de
decomposition thermique des chlorures de ruthenium et/ou d’iridium. L’efficacite de cette
technique de decomposition thermique, ainsi que la composition chimique de la surface et la
morphologie de ces couches passives modifies ont ete verifiees et confirmees par analyse
elementaire a rayons-X en selection d’energie (EDX) et par MEB. La couche passive de Ru02
au-dessus de la couche passive de Ti ne revele pas de fiacture ou de fissure. Par contre, la
couche passive de Ir02 et celle de Ir02+Ru02 possedent des fissures tres prononcees. La
morphologie des couches passives de Ti apres leur modification par Ru02 et/ou par Ir02,
donne des nouvelles caracteristiques electrochimiques, et aussi un comportement tout a fait
different comparativement aux couches passives colorees de Ti. L’evaluation de leur activite
electrocatalytique et de leur stabilite sur de longues periodes de polarisation cathodique a ete
effectuee en utilisant les memes techniques electrochimiques que pour la caracterisation du Ti,
des couches passives colorees de Ti et enfin pour Ebonex®.
iv
Reproduced with permission of the copyright owner. Further reproduction prohibited without permission.
ABSTRACT
Brightly and uniformly colored passive layers on Ti are prepared by application of AC
polarization in aqueous NH4BF4. Such formed films reveal a wider spectrum of colors that
those prepared by gas-phase techniques at elevated temperatures and can be formed within
seconds (vs. hours or days in the case of thermal treatment in an oxygen-containing
atmosphere). These films demonstrate novel properties as protective and decorative layers.
The influence of different experimental parameters (electrolyte pH and concentration, duration
of polarization, type of applied voltage) on the coloration, uniformity, brightness, and
morphology of the colored films is examined. The comparison with DC polarization was also
studied.
Experimental results demonstrate that the colored, passive films well adhere to the Ti substrate
and do not peel off from it. Optical microscopy and Scanning Electron Microscopy (SEM)
analysis confirm that AC polarization formed passive films are compact and do not reveal
fractures or cracks unlike thermally formed layers. The adherence of the passive films
depends on the mechanical pretreatment of the metallic Ti prior to the film formation. In
general, the adherence is greater when the films are formed on a rough, chemically etched Ti
substrate. In the case of the films formed on a mechanically polished Ti, the adherence is
lower and polishing or rubbing can result in the film’s removal.
X-ray Photoelectron Spectroscopy (XPS) characterization of the colored passive layers reveals
that their surface-chemical composition depends on the AC polarization voltage. The main
constituents of the passive layers are Ti*\ O2', and F (z varies from 4 to 2 depending on the
film’s depth). Fluoride in the film originates from decomposition of NH4BF4 and it
v
Reproduced with permission of the copyright owner. Further reproduction prohibited without permission.
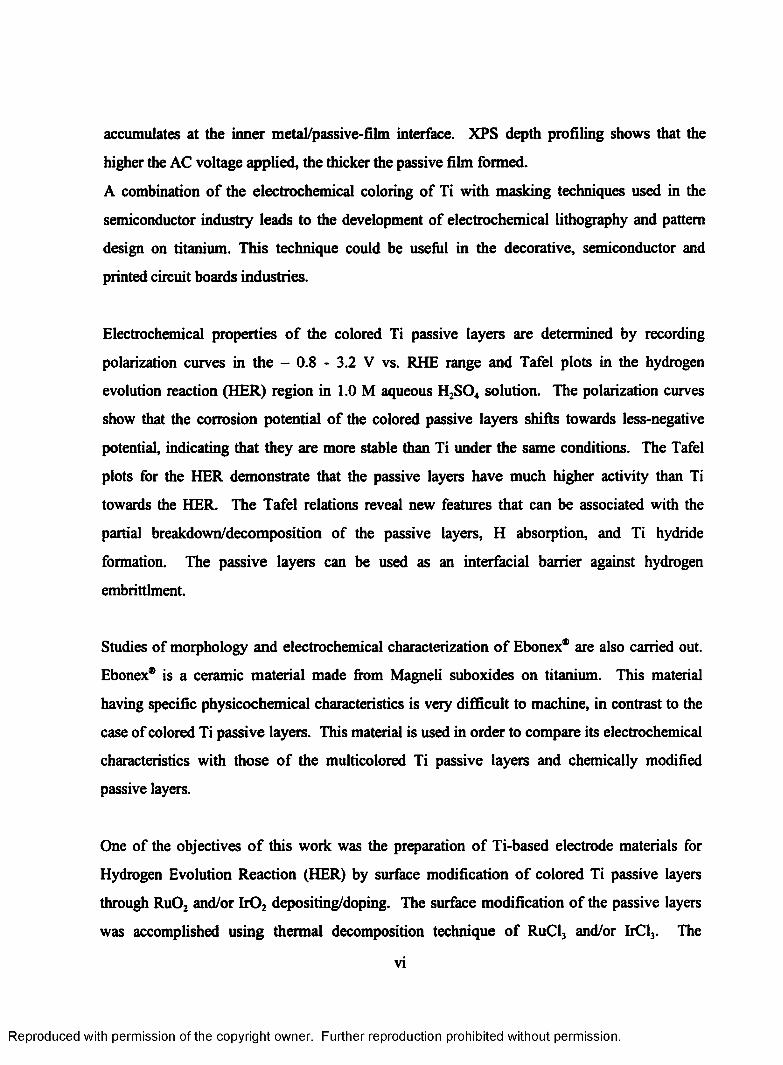
accumulates at the inner metal/passive-film interface. XPS depth profiling shows that the
higher the AC voltage applied, the thicker the passive film formed.
A combination of the electrochemical coloring of Ti with masking techniques used in the
semiconductor industry leads to the development of electrochemical lithography and pattern
design on titanium. This technique could be useful in the decorative, semiconductor and
printed circuit boards industries.
Electrochemical properties of the colored Ti passive layers are determined by recording
polarization curves in the - 0.8 - 3.2 V vs. RHE range and Tafel plots in the hydrogen
evolution reaction (HER) region in 1.0 M aqueous H2S04 solution. The polarization curves
show that the corrosion potential of the colored passive layers shifts towards less-negative
potential, indicating that they are more stable than Ti under the same conditions. The Tafel
plots for the HER demonstrate that the passive layers have much higher activity than Ti
towards the HER. The Tafel relations reveal new features that can be associated with the
partial breakdown/decomposition of the passive layers, H absorption, and Ti hydride
formation. The passive layers can be used as an interfacial barrier against hydrogen
embrittlment.
Studies of morphology and electrochemical characterization of Ebonex® are also carried out.
Ebonex® is a ceramic material made from Magneli suboxides on titanium. This material
having specific physicochemical characteristics is very difficult to machine, in contrast to the
case of colored Ti passive layers. This material is used in order to compare its electrochemical
characteristics with those of the multicolored Ti passive layers and chemically modified
passive layers.
One of the objectives o f this work was the preparation of Ti-based electrode materials for
Hydrogen Evolution Reaction (HER) by surface modification of colored Ti passive layers
through Ru0 2 and/or IrOz depositing/doping. The surface modification of the passive layers
was accomplished using thermal decomposition technique of RuC13 and/or IrCl3. The
vi
Reproduced with permission of the copyright owner. Further reproduction prohibited without permission.
achievement of this doping technique, and the surface chemical composition and morphology
of such modified layers are verified and confirmed by Energy Dispersive X-Ray microanalysis
(EDX) and Scanning Electron Microscopy analysis (SEM). The Ru02 oxide layer on top of the
Ti passive film reveals no cracks and fractures. On the other hand, the Ir02 and Ir02/Ru02
layers are cracked with very pronounced fractures. The surface morphology of Ti passive
layers obtained by depositing/doping with Ru02 and/or Ir02 gives new electrochemical
characteristic and different behavior to the colored titanium passive films. The evaluation of
their electrocatalytic activity and stability upon prolonged cathodic polarization was carried
out using the same electrochemical techniques used for the characterization of Ti, colored Ti
passive layers and Ebonex®.
vii
Reproduced with permission of the copyright owner. Further reproduction prohibited without permission.
ACKNOWLEDGEMENTS
I would like to present my gratitude and great appreciation to Professor Gregory Jerkiewicz for
his direction, guidance and support during the course of this research. Professor Jerkiewicz
has been always ready to help, to discuss the results and to provide useful ideas. He was not
only my professor, but also like my friend, joyful and helpful in establishing my new life in
my new homeland.
I would like to express my gratitude to my friends and colleagues in our laboratory: Sonia
Blais M.Sc., Dr. Alireza Zolfaghari, Dr. Gholam Vatankhah, Mathieu D’Amours and Jean-
Pierre Tessier, friends always ready to help and resolve numerous electrochemical problems. I
wish to thank the Chemistry Department professionals, Mr. Pierre Magny for excellent SEM
analysis, Mr. Denis Poulin of the Mechanical Workshop who was able to fabricate and
machine numerous electrodes. Thanks to Mr. Real Dubuc, master glassblower and artist in his
job.
I would like to express my special respects and gratitude to my parents, Zekir and Aisha, and
to my sister Selma, for their support and encouragement during the course of my studies which
I started in my native land, Bosnia, and which I could not finish there because of the war.
Even while being so far away, they have always been with me.
I would like to acknowledge the financial support from the Natural Sciences and Engineering
Research Council of Canada (NSRCC) through a Strategic Research Grant, and two industrial
supporters, namely Huron Tech Canada Inc., of Kingston, Ontario, and Kvaemer-Chemetics
Inc., of Vancouver, British Columbia.
Above all, I would like to thank my dear wife, Zorana, for her love and help. She was and is
always supporting and giving me the energy and courage to continue my work. Thank you!
viii
Reproduced with permission of the copyright owner. Further reproduction prohibited without permission.
TABLE OF CONTENTS
SUMMARY......................................................................................................................... ii
ABSTRACT..........................................................................................................................v
ACKNOWLEDGEMENTS............................................................................................... viii
TABLE OF CONTENTS.................................................................................................... ix
LIST OF FIGURES........................................................................................................... xiii
INTRODUCTION.................................................................................................................1
CHAPTER 1 - THEORETICAL ASPECTS OF CORROSION OF TITANIUM AND
TITANIUM PASSIVE LAYERS................................................................7
1.1 Forms of the corrosion of titanium.................................................................10
1.1.1 Galvanic corrosion..............................................................................10
1.1.2 Crevice corrosion................................................................................11
1.1.3 Stress corrosion and hydrogen embrittelment..................................... 12
1.1.4 Erosion corrosion and cavitation......................................................... 14
1.1.5 Localized corrosion (pitting)............................................................... 15
1.2 Corrosion resistance of titanium in specific media........................................16
1.3 Enhancement of the corrosion resistance of titanium.....................................18
1.3.1 Alloying of titanium...........................................................................18
1.3.2 Inhibitor addition................................................................................19
1.3.3 Precious metal surface treatment........................................................19
1.3.4 Thermal oxidation............................................................................. 20
1.3.5 Electrochemical oxidation...................................................................22
ix
Reproduced with permission of the copyright owner. Further reproduction prohibited without permission.
CHAPTER 2 - EXPERIMENTAL PART 24
2.1 Electrode preparation.......................................................................................24
2.1.1 Titanium electrodes............................................................................24
2.1.2 RuO, or/and Ir02 doped titanium passive layer electrodes................ 26
2.2 Electrolyte and cell for AC polarization......................................................... 27
2.3 Electrolyte and cell for electrochemical characterization................................29
2.4 Instrumentation for colored Ti layer preparation........................................... 31
2.5 Instrumentation for electrochemical characterization.................................... 31
2.6 Instrumentation and techniques for morphology and surface composition
analysis.......................................................................................................... 32
2.6.1 Optical Microscopy........................................................................... 32
2.6.2 Scanning Electron Microscopy (SEM)...............................................33
2.6.3 Atomic Force Microscopy (AFM).....................................................33
2.6.4 X-ray Photoelectron Spectroscopy (XPS/ESCA)...............................34
CHAPTER 3 - PREPARATION OF COLORED PASSIVE SURFACE LAYERS ON
TITANIUM............................................................................................... 37
3.1 Relation between current density and polarization time during film
formation....................................................................................................... 37
3.2 Relation between current density and distance between electrodes for
different applied AC potentials......................................................................37
3.3 Comparison of Ti surface coloration accomplished by AC and DC
polarization.................................................................................................... 39
3.4 Impact of AC voltage, polarization time, concentration, and pH on the
coloration of titanium.................................................................................... 41
3.5 Colors switching during AC polarization of titanium.....................................45
3.6 Colored passive films on titanium alloys....................................................... 46
x
Reproduced with permission of the copyright owner. Further reproduction prohibited without permission.
3.7 Development of electrochemical lithography on titanium 47
CHAPTER 4 - SURFACE CHEMICAL CHARACTERIZATION AND CHEMICAL
COMPOSITION OF MULTICOLORED TITANIUM PASSIVE
LAYERS.....................................................................................................50
4.1 Optical microscopy analysis of Ti passive films............................................. 50
4.2 3D Optical microscopy o f multicolored titanium passive layers.................... 51
4.3 Scanning electron microscopy characterization of titanium and titanium
passive layers...................................................................................................53
4.4 Atomic force microscopy analysis of titanium and titanium passive layers... 59
4.5 XPS characterization and depth profile analysis of the colored Ti passive
layers...............................................................................................................62
CHAPTER 5 - ELECTROCHEMICAL CHARACTERIZATION OF TITANIUM AND
ITS COLORED PASSIVE LAYERS.........................................................72
5.1 Electrochemical behavior o f Ti and colored Ti passive layers under open-
circuit conditions.............................................................................................72
5.2 Polarization curves of Ti and colored Ti layers............................................... 74
5.3 Tafel plots in the HER region..........................................................................75
5.4 Influence of prolonged cathodic polarization on morphology and
electrochemical behavior o f titanium............................................................. 85
CHAPTER 6 - SURFACE CHEMICAL MODIFICATION OF TITANIUM PASSIVE
LAYERS BY DEPOSITION OF RUTHENIUM OR/AND IRIDIUM
OXIDE........................................................................................................89
xi
Reproduced with permission of the copyright owner. Further reproduction prohibited without permission.
6.1 Morphology and chemical composition of the chemically modified layers
of T i................................................................................................................ 91
6.2 Electrochemical characteristics of the chemically modified passive layers.... 92
6.2.1 Polarization curves..............................................................................92
6.2.2 Impact of prolonged cathodic polarization on the chemically
modified Ti passive layers.................................................................. 94
6.2.3 Open circuit potential behavior of Ti, Ti passive layers and modified
Ti passive layers.................................................................................. 96
6.2.4 Cyclic voltammetry of surface modified Ti passive layers.................98
6.2.5 HER Tafel plots for the chemically modified Ti passive layers....... 102
CHAPTER 7 - MORPHOLOGY AND ELECTROCHEMICAL
CHARACTERIZATION OF EBONEX* ON TITANIUM.....................107
7.1 SEM analysis of Ebonex* on T i.................................................................... 107
7.2 Electrochemical characterization of Ebonex* on Ti.......................................108
7.2.1 Polarization curves............................................................................108
7.2.2 Cyclic voltammetry of Ebonex* on Ti...............................................I l l
7.2.3 HER Tafel plots for Ebonex* on Ti...................................................113
7.2.4 Impact of prolonged cathodic polarization on Ebonex* on Ti...........113
CONCLUSIONS............................................................................................................... 115
REFERENCES................................................................................................................. 118
Reproduced with permission of the copyright owner. Further reproduction prohibited without permission.
LIST OF FIGURES
1. A typical polarization curve for a metal/metal ion system that undergoes
an active to passive transition followed by transpassive transition..........................8
2. Pourbaix (potential versus pH) diagram for the titanium-water system at
25°C.........................................................................................................................9
3. Schematic representation of the mechanism of crevice corrosion for
titanium in aqueous chloride media....................................................................... 12
4. Photomicrograph of severely hydrided unalloyed titanium at the
magnification o f200 x)......................................................................................... 14
5. Schematic representation of the mechanism of pitting corrosion............................ 16
6. Corrosion rate of unalloyed titanium in high temperature HN03 solutions............ 17
7. Comparison of titanium and Pd-ion treated titanium surface in boiling
sulfuric acid........................................................................................................... 20
8. Growth of the thermal oxide films on unalloyed titanium in air.............................22
9. Circular titanium electrode used to establish optimal conditions for
surface coloration (a), and wire-shaped titanium electrode utilized for
electrochemical characterization of the colored Ti passive layers (b)................... 25
10. Schematic representation of the thermal treatment procedure applied to
prepare Ru02, Ir02, and RuOz - Ir02 doped colored Ti passive-layer
Reproduced with permission of the copyright owner. Further reproduction prohibited without permission.
electrodes: (a) furnace used for thermal decomposition, (b) three-step
program applied during the thermal treatment procedure.................................... 27
11. Schematic representation of the cell used for preparation of colored
passive layers on titanium.................................................................................... 28
12. Schematic representation of the cell used to study the influence of the
distance between the Ti electrode and the Pt counter electrode on the
surface coloration................................................................................................. 29
13. Schematic representation of the three compartment cell used for
electrochemical characterization of the colored titanium passive layers,
Ru0 2 or/and Ir02 doped Ti passive layers, and Ebonex®..................................... 30
14. Block diagram of XPS/ESCA system for surface analysis................................... 35
15. Current density vs. polarization time for applied 10 and 20VAC in aq. 7.5
wt. %NH4BF4, t = 10 s, T = 298 K (Error bars are omitted to facilitate the
graph analysis)......................................................................................................38
16. Current density vs. distance between the working and the counter
electrodes for different applied AC potentials from 20 to 60 VAC in aq. 7.5
wt. %NH4BF4 for t = 10 s, T = 298 K (Error bars are omitted to facilitate
the graph analysis)................................................................................................39
17. AC and DC voltages required to reach the same surface coloration of Ti
in aq. 7.5 wt. %NH4BF4, t = 10 s, T = 298 K........................................................ 40
18. Time required for DC current density to decay to a zero value during DC
polarization of titanium from 10 - 60 in aq. 7.5 wt. %NH4BF4, t = 10
s, T = 298 K.......................................................................................................... 41
xiv
Reproduced with permission of the copyright owner. Further reproduction prohibited without permission.
19. Colored passive layers of Ti obtained by applying different AC voltages
(10-70 VAC) in aq. 7.5 wt. %NH4BF4, t = 10 s, T = 298 K..................................... 42
20. Coloration changes with the time of AC polarization in aq. 7.5 wt.
%NH4BF4, t = 60 ms -1 2 0 s, T = 298 K............................................................... 43
21. Impact of electrolyte concentration and applied voltage on titanium
coloration in aq. 7.5 wt. %NH4BF4, t = 10 s, T = 298 K........................................ 44
22. Influence of the electrolyte pH on the coloration of titanium in aq. 7.5 wt.
% NH4BF4, t = 10 s, T = 298 K..............................................................................45
23. Color switching effect characteristic of only AC polarization. Possibility
of changing the coloration in opposite direction by decreasing or
increasing the applied VAC in aq. 7.5 wt. % NH4BF4, T = 298 K, t = 5 s...............46
24. Schema of electrochemical lithography technique: (1) application of
photoresist on Ti, (2) placement of mask to mark the surface for coloring,
(3) application of UV light - polymerization, (4) removal of the
polymerized surface, (5) chemical etching, (6) electrochemical oxidation
of unprotected titanium surface, and (7) removal of photoresist by
immersion in acetone............................................................................................. 49
25. Optical microscopy analysis (200 x) of Ti and Ti passive films formed at
10,15,30,50 and 60 VAC in aq. 7.5 wt. % NH4BF4, T = 298 K, t = 10 s ............. 52
26. New View 5000 3D Optical Microscopy analysis of an as-received Ti
sample, (a) Filled plot, (b) Solid plot, (c) Profile plot at the magnification
of 1000 x; working distance 3.4 mm, lateral resolution 0.64, field of view
0.14x0.11 mm.......................................................................................................54
xv
Reproduced with permission of the copyright owner. Further reproduction prohibited without permission.
27. New View 5000 3D Optical Microscopy analysis of the etched Ti sample.
(a) Filled plot, (b) Solid plot, (c) Profile plot, at the magnification of 1000
x; working distance 3.4 mm, lateral resolution 0.64 pm, field of view 0.14
x0 . l l mm.............................................................................................................. 55
28. New View 5000 3D Optical Microscopy analysis of the 20 VAC colored
passive layer on Ti formed in aq. 7.5 wt. % NH4BF4, T = 298 K, t = 10 s..
(a) Filled plot, (b) Solid plot, (c) Profile plot, at the magnification 1000 x;
working distance 3.4 mm, lateral resolution 0.64 pm, field of view 0.14 x
0.11 mm................................................................................................................. 56
29. New View 5000 3D Optical Microscopy analysis of the 40 VAC colored
passive layer on Ti formed in aq. 7.5 wt. % NH4BF4, T = 298 K, t = 10 s.
(a) Filled plot, (b) Solid plot, (c) Profile plot, at the magnification 1000 x;
working distance 3.4 mm, lateral resolution 0.64 pm, field of view 0.14 x
0.11 mm................................................................................................................. 57
30. New View 5000 3D Optical Microscopy analysis of the 60 VAC colored
passive layer on Ti formed in aq. 7.5 wt. % NH4BF4, T = 298 K, t = 10 s.
(a) Filled plot, (b) Solid plot, (c) Profile plot, at the magnification 1000 x;
working distance 3.4 mm, lateral resolution 0.64 pm, field of view 0.14 x
0.11 mm................................................................................................................. 58
31. SEM analysis (1000 x) of Ti and 7 Ti passive layers (10-70 VAC) formed
in aq. 7.5 wt. % NH4BF4, T = 298 K, t = 10 s ........................................................60
32. SEM analysis (3000 x) of Ti and 7 Ti passive layers (10-70 VAC) formed
in aq. 7.5 wt. % NH4BF4, T = 298 K, t = 10 s ........................................................61
33. AFM analysis (contact mode) of the Ti passive layer formed on 15 and 25
VAC in aq. 7.5 wt. % NH4BF4, T = 298 K, t = 10 s ................................................ 63
xvi
Reproduced with permission of the copyright owner. Further reproduction prohibited without permission.
34. AFM analysis (contact mode) o f the Ti passive layers formed on 35 and
45 VAC in aq. 7.5 wt. % NH4BF4, T = 298 K, t = 10 s ......................................... 64
35. XPS survey spectrum (A) and XPS depth profile (B) for the brown layer
formed at 15 VAC in aq. 7.5 wt. % NH4BF4, T = 298 K, t = 10 s..........................66
36. XPS survey spectrum (A) and XPS depth profile (B) for the dark-blue
layer formed at 25 VAC in aq. 7.5 wt. % NH4BF4, T = 298 K, t = 10 s ................. 67
37. XPS survey spectrum (A) and XPS depth profile (B) for the light-blue
layer formed at 35 VAC in aq. 7.5 wt. % NH4BF4, T = 298 K, t = 10 s................. 68
38. XPS survey spectrum (A) and XPS depth profile (B) for the olive-green
layer formed at 45 VAC in aq. 7.5 wt. % NH4BF4, T = 298 K, t = 10 s..................69
39. XPS survey spectrum (A) and XPS depth profile (B) for the pink layer
formed at 55 VAC in aq. 7.5 wt. % NH4BF4, T = 298 K, t = 10 s.......................... 70
40. Relation between the thickness of the colored passive layers and the
applied AC voltage in aq. 7.5 wt. % NH4BF4, T = 298 K, t =10 s........................71
41. Open-circuit behavior of six colored passive layers in aq. 7.5 wt. %
NH4BF4 vs pure Ti as a quasi-reference electrode. Colors represent the
real film coloration............................................................................................... 73
42. Two sets of two polarization curves, one for Ti (reference) and one for the
passive films (formed at 10 and 20 VAC in aq. 7.5 wt. % NH4BF4, T = 298
K, t = 10 s) in 1 M aq. H2S04 (T = 298 K, s = 1 mV s ').......................................76
43. Two sets of two polarization curves, one for Ti (reference) and one for the
passive films (formed at 30 and 40 VAC in aq. 7.5 wt. % NH4BF4, T = 298
K, t= 10 s) in 1 M aq. H2S04 (T = 298 K, s = 1 mV s ').......................................77
xvii
Reproduced with permission of the copyright owner. Further reproduction prohibited without permission.
44. Two sets of two polarization curves, one for Ti (reference) and one for the
passive films (formed at 50 and 60 VAC in aq. 7.5 wt. % NH4BF4, T = 298
K, t = 10 s) in 1 M aq. H2S04 (T = 298 K, s = 1 mV s'1)....................................... 78
45. Relation between E^,, and VAC. shifts 190 mV towards less-negative
potentials upon the colored layer formation.......................................................... 79
46. Relation between ECI. and VAC- e ct shifts 60 mV towards less-negative
potentials upon the colored layer growth...............................................................80
47. Program applied to obtain steady-state Tafel polarization curves for Ti
and colored passive films. Aq refers to the successive increment of the
overpotential, q, and At refers to the polarization time and the
conditioning time. The inset shows a typical current density, i, versus t
transients until a steady-state current density, i„, becomes established................ 81
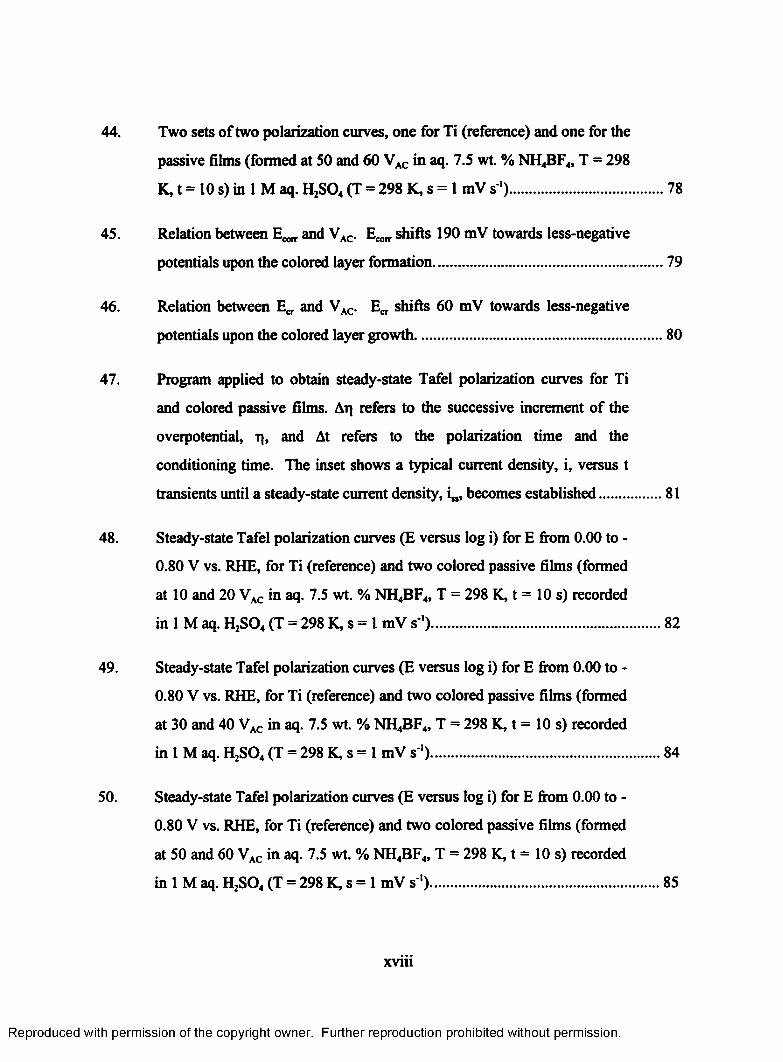
48. Steady-state Tafel polarization curves (E versus log i) for E from 0.00 to -
0.80 V vs. RHE, for Ti (reference) and two colored passive films (formed
at 10 and 20 VAC in aq. 7.5 wt. % NH4BF4, T = 298 K, t = 10 s) recorded
in 1 M aq. H2S04 (T = 298 K, s = 1 mV s*).......................................................... 82
49. Steady-state Tafel polarization curves (E versus log i) for E from 0.00 to -
0.80 V vs. RHE, for Ti (reference) and two colored passive films (formed
at 30 and 40 VAC in aq. 7.5 wt. % NH4BF4, T = 298 K, t = 10 s) recorded
in 1 M aq. H2S04 (T = 298 K, s = 1 mV s ').......................................................... 84
50. Steady-state Tafel polarization curves (E versus log i) for E from 0.00 to -
0.80 V vs. RHE, for Ti (reference) and two colored passive films (formed
at 50 and 60 VAC in aq. 7.5 wt. % NH4BF4, T = 298 K, t = 10 s) recorded
in 1 M aq. H2S04 (T = 298 K, s = 1 mV s ').......................................................... 85
xviii
Reproduced with permission of the copyright owner. Further reproduction prohibited without permission.
51. SEM analysis (10000 x) of Ti electrodes after cathodic polarization at -
100 mA cm'2 for different times (A - Oh, B - l h , C - 5 h , and D - 10 h)
in 1M aq. H2S04 (T = 298 K)................................................................................ 87
52. Impact of cathodic polarization on polarization curves of Ti after 1 h, 3 h,
5 h, and 10 h of polarization at - 100 mA cm'2 in 1M aq. H2S04
(T = 298 K, s = lmV s ') ........................................................................................88
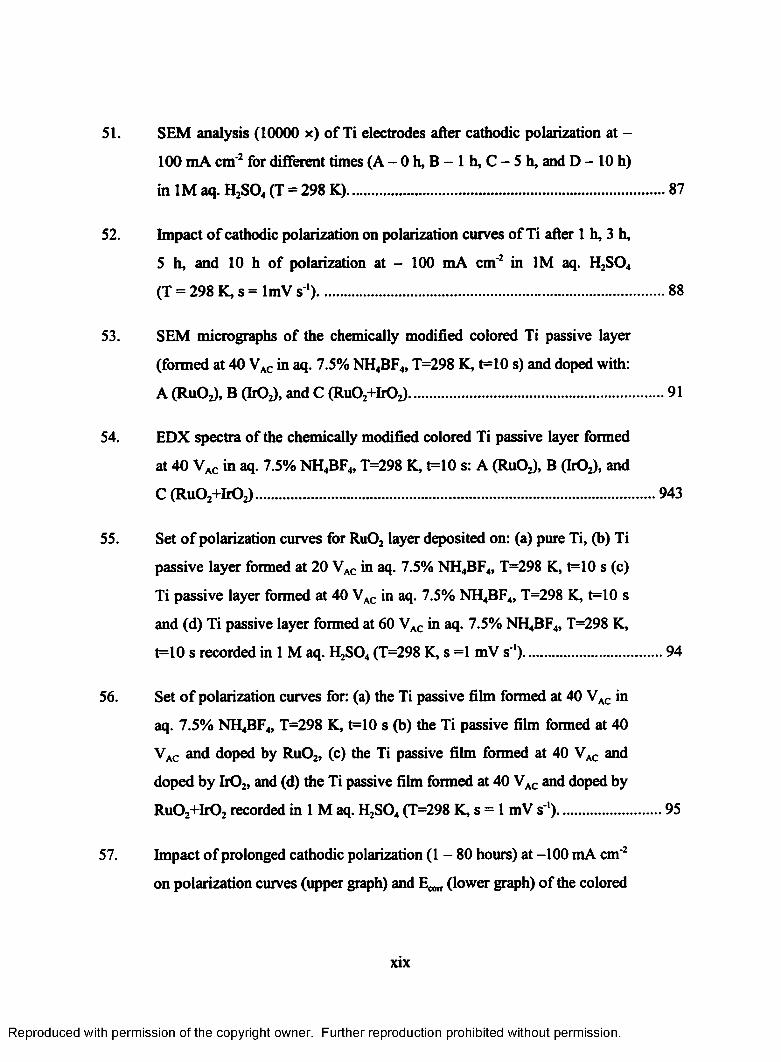
53. SEM micrographs of the chemically modified colored Ti passive layer
(formed at 40 VAC in aq. 7.5% NH4BF4, T=298 K, t=10 s) and doped with:
A (RuOj), B (IrOJ, and C (RuOz+IrOz).................................................................91
54. EDX spectra of the chemically modified colored Ti passive layer formed
at 40 VAC in aq. 7.5% NH4BF4, T=298 K, t=10 s: A (RuOJ, B (IrOz), and
C (RuOj+IrOj).....................................................................................................943
55. Set o f polarization curves for Ru02 layer deposited on: (a) pure Ti, (b) Ti
passive layer formed at 20 VAC in aq. 7.5% NH4BF4, T=298 K, t=10 s (c)
Ti passive layer formed at 40 VAC in aq. 7.5% NH4BF4, T=298 K, t=10 s
and (d) Ti passive layer formed at 60 VAC in aq. 7.5% NH4BF4, T=298 K,
t=10 s recorded in 1 M aq. H2S04 (T=298 K, s =1 mV s'1)................................... 94
56. Set o f polarization curves for: (a) the Ti passive film formed at 40 VAC in
aq. 7.5% NH4BF4, T=298 K, t=10 s (b) the Ti passive film formed at 40
VAC and doped by RuOz, (c) the Ti passive film formed at 40 VAC and
doped by Ir02, and (d) the Ti passive film formed at 40 VAC and doped by
Ru02+Ir02 recorded in 1 M aq. H2S04 (T=298 K, s = 1 mV s'1)...........................95
57. Impact of prolonged cathodic polarization (1 - 80 hours) at -100 mA cm'2
on polarization curves (upper graph) and E ^ (lower graph) of the colored
xix
Reproduced with permission of the copyright owner. Further reproduction prohibited without permission.
film formed at 40 VAC in aq. 7.5% NH4BF4, T=298 K, t=10s colored film
doped with RuOz recorded in 1M aq. H2S04 (T = 298 K, s = 1 mV s'1)................97
58. Open-circuit behavior of Ti, three colored passive layers, and three
modified colored passive layers with Ru02, IrOz, and Ru02+hO2 recorded
in 1M aq. H2S04 (T = 298 K)............................... Error! Bookmark not defined.
59. Cyclic voltammograms for Ti modified by deposition of RuOz, Ir02 and
Ru02+IrO2 recorded in 1.0 M aq. H2S04 (T = 298 K, s = 100 mV s 1)..................99
60. Cyclic voltammograms for Ti film (40 VAC) doped with Ru02, Ir02, and
Ru02+IrO2 recorded in 1.0 M aq. H2S04 (T = 298 K, s = 100 mV s ')................ 100
61. Cyclic voltammograms for the 60 VAC film modified with Ru02+Ir02
recorded at different scan rates in 1.0 M aq. H2S04 (T = 298 K). The inset
shows the current density vs. scan rate relation at 0.05V (RHE)......................... 101
62. Steady-state Tafel polarization curves (E versus log i) for E from 0.00 V
to - 0.80 V vs. RHE, for Ti doped with Ir02, Ru02, and Ru02+Ir02
recorded in 1M aq. H2S04 (T = 298 K)................................................................103
63. Steady-state Tafel polarization curves (E versus log i) for E from 0.00 V
to - 0.80 V vs. RHE, for Ti (20VAC film) doped with Ir02, Ru02, and
Ru02+Ir02 recorded in 1M aq. H2S04 (T = 298 K)..............................................104
64. Steady-state Tafel polarization curves (E versus log i) for E from 0.00 V
to - 0.80 V vs. RHE, for Ti (40VAC film) doped with Ir02, RuOz, and
Ru02+IrO2 recorded in 1M aq. H2S04 (T = 298 K)..............................................105
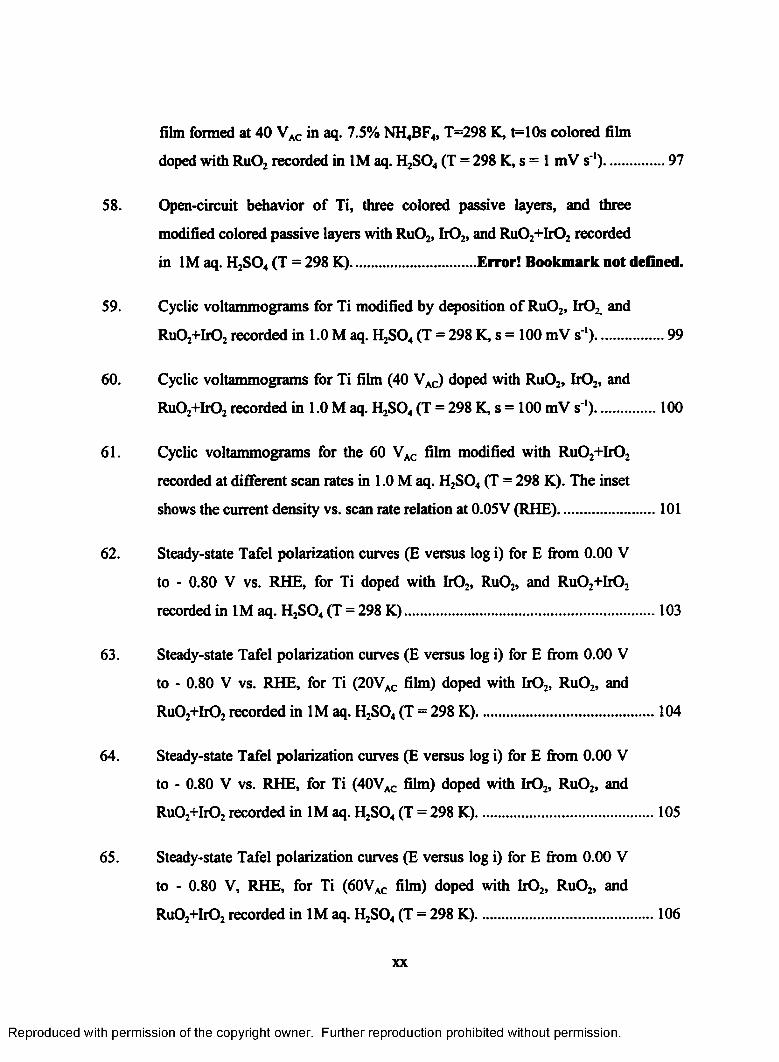
65. Steady-state Tafel polarization curves (E versus log i) for E from 0.00 V
to - 0.80 V, RHE, for Ti (60VAC film) doped with Ir02, Ru02, and
Ru0 2+ItO2 recorded in 1M aq. H2S04 (T = 298 K)..............................................106
xx
Reproduced with permission of the copyright owner. Further reproduction prohibited without permission.
66. SEM micrographs of Ebonex®on Ti (Magnification 1000 x and 3000 x)............ 109
67. Comparison of polarization curves for Ti, the 60 VAC colored Ti passive
layer, and Ebonex® on Ti recorded in 1M aq. H2S04 (T = 298 K, s = lmV
s ') ......................................................................................................................... I l l
68. Influence of the scan rate on the polarization curves of Ebonex® on Ti
recorded in 1M aq. H2S04 (T = 298 K, s = 1 - 60 mV s ')................................... 111
69. Cyclic voltammogram of Ebonex® on Ti in 1M aq. H2S04 between 0.05
and 2.0 V (RHE) with various scan rates (T = 298 K)......................................... 113
70. Tafel plot for Ebonex® on Ti in the HER region between 0.00 V and - 0.80
V (RHE) recorded in aq. 1M H2S04 (T = 298K)..................................................114
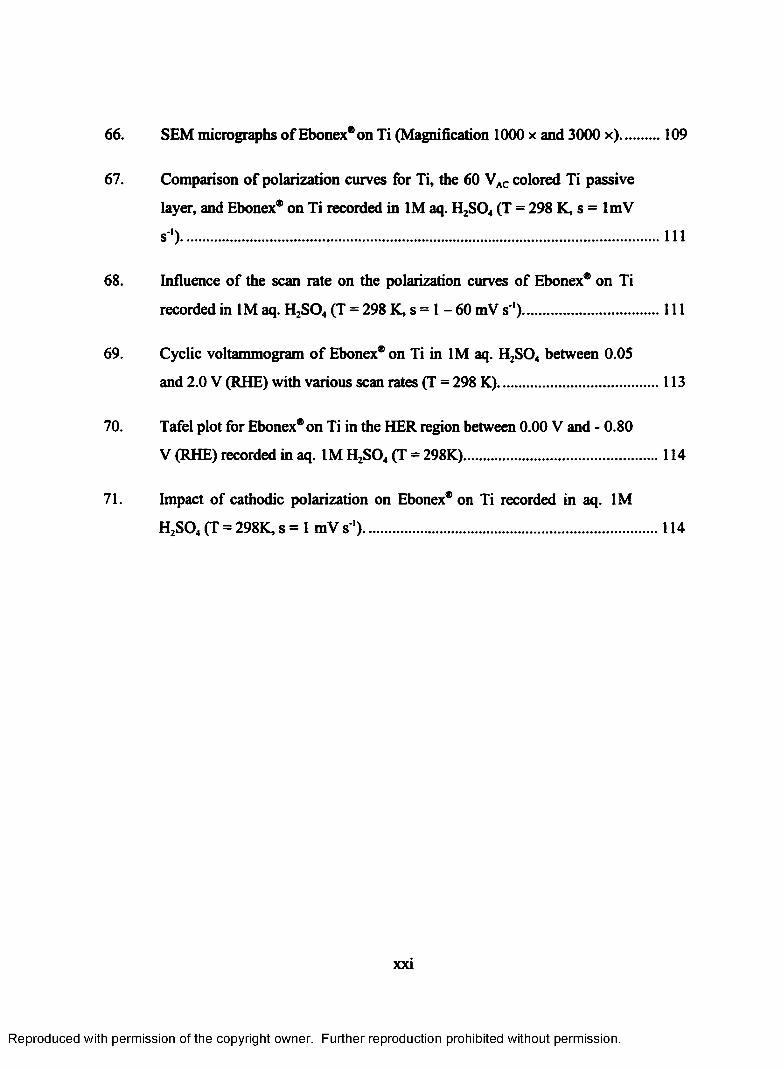
71. Impact of cathodic polarization on Ebonex® on Ti recorded in aq. 1M
H2S04 (T = 298K, s = 1 mV s ')...........................................................................114
xxi
Reproduced with permission of the copyright owner. Further reproduction prohibited without permission.
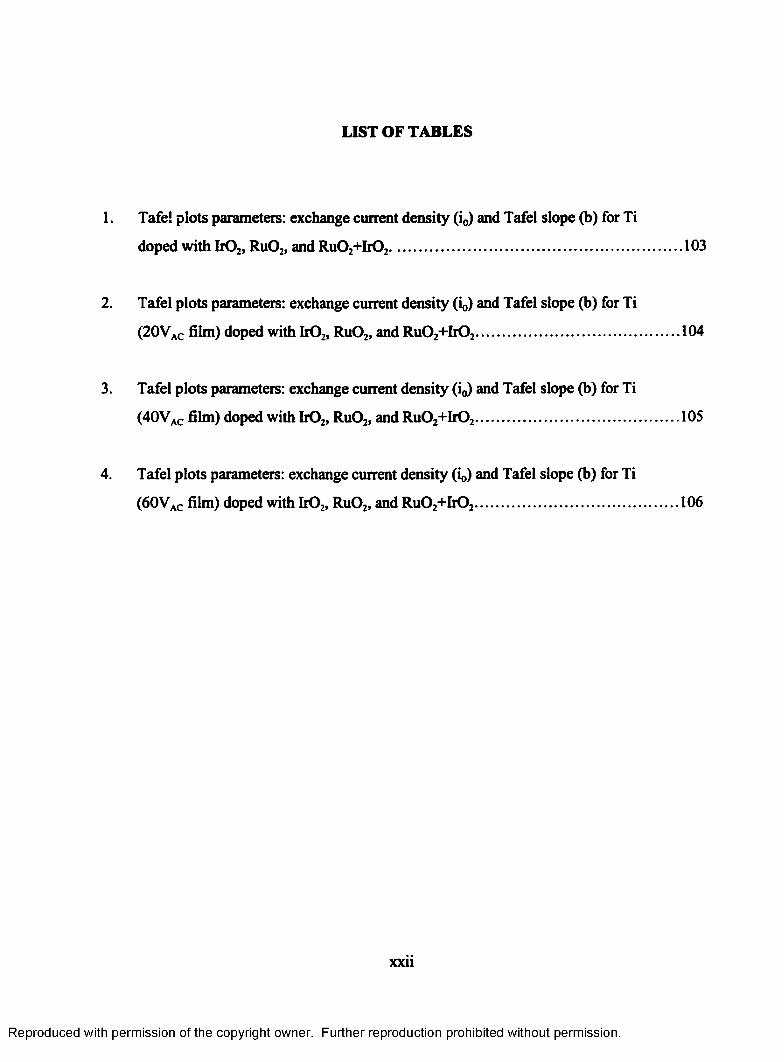
LIST OF TABLES
1. Tafe! plots parameters: exchange current density (i0) and Tafel slope (b) for Ti
doped with b 0 2, Ru02, and Ru02+Ir02..........................................................................103
2. Tafel plots parameters: exchange current density (i0) and Tafel slope (b) for Ti
(20Vac film) doped with Ir02, RuOz, and Ru02+Ir02................................................... 104
3. Tafel plots parameters: exchange current density (io) and Tafel slope (b) for Ti
(40Vac film) doped with IrOz, Ru02, and Ru02+Ir02................................................... 105
4. Tafel plots parameters: exchange current density (i0) and Tafel slope (b) for Ti
(60Vac film) doped with Ir02, Ru02, and Ru02+Ir02................................................... 106
xxii
Reproduced with permission of the copyright owner. Further reproduction prohibited without permission.
INTRODUCTION
The importance of titanium and its rapidly increasing utilization and applications lie in its
exceptional physico-chemical characteristics. Titanium is the fourth most abundant metal and
ninth most common element in the Earth's crust. With a density of 4.5 g cm'3, it lies halfway
between aluminum (2.7 g cm'3) and iron (7.9 g cm'3). Titanium is diamagnetic and has good
heat-transfer properties. Its coefficient of thermal expansion is somewhat lower than that of
steels and less than half of aluminum. Titanium is non-toxic and generally biologically
compatible with the human tissues and bones. The combination of high strength, low density,
and excellent corrosion resistance makes titanium and its alloys useful in many industrial
domains. The aircraft industry is the single largest market for titanium products primarily due
to the exceptional strength-to-weight ratio, high melting point and corrosion resistance.
Titanium applications are most significant in jet engine and airframe components that are
subject to temperatures up to 600°C and for other critical structural parts. Its use is widespread
in most commercial and military aircraft. Titanium is also used in spacecraft where the most
of the physical and mechanical properties of titanium are effectively utilized.
Development of highly efficient gas turbine engines is possible only through the use of
titanium-based alloys in components such as fan blades, compressor blades, discs, hubs and
numerous non-rotor parts. The key advantages of titanium-based alloys in this application
include high strength at moderate temperatures and good resistance to creep and fatigue. The
development of titanium aluminides will allow the use of titanium in hotter sections of a new
generation of engines. Titanium condensers, shell and tube heat exchangers, plate and frame
heat exchangers are used extensively in power plants, refineries, air conditioning systems,
chemical plants, offshore platforms, surface ships and submarines. Extended life time,
increased energy efficiency, and greater product purity are factors promoting the use of
titanium electrodes in electro-winning and electro-refining of copper, gold, manganese and
manganese dioxide. Titanium is widely used for implants, surgical devices, pacemaker cases
1
Reproduced with permission of the copyright owner. Further reproduction prohibited without permission.
and centrifuges. Titanium is the most biocompatible of all metals because of its total
resistance to attack by body fluids, high strength and low strength modulus. In hydrocarbon
processing, the need for long lifetime equipment, coupled with requirements for low downtime
and maintenance, favors the use of titanium in heat exchangers, vessels, columns and piping
systems in refineries and offshore platforms. Titanium is immune to general attack and stress
corrosion cracking brought about by hydrocarbons, H2S, brines and C 02.
Because of exceptional erosion/corrosion resistance, titanium is currently being used for
submarine ball valves, fire pumps, heat exchangers, castings, hull material for deep-sea
submersibles, water jet propulsion systems, shipboard cooling and piping systems. Titanium
vessels, heat-exchangers, tanks, agitators, coolers, and piping systems are utilized in the
processing of aggressive compounds such as nitric acid, organic acids, chlorine dioxide,
inhibited reducing acids and hydrogen sulfide (1,2).
The enigma of such a large utilization of titanium is its ability to passivate by forming surface
oxides which provide a high degree of immunity to attack by most mineral acids and chlorides
(3). However, in reducing environments in which the oxide film is not self-healing, it often
becomes the anodic member of the couple. The corrosion potential of titanium in sea water is
-0.10V vs. RHE which places it below that of 18-8 stainless steel and above that of silver in
the sea water galvanic series (4). Titanium is cathodic to aluminum, carbon steel, zinc and
magnesium in sea water, and the rate of corrosion of these less-noble metals will be affected
by the ratio of the surface areas. Because of the electrical resistivity of the oxide films that are
formed on titanium, the metal loss or corrosion due to the galvanic couple is less than it would
be in an electrochemical couple between metals of similar position in the galvanic series that
do not have a dielectric coating (2,5).
Protection of titanium against corrosion is achieved by means of passive, self-healing films
which form on the metal surface. Film formation depends on the environment to which metal
is exposed. Under oxidizing, neutral, or naturally occurring conditions, titanium shows
2
Reproduced with permission of the copyright owner. Further reproduction prohibited without permission.
immunity to corrosion as an oxide film is formed and maintained. In strongly reducing
solutions in which protective films cannot be formed (aqueous HF), rapid attack can occur. In
slightly reducing or complexing environments, titanium behavior depends on the presence of
metal ion inhibitors, alloying elements, the temperature, and other variables (6).
The protective crystalline oxide film that normally passivates titanium is believed to forme
instantaneously on exposure to the air. The initial film is 12-16 A in thickness. After about 70
days it reaches SO A, and after 4 years it grows to about 250 A (3). The thickness of the films
varies with temperature and oxidation conditions. The film composition changes across its
thickness. Near the metal surface it contains TiO, and at the outer surface it is Ti02, but in the
interior it contains Ti20 3 (7,8). The surface passive film affects heat transfer because the
thermal conductivity of titanium is greater than the thermal conductivity of Ti oxides. The
increased hardness of the surface film provides resistance to abrasion and cavitation erosion.
The passivation of titanium in aqueous reducing acidic media shifts the corrosion potential in
the noble (positive) direction where oxide film stability is promoted. There are different ways
and methodologies of improving titanium stability in corrosive environments (1):
(a) Anodic polarization of titanium or its alloy by applied anodic current, or galvanic
coupling to a less noble metal.
(b) Presence of dissolved oxidizing species in the environment acting as cathodic
depolarizers.
(c) Presence of certain alloying elements in titanium which decrease the cathodic
(hydrogen) overvoltage, thereby depolarizing the cathodic process.
(d) Increase of surface oxide thickness by thermal oxidation.
(e) Increase of surface oxide thickness by anodization.
The anodization of titanium by direct current (DC) application is a known and established
method. In the past, a variety of solutions have been employed for formation of anodic films
3
Reproduced with permission of the copyright owner. Further reproduction prohibited without permission.
on titanium: alcoholic-organic acid baths containing small amounts of phosphoric acid for
developing of the anodic film on titanium metal (9); acetic-perchloric acid baths (10). They
produced pure oxide films, but extremely poor in adherence. New methods were developed in
order to improve the poor adherence of Ti oxides formed in sulfuric acid solutions (11). Much
better results were obtained when using hydrochloric-nitric-sulfuric acid baths for polishing
the surface followed by anodization in a borate buffer solution (12). Some authors recommend
a two-step anodizing procedure employing first a phosphoric acid-glycol bath, and then a boric
acid bath for final film formation (13). The aqueous solution of phosphate salts including
sodium and potassium orthophosphates and sodium, potassium and ammonium acid
phosphates, and also ammonium tartaric acid baths) are the most commonly used aqueous salt
solutions . A large spectrum of colors can be obtained in aq. 3-5 wt. % trisodium phosphate
(13,14).
One of the objectives of this work was the examination of the corrosion resistance of the
colored passive layers on titanium and their applications as electrode materials. A
methodology of preparation of colored passive layers on Ti already invented in our laboratory
was improved. The formation of multicolored passive films on titanium was created by
potentiostatic alternating current (AC) polarization of titanium in aq. NH4BF4 solution which
produces passive films with a wide spectrum of uniform and well-defined colors (15). The
coloration originates from the constructive light interference between the beam reflected at the
outer oxide-air interface and the inner metal-oxide one, a phenomenon referred to as
iridescence (16). This is characteristic for thin transparent films, where part of the light is
reflected by the outer surface layer, and part at the inner one. Whether the beams reinforce or
cancel out depends on the nature and thickness of the film, the angle of reflection, and the light
wavelength. If the film has a uniform thickness, different wavelengths emerge at different
angles. If the layer varies in thickness, then at any given viewing angle, a different color
appears (17). The same effect is also observed for metals such as Zr, Nb, and Ta. This
phenomenon can be used in electrochromic process technology (18) and in the domain of
decorative art (19).
4
Reproduced with permission of the copyright owner. Further reproduction prohibited without permission.
A separate part of this work is the chemical modification of the titanium multicolored passive
layers by doping with IrOz or/and Ru02. Pure and mixed metal oxide coatings on titanium are
materials widely used as anodes in a variety of industrial electrochemical processes such as the
chloro-alkali industry. These types of materials are usually prepared by thermal
decomposition o f the corresponding metal chloride solutions (IrCl3 or R uC13) applied to the
titanium substrate by immersion or by painting (20-29). Some authors proposed the sol-gel
method as an alternative to obtain mixed oxide films on metallic substrates and to avoid the
presence o f residual chloride (30-32). These kinds of electrodes containing conductive metal
oxides reveal some desirable properties such as: (a) high surface area (33), (b) excellent
mechanical, electrical and electrocatalytic properties, (c) catalytic properties that can be
modified by introducing a modulating oxide (34). The surface doping of Ti02 with Ir02 or
Ru0 2 modifies the electronic properties of Ti02 from semi-conducting to electronically
conducting. Such prepared chemically modified mixed oxide layers reveal good catalytic
properties towards the electrolytic 0 2 and Cl2 generation, and are used as anode materials (35-
37). Our interest in surface modified Ti electrodes arises not only from their application as
anodes but also from the necessity to develop a suitable Ti-based cathodic material for the
chloro-alkali industry where the carbon-steel electrode is unable to withstand the highly
corrosive environment and has to be periodically replaced (38). Nanocrystalline Ti-Ru alloys
prepared by ball milling (39), as well as mixed Ti-Ru-Fe oxides (40) reveal favorable
electrocatalytic properties as a cathode material for water electrolysis owing to a low
overpotential of the hydrogen evolution reaction (HER), long-term mechanical stability, and
high real-surface area. On the other hand, titanium oxides electronically modified through Pd
implantation can be used as a suitable substrate in electrolytic bulk Cu deposition (41,42).
Another important objective of this work, which is described in a separate chapter, was to
study and characterize Ebonex® on titanium in order to compare its electrochemical properties
with those of multicolored titanium passive layers and also with modified passive layers.
5
Reproduced with permission of the copyright owner. Further reproduction prohibited without permission.
Ebonex* is a ceramic material based on Magneli suboxides on titanium (43). The non-
stoichiometric oxides having the general formula TinO^,, where n = 4-6, are dark blue-black
in color and electrically conducting, whilst retaining corrosion resistance and low toxicity of
the parent material (44). Ebonex* materials are currently being explored for a diverse range of
technological applications such as chlorine generation, sodium chlorate production,
electroflotation devices, battery materials, and fuel cells (45). In electroplating, for the
regeneration of hard chrome plating solutions, lead dioxide electrode coated with Ebonex* are
used (46). New systems using Ebonex* are being developed for cathodic protection of metals
in concrete and for marine applications (47).
6
Reproduced with permission of the copyright owner. Further reproduction prohibited without permission.
CHAPTER 1
THEORETICAL ASPECTS OF CORROSION OF TITANIUM AND TITANIUM
PASSIVE LAYERS
Corrosion is an electrochemical process in which the surface o f a metal in contact with an
electrolyte is oxidized with the simultaneous reduction of some species in the electrolyte on
the metal surface, and which, over time, results in the deterioration of the majority of metals.
Generally, a corrosion process can proceed via one of the three modes, depending on the
compactness and stability of the corrosion products: (a) direct dissolution without hindrance
from corrosion products, (b) direct dissolution with hindrance from corrosion products, and (c)
indirect dissolution through the formation of passive films (48,49).
The rate in which the corrosion reaction proceeds is related to the electrolyte composition and
physico-chemical characteristics of the metal. One of the very best ways for obtaining
information about corrosion kinetics is through an analysis of anodic polarization curves
recorded in the electrolyte of interest (SO). The polarization curve for a metal that passivates
will have the general shape shown in Fig. 1 (1). The current-potential, or polarization, curve
can be divided into number of regions. In region AB, the active region, metal dissolution
occurs. At the potential B, the current decreases to a very low value. The electrode is said to
have undergone under an active-passive transition, and at the point C, the electrode becomes
passive. The potential at which the current falls to the passive value is called the passivation
potential. For E > E ^ , the metal is said to be in the passive region. In this region, the current
is independent of potential, and metal dissolution occurs at a low constant rate. For potentials
greater than the point E, oxygen evolution can occur on the outside of the oxide film. This is
possible because the passive films are commonly thin (nanometers) and possess
semiconducting properties. The dashed line in Fig. 1, (potential region D to E), represent the
7
Reproduced with permission of the copyright owner. Further reproduction prohibited without permission.
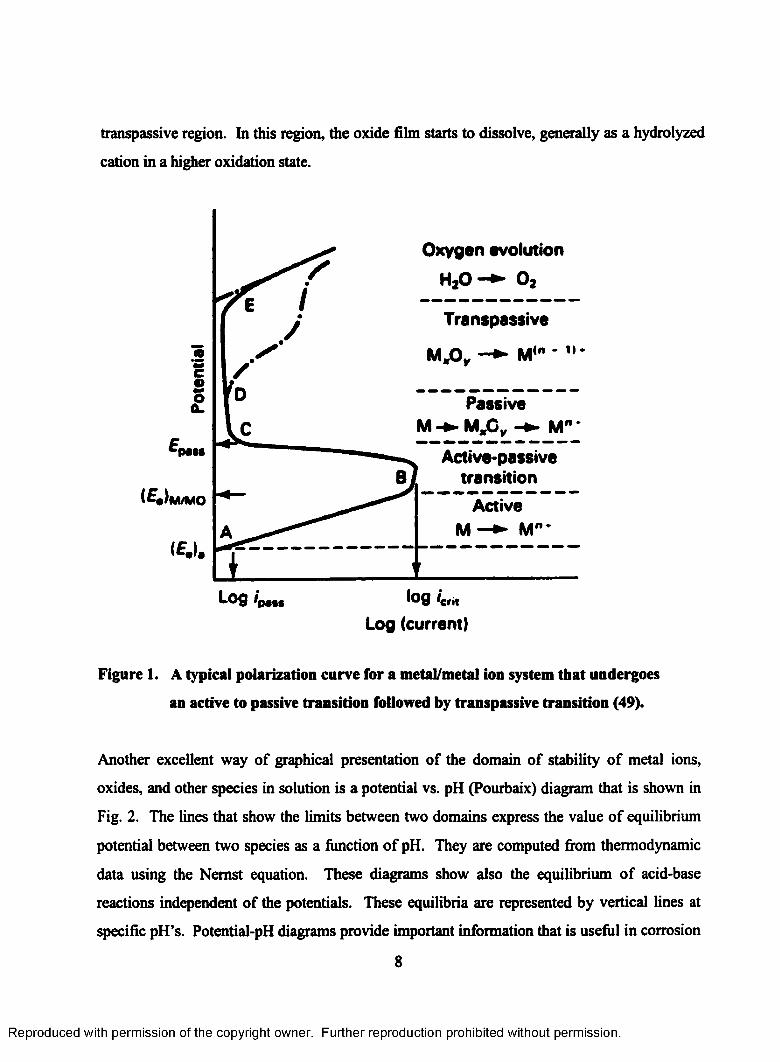
transpassive region. In this region, the oxide film starts to dissolve, generally as a hydrolyzed
cation in a higher oxidation state.
Oxygen evolution H20 —► 0 ,
Trenspassive
Mr0 M<n * *
Passiveh " *
pats
Active
Log (current)
Figure 1. A typical polarization curve for a metal/metal ion system that undergoes
an active to passive transition followed by transpassive transition (49).
Another excellent way of graphical presentation of the domain of stability of metal ions,
oxides, and other species in solution is a potential vs. pH (Pourbaix) diagram that is shown in
Fig. 2. The lines that show the limits between two domains express the value of equilibrium
potential between two species as a function of pH. They are computed from thermodynamic
data using the Nemst equation. These diagrams show also the equilibrium of acid-base
reactions independent of the potentials. These equilibria are represented by vertical lines at
specific pH’s. Potential-pH diagrams provide important information that is useful in corrosion
8
Reproduced with permission of the copyright owner. Further reproduction prohibited without permission.
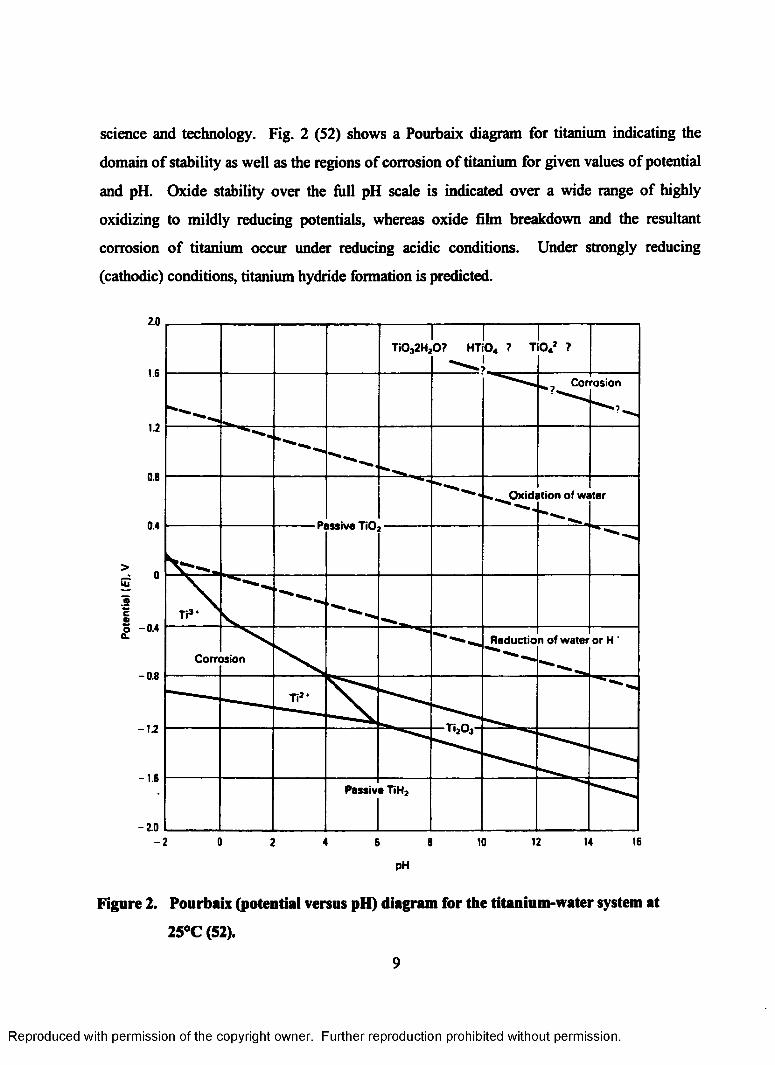
science and technology. Fig. 2 (52) shows a Pourbaix diagram for titanium indicating the
domain of stability as well as the regions of corrosion of titanium for given values of potential
and pH. Oxide stability over the full pH scale is indicated over a wide range of highly
oxidizing to mildly reducing potentials, whereas oxide film breakdown and the resultant
corrosion of titanium occur under reducing acidic conditions. Under strongly reducing
(cathodic) conditions, titanium hydride formation is predicted.
Ti0j2H20 ? HTiO« ? Ti04* ?
Corrosion
Oxidation of water
Passive TiO;
>
<8
coo(L
- 0.4Reduction of water or H ‘
Corrosion- 0.8
TijO;
- 1 .SPassive Tiff
- 2.00- 2 4 12 14 168 102 6
pH
Figure 2. Pourbaix (potential versus pH) diagram for the titanium-water system at
25°C (52).
9
Reproduced with permission of the copyright owner. Further reproduction prohibited without permission.
1.1 Forms of titanium corrosion
The form of corrosion can be defined according to the nature of corrosion such as galvanic
corrosion and crevice corrosion or according to the effect of the corrosion on the surface
morphology i.e. general corrosion and pitting corrosion, and also according to its effect on
bulk properties, such as intergranular corrosion and stress corrosion cracking (4).
1.1.1 Galvanic corrosion
Galvanic corrosion, also called bimetallic corrosion, occurs when two different metals are in
electrical contact. The coupling of titanium with dissimilar metals usually does not accelerate
the corrosion of titanium, with the exception of strongly reducing media in which titanium
severely corrodes and does not passivate (4). In this uncommon situation, accelerated
corrosion may occur when titanium is coupled with more noble metals. In its normal passive
state, titanium is beneficially influenced by materials that exhibit more noble (positive)
corrosion potentials (graphite, Pt, Pd, Au, Ru, Ir). When coupled with these materials,
titanium anodic protection increase by further stabilizing the oxide film on titanium at more
noble potentials. The corrosion potential of titanium in seawater is - 0.10 V vs. RHE which
places it below 18-8 stainless steel and above silver in the sea water galvanic series (4). The
anodic/cathodic nature of titanium depends on the other metal and its place and potential in the
galvanic series. Titanium is cathodic to aluminium, carbon, steel, zinc, and magnesium in
seawater, and the rate of corrosion of those metals is affected by the ratio of the surface areas
of the two metals. Because of the electrical resistivity of the oxide films that are formed on
titanium, the metal loss or corrosion due to the galvanic couple is less than it would be with a
couple between metals of similar position in the galvanic series that do not have a dielectric
coating (3).
10
Reproduced with permission of the copyright owner. Further reproduction prohibited without permission.
1.1.2 Crevice corrosion
Crevice corrosion is a localized form of corrosion proceeding at a fast rate within a crevice.
Titanium and titanium alloys generally exhibit superior resistance to crevice corrosion as
compared to stainless steel and nickel-based alloys. The susceptibility of titanium to crevice
corrosion should be considered when tight crevices exist in hot aqueous chloride, bromide,
iodide, or sulfate solutions. Factors that affect crevice attack includes alloy composition, pH
of electrolyte, temperature, halide concentration, presence of oxidizing species, sample surface
condition and crevice geometry. The model for crevice corrosion in aqueous chloride media is
represented in Fig. 3 (51). Dissolved oxygen or other oxidizing species in the bulk solution
are not present in the restricted volume of solution in the crevice. As a result, metal potential
in the crevices become active (negative) relative to metal surface exposed to the bulk solution.
This creates an electrochemical cell in which the crevice becomes anodic and corrodes, and the
surrounding metal surface is cathodic. Titanium chlorides formed within the crevice are
unstable and tend to hydrolyze, forming hydrochloric acid and titanium oxide as corrosion
products. Because of the small volume of the solution in the crevice, a decrease of pH value as
low as 1 and below, can be observed. This involves an additional growth of the crevice and a
progress of corrosion.
One way of preventing crevice corrosion is to avoid the imperfections of the materials and the
machining failures during the design stage. Rivets, which favor crevice corrosion, could be
replaced by welding or they could be covered by coatings (49). Under certain conditions,
usually associated with halide solutions, crevice corrosion of titanium can occur in gasket
joints, and under heavy scale deposits. Teflon and fluorocarbon adhesives, when coupled in a
crevice, accelerate the corrosion of titanium. The severity of attack increases with an
augmentation of temperature, halide ion concentration, and a decrease of pH.
11
Reproduced with permission of the copyright owner. Further reproduction prohibited without permission.
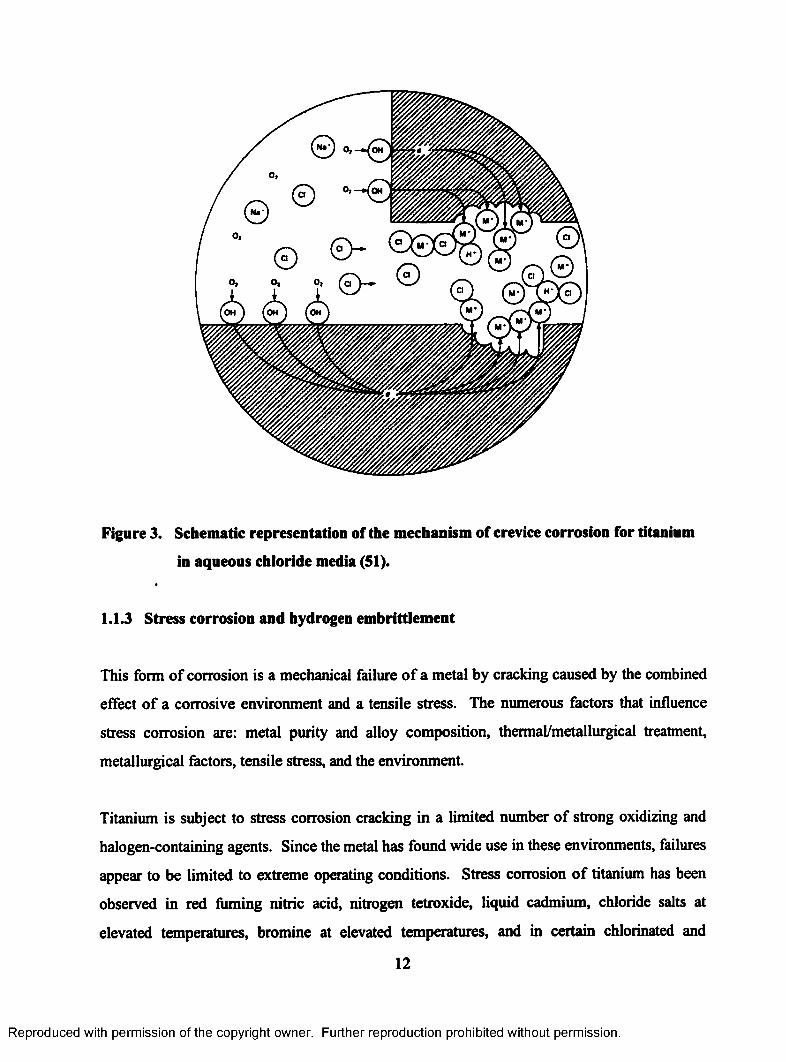
Figure 3. Schematic representation of the mechanism of crevice corrosion for titanium
in aqueous chloride media (51).
1.1.3 Stress corrosion and hydrogen embrittlement
This form of corrosion is a mechanical failure of a metal by cracking caused by the combined
effect of a corrosive environment and a tensile stress. The numerous factors that influence
stress corrosion are: metal purity and alloy composition, thermal/metallurgical treatment,
metallurgical factors, tensile stress, and the environment.
Titanium is subject to stress corrosion cracking in a limited number of strong oxidizing and
halogen-containing agents. Since the metal has found wide use in these environments, failures
appear to be limited to extreme operating conditions. Stress corrosion of titanium has been
observed in red fuming nitric acid, nitrogen tetroxide, liquid cadmium, chloride salts at
elevated temperatures, bromine at elevated temperatures, and in certain chlorinated and
12
Reproduced with permission of the copyright owner. Further reproduction prohibited without permission.
brominated organic compounds at elevated temperatures. In each case susceptibility manifests
itself in many small branching cracks. Initiation can occur in an untouched material at
relatively low stress levels. Alloying with certain metals can increase the sensitivity to stress
corrosion, and mill processing also influences susceptibility.
A special type of stress corrosion is hydrogen-assisted cracking, so-called hydrogen
embrittlement. The phenomenon is based on hydrogen absorption near the crack tip.
Hydrogen absorption leads to embrittlement of the metal and promotes formation of cracks
which may cause a severe loss of ductility and other physical properties of the metal. A
photomicrograph of severely hydrided titanium is shown in Fig. 4 (52). Hydrogen-assisted
cracking can affect zirconium, titanium, and other metals forming hydrides. The metal
becomes brittle and subject to mechanical failure. Moreover, hydrogen frequently
concentrates near dislocations, pits, cracks, or inclusions, thus leading to preferential cracking
in these areas (49). Brittle type failures in normally ductile material were shown to have
abnormal hydride contents. Under cathodic conditions, titanium is known to embrittle rapidly
and cracks, due to the formation of titanium hydride crystals. In aqueous halide-containing
solutions certain titanium alloys show reduced fracture toughness. This phenomenon is
considered by many to be a modified form of stress corrosion (52).
This disintegration mechanism depends on the nature of the metal, the electrolyte, temperature,
current density, etc. As regards Ti, the formation of TiH* is of particular importance. Atomic
hydrogen, formed on the cathodic surface, penetrates into the grain boundaries to form TiHx
(53). This ability of hydrogen to penetrate into titanium is responsible for its hydrogen
embrittlement.
Typically, the oxide film on titanium acts as an effective barrier for hydrogen penetration.
However, under conditions that allow hydrogen to enter titanium and exceed the concentration
needed to form a hydride phase (about 100 to 150 ppm), embrittlement can occur. Hydrogen
absorption has been observed in alkaline solutions at temperatures above the boiling point.
Acidic conditions that cause the oxide film to be unstable, may also result in embrittlement
13
Reproduced with permission of the copyright owner. Further reproduction prohibited without permission.
under conditions in which hydrogen is generated on the surface. The hydrogen penetration
may reduce ability to resist erosion, resulting in a higher rate of different forms of corrosion.
The presence of as little as 2% of moisture effectively prevents the absorption of hydrogen up
to temperatures as high as 31S°C. Anhydrous environments and those lacking a source of
oxygen to maintain the oxide film intact on titanium should be avoided, because absorption of
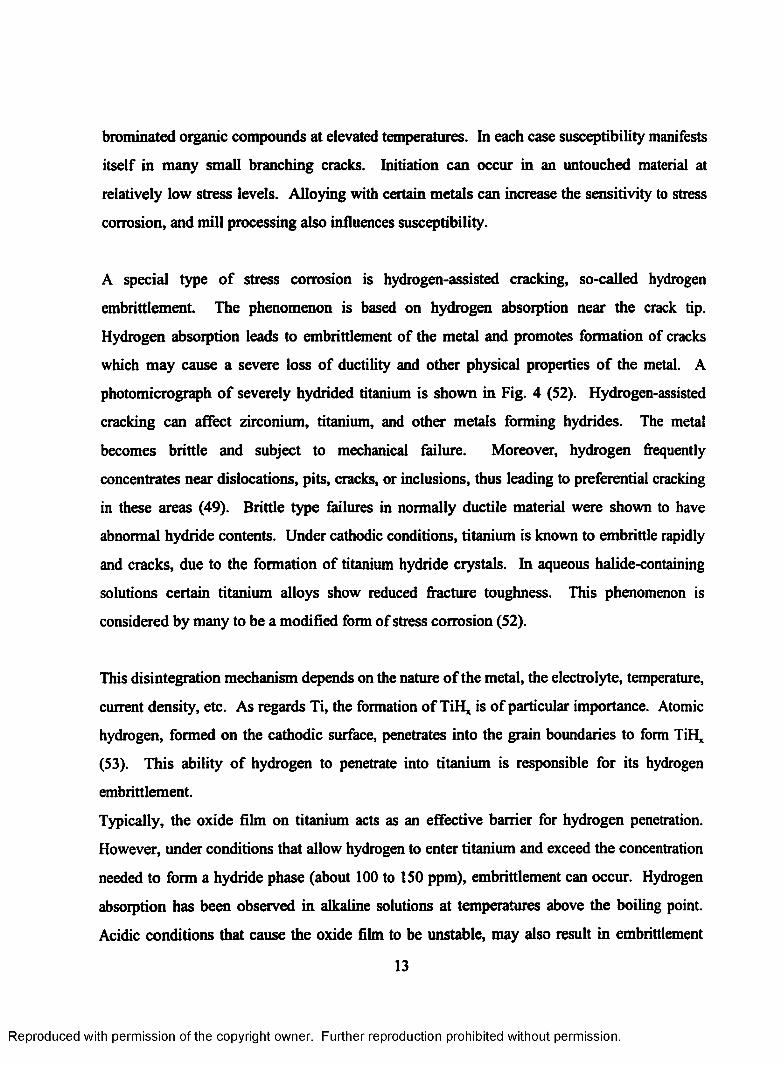
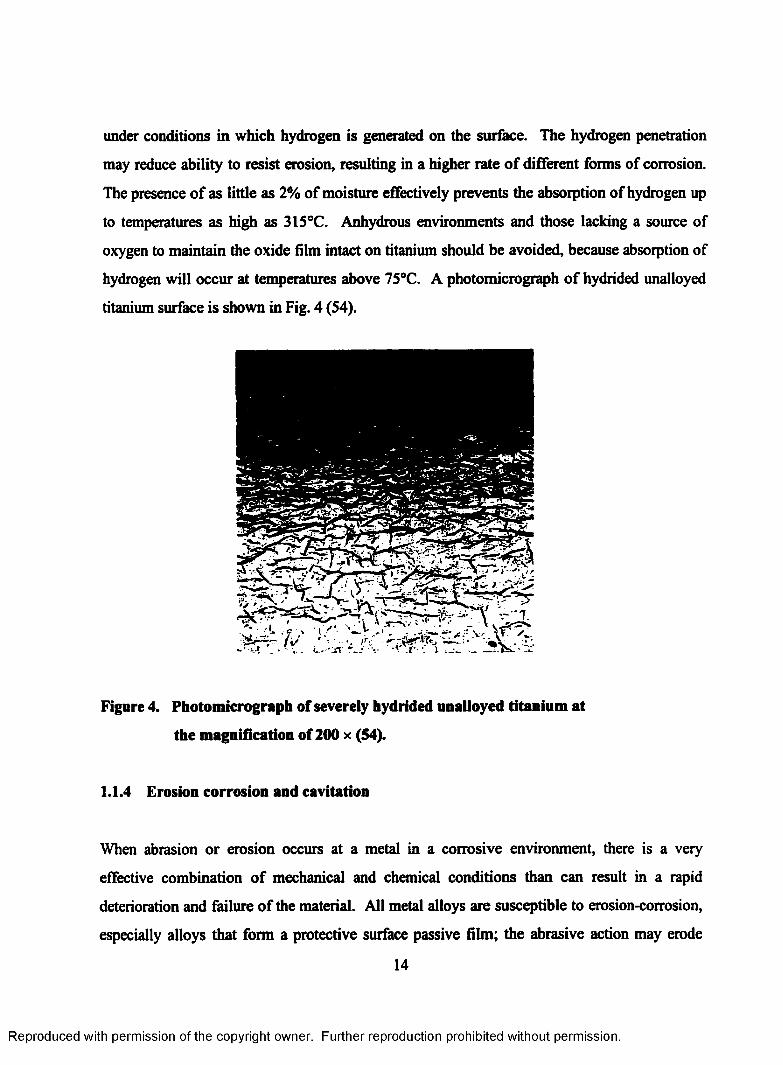
hydrogen will occur at temperatures above 7S°C. A photomicrograph of hydrided unalloyed
titanium surface is shown in Fig. 4 (54).
Figure 4. Photomicrograph of severely hydrided unalloyed titanium at
the magnification o f200 x (54).
1.1.4 Erosion corrosion and cavitation
When abrasion or erosion occurs at a metal in a corrosive environment, there is a very
effective combination of mechanical and chemical conditions than can result in a rapid
deterioration and failure of the material. All metal alloys are susceptible to erosion-corrosion,
especially alloys that form a protective surface passive film; the abrasive action may erode
14
Reproduced with permission of the copyright owner. Further reproduction prohibited without permission.
away the film, leaving a naked metal surface exposed to electrolyte. If the coating is not
capable of reforming a protective barrier, corrosion may be severe (55). In normal passive
environments, titanium is highly resistant to erosion corrosion, because of the presence of
protective surface oxide films as a barrier. The ability of an oxide film to repair itself when
damaged, also contributes to excellent resistance to erosion corrosion of titanium. The contour
of the metal surface, the amount of suspended solids, and the temperature affects the rate of the
attack (3). Recent studies have shown that initiation and propagation of fatigue micro-cracks
at the cavitated surface can play a major or even dominant role in cavitation erosion (49).
1.1.5 Localized corrosion (pitting)
Pitting corrosion is a localized corrosion that proceeds rapidly at small spots where the attack
penetrates deep into the metal. Once the pitting has started, it penetrates to the point of
perforation. Pitting is usually difficult to detect, especially in the early stage. One
characteristic feature is that pitting generally occurs on metals and alloys whose surface is in a
passive state, with severe dissolution of the metal at localized points and relatively little
dissolution of the rest of the exposed surface. Another feature is that it usually occurs in a
medium that contains aggressive anions, such as traces of fluoride or chloride ions, which
cause local breakdown of the passive surface, thus exposing the underlying metal to the
corrosive medium (48).
In the case of titanium, the protective oxide film must be destroyed before localized attack can
take place. Once the film becomes powdery and porous, the localized attack proceeds.
Titanium has good resistance to a localized attack. Although many metals pit in hypochlorites,
seawater, calcium chloride, hydrogen sulfide, and at places where surface deposits accumulate,
titanium is resistant in these circumstances (3). A general representation of the development
of pitting corrosion is shown in Fig. 5 (1).
15
Reproduced with permission of the copyright owner. Further reproduction prohibited without permission.
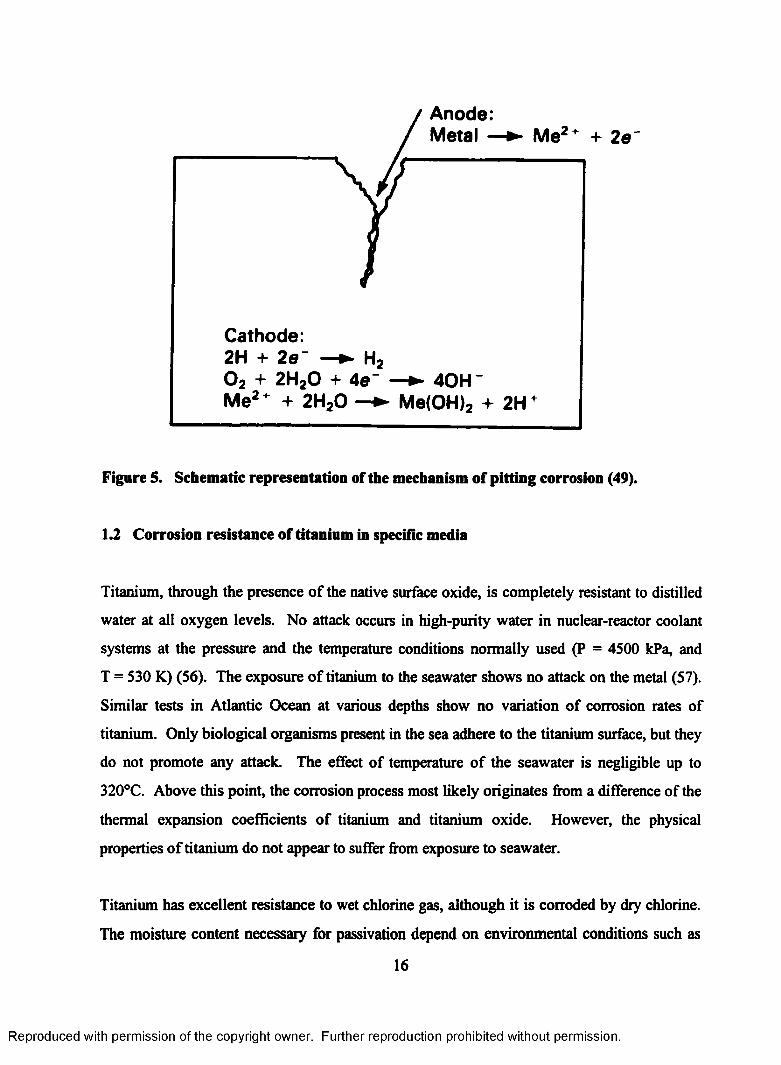
Anode: Metal - Me2* + 2e"
Cathode:2H + 2e~ —► H20 2 + 2H20 + 4e~ —► 40H~Me2" + 2H ,0 —► Me(OH), + 2H"
Figure 5. Schematic representation of the mechanism of pitting corrosion (49).
1.2 Corrosion resistance of titanium in specific media
Titanium, through the presence of the native surface oxide, is completely resistant to distilled
water at all oxygen levels. No attack occurs in high-purity water in nuclear-reactor coolant
systems at the pressure and the temperature conditions normally used (P = 4500 kPa, and
T = 530 K) (56). The exposure of titanium to the seawater shows no attack on the metal (57).
Similar tests in Atlantic Ocean at various depths show no variation of corrosion rates of
titanium. Only biological organisms present in the sea adhere to the titanium surface, but they
do not promote any attack. The effect of temperature of the seawater is negligible up to
320°C. Above this point, the corrosion process most likely originates from a difference of the
thermal expansion coefficients of titanium and titanium oxide. However, the physical
properties of titanium do not appear to suffer from exposure to seawater.
Titanium has excellent resistance to wet chlorine gas, although it is corroded by dry chlorine.
The moisture content necessary for passivation depend on environmental conditions such as
16
Reproduced with permission of the copyright owner. Further reproduction prohibited without permission.
temperature, pressure, degree of gas movement, geometry of the part, and extent of mechanical
damage to the surface oxide film. Titanium has a high degree of immunity to such media as
chlorinated brine, chlorine dioxide, chlorates, hypochlorites, and boiling solutions of sodium
chlorate. In chloride environments, titanium may suffer crevice corrosion.
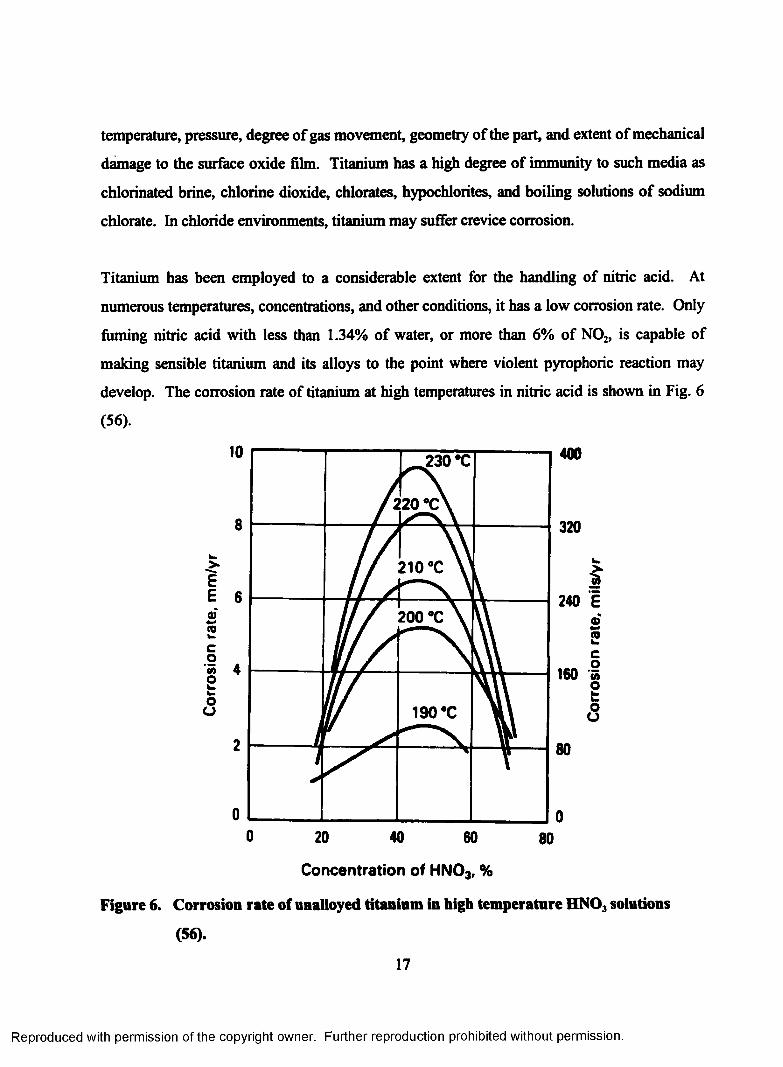
Titanium has been employed to a considerable extent for the handling of nitric acid. At
numerous temperatures, concentrations, and other conditions, it has a low corrosion rate. Only
fuming nitric acid with less than 1.34% of water, or more than 6% of N02, is capable of
making sensible titanium and its alloys to the point where violent pyrophoric reaction may
develop. The corrosion rate of titanium at high temperatures in nitric acid is shown in Fig. 6
(56).
>EEai«owCoMowh-oo
10 400230 *C
8 320
210 °C
6 240 E200 °C
4 160 «
190 aC
2
00 20 40 60 80
Concentration of HN03, %
Figure 6. Corrosion rate of unalloyed titanium in high temperature HNO, solutions
(56).
17
Reproduced with permission of the copyright owner. Further reproduction prohibited without permission.
Titanium is resistant to dilute solutions o f sulfuric acid at low temperatures. Although
laboratory test data show that the attack is severe at higher concentrations and temperatures,
titanium is used successfully where test data indicated poor performance. This phenomenon is
generally explained by the fact that minor amounts o f many metal ions such as Fe3+ and Cu2+,
often present when the acid is used in production cycles, dramatically lower the corrosive
attack on titanium. Accordingly, titanium is frequently found to be resistant in a sulfuric acid
environment. Titanium is corroded in hydrochloric acid, where the presence of ferric or cupric
ions, chromic acid or nitric acid in hydrochloric acid, can have a beneficial effect in
passivating titanium (58).
1.3 Enhancement of the corrosion resistance of titanium
Despite, in generaly, excellent corrosion properties of titanium, its use in more and more
severe and aggressive solutions requires an improvement and expansion of the corrosion
behavior of titanium. There are numerous ways of enhancing the corrosion stability of
titanium such as alloying of titanium, inhibitor addition, precious metal surface treatment,
thermal oxidation, and electrochemical oxidation.
1.3.1 Alloying of titanium
The most effective and preferred means for extending resistance to general corrosion into
reducing environments has been alloying titanium with certain elements. These additions
facilitate cathodic depolarization by providing sites o f low hydrogen overvoltage, which shift
the alloy corrosion potential towards more positive values where the formation of oxide
passive films is possible. Relatively small amounts of certain precious metals, of the order of
0.1 wt.%, are sufficient to expand significantly the corrosion resistance of titanium in reducing
media. These beneficial alloying additions have been incorporated in several commercially
available alloys including titanium-palladium alloys (grades 7 and 11), Ti-0.3Mo-0.8Ni (grade
12), Ti-3Al-8V-6Cr-4Zr-4Mo, Ti-15Mo-5Zr, and Ti-6Al-2Sn-4Zr-6Mo (51). The high-
18
Reproduced with permission of the copyright owner. Further reproduction prohibited without permission.
molybdenum alloys offer a unique combination of high strength, low density and superior
corrosion resistance.
1.3.2 Inhibitor addition
Various oxidizing species can effectively inhibit the corrosion of titanium in reducing acidic
environments when present in very small concentrations. Typical potent inhibitors for
titanium and titanium alloys in aggressive reducing acids are picric acid, m-nitroacetanilide,
trinitrobenzoic acid, oxidizing metal cations (Ti4+, Fe3+, Cu2+, Ce4+, Sn4+. ..), oxidizing anions
(C104\ Cr20 72', Mo0 42', WO4", IO3'...), precious metal cations (Pt2+, Pt4", Pd2\ Ru3+, Ir3+...).
Many of these inhibitors are effective at levels as low as 20-100 ppm, depending on the acid
concentration and temperature.
1.3.3 Precious metal surface treatment
Precious metals such as platinum and palladium can be ion plated, ion implanted, or thermally
diffused into the titanium alloy surface to achieve improved resistance to reducing acids. This
approach has not been used commercially for industrial components, because of high cost,
coating application limitations (mechanical and corrosion damage), normally associated with
very thin surface films. However, ion plated platinum or gold surface films impart significant
improvements in titanium alloy oxidation resistance at temperatures up to 650°C (59). In the
case of palladium surface treatment of titanium (Fig. 7), the addition of palladium provides
cathodic sites on the surface of titanium which tend to increase the thickness of the oxide film
and the resistance of titanium to aggressive environments (3).
19
Reproduced with permission of the copyright owner. Further reproduction prohibited without permission.
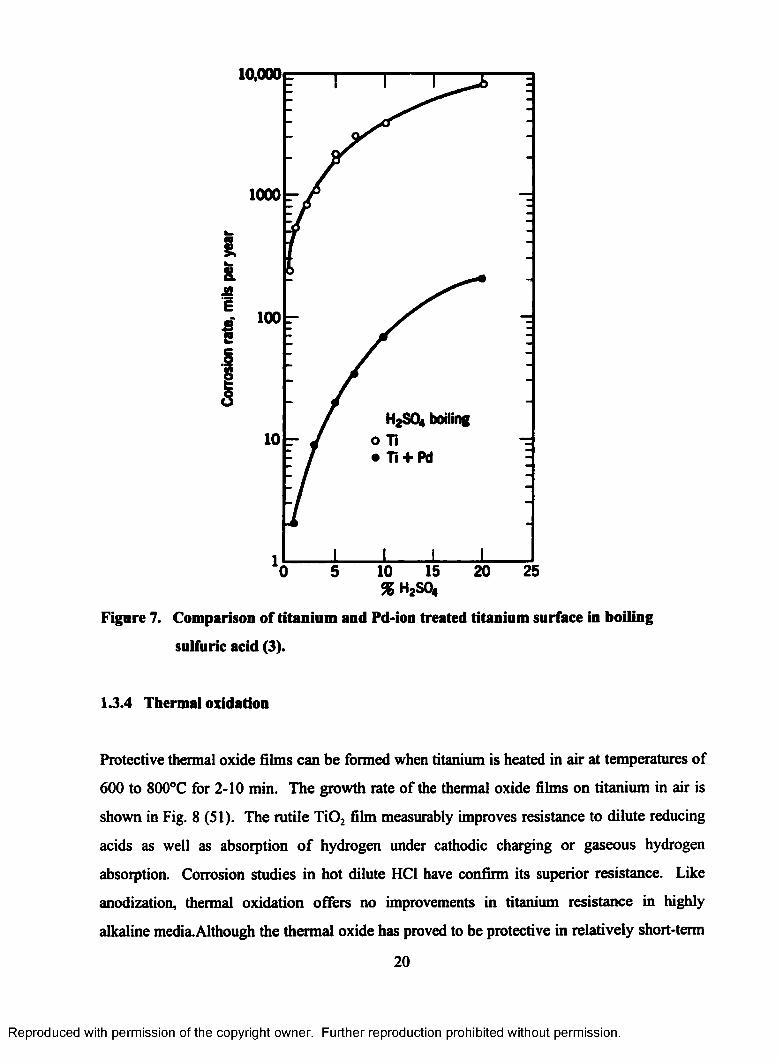
10,000
1000
M
* 100 I
HaSOti boiling o Ti• Ti + Pd
Figure 7. Comparison of titanium and Pd-ion treated titanium surface in boiling
sulfuric acid (3).
1.3.4 Thermal oxidation
Protective thermal oxide films can be formed when titanium is heated in air at temperatures of
600 to 800°C for 2-10 min. The growth rate of the thermal oxide films on titanium in air is
shown in Fig. 8 (51). The rutile T i02 film measurably improves resistance to dilute reducing
acids as well as absorption of hydrogen under cathodic charging or gaseous hydrogen
absorption. Corrosion studies in hot dilute HC1 have confirm its superior resistance. Like
anodization, thermal oxidation offers no improvements in titanium resistance in highly
alkaline media. Although the thermal oxide has proved to be protective in relatively short-term
20
Reproduced with permission of the copyright owner. Further reproduction prohibited without permission.
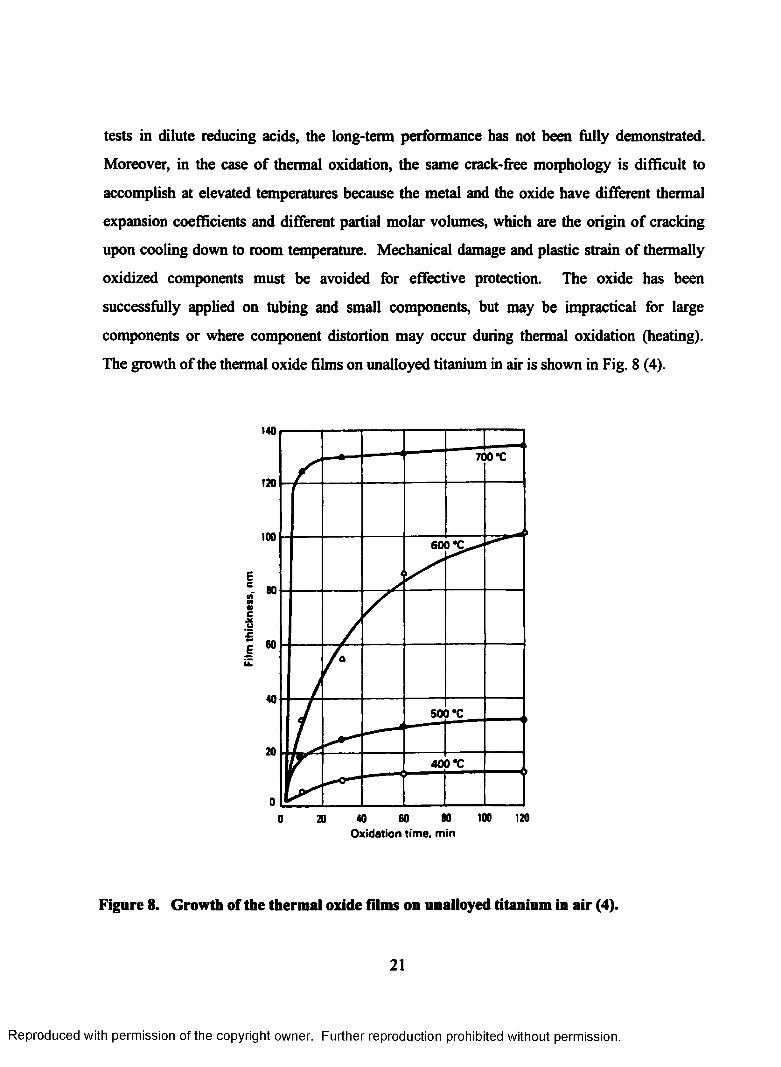
tests in dilute reducing acids, the long-term performance has not been fully demonstrated.
Moreover, in the case of thermal oxidation, the same crack-free morphology is difficult to
accomplish at elevated temperatures because the metal and the oxide have different thermal
expansion coefficients and different partial molar volumes, which are the origin of cracking
upon cooling down to room temperature. Mechanical damage and plastic strain of thermally
oxidized components must be avoided for effective protection. The oxide has been
successfully applied on tubing and small components, but may be impractical for large
components or where component distortion may occur during thermal oxidation (heating).
The growth of the thermal oxide films on unalloyed titanium in air is shown in Fig. 8 (4).
140
700 *c
120
100 600 *C
500 *C
400 *C
10080 1206040200Oxidation time, min
Figure 8. Growth of the thermal oxide films on unalloyed titanium in air (4).
21
Reproduced with permission of the copyright owner. Further reproduction prohibited without permission.
1.3.5 Electrochemical oxidation
This procedure resembles closely standard electroplating techniques. A well-established
method is DC anodization of titanium in different electrolytes (8-11, 19). During the
anodization, a current passes through the bath and oxygen evolution occurs on the anode
surface. Oxygen combines with the reactive titanium to form an oxide. This transparent oxide
increases in thickness in relation to the amount of applied voltage. While oxygen is formed on
the anode, hydrogen is generated on the cathode. The cathode may be any inert metal, but
titanium and stainless steel are also convenient.
One method of electrooxidation of titanium is an application of an alternating current (AC) in
NH4BF4 electrolyte (See Chapter 2). While the formation of oxide films on noble and non
noble metals by anodization (potentiostatic and galvanostatic), or by potential cycling is quite
well documented in the electrochemical literature, the oxide growth behavior and its
morphology and electrochemical characteristics upon application of AC polarization are not
well known or established (60). In order to properly understand the mechanism of formation
of Ti passive films and their physico-chemical properties, a careful attention must be given to
all the reactions taking place at the electrode surface upon polarization. The possible anodic
reactions are:
(a) Surface metal oxidation: Ti + ̂ H 20 -> T iO x +xe~ + xH+ (x = 2„3,4...) [1.1]
(b) Metal dissolution: Ti —► Ti+Z + ze“ [1.2]
(c) Surface fluoride formation: Ti + xF~ -> TiFx + xe“ [1.3]
(d) Oxygen evolution reaction: 2H20 -» 0 2 + 4H+ + 4e~ [1.4]
The oxidation state of titanium in oxides and fluorides may be +2, +3, or +4. It should be
emphasized that the products of the processes (a) to (c) may undergo subsequent reactions
such as: oxide dissolution, oxide conversion to a different oxide state, or oxide hydration (61).
22
Reproduced with permission of the copyright owner. Further reproduction prohibited without permission.
Also the fluorides may undergo similar reactions or dissolution forming complex compounds.
Both the surface oxide and fluoride may be influenced by the strong electric field, which
accelerates the ion (O2 , OH', or F ) migration and incorporation within it.
23
Reproduced with permission of the copyright owner. Further reproduction prohibited without permission.
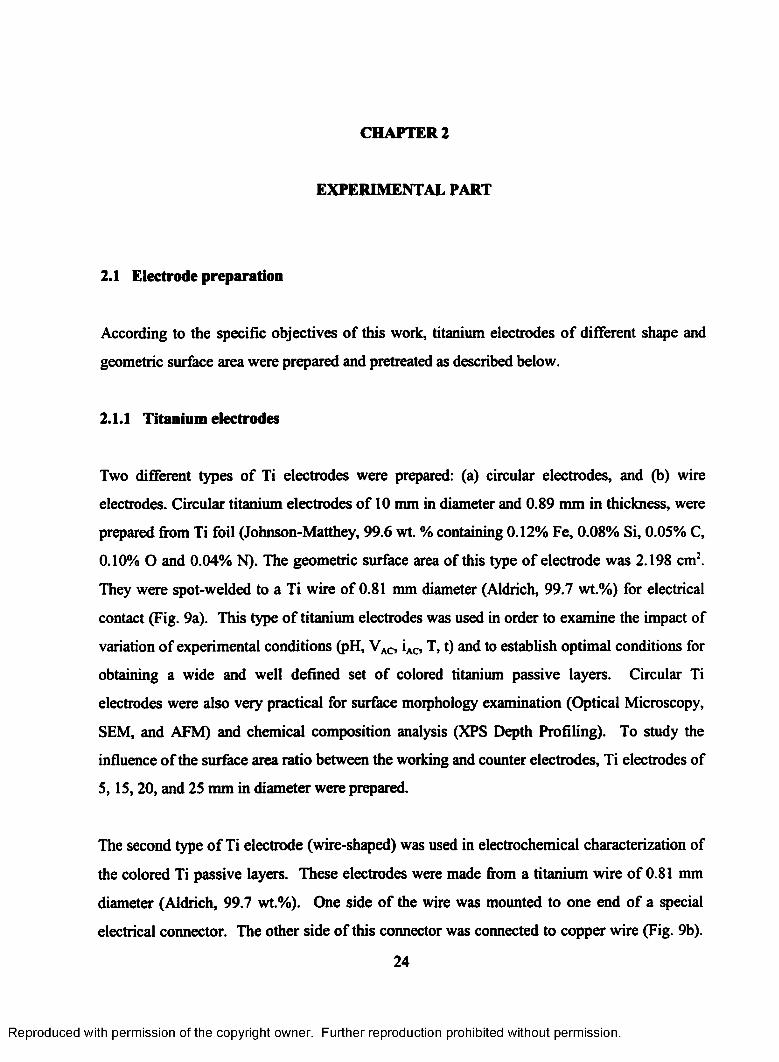
CHAPTER 2
EXPERIMENTAL PART
2.1 Electrode preparation
According to the specific objectives of this work, titanium electrodes of different shape and
geometric surface area were prepared and pretreated as described below.
2.1.1 Titanium electrodes
Two different types of Ti electrodes were prepared: (a) circular electrodes, and (b) wire
electrodes. Circular titanium electrodes of 10 mm in diameter and 0.89 mm in thickness, were
prepared from Ti foil (Johnson-Matthey, 99.6 wt. % containing 0.12% Fe, 0.08% Si, 0.05% C,
0.10% O and 0.04% N). The geometric surface area of this type of electrode was 2.198 cm2.
They were spot-welded to a Ti wire of 0.81 mm diameter (Aldrich, 99.7 wt.%) for electrical
contact (Fig. 9a). This type of titanium electrodes was used in order to examine the impact of
variation of experimental conditions (pH, VAC, iAC, T, t) and to establish optimal conditions for
obtaining a wide and well defined set of colored titanium passive layers. Circular Ti
electrodes were also very practical for surface morphology examination (Optical Microscopy,
SEM, and AFM) and chemical composition analysis (XPS Depth Profiling). To study the
influence of the surface area ratio between the working and counter electrodes, Ti electrodes of
5,15,20, and 25 mm in diameter were prepared.
The second type of Ti electrode (wire-shaped) was used in electrochemical characterization of
the colored Ti passive layers. These electrodes were made from a titanium wire of 0.81 mm
diameter (Aldrich, 99.7 wt.%). One side of the wire was mounted to one end of a special
electrical connector. The other side of this connector was connected to copper wire (Fig. 9b).
24
Reproduced with permission of the copyright owner. Further reproduction prohibited without permission.
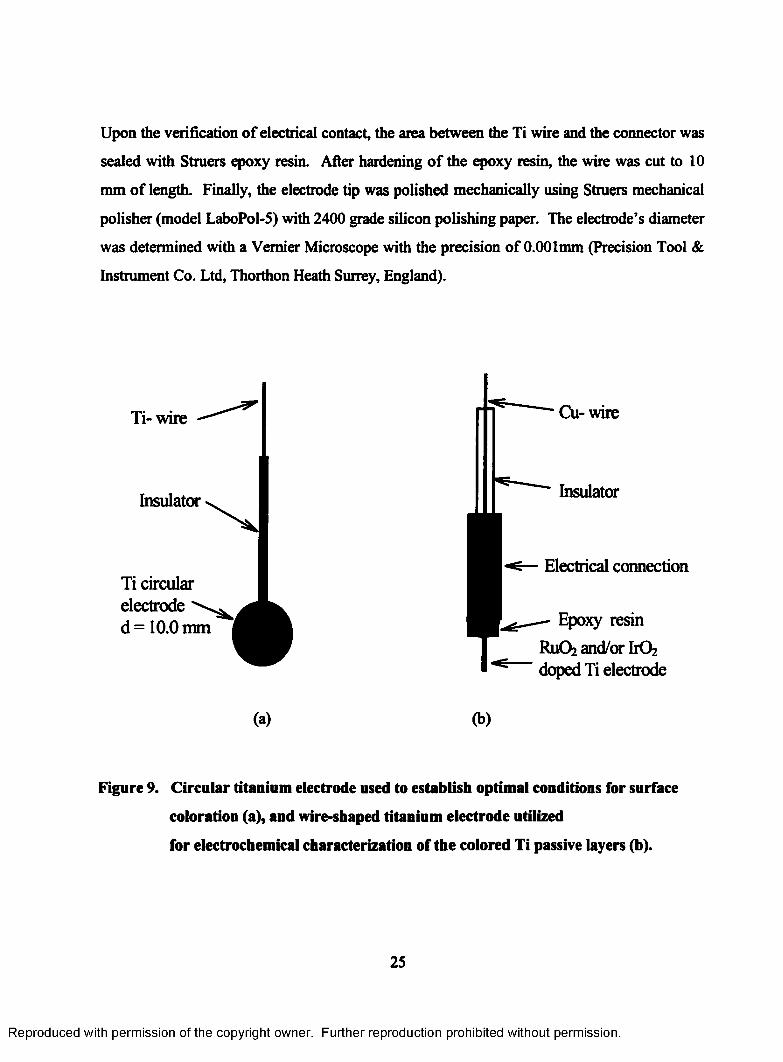
Upon the verification of electrical contact, the area between the Ti wire and the connector was
sealed with Struers epoxy resin. After hardening of the epoxy resin, the wire was cut to 10
mm of length. Finally, the electrode tip was polished mechanically using Struers mechanical
polisher (model LaboPol-5) with 2400 grade silicon polishing paper. The electrode’s diameter
was determined with a Vernier Microscope with the precision of 0.001mm (Precision Tool &
Instrument Co. Ltd, Thorthon Heath Surrey, England).
Ti-wire
Insulator
Ti circular electrode d= 10.0 mm
Cu- wire
Insulator
Electrical connection
Epoxy resinRuOz and/or I1O2
doped Ti electrode
(a) (b)
Figure 9. Circular titanium electrode used to establish optimal conditions for surface
coloration (a), and wire-shaped titanium electrode utilized
for electrochemical characterization of the colored Ti passive layers (b).
25
Reproduced with permission of the copyright owner. Further reproduction prohibited without permission.
Both types of electrode were pretreated similarly. The electrodes were degreased in acetone
under reflux in order to remove any organic impurities. Subsequently, they were etched for 1-
2 min. in solution made horn 30 cm3 of concentrated HF and SO cm3 of concentrated HN03
diluted to 1000 cm3 with H20; afterward, they were rinsed with Nanopure water, 18 (62).
To avoid any traces of the aggressive etching solution, which, with time, can damage and
dissolve the colored passive layer, the Ti electrodes were sonicated in an ultrasonic bath
(Branson) for 1 min, and than rinsed again carefully with Nanopure water.
2.1.2 Ru0 2 or/and Ir02 doped titanium passive-layer electrodes
Titanium wire (Aldrich Chemical Co. 99.7%) of 0.81mm diameter and 25 mm length was
mechanically polished, chemically degreased and etched as described in Section 2.1.1. Such a
pretreated electrode was ready for AC polarization. It was polarized by application of a given
AC voltage in aq. NH4 BF4 7.5 wt. %. In this case, the time of AC polarization was 10 sec.,
and the applied AC voltage was 20,40, and 60 V, respectively (60).
After the preparation of the colored Ti passive layers, thermal decomposition technique was
applied to deposit Ru02, Ir02, and Ru02+Ir02 layers. The AC-colored electrode was
immersed in 20% HC1 aqueous solution of 0.1 M RuC13 x H20 (Aldrich), 20% HC1 aqueous
solution of 0.1 M IrCl3 x 3H20 (Aldrich), or 1:1 (by volume) mixture of these solutions. After
immersion, the electrode was dried at 80°C for 15 min. After each drying procedure, the layer
was treated in a furnace (air environment) at 450°C for 15 min (Fig. 10a). Three subsequent
immersions and heating procedures were applied to increase the thickness of the deposit and
the Ru, Ir, or Ru+Ir loading. After the deposition of the third layer, the material was annealed
at 450°C for 1 hour (Fig. 10b).
After the thermal treatment, the electrodes (25mm in length) were connected to a copper wire
using an electrical connector to get a good electrical contact, degreased and sealed with Struers
Epofix resin (See Fig. 9b).
26
Reproduced with permission of the copyright owner. Further reproduction prohibited without permission.
3 Treatment450 °C
15 min 60 min15 min
t
Figure 10. Schematic representation of the thermal treatment procedure applied
to prepare Ru02, IrOz, and Ru02+ Ir02 doped colored Ti passive-layer
electrodes : (a) furnace used for thermal decomposition, (b) three-step
program applied during the thermal treatment procedure.
2.2 Electrolyte and cell for AC polarization
The solution was prepared by dilution of analytical grade NH4BF4 (97 wt. % Aldrich) or by
neutralizing HBF4 (48 wt. % Aldrich) with NH4OH (29 wt. % Aldrich) in stoichiometric
proportions. In this solution, the electrolyte anion is principally BF4~. A one-compartment
27
Reproduced with permission of the copyright owner. Further reproduction prohibited without permission.
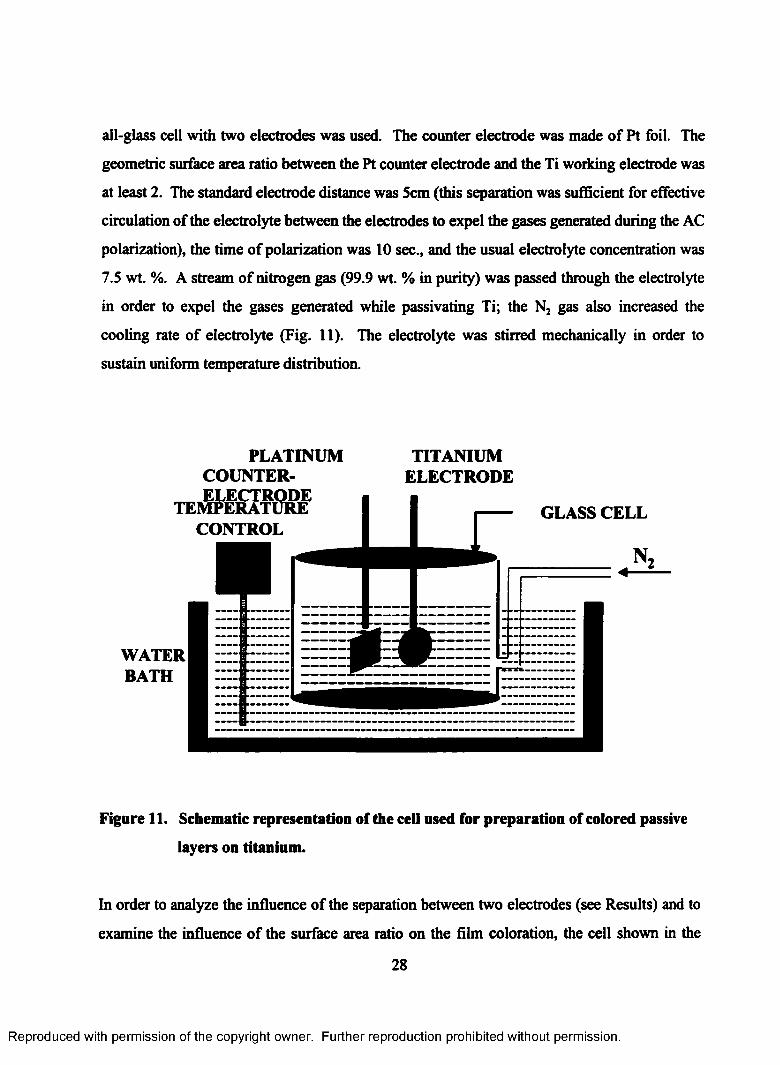
all-glass cell with two electrodes was used. The counter electrode was made of Pt foil. The
geometric surface area ratio between the Pt counter electrode and the Ti working electrode was
at least 2. The standard electrode distance was Scm (this separation was sufficient for effective
circulation of the electrolyte between the electrodes to expel the gases generated during the AC
polarization), the time of polarization was 10 sec., and the usual electrolyte concentration was
7.5 wt. %. A stream of nitrogen gas (99.9 wt. % in purity) was passed through the electrolyte
in order to expel the gases generated while passivating Ti; the N2 gas also increased the
cooling rate of electrolyte (Fig. 11). The electrolyte was stirred mechanically in order to
sustain uniform temperature distribution.
PLATINUM TITANIUMCOUNTER- ELECTRODE
GLASS CELLCONTROL
WATER
Figure 11. Schematic representation of the cell used for preparation of colored passive
layers on titanium.
In order to analyze the influence of the separation between two electrodes (see Results) and to
examine the influence of the surface area ratio on the film coloration, the cell shown in the
28
Reproduced with permission of the copyright owner. Further reproduction prohibited without permission.
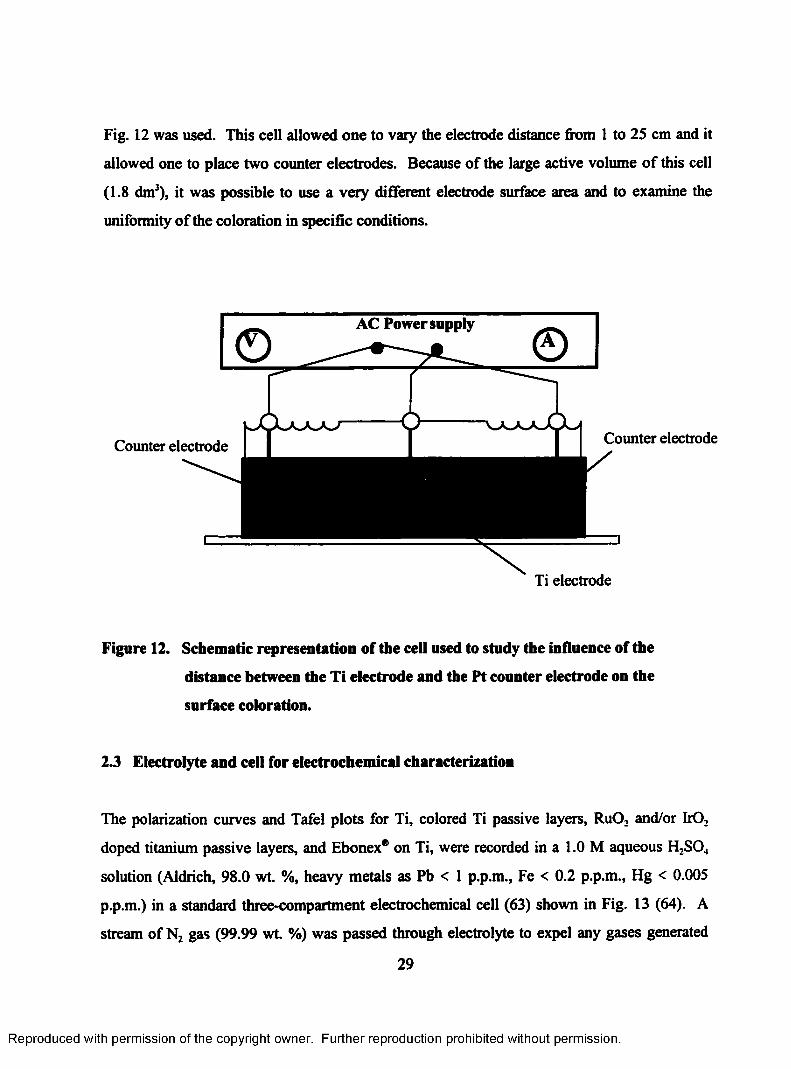
Fig. 12 was used. This cell allowed one to vary the electrode distance from 1 to 25 cm and it
allowed one to place two counter electrodes. Because of the large active volume of this cell
(1.8 dm3), it was possible to use a very different electrode surface area and to examine the
uniformity of the coloration in specific conditions.
AC Power supply
Counter electrodeCounter electrode
Ti electrode
Figure 12. Schematic representation of the cell used to study the influence of the
distance between the Ti electrode and the Pt counter electrode on the
surface coloration.
2.3 Electrolyte and cell for electrochemical characterization
The polarization curves and Tafel plots for Ti, colored Ti passive layers, RuO, and/or IrO,
doped titanium passive layers, and Ebonex® on Ti, were recorded in a 1.0 M aqueous H2S04
solution (Aldrich, 98.0 wt. %, heavy metals as Pb < 1 p.p.m., Fe < 0.2 p.p.m., Hg < 0.005
p.p.m.) in a standard three-compartment electrochemical cell (63) shown in Fig. 13 (64). A
stream of N2 gas (99.99 wt. %) was passed through electrolyte to expel any gases generated
29
Reproduced with permission of the copyright owner. Further reproduction prohibited without permission.
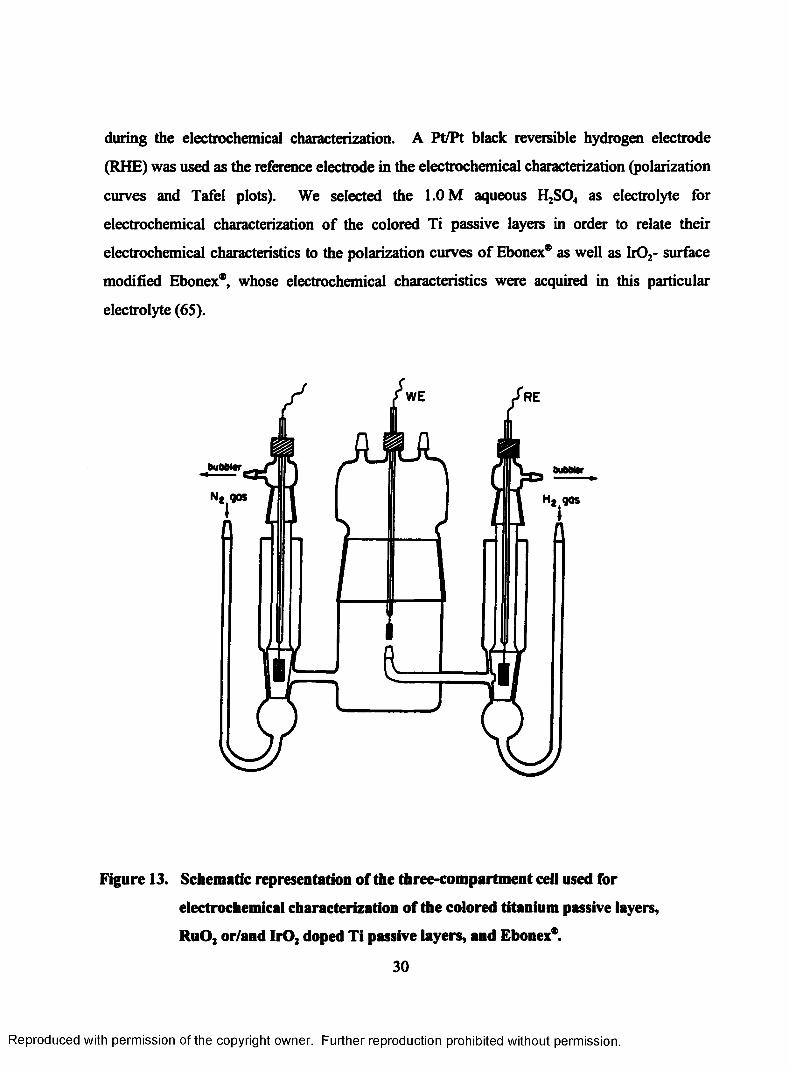
during the electrochemical characterization. A Pt/Pt black reversible hydrogen electrode
(RHE) was used as the reference electrode in the electrochemical characterization (polarization
curves and Tafel plots). We selected the 1.0 M aqueous H2S04 as electrolyte for
electrochemical characterization of the colored Ti passive layers in order to relate their
electrochemical characteristics to the polarization curves of Ebonex® as well as Ir02- surface
modified Ebonex*, whose electrochemical characteristics were acquired in this particular
electrolyte (65).
WE RE
Figure 13. Schematic representation of the three-compartment cell used for
electrochemical characterization of the colored titanium passive layers,
Ru0 2 or/and Ir02 doped Ti passive layers, and Ebonex*.
30
Reproduced with permission of the copyright owner. Further reproduction prohibited without permission.
2.4 Instrumentation for colored Ti layer preparation
The Ti coloration was accomplished using a variable AC power supply, 60 Hz (Vector-Vid,
Instrument Division, model WP32) and the AC voltage was monitored by means of a
multimeter (Fluke 45). The current passing during the polarization was controlled with a
digital ammeter (Phillips). The voltage applied was in the 5 - 90 V range and the current
density measured with respect to the geometric surface area, was from 230 mA cm'2 to 2800
mA cm'2. The coloration of titanium by DC polarization was accomplished using a DC power
supply (6034A system power supply, Hewlett Packard) in electrical circuit with the same
multimeters used in the case of the AC polarization of Ti.
It should be emphasized that it was essential to sustain a constant temperature in order to
achieve passive films of uniform thickness and coloration. Because the Ti passivation was
carried out at high current densities, heat was generated during the process and it was
necessary to cool the cell by its immersion in a thermostated water bath (Haake B3).
2.5 Instrumentation for electrochemical characterization
Electrochemical characterization was carried out using EG&G model 273 potentiostat. EG&G
M270 and M353 electrochemical and corrosion software packages were used to control the
experimental parameters and to acquire the data. Polarization curves of the wire-shaped Ti
electrodes in 1.0 M aqueous H2S04 solution were obtained in the - 0.8 - 3.2 V, RHE, potential
range. Tafel polarization measurements were conducted in the 0.0 - (- 0.8) V, RHE, potential
range in order to assess the activity of the colored Ti towards the HER. In these
measurements, the counter electrode was made of a platinum gauze and its surface area was
over 10 times that of the Ti electrodes. All current densities are reported with respect to the
geometric surface area of the passivated Ti electrodes.
31
Reproduced with permission of the copyright owner. Further reproduction prohibited without permission.
2.6 Instrumentation and techniques for morphology and surface composition analysis
The examination of the morphology of Ti and colored Ti passive layers, Ru02 and/or Ir02
doped layers, and also Ebonex* on Ti, was carried out by means of Optical Microscopy,
Scanning Electron Microscopy, and Atomic Force Microscopy. Surface-chemical
composition of the electrodes was examined by X-Ray Photoelectron Spectroscopy coupled
with Ar+-ion depth profiling.
2.6.1 Optical Microscopy
An optical microscopy analysis was carried out using a SEIWA Optical, Correct Metallurgical
Microscope, model SDM-TR in order to analyze the uniformity of the surface coloration and
the morphology of the colored Ti passive layers. The electrodes were analyzed at different
magnifications from SO x to 600 x.
Three-dimensional optical microscopy analysis was performed using an optical microscope,
model New View 5000 Zygo (Zygo Corporation, USA). This analysis was carried out to
generate quantitative three-dimensional images. The principle of the technique is based on
scanning white-light interferometry, a traditional technique in which a pattern of dark and
bright lines (fringes) result from an optical path difference between a reference and a sample
beam. The incoming light is split inside an interferometer, one beam going to an internal
reference surface, and the other one to our sample. After reflection, the beams recombine
inside the interferometer, undergoing constructive and destructive interference and producing
light and dark patterns. This type of analysis gives information not only about the topography
of the samples, but also about their roughness showing high quality 3D images. The results of
the analysis are presented as a filled contour plot (two-dimensional plot, which shows the
surface heights as viewed along the instrument’s z-axis top view). Different height is
represented by different colors. The red shows high points and the violet, low points. The
horizontal lines found in the filled contour plot represent the cross-section found in the profile
32
Reproduced with permission of the copyright owner. Further reproduction prohibited without permission.
plot. Solid plot displays surface area data as a function of the slope as viewed along the
instrument's z-axis. Areas with different slopes are represented by different shades. The
profile plot shows two-dimensional slices through the filled plot. The x-axis shows lateral
dimensions. The y-axis provides the height information. Ti and Ti colored passive films
samples were analyzed at different magnifications (100 x and 1000 x), working distance 3.4
mm, lateral resolution 0.64 pm and field of view 0.14 x 0.11mm.
2.6.2 Scanning Electron Microscopy (SEM)
As a tool for examining surfaces, the scanning electron microscope (SEM) offers two major
advantages over the optical microscope: (a) an improvement in resolution, and (b) a depth of
field. This technique provides images at magnifications up to 100 000 x and a resolution of
features down to 3 nm, depending on the sample. SEM is a very useful technique in
observation of grain boundaries on etched and unetched samples, in an analysis of the
morphology of ferromagnetic materials, and in evaluation of the crystallographic orientation of
grains with diameter down to 2 to 10 pm. A scanning electron microscope JEOL, model JSM
840-A in topography mode, was used in surface analysis of the colored Ti passive layers, Ru02
and/or IrOz doped layers, and also for the examination of the morphology of Ebonex* on Ti.
The magnification in the SEM analysis was 1000, 3000, and 10 000 x. The JEOL scanning
electron microscope allowed one to perform a bulk chemical analysis via the Electron
Diffraction Analysis (EDX). This analysis was used in order to verify the extent of doping the
colored Ti passive layer with RuOz or/and Ir02.
2.6.3 Atomic Force Microscopy (AFM)
AFM allows us to perform surface morphology analysis at magnifications not attainable by
SEM. This method is particularly useful for analyzing thin and thick film coatings, ceramics,
composites, glasses, synthetic and biological membranes, metals, polymers, and
33
Reproduced with permission of the copyright owner. Further reproduction prohibited without permission.
semiconductors. The AFM can be applied to study phenomena such as abrasion, adhesion,
cleaning, corrosion, etching, friction, lubrication, plating, and polishing.
Titanium passive layers formed by AC polarization were analyzed by using Digital
Instruments, NanoScope EH Atomic Force Microscope. The most common mode, so called,
the contact mode, where the tip scans the sample in close contact with the surface, was applied
for the analysis of colored titanium passive layers. In AFM, an atomically sharp tip is scanned
over a surface with feedback mechanisms that enable the piezo-electric scanners to maintain
the tip at a constant force (to obtain height information), or height (to obtain force information)
above the sample surface. Tips are typically made from Si3N4 or Si. As the tip scans the
surface of the sample, moving up and down with the contour of the surface, the laser beam is
deflected into a dual element photodiode. The photodetector measures the difference in light
intensities between the upper and lower photodetectors, and then converts to voltage.
Feedback from the photodiode difference signal, through software control from the computer,
enables the tip to maintain either a constant force or a constant height above the sample. In the
constant force mode, the piezo-electric transducer monitors real time height deviation. In the
constant height mode, the deflection force on the sample is recorded. The latter mode of
operation requires calibration parameters of the scanning tip to be inserted in the sensitivity of
the AFM head during force calibration of the microscope (6 6 ).
2.6.4 X-ray Photoelectron Spectroscopy (XPS/ESCA)
The chemical composition of titanium oxide layers formed under electrochemical or gas-phase
conditions can be evaluated by means of Auger electron spectroscopy (AES) and X-ray
photoelectron spectroscopy (XPS). XPS or ESCA (Electron Spectroscopy for Chemical
Analysis) is a technique which gives the elemental analysis of a surface, identification of
chemical state of surface species, in-depth composition profiles in thin films, or determination
of oxidation states of metal atoms in metal oxide surface films (IS).
34
Reproduced with permission of the copyright owner. Further reproduction prohibited without permission.
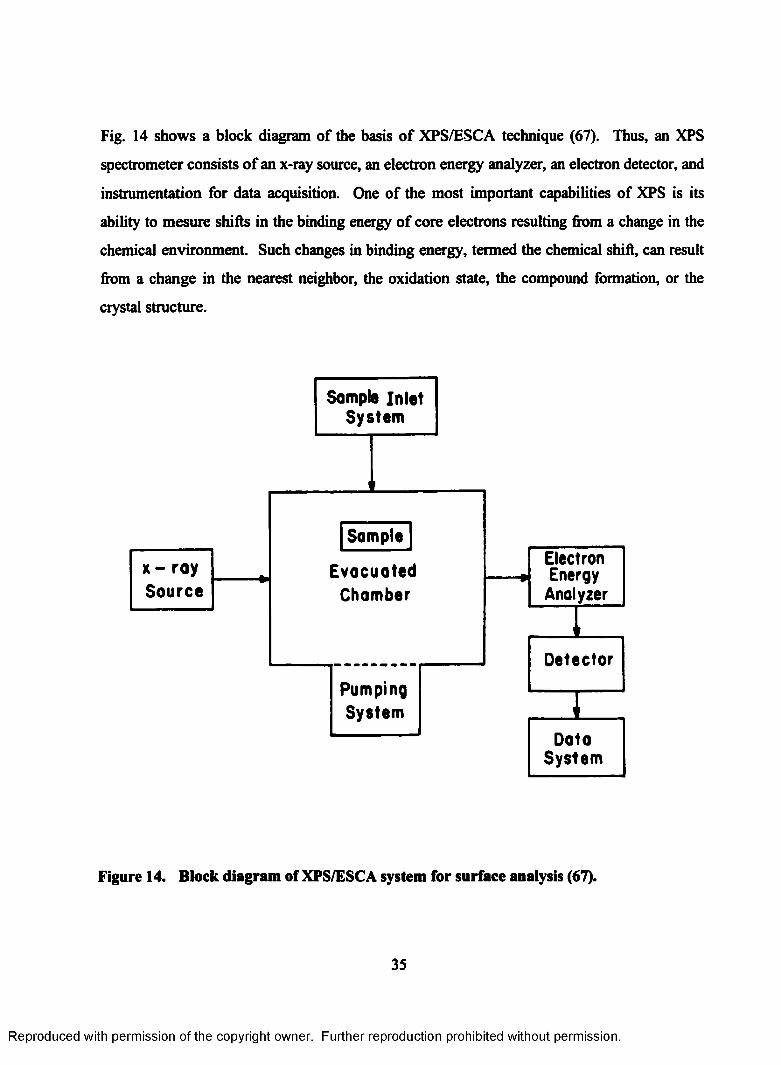
Fig. 14 shows a block diagram of the basis of XPS/ESCA technique (67). Thus, an XPS
spectrometer consists of an x-ray source, an electron energy analyzer, an electron detector, and
instrumentation for data acquisition. One of the most important capabilities of XPS is its
ability to mesure shifts in the binding energy of core electrons resulting from a change in the
chemical environment. Such changes in binding energy, termed the chemical shift, can result
from a change in the nearest neighbor, the oxidation state, the compound formation, or the
crystal structure.
EvacuatedChamber
PumpingSystem
Somple
x - ray Source
Detector
DataSystem
ElectronEnergy
Analyzer
Sample inlet System
Figure 14. Block diagram of XPS/ESCA system for surface analysis (67).
35
Reproduced with permission of the copyright owner. Further reproduction prohibited without permission.
The XPS depth profile analysis was of particular importance for this project, because this
aspect of ESCA gives the information about the thickness (d/nm) of the colored passive layers
in relation to the applied AC voltage. A way of obtaining a depth-composition profile is to
bombard the sample with a beam of inert gas ions, usually argon or xenon. Sputtering rates
can be varied from a few angstroms per minute to several hundred angstroms per minute by
changing the ion current and the accelerating potential. The surface-chemical composition and
depth profile analysis (6 8 ) were conducted on colored Ti samples transferred via air using a
fully automated PHI Quantum 2000 Scanning ECSA Microprobe. The X-ray beam was of 200
pm in diameter. Photoelectrons were generated by A1 (K ^ ) X-ray radiation (energy of
1486.6 eV) at 50 W of power and the calibration was based on the C (Is) spectrum at the 284.8
eV binding energy (69-71). First, a survey spectrum of each Ti sample was acquired followed
by a high-resolution spectra acquisition. Each sample was sputter depth profiled using 3 keV
Ar ion beam and Zalar Rotation™. The unique Zalar Rotation™ system allowed us to
minimize sputter-induced surface roughening and to enhance interface resolution. Survey and
high-resolution spectra were acquired at each stage of depth profiling. XPS spectra were
treated using the PHI MultiPak™ linear least squares (LLS) fitting routines. The Ti XPS
spectrum did not represent a single spectrum and was deconvolved into two components, one
characteristic of Ti^ and one of Ti° (metallic Ti). The positions of the following XPS lines
were considered in the depth profile evaluation: Ti (2p3/2), Ti (2p1/2), O (Is), F (Is), and C (Is).
The binding energy and the chemical shift of each XPS line were compared to the standards
and the data were sensitivity-factor corrected. Based on the sensitivity-factor corrected XPS
data, we evaluated the O to Ti atomic ratio, No/NTl, in relation to the AC voltage applied to
form the colored passive layers (the amount of Ti bound to O was corrected for a small amount
of Ti bound to F). Finally, the thickness of each passive layer was determined by measuring
the depth at which the intensity of the O (Is) signal dropped to 50% of its maximal value.
36
Reproduced with permission of the copyright owner. Further reproduction prohibited without permission.
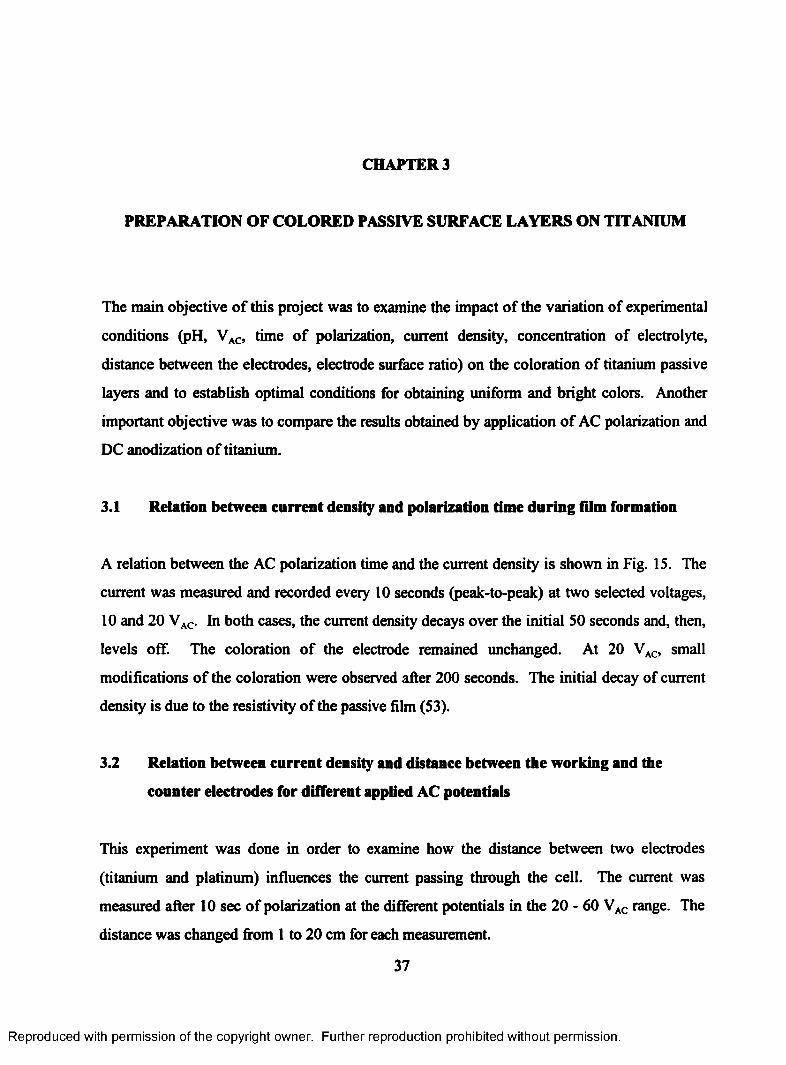
CHAPTER 3
PREPARATION OF COLORED PASSIVE SURFACE LAYERS ON TITANIUM
The main objective of this project was to examine the impact of the variation of experimental
conditions (pH, VAC, time of polarization, current density, concentration of electrolyte,
distance between the electrodes, electrode surface ratio) on the coloration of titanium passive
layers and to establish optimal conditions for obtaining uniform and bright colors. Another
important objective was to compare the results obtained by application of AC polarization and
DC anodization of titanium.
3.1 Relation between current density and polarization time during film formation
A relation between the AC polarization time and the current density is shown in Fig. 15. The
current was measured and recorded every 1 0 seconds (peak-to-peak) at two selected voltages,
10 and 20 VAC. In both cases, the current density decays over the initial 50 seconds and, then,
levels off. The coloration of the electrode remained unchanged. At 20 VAC, small
modifications of the coloration were observed after 200 seconds. The initial decay of current
density is due to the resistivity of the passive film (53).
3.2 Relation between current density and distance between the working and the
counter electrodes for different applied AC potentials
This experiment was done in order to examine how the distance between two electrodes
(titanium and platinum) influences the current passing through the cell. The current was
measured after 10 sec of polarization at the different potentials in the 20 - 60 VAC range. The
distance was changed from 1 to 2 0 cm for each measurement.
37
Reproduced with permission of the copyright owner. Further reproduction prohibited without permission.
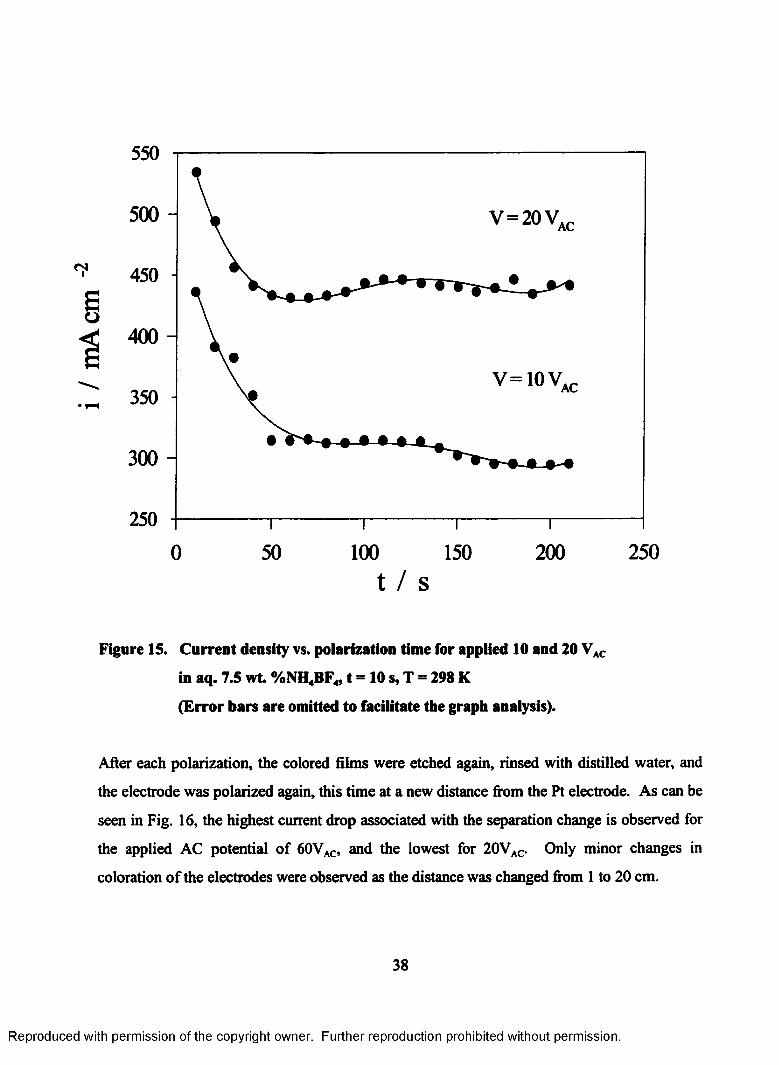
550
500 V =20 V,AC
450
§400
350
300
250
0 50 100 150 200 250t / S
Figure IS. Current density vs. polarization time for applied 10 and 20 VAC in aq. 7.5 w t %NH4BF4, t = 10 s, T = 298 K
(Error bars are omitted to facilitate the graph analysis).
After each polarization, the colored films were etched again, rinsed with distilled water, and
the electrode was polarized again, this time at a new distance from the Pt electrode. As can be
seen in Fig. 16, the highest current drop associated with the separation change is observed for
the applied AC potential of 60VAC, and the lowest for 20VAC. Only minor changes in
coloration of the electrodes were observed as the distance was changed from 1 to 2 0 cm.
38
Reproduced with permission of the copyright owner. Further reproduction prohibited without permission.
2400
2000 -
1600 -
o<£
1200 -
♦ ♦800 -
400 -
252010 150 5
d / cm
Figure 16. Current density vs. distance between the working and the counter electrodes
for different applied AC potentials from 20 to 60 VAC in aq. 7.5 wt
%NH4BF4 for t = 10 s, T = 298 K.
(Error bars are omitted to facilitate the graph analysis).
3.3 Comparison of Ti surface coloration accomplished by AC and DC polarization
These experiments were carried out in order to compare the impact of two different types of
polarization (AC vs. DC) while maintaining other parameters constant. Because of the
different properties of the AC and DC polarization (19), we have noticed that to achieve the
same coloration (the coloration was determined by eye), it was necessary to apply a 2 0 %
higher DC voltage than the AC voltage (Fig. 17). This could be explained by the different
nature of AC and DC current. In the case of DC current, the current passes only in one
39
Reproduced with permission of the copyright owner. Further reproduction prohibited without permission.
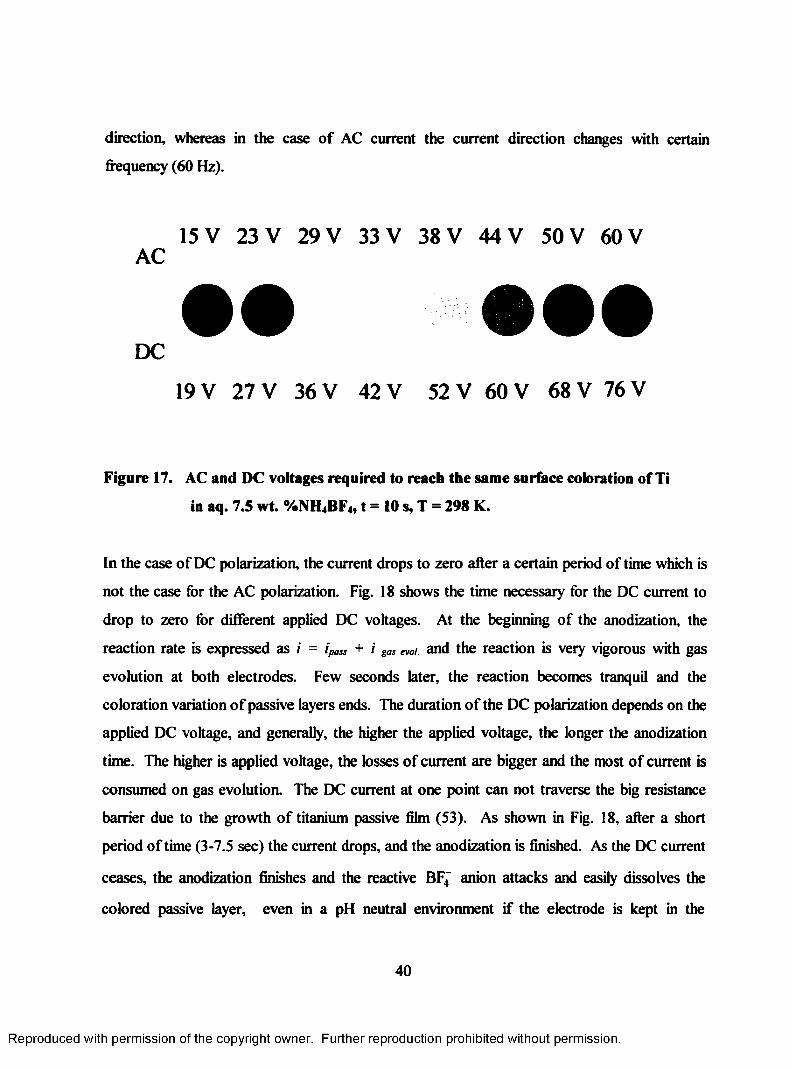
direction, whereas in the case of AC current the current direction changes with certain
frequency (60 Hz).
15 V 23 V 29 V 33 V 38 V 44 V 50 V 60 V AC
DC
19 V 27 V 36 V 42 V 52 V 60 V 68 V 76 V
Figure 17. AC and DC voltages required to reach the same surface coloration of Ti
in aq. 7.5 wt. %NH4BF4, t = 1 0 s, T = 298 K.
In the case of DC polarization, the current drops to zero after a certain period of time which is
not the case for the AC polarization. Fig. 18 shows the time necessary for the DC current to
drop to zero for different applied DC voltages. At the beginning of the anodization, the
reaction rate is expressed as / = ipaSs + i gas ewi. and the reaction is very vigorous with gas
evolution at both electrodes. Few seconds later, the reaction becomes tranquil and the
coloration variation of passive layers ends. The duration of the DC polarization depends on the
applied DC voltage, and generally, the higher the applied voltage, the longer the anodization
time. The higher is applied voltage, the losses of current are bigger and the most of current is
consumed on gas evolution. The DC current at one point can not traverse the big resistance
barrier due to the growth of titanium passive film (53). As shown in Fig. 18, after a short
period of time (3-7.5 sec) the current drops, and the anodization is finished. As the DC current
ceases, the anodization finishes and the reactive BF4 anion attacks and easily dissolves the
colored passive layer, even in a pH neutral environment if the electrode is kept in the
40
Reproduced with permission of the copyright owner. Further reproduction prohibited without permission.
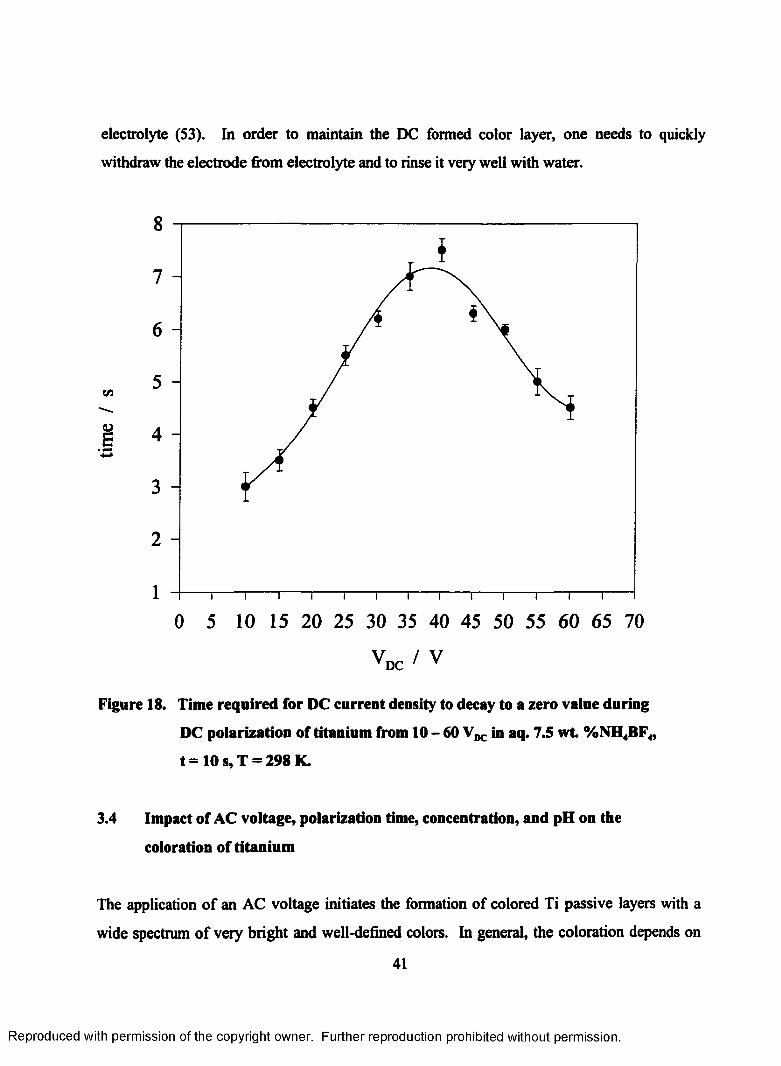
electrolyte (S3). In order to maintain the DC formed color layer, one needs to quickly
withdraw the electrode from electrolyte and to rinse it very well with water.
8
7
6
U A
. i 4S
3
2
1
0 5 10 15 20 25 30 35 40 45 50 55 60 65 70
V / VDC V
Figure 18. Time required for DC current density to decay to a zero value during
DC polarization of titanium from 10 - 60 in aq. 7.5 w t %NH4BF4,
t = 10 s, T = 298 K.
3.4 Impact of AC voltage, polarization time, concentration, and pH on the
coloration of titanium
The application of an AC voltage initiates the formation of colored Ti passive layers with a
wide spectrum of very bright and well-defined colors. In general, the coloration depends on
41
t i i i i i i i i r
Reproduced with permission of the copyright owner. Further reproduction prohibited without permission.
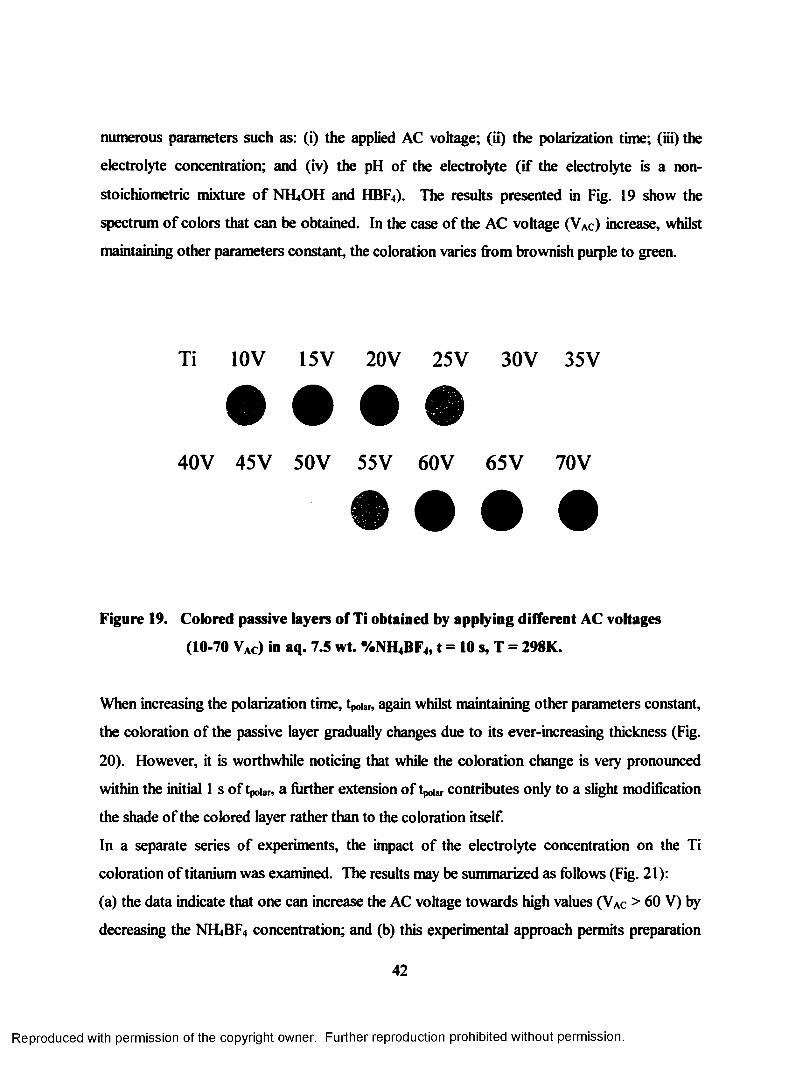
numerous parameters such as: (0 the applied AC voltage; (ii) the polarization time; (iii) the
electrolyte concentration; and (iv) the pH of the electrolyte (if the electrolyte is a non-
stoichiometric mixture of NH4OH and HBF4). The results presented in Fig. 19 show the
spectrum of colors that can be obtained. In the case of the AC voltage ( V a c ) increase, whilst
maintaining other parameters constant, the coloration varies from brownish purple to green.
Ti 10 V 15V 20 V 25 V 30 V 35 V
• • • •40V 45V 50V 55V 60V 65V 70V
Figure 19. Colored passive layers of Ti obtained by applying different AC voltages
(10-70 V ac) in aq. 7.5 wt. %NH4 BF4, t = 10 s, T = 298K.
When increasing the polarization time, tpoiar, again whilst maintaining other parameters constant,
the coloration of the passive layer gradually changes due to its ever-increasing thickness (Fig.
20). However, it is worthwhile noticing that while the coloration change is very pronounced
within the initial 1 s of tpoiar, a further extension of tpoiar contributes only to a slight modification
the shade of the colored layer rather than to the coloration itself.
In a separate series of experiments, the impact of the electrolyte concentration on the Ti
coloration of titanium was examined. The results may be summarized as follows (Fig. 21):
(a) the data indicate that one can increase the AC voltage towards high values (VAc > 60 V) by
decreasing the NIi»BF4 concentration; and (b) this experimental approach permits preparation
42
Reproduced with permission of the copyright owner. Further reproduction prohibited without permission.
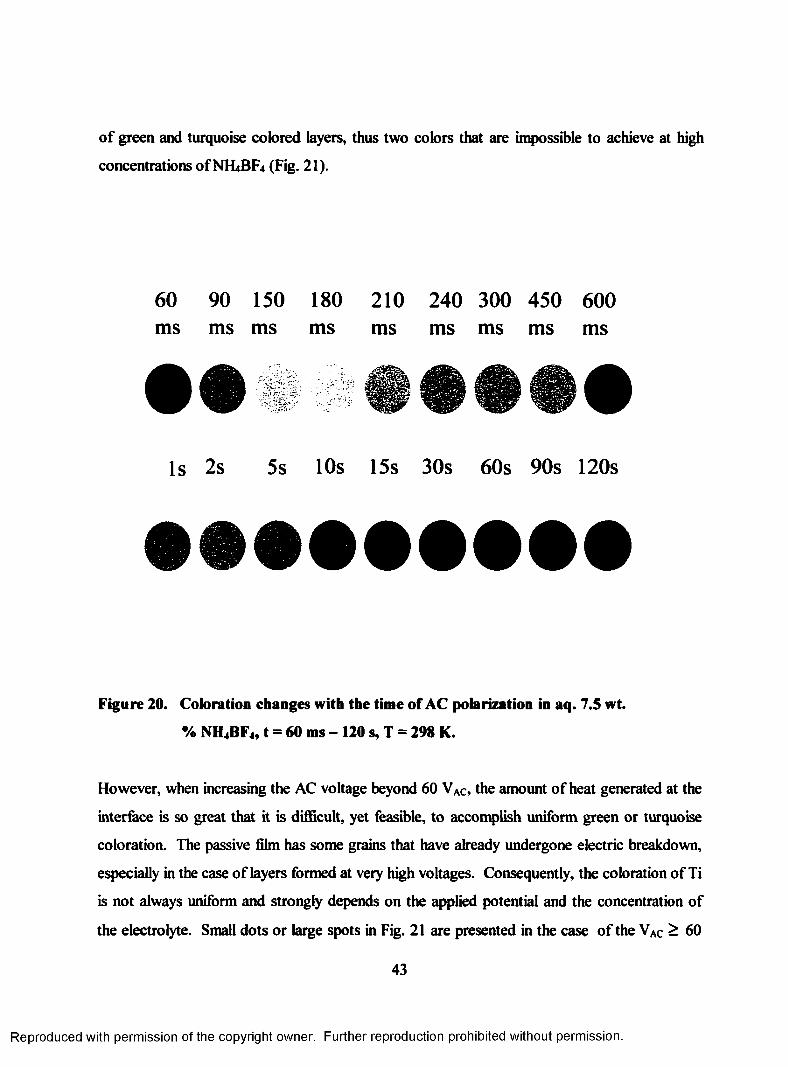
of green and turquoise colored layers, thus two colors that are impossible to achieve at high
concentrations ofNH4 BF4 (Fig. 21).
60 90 150 180 210 240 300 450 600ms ms ms ms ms ms ms ms ms
• •Is 2s 5s 10s 15s 30s 60s 90s 120s
• • • • • • • • •Figure 20. Coloration changes with the time of AC polarization in aq. 7.5 wt.
% NH4 BF4, t = 60 ms - 120 s, T = 298 K.
However, when increasing the AC voltage beyond 60 VAc, the amount of heat generated at the
interface is so great that it is difficult, yet feasible, to accomplish uniform green or turquoise
coloration. The passive film has some grains that have already undergone electric breakdown,
especially in the case of layers formed at very high voltages. Consequently, the coloration of Ti
is not always uniform and strongly depends on the applied potential and the concentration of
the electrolyte. Small dots or large spots in Fig. 21 are presented in the case of the VAc ^ 60
43
Reproduced with permission of the copyright owner. Further reproduction prohibited without permission.
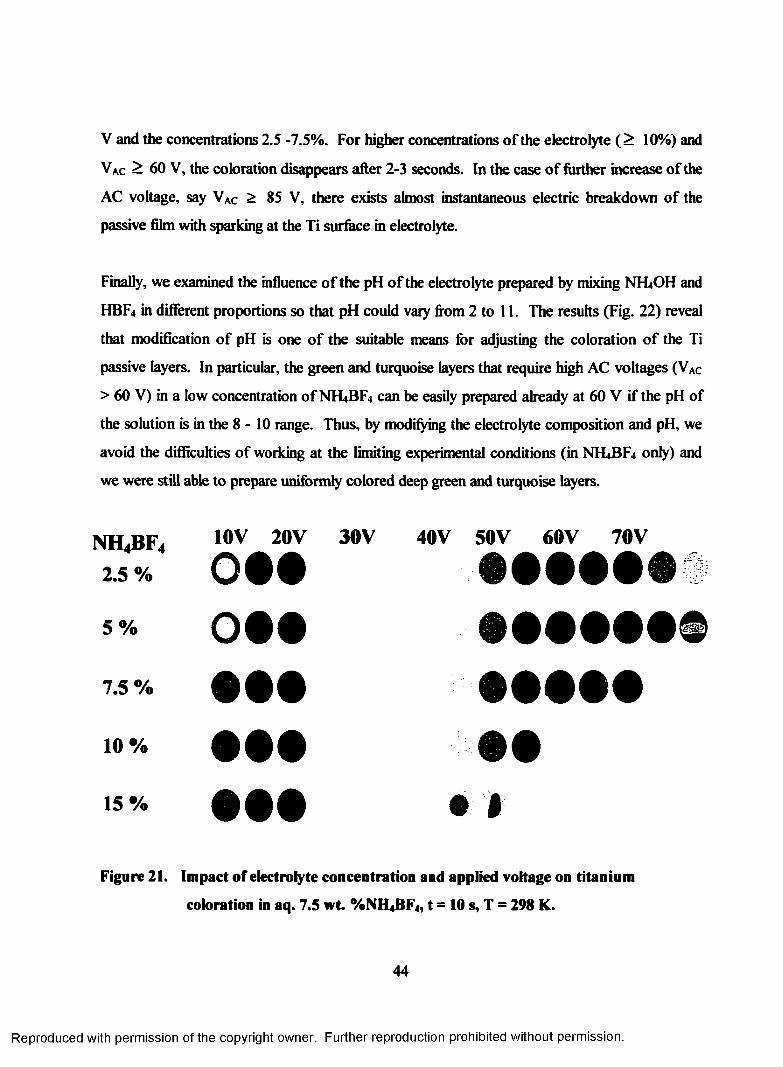
V and the concentrations 2.5 -7.5%. For higher concentrations of the electrolyte ( > 10%) and
VAC ^ 60 V, the coloration disappears after 2-3 seconds. In the case of further increase of the
AC voltage, say VAc ^ 85 V, there exists almost instantaneous electric breakdown of the
passive film with sparking at the Ti surface in electrolyte.
Finally, we examined the influence of the pH of the electrolyte prepared by mixing NH4OH and
HBF4 in different proportions so that pH could vary from 2 to 11. The results (Fig. 22) reveal
that modification of pH is one of the suitable means for adjusting the coloration of the Ti
passive layers. In particular, the green and turquoise layers that require high AC voltages (VAC
> 60 V) in a low concentration of NH4BF4 can be easily prepared already at 60 V if the pH of
the solution is in the 8 - 10 range. Thus, by modifying the electrolyte composition and pH, we
avoid the difficulties of working at the limiting experimental conditions (in NH4BF4 only) and
we were still able to prepare uniformly colored deep green and turquoise layers.
NH4 BF4
2.5 %
10V 20V 30V 40V 50V 60V 70V
O i l # • • • • #
- O M • • • • • • ©
• M • • • • •1 0 % 9 9 9 9 9
15% 0 0 0 • #
Figure 21. Impact of electrolyte concentration and applied voltage on titanium
coloration in aq. 7.5 wt. %NH4 BF4, t = 10 s, T = 298 K.
44
Reproduced with permission of the copyright owner. Further reproduction prohibited without permission.
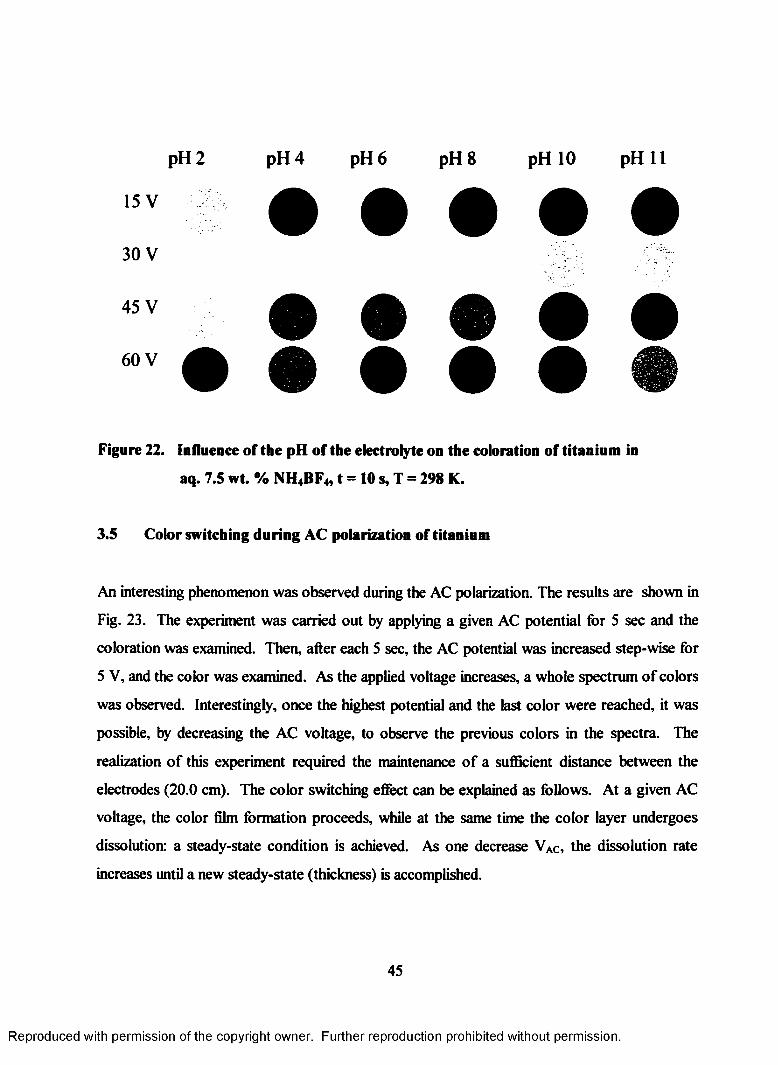
pH 2 pH 4 pH 6 pH 8 pH 10 pH 11
15 V
30 V
60 V
45 V
Figure 22. Influence of the pH of the electrolyte on the coloration of titanium in
3.5 Color switching during AC polarization of titanium
An interesting phenomenon was observed during the AC polarization. The results are shown in
5 V, and the color was examined. As the applied voltage increases, a whole spectrum of colors
was observed. Interestingly, once the highest potential and the last color were reached, it was
possible, by decreasing the AC voltage, to observe the previous colors in the spectra. The
realization of this experiment required the maintenance of a sufficient distance between the
electrodes (20.0 cm). The color switching effect can be explained as follows. At a given AC
voltage, the color film formation proceeds, while at the same time the color layer undergoes
dissolution: a steady-state condition is achieved. As one decrease VAc, the dissolution rate
increases until a new steady-state (thickness) is accomplished.
aq. 7.5 wt. % NH4 BF4, t = 10 s, T = 298 K.
Fig. 23. The experiment was carried out by applying a given AC potential for 5 sec and the
coloration was examined. Then, after each 5 sec, the AC potential was increased step-wise for
45
Reproduced with permission of the copyright owner. Further reproduction prohibited without permission.
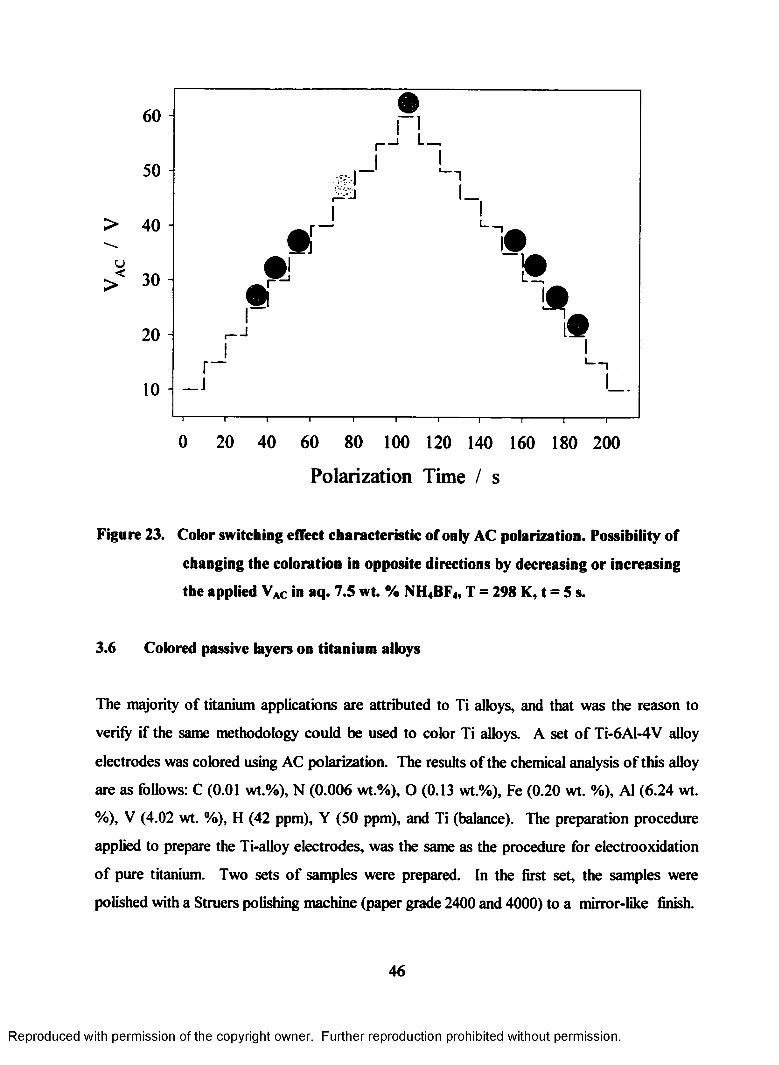
60 - nL _
50 -
> 40 -
u>* 30-
20 -
r ~
0 20 40 60 80 100 120 140 160 180 200
Polarization Time / s
Figure 23. Color switching effect characteristic of only AC polarization. Possibility of
changing the coloration in opposite directions by decreasing or increasing
the applied VAC in aq. 7.5 wt. % NH4BF4, T = 298 K, t = 5 s.
3.6 Colored passive layers on titanium alloys
The majority of titanium applications are attributed to Ti alloys, and that was the reason to
verify if the same methodology could be used to color Ti alloys. A set of Ti-6A1-4V alloy
electrodes was colored using AC polarization. The results of the chemical analysis of this alloy
are as follows: C (0.01 wt.%), N (0.006 wt.%), O (0.13 wt.%), Fe (0.20 wt. %), A1 (6.24 wt.
%), V (4.02 wt. %), H (42 ppm), Y (50 ppm), and Ti (balance). The preparation procedure
applied to prepare the Ti-alloy electrodes, was the same as the procedure for electrooxidation
of pure titanium. Two sets of samples were prepared. In the first set, the samples were
polished with a Struers polishing machine (paper grade 2400 and 4000) to a mirror-like finish.
46
Reproduced with permission of the copyright owner. Further reproduction prohibited without permission.
After that, the samples were degreased in acetone under reflux, and finally polarized by
applying different AC voltages in 7.5 wt. % aq.NH4BF4. This way of coloring the alloys
provides very shiny samples with wide spectrum of colors. In the second set, the samples
were etched prior to the AC polarization. Due to the presence of A1 in the alloy, the etching
solution used for Ti (30 cm3 of concentrated HF and 50 cm3 of concentrated HN0 3 diluted to
1000 cm3 with H20) was found too agressive. After dilution of this solution with distilled
water ( 1 : 1 ratio, per volume), the alloy surface was uniformly etched and ready for the
coloration. Both methods (polishing and etching) give the same spectrum of well-defined and
uniform colors, yet the surface coloration accomplished at a given VAC differs from that
accomplished for Ti under the same experimental conditions. The difference of surface
coloration is due to the different surface morphologies (pure Ti and Ti alloy).
3.7 Development of electrochemical lithography on titanium
After mastering the experimental conditions for titanium coloration, it was possible to proceed
further and to develop a special technique of pattern design on titanium (72,73) -
electrochemical lithography on titanium. This technique could be useful in surface finishing
and the decorative industry, and also in semiconductor and printed circuit boards industries.
Electrochemical lithography is a combination of the AC polarization of Ti with the masking
technique for microlithographic applications in the semiconductor and microelectronics
industries.
The consecutive steps of the electrochemical lithography technique are described below and
presented in Fig. 24.
1) Application of positive photoresist (Olin Microelectronics Materials, Norwalk, USA)
either on pure titanium, or on pre-colored Ti surface. This photoresist layer is formed by
immersion of the Ti sample followed by drying.
47
Reproduced with permission of the copyright owner. Further reproduction prohibited without permission.
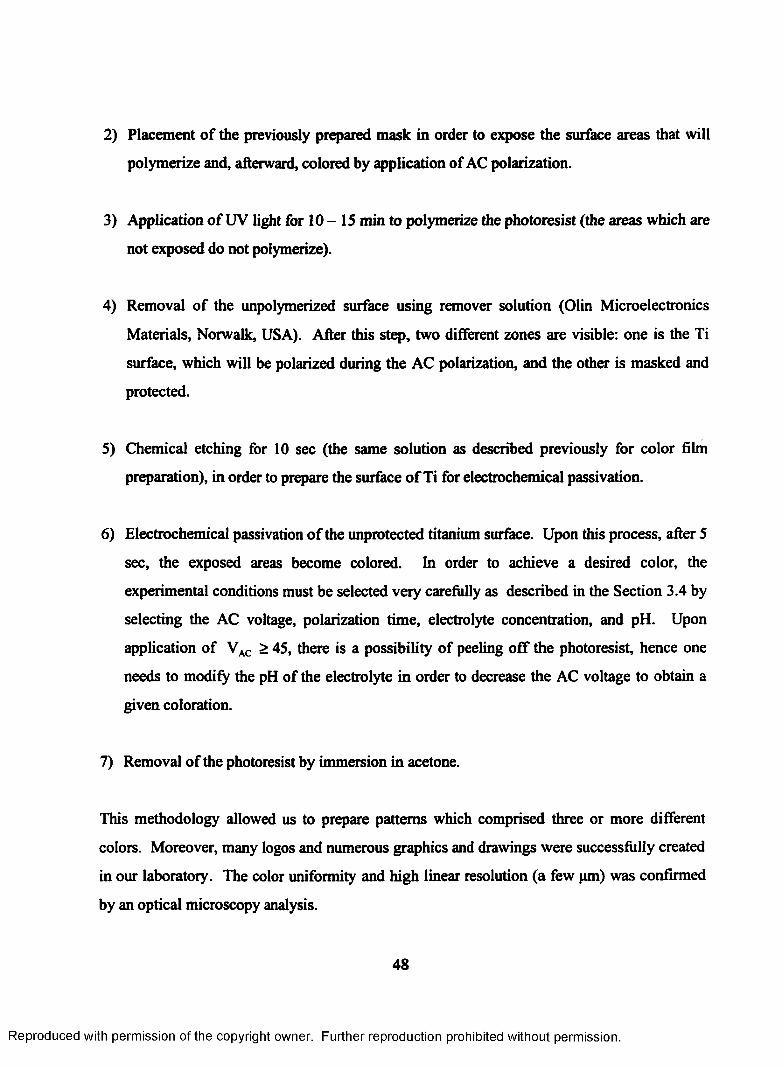
2) Placement of the previously prepared mask in order to expose the surface areas that will
polymerize and, afterward, colored by application of AC polarization.
3) Application of UV light for 10 - 15 min to polymerize the photoresist (the areas which are
not exposed do not polymerize).
4) Removal of the unpolymerized surface using remover solution (Olin Microelectronics
Materials, Norwalk, USA). After this step, two different zones are visible: one is the Ti
surface, which will be polarized during the AC polarization, and the other is masked and
protected.
5) Chemical etching for 10 sec (the same solution as described previously for color film
preparation), in order to prepare the surface of Ti for electrochemical passivation.
6 ) Electrochemical passivation of the unprotected titanium surface. Upon this process, after 5
sec, the exposed areas become colored. In order to achieve a desired color, the
experimental conditions must be selected very carefully as described in the Section 3.4 by
selecting the AC voltage, polarization time, electrolyte concentration, and pH. Upon
application of VAC > 45, there is a possibility of peeling off the photoresist, hence one
needs to modify the pH of the electrolyte in order to decrease the AC voltage to obtain a
given coloration.
7) Removal of the photoresist by immersion in acetone.
This methodology allowed us to prepare patterns which comprised three or more different
colors. Moreover, many logos and numerous graphics and drawings were successfully created
in our laboratory. The color uniformity and high linear resolution (a few pm) was confirmed
by an optical microscopy analysis.
48
Reproduced with permission of the copyright owner. Further reproduction prohibited without permission.
Photoresist +
Titanium
* MaskIRemover
I
14:1iJitliWi l h i i - l
l-r-i;!-!:*i:ThliHJ
HF + HNO 3 aq. NH4 BF4 Acetone
Figure 24. Schema of electrochemical lithography technique: (1) application of
photoresist on Ti, (2) placement of mask to mark the surface for coloring, (3) application
of UV light - polymerization, (4) removal of the polymerized surface, (5) chemical
etching, (6 ) electrochemical oxidation of unprotected titanium surface, and (7) removal
of photoresist by immersion in acetone.
49
Reproduced with permission of the copyright owner. Further reproduction prohibited without permission.
CHAPTER 4
SURFACE CHEMICAL CHARACTERIZATION AND CHEMICAL COMPOSITION
OF MULTICOLORED TITANIUM PASSIVE LAYERS
4.1 Optical microscopy analysis of Ti passive films
The Ti samples used in the course of research were of polycrystalline nature and after cleaning
and etching, they revealed a well-defined grain structure (Fig. 25), with each grain behaving
like a single crystal. Thus, it became necessary to evaluate whether: (a) the passive films
revealed the same coloration on different grains; (b) the surface roughness underwent any
changes upon the color film formation, and if so how it depended on the applied AC voltage;
and (c) the colored passive films revealed cracks or fractures.
The relation between the grain structure and the coloration of particular grains, thus the
uniformity of AC-polarization induced coloration, was evaluated by optical microscopy at
various magnifications but the visualization at 200 x provided the best results. Fig. 25
represents the surface morphology pictures of Ti and colored passive films formed at five
different voltages (10, 15, 30, 50 and 60 Vac) that are representative of the overall tendency.
The results may be summarized as follows:
(i) The surface coloration is predominantly uniform in the sense that each grain had the
same color;
(ii) Certain grains show slightly different coloration than that expected for a particular AC
voltage (see 30 and 60 VAC in Fig. 25), yet they are the neighbor colors of the principal
one according to the coloration versus voltage dependence shown in Fig. 19. For
instance, the blue passive layer (Fig. 25, 30 VAC) reveals some purple and pale-blue
50
Reproduced with permission of the copyright owner. Further reproduction prohibited without permission.
grains, thus the "neighbor colors" of the principal one since a purple layer is formed at
20-25 VAC and the pale-blue one at 35 VAC. Similarly, the brownish pink sample (Fig.
25,60 VAC) reveals gold and purple grains with some characteristics of non-uniformity
due to the lines and scratches on the electrode.
(iii) Since the XPS depth profile analysis (see Section 4.5) displays that the coloration
depends on the thickness of the passive layer, it may be concluded that the thickness of
the passive layer is not exactly the same on all grains owing to the polycrystalline
nature of the sample. Yet, since most of the grains reveal the coloration representative
of the applied voltage (the principal coloration), it is rational to say that the thickness
of the colored passive layer is similar across the entire sample.
(iv) The optical microscopy shows that the passive layers were free of micrometer-sized
cracks or fractures.
4.2 3D Optical microscopy of multicolored titanium passive layers
Fig. 26 shows the results of 3D optical microscopy analysis of an as-received Ti samples
which were only cleaned in acetone under reflux. All heights vs. distance plots clearly display
the imperfections on the surface such as grains, grain boundaries, scratches and lines due to the
manufacturing of the titanium plate, which gives a rough, irregular polycrystalline surface.
Fig. 27 presents Ti being etched for lmin. The etching resulted in a fast dissolution of
titanium. This procedure results in higher surface roughness as revealed in the contour and
surface profile plots (Fig. 27). However, the etching of Ti results in a regular titanium surface
showing the grain structure and the polycrystalline nature of Ti. The results allowed us to
access to the real morphology characteristics of the pure metal and to relate them to the
features of the colored layers. Fig. 28 represents the 3D optical microscopy analysis of the
20Vac passive layer. On the macroscopic or micrometers level, there are no major differences
between the etched titanium sample and the colored films on titanium.
51
Reproduced with permission of the copyright owner. Further reproduction prohibited without permission.
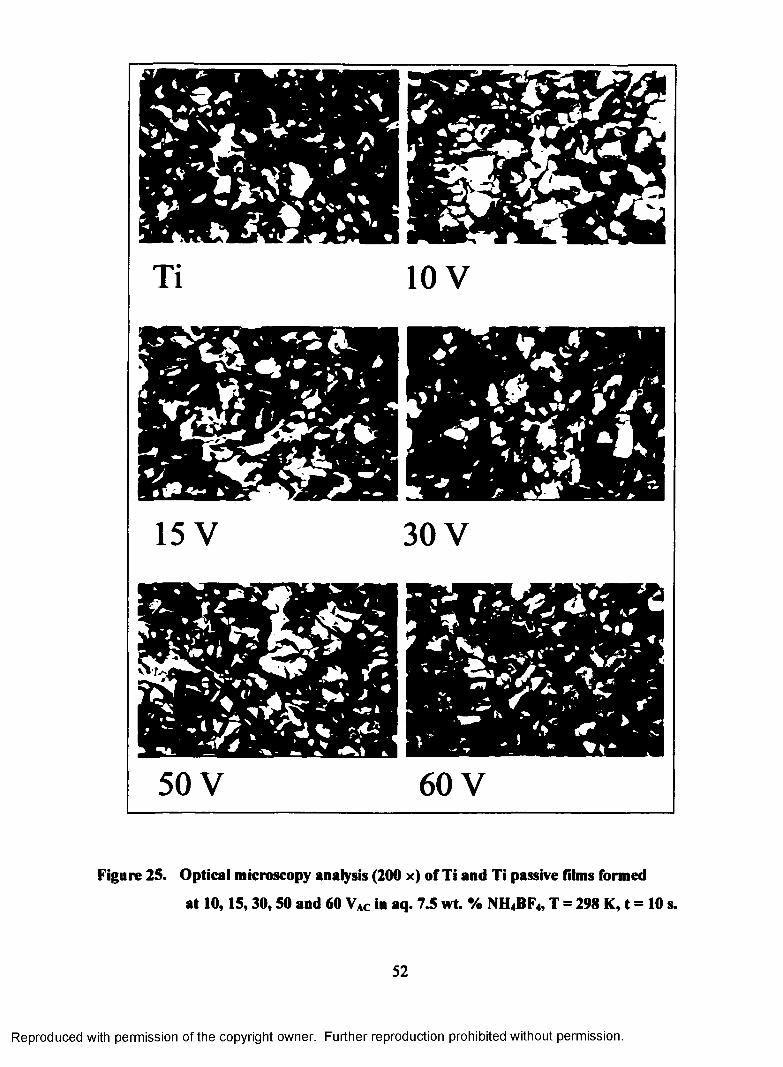
Ti 10 V
15 V 30 V
50 V 60 V
Figure 25. Optical microscopy analysis (200 x) of Ti and Ti passive films formed
at 10,15,30,50 and 60 VAC in aq. 7.5 wt. % NH4BF4 , T = 298 K, t = 10 s.
52
Reproduced with permission of the copyright owner. Further reproduction prohibited without permission.
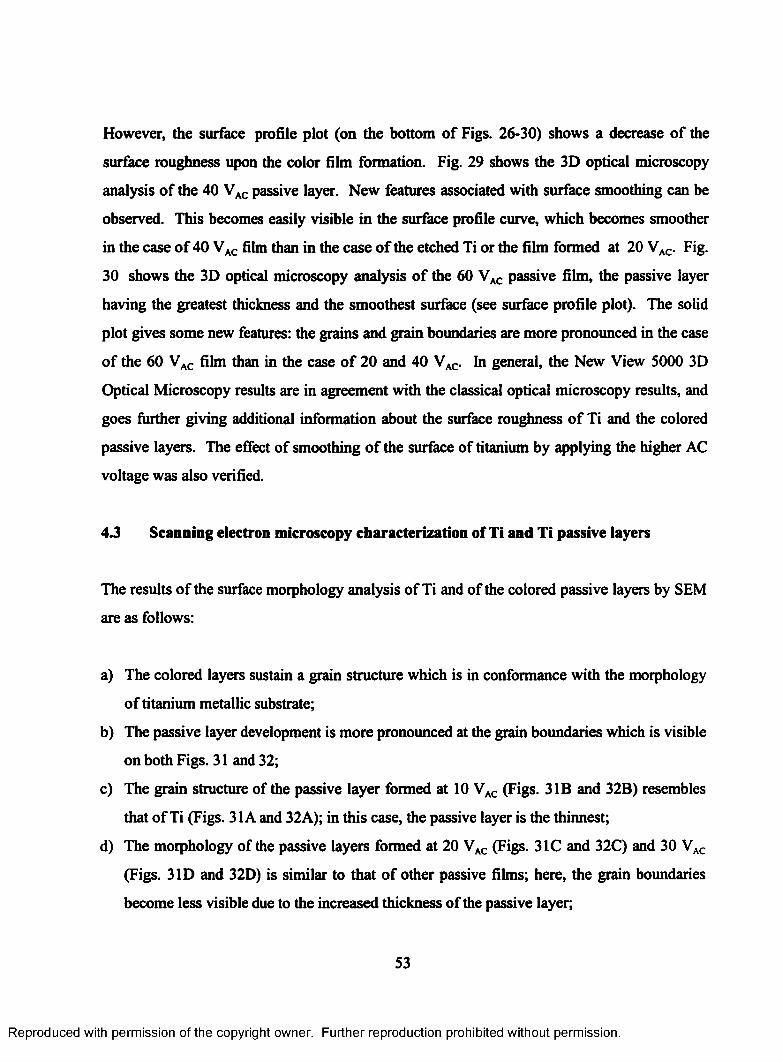
However, the surface profile plot (on the bottom of Figs. 26-30) shows a decrease of the
surface roughness upon the color film formation. Fig. 29 shows the 3D optical microscopy
analysis of the 40 VAC passive layer. New features associated with surface smoothing can be
observed. This becomes easily visible in the surface profile curve, which becomes smoother
in the case of 40 VAC film than in the case of the etched Ti or the film formed at 20 VAC. Fig.
30 shows the 3D optical microscopy analysis of the 60 VAC passive film, the passive layer
having the greatest thickness and the smoothest surface (see surface profile plot). The solid
plot gives some new features: the grains and grain boundaries are more pronounced in the case
of the 60 VAC film than in the case of 20 and 40 VAC. In general, the New View 5000 3D
Optical Microscopy results are in agreement with the classical optical microscopy results, and
goes further giving additional information about the surface roughness of Ti and the colored
passive layers. The effect of smoothing of the surface of titanium by applying the higher AC
voltage was also verified.
4.3 Scanning electron microscopy characterization of Ti and Ti passive layers
The results of the surface morphology analysis of Ti and of the colored passive layers by SEM
are as follows:
a) The colored layers sustain a grain structure which is in conformance with the morphology
of titanium metallic substrate;
b) The passive layer development is more pronounced at the grain boundaries which is visible
on both Figs. 31 and 32;
c) The grain structure of the passive layer formed at 10 VAC (Figs. 3 IB and 32B) resembles
that of Ti (Figs. 31A and 32A); in this case, the passive layer is the thinnest;
d) The morphology of the passive layers formed at 20 VAC (Figs. 31C and 32C) and 30 VAC
(Figs. 3ID and 32D) is similar to that of other passive films; here, the grain boundaries
become less visible due to the increased thickness of the passive layer;
53
Reproduced with permission of the copyright owner. Further reproduction prohibited without permission.
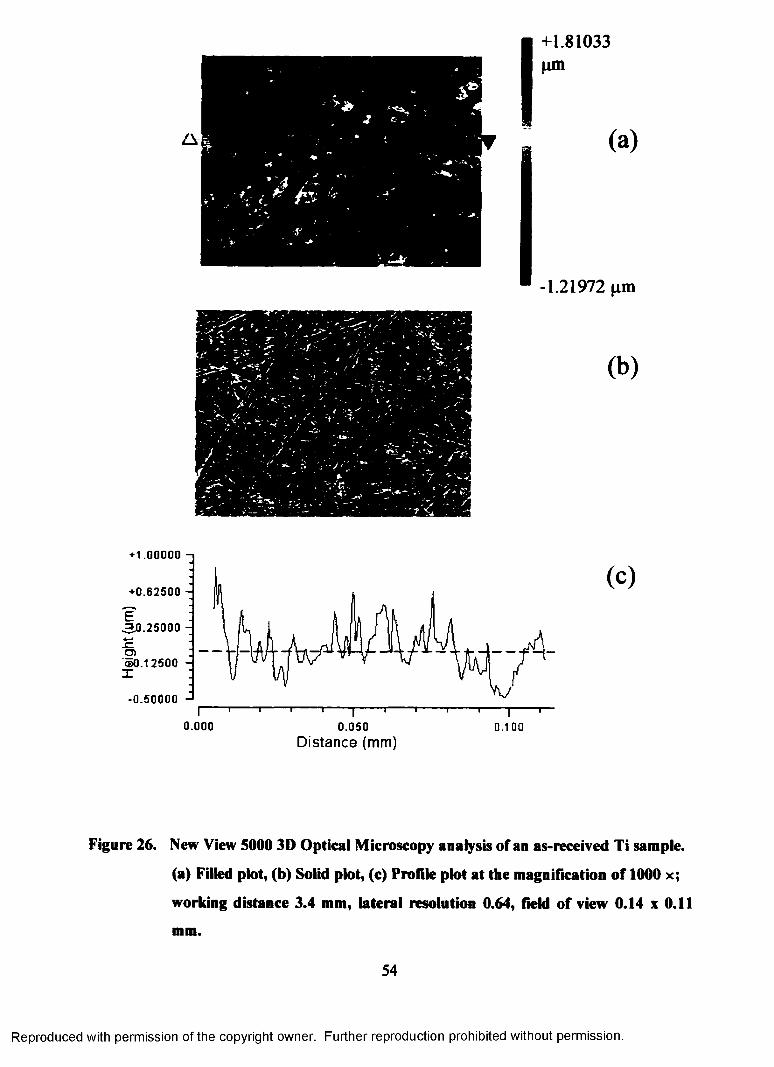
+1.81033pm
(a)
■1.21972 Mm
(b)
+ 1 .0 0 0 0 0
+0.62500
-0.50000
0.000 0.050 0 . 1 00
(c)
Distance (mm)
Figure 26. New View 5000 3D Optical Microscopy analysis of an as-received Ti sample.
(a) Filled plot, (b) Solid plot, (c) Profile plot at the magnification of 1000 x;
working distance 3.4 mm, lateral resolution 0.64, field of view 0.14 x 0.11
mm.
54
Reproduced with permission of the copyright owner. Further reproduction prohibited without permission.
+4.78546f i m
(a)
-4.21314 nm
(b)
0 . 0 0 0
1 — I— I— I—0.050
Distance (mm)
♦ 2 .0 0 0 0 0 - |
♦0.75000
3 ) .5 0 0 0 0
O)'$1.75000 -
-3.00000 -J
(C )
— I— r 0 . 1 00
Figure 27. New View 5000 3D Optical Microscopy analysis of the etched Ti sample.
(a) Filled plot, (b) Solid plot, (c) Profile plot, a t the magnification of 1000 x;
working distance 3.4 mm, lateral resolution 0.64 pm, field of view 0.14 x 0.11
mm.
55
Reproduced with permission of the copyright owner. Further reproduction prohibited without permission.
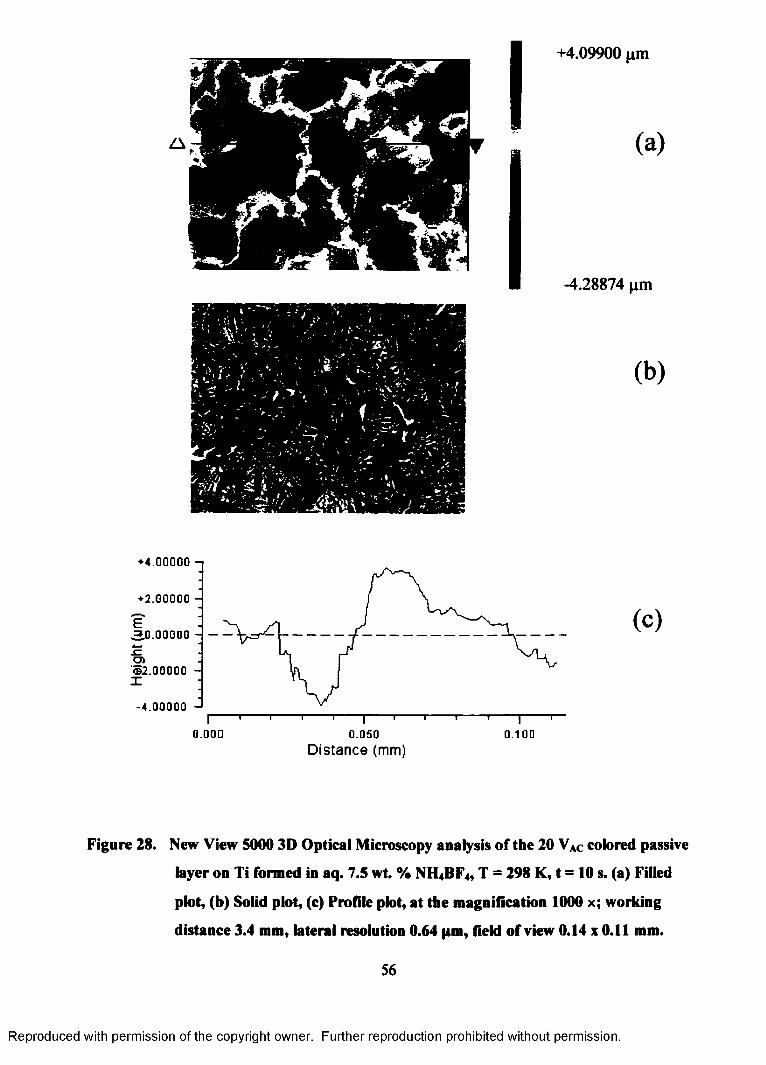
+4.09900 jim
(a)
-4.28874 pm
(b)
♦ 4.00000 - i
♦ 2 . 0 0 0 0 0 -
O)© 2 .0 0 0 0 0 -
- 4.00000TT
(C )
0 . 0 0 0 0.050Distance (mm)
0.100
Figure 28. New View 5000 3D Optical Microscopy analysis of the 20 VAC colored passive
layer on Ti formed in aq. 7.5 wt. % NH4 BF4 , T = 298 K, t = 10 s. (a) Filled
plot, (b) Solid plot, (c) Profile plot, at the magnification 1000 x; working
distance 3.4 mm, lateral resolution 0.64 pm, field of view 0.14 x 0.11 mm.
56
Reproduced with permission of the copyright owner. Further reproduction prohibited without permission.
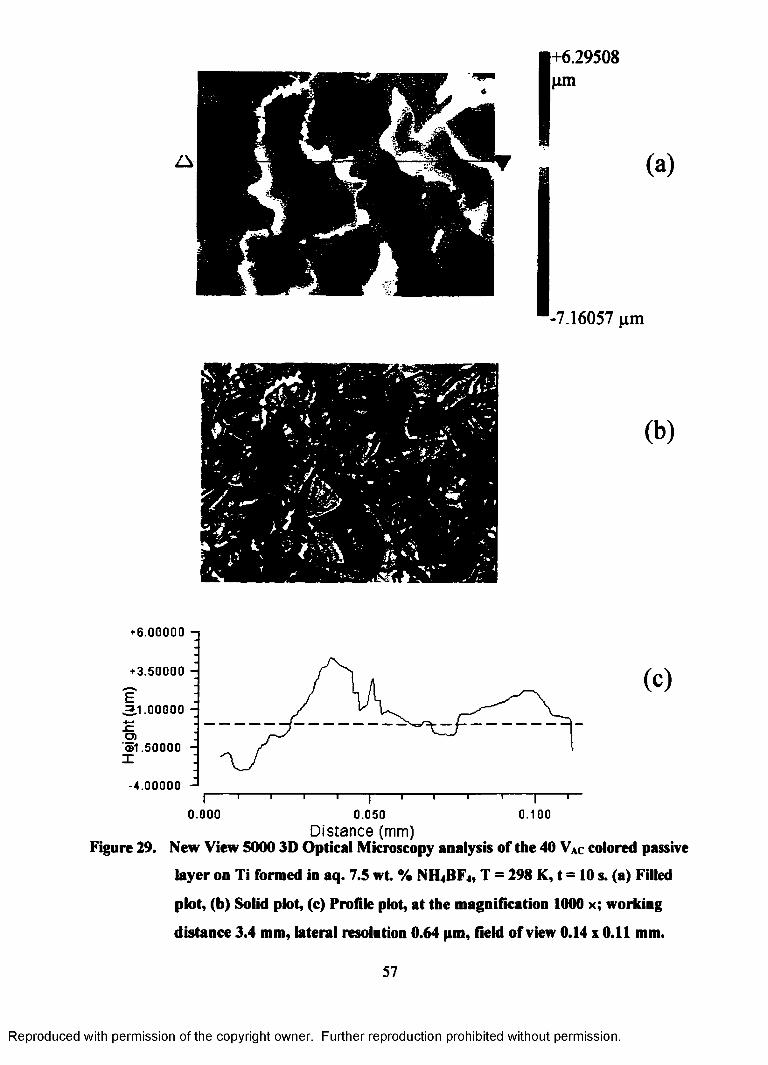
1+6.29508 kim
(a)
-7.16057 jun
(b)
+ 6 . 0 0 0 00 -
+ 3.50000 -j
E“3 .1-00000 - 4—1x: o>©1.50000 - X
-4.00000 -| 1 1 1 1 1 1 1 1 1 1--------- 1—
0.000 0.050 0.100Distance (mm)
Figure 29. New View 5000 3D Optical Microscopy analysis of the 40 Vac colored passive
layer on Ti formed in aq. 7.5 wt. % NH4BF4, T = 298 K, t - 10 s. (a) Filled
plot, (b) Solid plot, (c) Profile plot, at the magnification 1000 x; working
distance 3.4 mm, lateral resolution 0.64 pm, field of view 0.14 x 0.11 mm.
57
Reproduced with permission of the copyright owner. Further reproduction prohibited without permission.
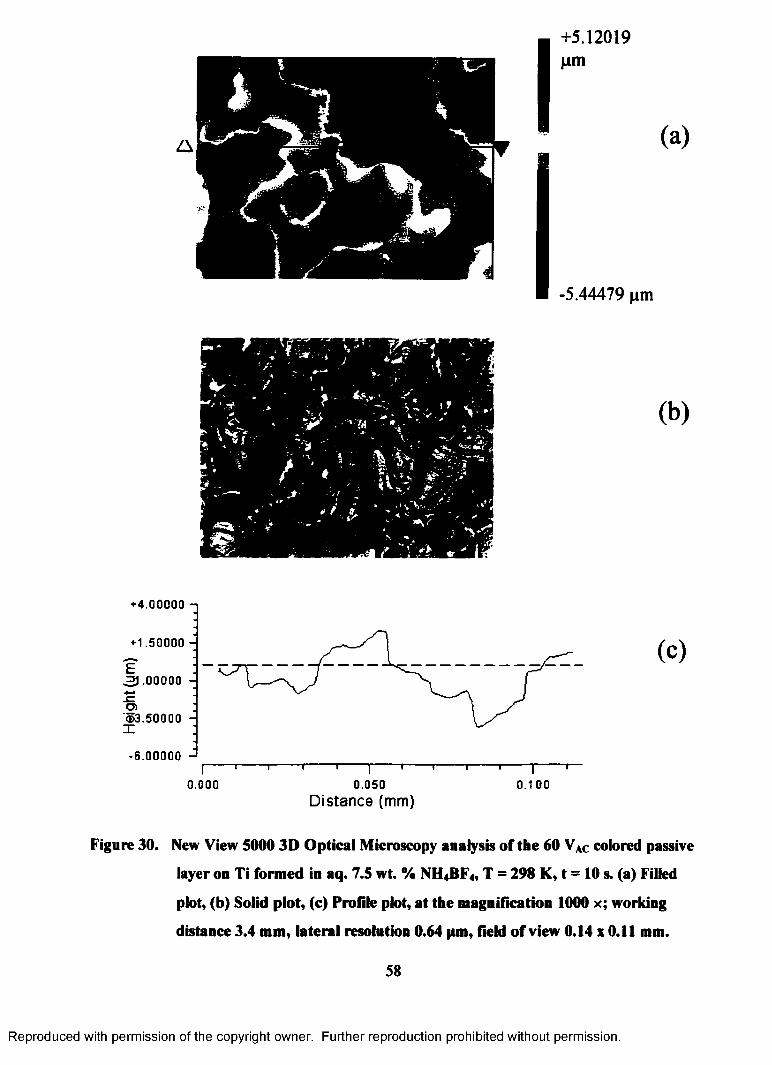
+5.12019fim
(a)
-5.44479 fim
(b)
■*•4.00000
+ 1.50000
3 - 0 0 0 0 0
O)© 3.50000
- 6 . 0 0 0 0 0T T
(C )
0 . 0 0 0 0.050Distance (mm)
0.100
Figure 30. New View 5000 3D Optical Microscopy analysis of the 60 VAC colored passive
layer on Ti formed in aq. 7.5 wt. % NH4BF4, T - 298 K, t = 10 s. (a) Filled
plot, (b) Solid plot, (c) Profile plot, at the magnification 1000 x; working
distance 3.4 mm, lateral resolution 0.64 pm, field of view 0.14 x 0.11 mm.
58
Reproduced with permission of the copyright owner. Further reproduction prohibited without permission.
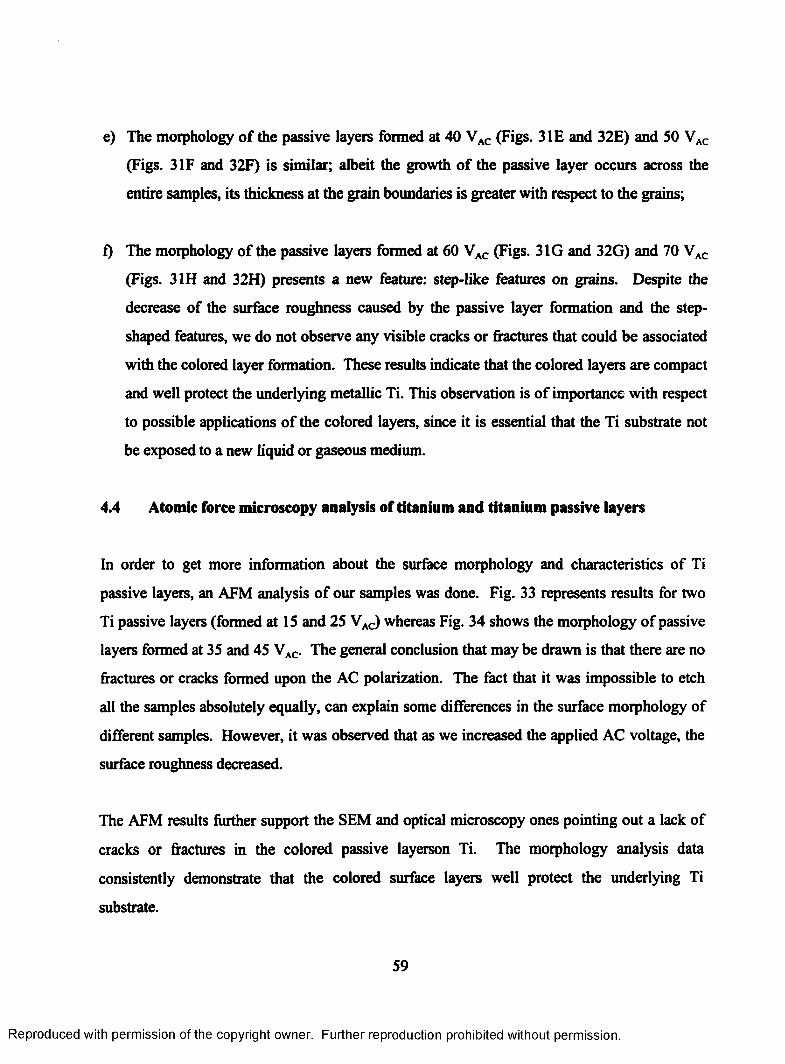
e) The morphology of the passive layers formed at 40 VAC (Figs. 3IE and 32E) and 50 VAC
(Figs. 3 IF and 32F) is similar; albeit the growth of the passive layer occurs across the
entire samples, its thickness at the grain boundaries is greater with respect to the grains;
f) The morphology of the passive layers formed at 60 VAC (Figs. 31G and 32G) and 70 VAC
(Figs. 31H and 32H) presents a new feature: step-like features on grains. Despite the
decrease of the surface roughness caused by the passive layer formation and the step
shaped features, we do not observe any visible cracks or fractures that could be associated
with the colored layer formation. These results indicate that the colored layers are compact
and well protect the underlying metallic Ti. This observation is of importance with respect
to possible applications of the colored layers, since it is essential that the Ti substrate not
be exposed to a new liquid or gaseous medium.
4.4 Atomic force microscopy analysis of titanium and titanium passive layers
In order to get more information about the surface morphology and characteristics of Ti
passive layers, an AFM analysis of our samples was done. Fig. 33 represents results for two
Ti passive layers (formed at 15 and 25 VAC) whereas Fig. 34 shows the morphology of passive
layers formed at 35 and 45 vAC. The general conclusion that may be drawn is that there are no
fractures or cracks formed upon the AC polarization. The fact that it was impossible to etch
all the samples absolutely equally, can explain some differences in the surface morphology of
different samples. However, it was observed that as we increased the applied AC voltage, the
surface roughness decreased.
The AFM results further support the SEM and optical microscopy ones pointing out a lack of
cracks or fractures in the colored passive layerson Ti. The morphology analysis data
consistently demonstrate that the colored surface layers well protect the underlying Ti
substrate.
59
Reproduced with permission of the copyright owner. Further reproduction prohibited without permission.
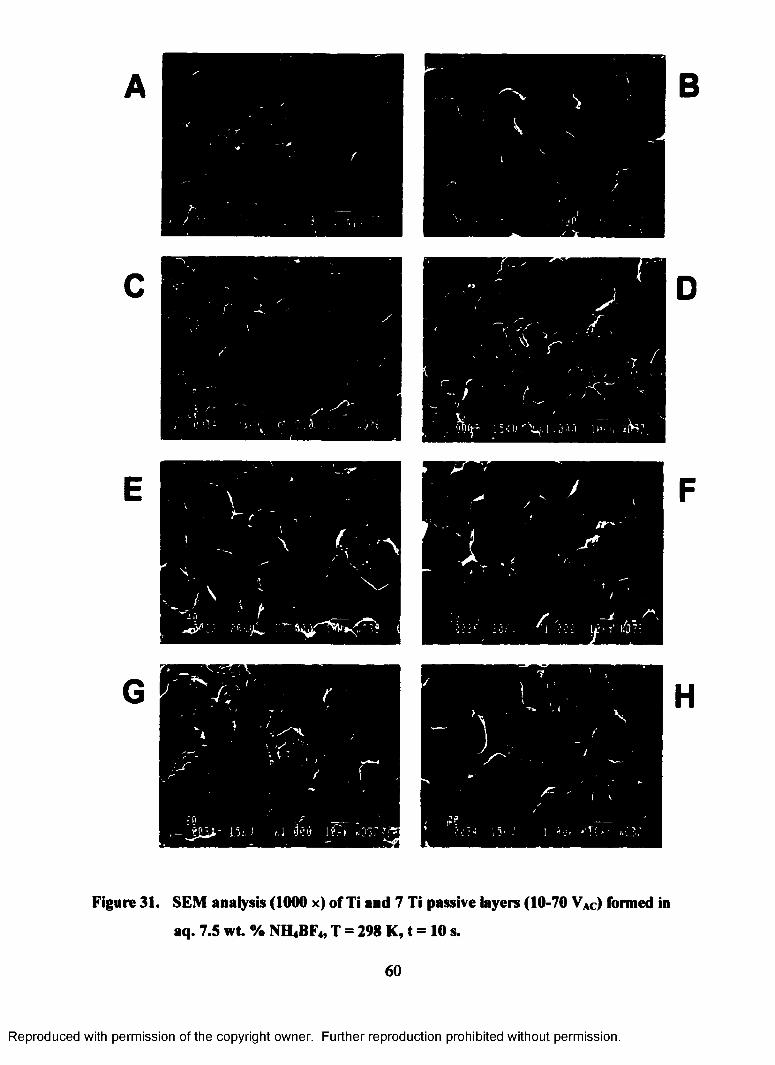
" Sjf'NV*<r
Figure 31. SEM analysis (1000 x) of Ti and 7 Ti passive layers (10*70 VAc) formed in
aq. 7.5 wt. % NH4BF4, T = 298 K, t = 10 s.
60
Reproduced with permission of the copyright owner. Further reproduction prohibited without permission.
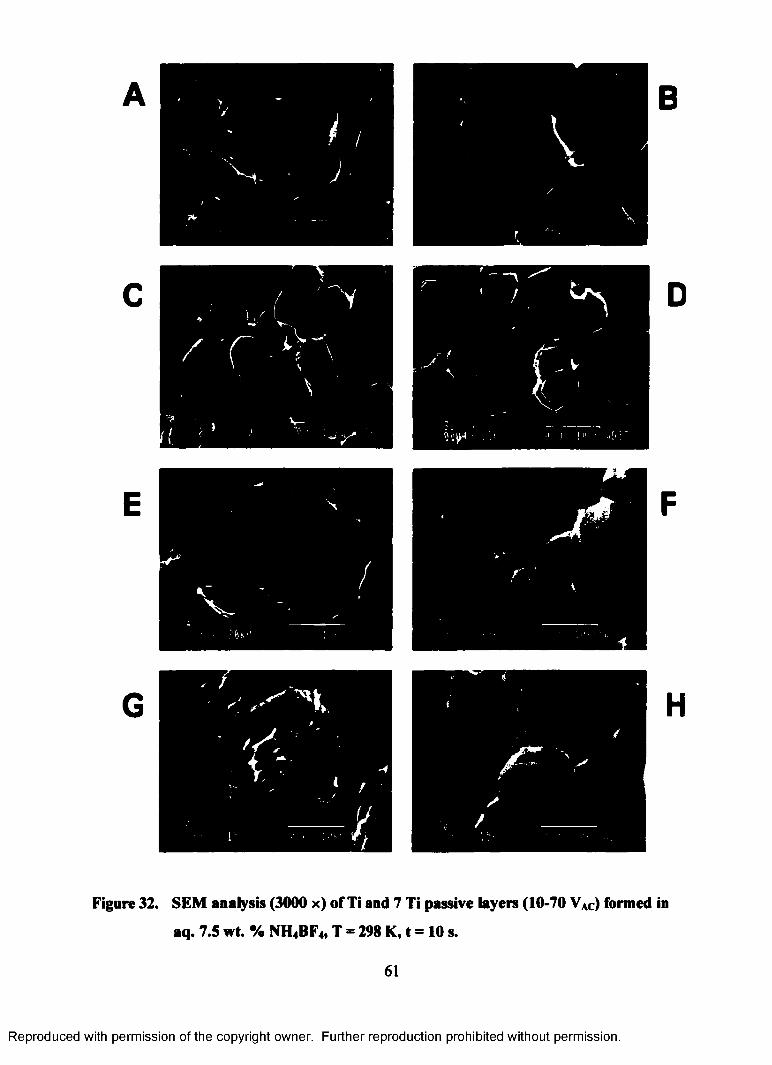
B
1 '
H
4
Figure 32. SEM analysis (3000 x) of Ti and 7 Ti passive layers (10-70 VAC) formed in
aq. 7.5 wt. % NH4 BF4, T = 298 K, t = 10 s.
61
Reproduced with permission of the copyright owner. Further reproduction prohibited without permission.
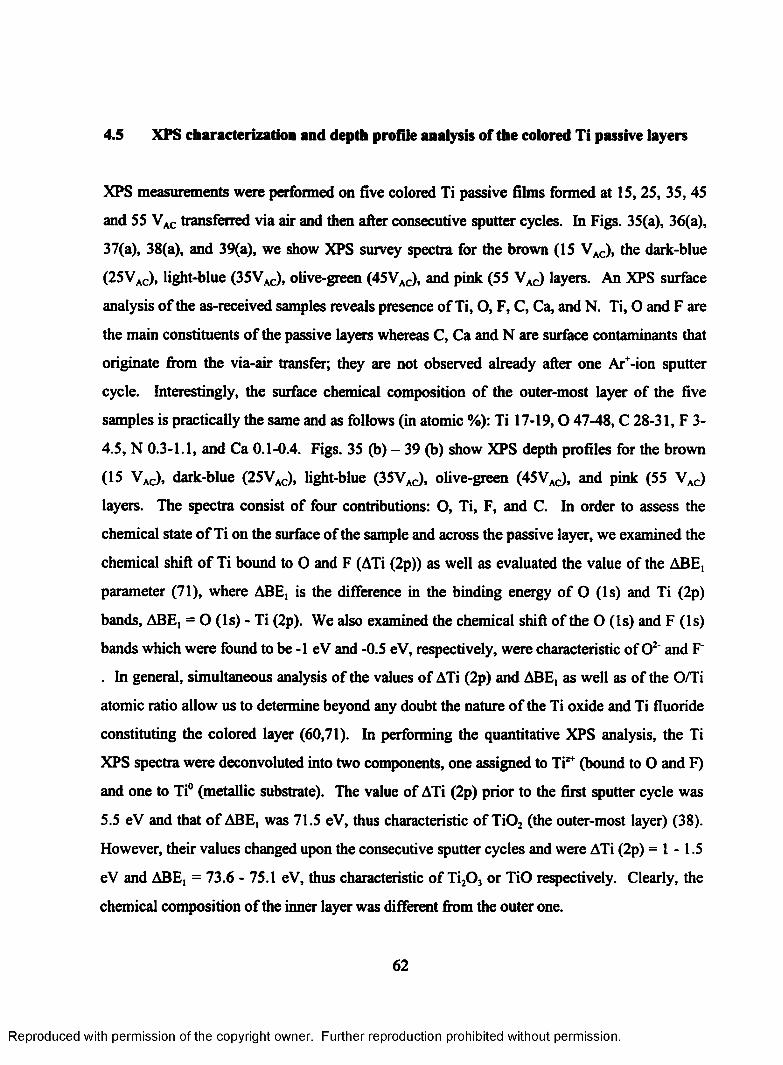
4.5 XPS characterization and depth profile analysis of the colored Ti passive layers
XPS measurements were performed on five colored Ti passive films formed at 15, 25, 35, 45
and 55 VAC transferred via air and then after consecutive sputter cycles. In Figs. 35(a), 36(a),
37(a), 38(a), and 39(a), we show XPS survey spectra for the brown (15 VAC), the dark-blue
(25Vac), light-blue (35VAC), olive-green (45VAC), and pink (55 VAC) layers. An XPS surface
analysis of the as-received samples reveals presence of Ti, O, F, C, Ca, and N. Ti, O and F are
the main constituents of the passive layers whereas C, Ca and N are surface contaminants that
originate from the via-air transfer; they are not observed already after one Ar+-ion sputter
cycle. Interestingly, the surface chemical composition of the outer-most layer of the five
samples is practically the same and as follows (in atomic %): Ti 17-19,0 47-48, C 28-31, F 3-
4.5, N 0.3-1.1, and Ca 0.1-0.4. Figs. 35 (b) - 39 (b) show XPS depth profiles for the brown
(15 VAC), dark-blue (25VAC), light-blue (35VAC), olive-green (45VAC), and pink (55 VAC)
layers. The spectra consist of four contributions: O, Ti, F, and C. In order to assess the
chemical state of Ti on the surface of the sample and across the passive layer, we examined the
chemical shift of Ti bound to 0 and F (ATi (2p)) as well as evaluated the value of the ABE,
parameter (71), where ABE, is the difference in the binding energy of O (Is) and Ti (2p)
bands, ABE, = O (Is) - Ti (2p). We also examined the chemical shift of the O (Is) and F (Is)
bands which were found to be -1 eV and -0.5 eV, respectively, were characteristic of O2' and F'
. In general, simultaneous analysis of the values of ATi (2p) and ABE, as well as of the O/Ti
atomic ratio allow us to determine beyond any doubt the nature of the Ti oxide and Ti fluoride
constituting the colored layer (60,71). In performing the quantitative XPS analysis, the Ti
XPS spectra were deconvolved into two components, one assigned to Ti** (bound to O and F)
and one to Ti° (metallic substrate). The value of ATi (2p) prior to the first sputter cycle was
5.5 eV and that of ABE, was 71.5 eV, thus characteristic of T i0 2 (the outer-most layer) (38).
However, their values changed upon the consecutive sputter cycles and were ATi (2p) = 1-1.5
eV and ABE, = 73.6 - 75.1 eV, thus characteristic of Ti20 3 or TiO respectively. Clearly, the
chemical composition of the inner layer was different from the outer one.
62
Reproduced with permission of the copyright owner. Further reproduction prohibited without permission.
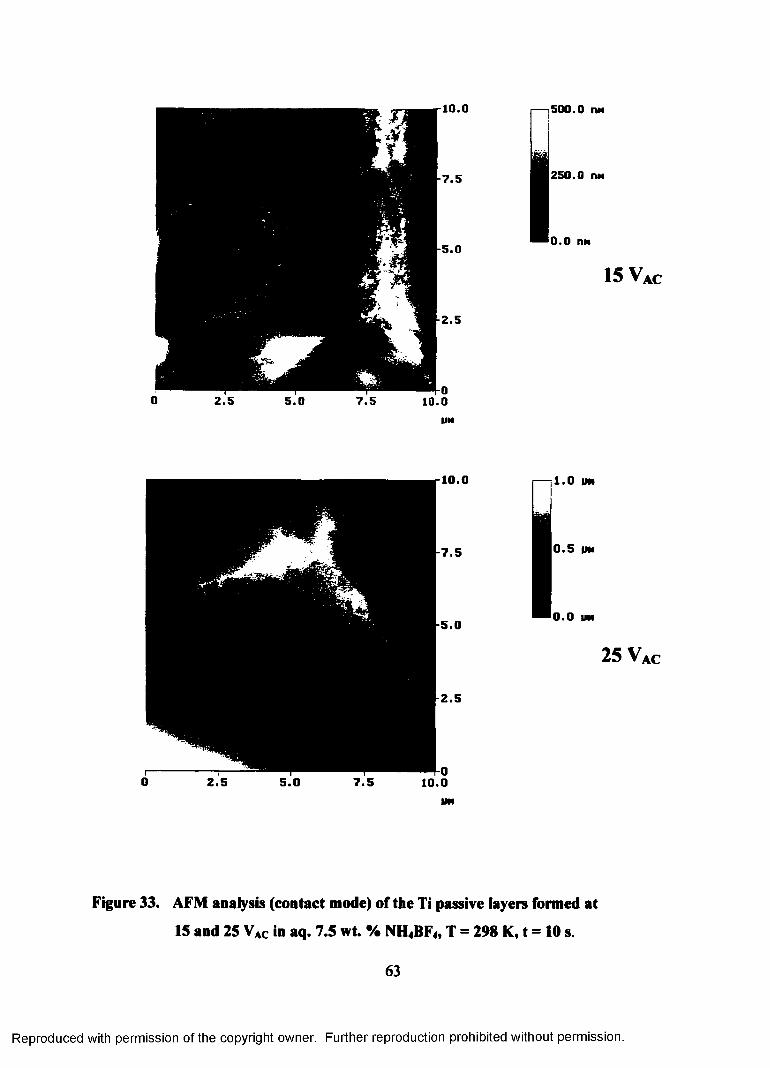
10.0 500.0 nM
250.0 (M
•0 . 0 nM
15 V a c
10 .0
7 .5
5 .0
2 .5
1 .0 im
|0 . 5 |M
*0.0 MM
25 V a c
Figure 33. AFM analysis (contact mode) of the Ti passive layers formed at
IS and 25 VAC in aq. 7.5 wt. % NH4BF4, T = 298 K, t = 10 s.
63
Reproduced with permission of the copyright owner. Further reproduction prohibited without permission.
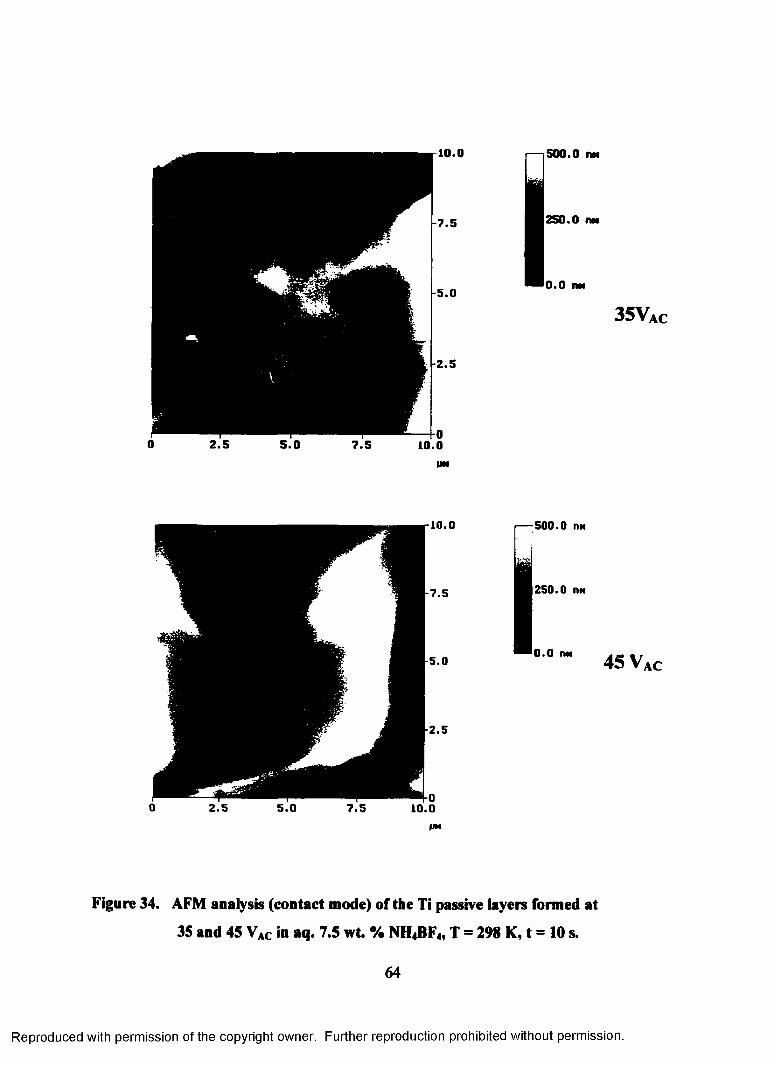
0 2 .5 5 .0 7 .5 10.0|IN
Figure 34. AFM analysis (contact mode) of the Ti passive layers formed at
35 and 45 VAC in aq. 7.5 wt. % NH4 BF4, T = 298 K, t = 10 s.
64
Reproduced with permission of the copyright owner. Further reproduction prohibited without permission.
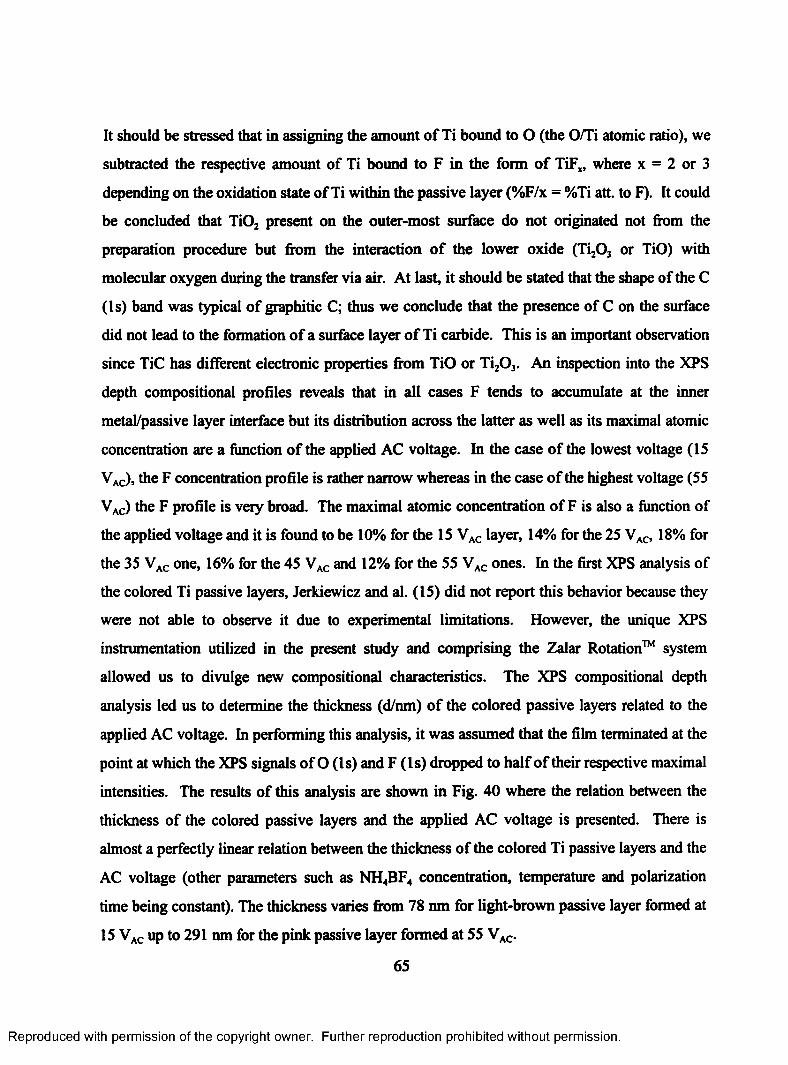
It should be stressed that in assigning the amount of Ti bound to O (the O/Ti atomic ratio), we
subtracted the respective amount of Ti bound to F in the form of TiFx, where x = 2 or 3
depending on the oxidation state of Ti within the passive layer (%F/x = %Ti att. to F). It could
be concluded that TiOz present on the outer-most surface do not originated not from the
preparation procedure but from the interaction of the lower oxide (Ti20 3 or TiO) with
molecular oxygen during the transfer via air. At last, it should be stated that the shape of the C
(Is) band was typical of graphitic C; thus we conclude that the presence of C on the surface
did not lead to the formation of a surface layer o f Ti carbide. This is an important observation
since TiC has different electronic properties from TiO or Ti20 3. An inspection into the XPS
depth compositional profiles reveals that in all cases F tends to accumulate at the inner
metal/passive layer interface but its distribution across the latter as well as its maximal atomic
concentration are a function of the applied AC voltage. In the case of the lowest voltage (15
VAC), the F concentration profile is rather narrow whereas in the case of the highest voltage (55
VAC) the F profile is very broad. The maximal atomic concentration of F is also a function of
the applied voltage and it is found to be 10% for the 15 VAC layer, 14% for the 25 VAC, 18% for
the 35 VAC one, 16% for the 45 VAC and 12% for the 55 VAC ones. In the first XPS analysis of
the colored Ti passive layers, Jerkiewicz and al. (15) did not report this behavior because they
were not able to observe it due to experimental limitations. However, the unique XPS
instrumentation utilized in the present study and comprising the Zalar Rotation™ system
allowed us to divulge new compositional characteristics. The XPS compositional depth
analysis led us to determine the thickness (d/nm) of the colored passive layers related to the
applied AC voltage. In performing this analysis, it was assumed that the film terminated at the
point at which the XPS signals of O (Is) and F (Is) dropped to half of their respective maximal
intensities. The results of this analysis are shown in Fig. 40 where the relation between the
thickness of the colored passive layers and the applied AC voltage is presented. There is
almost a perfectly linear relation between the thickness of the colored Ti passive layers and the
AC voltage (other parameters such as NH4 BF4 concentration, temperature and polarization
time being constant). The thickness varies from 78 nm for light-brown passive layer formed at
15 VAC up to 291 nm for the pink passive layer formed at 55 VAC.
65
Reproduced with permission of the copyright owner. Further reproduction prohibited without permission.
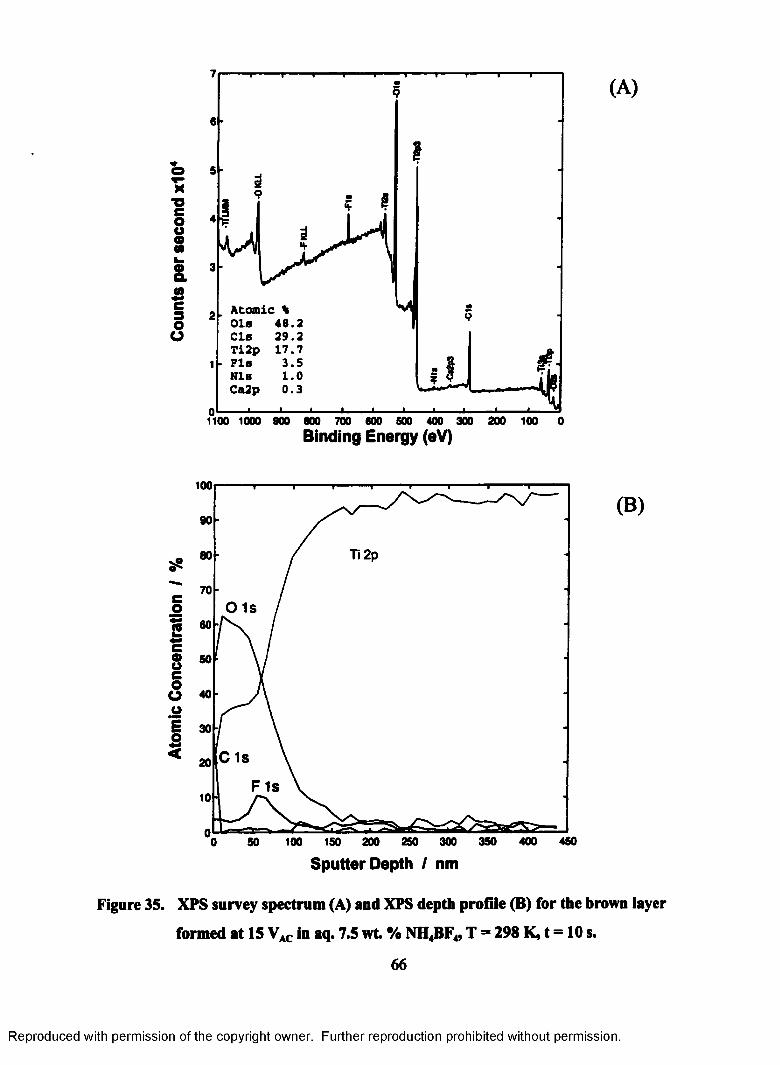
isoo
4 8 .22 9 .217.7
S?
i1100 1000 900 800 700 600 500 400 300 200 100 0
Binding Energy (eV)
100
Ti 2p
eos2
0 1 s
cooeoo0E1 C 1s
F I s
100 150 200 2S0 300 350 400 450
Sputter Depth / nm
(B )
Figure 35. XPS survey spectrum (A) and XPS depth profile (B) for the brown layer
formed at 15 VAC in aq. 7.5 w t % NH4BF4, T = 298 K, t = 10 s.
66
Reproduced with permission of the copyright owner. Further reproduction prohibited without permission.
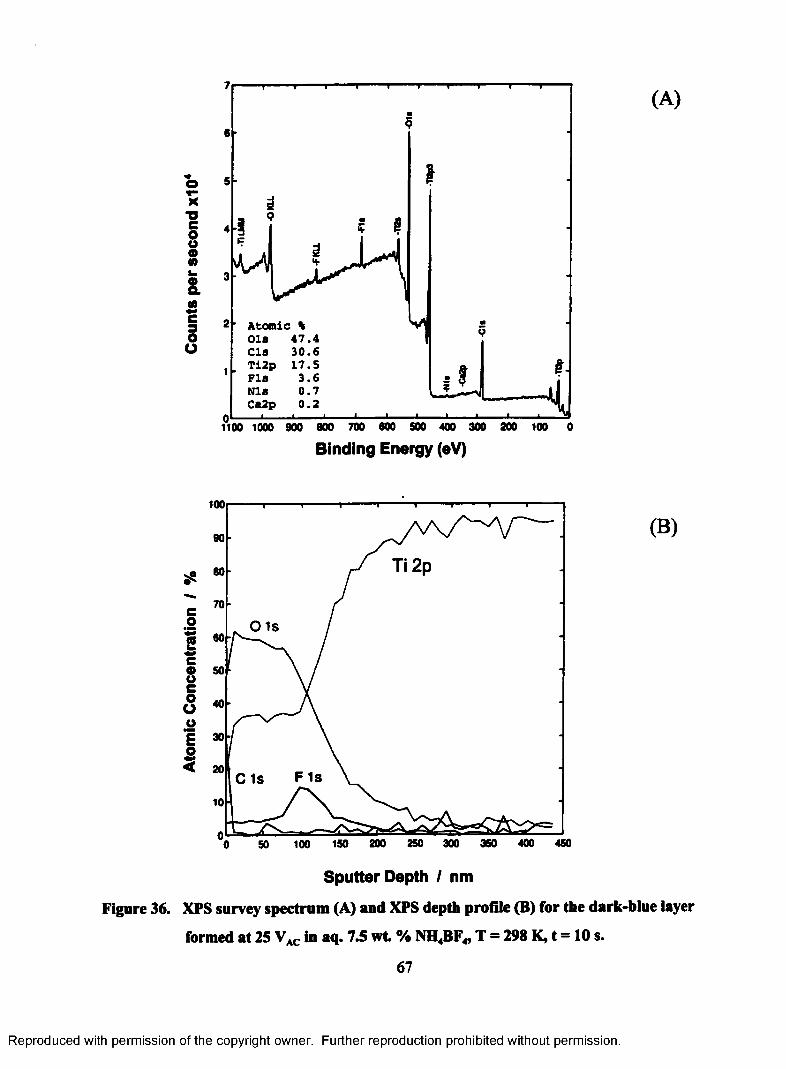
♦oX■oeooo( 0k.&&caoO
Atomic % 018 47.4CIS 30.6
3.60 .70 . 2
F I BN IBCa2p
Binding Energy (eV)
(A)
100
Ti 2p
e01c
0 1 s
ooeoO01i
F 1 sC 1s
100 150 200 250 300 350 400 450
(B )
Sputter Depth / nm
Figure 36. XPS survey spectrum (A) and XPS depth profile (B) for the dark-blue layer
formed at 25 VAC In aq. 7.5 w t % NH4BF4, T = 298 K, t = 10 s.
67
Reproduced with permission of the copyright owner. Further reproduction prohibited without permission.
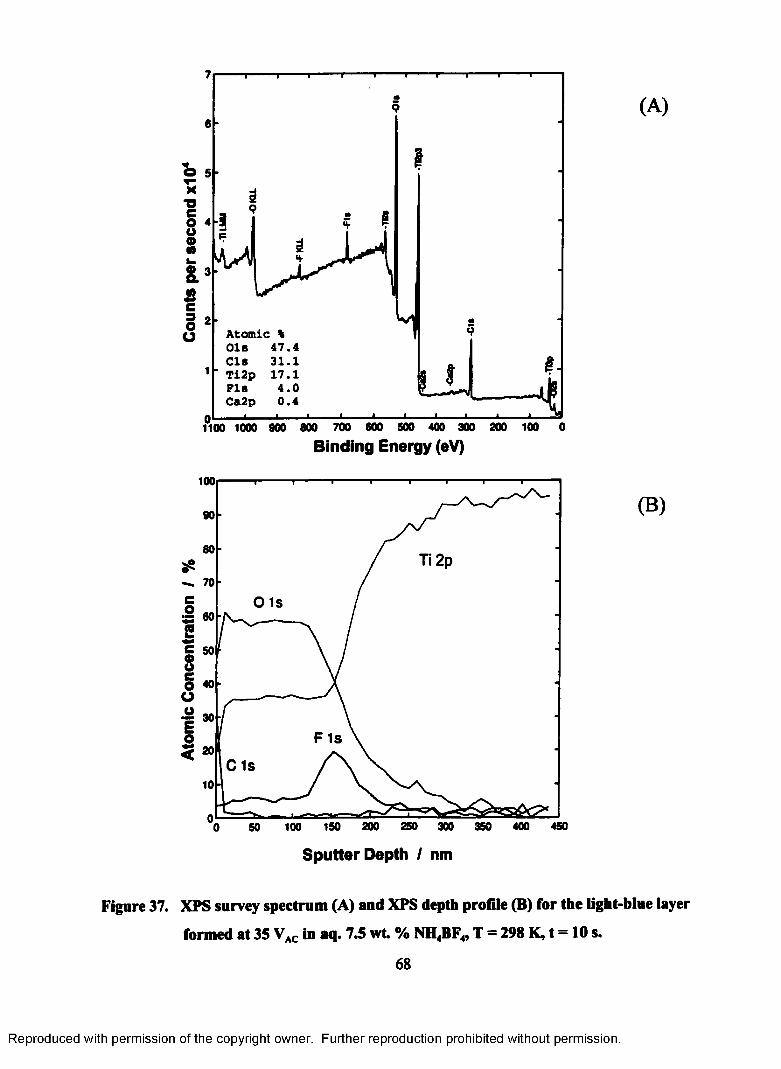
O 5
Atomic % 01b 47.4Cls 31.1
’ Ti2p 17.1 FI 8
Ca2p4.00.4
Binding Energy (eV)
(A)
100
Ti 2p
e01 c
0 1 s
ooeoO01
I F 1s
C 1 s
100 150 200 250 300 350 400 450
Sputter Depth / nm
(B )
Figure 37. XPS survey spectrum (A) and XPS depth profile (B) for the light-blue layer
formed at 35 VAC in aq. 7.5 w t % NH4BF4, T = 298 K, t = 10 s.
68
Reproduced with permission of the copyright owner. Further reproduction prohibited without permission.
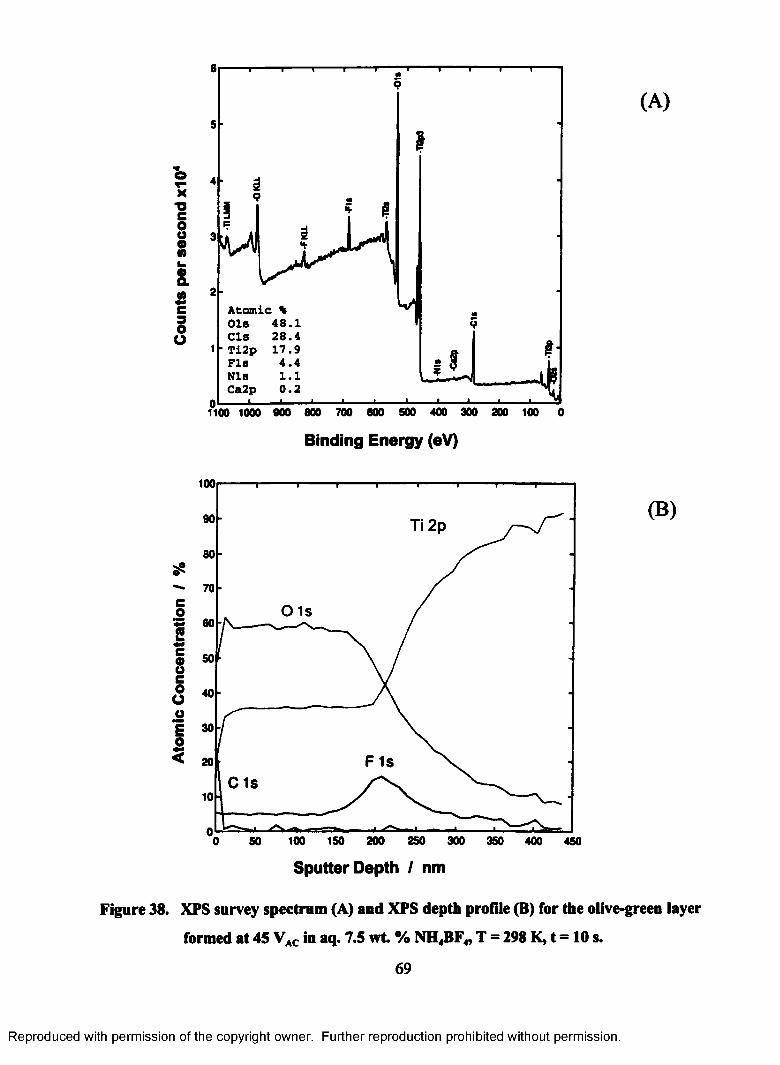
6 i i i i i ^ i i i i ‘ i9
X■oeou•Mh.&8
oo
Atomic % 018 48.1
28.4■ Ti2p
(A)
1100 1000 9 0 0 8 0 0 700 8 0 0 5 0 0 4 0 0 3 0 0 2 0 0 100
Binding Energy (eV)
100
Ti 2p
eo O 1 s2eoucoo01
I FIsC I S
100 150 200 250 300 350 400 450
Sputter Depth I nm
(B )
Figure 38. XPS survey spectrum (A) and XPS depth profile (B) for the olive-green layer
formed at 45 VAC in aq. 7.5 w t % NH4BF4, T = 298 K, t = 10 s.
69
Reproduced with permission of the copyright owner. Further reproduction prohibited without permission.
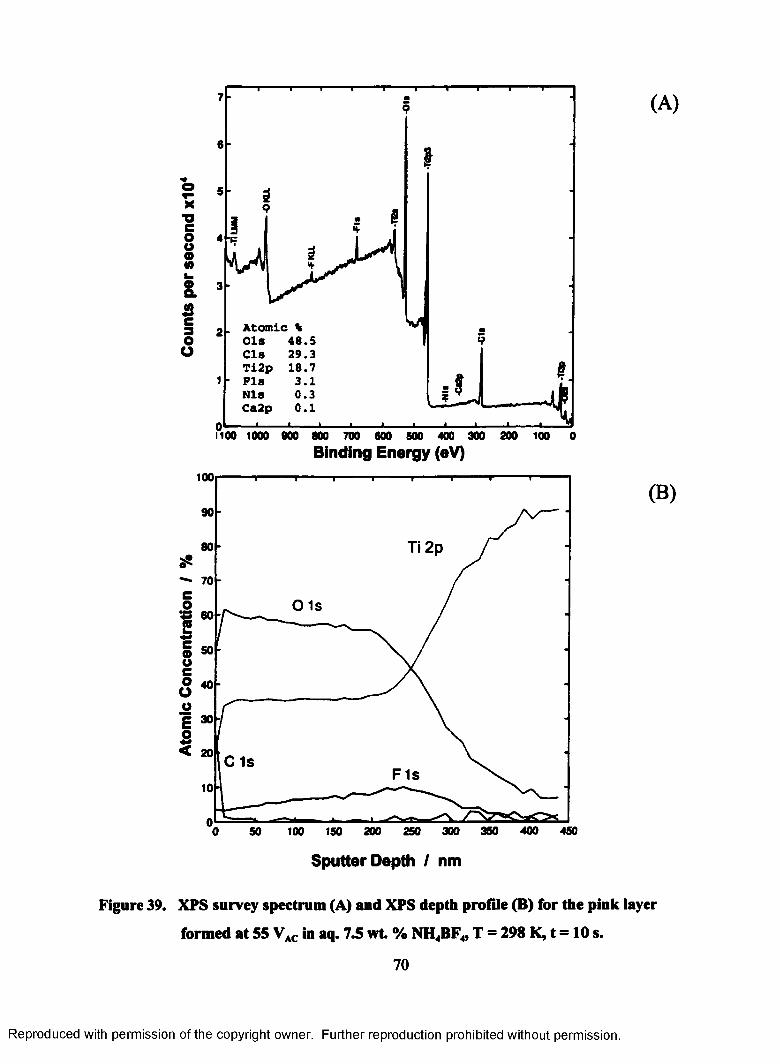
&
oo
4 8 .5
1100 1000 900 800 700 600 S00 400 300 200 100Binding Energy (eV)
100
Ti 2p
co 0 1 s
sc®oeoO01
IC is
F 1s
100 150 200 250 300 350 400 450
(B )
Sputter Depth I nm
Figure 39. XPS survey spectrum (A) and XPS depth profile (B) for the pink layer
formed at 55 VAC in aq. 7.5 w t % NH4BF4, T = 298 K, t = 10 s.
70
Reproduced with permission of the copyright owner. Further reproduction prohibited without permission.
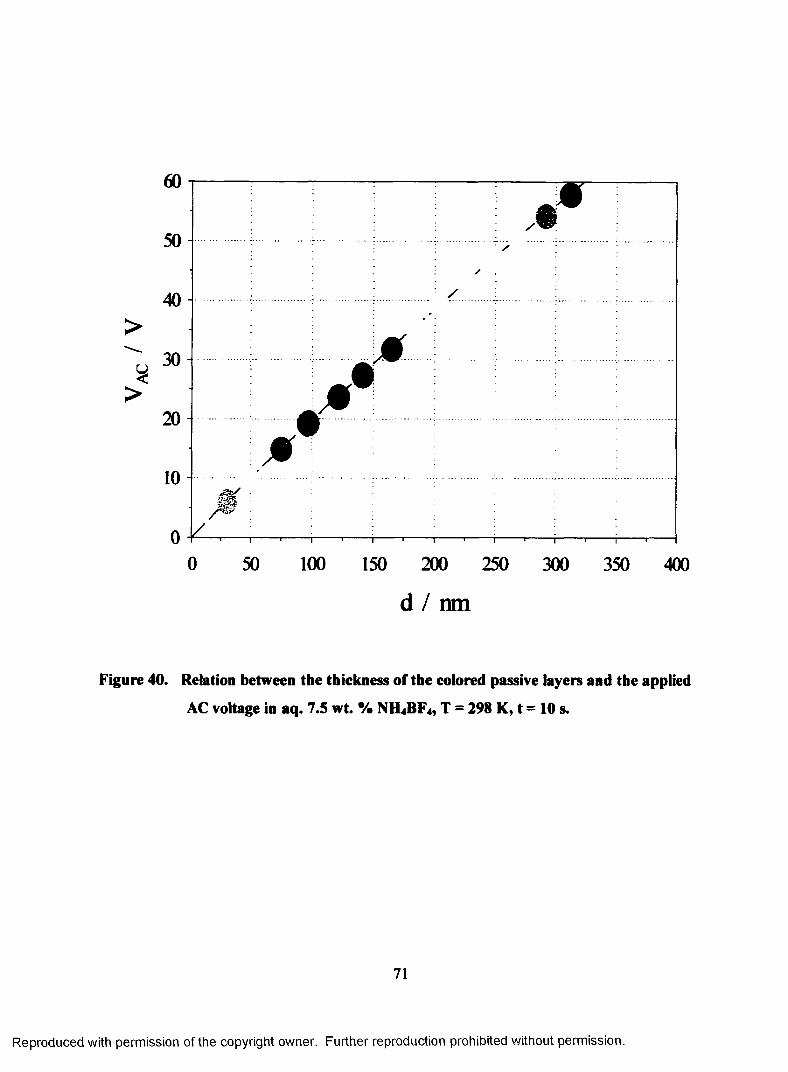
50
40>
30
>2 0
0 50 100 150 200 250 300 350 400
d / n m
Figure 40. Relation between the thickness of the colored passive layers and the applied
AC voltage in aq. 7.5 wt. % NH4BF4, T = 298 K, t = 10 s.
71
Reproduced with permission of the copyright owner. Further reproduction prohibited without permission.
CHAPTERS
ELECTROCHEMICAL CHARACTERIZATION OF TITANIUM AND ITS
COLORED PASSIVE LAYERS
5.1 Electrochemical behavior of Ti and the colored Ti passive layers under open-circuit
conditions
Firstly, we examined the open-circuit behavior of the colored titanium passive layers in the
native electrolyte, thus the solution that was used for preparation of the multicolored passive
films. The fact that the BF4 anion is very aggressive and corrosive for Ti and its colored
layers (S3) is confirmed in Fig. 41 which shows the corrosion potential (E ^J measured vs.
pure Ti (a quasi-reference electrode) in open-circuit conditions as a function of time. The
potential of a corroding surface in an electrolyte, relative to a reference electrode is the
corrosion potential. is also called rest potential, open circuit potential, or freely corroding
potential (49,51).
The relatively fast dissolution (time of dissolution was from 20 to 400 sec.) of the colored
passive layers in 7.5% NH4BF4 was observed. The colors in Fig. 41 present the real color of
the titanium passive films. Right after placing the electrodes in the solution (aqueous 7.5%
NH4BF4) the dissolution starts and the open circuit potential (measured versus freshly etched
Ti electrode of the same surface area as that of the working electrodes) drops. Three different
regions can be observed in the graph: (i) film stability, (ii) film dissolution, and (iii) film
absence regions. Interestingly, the passive film formed on 10 VAC had the longest film
stability region and the dissolution of this film starts only after ca. 400 sec. As we increase the
AC voltage to form the films, their stability in aq. NH4BF4 decreases following the order from
10 to 60 VAC. This behavior means that the thickest does not possess the greatest stability. At
72
Reproduced with permission of the copyright owner. Further reproduction prohibited without permission.
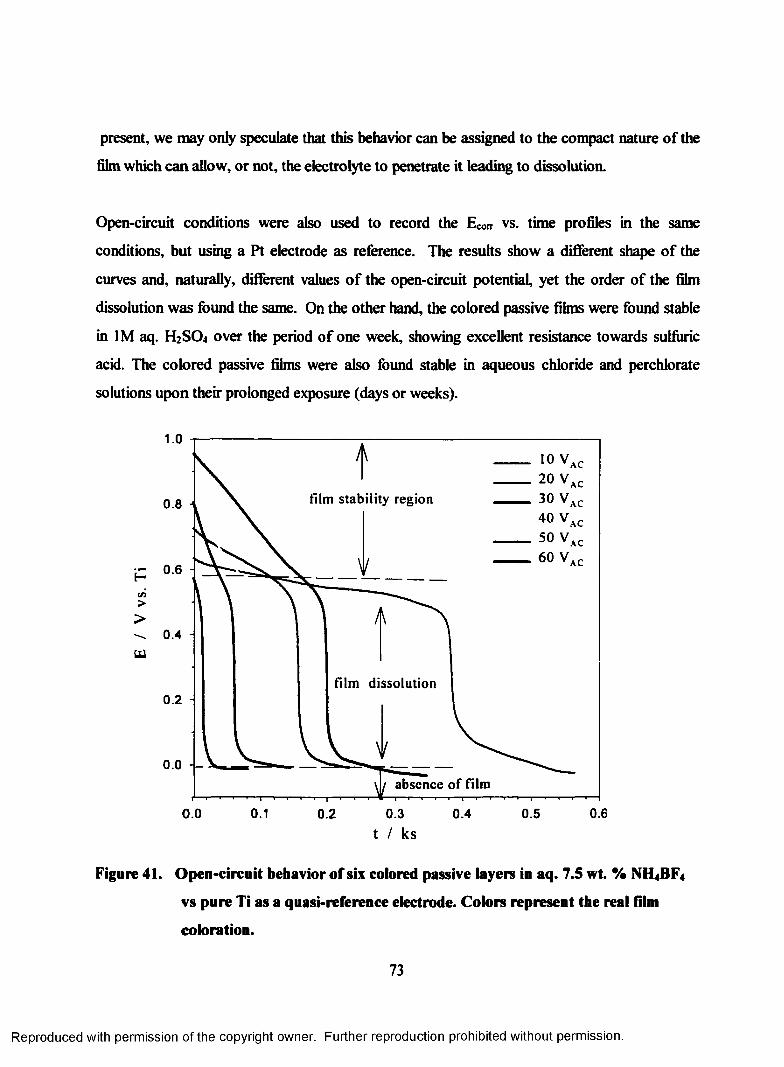
present, we may only speculate that this behavior can be assigned to the compact nature of the
film which can allow, or not, the electrolyte to penetrate it leading to dissolution.
Open-circuit conditions were also used to record the ECOrr vs. time profiles in the same
conditions, but using a Pt electrode as reference. The results show a different shape of the
curves and, naturally, different values of the open-circuit potential, yet the order of the film
dissolution was found the same. On the other hand, the colored passive films were found stable
in 1M aq. H2 S0 4 over the period of one week, showing excellent resistance towards sulfuric
acid. The colored passive films were also found stable in aqueous chloride and perchlorate
solutions upon their prolonged exposure (days or weeks).
Figure 41. Open-circuit behavior o f six colored passive layers in aq. 7.5 wt. % NH4 BF4
film stability region
film dissolution
1.0
^ 0.4 -UJ
w absence o f film
vs pure Ti as a quasi-reference electrode. Colors represent the real film
coloration.
73
Reproduced with permission of the copyright owner. Further reproduction prohibited without permission.
5.2 Polarization curves of Ti and colored Ti layers
Wire-shaped electrodes of metallic Ti (to serve as a reference) and colored passive layers (10,
20,..., 60 VAC) were characterized by recording polarization curves in the - 0.8 - 3.2 V
potential range at the scan rate s = 1 mV s' 1 in 1.0 M aqueous H2S04. We focused particular
attention on determination of the following parameters: (i) the corrosion potential and current
density, E ^ and i ^ (ii) the critical potential and current density, ECT and i„, (iii) the extent of
surface passivation, and (iv) modification of the polarization curve in the HER potential region
(74). Figs. 42, 43, and 44 show three sets of two graphs, each comprising two polarization
curves: (a) the same polarization curve for metallic Ti that serves as a reference, and (b) a
polarization curve for a colored passive film formed at a given AC voltage (10, 20, ... ,
60Vac). An analysis of the results reveals significant changes in the HER region and the
active region prior to the passive one. The current density that can be achieved in the - 0.70 -
Ecorr potential range increases with the increase of applied AC potential of the passive film
formation. Only in the case of the passive films formed at 30, 40, 50 and 60 VAC the current
density of the HER occurring on Ti surpasses that taking place on the respective passive layer.
Econ. and i ^ were determined by linear extrapolation of the respective transients (Fig. 42) and
it was examined how they varied with regard to the applied AC voltage (Fig. 45). The results
reveal that as VAC increases, E ^ shifts towards less-negative potentials; the difference of E ^
between Ti and the 60 VAC film is ca. 190 mV. The displacement of EC0(r towards less-
negative potentials indicates that the colored passive films are more stable (more noble) than
the metallic Ti. The highest value of E ^ shows the passive film formed on 10 VAC. We do
not show a relation between i ^ and VAC because the corrosion current density was only
slightly affected by the passive layer development and it remained in the 1.0 x 1 O' 6 - 5.0 x 10' 6
A cm' 2 range. We determined the critical potential and current density, Ecr and iCT (see inset in
Fig. 42 for the applied methodology) and found that they depend on the applied AC voltage
(Fig. 46). The maximum anodic current density observed in the active region for a metal that
exhibits active-passive behavior is called critical current density (50). The data show that as
74
Reproduced with permission of the copyright owner. Further reproduction prohibited without permission.
VAC increases Ecr moves towards less-negative potentials; the difference of Ea between Ti and
the 10 VAC film is ca. 80 mV. We examined the relation between icr and VAC and observed that
the critical current density varied little as a result of the passive film formation. Its values
were found to fall in the 50 x 10"6 -100 x 10“® A cm' 2 range. In the case of the 50 and 60 VAC
films (see Fig. 44), we observed the emergence of a secondary active-passive transition (50).
At present, we are unable to assign this feature to any specific titanium oxide formation,
although we may say that it corresponds to a transition of a lower oxide to a higher one. This
behavior has not been reported in the literature.
5.3 Tafel plots in the HER region
Since one of the objectives of the research project was to develop Ti-based cathodic materials,
we examined the activity of the colored Ti passive films towards the HER. The activity
examination was accomplished by recording Tafel polarization curves (75) between 0.00 and
(- 0.80) V vs. RHE, in 1.0 M aq. H2S04. The selection of the pre-treatment conditions as well
as the program used to obtain reproducible and meaningful steady-state Tafel polarization
curves is essential (76, 77). In the course of research, we applied the so-called rectangular
program (Fig. 47) to obtain cathodic polarization curves. The program comprised the initial
conditioning at Econd = - 0.80 V vs. RHE, for tcond = 60 s. Following the conditioning, a given
negative overpotential, r|, was applied for a period of time sufficiently long for a steady-state
current density, iM, to become established, here At = 60 s (see inset in Fig. 47). Once iM had
been determined, the electrode was conditioned at E , = 0.00 V for At = 60 s and then a new
negative over potential (increased by Ar| with respect to r|, Fig. 47) was applied and the new
steady-state current density was measured.
Figs. 48, 49, and 50 show three sets of two graphs, each comprising two steady-state Tafel
plots: a Tafel plot for the metallic Ti to serve as a reference, and a Tafel plot for a colored
passive film fonned at a given AC voltage (10 ,2 0 ,..., 60 VAC).
75
Reproduced with permission of the copyright owner. Further reproduction prohibited without permission.
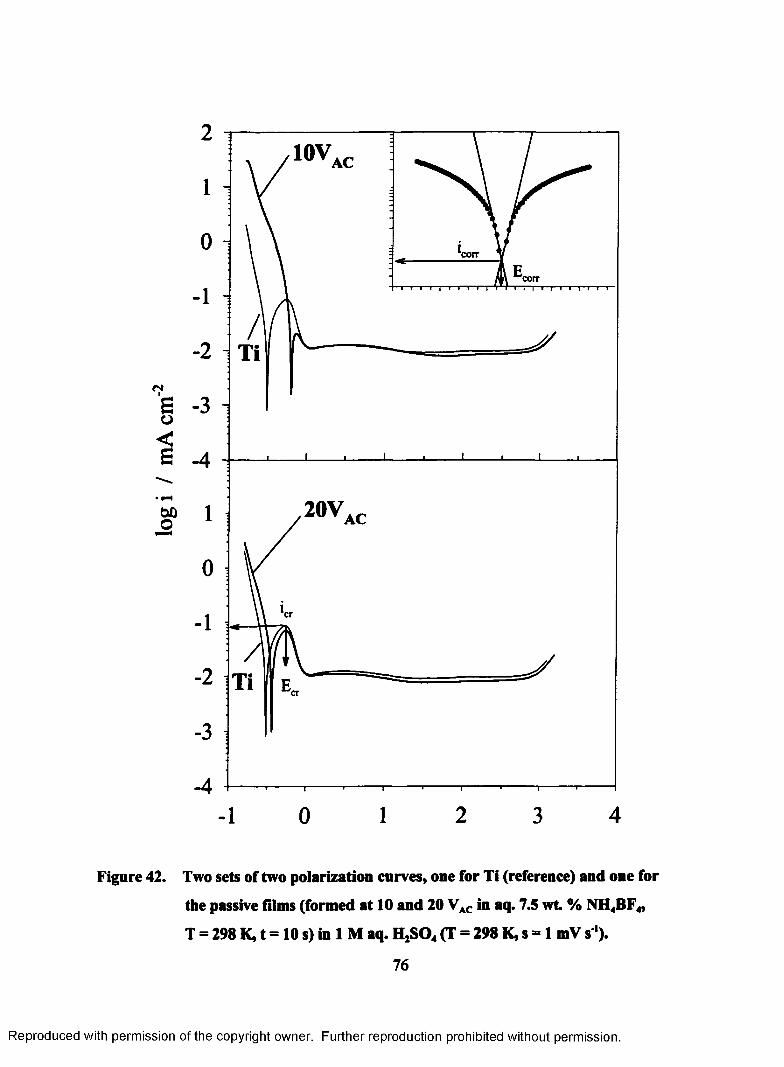
CM
Bo
2
1
0 corr
corr
1
2
3
4
1
0
cr1
2
3
44
Figure 42. Two sets of two polarization curves, one for Ti (reference) and one for
the passive films (formed at 10 and 20 VAC in aq. 7.5 w t % NH4BF4,
T = 298 K, t = 10 s) in 1 M aq. H2S 0 4 (T = 298 K, s = 1 mV s ').
76
Reproduced with permission of the copyright owner. Further reproduction prohibited without permission.
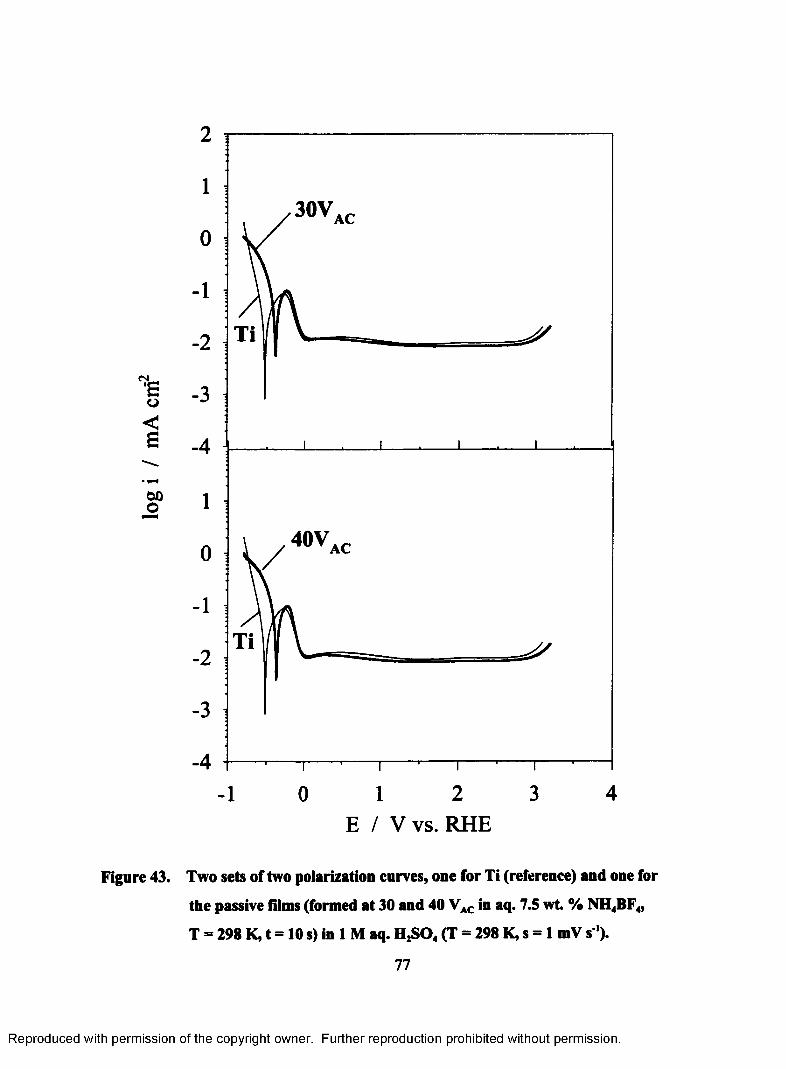
2
N■eo<£
60o
0
1
2
3
-4
1
-4- 1
T
0
0
1
2
3
1 2 3E / V vs. RHE
Figure 43. Two sets of two polarization curves, one for Ti (reference) and one for
the passive films (formed at 30 and 40 VAC in aq. 7.5 w t % NH4BF4,
T = 298 K, t = 10 s) in 1 M aq. H2S 0 4 (T = 298 K, s = 1 mV s ').
77
Reproduced with permission of the copyright owner. Further reproduction prohibited without permission.
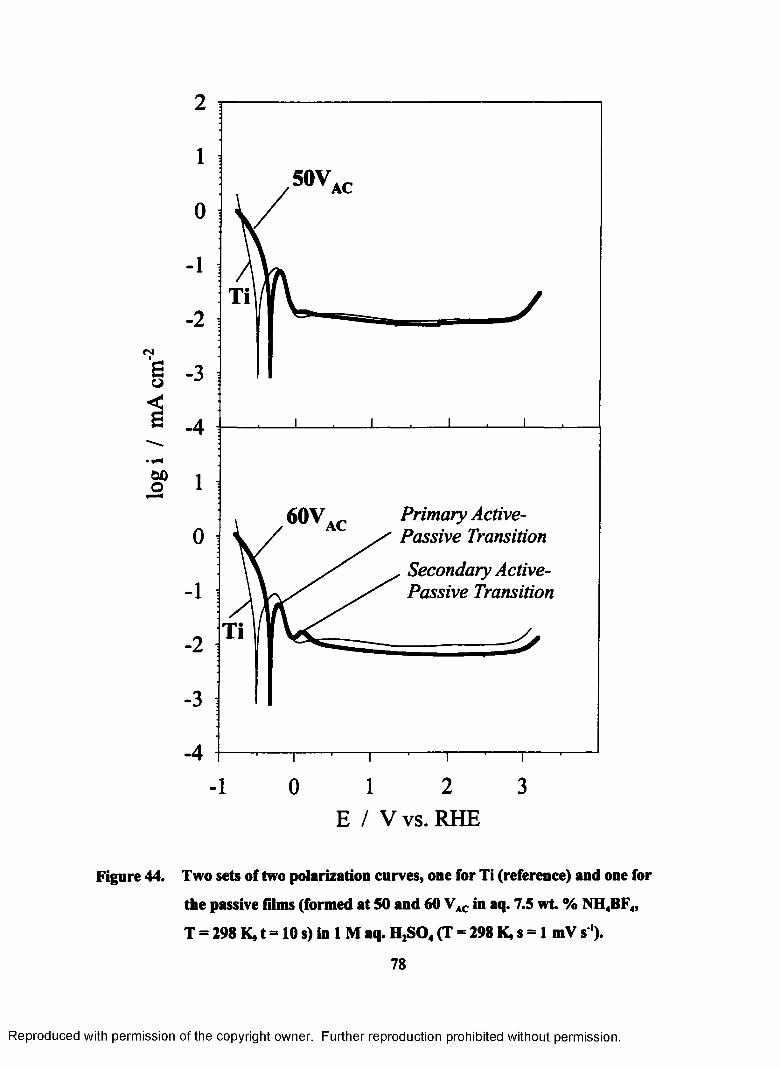
log
i /
mA
cm
fNi
Figure 44.
2
1
0
1
2
3
4
1
Primary Active- Passive Transition
. Secondary Active- Passive Transition
0
1
2
3
4- 1 0 1 2 3
E / V vs. RHE
Two sets of two polarization curves, one for Ti (reference) and one for
the passive films (formed at 50 and 60 VAC in aq. 7.5 w t % NH4BF4,
T = 298 K, t = 10 s) in 1 M aq. H2S 0 4 (T = 298 K, s = 1 mV s ').
78
Reproduced with permission of the copyright owner. Further reproduction prohibited without permission.
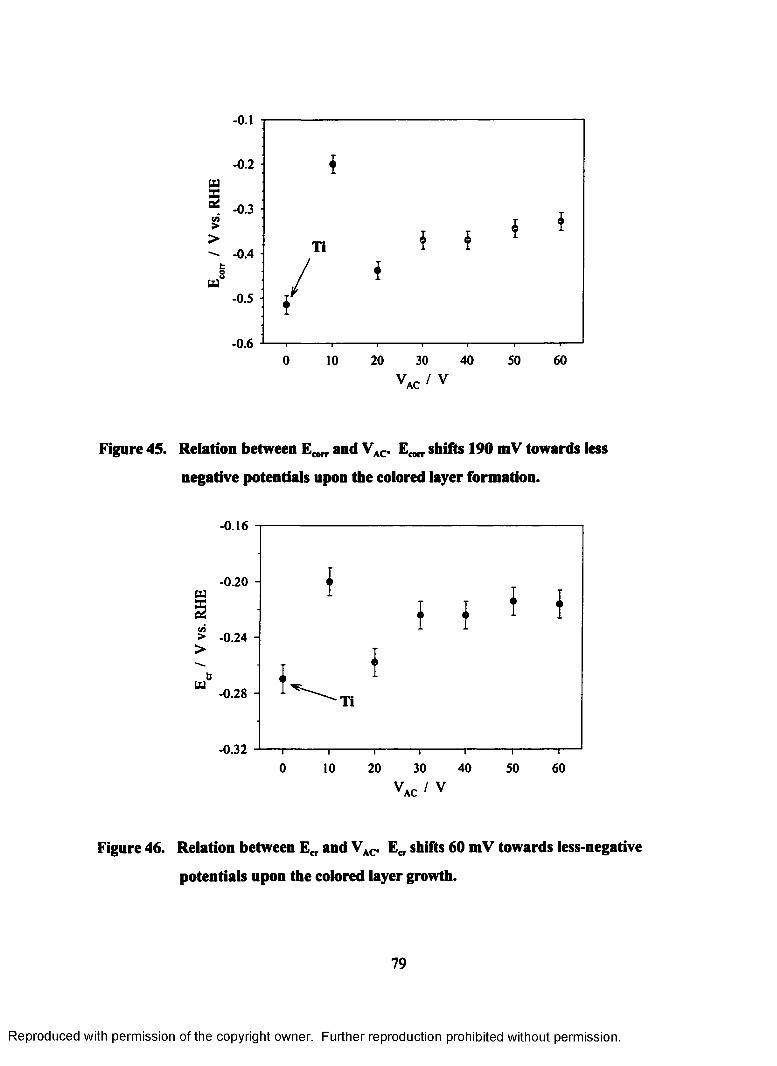
w
03>•
M
-0.1
- 0.2
- 0.3
- 0.4
- 0.5
- 0.60 20 30 40 50 6010
v AC/ v
Figure 45. Relation between and vAC. shifts 190 mV towards less
negative potentials upon the colored layer formation.
- 0.16
- 0.20 -
03> - 0.24 -
>U
- 0.28 -
- 0.320 20 30 40 50 6010
v AC/ V
Figure 46. Relation between Ecr and VAC- Ecr shifts 60 mV towards less-negative
potentials upon the colored layer growth.
79
Reproduced with permission of the copyright owner. Further reproduction prohibited without permission.
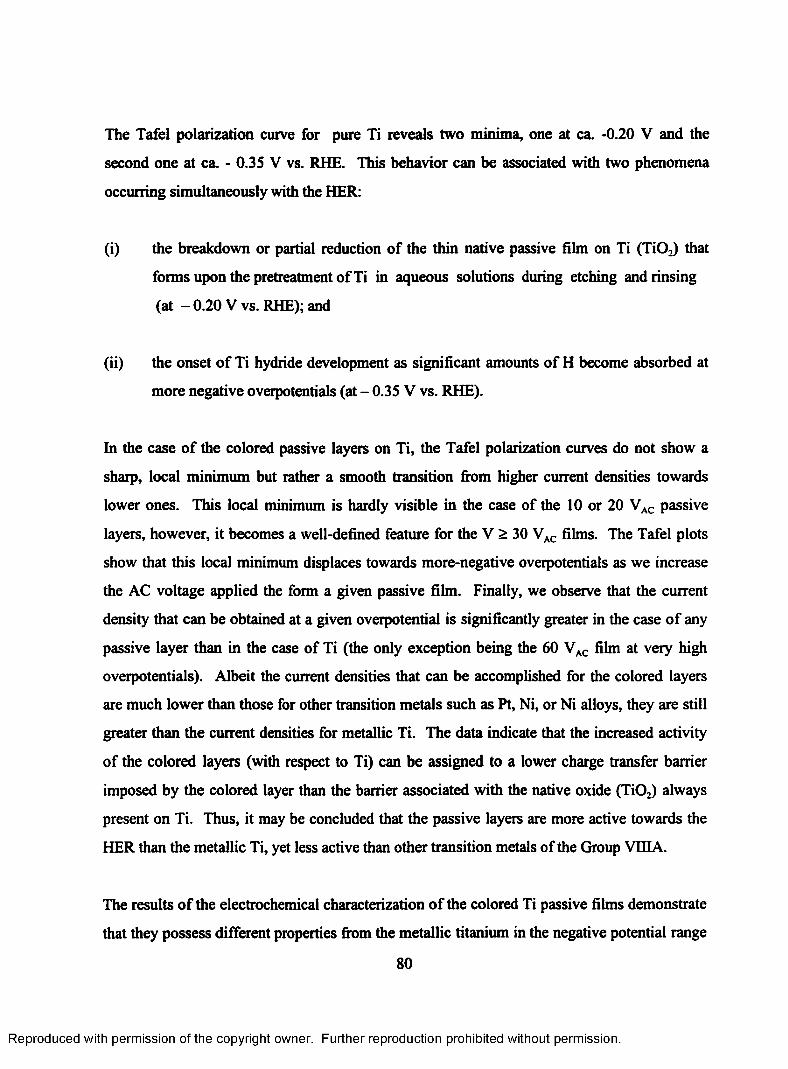
The Tafel polarization curve for pure Ti reveals two minima, one at ca. -0.20 V and the
second one at ca. - 0.35 V vs. RHE. This behavior can be associated with two phenomena
occurring simultaneously with the HER:
(i) the breakdown or partial reduction of the thin native passive film on Ti (Ti02) that
forms upon the pretreatment of Ti in aqueous solutions during etching and rinsing
(at -0 .20 V vs. RHE); and
(ii) the onset of Ti hydride development as significant amounts of H become absorbed at
more negative overpotentials (at - 0.35 V vs. RHE).
In the case of the colored passive layers on Ti, the Tafel polarization curves do not show a
sharp, local minimum but rather a smooth transition from higher current densities towards
lower ones. This local minimum is hardly visible in the case of the 10 or 20 VAC passive
layers, however, it becomes a well-defined feature for the V > 30 VAC films. The Tafel plots
show that this local minimum displaces towards more-negative overpotentials as we increase
the AC voltage applied the form a given passive film. Finally, we observe that the current
density that can be obtained at a given overpotential is significantly greater in the case of any
passive layer than in the case of Ti (the only exception being the 60 VAC film at very high
overpotentials). Albeit the current densities that can be accomplished for the colored layers
are much lower than those for other transition metals such as Pt, Ni, or Ni alloys, they are still
greater than the current densities for metallic Ti. The data indicate that the increased activity
of the colored layers (with respect to Ti) can be assigned to a lower charge transfer barrier
imposed by the colored layer than the barrier associated with the native oxide (Ti02) always
present on Ti. Thus, it may be concluded that the passive layers are more active towards the
HER than the metallic Ti, yet less active than other transition metals of the Group VELA.
The results of the electrochemical characterization of the colored Ti passive films demonstrate
that they possess different properties from the metallic titanium in the negative potential range
80
Reproduced with permission of the copyright owner. Further reproduction prohibited without permission.
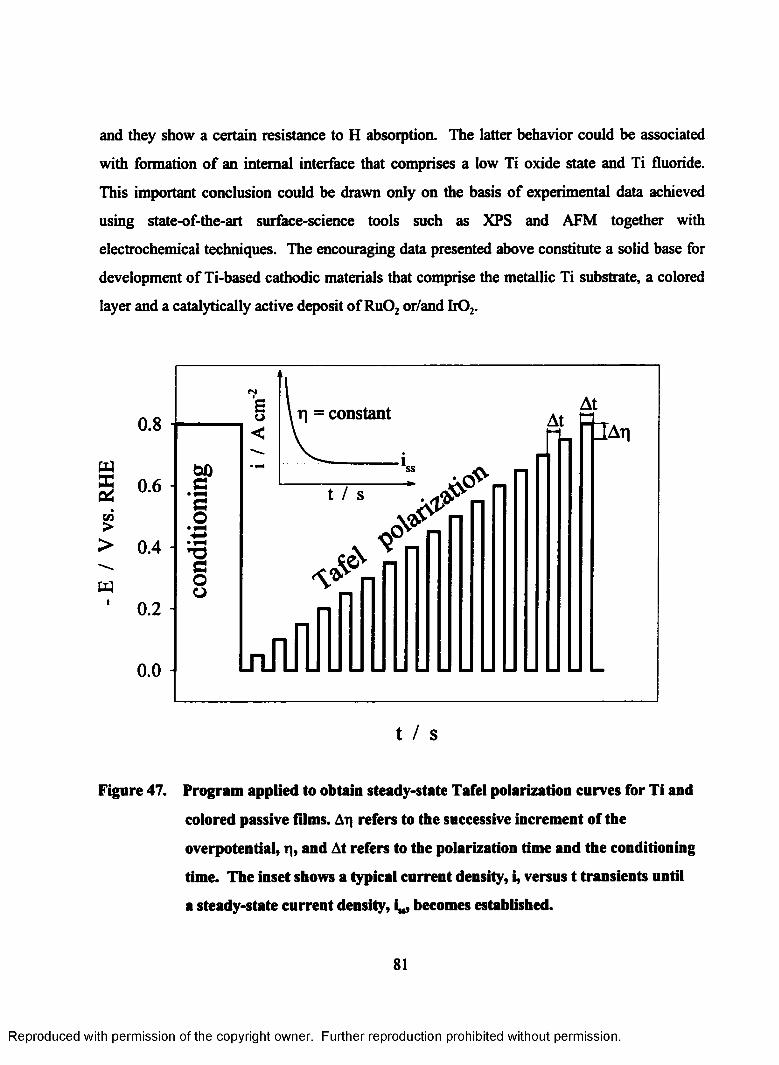
and they show a certain resistance to H absorption. The latter behavior could be associated
with formation of an internal interface that comprises a low Ti oxide state and Ti fluoride.
This important conclusion could be drawn only on the basis of experimental data achieved
using state-of-the-art surface-science tools such as XPS and AFM together with
electrochemical techniques. The encouraging data presented above constitute a solid base for
development of Ti-based cathodic materials that comprise the metallic Ti substrate, a colored
layer and a catalytically active deposit of RuOz or/and Ir02.
CO>
<NT| = constant
t l A t l0.8
0.6
0.4
0.2
0.0
t / s
Figure 47. Program applied to obtain steady-state Tafel polarization curves for Ti and
colored passive films. Aq refers to the successive increment of the
overpotential, t], and At refers to the polarization time and the conditioning
time. The inset shows a typical current density, i, versus t transients until
a steady-state current density, i„, becomes established.
81
Reproduced with permission of the copyright owner. Further reproduction prohibited without permission.
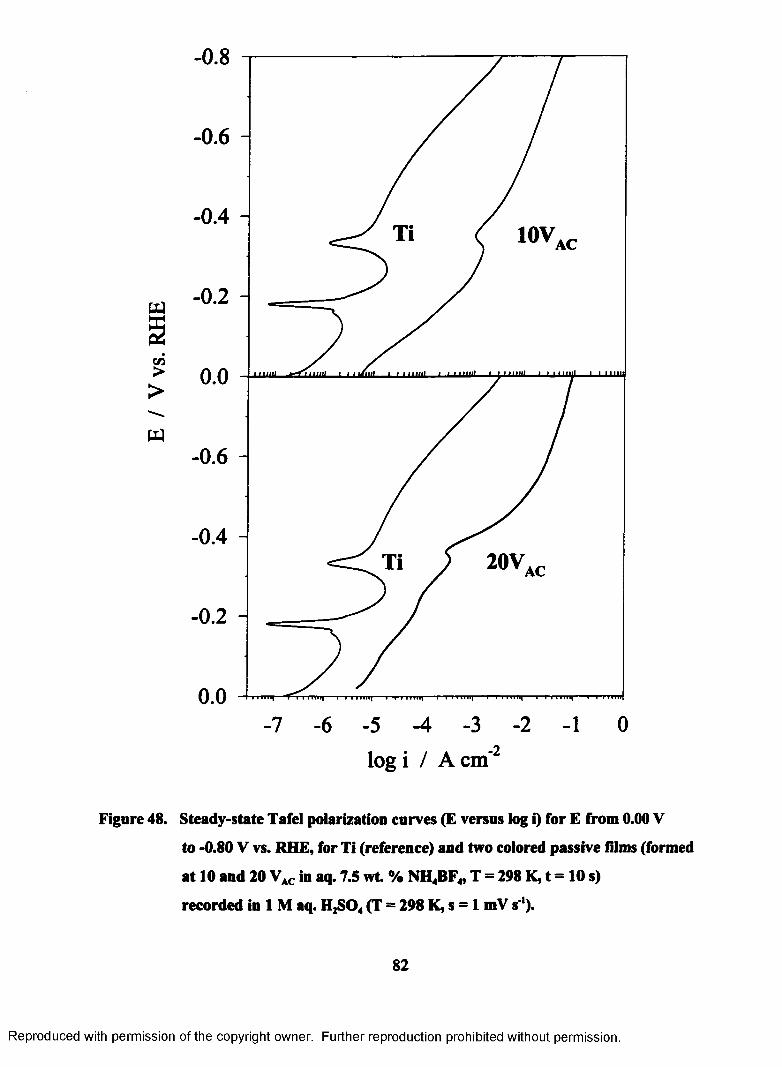
E /
V v
s.
-0.8
- 0.6 -
-0.4 -
- 0.2 -
0.0
- 0.6 -
-0.4 -
- 0.2 -
0.0 ■mr
2 -1 0
l o g i / A c m ' 2
Figure 48. Steady-state Tafel polarization curves (E versus log i) for E from 0.00 V
to -0.80 V vs. RHE, for Ti (reference) and two colored passive films (formed
at 10 and 20 VAC in aq. 7.5 w t % NH4BF4, T = 298 K, t = 10 s)
recorded in 1 M aq. H2S0 4 (T = 298 K, s = 1 mV s’1).
82
Reproduced with permission of the copyright owner. Further reproduction prohibited without permission.
E /
V vs
.
-0.8
- 0.6 -
-0.4 -
- 0.2 -
0.0
- 0.6 -
-0.4 -
- 0.2 -
0.0
l o g i / A c m ’2
Figure 49. Steady-state Tafel polarization curves (E versus log i) for E from 0.00 V
to -0.80 V vs. RHE, for Ti (reference) and two colored passive films (formed
at 30 and 40 VAC in aq. 7.5 w t % NH4BF4, T = 298 K, t = 10 s)
recorded in 1 M aq. H2S 0 4 (T = 298 K, s = 1 mV s'1).
83
Reproduced with permission of the copyright owner. Further reproduction prohibited without permission.
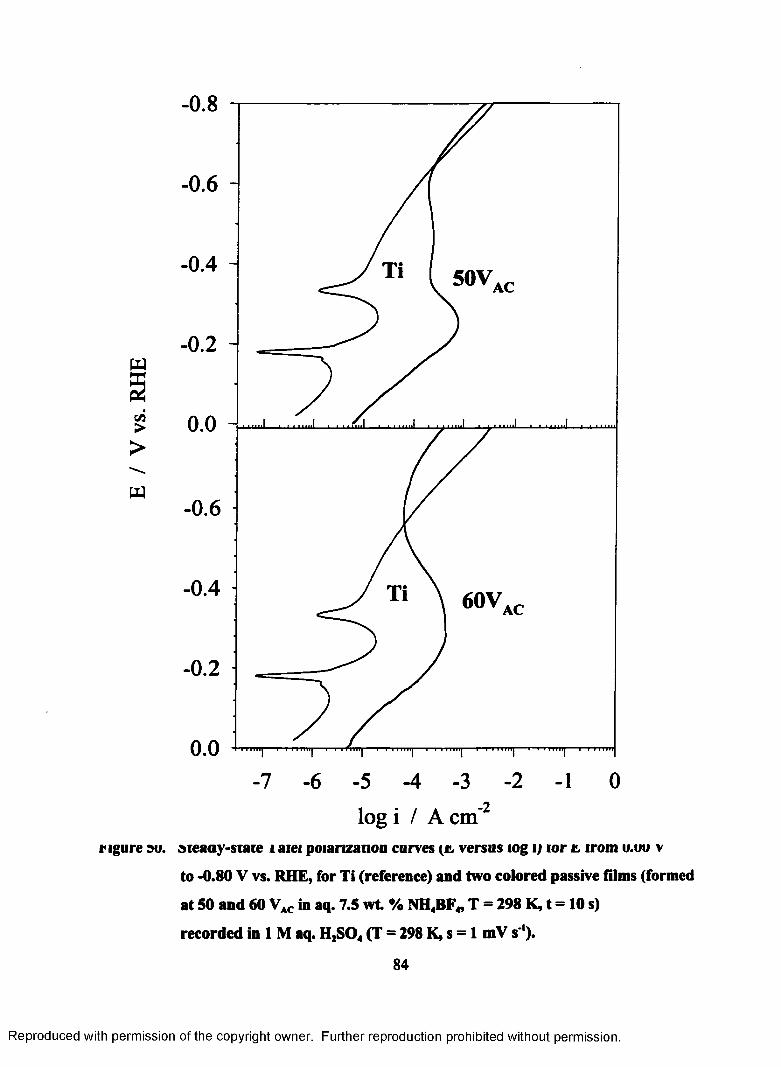
E /
V vs
.-0.8
- 0.6 -
-0.4 -
- 0.2 -
0.0 J
- 0.6
-0.4
- 0.2
0.02 1
log i / A cm'2figure 9 v. steaay-siaie i aiei poianzanon curves (t, versus tog if to r t irom u.uu v
to -0.80 V vs. RHE, for Ti (reference) and two colored passive films (formed
at 50 and 60 VAC in aq. 7.5 w t % NH4BF4, T = 298 K, t = 10 s)
recorded in 1 M aq. H2S0 4 (T = 298 K, s = 1 mV s ').
84
Reproduced with permission of the copyright owner. Further reproduction prohibited without permission.
5.4 Influence of prolonged cathodic polarization on morphology and electrochemical
behavior of titanium
In order to examine the resistance of titanium towards hydrogen embrittlement, we applied a
constant negative current (-100 mA cm'2) to a Ti electrode for different periods of time using a
Hewlett Packard 6034A power supply. After each period of cathodic polarization, the
electrode’s morphology was examined by SEM and a polarization curve was recorded in order
to analyze the changes in the electrochemical characteristics of titanium.
In Fig. 51, we show the results of SEM morphology analysis of the titanium electrode after the
cathodic polarization. Fig. 51A refers to the Ti electrode freshly prepared and etched. The
polycrystalline Ti structure with grains and grain boundaries with fairly uniform and non-
destructed surface can easily be observed. After 1 hour of cathodic polarization (Fig. 5 IB), the
morphology changes such as the appearance of pores and cracks along grain boundaries can be
observed. Even by a naked eye, we noticed changes in the color of the electrode, which
becomes dark-gray. After 4 additional hours of cathodic polarization (5 hrs in total), we
observe (Fig. 51C) a progress in the cracking of titanium. The cracks becomes more
pronounced and numerous. Moreover, the appearance of black points can represent the pitting
of titanium (1) after 5 h of negative current application. Fig. 5ID shows the black-grayish
titanium hydride surface with clearly visible mechanical failure pits, cracks and inclusions
produced after 10 h of cathodic polarization. Thus, the SEM analysis absolutely confirmed
some previous results (49,52).
Not only mechanical properties but also electrochemical behavior of cathodicaly charged
titanium electrodes were examined. The results show some unexpected and interesting
behavior, such as the shift of the corrosion potential towards less negative values as we
increase the time of cathodic polarization.
85
Reproduced with permission of the copyright owner. Further reproduction prohibited without permission.
Fig. 52 shows polarization curves for pure and fresh Ti and Ti after the application of negative
current density (cathodic polarization) for 3 h, 5 h, and 15 h. The corrosion parameters were
determined the same way as in the case of the colored passive layers (see Section 5.2). We
observe that upon an increase of the time of cathodic polarization, shifts from -0.48 V
(RHE) for pure Ti, to - 0.41 V after 3 h of cathodic charging, and to - 0.35 V upon 5 h of
cathodic charging. Finally, the corrosion potential stabilizes at - 0.33 V after 15 h of cathodic
polarization. This shift of E ^ towards less negative values upon prolonged cathodic
polarization does not mean that Ti becomes more noble with the hydrogen penetration,.
Finally, the outcome of mechanical disintegration and corrosion of Ti caused by hydrogen
penetration is clearly shown on Fig. 51.
The other electrochemical parameters such as E „ , i„, and iCOfr follow the overall tendency, i.e.
they shift towards higher values upon cathodic charging. The role of the colored Ti passive
layers as a barrier towards hydrogen embrittlement is negligible in the case of the cathodic
charging for several hours. However, it cannot be excluded that further chemical treatment
and modification could result in layers that become an effective barrier to H interfacial
transfer.
86
Reproduced with permission of the copyright owner. Further reproduction prohibited without permission.
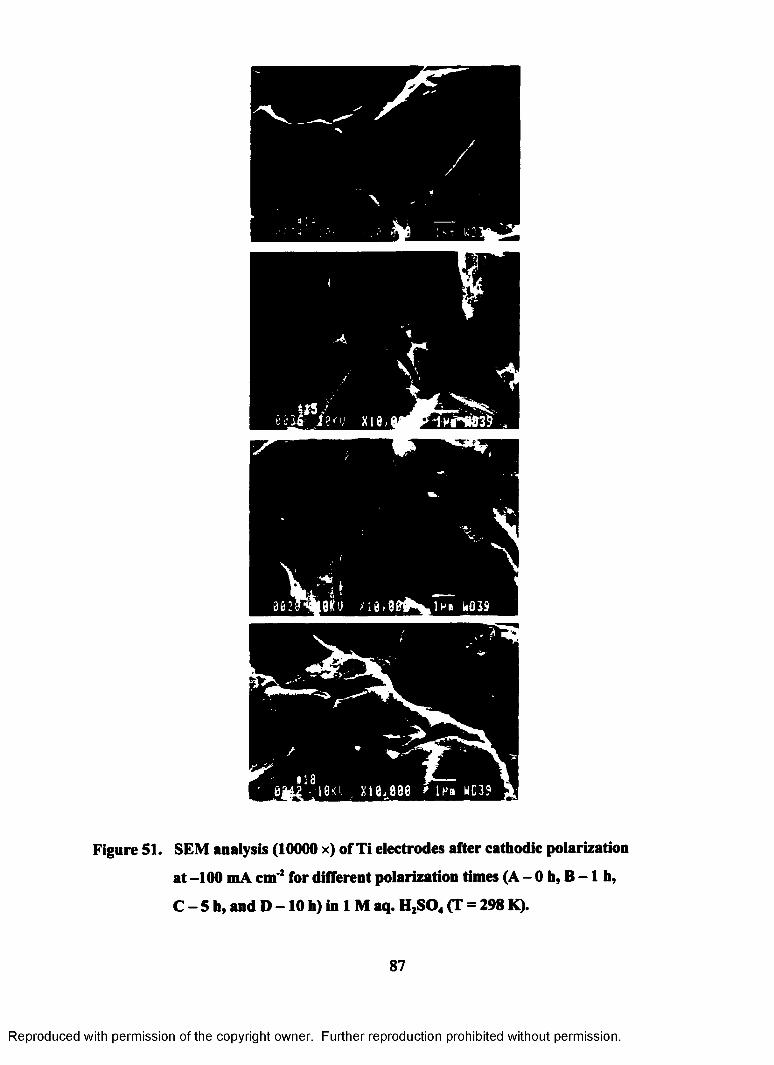
Figure 51. SEM analysis (10000 x) of Ti electrodes after cathodic polarization
at -100 mA cm' 2 for different polarization times (A - 0 h, B - 1 h,
C - 5 h, and D -1 0 h) in 1 M aq. H2S 0 4 (T = 298 K).
87
Reproduced with permission of the copyright owner. Further reproduction prohibited without permission.
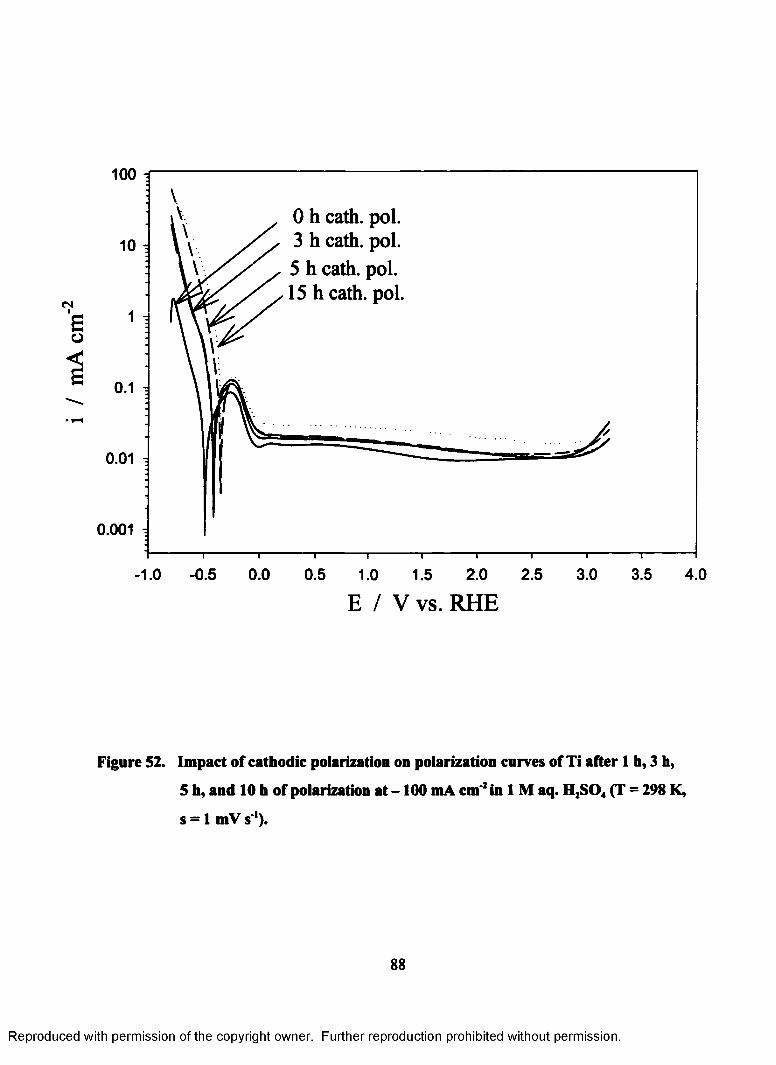
i /
mA
cm
100
0 h cath. pol. 3 h cath. pol.5 h cath. pol. 15 h cath. pol.
0.1
0.01 .0.001 i
—i—3.0
I---------- 1---1.0 -0.5
—I— 0.0
—I— 2.0
I1.5 3.5 4.0
E / V vs. RHE
Figure 52. Impact of cathodic polarization on polarization curves of Ti after 1 h, 3 h,
5 h, and 10 h of polarization a t - 100 mA cm' 2 in 1 M aq. H2S 0 4 (T = 298 K,
s = 1 mV s'1).
Reproduced with permission of the copyright owner. Further reproduction prohibited without permission.
CHAPTER 6
SURFACE CHEMICAL MODIFICATION OF THE COLORED TITANIUM PASSIVE
LAYERS BY DEPOSITION OF RUTHENIUM OR/AND IRIDIUM OXIDE
Modification of the surface chemical composition and electrochemical properties of the
colored titanium passive films was carried out by thermal decomposition of a respective
chlorides (MC13, M = Ru or Ir) which result with deposition and intercalation of metal oxides
(R u0 2 or/and IrOj) on the surface of the colored layers of titanium (see Experimental). The
interest in the surface modified Ti electrodes arises from the necessity to develop a suitable Ti-
based cathodic material for the chlor-alkali industry where the carbon-steel electrode is unable
to withstand the highly corrosive environment and has to be periodically replaced. However,
its chemical stability can be enhanced through surface doping with Ru or/and Ir oxides
accomplished through pyrolysis of the respective chlorides (RuC13 or IrCl3). The surface-
chemical modification of Ti0 2 with Ir02 or Ru0 2 modifies the electronic properties of Ti0 2
from semi-conducting to electronically conducting. Such prepared chemically modified mixed
oxide layers reveal good catalytic properties towards the electrolytic 0 2 and Cl2 generation and
are used as anode materials. Morphology of those modified layers was studied with SEM
technique in order to obtain the information about surface characteristics of different noble
metal oxide layers.
The objective of this work was to examine if surface-chemical modification of the colored Ti
passive layers with Ru0 2 or/and Ir02 would result in catalytically active yet crack-free
materials. It is well established that chemical modification of T i0 2 with Ru02 or/and Ir0 2
leads to an active but cracked and fractured layer (79,83). The presence of these structural
defects makes them unsuitable as cathode materials because they do not protect the underlying
Ti substrate that, eventually, becomes a subject of H embrittlement.
89
Reproduced with permission of the copyright owner. Further reproduction prohibited without permission.
6.1 Morphology and chemical composition of the chemically modified layers of Ti
The morphology of the catalytic layers depends on a number of factors: (i) technique of
solution spreading (immersion, brushing, spraying), (ii) solution concentration, (iii) film
thickness, (iv) decomposition temperature, (v) heating rate, and (vi) atmosphere over the
sample during the decomposition. Therefore, the selection of the suitable technique depends
on the desired composition, morphology and cost (laboratory experiments vs. industrial
production).
Fig. S3 shows SEM micrographs of three representative samples of doped Ti passive layers:
Ru0 2 (Fig. 53A), Ir0 2 (Fig. 53B) and Ru02+Ir02 (Fig. 53C). These three layers are deposited
on the passive film formed at 40 VAC- The magnification is 2400 x for all the samples and it
allows us to clearly examine the roughness and the morphology of the prepared electrode.
There is a prominent difference in morphology between the RuOz and Ir0 2 layers (Figs. 53A
and S3B). The coatings obtained by thermal decomposition show a large number of
interconnected microcracks that form discrete surface islands. Hence, the active surface area
of the electrode has increased leading to a large capacitive charging current (see Section 6.2.4).
The Ru02+Ir02 layer (Fig. 53C) presents mixed morphology characteristics of the Ru02 and
Ir0 2 layers. Moreover, the Ir0 2 and Ru0 2+Ir02 layers are cracked (29, 78), but the Ru02 layer
deposited on the 40 VAC Ti passive layer is uniform, and importantly, crack-free.
In order to determine the chemical composition of the layers and to verify the applicability of
the thermal treatment, an EDX analysis of the samples was performed. Fig. 54 shows the
results of the EDX measurements performed on the same samples that were characterized by
SEM. In order to facilitate the analysis, Fig. 54 comprises both EDX spectra and SEM
micrographs. The results reveals pronounced Ru+Ti, Ir+Ti, and Ru+Ir+Ti signals showing
that the thermal decomposition of the respective chlorides leads to a deposition of M02 (M =
Ru, Ir, Ru + Ir) and its subsequent doping into the film via the solid-state diffusion (mixed
solid-state mixed compound). Since EDX analysis does not reveal the presence of Cl
90
Reproduced with permission of the copyright owner. Further reproduction prohibited without permission.
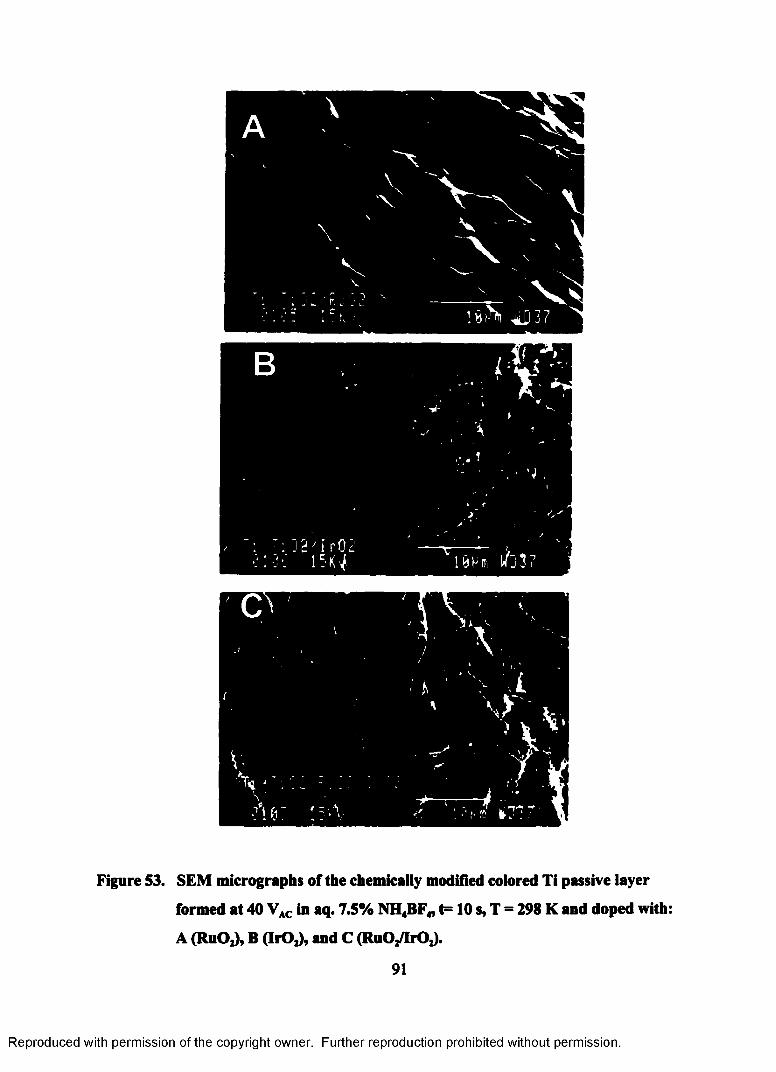
Figure S3. SEM micrographs of the chemically modified colored Ti passive layer
formed at 40 VAC in aq. 7.5% NH4BF4, t= 10 s, T = 298 K and doped with:
A (RuOj), B (IrOj), and C (RuOj/IrOj).
91
Reproduced with permission of the copyright owner. Further reproduction prohibited without permission.
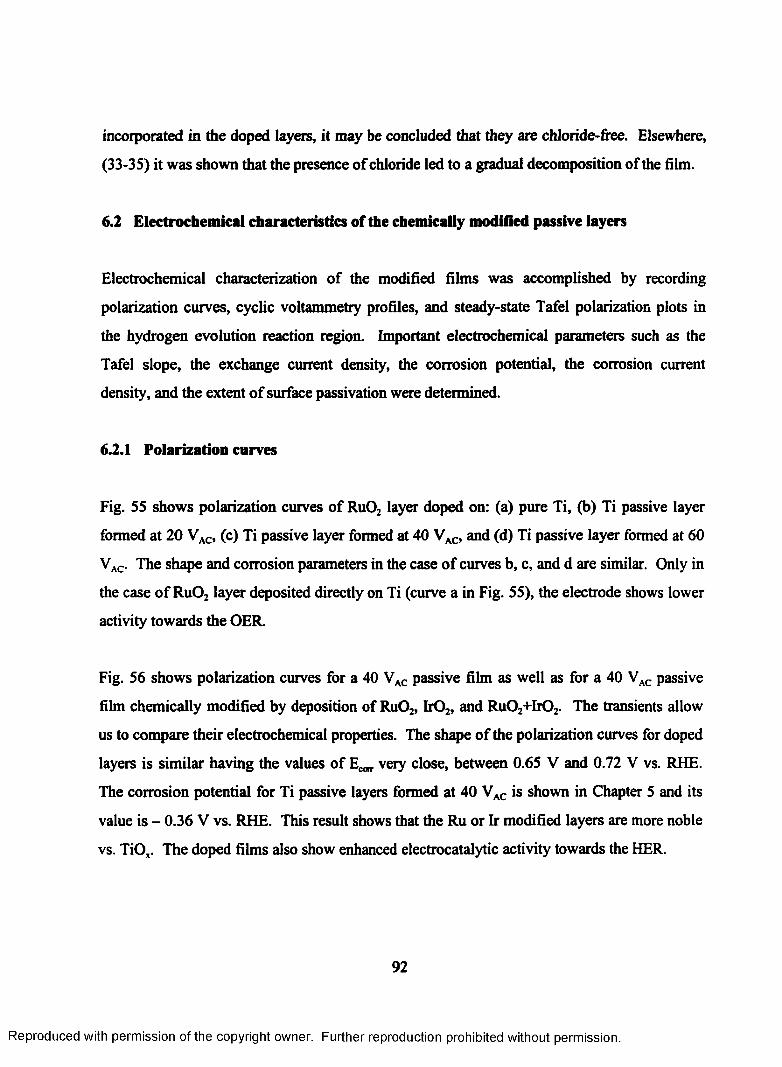
incorporated in the doped layers, it may be concluded that they are chloride-free. Elsewhere,
(33-35) it was shown that the presence of chloride led to a gradual decomposition of the film.
6.2 Electrochemical characteristics of the chemically modified passive layers
Electrochemical characterization of the modified films was accomplished by recording
polarization curves, cyclic voltammetry profiles, and steady-state Tafel polarization plots in
the hydrogen evolution reaction region. Important electrochemical parameters such as the
Tafel slope, the exchange current density, the corrosion potential, the corrosion current
density, and the extent of surface passivation were determined.
6.2.1 Polarization curves
Fig. 55 shows polarization curves of RuOz layer doped on: (a) pure Ti, (b) Ti passive layer
formed at 20 VAC, (c) Ti passive layer formed at 40 VAC, and (d) Ti passive layer formed at 60
VAC. The shape and corrosion parameters in the case of curves b, c, and d are similar. Only in
the case of RuOz layer deposited directly on Ti (curve a in Fig. 55), the electrode shows lower
activity towards the OER.
Fig. 56 shows polarization curves for a 40 VAC passive film as well as for a 40 VAC passive
film chemically modified by deposition of Ru02, Ir02, and Ru0 2+Ir02. The transients allow
us to compare their electrochemical properties. The shape of the polarization curves for doped
layers is similar having the values of E ^ very close, between 0.65 V and 0.72 V vs. RHE.
The corrosion potential for Ti passive layers formed at 40 VAC is shown in Chapter 5 and its
value is - 0.36 V vs. RHE. This result shows that the Ru or Ir modified layers are more noble
vs. TiOx. The doped films also show enhanced electrocatalytic activity towards the HER.
92
Reproduced with permission of the copyright owner. Further reproduction prohibited without permission.
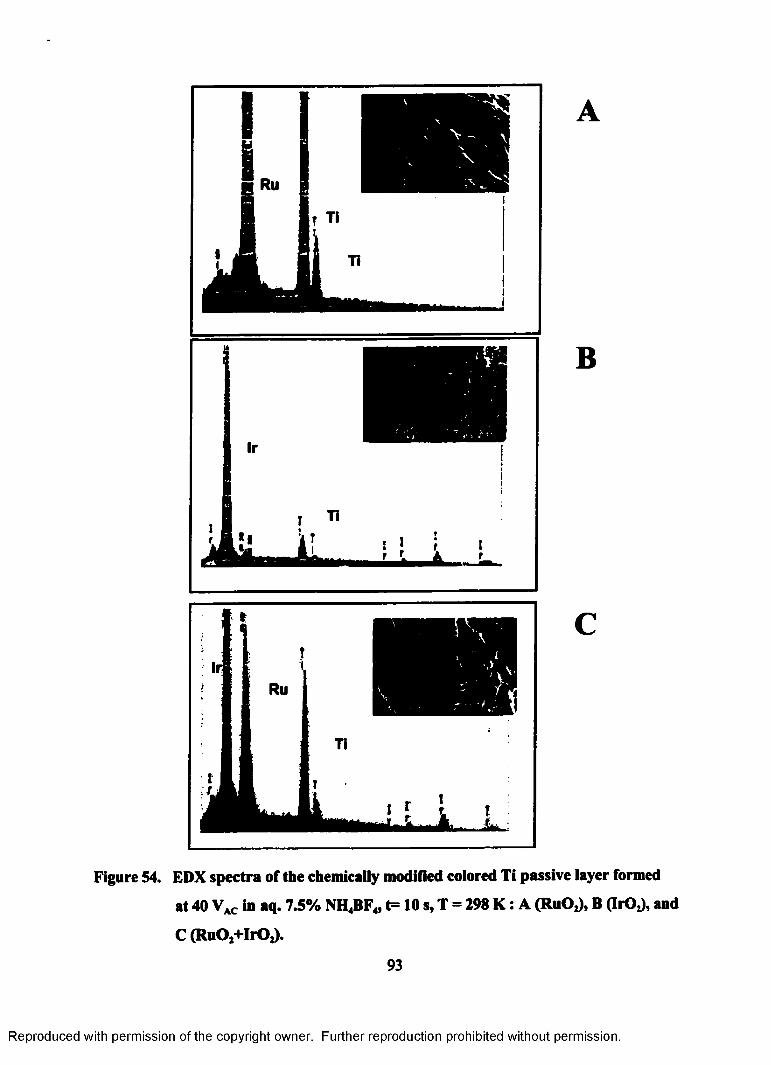
A
B
C
Figure 54. EDX spectra of the chemically modified colored Ti passive layer formed
at 40 VAC in aq. 7.5% NH4BF4, t= 1 0 s, T = 298 K : A (RuOJ, B (IrOJ, and
C (RuOj+IrOj).
93
Reproduced with permission of the copyright owner. Further reproduction prohibited without permission.
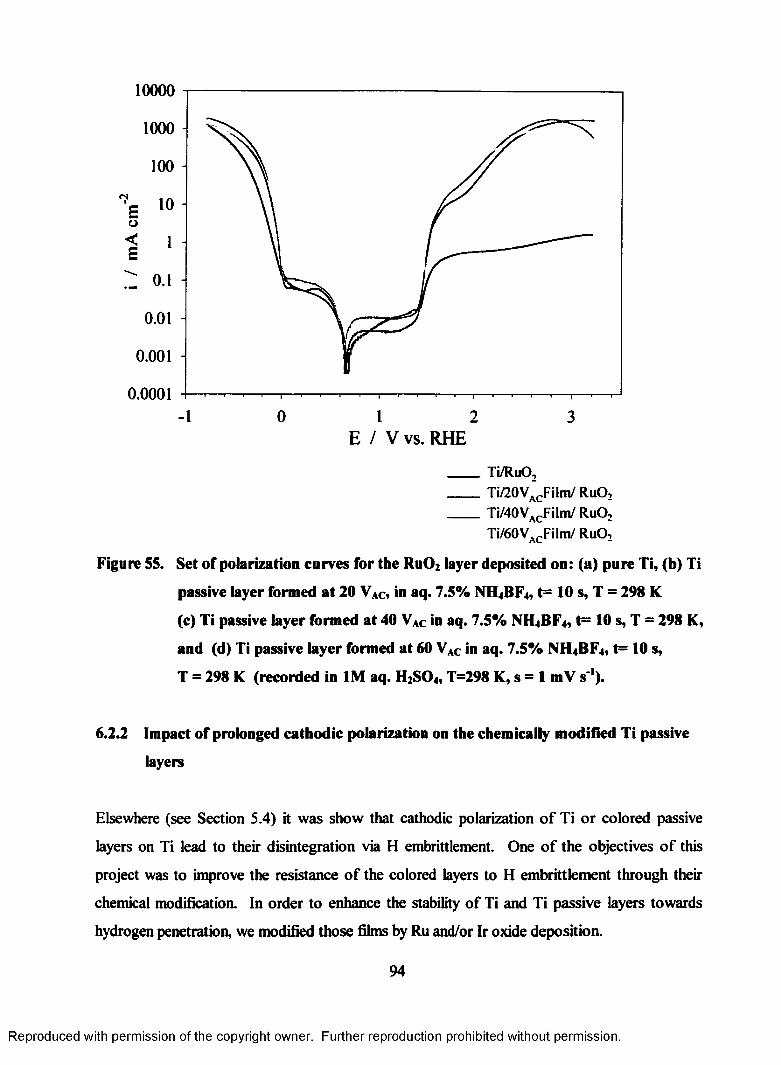
10000
1000 -
100 -
<N
0.01 -
0.001 -
0.0001 T T T T TT
- 1 0 1 2 3E / V vs. RHE
Ti/RuO , Ti/20VACFilm / RuO , Ti/40VACFilm / RuO ,
Ti/60VACFilm / RuO ,
Figure 55. Set of polarization curves for the Ru02 layer deposited on: (a) pure Ti, (b) Ti
passive layer formed at 20 VAC, in aq. 7.5% NH4BF4, t= 1 0 s, T = 298 K
(c) Ti passive layer formed at 40 VAC in aq. 7.5% NH4BF4, t= 10 s, T = 298 K,
and (d) Ti passive layer formed at 60 VAC in aq. 7.5% NH4 BF4, t= 10 s,
T = 298 K (recorded in 1M aq. H2S04, T=298 K, s = 1 m V s ').
6.2.2 Impact of prolonged cathodic polarization on the chemically modified Ti passive
layers
Elsewhere (see Section 5.4) it was show that cathodic polarization o f Ti or colored passive
layers on Ti lead to their disintegration via H embrittlement. One o f the objectives of this
project was to improve the resistance of the colored layers to H embrittlement through their
chemical modification. In order to enhance the stability of Ti and Ti passive layers towards
hydrogen penetration, we modified those films by Ru and/or Ir oxide deposition.
94
Reproduced with permission of the copyright owner. Further reproduction prohibited without permission.
10000
1000 -
100 -
0.01 -
0.001 -
0.00010 21 3
E / V vs. RHE Ti/40VACFilm Ti/40VACFilm/RuO2
Ti/40VACFilm/lrO2Ti/40VACFilm/RuO2-IrO2
Figure 56. Set of polarization curves for: (a) the Ti passive film formed at 40 VAC in aq.
7.5% NH4 BF4, t= 10 s, T = 298 K, (b) the Ti passive film formed at 40 VAC
and doped by Ru02, (c) the Ti passive film formed at 40 VAC and doped by
I1O 2 , and (d) the Ti passive film formed at 40 VAc and doped by RUO2+I1O 2
(recorded in 1M aq. H2SO4 (T=298 K, s = 1 mV s'1).
In Fig. 57, we show polarization curves for the Ru02 modified film recorded every 5 hrs for the
total polarization time up to 80 hrs. We selected only the Ru02 modified layer because it was
the only one that did not have crack or fractures. As it can be seen from Fig. 57, the layer is
stable and unaffected during almost 20 hrs of cathodic charging. The only changes are visible
in the OER region, where the electrode activity decreases upon the increase of the time of
cathodic polarization. The corrosion potential, ECOrr was constant during the initial 20 hrs of
cathodic polarization (small graph in Fig. 57 presents Ecorr vs. time of cathodic polarization).
95
Reproduced with permission of the copyright owner. Further reproduction prohibited without permission.
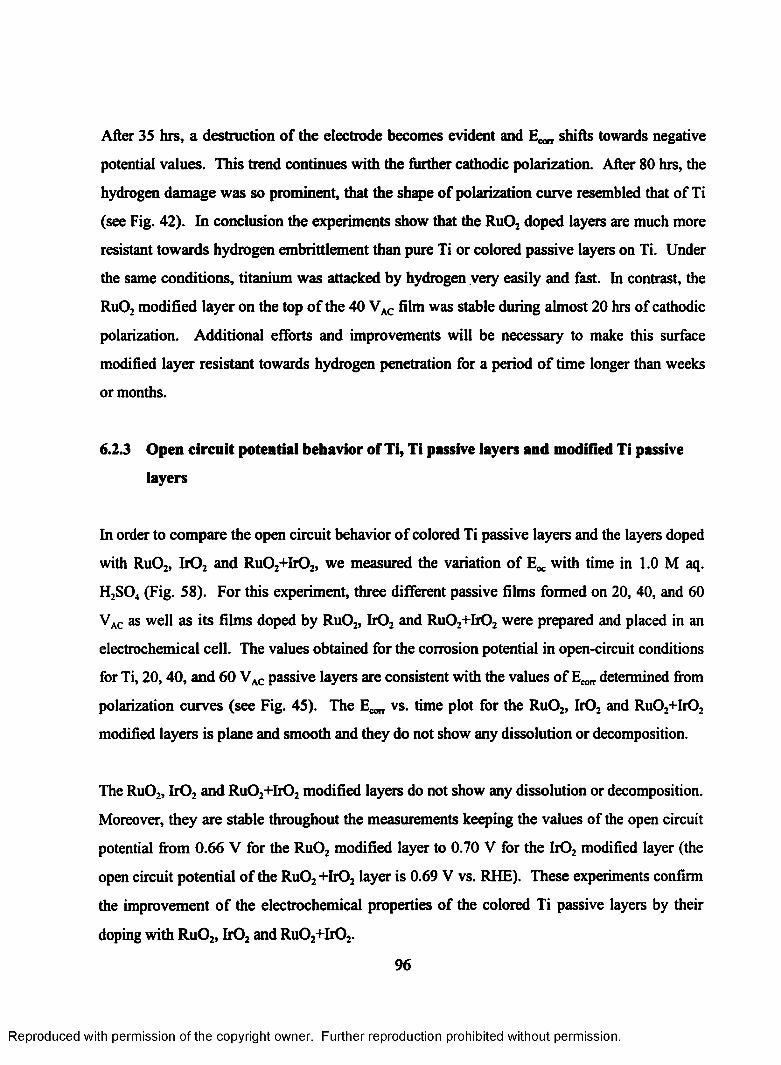
After 35 hrs, a destruction of the electrode becomes evident and shifts towards negative
potential values. This trend continues with the further cathodic polarization. After 80 hrs, the
hydrogen damage was so prominent, that the shape of polarization curve resembled that of Ti
(see Fig. 42). In conclusion the experiments show that the RuOz doped layers are much more
resistant towards hydrogen embrittlement than pure Ti or colored passive layers on Ti. Under
the same conditions, titanium was attacked by hydrogen very easily and fast. In contrast, the
Ru02 modified layer on the top of the 40 VAC film was stable during almost 2 0 hrs of cathodic
polarization. Additional efforts and improvements will be necessary to make this surface
modified layer resistant towards hydrogen penetration for a period of time longer than weeks
or months.
6.2.3 Open circuit potential behavior of Ti, Ti passive layers and modified Ti passive
layers
In order to compare the open circuit behavior of colored Ti passive layers and the layers doped
with Ru02, Ir0 2 and Ru02+Ir02, we measured the variation of with time in 1.0 M aq.
H2S04 (Fig. 58). For this experiment, three different passive films formed on 20, 40, and 60
VAC as well as its films doped by Ru02, Ir0 2 and Ru02+ b0 2 were prepared and placed in an
electrochemical cell. The values obtained for the corrosion potential in open-circuit conditions
for Ti, 20,40, and 60 VAC passive layers are consistent with the values of Ecorr determined from
polarization curves (see Fig. 45). The E ,^ vs. time plot for the RuOz, Ir02 and Ru02+Ir02
modified layers is plane and smooth and they do not show any dissolution or decomposition.
The Ru0 2, Ir0 2 and RuOz+Ir02 modified layers do not show any dissolution or decomposition.
Moreover, they are stable throughout the measurements keeping the values of the open circuit
potential from 0.66 V for the Ru0 2 modified layer to 0.70 V for the Ir0 2 modified layer (the
open circuit potential of the Ru0 2 +Ir02 layer is 0.69 V vs. RHE). These experiments confirm
the improvement of the electrochemical properties of the colored Ti passive layers by their
doping with Ru02, Ir0 2 and Ru02+Ir02.
96
Reproduced with permission of the copyright owner. Further reproduction prohibited without permission.
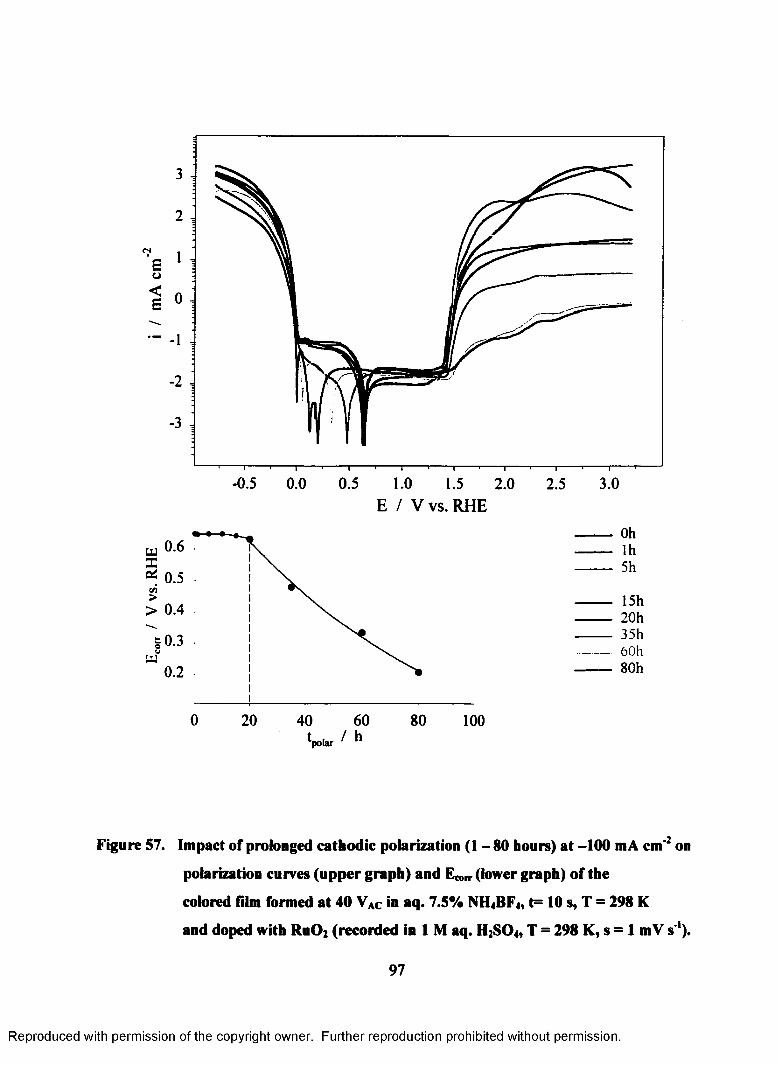
scj
3
2
1
0
■2
■3
-0.5 0.0 0 .5 1.0 3.01.5 2.0 2.5
E / V vs. RHE
0.6
* 0.5CO> 0.4
1 0.3j
0.2
0 20 60 8040 100
OhIh5h
15h20h35h60h80h
W ' h
Figure 57. Impact of prolonged cathodic polarization (1 - 80 hours) a t -100 mA cm ' 2 on
polarization curves (upper graph) and Emn- (lower graph) of the
colored film formed a t 40 VAc in aq. 7.5% NH4 BF4 , t= 1 0 s, T = 298 K
and doped with RuO: (recorded in 1 M aq. H2SO4 , T = 298 K, s = 1 m V s'1).
97
Reproduced with permission of the copyright owner. Further reproduction prohibited without permission.
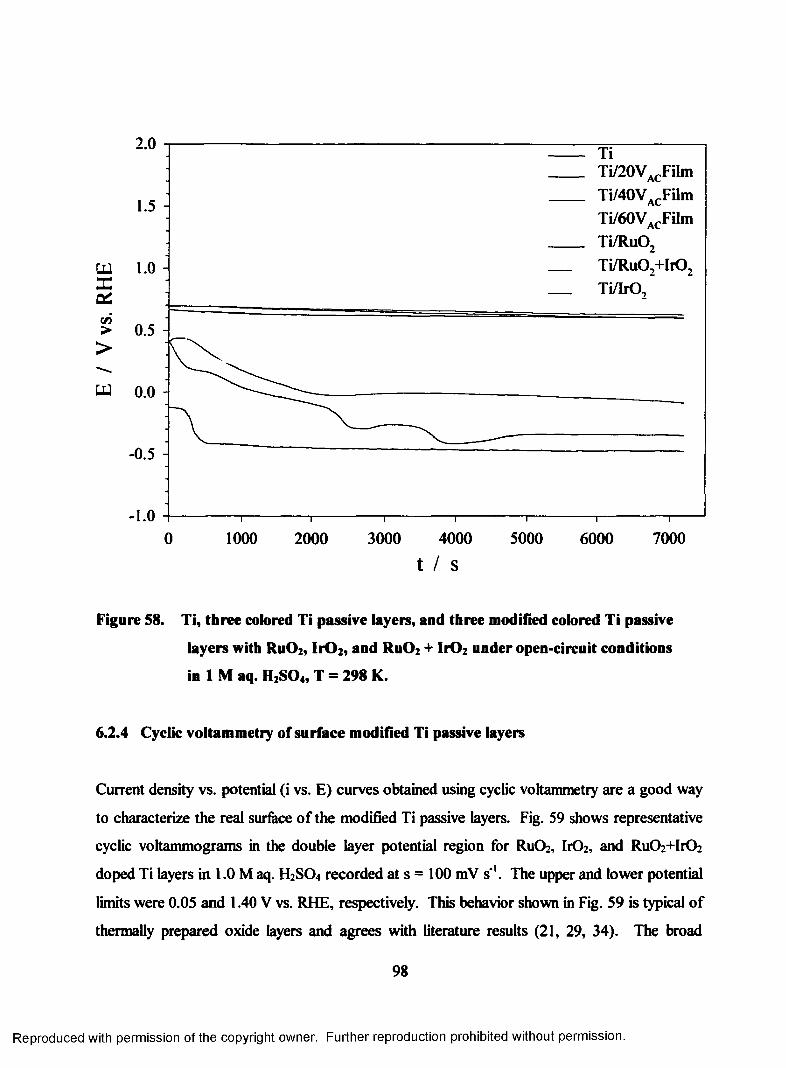
2.0
1.5
CU 1.0xo i
> 0.5>
u 0.0
-0.5
- 1.070001000 2000 3000 4000 50000 6000
t / s
Figure 58. Ti, three colored Ti passive layers, and three modified colored Ti passive
layers with RUO2, Ir02, and RuOz + lr0 2 under open-circuit conditions
in 1 M aq. H2S04, T = 298 K.
6.2.4 Cyclic voltammetry of surface modified Ti passive layers
Current density vs. potential (i vs. E) curves obtained using cyclic voltammetry are a good way
to characterize the real surface of the modified Ti passive layers. Fig. 59 shows representative
cyclic voltammograms in the double layer potential region for Ru02, Ir02, and Ru02 +Ir02
doped Ti layers in 1.0 M aq. H2 S0 4 recorded at s = 100 mV s '. The upper and lower potential
limits were 0.05 and 1.40 V vs. RHE, respectively. This behavior shown in Fig. 59 is typical of
thermally prepared oxide layers and agrees with literature results (21, 29, 34). The broad
98
Reproduced with permission of the copyright owner. Further reproduction prohibited without permission.
features are associated with a large surface heterogeneity (79). The reversible curves show that
the Ru02 + Ir0 2 modified film has the largest real surface area, while the Ru02-modified one
has the smallest area. This observation well agrees with the SEM morphology data
shown in Fig. 53.
Fig. 60 shows four cyclic voltammograms superposed for the 40 VAc colored layer after
chemical modification by deposition of Ru02, Ir02, and Ru02 + Ir02. The data indicate that the
Ru02 + Ir0 2 modified layer has the greatest real surface area, while the Ru02 one has the
smallest one, with the Ir0 2 modified layer being in betweea Albeit these results coincide with
those presented in Fig. 59, it is apparent that the presence of the 40 VAc colored layer increases
the double-layer charging current density that is a measure of the real surface area.
800
600
400<NiI 200
<=*■ 0
-200
-400
-600-0.2 0.0 0.2 0.4 0.6 0.8 1.0 1.2 1.4 1.6
E / V vs. RHE
Figure 59. Cyclic voltammograms for Ti modified by deposition of R u02, I r0 2,
and R u0 2+ Ir0 2 recorded in 1.0 M aq. H2 S 0 4 (T = 298 K, s = 100 mV s'1).
99
T T T T T T
Reproduced with permission of the copyright owner. Further reproduction prohibited without permission.
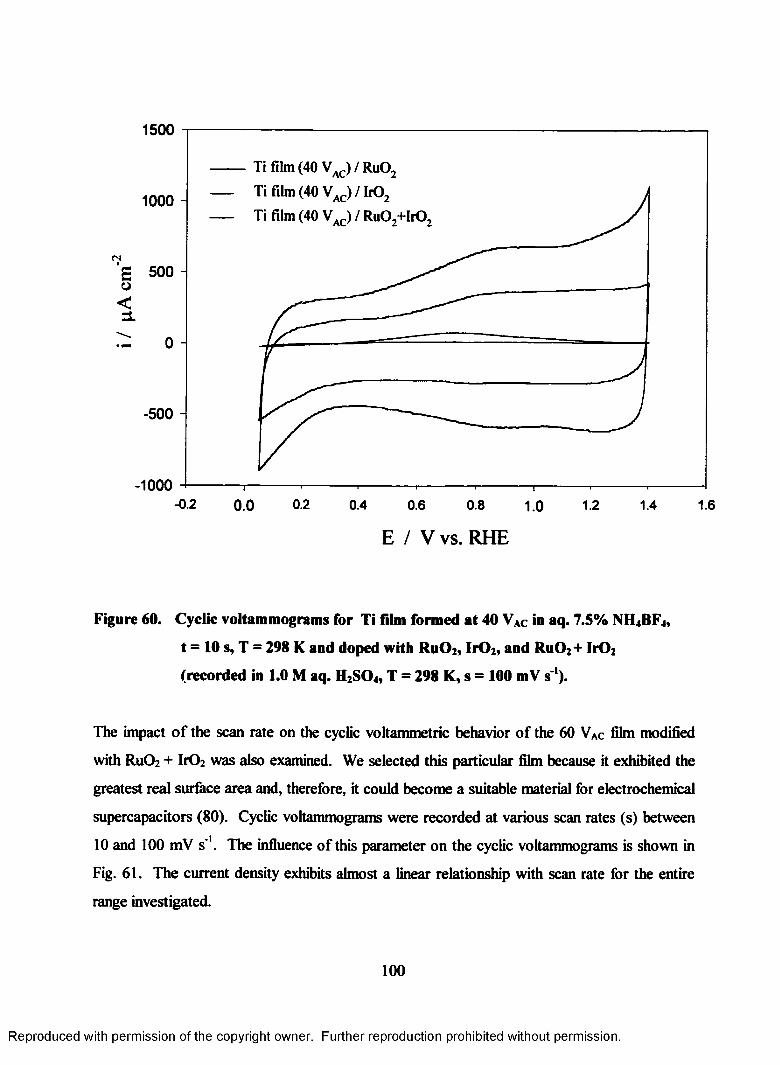
1500
Ti film (40 VAC) / Ru02 Ti film (40 VAC) / Ir02
Ti film (40 VAC) / Ru02 +IrO.1000 -
500 -
-500 -
-1000 — r—
0.6—i—
0.8!
0.0- 0.2 0.2 0.4 1.61.2 1.41
E / V vs. RHE
Figure 60. Cyclic voltammograms for Ti film formed at 40 VAC in aq. 7.5% NH4 BF4 ,
t = 10 s, T = 298 K and doped with R u02, I r0 2, and R u02+ Ir0 2
(recorded in 1.0 M aq. H2 S04, T = 298 K, s - 100 mV s ').
The impact of the scan rate on the cyclic voltammetric behavior of the 60 VAc film modified
with R u 0 2 + Ir0 2 was also examined. We selected this particular film because it exhibited the
greatest real surface area and, therefore, it could become a suitable material for electrochemical
supercapacitors (80). Cyclic voltammograms were recorded at various scan rates (s) between
10 and 100 mV s'1. The influence of this parameter on the cyclic voltammograms is shown in
Fig. 61. The current density exhibits almost a linear relationship with scan rate for the entire
range investigated.
100
Reproduced with permission of the copyright owner. Further reproduction prohibited without permission.
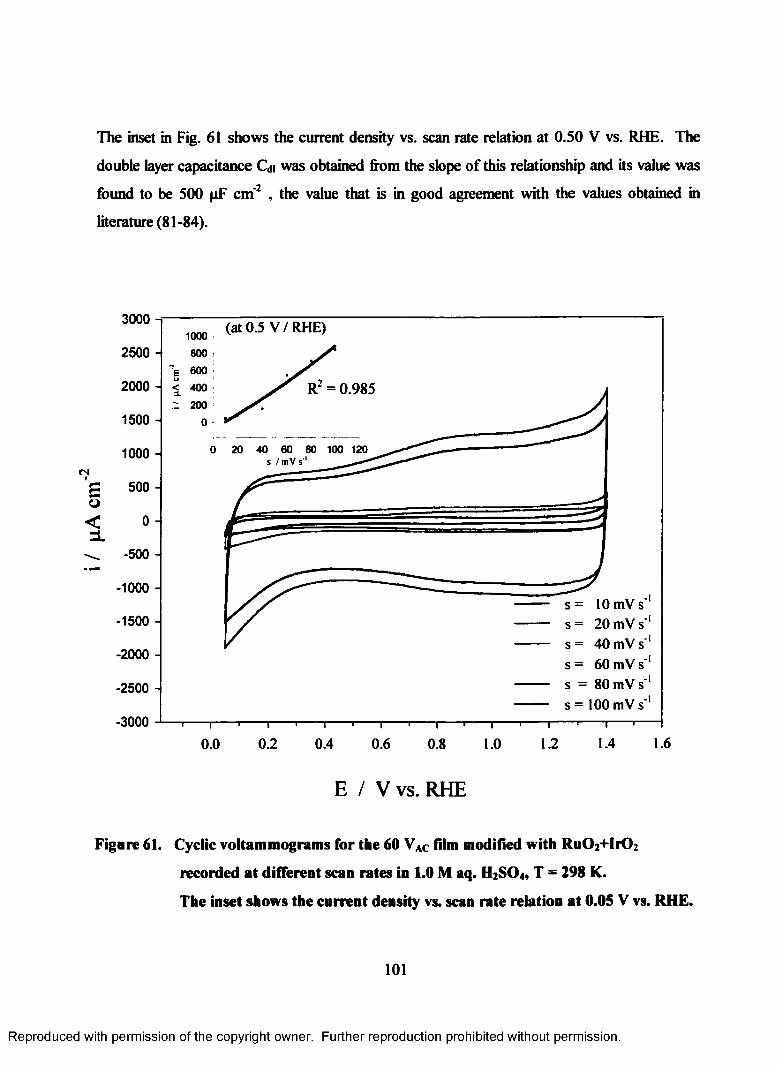
The inset in Fig. 61 shows the current density vs. scan rate relation at 0.50 V vs. RHE. The
double layer capacitance Cdi was obtained front the slope of this relationship and its value was
found to be 500 pF cm'2 , the value that is in good agreement with the values obtained in
literature (81-84).
3000 -1000
2500 - 800 '"E 600
2000 - < 400 ;
^ 200
1500 - 0
1000 - 0
<N
S 500 -
< 0 -=L
-500 -■—>
-1000 -
-1500 -
-2000 -
-2500 -
-3000 --- 1-------- 1—
(a t 0.5 V / RHE)
R2 = 0.985
20 4 0 60 80 100 120s / mV s '1
0.0T
0.2“T
0.4T
0.6T
0.8 1.0 12
s = 10 mV s' s = 20 mV s' s = 40 mV s' s = 60 mV s’ s = 80 mV s' s = 100 mV s'
r 1.4 1.6
E / V vs. RHE
Figure 61. Cyclic voltammograms for the 60 VAC film modified with RUO2+I1O 2
recorded at different scan rates in 1.0 M aq. H2SO4, T = 298 K.
The inset shows the current density vs. scan rate relation at 0.05 V vs. RHE.
101
Reproduced with permission of the copyright owner. Further reproduction prohibited without permission.
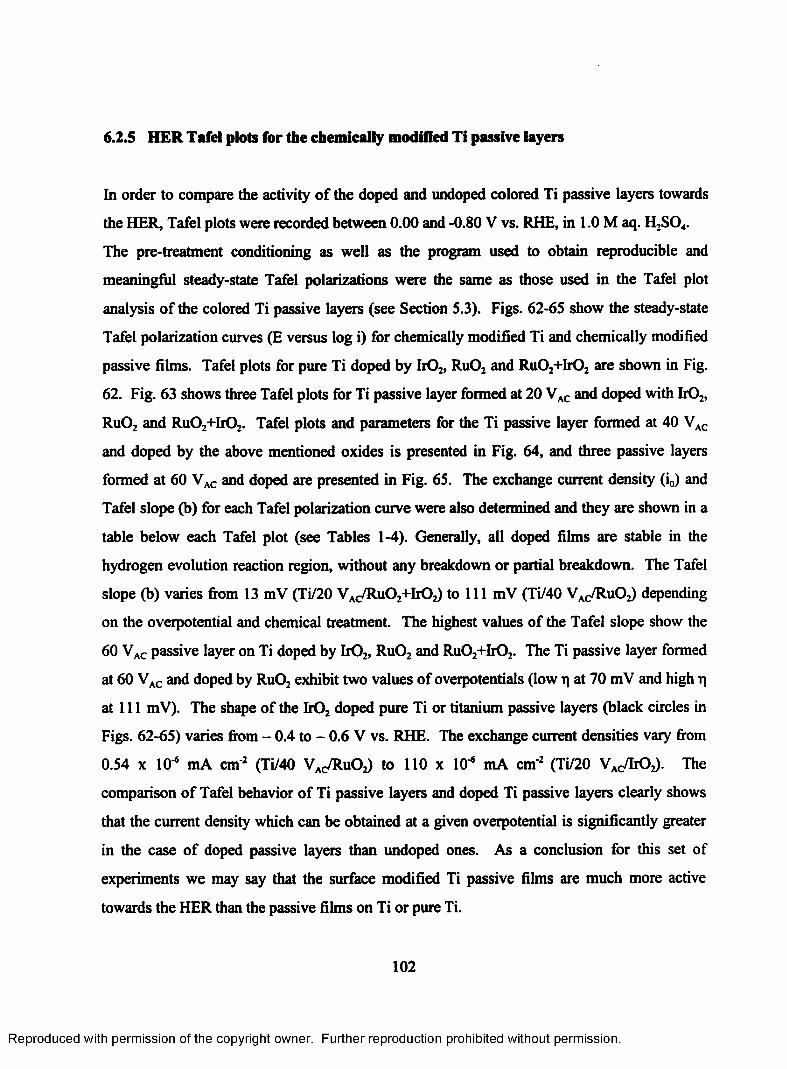
6.2.5 HER Tafel plots for the chemically modified Ti passive layers
In order to compare the activity of the doped and undoped colored Ti passive layers towards
the HER, Tafel plots were recorded between 0.00 and -0.80 V vs. RHE, in 1.0 M aq. H2S04.
The pre-treatment conditioning as well as the program used to obtain reproducible and
meaningful steady-state Tafel polarizations were the same as those used in the Tafel plot
analysis of the colored Ti passive layers (see Section 5.3). Figs. 62-65 show the steady-state
Tafel polarization curves (E versus log i) for chemically modified Ti and chemically modified
passive films. Tafel plots for pure Ti doped by Ir02, Ru02 and Ru02+IrOz are shown in Fig.
62. Fig. 63 shows three Tafel plots for Ti passive layer formed at 20 VAC and doped with Ir02,
R u 0 2 and Ru02+Ir02. Tafel plots and parameters for the Ti passive layer formed at 40 VAC
and doped by the above mentioned oxides is presented in Fig. 64, and three passive layers
formed at 60 VAC and doped are presented in Fig. 65. The exchange current density (i0) and
Tafel slope (b) for each Tafel polarization curve were also determined and they are shown in a
table below each Tafel plot (see Tables 1-4). Generally, all doped films are stable in the
hydrogen evolution reaction region, without any breakdown or partial breakdown. The Tafel
slope (b) varies from 13 mV (Ti/20 V^YRuC^+IrOz) to 111 mV (Ti/40 Vac/R u 0 2) depending
on the overpotential and chemical treatment. The highest values of the Tafel slope show the
6 0 V ac passive layer on Ti doped by Ir02, Ru02 and Ru02+Ir02. The Ti passive layer formed
at 60 VAC and doped by Ru02 exhibit two values of overpotentials (low r\ at 70 mV and high t|
at 111 mV). The shape of the Ir02 doped pure Ti or titanium passive layers (black circles in
Figs. 62-65) varies from - 0.4 to - 0.6 V vs. RHE. The exchange current densities vary from
0.54 x 10* mA cm'2 (Ti/40 VAC/Ru02) to 110 x 10* mA cm'2 (Ti/20 Vac/ItOj). The
comparison of Tafel behavior of Ti passive layers and doped Ti passive layers clearly shows
that the current density which can be obtained at a given overpotential is significantly greater
in the case of doped passive layers than undoped ones. As a conclusion for this set of
experiments we may say that the surface modified Ti passive films are much more active
towards the HER than the passive films on Ti or pure Ti.
102
Reproduced with permission of the copyright owner. Further reproduction prohibited without permission.
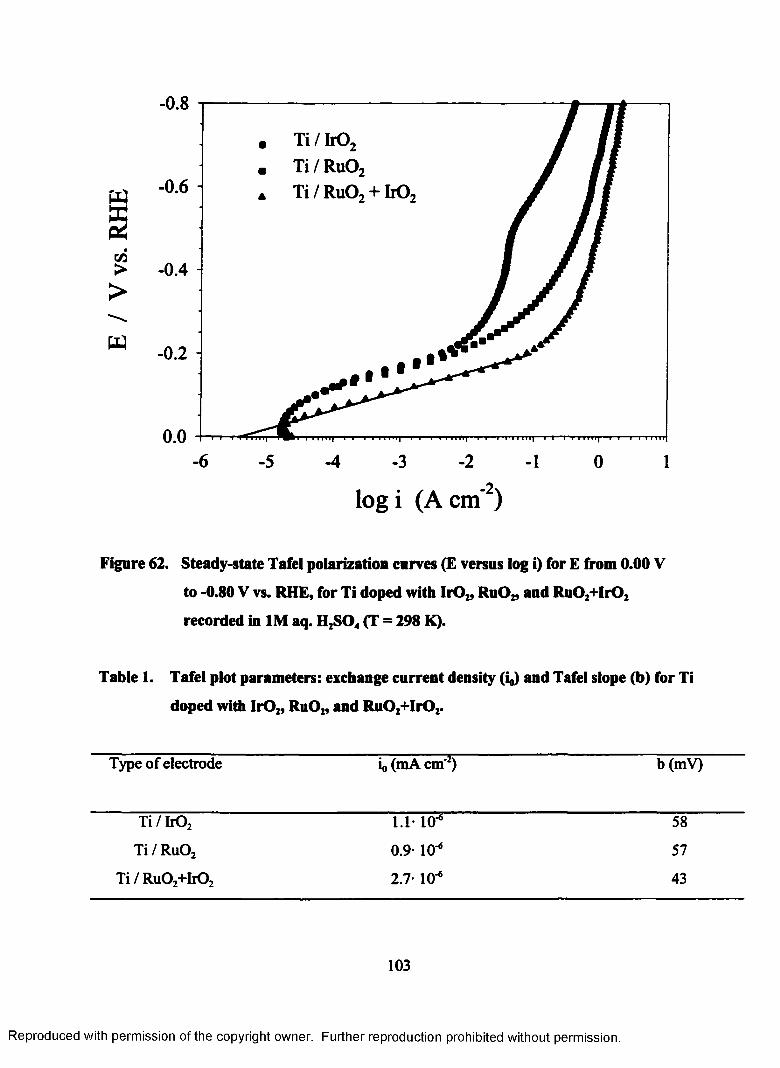
w
Vi>
>
w
- 0.8
Ti / Ir02 Ti / Ru0 2 Ti / RuO, + M )-0.6
-0.4
-0.2
0.0-6 -5
2log i (A cm’ )
o
Figure 62. Steady-state Tafel polarization curves (E versus log i) for E from 0.00 V
to -0.80 V vs. RHE, for Ti doped with Ir02, Ru02, and Ru02+Ir02
recorded in 1M aq. H2S 0 4 (T = 298 K).
Table 1. Tafel plot parameters: exchange current density fo) and Tafel slope (b) for Ti
doped with Ir02, Ru02, and Ru02+Ir02.
Type of electrode io (mA cm'2) b (mV)
T i/I r0 2 1.1- io-6 58
Ti / RuOz 0.9- 10-* 57
Ti / Ru02+Ir02 2.7- 10-6 43
103
Reproduced with permission of the copyright owner. Further reproduction prohibited without permission.
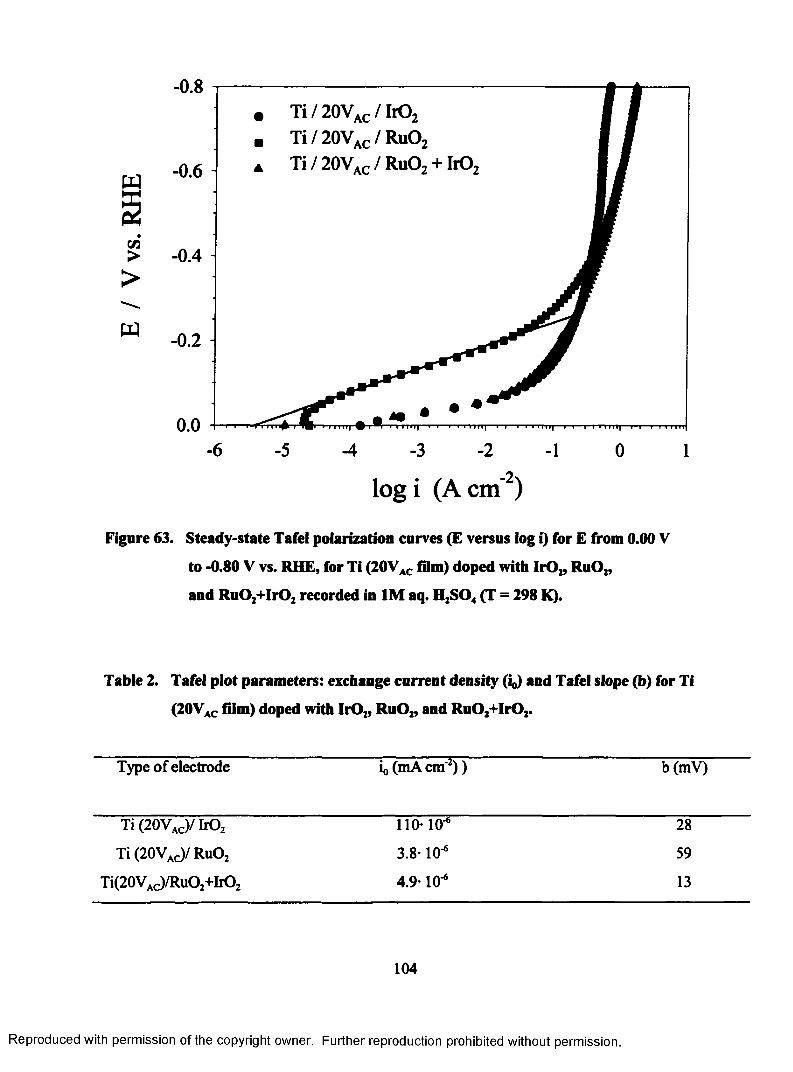
c« >
>
- 0.8Ti / 20Vac / Ir02 Ti / 20Vac / Ru0 2 Ti / 20VAr / RuO, + IrO-0.6
-0.4
-0.2
0.0-6 5 -4 3 2 1 0 1
logi (A cm’2)
Figure 63. Steady-state Tafel polarization curves (E versus log i) for E from 0.00 V
to -0.80 V vs. RHE, for Ti (20VAC film) doped with IrOz, RuOz,
and RuOz+IrOz recorded in 1M aq. HZSQ4 (T = 298 IQ.
Table 2. Tafel plot parameters: exchange current density (io) and Tafel slope (b) for Ti
(20Vac film) doped with IrOz, RuOz, and RuOz+IrOz.
Type of electrode i0 (mA cm'2) ) b(mV)
Ti (20Vac)/ IrOz 110- io-6 28
Ti (20VAC)/ RuOz 3.8-10-6 59
Ti(20VAC)/RuO2+IrO2 4.9-10-6 13
104
Reproduced with permission of the copyright owner. Further reproduction prohibited without permission.
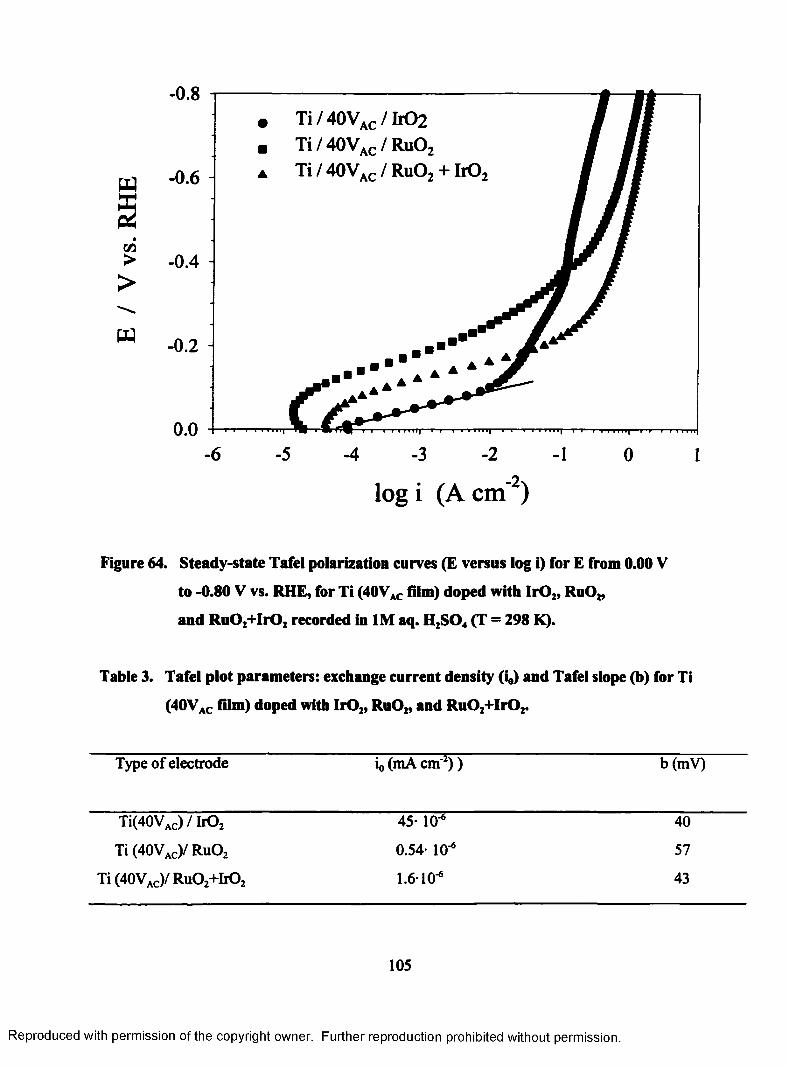
- 0.8
W
c« >
>
t i
- 0.6
-0.4 -
- 0.2 -
0.0
Ti / 40Vac / I1O2
Ti / 40Vac / RuO Ti / 40Vac / Ru02 + Ir0 2
f 1 * i i 1 1 1 mr|- r 1 1 im i i|
log i (A cm’2)
Figure 64. Steady-state Tafel polarization curves (E versus log i) for E from 0.00 V
to -0.80 V vs. RHE, for Ti (40VAC film) doped with IrO„ RuOz,
and RuOj+IrOj recorded in 1M aq. H2S 0 4 (T = 298 K).
Table 3. Tafel plot parameters: exchange current density (io) and Tafel slope (b) for Ti
(40Vac film) doped with Ir02, Ru02, and R u0 2+Ir02.
Type of electrode i„ (mA cm'2) ) b (mV)
Ti(40VAC)/I rO 2 45- 10-6 40
Ti (40VAC)/ R u 0 2 0.54- 10-6 57
Ti(40VAC)/RuO2+IrO2 1.6-10-6 43
105
Reproduced with permission of the copyright owner. Further reproduction prohibited without permission.
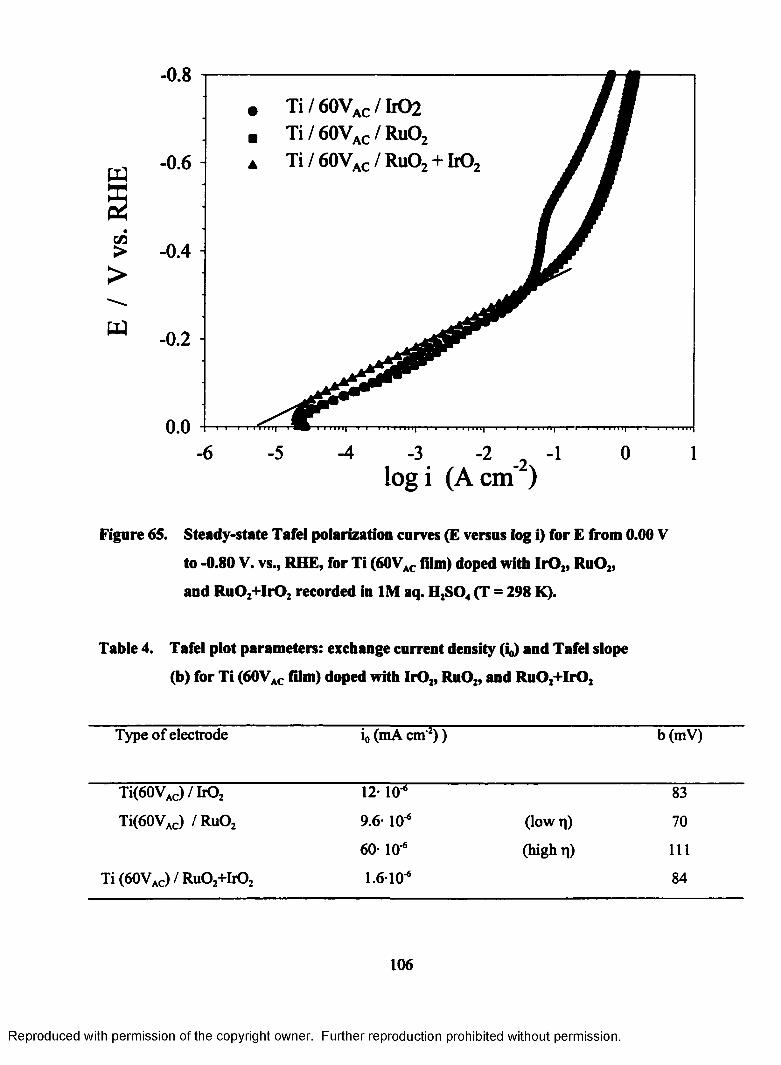
c«>
>
w
- 0.8
Ti / 60Vac / I1O2
Ti / 60Vac / Ru02 Ti / 60VAr / RuO, + IrO- 0.6
-0.4
- 0.2 -
0.06 -4 -3 -2 -1
log i (A cm’ )5 0 1
Figure 65. Steady-state Tafel polarization curves (E versus log i) for E from 0.00 V
to -0.80 V. vs., RHE, for Ti (60VAC film) doped with Ir02, RuOz,
and Ru0 2+Ir0 2 recorded in 1M aq. H2S0 4 (T = 298 K).
Table 4. Tafel plot parameters: exchange current density (io) and Tafel slope
(b) for Ti (60Vac film) doped with Ir02, RuOz, and Ru0 2+Ir0 2
Type of electrode i0 (mA cm'2) ) b (mV)
Ti(60VAC)/IrO 2 12-10-6 83
Ti(60VAC) /RuOz 9.6-10^ (low q) 70
60- IO-6 (high ti) 111
Ti (60VAC)/R uO 2+IrO2 1.6-10* 84
106
Reproduced with permission of the copyright owner. Further reproduction prohibited without permission.
CHAPTER 7
MORPHOLOGY AND ELECTROCHEMICAL CHARACTERIZATION OF
EBONEX® ON TITANIUM
Ebonex® is a ceramic material based on the Magneli suboxides of titanium. The main material
for the production of Ebonex® is titanium dioxide which is one of the most abundant Ti
materials produced by the chemical industry. The non-stoichiometric oxides are blue-black in
color and electronically conductive, whilst retaining a high corrosion resistance and a low
toxicity. They are electrode materials in the electrochemical industry owing to their corrosion
resistance and electronic conductivity. Titanium based materials already play an important
role in electrochemistry because of their high stability. The Magneli phase-Ti conductive
oxides (Ti40 7and Ti50 9) are known to have comparable conductivities (85) and therefore, they
attracted much attention (86,87). Ebonex®, a conductive ceramic material, is mainly
composed of the Magneli phase titanium oxides (Ti40 7 and Ti50 9) and is considered a suitable
electrode material because of its bulk conductivity that matches that of carbon and graphite
electrodes. It is resistant to corrosion in various aqueous electrolytes and shows no tendency
to form hydride upon contact with molecular hydrogen or upon cathodic polarization. Pletcher
et al. (86) have studied the kinetics of the ferro/ferricyanide couple at Ebonex® electrodes.
They have also electrodeposited five metals such as Cu, Au, Ni, Pd, and Pt on Ebonex® in
order to modify its properties and, then, they investigated the electrochemical characteristics of
such modified electrode materials (87).
7.1 SEM analysis of Ebonex® on Ti
SEM analysis was performed at three different magnifications, namely 1 000, 3 000, and
10 000 x, in order to bring out any surface features. Fig. 66 presents the SEM micrographs of
the Ebonex® coated Ti at the magnification 1000 and 3000 x. The Ebonex® coating does not
107
Reproduced with permission of the copyright owner. Further reproduction prohibited without permission.
show any grain structure, but it shows some typical features of ceramic electrodes (pores and
disordered regions between crystallites). Darker regions on the photographs represent deeper
surface areas, giving us the impression of an irregular, porous surface. However, this structure
shows the high roughness of the coating, which may be related to the high electrocatalytic
activity of this material. No traces of titanium metal substrate we observed, indicating
uniformity in the coating layer. Moreover, this morphology analysis data indicates that the
electrochemical characteristics subsequently determined are characteristic of Ebonex®-Ti
material.
7.2 Electrochemical characterization of Ebonex* on Ti
The instrumentation and preparation of electrodes for electrochemical characterization of the
EBONEX* coating on Ti were described in Experimental. We focused our attention on the
determination of the corrosion potential and current density, Ecorr and i ^ the critical potential
and current density, ECT and iOT the extent of surface passivation, and the potential of the onset
of the OER.
7.2.1 Polarization curves
Fig. 67 shows polarization curves for pure Ti, the colored Ti passive layer formed at 60 VAC
and Ebonex® on Ti. These three curves are superimposed in order to compare the
electrochemical parameters of the three different electrode materials. Corrosion parameters of
metallic Ti were already determined (see Chapter 5) and they are as follows: Ecorr = - 0.51 V
and Ecr = - 0.27 V vs. RHE. The electrochemical parameters for the colored Ti passive layer
formed at 60 VAC are: E ^ = - 0.33 V and ECT = - 0.22 V vs. RHE. Ebonex* on Ti exhibits
even more pronounced shift of E ^ and ECT towards less-negative potentials with respect to Ti,
thus revealing its stability: ( E ^ = - 0.24 V and ECT = - 0.09 V vs. RHE). The overpotentials
for the HER and OER are lower than for Ti or the colored passive films.
108
Reproduced with permission of the copyright owner. Further reproduction prohibited without permission.
I ' M '-1 iy>-
Figure 66. SEM micrographs of Ebonex* on Ti (magnification 1000 x and 3000 x).
109
Reproduced with permission of the copyright owner. Further reproduction prohibited without permission.
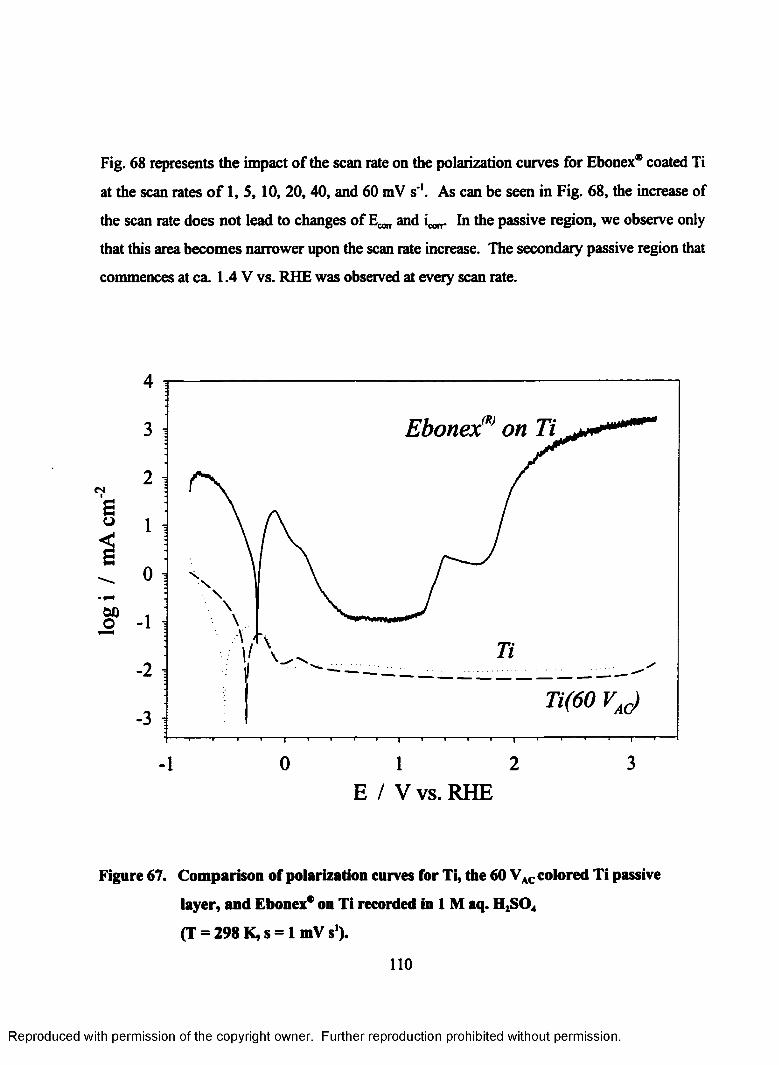
Fig. 68 represents the impact of the scan rate on the polarization curves for Ebonex0 coated Ti
at the scan rates o f 1, 5, 10, 20, 40, and 60 mV s'1. As can be seen in Fig. 68, the increase of
the scan rate does not lead to changes of and icon.. In the passive region, we observe only
that this area becomes narrower upon the scan rate increase. The secondary passive region that
commences at ca. 1.4 V vs. RHE was observed at every scan rate.
Bo
W)
4
Ebonex™ on Ti3
2
1
0
1
2
Ti(60 V J3
30 1 21
E / V vs. RHE
Figure 67. Comparison of polarization curves for Ti, the 60 VAC colored Ti passive
layer, and Ebonex* on Ti recorded in 1 M aq. H2S 0 4
(T = 298 K, s = 1 mV s1).
110
Reproduced with permission of the copyright owner. Further reproduction prohibited without permission.
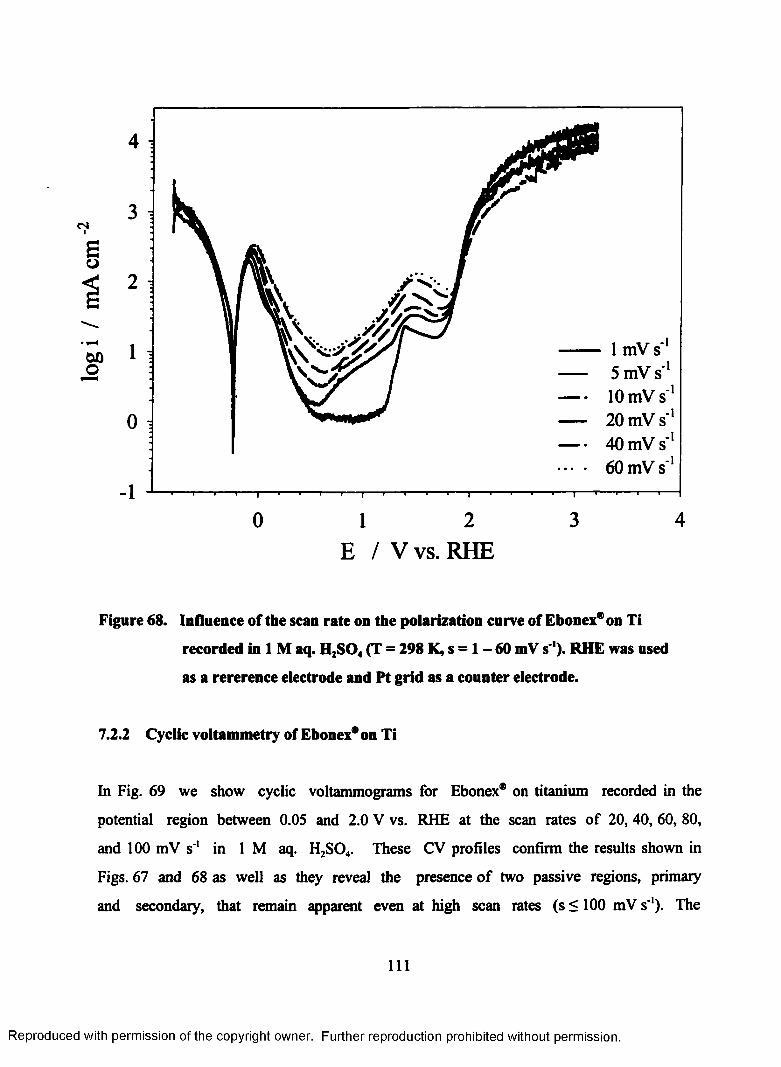
tN
Bo
o1 i
0 i
1 mV s 5 mV s 10 mV s'1 20 mV s’1 40 mV s’1• • • • 60 mV s'1
0 1 2
E / V vs. RHE
Figure 6 8 . Influence of the scan rate on the polarization curve of Ebonex® on Ti
recorded in 1 1VI aq. H2S0 4 (T = 298 K, s = 1 - 60 mV s '). RHE was used
as a rererence electrode and Pt grid as a counter electrode.
7.2.2 Cyclic voltammetry of Ebonex® on Ti
In Fig. 69 we show cyclic voltammograms for Ebonex® on titanium recorded in the
potential region between 0.05 and 2.0 V vs. RHE at the scan rates of 20, 40, 60, 80,
and 100 mV s'1 in 1 M aq. H2S04. These CV profiles confirm the results shown in
Figs. 67 and 68 as well as they reveal the presence of two passive regions, primary
and secondary, that remain apparent even at high scan rates (s < 100 mV s'1). The
111
Reproduced with permission of the copyright owner. Further reproduction prohibited without permission.
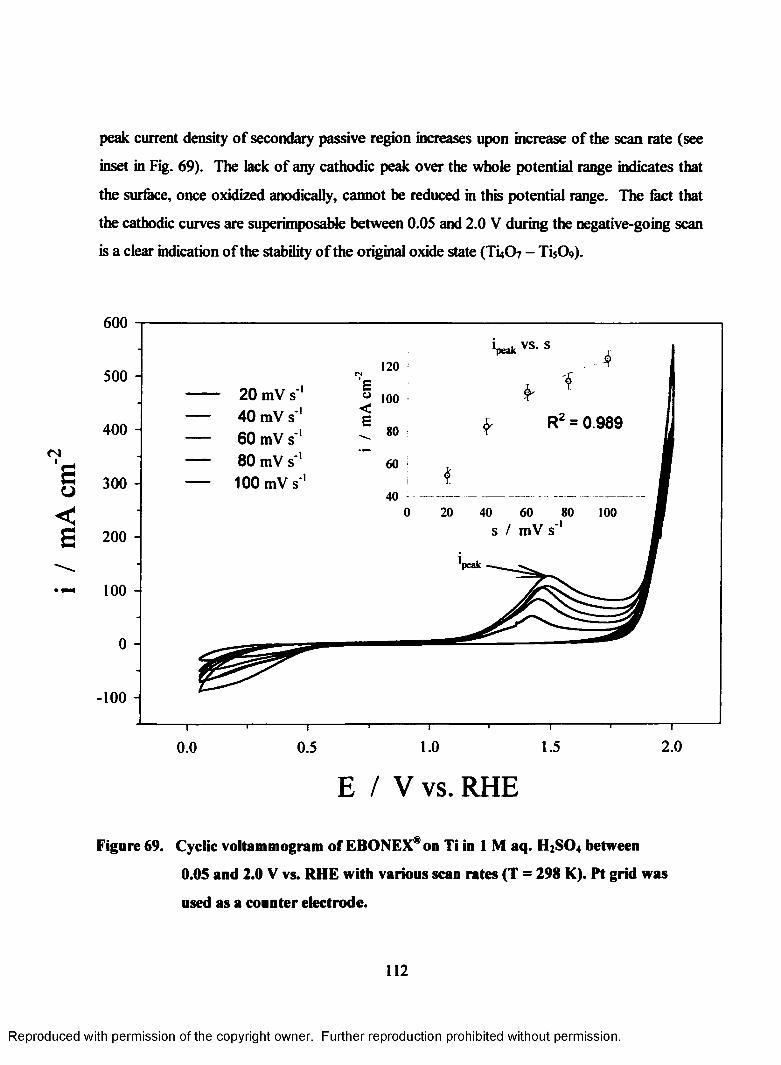
peak current density of secondary passive region increases upon increase of the scan rate (see
inset in Fig. 69). The lack of any cathodic peak over the whole potential range indicates that
the surface, once oxidized anodically, cannot be reduced in this potential range. The fact that
the cathodic curves are superimposable between 0.05 and 2.0 V during the negative-going scan
is a clear indication of the stability of the original oxide state (TuO? - TisC^).
600‘peak VS- S
120500 -
20 mV s' 40 mV s '1 60 mV s '1 80 mV s '1 100 mV s'
100
R = 0.989400 -
100s / mV s
peak
100 -
-100 -
2.01.0 1.50.0 0.5
E / V vs. RHE
Figure 69. Cyclic voltammogram of EBONEX® on Ti in 1 M aq. H2SO4 between
0.05 and 2.0 V vs. RHE with various scan rates (T = 298 K). Pt grid was
used as a counter electrode.
112
Reproduced with permission of the copyright owner. Further reproduction prohibited without permission.
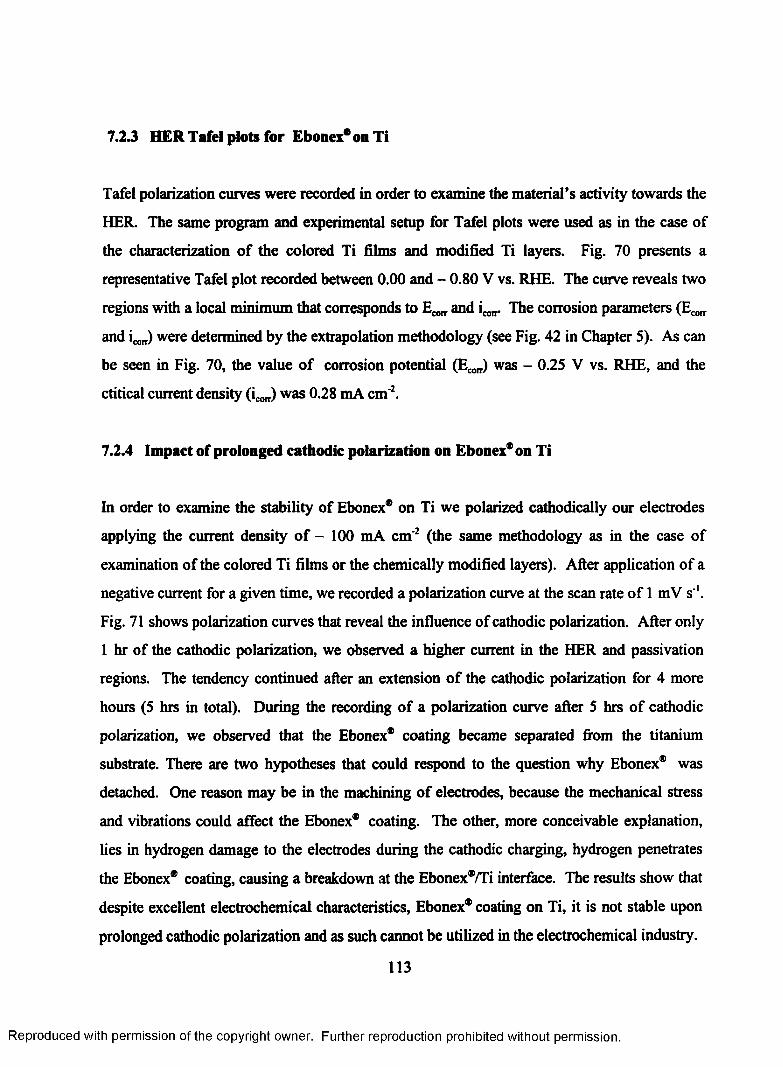
7.2.3 HER Tafel plots for Ebonex* on Ti
Tafel polarization curves were recorded in order to examine the material’s activity towards the
HER. The same program and experimental setup for Tafel plots were used as in the case of
the characterization of the colored Ti films and modified Ti layers. Fig. 70 presents a
representative Tafel plot recorded between 0.00 and - 0.80 V vs. RHE. The curve reveals two
regions with a local minimum that corresponds to E ^ and icorr. The corrosion parameters (Ecoir
and ic0„) were determined by the extrapolation methodology (see Fig. 42 in Chapter 5). As can
be seen in Fig. 70, the value of corrosion potential (£„„) was - 0.25 V vs. RHE, and the
critical current density ( i^ J was 0.28 mA cm'2.
7.2.4 Impact of prolonged cathodic polarization on Ebonex* on Ti
In order to examine the stability of Ebonex* on Ti we polarized cathodically our electrodes
applying the current density of - 100 mA cm'2 (the same methodology as in the case of
examination of the colored Ti films or the chemically modified layers). After application of a
negative current for a given time, we recorded a polarization curve at the scan rate of 1 mV s'1.
Fig. 71 shows polarization curves that reveal the influence of cathodic polarization. After only
1 hr of the cathodic polarization, we observed a higher current in the HER and passivation
regions. The tendency continued after an extension of the cathodic polarization for 4 more
hours (5 hrs in total). During the recording of a polarization curve after 5 hrs of cathodic
polarization, we observed that the Ebonex* coating became separated from the titanium
substrate. There are two hypotheses that could respond to the question why Ebonex* was
detached. One reason may be in the machining of electrodes, because the mechanical stress
and vibrations could affect the Ebonex* coating. The other, more conceivable explanation,
lies in hydrogen damage to the electrodes during the cathodic charging, hydrogen penetrates
the Ebonex* coating, causing a breakdown at the Ebonex*/Ti interface. The results show that
despite excellent electrochemical characteristics, Ebonex* coating on Ti, it is not stable upon
prolonged cathodic polarization and as such cannot be utilized in the electrochemical industry.
113
Reproduced with permission of the copyright owner. Further reproduction prohibited without permission.
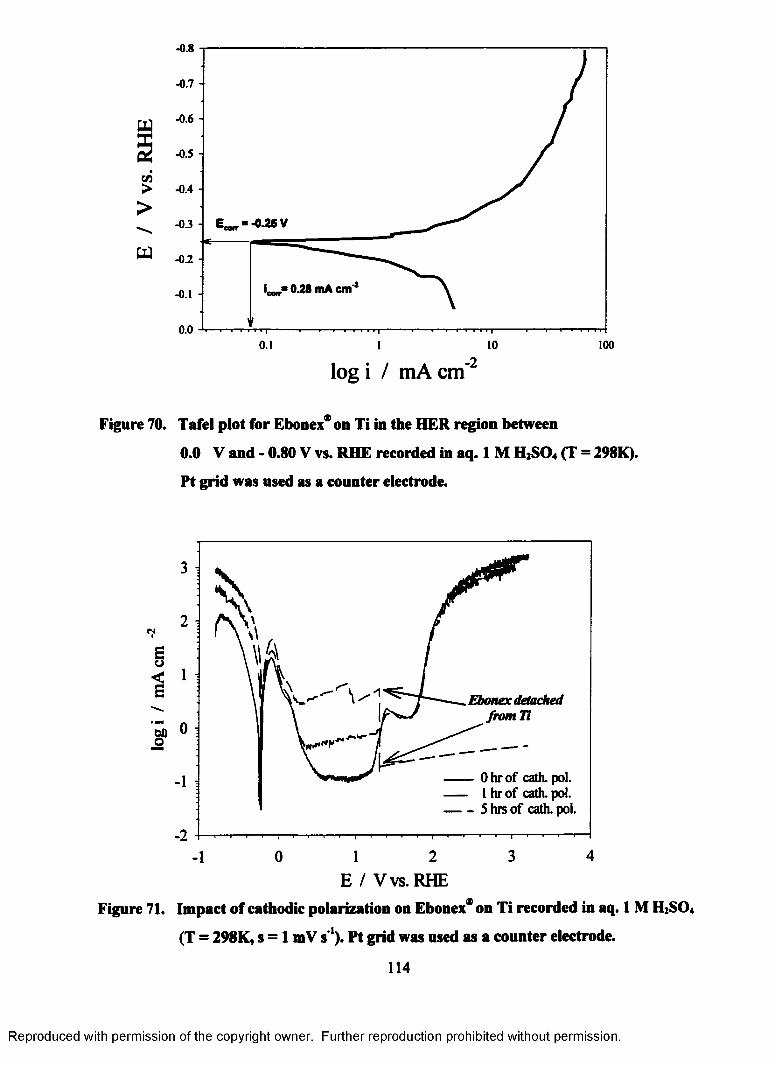
-0.8
-0.7 -
- 0.6 -
-0.5 -
t/i> -0.4 -
>_ -03 - E__ ■ -0.26 V
l__* 0.28 mA cm'- 0.1 -
0.01000.1 10
lo g i / m A c m ' 2
Figure 70. Tafel plot for Ebonex* on Ti in the HER region between
0.0 V and - 0.80 V vs. RHE recorded in aq. 1 M H2S 04 (T = 298K).
Pt grid was used as a counter electrode.
I
3
2
1Ebonex detached
from Ti0
Ohrof cath. pol. 1 hr of cath. pol. 5 his of cath. pol.
1
•24320 11
E / Vvs. RHEFigure 71. Impact of cathodic polarization on Ebonex* on Ti recorded in aq. 1 M H2S04
(T = 298K, s = 1 mV s'1). Pt grid was used as a counter electrode.
114
Reproduced with permission of the copyright owner. Further reproduction prohibited without permission.
CONCLUSIONS
In this study, a new procedure of preparing colored passive layers on titanium by application
of AC polarization in aq. NH4BF4 was developed. This methodology gives a wide spectrum of
well-defined and brightly colored layers. Therefore, we conclude that the unique results that
were obtained in aqueous NH4BF4 are directly related to experimental methodology. The
examination of the influence of different experimental parameters on the surface coloration
(electrolyte pH, concentration, time of the polarization), guide us to the bright and uniform
colors on titanium.
A combination of the electrochemical coloration of Ti by AC polarization with masking
techniques used in the semiconductor industry allows us to develop a method of pattern design
on Ti that we refer to as electrochemical lithography. It can be effectively use for decorative
purposes and surface finishing.
The morphology of the colored passive films was studied by application of optical
microscopy, scanning electron microscopy, and atomic force microscopy. The general
observations are that the passive films revealed the same coloration on different grains, the
surface roughness decreases upon the color film formation, and the colored passive films
revealed no cracks or fractures.
The information about the surface-chemical composition and the thickness of the colored
titanium passive layers was obtained using X-ray photoelectron spectroscopy. A relation
between the thickness, the coloration and the applied AC voltage was established. XPS
analysis of the as-received samples reveals presence of Ti, O, F, C, Ca, and N. Ti, O and F are
the main constituents of the passive layers, whereas C, Ca, and N are surface contaminants that
originate from the via-air transfer. The surface chemical composition of the outer-most layer
of the colored titanium passive layers is practically the same and Ti, O, and F are present in the
115
Reproduced with permission of the copyright owner. Further reproduction prohibited without permission.
same quantities. However, the chemical composition of the inner layer, as determined on the
basis of XPS depth profiling, is not the same and it depends on the surface coloration which is
a function of the experimental conditions.
Electrochemical properties of the metallic Ti and colored Ti passive layers are determined by
recording polarization curves in the - 0.8 - 3.2 V vs. RHE range as well as Tafel plots in the
hydrogen evolution reaction (HER) region in 1.0 M aqueous H2S04. The polarization curves
show that the corrosion potential of the colored passive layers shifts towards less-negative
potential indicating that they are more stable than Ti under the same conditions. The passive
region for the colored layers resembles that for Ti. The Tafel plots for the HER demonstrate
that the passive layers have higher activity towards the HER than Ti. The Tafel relations
reveal new features that can be associated with the partial breakdown/decomposition of the
passive layers, H absorption and the onset of Ti hydride formation.
Modification of the surface chemical composition and electrochemical properties of
multicolored titanium passive films was accomplished by deposition and intercalation of RuO,
or/and Ir02 through thermal oxidative decomposition of respective chlorides. Our interest in
surface modified Ti electrodes arises from the necessity to develop a suitable Ti-based
cathodic material for the chloro-alkali industry where the carbon-steel electrode is unable to
withstand the highly corrosive environment. However, the chemical stability of Ti can be
enhanced through its surface doping with RuOz or/and Ir02. The surface doping of TiOx with
Ru0 2 or/and Ir02 modifies the electronic properties of the former from semi-conducting to
electronically conducting. Such prepared chemically modified mixed oxide layers reveal
promising catalytic properties towards the hydrogen evolution reaction and could become a
new Ti-based cathode material. Surface morphology of these chemically modified layers was
determined using SEM. The Ru02 layer deposited on top of the colored Ti passive films
reveals no cracks and fractures. On the other hand, the Ir02 and Ru02+Ir02 layer have
pronounced cracks and fractures. The Ru02-modified catalyst well protects the underlying Ti
(compact layer) as well as enhances the catalytic properties. The colored passive films
116
Reproduced with permission of the copyright owner. Further reproduction prohibited without permission.
increase the adhesion of Ru02 on Ti and effectively absorb any thermal stress that would lead
to a cracked RuOz deposit in absence of the interfacial colored film. Therefore, it may be
concluded that under such condition the colored passive layers play the role of an interfacial
adhesive.
Surface morphology of Ebonex* (non-stoichiometric mixture of Ti oxides) on metallic Ti was
examined by using optical microscopy and scanning electron microscopy. Electrochemical
characterization of Ebonex* on Ti and its comparison with pure Ti and colored Ti passive
layers, were accomplished using linear sweep voltammetry, cyclic voltammetry, Tafel plots,
and prolonged cathodic polarization. Ebonex* revealed higher electrocatalytic activity than Ti
or its colored passive layers. On the other hand, Ebonex* shows instability during prolonged
application of a negative current that leads to its peeling off from the metallic substrate.
117
Reproduced with permission of the copyright owner. Further reproduction prohibited without permission.
REFERENCES
1. R.W. SCHUTZ, Corrosion Tests and Standards-Application and Interpretation,
Edited by R. BABOIAN, ASTM Manual series, Philadelphia, PA, 1995., Ch. 52.,
p. 493.
2. H. CHANDLER in Metallurgy for the Non-Metallurgist, Edited by
THE MATERIAL INFORMATION SOCIETY, Ohio, USA, 1998., p. 250.
3. H. P. GODARD, W. B. JEPSON, M. R. BOTHWELL, R. L. KANE in
The Corrosion of Light Metals, Edited by JOHN WILEY & SONS Inc.,
New York, NY, USA, pp. 315-328, (1967).
4. Corrosion Resistance of Metal and Alloys, Amer. Chem. Soc. Monograph, 158,
p. 97 and 647, (1963).
5. J. B. COTTON and B. P. DOWNING, Inst. Mar. Eng. (U.K.), 69, 311, (1957).
6. E. E. MILLAWAY, Mater. Protect., 4 (1), (1965).
7. N. D. TOMASHOV, R. M. ALTOVSKH, and M. TAKUSHNEREV, Dokl.
Akad. Nauk. (USSR), 141,4,2, (1961).
8. V. V. ANDREEVA, Corrosion, 20,35, (1964).
9. E. ENCE and J. MARGOLIN, J. Metals, 6,346, (1954).
10. P. A. JACQUET, Metal Treatment, 18,176, (1951).
11. C. MA and E. M. PERES, Ind. Eng. Chem., 43,675, (1951).
12. D.A. McLEAN, N. SCHWARTZ, J. K. WERNER, and M. GRESH, in
Bell Tel. Labs. Rpt. AD-232-690, pp. 14-15. (1960).
13. E. WAINER, U.S. Pat. 2,874,102, (1959).
14. M. E. SILBERT, J. Electrochem. Soc., 110,65, (1963).
15. G. JERKIEWICZ, H. STRZELECKI, and A. WIECKOWSKI, Langmuir,
12,1005, (1996).
16. G. WYSZNECKI, and W.S. STYLES, Color Science: Concepts and Methods,
118
Reproduced with permission of the copyright owner. Further reproduction prohibited without permission.
Quantitative Data and Formulae, Wiley-Interscience, New York, (1982).
17. K. MASSAU, The Physics and Chemistry of Colors, Wiley-Interscience,
New York, (1983).
18. A. HAGFELDT, N. VLACHOPOULOS, AND M. GRATZEL, J. Electrochem.
Soc., 141, 82, (1994).
19. W. A. SEELEY, M.Sc. Thesis, University of Kanzas, USA, (1970).
20. M. KODINTSEV and S. TRASSATTI, Electrochim. Acta, 3 9 ,1803, (1993).
21. V.A. ALVES, L.A. DA SILVA, J.F.C. BOODTS and S. TRASSATTI, Electrochim.
Acta, 39,1585, (1993).
22. L. TOMCSANYI, F. MOLNAR, J. LISZI and A. DE BATTISTI, Electrochim. Acta,
3 9 ,1923, (1994).
23. P.C.S. HAYFIELD, Platinum Metals Rev., 42,46, (1998).
24. CH. COMNINELLIS and G.P. VERCESI, J. Appl. Electrochem., 21,
136, (1991).
25. R. KOTZ and S. STUCKI, Electrochim. Acta, 3 1 ,1311, (1986).
26. C. IWAKURA, K. HIRAO and H. TAMURA, Electrochim. Acta, 22, 335, (1977).
27. K. FUKUDA, C. IWAKURA and H. TAMURA, Electrochim. Acta, 23,613, (1978).
28. K. FUKUDA, C. IWAKURA and H. TAMURA, Electrochim. Acta, 24,363, (1979).
29. S. TRASATTI, Electrochim. Acta, 29 ,1503, (1984).
30. F.I. MATTOS-COSTA, P. DE LIMA-NETO, S.A.S. MACHADO and L.A. AVACA,
Electrochim. Acta, 44,1515, (1998).
31. H. SCHMIDT, in Chemistry, Spectroscopy and Applications of Sol-gel Glasses,
Edited by R. REISFELD and C.K. JORGENSEN, Springer-Verlag, Berlin, 1992.
p .l19.
32. S. SAKKA and T. YOKO, in Chemistry, Spectroscopy and Applications of Sol-Gel
Glasses, Edited by R. REISFELD and C. K. JORGENSEN, Springer-Verlag, Berlin,
1992. p. 89.
119
Reproduced with permission of the copyright owner. Further reproduction prohibited without permission.
33. J.L. FERNANDEZ, C.A. MAROZZI, M.R. GENNERO DE CHIALVO, and A.C.
CHIALVO, J. Electroanal. Chem., 457,109, (1998).
34. C.L.P.S. ZANTA, A.R. DE ANDRADE, and J.F.C. BOODTS, Electrochim. Acta,
44,3333, (1999).
35. C. ANGELINETTA, S. TRASATTI, Lj.D. ATANASOSKA, R.T. ATANASOSKI,
J. Electroanal. Chem., 214, 535, (1986).
36. R. KOTZ, S. STUCKI, Electrochim. Acta, 31, 1311, (1986).
37. CH. COMNINELLIS, G.P. VERSECI, J. Appl. Electrochem., 21, 136, (1991).
38. G. JERKIEWICZ, S. HRAPOVIC, G. VATANKHAH, B.L. LUAN, in Proceedings of
the Symposium on Environmental Degradation of Metals and Corrosion Control of
Metals, Edited by M. ELBOUJDAINI, E. GHALI, METSOC, Quebec, (1999).
39. S. JIN, A. VANNESTE, E. GHALI, S. BOILY, R. SCHULTZ, J. Electrochem. Soc.,
144,4272, (1997).
40. S.H. YIP, D. GUAY, S. JIN, E. GHALI, A. VANNESTE, R. SCHULTZ, J. Mater.
Res., 13, 1171,(1998).
41. J.-L. DEPLANCKE, M. SUN, T.J. O'KEFFE, R. WINAND, Hydrometallurgy, 23,46,
(1989).
42. J.-L. DEPLANCKE, M. SUN, T.J. O'KEFFE, R. WINAND, Hydrometallurgy, 24,
179, (1990).
43. J. PRZYLUSKI and K. KOLBRECKA, J. App. Electrochem., 23,1063, (1993).
44. J.R. SMITH and F. C. WALSH, J. Appl. Electrochem., 28,1021, (1998).
45. W.J. MACKLIN and R.J. NEAT, Solid State Ionics, 53,694, (1992).
46. M. MAYR, W. BLATT, B. BUSSE and H. HEINKE, 4lh International Forum on
Electrolysis in the Chemical Industry, Fort Lauderdale, FA, (1990).
47. R. L. CLARKE, 2nd European Conference on Electrochemical Processing, Innovation
and progress, Moat House International, Glasgow, U. K. (1993).
48. X. G. ZHANG, in Corrosion and Electrochemistry of Zinc, Plenum Press New York,
120
Reproduced with permission of the copyright owner. Further reproduction prohibited without permission.
NY, USA, (1996). p. 250.
49. D.L. PIRON, in The Electrochemistry of Corrosion, Nace Houston, (1994), p. 169.
50. D.W. SHOESMITH, Kinetics of Aqueous Corrosion, ASM Handbook, 9th Edition,
Vol 13, p. 35, (1986).
51. R. W. SCHUTZ, Corrosion of Titanium and Titanium Alloys, ASM Handbook,
9lh Edition, Vol 13, pp. 669-696, (1986).
52. J. P. HIRTH,. in Hydrogen embrittlement and Stress Corrosion Cracking, Edited by
R. GIB ALA and R.F. HEHEMANN, American Society for Metals, Ohio, USA, 1984,
pp.30-38.
53. Encyclopedia of Electrochemistry of elements, Edited by A.J. BARD, Marcel Dekker
Inc., New York, NY, USA,1976, Vol V, p.365.
54. Corrosion and Corrosion Protection Handbook, Seconf Edition, Edited by P. A.
SCHWEITZER, Marcel Dekker Inc., New York, NY, 1988, pp.3187-212.
55. W.D. CALLISTER, Materials Science and Engeneering, John Willey and Sons, New
York, NY, 1990, p. 587.
56. D. SCHLAIN, Corrosion Properties of Titanium, Bureau of Mines Bulletin, 1964.
p. 619.
57. K. O. GRAY, Mater. Prot., 3,46 (1964).
58. M.E. STRAUMANIS and P.C. CHEN, J. Electrochem. Soc., 98,234, (1951).
59. T. FUKUZUKA, K. SHIMOGORI, H. SATOH and F. KAMDCUBO, in Titanium’80
Science and Technology, The Metallurgical Society, pp. 2631-2638,1980.
60. S. HRAPOVIC, G. VATANKHAH, B. LUAN, and G. JERKIEWICZ, in
Environmental Degradation of materials and Corrosion Control in Metals, Edited by
M. Elboujdaini, E. Ghali, METSOC, CIM, Montreal, Canada, (1999).
61. L.D. BURKE, Chapter 4 in R.E. WHITE, J.O’M. BOCKRIS and B.E. CONWAY,
Modem Aspects of Electrochemistry, 18, New York, NY, 1986.
62. N.V. PARTHASARADHY, Practical Electroplating Handbook, Prentice Hall,
121
Reproduced with permission of the copyright owner. Further reproduction prohibited without permission.
Englewood Cliffs, (1989).
63. H. ANGERSTEIN-KOZLOWSKA, in Comprehensive Treatise of Electrochemistry,
Vol. 9, Ch. 1, Edited by E. YEAGER, J.O'M. BOCKRIS, B.E. CONWAY,
S. SARANGAPANI, Plenum Press, New York, NY, USA, (1984).
64. A. ZOLFAGHARI, Ph. D. Thesis, Universite de Sherbrooke, Canada, (1998).
65. EBONEX® Electrodes for Electrometallurgy, ICI Ebonex Technologies Inc.
(Product Description), (1996).
66. G.J. LEFFETT in Surface Analysis-The Principal Techniques,
Edited by J.C. VICKERMAN, John Wiley & Sons, England, p. 406, (1997).
67. N. WINOGRAD and S.W. GAARENSTROOM in Physical Methods in Modem
Chemical Analysis, Edited by T. KUWANA, Academic Press, New york, NY, USA,
Vol. 2, p. 126-161, (1980).
68. M. RUBEL, R. HAASH, P. MROZEK, A. WIECKOWSKI, C.DE PAULLI,
S. TRASATTI, Vacuum, 45,423, (1994).
69. G. ERTL, J. KUPPERS, Low Energy Electrons and Surface Chemistry, VCH,
New York, NY, USA, (1985).
70. J.F. WATTS, An Introduction to Surface Analysis by Electron Spectroscopy, Oxford
University Press, New York, NY, USA, (1990).
71. Hanboook of X-Ray Photoelectron Spectroscopy, Edited by J.F. MOULDER,
Perkin Elmer, Eden Prairie, MN, USA, (1992).
72. P. PEDEFERRI, Drawings on Titanium, Cooperativa Libraria Universitaria
del Politecnico, Milano, Italia, (1981).
73. C. MADORE, O. PIOTROWSKI, D. LANDOLT, J. Electrochem. Soc.,
146,2526, (1999).
74. M. STERN, H. WISSENBRG, J. Electrochem. Soc., 106,755 (1959).
75. J. TAFEL, Z. Phys. Chem., 50,641, (1905).
76. B.E. CONWAY, Theory and Principles of Electrode Processes, Ronald Press,
122
Reproduced with permission of the copyright owner. Further reproduction prohibited without permission.
New York, NY, (1965).
77. B.E. CONWAY, B.V. TILAK, Advances in Catalysis, Vol 38, Ch. 1, Academic Press,
New York, NY, USA, (1992).
78. Electrodes of Conductive Metallic oxides, Edited by S. TRASATTI, Elsevier Scientific
Publishing Company, Part 1,6, p. 324, New York, NY, USA, (1980).
79. S. TRASATTI and P. KURTZWEIL, Platinum Met. Rev., 38,46, (1994).
80. B.E. CONWAY, Electrochemical Supercapacitors, Kluwer Academic Plenum
Publishers, New York, NY, USA, (1999).
81. J. O’M. BOCKRIS and T. OTAGAWA, J. Electrochem. Soc., 131, 290, (1984).
82. R. BOGGIO, A. CARUGATI, and S. TRASATTI, J. Appl. Electrochem.,
17, 828, (1987).
83. S. TRASATTI and D. A. PETRH, Pure Appl. Chem. 63, 711, (1991).
84. P. SIVIGLIA, A. DAGHETTI, and S. TRASATTI, Colloids Surf., 7, 15 (1983).
85. ANDERSSON, S.; COLLEN, B. KUYLENSTIERNA, U. MAGNELI,
Acta Chem. Scand.,11,1641, (1957).
86. R.R. MILLER-FOLK, R.E. NOFTLE, D. PLETCHER, J. Electroanal. Chem.,
274,257, (1989).
87. R.E. GRAVES, D. PLETCHER, R.L. CLARKE, F.C.J. WALSH,
J. Appl. Electrochem., 21, 848, (1991).
123
Reproduced with permission of the copyright owner. Further reproduction prohibited without permission.