colorado unaffiliated women voter post election survey summary 121714
TRANSCRIPT

!! December 11, 2014 MEMORANDUM TO: DEBBIE BROWN, COLORADO WOMEN’S ALLIANCE FR: DAVID FLAHERTY AND COURTNEY GIBBON, MAGELLAN STRATEGIES RE: SUMMARY OF COLORADO 2014 WOMEN VOTER POST-ELECTION SURVEY This document is a summary of a post-election landline and cell phone survey of 500 unaffiliated women voters in Colorado that voted in the 2014 general election. The interviews were conducted on November 17th and 18th, and the survey has a margin of error of +/- 4.38% at the 95 percent confidence interval. This group of women voters contributed 14% of the total vote, or 286,283 votes of the 2,080,071 total votes cast in the 2014 election. The survey used Magellan Strategies Colorado segmentation data to draw the sample, which only surveyed female unaffiliated voters that voted in the 2014 general election. The three unaffiliated segments used were Lean Republican Unaffiliated, True Middle and Lean Democrat Unaffiliated. Among all unaffiliated women who voted in the 2014 general election, 17% were Lean Republican Unaffiliated, 48% were True Middle and 35% were Lean Democrat Unaffiliated. Most observers of Colorado politics would confirm that unaffiliated women voters are an important voting block that can decide most elections in the Centennial state. These women voters are less partisan and more likely to consider candidates of both parties. This survey attempts to understand how these women viewed: the 2014 candidates for the United States Senate and Governor, the dominance of women’s issues, the Republican and Democrat parties, and their support for Hillary Clinton in 2016. Key Findings: Likeability of the Candidate Likeability of the candidate was a central decision point for a majority of these women when making their decision of whom to support in both the United States Senate and Governor elections. Their decision was not made based on a specific set of issues or a candidate’s party affiliation.

Colorado Women’s Alliance 2014 Unaffiliated Women Voter Post-Election Survey Summary 12/11/14
Magellan Strategies | 1685 Boxelder St. Suite 300 | Louisville, CO
www.MagellanStrategies.com | (303) 861-8585
2
Truly Independent Women These women have a negative opinion of both political parties, and 19% of Cory Gardner supporters split their ticket and voted for John Hickenlooper. Udall Campaign’s Overreach on Women’s Issues The survey showed that more than half of these women believed the election for the United States Senate was focused too much on women’s issues. Likeability of the Candidate Among all respondents in the election for the United States Senate, 39% supported Mark Udall and 38% supported Cory Gardner, 7% voted for some other candidate and 16% of respondents did not remember or refused the question. When comparing voter subgroups, we find that Mark Udall performed well among traditional Democrat-leaning demographics such as single and younger women. However, it is notable that Cory Gardner picked up 26% of pro-choice women, narrowing Mark Udall’s margin to only 26 points, which is a low margin considering two-thirds of all unaffiliated women voters are pro-choice. Below you will find the United States Senate ballot test among subgroups: Candidate All
Marr. Wom.
Sing. Wom. 18-34
35-44
45-54
55-64
65+
Pro Choice
Pro Life
Udall Margin +1 -3 +10 +15 -3 -1 -3 -7 +26 -52 Udall 39% 37% 43% 46% 39% 39% 36% 34% 52% 13% Gardner 38% 40% 33% 31% 42% 40% 39% 41% 26% 65% Other Can. 7% 7% 7% 9% 5% 8% 9% 3% 7% 6% DK/Remem. 3% 2% 6% 4% 3% 1% 4% 4% 4% 2% Refused 13% 14% 11% 10% 11% 12% 12% 18% 11% 14%
Cory Gardner’s likeability among these unaffiliated women voters was a large factor in determining how he was able to match Mark Udall’s support. The survey collected verbatim responses asking each respondent what she liked or disliked about Cory Gardner. The majority of the responses showed that these women voters liked his positive personality and felt he was more likely to represent the people of Colorado. Respondents were also asked if they liked or disliked Mark Udall. Mark Udall’s liberal views and the fact that he was not Cory Gardner were also decision makers for these women. It should be stated that a majority of these women also mentioned his single focus on women’s issues as a reason they disliked him. The Governor ballot test shows a much different story than the United States Senate ballot test. Among all respondents, 50% supported John Hickenlooper and 32% supported Bob Beauprez, for a win margin of 18%. You can see in the following table that Governor Hickenlooper did well among all subgroups, except among women who are pro-life.

Colorado Women’s Alliance 2014 Unaffiliated Women Voter Post-Election Survey Summary 12/11/14
Magellan Strategies | 1685 Boxelder St. Suite 300 | Louisville, CO
www.MagellanStrategies.com | (303) 861-8585
3
Below you will find the Governor ballot test among subgroups: Candidate All
Marr. Wom.
Single Wom. 18-34
35-44
45-54
55-64
65+
Pro Choice
Pro Life
Hick. Margin +18 +15 +25 +38 +17 +16 +5 +9 +46 -41 Hickenlooper 50% 49% 54% 61% 52% 48% 44% 44% 65% 21% Beauprez 32% 34% 29% 23% 35% 32% 39% 35% 19% 62% Other Can. 4% 4% 3% 4% 2% 5% 5% 2% 4% 1% DK/Remember 4% 2% 7% 7% 3% 3% 1% 5% 3% 4% Refused 10% 11% 7% 5% 8% 12% 11% 14% 9% 12%
In the election for Governor the women interviewed had very few comments regarding abortion or women’s issues. John Hickenlooper ran a very different campaign than Mark Udall, and the survey data indicates that his was much more effective among unaffiliated women voters. Among pro-choice voters, a key Democrat-leaning subgroup, John Hickenlooper achieved a 46-point win margin, where Mark Udall’s margin was only 26 points. Looking at John Hickenlooper, likeability again played a large determining factor among these unaffiliated women. Top reasons why these women liked John Hickenlooper were his personality, his overall job performance as Governor and his positive-only campaign policy. Looking at the data from the survey, John Hickenlooper was viewed as a positive centrist who is doing a good job as Governor. The Republican candidate for Governor had an uphill battle due to the fact that John Hickenlooper was so well liked among these women prior to the election season. Some women liked Bob Beauprez because he is a Republican and he is not John Hickenlooper. Other reasons included: his conservative values, he is pro-life stance, his record on business and his position on guns. Overall, there was no single, dominant issue that drove these women to vote for either candidate in the election for Governor. When asked what issue they felt was most important in selecting a candidate, a majority of respondents said the economy and that John Hickenlooper had done a good enough job to deserve re-election. These women were not focused on any particular issue, rather on personality and character of the candidates. When comparing the two top-of-ticket Democrat candidates among all respondents, we find John Hickenlooper outperformed Mark Udall by 11%, 50% to 39% respectively within the segments of Lean Republican Unaffiliated, True Middle and Lean Democrat Unaffiliated. The survey identifies several reasons for this, but primarily likeability of John Hickenlooper. These women liked and connected with John Hickenlooper, more than with Mark Udall, who was more closely associated with an unpopular President and focused too much on women’s issues. John Hickenlooper also received several mentions about him running a positive campaign, where Mark Udall did not.

Colorado Women’s Alliance 2014 Unaffiliated Women Voter Post-Election Survey Summary 12/11/14
Magellan Strategies | 1685 Boxelder St. Suite 300 | Louisville, CO
www.MagellanStrategies.com | (303) 861-8585
4
The Republican candidates show a similar story, with one being perceived as more likeable than the other. Cory Gardner achieved more personal likeability and trust with unaffiliated women than Bob Beauprez. The verbatim responses also mention Bob Beauprez running a more negative campaign, a criticism that was not found in comments about Cory Gardner. Truly Independent Women Much has been written about the polarization of the electorate and how the vast majority of voters are either in the Democrat or Republican camp. This survey looked to validate that assumption and see if unaffiliated female voters consider both parties or lean more toward one party. To get a sense of how open these women were to both candidates in the election for the United States Senate and Governor, the survey asked respondents if at any point they considered a candidate other than whom they voted for. Among all respondents, 20% considered a candidate other than whom they voted. Among those that voted for Cory Gardner, 19% split their ticket and voted for John Hickenlooper. This demonstrates that these women are open to candidates from both parties, and made their decision on other factors and candidate likeability. At this time, both the Democrat and Republican parties earn low marks among these women voters. Only one third of respondents have favorable feelings toward either party, and 20% have neutral feelings for both parties equally. A plurality of respondents, 45%, have unfavorable feelings toward the Republican party, and 43% have unfavorable feelings toward the Democrat party. The survey asked respondents what they liked and disliked about each party. Both parties were criticized for not compromising and working together, being selfish and being out for themselves. There were also comments among Democrat-leaning women who were frustrated that Democrat candidates did not defend the President’s policies more aggressively. Udall Campaign’s Overreach on Women’s Issues Some say that Mark Udall’s ties to President Obama and his policies harmed Mark Udall’s campaign for Senate. However, the survey shows that the sole focus on women’s issues was more damaging to the campaign. By concentrating on women’s issues only, Mark Udall was unable to separate himself from President Obama or give unaffiliated women any other issues to consider. Among all respondents, a majority thought the election for the United States Senate was focused too much on women’s issues. When comparing the United States Senate ballot to the Governor ballot, we find that Mark Udall does not match the overall support of John Hickenlooper. To explain this, one subgroup to look at would be unaffiliated women who self-identified as moderates. They do not lean one way or another, but in the past tend to vote Democrat. In the election for the United States Senate, 36% of moderates supported Cory Gardner

Colorado Women’s Alliance 2014 Unaffiliated Women Voter Post-Election Survey Summary 12/11/14
Magellan Strategies | 1685 Boxelder St. Suite 300 | Louisville, CO
www.MagellanStrategies.com | (303) 861-8585
5
compared to 34% for Mark Udall. In the election for Governor, 53% supported John Hickenlooper and only 29% supported Bob Beauprez. Among these self-identified moderate women, more than half, 54%, thought the election for the United States Senate focused too much on women’s issues. This survey shows that the use of women’s rights as the primary issue in the election for United States Senate was an overreach, and did not persuade these women to vote for Mark Udall. Looking ahead Looking ahead to the 2016 Presidential election, respondents were asked two questions measuring support for Hillary Clinton. Her support was much lower than we expected. When asked how likely they were to support her, 14% responded as extremely likely, and 13% as very likely, coming to only 27% reliably supporting her. Twenty seven percent said they were somewhat likely to support her, and 37% were not likely at all to support her. When asked if they would vote for her regardless of whom the Republican nominee is, only 21% said yes. We find these results rather surprising, but after understanding more about how these women think and feel about the political parties and candidates, it makes sense. Yet it is clear at this time that Hillary Clinton, if she is the nominee, will have to work hard for the support of these independent women. Looking to build off of the momentum of the 2014 Election, it is important to note that likeability of a candidate, on any level, is a very important factor for these women when deciding to cast their vote. Unaffiliated women are likely to remain truly independent in the years to come, and doing well among this voting subgroup should be a key strategy for any candidate in the elections ahead. For more information regarding this survey please contact: Debbie Brown, Colorado Women’s Alliance - [email protected] David Flahery, Magellan Strategies - [email protected] Courtney Gibbon, Magellan Strategies - [email protected].

!!!!Magellan Strategies Colorado 2014 Post Election Survey Topline Results Magellan Strategies are pleased to present the topline results for a 500n live landline and cell phone survey of 2014 general election unaffiliated women voters in the state of Colorado. The interviews were conducted November 17th and 18th, 2014. This survey has a margin of error of +/- 4.38% at the 95 percent confidence interval. This survey was weighted based upon the 2014 general election voting demographic turnout. T1. Did you vote in this year’s general election for Governor, the United States Senate and the state legislature? Yes ........................................................................ 100%
T2. Are you male or female? Female .................................................................. 100%
T3. Are you registered to vote in Colorado as a Republican, a Democrat, an independent or unaffiliated voter, or are you not registered to vote? Unaffiliated ............................................................. 74% Republican .............................................................. 12% Democrat ................................................................ 11% Other ........................................................................ 3%
Magellan ID#: COPOST-111714 Colorado 2014 Unaffiliated Women Post Election Survey Topline Results Field Dates: 11/17/14 – 11/18/14, MoE +/- 4.38%, 500n, CONFIDENTIAL
Magellan Strategies | 1685 Boxelder St. Suite 300 | Louisville, CO 80027
www.MagellanStrategies.com | (303) 861-8585
2
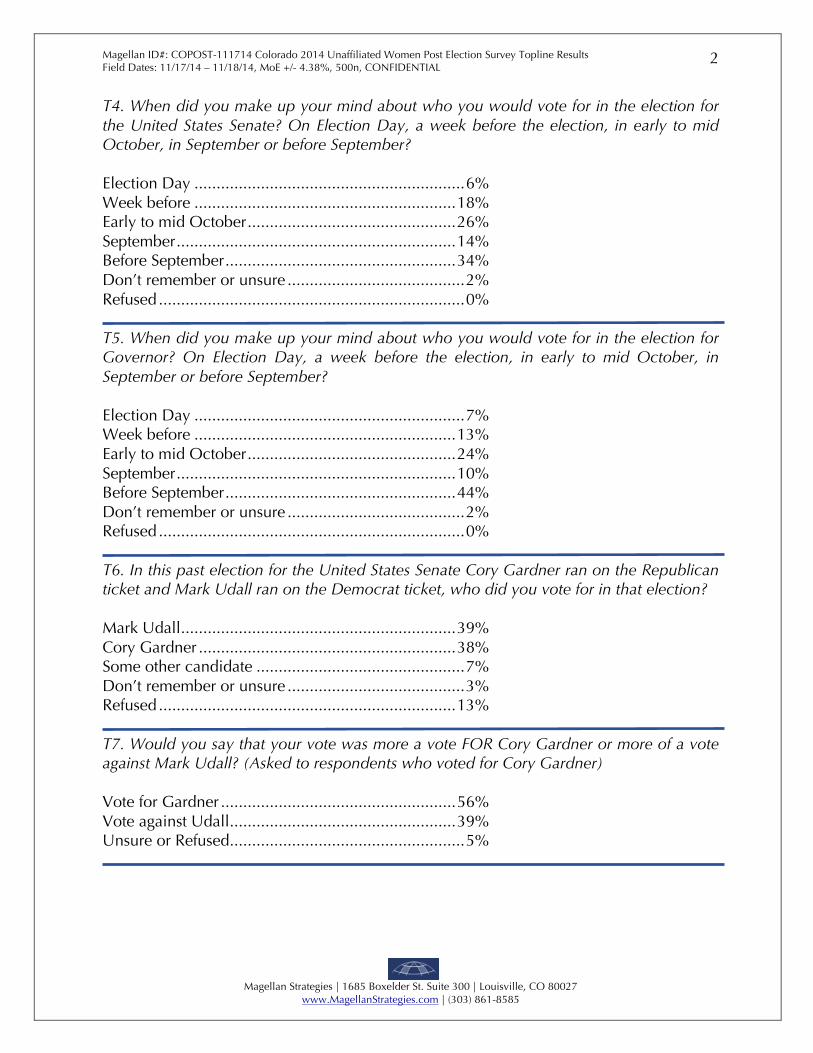
T4. When did you make up your mind about who you would vote for in the election for the United States Senate? On Election Day, a week before the election, in early to mid October, in September or before September? Election Day ............................................................. 6% Week before ........................................................... 18% Early to mid October ............................................... 26% September ............................................................... 14% Before September .................................................... 34% Don’t remember or unsure ........................................ 2% Refused ..................................................................... 0%
T5. When did you make up your mind about who you would vote for in the election for Governor? On Election Day, a week before the election, in early to mid October, in September or before September? Election Day ............................................................. 7% Week before ........................................................... 13% Early to mid October ............................................... 24% September ............................................................... 10% Before September .................................................... 44% Don’t remember or unsure ........................................ 2% Refused ..................................................................... 0%
T6. In this past election for the United States Senate Cory Gardner ran on the Republican ticket and Mark Udall ran on the Democrat ticket, who did you vote for in that election? Mark Udall .............................................................. 39% Cory Gardner .......................................................... 38% Some other candidate ............................................... 7% Don’t remember or unsure ........................................ 3% Refused ................................................................... 13%
T7. Would you say that your vote was more a vote FOR Cory Gardner or more of a vote against Mark Udall? (Asked to respondents who voted for Cory Gardner) Vote for Gardner ..................................................... 56% Vote against Udall ................................................... 39% Unsure or Refused ..................................................... 5%

Magellan ID#: COPOST-111714 Colorado 2014 Unaffiliated Women Post Election Survey Topline Results Field Dates: 11/17/14 – 11/18/14, MoE +/- 4.38%, 500n, CONFIDENTIAL
Magellan Strategies | 1685 Boxelder St. Suite 300 | Louisville, CO 80027
www.MagellanStrategies.com | (303) 861-8585
3
T8. Would you say that your vote was more a vote FOR Cory Gardner or more of a vote against Barack Obama and his policies? (Asked to respondents who voted for Cory Gardner) Vote against Obama and his policies ...................... 55% Vote for Gardner ..................................................... 41% Unsure or Refused ..................................................... 4%
T9. During the election this year for the United States Senate, was there a time when you were considering voting for someone other than who you voted for? Yes, considered another candidate .......................... 23% No, always intended to vote for candidate .............. 75% Unsure or don’t remember ........................................ 1% Refused ..................................................................... 1%
T10. Do you think the United States Senate election focused too much on women’s issues? Yes .......................................................................... 51% No .......................................................................... 43% Unsure or Refused ..................................................... 6%
T11. Now I would like to talk about the good and the bad points of each candidate for the United States Senate. Was there anything about Cory Gardner and his campaign that made you want to vote for him or against him? VERBATIM RESPONSES ATTACHED
T12. Was there anything about Mark Udall and his campaign that made you want to vote for him or against him? VERBATIM RESPONSES ATTACHED
T13. In this past election for Governor Bob Beauprez ran on the Republican ticket and John Hickenlooper ran on the Democrat ticket, who did you vote for in that election? John Hickenlooper .................................................. 50% Bob Beauprez ......................................................... 32% Some other candidate ............................................... 4% Don’t remember or unsure ........................................ 4% Refused ................................................................... 10%

Magellan ID#: COPOST-111714 Colorado 2014 Unaffiliated Women Post Election Survey Topline Results Field Dates: 11/17/14 – 11/18/14, MoE +/- 4.38%, 500n, CONFIDENTIAL
Magellan Strategies | 1685 Boxelder St. Suite 300 | Louisville, CO 80027
www.MagellanStrategies.com | (303) 861-8585
4
T14. During the election this year for Governor, was there a time when you were considering voting for someone other than who you voted for? Yes, considered another candidate .......................... 20% No, always intended to vote for candidate .............. 78% Unsure or don’t remember ........................................ 2% Refused ..................................................................... 0%
T15. Now I would like to talk about the good and the bad points of each candidate for Governor. Was there anything about Bob Beauprez and his campaign that made you want to vote for him or against him? VERBATIM RESPONSES ATTACHED
T16. Was there anything about John Hickenlooper and his campaign that made you want to vote for him or against him? VERBATIM RESPONSES ATTACHED
T17. In this past election, what issues were the most important to you when choosing a candidate to vote for in the election for the United States Senate? VERBATIM RESPONSES ATTACHED
T18. In this past election, what issues were the most important to you when choosing a candidate to vote for in the election for Governor? VERBATIM RESPONSES ATTACHED

Magellan ID#: COPOST-111714 Colorado 2014 Unaffiliated Women Post Election Survey Topline Results Field Dates: 11/17/14 – 11/18/14, MoE +/- 4.38%, 500n, CONFIDENTIAL
Magellan Strategies | 1685 Boxelder St. Suite 300 | Louisville, CO 80027
www.MagellanStrategies.com | (303) 861-8585
5
Just a few more questions… I’d now like you to think about the good and bad points of the national political parties. T19. How would you rate your feelings toward the Republican Party? Would you say your feelings are very favorable, somewhat favorable, neutral, somewhat unfavorable or very unfavorable? Total Favorable ....................................................... 34% Neutral .................................................................... 20% Total Unfavorable ................................................... 45% Very Favorable .......................................................... 8% Somewhat Favorable ............................................... 26% Very Unfavorable .................................................... 24% Somewhat Unfavorable ........................................... 21% Refused ..................................................................... 1%
T20. Is there anything in particular that you like or do not like about the Republican Party? VERBATIM RESPONSES ATTACHED
T21. How would you rate your feelings toward the Democrat Party? Would you say your feelings are very favorable, somewhat favorable, neutral, somewhat unfavorable or very unfavorable? Total Favorable ....................................................... 36% Neutral .................................................................... 20% Total Unfavorable ................................................... 43% Very Favorable .......................................................... 8% Somewhat Favorable ............................................... 28% Very Unfavorable .................................................... 24% Somewhat Unfavorable ........................................... 19% Refused ..................................................................... 1%
T22. Is there anything in particular that you like or do not like about the Democrat Party? VERBATIM RESPONSES ATTACHED

Magellan ID#: COPOST-111714 Colorado 2014 Unaffiliated Women Post Election Survey Topline Results Field Dates: 11/17/14 – 11/18/14, MoE +/- 4.38%, 500n, CONFIDENTIAL
Magellan Strategies | 1685 Boxelder St. Suite 300 | Louisville, CO 80027
www.MagellanStrategies.com | (303) 861-8585
6
T23. How much do public officials care about what people like you think? A great deal, a lot, a moderate amount, a little, not at all? Great deal ................................................................. 2% A lot .......................................................................... 7% Moderate amount .................................................... 28% A little ..................................................................... 35% Not at all ................................................................. 25% Refused ..................................................................... 3%
T24. How much can people like you affect what the government does? A great deal, a lot, a moderate amount, a little, not at all? Great deal ................................................................. 7% A lot ........................................................................ 10% Moderate amount .................................................... 29% A little ..................................................................... 36% Not at all ................................................................. 15% Refused ..................................................................... 3%
T25. Do you approve or disapprove of the job Barack Obama is doing as President? Total Approve ......................................................... 42% Total Disapprove ..................................................... 52% Unsure or Refused ..................................................... 6% Strongly Approve .................................................... 14% Somewhat Approve ................................................. 28% Strongly Disapprove ................................................ 37% Somewhat Disapprove ............................................ 15%
T26. Thinking ahead to the 2016 Presidential election, if Hillary Clinton is the Democratic Party’s nominee, how likely are you to support her? Extremely likely, very likely, somewhat likely or not likely at all? Extremely likely ....................................................... 14% Very likely ............................................................... 13% Somewhat likely ...................................................... 27% Not likely at all ....................................................... 37% Undecided ................................................................ 7% Refused ..................................................................... 2%

Magellan ID#: COPOST-111714 Colorado 2014 Unaffiliated Women Post Election Survey Topline Results Field Dates: 11/17/14 – 11/18/14, MoE +/- 4.38%, 500n, CONFIDENTIAL
Magellan Strategies | 1685 Boxelder St. Suite 300 | Louisville, CO 80027
www.MagellanStrategies.com | (303) 861-8585
7
T27. If Hillary Clinton is the Democratic Party’s nominee for President, would you vote for her regardless of who the Republican nominee is? Yes .......................................................................... 21% No .......................................................................... 70% Unsure or Refused ..................................................... 9%
And now I have a couple of questions for statistical purposes only… T28. Do you consider yourself to be very conservative, somewhat conservative, moderate, somewhat liberal or very liberal when it comes to your political beliefs? Total Conservative .................................................. 30% Moderate ................................................................ 36% Total Liberal ............................................................ 32% Very Conservative ................................................... 10% Somewhat Conservative .......................................... 20% Very Liberal ............................................................ 10% Somewhat Liberal ................................................... 22% Refused ..................................................................... 2%
T29. Do you consider yourself to be pro-life or pro-choice? Pro-Choice .............................................................. 63% Pro-Life ................................................................... 27% Unsure or Refused ................................................... 10%
T30. Which of the following age groups applies to you? 18-34 ...................................................................... 23% 35-44 ...................................................................... 18% 45-54 ...................................................................... 19% 55-64 ...................................................................... 21% 65+ ......................................................................... 19% Refused ..................................................................... 0%

Magellan ID#: COPOST-111714 Colorado 2014 Unaffiliated Women Post Election Survey Topline Results Field Dates: 11/17/14 – 11/18/14, MoE +/- 4.38%, 500n, CONFIDENTIAL
Magellan Strategies | 1685 Boxelder St. Suite 300 | Louisville, CO 80027
www.MagellanStrategies.com | (303) 861-8585
8
T31. What is your marital status? Are you married, single and have never been married, unmarried and living with a partner, widowed, separated, or divorced? Married ................................................................... 64% Single and never been married ................................ 13% Divorced ................................................................. 11% Widowed .................................................................. 7% Unmarried living with partner ................................... 4% Separated .................................................................. 0% Refused ..................................................................... 1%
T32. For statistical purposes only what is your race? Are you white, Hispanic or Latino, black or African American, of do you belong to some other racial group? White ...................................................................... 84% Hispanic ................................................................... 7% Other ........................................................................ 5% Black or African American ........................................ 2% Don’t Know or Refused ............................................. 2%
Survey Methodology This survey was conducted using live dialing to landline and cell phone sample. The sample used for this survey was randomly drawn from a Colorado voter file and selected women within the Magellan Strategies Lean Republican Unaffiliated, True Middle and Lean Democrat Unaffiliated segments. The survey response data was weighted based upon the 2014 general election voting demographics. The interviews were conducted on November 17th – 18th, 2014. Three attempts were made to interview each household in the sample. This survey has a margin of error of 4.38% at the 95 percent confidence interval.