color image processing and object tracking system - · pdf filecolor image processing and...
TRANSCRIPT
NASA Technical Memorandum 107144
J i'_
Color Image Processing and Object
Tracking System
Robert B. Klimek and Ted W. Wright
Lewis Research Center
Cleveland, Ohio
Robert S. Sielken
Trinity University
San Antonio, Texas
February 1996
National Aeronautics and
Space Administration
https://ntrs.nasa.gov/search.jsp?R=19960016954 2018-05-13T10:43:59+00:00Z
Trade names or rnanufacturets' names are used in this report for id_tifica_ion
only. This _sag¢ does not ccGstirute an o_c/aJ endonement, eid_e_ exlxessedor implied, by the NabcmLl Aeronautics and Space Adminislrabon.
COLOR IMAGE PROCESSING AND OBJECT TRACKING SYSTEM
Robert B. Klimek and Ted W. Wright
National Aeromutics and Space AdministrationLewis Research Center
Cleveland, Ohio 44135-3191
Robert S. Sielken
Trinity University715 Stadium Drive
San Antonio, Texas 78212-7200
SUMMARY
This report describes a personal computer based system for automatic and semiautomatic
tracking of objects on film or video tape, developed to meet the needs of the MicrogravityCombustion and Fluids Science Research Programs at the NASA Lewis Research Center. The
system consists of individual hardware components working under computer control to achieve a
high degree of automation. The most important hardware components include 16-mm and 35-mm
film transports, a high resolution digital camera mounted on a x-y-z micro-positioning stage, an S-
VHS tapedeck, an Hi8 tapedeck, video laserdisk, and a framegrabber. All of the image input
devices are remotely controlled by a computer.Software was developed to integrate the overall operation of the system including device
frame incrementation, grabbing of image frames, image processing of the object's neighborhood,
locating the position of the object being tracked, and storing the coordinates in a file. This
process is performed repeatedly until the last frame is reached. Several different tracking methods
are supported.To illustrate the process, two representative applications of the system are described.
These applications represent typical uses of the system and include tracking the propagation of a
flame front and tracking the movement of a liquid-gas interface with extremely poor visibility.
INTRODUCTION
Historically, the analysis of moving objects, whether they are flame fronts, particles,
droplets, or fluid interfaces, was done manually, usually by measuring features of an image
projected on a wall. This manual analysis was tedious and suffered from many shortcomings,
including poor accuracy and poor repeatability. The smoothness and reflection of the wall or
projection screen was a problem, as was the stability of the projector and the poor lighting
conditions. Since all the measurements were performed by hand and by eye, repeatability was
always questionable. For most people, the worst part was the l_gth of time it took to analyze afilm.
More recently, film analysis was performed by projecting the image onto an internal
viewing screen-an improvement over projection on a wall. The movement of objects was tracked
manually with a cursor moved by the operator. The latest models even incorporated a personal
computer (PC) serial interface for downloading the data. However, several shortcomings
remained. The cursor was still operated by the scientist and was still dependent on the scientist's
eyesight and judgement on that particular day. It was not a problem for a couple dozen frames,
but after a few hundred the operator's fatigue undoubtedly became a factor, and the reliability and
the operator's judgement diminished.
The Color Image Processing and Object Tracking System (Tracking System) was
designed to overcome these deficiencies. It was designed to be fully automatic, thus removing
some of the guesswork fi'om the analysis as well as reducing the tedium of analyzing a large
number of frames. Because the image is converted to digital format, it can be processed digitally,
improving the image and enabling easier detection of edges. At times it may be preferable for the
user to locate the object manually with a mouse rather than have the computer do it. The
Tracking System allows this. All of the image processing that can be performed in the automatic
tracking mode can still be performed in the manual mode, at the user's discretion. Several
tracking methods (or modes) axe implemented. A template matching method can be used as an
alternate to the automated threshold-based method. The template matching techniques, including
correlation and a subtractive technique, track image features rather than edges. A region
parameters method can track movement of intensity-based parameters, such as intensity
maximum, minimum, and mean, in a selected stationary region. The last tracking method
currently implemented is the area measurement method, which can be used measure scaled or non-sealed areas.
The Tracking System was developed and is being used by the Space Experiments
Division at the NASA Lewis Research Center primarily for combustion and fluid studies. The
system is composed mostly of commercial off-the-shelf components that were integrated in-
house. The software to control the overall system operation as well as data acquisition and
tracking was also written in-house.
SYSTEM DESCRIPTION
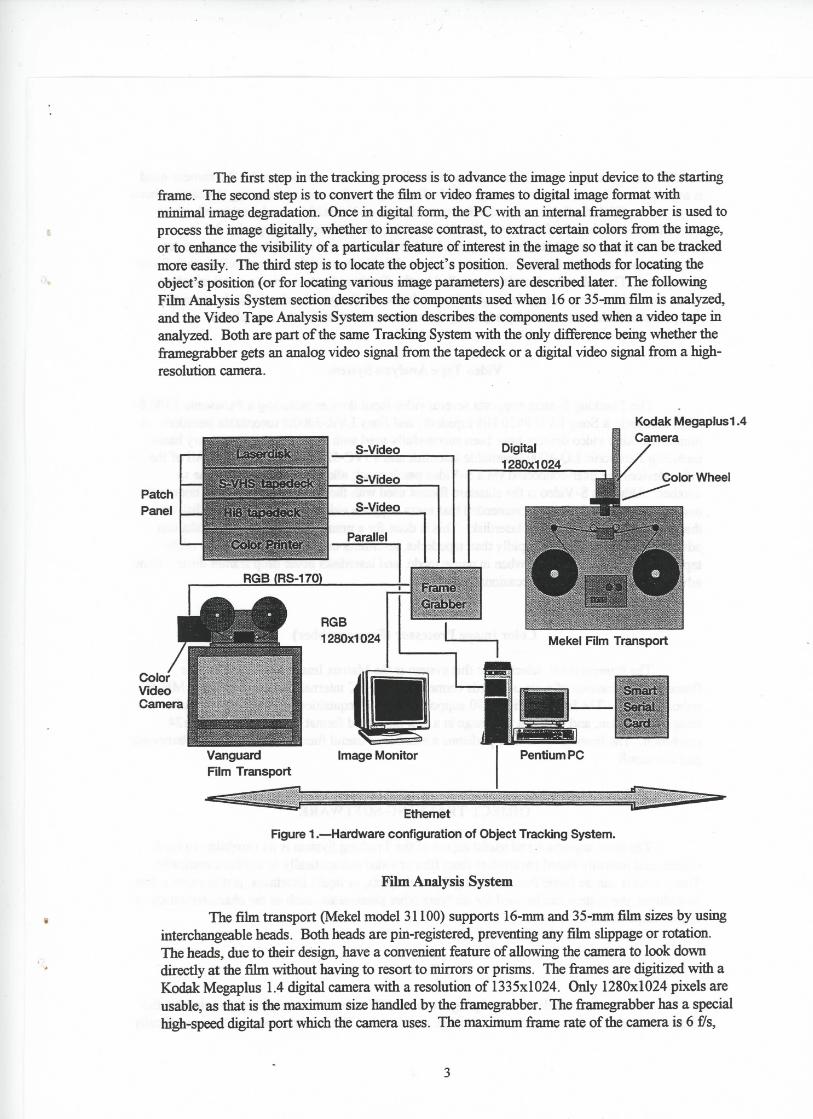
The Tracking System consists of a number of discrete components as illustrated in Fig. 1.
The Tracking System achieves the automation by integrating the discrete components into a
cohesive system with a controlling program that directs the entire operation. The image input
devices are controlled via a "smart" serial card which enables the usage of multiple ports, thus
providing independent control of all devices. A framegrabber digitizes the incoming video signals
and displays the output image to the secondary monitor. The system can track objects directly
from 16-ram film, 35-rnm film, VHS tape, S-VHS tape, Hi8 tape, or a recordable laserdisk. In
addition, any other type of video tape can be tracked by copying the image data to the laserdiskvideo recorder and then tracking fxom the laserdisk.
but that speed is rarely realized in practice as it is limited by the shutter speed. The camera head
is attached to a 3-axis translation stage which allows up to a 2:1 zoom by moving the camera head
up or down. With the 2:1 zoom, a maximum resolution of 2560x2048 can be achieved, albeit
over an area less than the full frame. A colorwheel (needed because the Megaplus 1.4 is
monochrome) is located between the camera head and the lens and is used to generate a color
imago by rotating color filters (red, green, blue, or clear) in front ofthe camera before each frame
is acquired. The colorwheel is also controlled by the Tracking System using a serial interface.
Since most of the lamp energy is weighted towards the red (longer wavelengths), the computer
compensates (balances colors) by adjusting the exposure duration for the four planes.
Video Tape Analysis System
The Tracking System supports several video input devices including a Panasonic 7300 S-
VHS tapedeck, a Sony Eve 9650 Hi8 tapedeck, and Sony LVR-3000N recordable laserdisk. A
number of other video devices have been successfully used with the system on temporary basis,
including Panasonic LQ-4000 rewritable laserdisk and a JVC-525 S-VHS tapedeck. All of the
video devices are inter-connected via a S-Video patch panel, allowing copying from one toanother. Although S-Video is the standard format used with the video devices, NTSC composite
may also be selected. It is recommended that users copy the video tape data to a laserdisk and
that tracking be done fi_m the laserdisk. This is done for a number of reasons: laserdisks can
advance frames much more rapidly than tapedecks, laserdisks can display a full frame while
tapedccks display only a field when in pause mode, and laserdisks never drop flames during frame
advancement like tapcx_ks occasionally do.
Color Image Processor (Framegrahber)
The framegrabber selected for this system is the Matrox Image Series 1280. The
framegrabber consists of a set of boards connected to the PC internal ISA bus and has 8 MB of
onboard RAM. The Image Series 1280 supports S-Video acquisition, digital high-resolution
image acquisition, and displays the image in a non-interlaced format up to a 1280x1024x24
resolution. The framegrabber also performs a number of useful functions, including the hardware
pan and scroll.
OBJECT TRACKING SOFTWARE
The most important and useful aspect of the Tracking System is its capability to track
objects and intensity-based parameters from film or video automatically or scm_iautomatically.
These objects can be flame fi'onts, moving liquid droplets, or liquid interfaces, just to name a few.
In addition, the system can be used for studying other phenomena, such as the characterization of
object shape or color.
Tracker
A Microsoft Windows-based program named "Tracker" was developed to automate the
process of tracking objects and various image parameters. This program was written specifically
for the type of problems encountered m many of mierogravity-based combustion and fluid seience
studies. Some of these problems may be related to color nonuniformity, poor contrast, noisy
signal, uneven background illumination, changes in the edge characteristics with time, or
reflection from an experiment container window. In addition, many of the objects analyzed arc
not objects with well defined outlines but wispy and hazy objects without hard edges, especiallythose related to flame and smoke studies.
There are two auxiliary software libraries used by Tracker. Most of the image processing
is performed with functions from the Visilog (Noesis Vision, Inc.) function library. A number of
image processing functions were also written by the authors. In addition to performing image
processing, Visilog was also used to control interaction with the framegrabber, including
acquiring frames and displaying them to the image monitor. Functions from Image Man (Data
Techniques, Inc.) library are used to display the images to Microsoft Windows.
The Tracker program evolved from several earlier DOS-based versions 1. Tracker was
written in Visual C++ and makes extensive use of the Microsoft Foundation Classes (MFC).
Emphasis was placed on keeping the program user interface as simple as possible and on
following accepted Windows conventions. The user interface and most of the tracking featureswere based on user input and suggestions. In addition to tracking objects and image parameters,
the program also contains various options for performing image analysis and measurements,
image processing, and controlling instruments using a serial interface.
The object tracking can be performed in two modes: automatic and semiautomatic. In the
automatic tracking mode, the program increments the image input device by one or more frames,
grabs a frame, performs the selected image processing operations within the user selected Area of
Interest (AOI), locates the edge, stores the edge location coordinates in a fie, and centers the AOI
around the newly found edge. This process is repeated in a loop until the last frame specified is
reached or until stopped by user intervention. Four automatic tracking methods are supported: the
threshold tracking, template match tracking, region parameters tracking, and the area and volume
measurement tracking.
The Automatic Threshold Method uses a threshold operation as the final processing step
ag_er which the object's position is determined by searching the AOI for the first occurrence of
thresholded pixels in a given direction. Filtering or other image processing may be used to
clean up the image before the final threshoding step is executed. The threshold may be fixed
or variable based on maximum, minimum, or median intensities in the AOI. Tracking
movement can be consWained to a line. Finally, a provision is made that if tracking is lost
(i.e. no point is found inside the AOI), the user has the option to change tracking parametersand resume tracking, continue with the current selections assuming that the object will
become visible again, or to quit tracking altogether.
The Template Match Method is performed by searching an area of an image, called the
search region, with a template image. The track point is the poin_ of best match between the
template and the corresponding area in the search region. Correlation and Subtractive
template matching is supported.
The Region Parameters Method records intensity-based parameters in a stationary (notmoving) AOI as a function of time. This allows the user to make observations at a fixed point
(area) in the image frame. The parameters recorded are the maximum intensity, x and y
°"
positions of the maximum, minimum intensity, x and y positions of the minimum, and themean intensity of all pixels inside the AOI.
- The Area and Volume Measurement Method calculates areas, volumes, and surfaces by
lowpass filtering and thresholding the AOI and then summing up the thresholded pixels.
Scaled as well as non-scaled area measurements are supported. The scaled area measurement
employs a scale factor to a_ for distortion caused by viewing angle. The volume and
surface area is calculated from the 2-d area with the assumption that the object in question is
symm_c.
In the semiantomatic mode, the program performs all steps as in the automatic mode,
except locating the edge. The user manually specifies the edge by moving a cross hair around the
screenvia a mouse. Once the object position has been specified, the program automatically
advances to the next frame, the fiamegrabber digitizes the frame, and Tracker waits for user to
specify the next object position. When tracking an object in the semiautomatic mode, sometimes
it can be dit_cult to see where to place the cursor for exact position specification. The Tracker
has a feature that helps deal with this predicament: the user can select a zoom factor to enlarge the
object on the screen so that it is easier to see, and can continue tracking while in the zoom mode.
If the object tracks off the screen, Tracker recalculates the display coordinates and scrolls the
display area such that the object is once again centered on the screen. Depending on the zoom
factor and the movement of the object, the scrolling of the zoom area may be repeated severaltimes.
Pre-Tracking and Imge Processing
The Tracker soRware also allows image processing to be performed on individual images
before tracking is started. This allows the user to experiment with different processing options to
see which would work the best in enhancing the object for successful tracking. Various tools,
such as line profile, histograms, and other pixel readout utilities, may be employed to analyze and
visualize the results and effects of the image processing operations. Once the user is satisfied
with a particular sequence of processing fimctions which do the best job in enhancing the features
of interest, those same processing functions can be specified for use during trackins.
Summary of Important Tracking System Features
The Tracker user interface and the tracking features are based on user inputs and the
numerous suggestions which we've received over time, including various time saving shortcuts
and helpful features. All of the image input devices can be controlled fi'om the Tracker program,
using puU-down menus or buttons on the button bar. Image processing can be used to enhance
the object's features to help the tracking algorithm stay with the object. Frame averaging, frame
subtraction, and various histogram equalization schemes are supported. A complete list of the
image processing functions is given in Appendix A. Even though color images (24-bit) are
captured from the input device, tracking is performed on monochrome images by extracting a
single color plane (red, green, blue, or intensity) from the color image. This not only reduces the
number ofpixels needed to be processed, but also eliminates unwanted color _. Spatial
and temporal scale factors can be used to track an object in terms of real spatial units (instead of
pixels) and real time units (instead of frames). Tracking an object position can be performed in
6

IQ
terms of relative screen coordinates or relative to first point origin. Multiple objects can be
tracked simultaneously. Tracker allows independent control ofaU AOI's including selection of
different tracking techniques, tracking constraints, and image processing options. The tracking
process can be temporarily suspended during any step of the tracking cycle. When tracking is
suspended, the user has the option to change tracking parameters and resume tracking, continuewith the current selections, or to quit tracking altogether. While the tracking is in progress, the
incoming data points can be graphed (position vs. time) in real-time or displayed in a numeric
format. An output file is generated m a convenient format for analysis/plotting/graphics. The
system is connected via Ethemet to the network allowing easy transfer of data files and/or images.
The Tracker program is quite flexible m terms of types of image acquisition devices it can use and
where to display the acquired images. It can be used with a framegrabber or it can run m a stand-
along mode without a framegrabber. The image display can be to a framegrabber (typically) or itcan be to MicrosoR Windows. And finally, the complete tracking configuration, including image
processing, scale factors, coordinate systems, and tracking methods can be saved to a file for
future retrieval.
EXAMPLE APPLICATION
Two example combustion and fluid science experiments were chosen to demonstrate the
usage and the capabilities of the Tracking System. The examples are quite different, employing a
different set of processing functions and tracking criteria.
The first application involves tracking two propagating flames and the middle interaction
region between the two flames. This tracking application demonstrates tracking multiple objects
and constmimng their motion to horizontal straight lines. This is a fairly easy tracking problem
since the flame is dearly visible and the noise level is low. The second application involves
tracking a very low visibility fluid interface, which presents a much greater challenge. The liquid-
gas interface is nearly indistinguishable from the background. A significant amount of processing
is necessary for the computer to find the interface.
Two Interacting Flames
This experiment involves the study of interaction of two flames spreading over thin
surfaces in microgravity. The flame motion is linear, and the viewing conditions are not difficult,
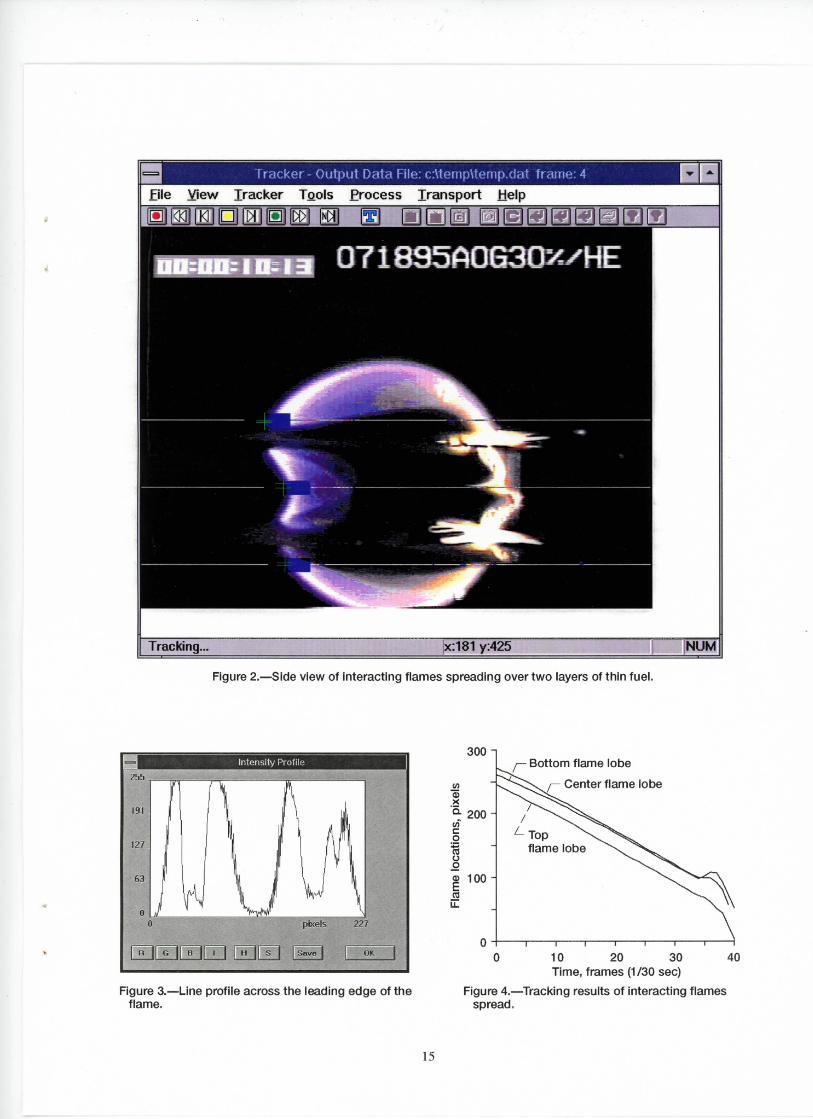
with a dark background and a bright flame clearly visible (see fig. 2). The solid surface samples
are perpendicular to the plane of the paper so that the flame was viewed on edge. After ignition,
the flames propagate from right to leit until the sample is fully consumed. The flame spreadvelocities are studied as a function of oxygen concentration and total pressure.
The first step in the tracking process is to observe the blue component line profile (see fig.
3) across the leading edge of the flame. As can be seen fi'om the height of the profile curve m
figure 3, the flame can be easily distinguished from the background, and thus very little image
processing is needed. A 3x3 convolution lowpass filter is employed to smooth out any noise
spikes, which do occasionally occur and may yield an erroneous reading. The last step is to selecta threshold level on which the exact location of the flame edge would be based. It was observed
that the flame intensity stayed constant over the length of travel and thus a constant thresholdwould be sufficient. The threshold is selected just above the background noise level, ensuring that

the first and faintest occurrence of the flame was detected. Three different regions are tracked, the
flame fronts from the upper and lower samples and the interaction region between the two flames.
This is done by specifying three separate AOl's which were positioned at the appropriate
locations. To ensure that the AOI's don't wander off from their selected positions on the flame,
their movement is constrained to horizontal lines (i.e. the box in which the algorithm searches for
the leading edge can only move along the line). The resultant data is shown in Figure 4.
Low-Visibility Liquid-Gas Interface
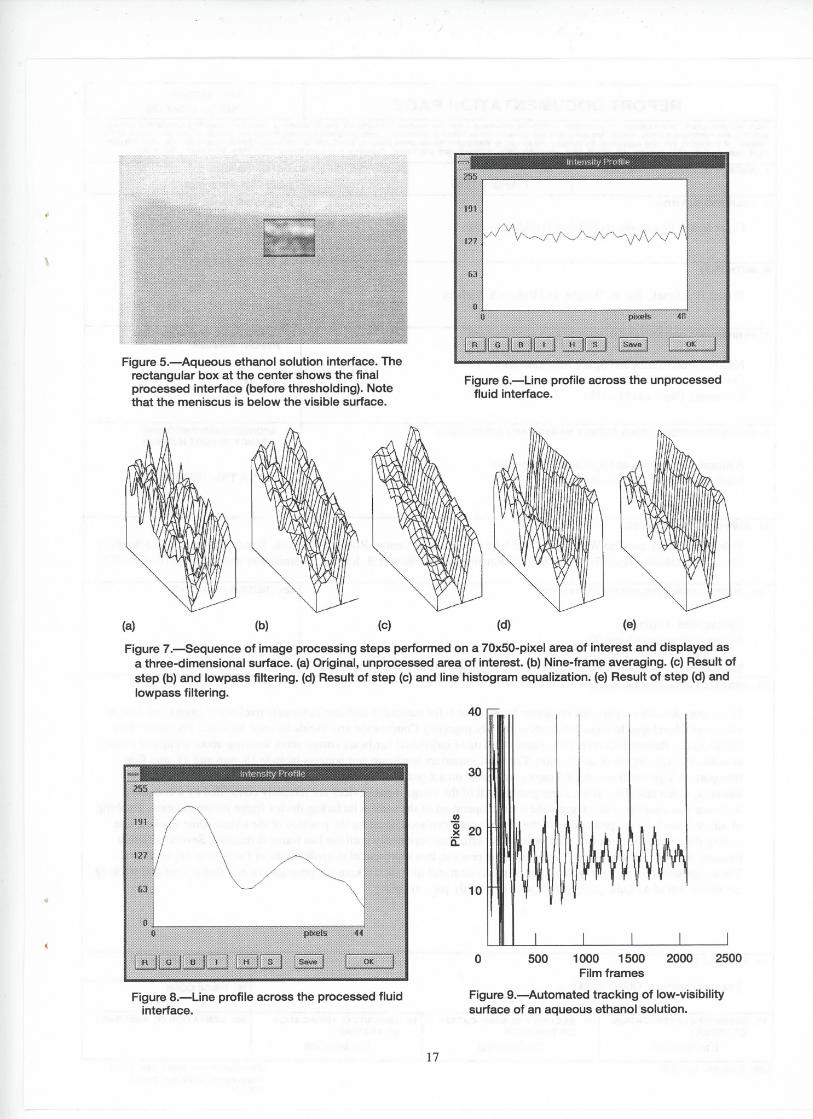
The second application chosen is the tracking of surface settling motion of an aqueous
ethanol solution in a partially filled container. The visibility of the meniscus is extremely poor as
can be seen on the outside of the rectangular AOI in figure 5. The meniscus appears beneath the
surface of the fluid because in the absence of gravity the fluid climbs the walls of the container,
thus making the meniscus appear below the surface in the side view. The line profile through the
unprocessed interface (fig. 6) reveals that the fluid interface could not be clearly distinguished
from the background as the film grain noise is on the same level as the fluid interface itself. In
this condition, the meniscus location is impossible to track. However, it is possible to improve the
image considerably with several image processing operations. Five image processing operations
were found to be particularly important. They are fisted in the following paragraphs in the order
in which they were performed. All of the image processing is performed within a 70xS0-pixel
AOI that can be seen in figure 5. For improved visualization, the unprocessed AOI as well as the
results of the first four processing steps are plotted as a three-dimensional surfaces in figure 7.
The first processing step deals with increasing the signal with respect to the noise. A
closer study of the film reveals that the film grain noise is random from frame to frame, and
therefore, the signal-to-noise ratio (S/N) could be improved with frame averaging. The number of
frames used in the averaging process is kept low, compared with the 400 frames/see at which the
original event was filmed, to avoid any blurring problem due to the movement of the interface.
Nine was found to be an effective number of frames for averagin_ above which the S/N
improvement was limited. The vfl'ect of frame averaging is illustrated in figure 7 Co).
The flame averaging helps immensely, but some noise still persists (fig. 7Co)). The AOI
is lowpass filtered with a 5x5 convolution filter to reduce the noise level further. This filtering
causes the remaining noise spikes to be averaged in with the neighborhood pixels. The smoothingeffect on a lowpass-processed fluid interface is shown in figure 7(c).
The lowpass filtering cleans up the noise in the image very well. However, because of the
uneven background illumination, the intensity levels of the fluid interface are higher at the left side
of the AOI than at the right side, as can be seen by the slant of the surface in figure 7CO)and (c).
This prevents the program from correctly finding the center of the interface. Even though a
substantial amount of noise is eliminated, the fluid interface is still very faint, making
identification of the interface still difficult. The technique that increases the image contrast the
most is histogram equalization. This technique attempts to remap the intensity levels uniformly
over the entire available intensity range. However, the area histogram equalization only
accentuates the problem of the uneven background illuminations, making the slant in the intensitylevels across the AOI (fig. 7(c)) even more pronounced. This problem is
overcome with a line histogram equalization perpendicular to the fluid interface (vertical). That
is, a line histogram equalization is performed on each column of pixels in the AOI. The effect of
this equalization is shown in figure 7(d).
A lowpass filter is employed once again to smooth out any leftover noise spikes that could
be generated spuriously by the histogram equalization. The results of this step is shown in figure
7(e). A line profile across this resultant interface area is shown in figure 8. It is easy to see that
tracking the processed interface can be much easier than tracking the unprocessed one in figure 6.
The final processing step is to use the median-inverse threshold. This adaptive threshold
routine finds the maximum and minimum intensity levels in the processed AOI and sets the
threshold at the midpoint. This sets all intensities below the threshold level to white and above the
threshold level to black. To skip over some unwanted edge effects (noisy areas in the upper part
of the AOI which are also erroneously thresholded), the search region within the AOI is decreased
by 8 pixels on all sides.
The surface settling motion tracked automatically by the processor is shown in figure 9.
The vertical Lines indicate missed points where the interface could not be correctly identified. The
settling history of figure 9 reveals high-frequency oscillations due to the release mechanism of the
particular drop tower where these tests were performed, whereas the lower frequencies are the
resonant frequencies for the liquid surface.
CONCLUDING REMARKS
The Color Image Processing and Object Tracking System (Tracking System) has become
an important tool in film and video tape analysis of combustion and fluid science data. The
automation of the system removes much of the tedium of tracking objects manually as was done in
the past. Moreover, much of the guesswork has been eliminated, improving the accuracy and
reproducibility of the measurement. Since the image is converted into a digital format, a more
sophisticated tracking analysis can be performed. Digital image processing can be employed to
enhance the visibility of features being tracked, allowing the tracking of objects that would have
been nearly impossible before. The Tracking System can also be used for analysis other than
tracking object movements, such as color characterization, measuring changes in an object's size,
measuring areas and volumes, or tracking intensity parameters.
ACKNOWLEDGMENTS
The authors wish to thank David Urban and Mark Weislogel for use of their data in
presenting the two example applications: the interacting flame spread and the low-visibility liquid-
gas interface, respectively.
.
.
3.
REFERENCES
Color Image Processing and Object TrackingWorkstation, NASA Technical Memorandum
105561, R. B. Klimek and M. J. Pauliek, April 1992.
Digital Image Processing, R. C. Cronzalez, P. Wintz, Addison-Wesley, 1977, p. 119.
Tracker, Windows-Based Object Tracking Software (Manual), R. B. Klimek, T. W. Wright,
R. S. Sielken, ver 1.1, I995
10
APPENDIX A
TRACKER IMAGE PROCESSING FUNCTIONS
The following list of image processing functions is supported in the Tracker program.The functions can be executed on a single image, perhaps when experimenting with
enhancement techniques, or they can be used during a tracking process.
- Threshold
- Normal - sets all pixels to 0 (black) that are below or equal to the threshold value and
sets all pixels to 255 (white) that are above the threshold value.
- Inverse - sets all pixels to 255 that are below or equal to the threshold value and sets
all pixels to 0 that are above the threshold value.
Maximum (normal) - finds the maximum intensity level and then thresholds based
on that value (setting all values above the threshold to 255 and all values below the
threshold to 0).
Maximum (inverse) - finds the maximum intensity level and then thresholds based
on that value (setting all values above the threshold to 0 and all values below the
threshold to 255).
Median (normal) - f'mds the median intensity level and then thresholds based on that
value (setting all values above the threshold to 255 and all values below the threshold
to 0). The median is defined here as (max+min)/2.
Median (inverse) - finds the median intensity level and then thresholds based on that
value (setting all values above the threshold to 0 and all values below the threshold to
255). The median is defined here as (max+min)/2.
Minimum (normal) - finds the minimum intensity level and then thresholds based on
that value (setting all values above the threshold to 255 and all values below the
threshold to 0).
Minimum (inverse) - finds the minimum intensity level and then thresholds based on
that value (setting all values above the threshold to 0 and all values below the
threshold to 255).
Threshold Mask - performs a bandpass thresholding operation, eg. sets all valuesbelow and above a certain threshold setting to 0 and leaves the other intensities
unaffected.
- Smoothing Filters - performs a convolution lowpass filtering operation. All filter kernel
elements are 1. The kernel sizes supported are 3x3, 5x5, and 7x7.
11
Sharpening Filters - performs a convolution sharpening operation. The kernel sizessupported are 3x3, 5x5, and 7x7.
Morphological Contrast - performs a morphological type filtering operation (produces
similar results to other sharpening filters).
Edge Detect Filters - the following group of filters enhance object edges. They fall into
two categories; gradient filters (first order derivative) and laplacian filters (2nd order
derivative). Both types of filters have an effect of highlighting edges and setting all non-edge portions of an image to black.
- Gradient (Roberts) - gradient filter using the Roberts convolution kernel. This filter
produces a fairly thin edge lines and has little effect on highly blurred edges.
- Gradient (Prewitt) - gradient filter using the Prewitt convolution kernel. This filter
is an intermediate strength gradient tilter and can be used in most applications. ThePrewitt gradient amplitude is calculated using the Euclidean distance vector.
- Gradient (Sobel) - gradient filter using the Sobel convolution kernel. This filter
produces a thick edge line and has strong effect on edges.
- Gradient Max - this function is identical to Gradient (Prewitt) except that amplitudeis calculated using the maximums of absolute values.
- Recursive Gradient - a gradient filter based on Canny-Deriche method. This isanother variation of Prewitt gradient filter.
- Sup. Non-Local Maxima (Roberts) - Roberts gradient filter with a suppression of
non-local maxima. This method takes a Roberts gradient and then suppresses non-
local maxima (sets to zero everything other than the edge maxima). This method isuseful in that it produces edge lines of single pixel thickness.
Sup. Non-Local Maxima (Prewitt) - same as above except Prewitt filter is used.
Laplacian - a second order filter. The kernel sizes supported axe 3x3, 5x5, and 7x7.
This filter highly accentuates noise and thus should be always preceded by a lowpassfilter.
- Zero Crossing - this function first generates a laplacian and then labels values where
the function changes curvature (zero-crossing) leaving a single pixel wide line. Thekernel sizes supported are 3x3, 5x5, and 7x7.
Histogram Equalize - the following group of routines perform line or area histogramequalization.
- Local Area - performs a histogram equalization on the image by performinghistogram equalization on small, local 16x16 pixel areas.
- Area - performs an area histogram equalization using the Visilog histogram function.
12
Area2 - performs an area histogram equalization using an algorithm described in abook by Gonzalez and Wintz 2.
- Horizontal Line - performs a histogram equalization on an area one horizontal line at
a time. This de-couples x and y components, thus negating vertical variation.
- Vertical Line - performs a histogram equalization on an area one vertical line at a
time. This de-couples x and y components, thus negating horizontal variation.
Morphological - the following group of routines perform morphological operation. All
functions in this group operate on thresholded (binary) images.
Hole Fill - fills in all holes in an object.
Erode - performs a morphological erosion operation of a given number of iterations.
- Erode/Reconstruct - performs a morphological erosion operation followed by
reconstruction using the contents of the eroded image as markers.
- Template Matching - this group of routines performs template matching on a singleframe between a template and a search region. They are included here so the user can test
the performance and ability of these routines to locate an objects position under variousconditions. The object position is determined by scanning the search region with the
template and performing comparisons on groups of pixels between the two regions. Theroutines can remap the "match" surface to an image intensity range (0-255) and display it
over the current image so that its characteristics can be analyzed by the tools mentioned
above.
Subt. Template Match w/surf. - performs subtractive template match and plots thematch surface. In a subtractive template match, the pixels in the template are
subtracted from the corresponding pixels in the search region and the absolute value
of the differences are summed. A new sum is calculated for each position as the
template is shifted over the image. The minimum sum is the best match. The
subtractive template match executes much faster than correlation.
Subt. Template Match - same as above but instead of plotting the surface a crosscursor is drawn at the location where the best match occurred.
Normalized Correlation (L) - performs normalized correlation match and plots the
correlation surface. To speed up the computation long integers instead of floating
point numbers are used to calculate the correlation, but this occurs at the expense of around-off error.
Normalized Correlation (D) - performs normalized correlation match and plots the
correlation surface. Double precision floating point numbers axe used to improve
accuracy, but at the expense of computation speed.
Frame Subtraction - performs subtraction of two images.
13
t
APPENDIX B
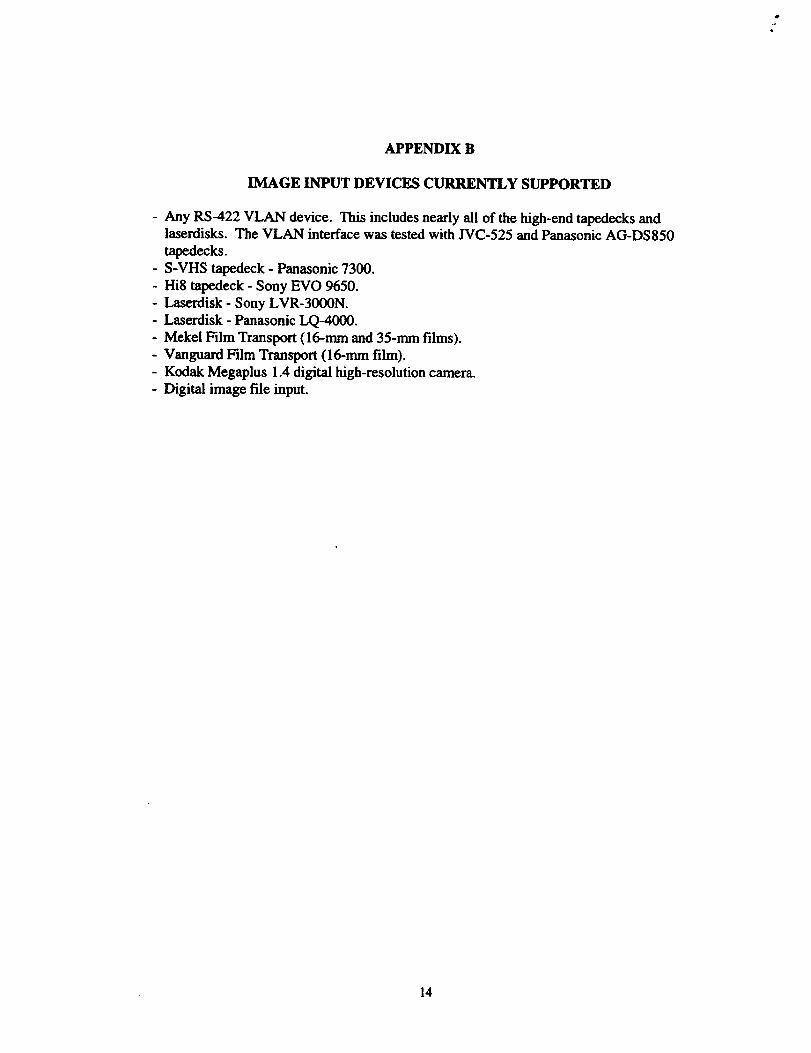
IMAGE INPUT DEVICES CURRENTLY SUPPORTED
- Any RS-422 VLAN device. This includes nearly all of the high-end tapedecks andlaserdisks. The VLAN interface was tested with JVC-525 and Panasonic AG-DS850
tapedecks.
- S-VHS tapedeck - Panasonic 7300.
- Hi8 tapedeck - Sony EVO 9650.
- Laserdisk - Sony LVR-3000N.
- Laserdisk - Panasonic LQ-4000.
- Mekel Film Transport (16-ram and 35-ram films).
- Vanguard Film Transport (16-ram film).
- Kodak Megaplus 1.4 digital high-resolution camera.
- Digital image file input.
14

Page intentionally left blank
Form ApprovedREPORT DOCUMENTATION PAGE OMB No. 0704-0188
Public reporting burden for this collection of information is estimated to average 1 hour per response, including the time for reviewing instructiorm, searching existing data sources,gathering end maintaining the data needed, and completing and reviewing the collection of information. Send comments regarding this burden estimate or any other aspect of thiscollection of information, including suggestions for reducing this burden, 1o Washington Headquarters Services, Directorate for Information Operations end Reports, 1215 JeffersonDavis Highway, Suite 1204, Arlington, VA 22202-4302, and to the Office of Management and Budget, Paperwork Reduction Prclect (0704-0188), Washington, DC 20503.
1. AGENCY USE ONLY (Leave blank) 2. REPORT DATE
February 1996
4. TITLE AND SUBTITLE 5. FUNDING NUMBERS
Color Image Processing and Object Tracking System
6. AUTHOR(S)
Robert B. Klimek, Ted W. Wright, and Robert S. Sielken
7. PERFORMING ORGANIZATION NAME(S) AND ADDRESS(ES)
National Aeronautics and Space Administration
Lewis Research Center
Cleveland, Ohio 44135-3191
9. SPONSORING/MONITORING AGENCY NAME(S) AND ADDRESS(ES)
National Aeronautics and Space Administration
Washington, D.C. 20546-0001
3. REPORT TYPE AND DATES COVERED
Technical Memorandum
WU-963-15-OA
8. PERFORMING ORGANIZATION
REPORT NUMBER
E- 10074
10. SPONSORING/MONITORING
AGENCY REPORT NUMBER
NASA TM- 107144
11. SUPPLEMENTARY NOTES
Robert B. Klimek and Ted W. Wright, NASA Lewis Research Center; Robert S. Sielken, Trinity University, 715 Stadium
Drive, San Antonio, Texas 78212-7200. Responsible person, Robert B. Klimek, organization code 6713, (216) 433-2837.
12a. DISTRIBUTION/AVAILABILITY STATEMENT
Unclassified - Unlimited
Subject Categories 62 and 29
This publication is available from the NASA Center for Aerospace Information, (301) 621-0390.
12b. DISTRIBUTION CODE
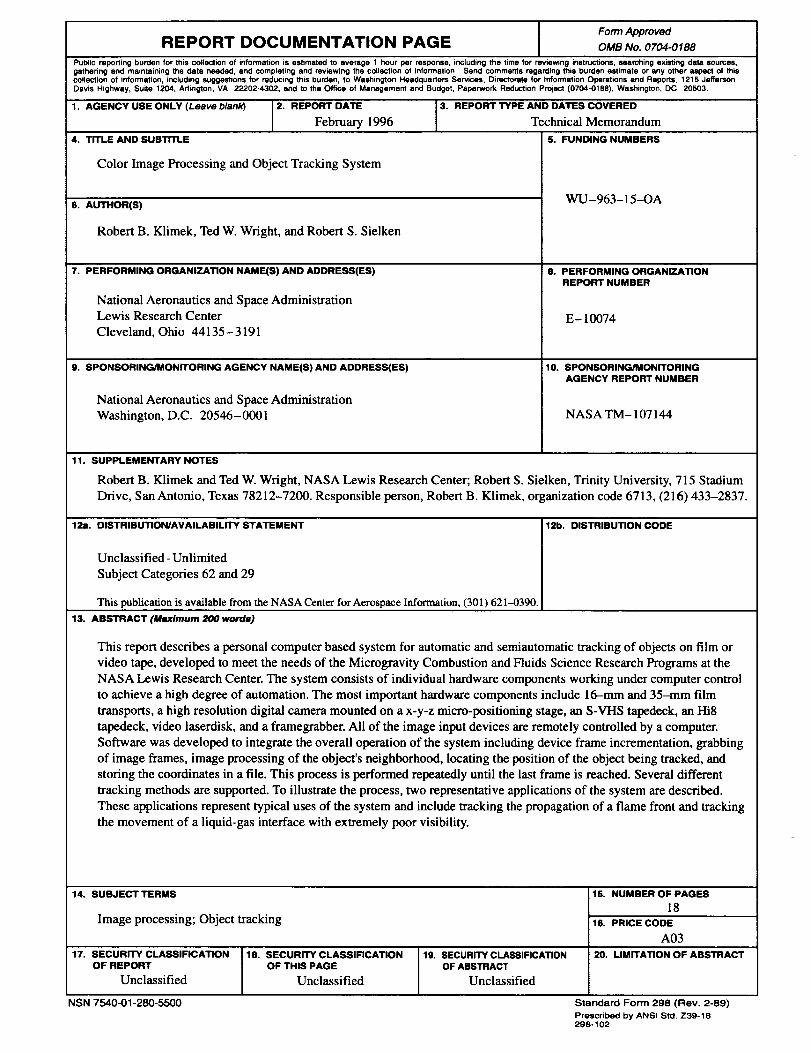
13. ABSTRACT (Maximum 200 words)
This report describes a personal computer based system for automatic and semiautomatic tracking of objects on film or
video tape, developed to meet the needs of the Microgravity Combustion and Fluids Science Research Programs at the
NASA Lewis Research Center. The system consists of individual hardware components working under computer control
to achieve a high degree of automation. The most important hardware components include 16-mm and 35-ram film
transports, a high resolution digital camera mounted on a x-y-z micro-positioning stage, an S-VHS tapedeck, an Hi8
tapedeck, video laserdisk, and a framegrabber. All of the image input devices are remotely controlled by a computer.
Software was developed to integrate the overall operation of the system including device frame incrementation, grabbing
of image frames, image processing of the object's neighborhood, locating the position of the object being tracked, and
storing the coordinates in a file. This process is performed repeatedly until the last frame is reached. Several different
tracking methods are supported. To illustrate the process, two representative applications of the system are described.
These applications represent typical uses of the system and include tracking the propagation of a flame front and tracking
the movement of a liquid-gas interface with extremely poor visibility.
14. SUBJECT TERMS
Image processing; Object tracking
17. SECURITY CLASSIFICATION 18. SECURITY CLASSIFICATION
OF REPORT OF THIS PAGE
Unclassified Unclassified
NSN 7540-01-280-5500
19. SECURITY CLASSIFICATION
OF ABSTRACT
Unclassified
15. NUMBER OF PAGES
18
16. PRICE CODE
A0320. LIMITATION OF ABSTRACT
Standard Form 298 (Rev. 2-89)
Prescribed by ANSI Std. Z39-18298-102

National Aeronautics and
Space Administration
Lewis Research Center
21000 Brookpark Rd.Cleveland, OH 44135-3191
Official Business
Penalty for Privale Use $300
POSTMASTER: If Undeliverable -- Do Not Return