colombo
TRANSCRIPT
sion. Monsoon rain, which is the dominant type, occursin two monsoon periods per year. These two seasonshave been identified as the south-west and north-eastmonsoons. Convection rain and depression rain occurmainly during the inter-monsoon periods. The annualaverage rainfall varies between 1,000 ml in the arid partsof the north-west and south-east of the island to over5,000 ml on the south-western hill slopes. Relativehumidity varies generally from about 70 per cent duringthe day to about 90 – 95 per cent during the night. In theDry Zone these values are about 5 per cent lower.
2. DemographicsSri Lanka's first population census was taken in the
year 1871, and was repeated every 10 years thereafter.According to the first census, the total population of thecountry was recorded as 2,400,400 people(Department of Census and Statistics, 1871). 100years after the first census, in 1971 the country's popu-lation had increased to 12,698,900 people (Departmentof Census and Statistics, 1971). The subsequent pop-ulation censuses were taken in 1981 and 2001 (no cen-sus was taken in 1991 due to civil disturbances in north-ern and eastern parts of the country). The total popula-
I. INTRODUCTION
A. NATIONAL OVERVIEW
1. Location and ClimateSri Lanka is an island situated in the tropics, between
the latitudes of 6 and 10 degrees north just at the south-ern tip of India. It covers an area of 64,454 km2 includ-ing the large inland water bodies, which constitute about1,156 km2 The island is pear-shaped, the maximumnorth-south distance being 435 km and the greatesteast-west width being 225 km. The mountainous area inthe south-central region, which rises to 2500 metres issurrounded on all sides by coastal plains, narrow in thewest, east and south, but broadening to an extensivearea in the north. The coastline of the country is about1,600 km long (Mendis, 1998).
Climatically, Sri Lanka falls into two distinct regions –The Wet Zone and the Dry Zone. The Wet Zone corre-sponds mainly to the south-western quadrant of thecountry, which covers about 30 per cent of the land areawhile the remaining 70 per cent of the land area formsthe Dry Zone.
A distinct variation in temperature can be observedbetween the Central Hill Country and Low Country withminimum and maximum average temperatures of 17.6Cand 25.8C in the Hill Country and 24.3C and 31.5C inthe Low Country respectively.
The country receives rainfall throughout the year iden-tified by three types: monsoon, convection and depres-
The case of
Colombo, Sri Lanka
by Sevanatha
Contact
Urban Resource Centre14 Schol Lane, Nawala Road, RajagiriyaSri LankaTel/Fax: 94-1-878893
Sou
rce:
CIA
fact
book
tion of the country according to the population census of2001 was 16,864,687 (Department of Census andStatistics, 2001).
It was revealed that particularly from the 1980s to thepresent, the annual population growth rate has beenbelow 1.5 per cent (Department of Census andStatistics, 1981). According to the Human DevelopmentIndex, life expectancy was 71 for males and 76 forfemales (Central Bank, 2001) The country has a litera-cy rate of 91.4 per cent, 94 per cent for men and 89 percent for women, indicating the benefits of equal oppor-tunities in education (Central Bank, 2001) .
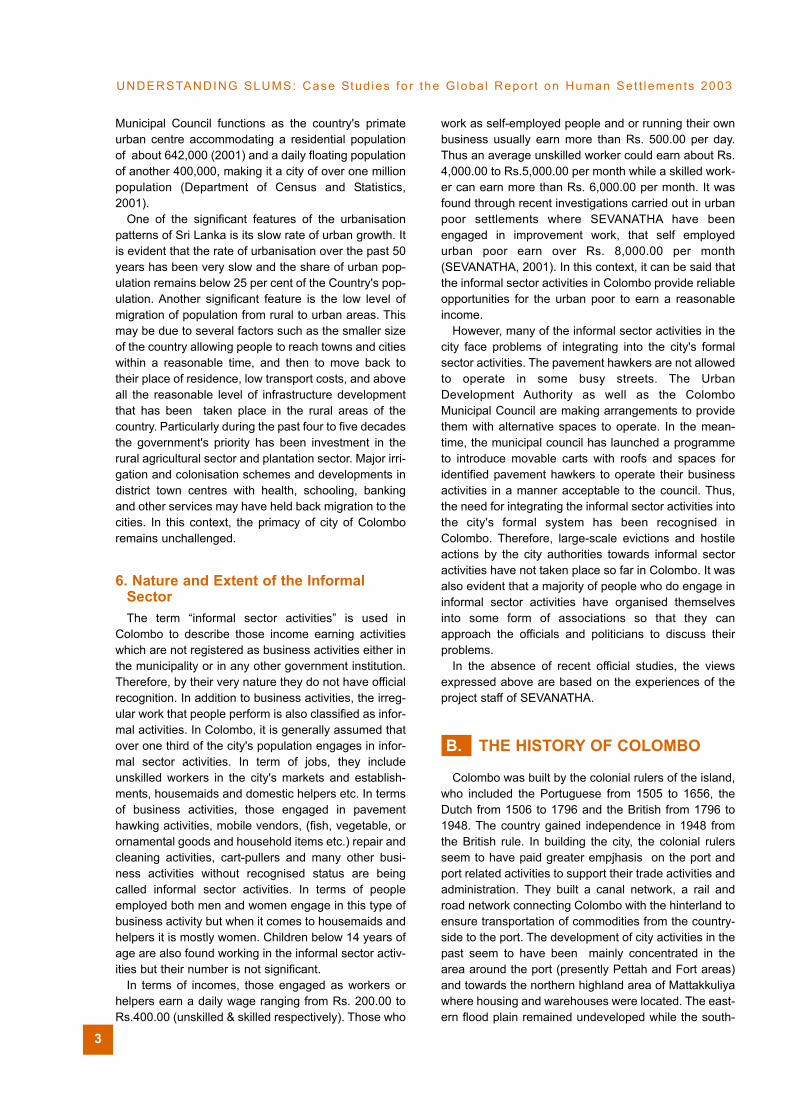
3. Racial Composition of the PopulationSri Lankan society is a multi-racial one in which a
majority Sinhalese and several minority racial groupshave been living together for centuries. The racial andreligious composition of the population according to the1981 census is indicated below.
4. Economic TrendsSri Lanka being a developing country, its economy
relies mainly on agriculture and service sector activities.Its GDP growth rate has been fluctuating over the yearsand observed varied between 6.9 per cent in 1993 and4.7 per cent in 1998 which was moving up to 6.0 percent in the year 2000 (Central Bank, 2001).
With continuing a war situation in North/Eastprovince, since early 1980s , the country's economywas managed to maintain a GDP growth rate of above5% . This was reflected in the per capita GNP whichhas ranged from 804 US$ to 841 US$ during the period1997 – 2000 (Central Bank, 2001).
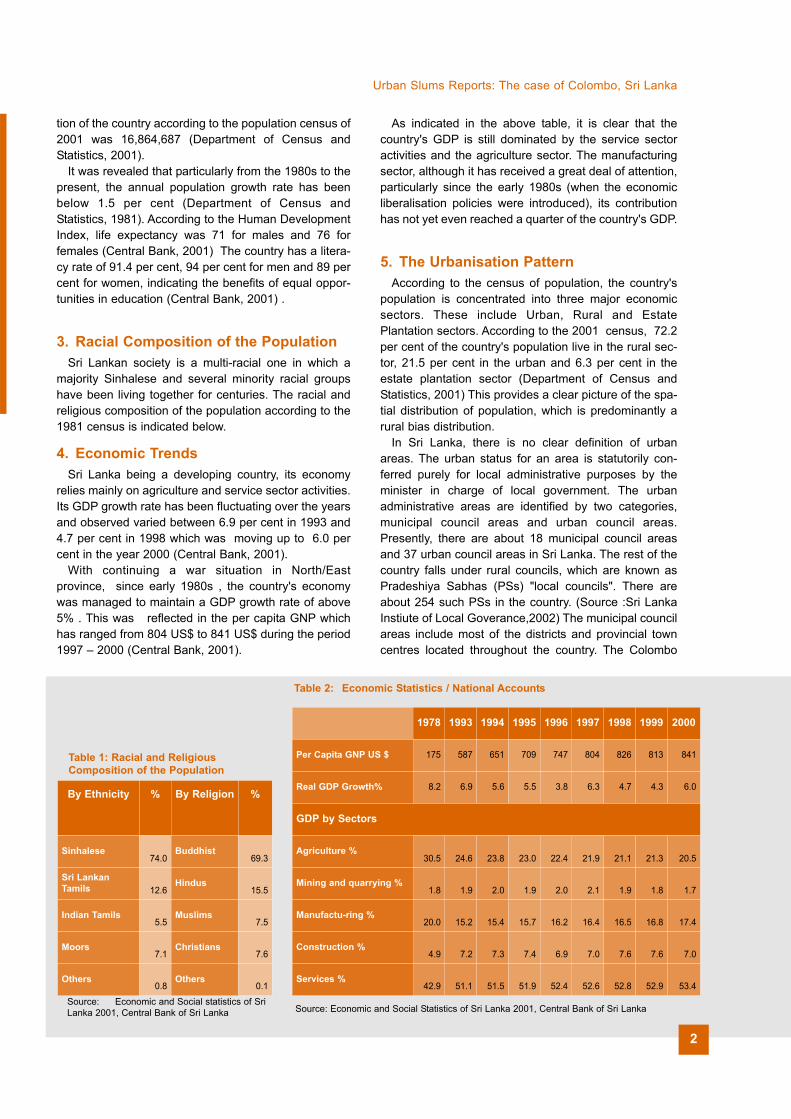
As indicated in the above table, it is clear that thecountry's GDP is still dominated by the service sectoractivities and the agriculture sector. The manufacturingsector, although it has received a great deal of attention,particularly since the early 1980s (when the economicliberalisation policies were introduced), its contributionhas not yet even reached a quarter of the country's GDP.
5. The Urbanisation PatternAccording to the census of population, the country's
population is concentrated into three major economicsectors. These include Urban, Rural and EstatePlantation sectors. According to the 2001 census, 72.2per cent of the country's population live in the rural sec-tor, 21.5 per cent in the urban and 6.3 per cent in theestate plantation sector (Department of Census andStatistics, 2001) This provides a clear picture of the spa-tial distribution of population, which is predominantly arural bias distribution.
In Sri Lanka, there is no clear definition of urbanareas. The urban status for an area is statutorily con-ferred purely for local administrative purposes by theminister in charge of local government. The urbanadministrative areas are identified by two categories,municipal council areas and urban council areas.Presently, there are about 18 municipal council areasand 37 urban council areas in Sri Lanka. The rest of thecountry falls under rural councils, which are known asPradeshiya Sabhas (PSs) "local councils". There areabout 254 such PSs in the country. (Source :Sri LankaInstiute of Local Goverance,2002) The municipal councilareas include most of the districts and provincial towncentres located throughout the country. The Colombo
Urban Slums Reports: The case of Colombo, Sri Lanka
Table 1: Racial and ReligiousComposition of the Population
Source: Economic and Social statistics of SriLanka 2001, Central Bank of Sri Lanka
Table 2: Economic Statistics / National Accounts
1978 1993 1994 1995 1996 1997 1998 1999 2000
Per Capita GNP US $ 175 587 651 709 747 804 826 813 841
Real GDP Growth% 8.2 6.9 5.6 5.5 3.8 6.3 4.7 4.3 6.0
GDP by Sectors
Agriculture %30.5 24.6 23.8 23.0 22.4 21.9 21.1 21.3 20.5
Mining and quarrying %1.8 1.9 2.0 1.9 2.0 2.1 1.9 1.8 1.7
Manufactu-ring %20.0 15.2 15.4 15.7 16.2 16.4 16.5 16.8 17.4
Construction %4.9 7.2 7.3 7.4 6.9 7.0 7.6 7.6 7.0
Services %42.9 51.1 51.5 51.9 52.4 52.6 52.8 52.9 53.4
Source: Economic and Social Statistics of Sri Lanka 2001, Central Bank of Sri Lanka
By Ethnicity % By Religion %
Sinhalese74.0
Buddhist69.3
Sri LankanTamils 12.6
Hindus15.5
Indian Tamils5.5
Muslims7.5
Moors7.1
Christians7.6
Others0.8
Others0.1
2
work as self-employed people and or running their ownbusiness usually earn more than Rs. 500.00 per day.Thus an average unskilled worker could earn about Rs.4,000.00 to Rs.5,000.00 per month while a skilled work-er can earn more than Rs. 6,000.00 per month. It wasfound through recent investigations carried out in urbanpoor settlements where SEVANATHA have beenengaged in improvement work, that self employedurban poor earn over Rs. 8,000.00 per month(SEVANATHA, 2001). In this context, it can be said thatthe informal sector activities in Colombo provide reliableopportunities for the urban poor to earn a reasonableincome.
However, many of the informal sector activities in thecity face problems of integrating into the city's formalsector activities. The pavement hawkers are not allowedto operate in some busy streets. The UrbanDevelopment Authority as well as the ColomboMunicipal Council are making arrangements to providethem with alternative spaces to operate. In the mean-time, the municipal council has launched a programmeto introduce movable carts with roofs and spaces foridentified pavement hawkers to operate their businessactivities in a manner acceptable to the council. Thus,the need for integrating the informal sector activities intothe city's formal system has been recognised inColombo. Therefore, large-scale evictions and hostileactions by the city authorities towards informal sectoractivities have not taken place so far in Colombo. It wasalso evident that a majority of people who do engage ininformal sector activities have organised themselvesinto some form of associations so that they canapproach the officials and politicians to discuss theirproblems.
In the absence of recent official studies, the viewsexpressed above are based on the experiences of theproject staff of SEVANATHA.
B. THE HISTORY OF COLOMBO
Colombo was built by the colonial rulers of the island,who included the Portuguese from 1505 to 1656, theDutch from 1506 to 1796 and the British from 1796 to1948. The country gained independence in 1948 fromthe British rule. In building the city, the colonial rulersseem to have paid greater empjhasis on the port andport related activities to support their trade activities andadministration. They built a canal network, a rail androad network connecting Colombo with the hinterland toensure transportation of commodities from the country-side to the port. The development of city activities in thepast seem to have been mainly concentrated in thearea around the port (presently Pettah and Fort areas)and towards the northern highland area of Mattakkuliyawhere housing and warehouses were located. The east-ern flood plain remained undeveloped while the south-
Municipal Council functions as the country's primateurban centre accommodating a residential populationof about 642,000 (2001) and a daily floating populationof another 400,000, making it a city of over one millionpopulation (Department of Census and Statistics,2001).
One of the significant features of the urbanisationpatterns of Sri Lanka is its slow rate of urban growth. Itis evident that the rate of urbanisation over the past 50years has been very slow and the share of urban pop-ulation remains below 25 per cent of the Country's pop-ulation. Another significant feature is the low level ofmigration of population from rural to urban areas. Thismay be due to several factors such as the smaller sizeof the country allowing people to reach towns and citieswithin a reasonable time, and then to move back totheir place of residence, low transport costs, and aboveall the reasonable level of infrastructure developmentthat has been taken place in the rural areas of thecountry. Particularly during the past four to five decadesthe government's priority has been investment in therural agricultural sector and plantation sector. Major irri-gation and colonisation schemes and developments indistrict town centres with health, schooling, bankingand other services may have held back migration to thecities. In this context, the primacy of city of Colomboremains unchallenged.
6. Nature and Extent of the InformalSectorThe term “informal sector activities” is used in
Colombo to describe those income earning activitieswhich are not registered as business activities either inthe municipality or in any other government institution.Therefore, by their very nature they do not have officialrecognition. In addition to business activities, the irreg-ular work that people perform is also classified as infor-mal activities. In Colombo, it is generally assumed thatover one third of the city's population engages in infor-mal sector activities. In term of jobs, they includeunskilled workers in the city's markets and establish-ments, housemaids and domestic helpers etc. In termsof business activities, those engaged in pavementhawking activities, mobile vendors, (fish, vegetable, orornamental goods and household items etc.) repair andcleaning activities, cart-pullers and many other busi-ness activities without recognised status are beingcalled informal sector activities. In terms of peopleemployed both men and women engage in this type ofbusiness activity but when it comes to housemaids andhelpers it is mostly women. Children below 14 years ofage are also found working in the informal sector activ-ities but their number is not significant.
In terms of incomes, those engaged as workers orhelpers earn a daily wage ranging from Rs. 200.00 toRs.400.00 (unskilled & skilled respectively). Those who
3
UNDERSTANDING SLUMS: Case Stud ies fo r the G loba l Repor t on Human Set t lements 2003
ern area and coastal belt of the city attracted the middleand high-income inhabitants.
1. Planning History of ColomboThe first city plan was prepared by an eminent
British Town Planner, Sir Patrick Geddes in 1921. Theconcept of the plan was to preserve the rural spirit ofthe town, and to make Colombo a “Garden City of theEast". Though the plan had not been fully implented inthe city, it has had influenced the subsequent planninginterventions.
With the enactment of Town & Country PlanningOrdinance in 1946, the Colombo Municipal Councilembarked on preparing a town-planning scheme for thecity. The government had invited a British Town Planner,Sir Patrick Abercromby to prepare the second city plan.Abercromby's plan of 1949 covered the ColomboMetropolitan Region as a whole but it did not translateinto detailed proposals. The plan emphasised thedecentralisation of the city's activities and creation ofsatellite towns around Colombo.
The third city plan was the Colombo Master Plan of1978, of which the main objective was the promotionof balanced regional development and acceleratedeconomic development of the country. The ColomboMaster Plan has provided the basis for city planningprogrammes implemented since 1978 particularly in theGreater Colombo Area.
The next city plan was the Colombo Development Planprepared by the Urban Development Authority (UDA) in1985 based on the Colombo Master Plan. This develop-ment plan laid the foundations for implementing zoningand building regulations in the city in keeping with thefuture socio-economic development patern in the city.
The most recent city plan was the ColomboMetropolitan Regional Structure Plan (CMRSP) pre-pared in 1998 by the Urban Development Authority,whose overall objective to prepare action programmesfor the development of the region with a view to meet-ing the aspirations of the citizens and improving thequality of life of the people of Western Province and thepeople of Sri Lanka.
C. THE PHYSICAL CITY
The Colombo Municipal Council was established in1866 under the Colombo Municipal Council Ordinanceof 1865.. According to the Centenary Volume ofColombo Municipal Council 1963, (CMC, 1963) thephysical size of the city was 24.5 km2 in 1871. The amal-gamation of adjoining areas from time to time increasedthe physical size of the city. Such changes occurred in1901, 1911, 1946, 1953 and 1963. The present city sizehas increased up to 37.3 km2. The changes of the citysize is indicated in the table below:
1. DensityThe average population density of the city according
to the first available records in 1871 was 40 people perhectare. This has reached up to 105 people per hectarein 1940. The current density is 172 people per hectare(2001 census). (Department of Census and Statistics,2001)
This figure indicates only the city-wide average pop-ulation density. However, there are some MunicipalWards, which represent higher densities such as 974people per hectare. The highest population density is inColombo North, which is predominantly a low-incomeresidential area. The Colombo Southern area repre-sents a low-density distribution of population, which isvery much close to the city’s current average populationdensity of 172 persons per hectare.
2. Topography A dominant physical aspect of the city is its harbour
and the extensive network of watercourses. A large partof Colombo is below the 30 metre mean sea level andsome areas in the east of Colombo are even below thesea level. Rivers are supplemented by numerouscanals either draining the rainwater from the low-lyingland or constructed for water transportation purposes.The climate of the city is warm and humid for thegreater part of the year. The mean temperature is 270Cand the mean rainfall 2,300 mm.
3. DemographyAccording to the first census of population in 1871,
Colombo had a population of 98,847 people. This fig-ure became slightly more than doubled by the 1911.The current city population according to the 2001 pop-ulation census was 642,163 people. The unique featureof population growth in Colombo has been its slowgrowth. The annual population growth rate has beenvarying between 0.5 and 3.7 in the recent past(Department of Census and Statistics, 2001).
3.1 Population by GenderAccording to the 2001 census of population, the age
group and gender distribution of the city population isas indicated below.
The significant feature of the above distribution is thata large percentage (29.1 per cent male, 30.4 per centfemale) of the population was between the age groupof 15 – 29 years .
3.2 Ethnic Groups:Like many other towns and cities of Sri Lanka, the
capital city of Colombo is a multi-racial city whereSinhalese, Tamils, Muslims and other communitygroups have been living together for generations.
Urban Slums Reports: The case of Colombo, Sri Lanka
4
II. SLUMS AND POVERTY
D. OVERVIEW OF SLUMS IN COLOMBO
1. TypesFour main types of slums have been identified in
Colombo (Upgrading Steps – Ministry of LocalGovernment Housing and Construction, 1984)
Slums: Old deteriorating tenements or subdividedderelict houses. The slum tenements, built mostly ofpermanent materials, are very often singled roomedand compactly arranged, in back to back rows. Theoccupants have a definite legal status of occupancy.
Shanties: Improvised and unauthorised shelters,constructed by the urban squatters on state or privately
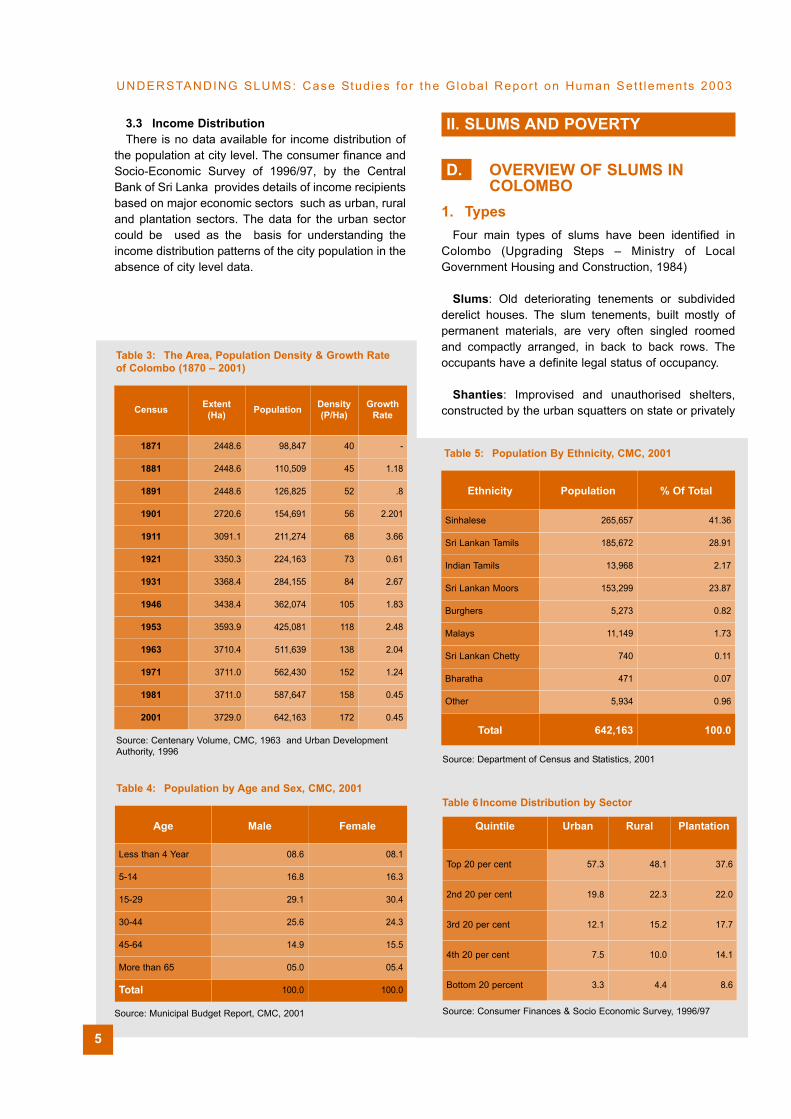
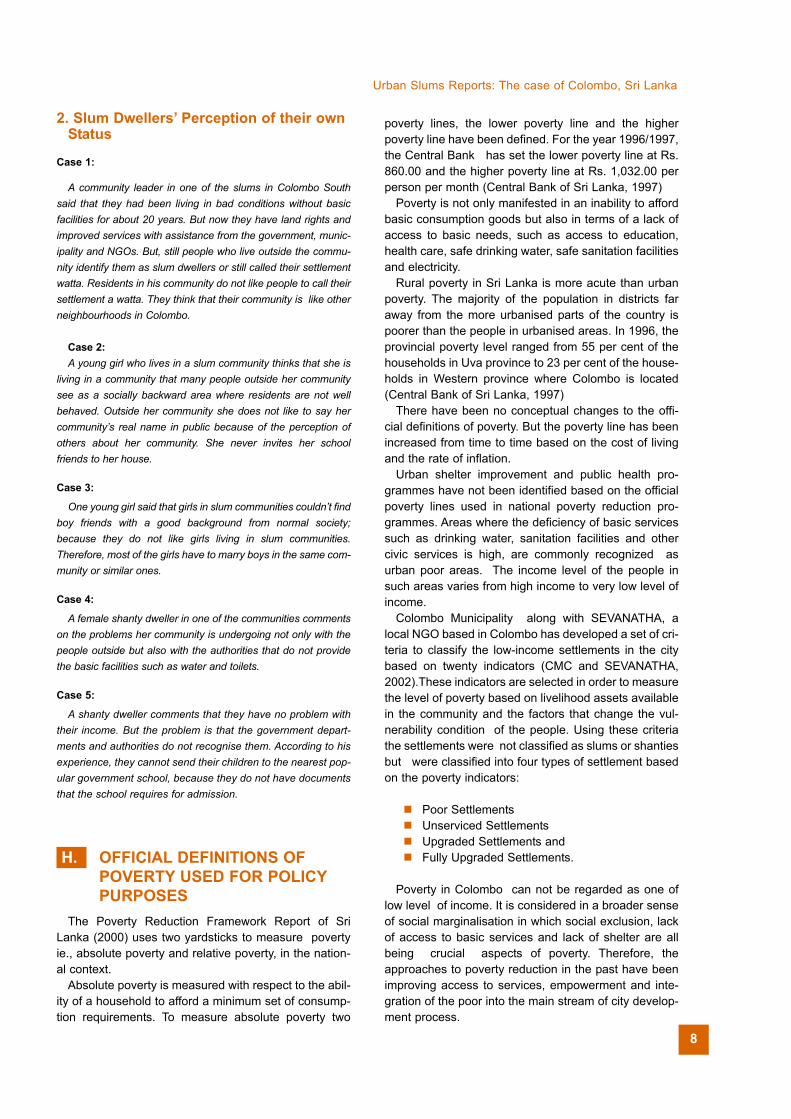
3.3 Income Distribution There is no data available for income distribution of
the population at city level. The consumer finance andSocio-Economic Survey of 1996/97, by the CentralBank of Sri Lanka provides details of income recipientsbased on major economic sectors such as urban, ruraland plantation sectors. The data for the urban sectorcould be used as the basis for understanding theincome distribution patterns of the city population in theabsence of city level data.
5
Table 3: The Area, Population Density & Growth Rateof Colombo (1870 – 2001)
Census Extent(Ha) Population Density
(P/Ha)Growth
Rate
1871 2448.6 98,847 40 -
1881 2448.6 110,509 45 1.18
1891 2448.6 126,825 52 .8
1901 2720.6 154,691 56 2.201
1911 3091.1 211,274 68 3.66
1921 3350.3 224,163 73 0.61
1931 3368.4 284,155 84 2.67
1946 3438.4 362,074 105 1.83
1953 3593.9 425,081 118 2.48
1963 3710.4 511,639 138 2.04
1971 3711.0 562,430 152 1.24
1981 3711.0 587,647 158 0.45
2001 3729.0 642,163 172 0.45
Source: Centenary Volume, CMC, 1963 and Urban DevelopmentAuthority, 1996
Table 4: Population by Age and Sex, CMC, 2001
Age Male Female
Less than 4 Year 08.6 08.1
5-14 16.8 16.3
15-29 29.1 30.4
30-44 25.6 24.3
45-64 14.9 15.5
More than 65 05.0 05.4
Total 100.0 100.0
Source: Municipal Budget Report, CMC, 2001
Table 5: Population By Ethnicity, CMC, 2001
Ethnicity Population % Of Total
Sinhalese 265,657 41.36
Sri Lankan Tamils 185,672 28.91
Indian Tamils 13,968 2.17
Sri Lankan Moors 153,299 23.87
Burghers 5,273 0.82
Malays 11,149 1.73
Sri Lankan Chetty 740 0.11
Bharatha 471 0.07
Other 5,934 0.96
Total 642,163 100.0
Source: Department of Census and Statistics, 2001
Table 6 Income Distribution by Sector
Quintile Urban Rural Plantation
Top 20 per cent 57.3 48.1 37.6
2nd 20 per cent 19.8 22.3 22.0
3rd 20 per cent 12.1 15.2 17.7
4th 20 per cent 7.5 10.0 14.1
Bottom 20 percent 3.3 4.4 8.6
Source: Consumer Finances & Socio Economic Survey, 1996/97
UNDERSTANDING SLUMS: Case Stud ies fo r the G loba l Repor t on Human Set t lements 2003
owned land, without any legal rights of occupancy. Theareas are badly serviced and very often unsanitary.
Unserviced Semi-urban Neighbourhoods: Badlyserviced residential areas in the suburban areas ofColombo and secondary towns. One difference from thesquatter areas is that residents of these settlementshave definite legal titles and the plot sizes are relativelylarger than the shanties.
Labour Lines or Derelict Living Quarters: Theseare derelict housing areas belonging to the local author-ity or government agencies occupied by temporary orcasual labourers. These settlements are in unsanitaryand derelict conditions due to lack of maintenance overa period of long time.
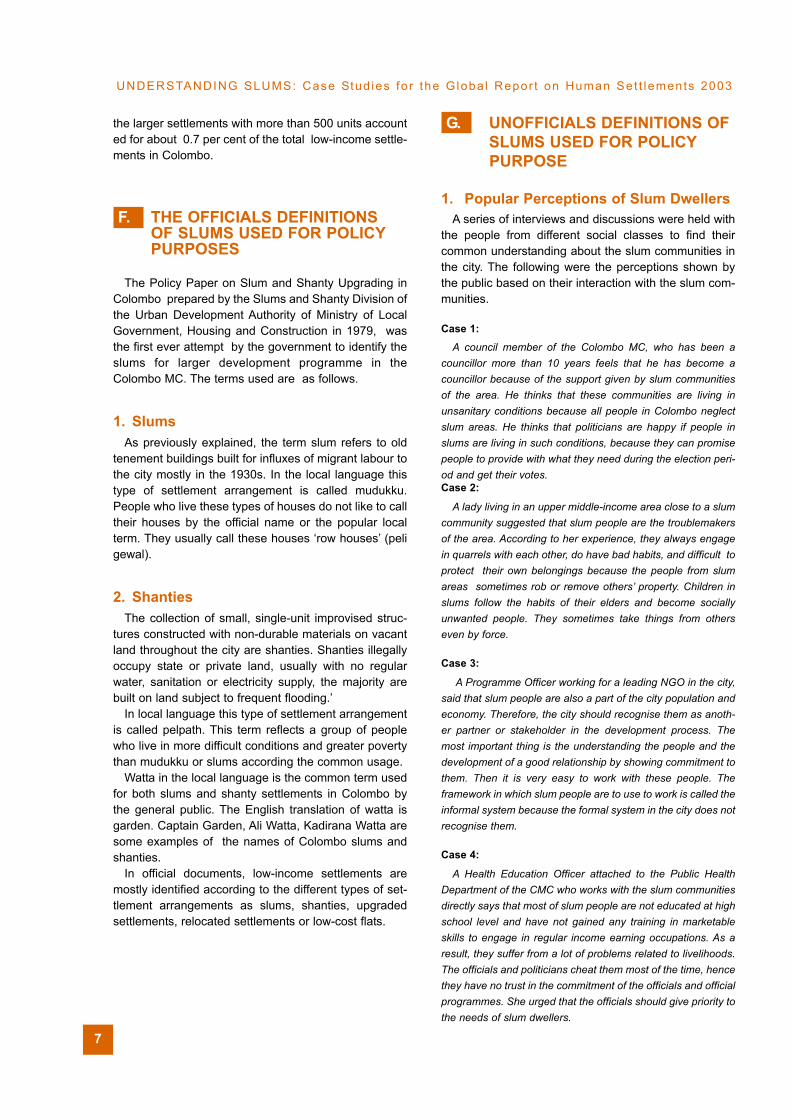
2. Location of Slums The most common slums in Colombo are the inner
city slums and the shanties. Slums are located on high-lands in the old parts of the inner city areas. Shantiesare mostly located in the periphery of city on road andcanal reservation lands that are mostly low-lying areasliable to frequent floods. Other types of slums are scat-tered through out the city.
3. AgeSlums in the inner city areas are the oldest low-
income housing in Colombo. These are the old residen-tial quarters built mostly in the 1930s by private land-lords for labourers who were engaged in processingagricultural products for export. Houses vacated bymiddle-income residents and traders in the inner cityareas during the Second World War were graduallyoccupied by the low income population which laterbecame slums. The partitioning of large old residenceswas done either by the owner himself or by tenants whohad rented out the single units at low rents to low-income-people who had migrated to the city searchingfor new jobs during a period when a thriving plantationindustry required labour for processing, packing, stor-age, handling and shipping. Shanty settlementsemerged after independence in 1948 and escalated inthe 1950s particularly during the Korean War time dueto influx of migrant workers from rural areas to the citylooking for employment. Many shanty settlementsalong the canal banks and road reservations were reg-ularised under the Million Houses Programs andColombo Canal Improvement projects from 1984 to1995.
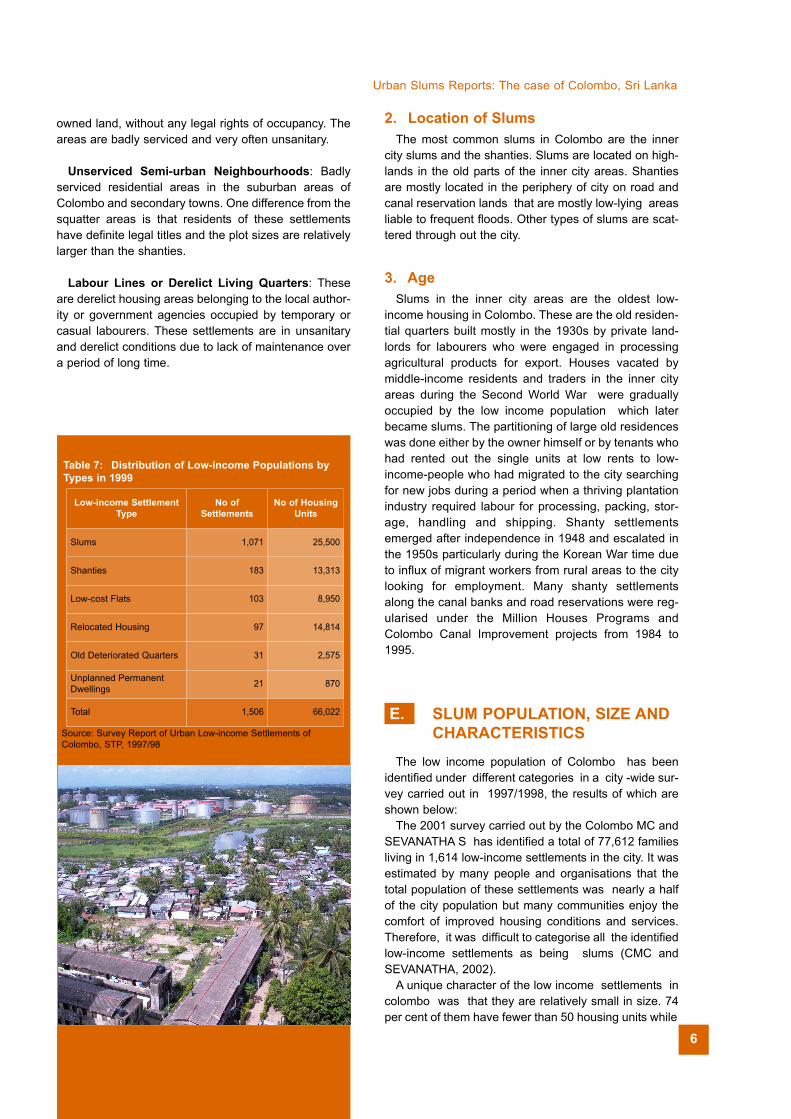
E. SLUM POPULATION, SIZE AND CHARACTERISTICS
The low income population of Colombo has beenidentified under different categories in a city -wide sur-vey carried out in 1997/1998, the results of which areshown below:
The 2001 survey carried out by the Colombo MC andSEVANATHA S has identified a total of 77,612 familiesliving in 1,614 low-income settlements in the city. It wasestimated by many people and organisations that thetotal population of these settlements was nearly a halfof the city population but many communities enjoy thecomfort of improved housing conditions and services.Therefore, it was difficult to categorise all the identifiedlow-income settlements as being slums (CMC andSEVANATHA, 2002).
A unique character of the low income settlements incolombo was that they are relatively small in size. 74per cent of them have fewer than 50 housing units while
Urban Slums Reports: The case of Colombo, Sri Lanka
Table 7: Distribution of Low-income Populations byTypes in 1999
Low-income SettlementType
No ofSettlements
No of HousingUnits
Slums 1,071 25,500
Shanties 183 13,313
Low-cost Flats 103 8,950
Relocated Housing 97 14,814
Old Deteriorated Quarters 31 2,575
Unplanned PermanentDwellings 21 870
Total 1,506 66,022
Source: Survey Report of Urban Low-income Settlements ofColombo, STP, 1997/98
6
the larger settlements with more than 500 units accounted for about 0.7 per cent of the total low-income settle-ments in Colombo.
F. THE OFFICIALS DEFINITIONS OF SLUMS USED FOR POLICYPURPOSES
The Policy Paper on Slum and Shanty Upgrading inColombo prepared by the Slums and Shanty Division ofthe Urban Development Authority of Ministry of LocalGovernment, Housing and Construction in 1979, wasthe first ever attempt by the government to identify theslums for larger development programme in theColombo MC. The terms used are as follows.
1. Slums As previously explained, the term slum refers to old
tenement buildings built for influxes of migrant labour tothe city mostly in the 1930s. In the local language thistype of settlement arrangement is called mudukku.People who live these types of houses do not like to calltheir houses by the official name or the popular localterm. They usually call these houses ‘row houses’ (peligewal).
2. ShantiesThe collection of small, single-unit improvised struc-
tures constructed with non-durable materials on vacantland throughout the city are shanties. Shanties illegallyoccupy state or private land, usually with no regularwater, sanitation or electricity supply, the majority arebuilt on land subject to frequent flooding.’
In local language this type of settlement arrangementis called pelpath. This term reflects a group of peoplewho live in more difficult conditions and greater povertythan mudukku or slums according the common usage.
Watta in the local language is the common term usedfor both slums and shanty settlements in Colombo bythe general public. The English translation of watta isgarden. Captain Garden, Ali Watta, Kadirana Watta aresome examples of the names of Colombo slums andshanties.
In official documents, low-income settlements aremostly identified according to the different types of set-tlement arrangements as slums, shanties, upgradedsettlements, relocated settlements or low-cost flats.
G. UNOFFICIALS DEFINITIONS OF SLUMS USED FOR POLICYPURPOSE
1. Popular Perceptions of Slum DwellersA series of interviews and discussions were held with
the people from different social classes to find theircommon understanding about the slum communities inthe city. The following were the perceptions shown bythe public based on their interaction with the slum com-munities.
Case 1:
A council member of the Colombo MC, who has been acouncillor more than 10 years feels that he has become acouncillor because of the support given by slum communitiesof the area. He thinks that these communities are living inunsanitary conditions because all people in Colombo neglectslum areas. He thinks that politicians are happy if people inslums are living in such conditions, because they can promisepeople to provide with what they need during the election peri-od and get their votes. Case 2:
A lady living in an upper middle-income area close to a slumcommunity suggested that slum people are the troublemakersof the area. According to her experience, they always engagein quarrels with each other, do have bad habits, and difficult toprotect their own belongings because the people from slumareas sometimes rob or remove others’ property. Children inslums follow the habits of their elders and become sociallyunwanted people. They sometimes take things from otherseven by force.
Case 3:
A Programme Officer working for a leading NGO in the city,said that slum people are also a part of the city population andeconomy. Therefore, the city should recognise them as anoth-er partner or stakeholder in the development process. Themost important thing is the understanding the people and thedevelopment of a good relationship by showing commitment tothem. Then it is very easy to work with these people. Theframework in which slum people are to use to work is called theinformal system because the formal system in the city does notrecognise them.
Case 4:
A Health Education Officer attached to the Public HealthDepartment of the CMC who works with the slum communitiesdirectly says that most of slum people are not educated at highschool level and have not gained any training in marketableskills to engage in regular income earning occupations. As aresult, they suffer from a lot of problems related to livelihoods.The officials and politicians cheat them most of the time, hencethey have no trust in the commitment of the officials and officialprogrammes. She urged that the officials should give priority tothe needs of slum dwellers.
7
UNDERSTANDING SLUMS: Case Stud ies fo r the G loba l Repor t on Human Set t lements 2003
2. Slum Dwellers’ Perception of their ownStatus
Case 1:
A community leader in one of the slums in Colombo Southsaid that they had been living in bad conditions without basicfacilities for about 20 years. But now they have land rights andimproved services with assistance from the government, munic-ipality and NGOs. But, still people who live outside the commu-nity identify them as slum dwellers or still called their settlementwatta. Residents in his community do not like people to call theirsettlement a watta. They think that their community is like otherneighbourhoods in Colombo.
Case 2: A young girl who lives in a slum community thinks that she is
living in a community that many people outside her communitysee as a socially backward area where residents are not wellbehaved. Outside her community she does not like to say hercommunity’s real name in public because of the perception ofothers about her community. She never invites her schoolfriends to her house.
Case 3:
One young girl said that girls in slum communities couldn’t findboy friends with a good background from normal society;because they do not like girls living in slum communities.Therefore, most of the girls have to marry boys in the same com-munity or similar ones.
Case 4:
A female shanty dweller in one of the communities commentson the problems her community is undergoing not only with thepeople outside but also with the authorities that do not providethe basic facilities such as water and toilets.
Case 5:
A shanty dweller comments that they have no problem withtheir income. But the problem is that the government depart-ments and authorities do not recognise them. According to hisexperience, they cannot send their children to the nearest pop-ular government school, because they do not have documentsthat the school requires for admission.
H. OFFICIAL DEFINITIONS OF POVERTY USED FOR POLICYPURPOSES
The Poverty Reduction Framework Report of SriLanka (2000) uses two yardsticks to measure povertyie., absolute poverty and relative poverty, in the nation-al context.
Absolute poverty is measured with respect to the abil-ity of a household to afford a minimum set of consump-tion requirements. To measure absolute poverty two
poverty lines, the lower poverty line and the higherpoverty line have been defined. For the year 1996/1997,the Central Bank has set the lower poverty line at Rs.860.00 and the higher poverty line at Rs. 1,032.00 perperson per month (Central Bank of Sri Lanka, 1997)
Poverty is not only manifested in an inability to affordbasic consumption goods but also in terms of a lack ofaccess to basic needs, such as access to education,health care, safe drinking water, safe sanitation facilitiesand electricity.
Rural poverty in Sri Lanka is more acute than urbanpoverty. The majority of the population in districts faraway from the more urbanised parts of the country ispoorer than the people in urbanised areas. In 1996, theprovincial poverty level ranged from 55 per cent of thehouseholds in Uva province to 23 per cent of the house-holds in Western province where Colombo is located(Central Bank of Sri Lanka, 1997)
There have been no conceptual changes to the offi-cial definitions of poverty. But the poverty line has beenincreased from time to time based on the cost of livingand the rate of inflation.
Urban shelter improvement and public health pro-grammes have not been identified based on the officialpoverty lines used in national poverty reduction pro-grammes. Areas where the deficiency of basic servicessuch as drinking water, sanitation facilities and othercivic services is high, are commonly recognized asurban poor areas. The income level of the people insuch areas varies from high income to very low level ofincome.
Colombo Municipality along with SEVANATHA, alocal NGO based in Colombo has developed a set of cri-teria to classify the low-income settlements in the citybased on twenty indicators (CMC and SEVANATHA,2002).These indicators are selected in order to measurethe level of poverty based on livelihood assets availablein the community and the factors that change the vul-nerability condition of the people. Using these criteriathe settlements were not classified as slums or shantiesbut were classified into four types of settlement basedon the poverty indicators:
Poor SettlementsUnserviced SettlementsUpgraded Settlements andFully Upgraded Settlements.
Poverty in Colombo can not be regarded as one oflow level of income. It is considered in a broader senseof social marginalisation in which social exclusion, lackof access to basic services and lack of shelter are allbeing crucial aspects of poverty. Therefore, theapproaches to poverty reduction in the past have beenimproving access to services, empowerment and inte-gration of the poor into the main stream of city develop-ment process.
8
Urban Slums Reports: The case of Colombo, Sri Lanka
I. OFFICIAL DEFINITIONS OF POVERTY
1. Popular Understandings of Poverty
There are a large number of families suffering fromlack of basic services and low-incomes scatteredthroughout the city. As they are not living in the designat-ed low-income areas called slums or shanties, suchhouseholds are generally get excluded from the urbanpoor improvement programmes of the city. People whoare unemployed, single-headed households, especiallywomen, disabled, elderly and sick people are also con-sidered poor.
2. The Poor’s Perception of their Own Poverty
Community perceptions on urban poverty werereviewed at different community forums held in Colomboby SEVANATHA. One such forum was held under theresearch project carried out by SEVANATHA in collabo-ration with WEDC of Loughborough University, UK onRegulatory Guidelines for Urban Upgrading based onthe Sustainable Urban Livelihoods Framework and thecommunity assessment survey to review the findingswith the communities. (CMC and SEVANTHA, 2002).The poor’s perception of their own poverty as stated bythem are indicated below:
Feelings of social exclusion: Low-income people feelthat they are poor, because they are socially excludedby the formal sector institutions. Hence, they have noaccess to the city's services, such as piped water, sani-tation, drains and waste collection. They have no accessto the formal banking system, hence they depend onthe moneylenders in the area. Their children cannot beenrolled in the good schools of the area. They have nofaith in the institutions and the officials systems toacqure services due to poor relations with them. Theirorganisations are not genuinely recognised for planningand development process.
Lack of land tenure: The urban poor recognise theirland as being the single most important asset of theirwhole livelihood pattern, hence lack of freehold rights totheir land has been a major cause of their poverty.Some people responded that they always lived witheviction threats. Sometimes the government introducedsome programmes; especially the relocation pro-gramme without any consultation with the people andmost of these programmes badly affected their liveli-hood.
Government victimisation: People in the urban poorsettlements think that the government does not want todevelop these settlements. Most of the respondents whowere interviewed said that the authorities want to evictthem from their lands and resell to the private sector.
Lack of secure sources of income: A majority of urbanpoor consider that they have lots of income opportuni-ties in the informal sector activities of the city. But lackof opportunities for skill improvements and securesources of income are a major cause of the poverty.
Lack of access to credit: A majority of urban poorconsider that they are poor, because they do not haveeasy access to credit. They always rely on moneylend-ers for emergency credit due to lack of access to the for-mal banking system. Recognising the above limitationscommunity savings & credit societies have been formedby a section of the poor. Women have been playing aleading role in this process. However, the communitysavings & credit programmes have not been recognisedby the government programmes.
J. THE ORIGINS OF THE SLUMS IN COLOMBO
1. Social, Economic and Political Forces that have Formed and Removed Slums
Slums including tenement gardens came into exis-tence in colombo with the expansion of export tradeassociated with the rubber boom (during the KoreanWar in 1953) after the Second World War. The charac-ter of Colombo changed in keeping with the new eco-nomic demands for warehousing, workers accomoda-tion and the road network improvement.. The city corebecame more congested and the city elite moved outinto more spacious residential areas in the suburbs. Thecentral part of Colombo became a predominantly low-income residential area with many slums, and the north-ern and eastern parts of the city were occupied byshanties.
2. Social, Political and Economic Advantages of Slums to the City
Half of the population of Colombo has been living formany years in slums, shanties and other types of low-income settlements. The city needs their services forthe proper functioning of various sectors of the urbaneconomy. Many people in developing countries cannotafford the services provided by the formal sector. Theinformal sector, which is predominantly owned and runby the people in the low-income areas, provides thenecessary services and goods needed by the majorityof the city in parallel with the formal sector. Most skilledand unskilled labour needed for the city comes from theinformal sector. Slums are the urban housing providersat cheap rent for those who come to city not only forseeking employment but also for many other purposes.
9
UNDERSTANDING SLUMS: Case Stud ies fo r the G loba l Repor t on Human Set t lements 2003
3. Permanent StructuresSeventy per cent of families live in permanent hous-
es of which 23 per cent were two storied (permanentstructures are composed of walls with fired bricks orcement sand blocks, roofed with asbestos sheets, cor-rugated iron sheets and floored with cement, floor tilesand terrazzo finish). Only 30 per cent of houses aresemi-permanent and temporary units. This reveals thateven without freehold rights to land, people haveimproved their houses.
4. Access to WaterThirty per cent of families have difficult access to
drinking water while only 44 per cent have individualhouse connection. 24-hour availability of piped watercovers only 56 per cent of the urban poor families in thecity. About 10 per cent of the families receive less than10 hours of water per day. This shows that provision ofimproved water supplies to a majority (56 per cent) ofurban poor is a critical issue in Colombo.
5. Access to SanitationThe availability of the city sewerage network was
recorded for about 70 per cent families (a majority ofindividual toilets and some common toilets were con-nected to the sewer network. However, in ColomboNorth Districts (District 1, 2A, 2B) where a large numberof low-income settlements located, a sewerage networkconnection was available for only 51 per cent families.The remaining 30 per cent without sewage connectionfacilities used septic tanks and soak pits while somefamilies directly discharged sewer into canals. As such,improving sanitation conditions in low-income settle-ments located in Colombo North district is more criticalthan in Colombo South district where about 70 per centof families have access to the city sewer network.
Even though slum dwellers can not afford formal sec-tor goods and services, they have been able to buildtheir houses and some infrastructure on a self-helpbasis without being a burden to local authorities and thegovernment. As the slum dwellers are migrants from therural areas, they socially and culturally maintain theirlocal values. Politically slum dwellers are importantbecause they could elect and select members of thecity council as well as the higher political authorities asthey hold the majority of votes in the city. Generally,low-income people have close relationships with theelected representatives at all political levels in the coun-try. When these people are aware of the policies andprogrammes being implemented by the government,they have been able to influence it in favour of poorthrough their contacts with the elected representatives.
K. BASIC DATA RELATED TO THE SLUMS IN COLOMBO
The key indicators relating to slums presented in thefollowing tables are drawn from the PovertyAssessment Survey in Colombo conducted by theColombo MC and SEVANATHA in 2001 (CMC &SEVANTATHA, 2002)
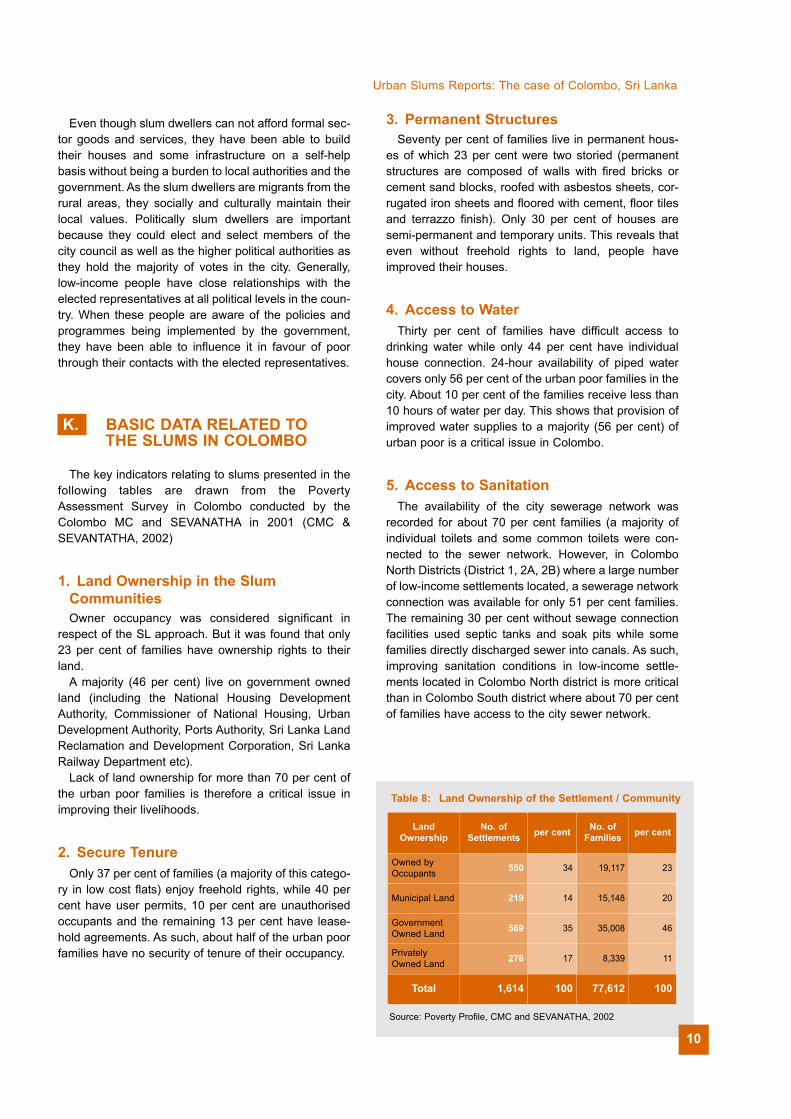
1. Land Ownership in the SlumCommunitiesOwner occupancy was considered significant in
respect of the SL approach. But it was found that only23 per cent of families have ownership rights to theirland.
A majority (46 per cent) live on government ownedland (including the National Housing DevelopmentAuthority, Commissioner of National Housing, UrbanDevelopment Authority, Ports Authority, Sri Lanka LandReclamation and Development Corporation, Sri LankaRailway Department etc).
Lack of land ownership for more than 70 per cent ofthe urban poor families is therefore a critical issue inimproving their livelihoods.
2. Secure TenureOnly 37 per cent of families (a majority of this catego-
ry in low cost flats) enjoy freehold rights, while 40 percent have user permits, 10 per cent are unauthorisedoccupants and the remaining 13 per cent have lease-hold agreements. As such, about half of the urban poorfamilies have no security of tenure of their occupancy.
Urban Slums Reports: The case of Colombo, Sri Lanka
Table 8: Land Ownership of the Settlement / Community
LandOwnership
No. ofSettlements per cent No. of
Families per cent
Owned byOccupants 550 34 19,117 23
Municipal Land 219 14 15,148 20
GovernmentOwned Land 569 35 35,008 46
PrivatelyOwned Land 276 17 8,339 11
Total 1,614 100 77,612 100
Source: Poverty Profile, CMC and SEVANATHA, 2002
10
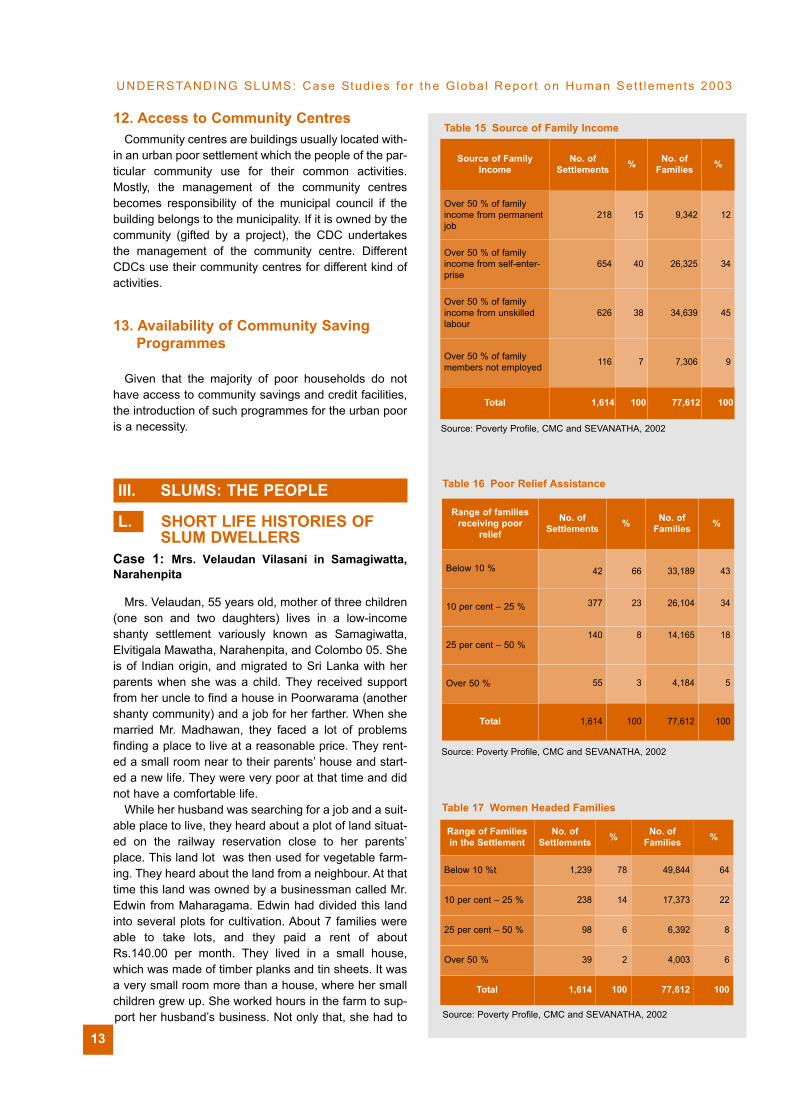
8. Source of IncomeAbout 45 per cent of the income-earning household
members engage in unskilled employment activities(waged labours, helpers etc.) About 9 per cent of fami-lies do not have any source of regular income. As such,lack of a regular source of income is a problem for about54 per cent of urban poor families.
9. Poor Relief AssistanceThe research showed that the CMC spends about
Rs.6.1 millions per month on poor relief assistance forabout 12,693 families in the city (which is about 16 percent of urban poor families). Those families whose totalfamily income is less than Rs. 1,500.00 per month areeligible for CMC poor relief. The distribution of thesefamilies in the urban poor settlements revealed that only34 per cent of settlements had more than 10 per centfamilies receiving poor relief assistance. In this respectit is important to note that between 10 per cent and 25per cent of families who receive poor relief assistanceare present in a majority (89 per cent) of poor settle-ments.
10. Women Headed FamiliesWomen headed families (due to death, abandonment
or permanent disability of husband) in urban poor settle-ments in Colombo were found to constitute a serioussocial issue.
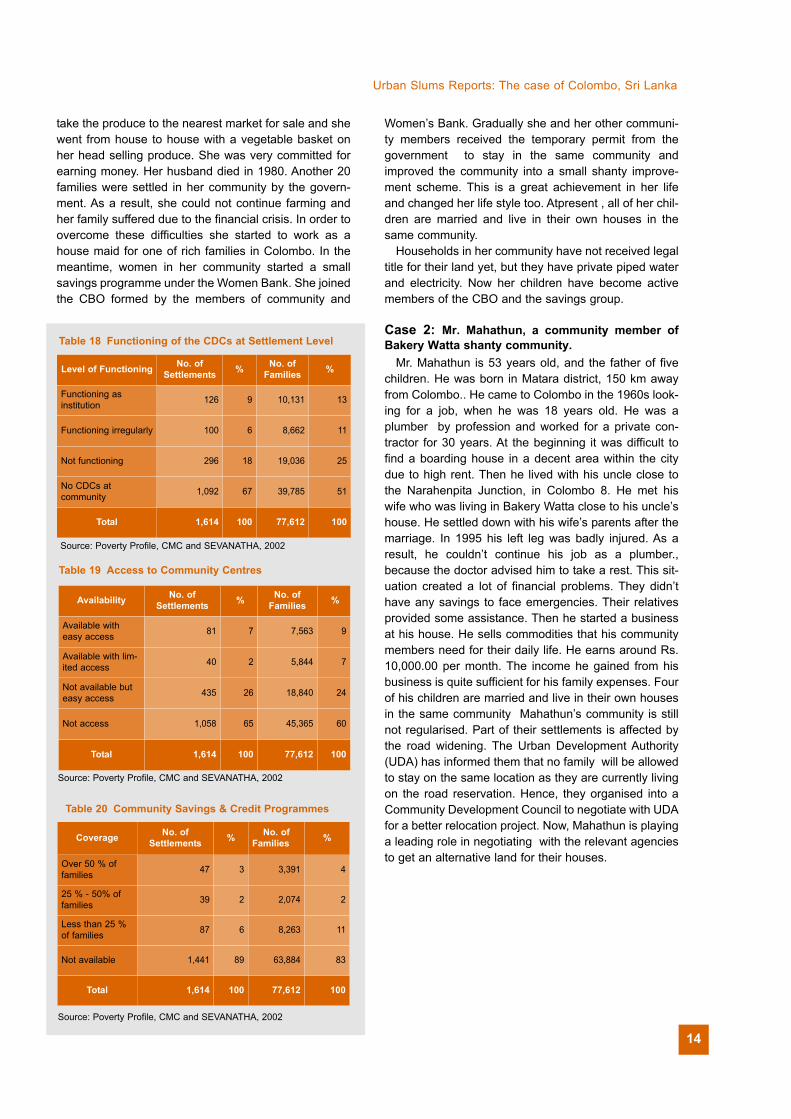
11. Functioning of Community Development Councils (CDCs)
Most slum and shanty communities have organisedCBOs, in the form of Community Development Councils(CDCs). The Colombo MC introduced the system of theCDC in 1979 and they operate at community level toimprove the basic amenities of their own slum settle-ments. Through the mechanism of three-tier develop-ment council system (community, municipal district andcity level) these communities have been able to partici-pate in the planning of programme activities to enablethe municipal authorities to deliver the basic amenitiesthat they really need.
Nevertheless, 67 per cent of the urban poor settle-ments do not have CDCs at present. Only 9 per cent ofthe settlements do have properly functioning CDCs. Assuch, organising the urban poor communities is to beconsidered a critical issue in improving their livelihoods.
The CDCs fulfil several important activities at commu-nity level. They provide the channel through which theurban poor communicate with governmental and non-governmental organisations, The CDC is a forum ofpeople at which the community can take decisions onthe settlement improvement activities. Once a CDC isformed by an urban poor community it has to be regis-
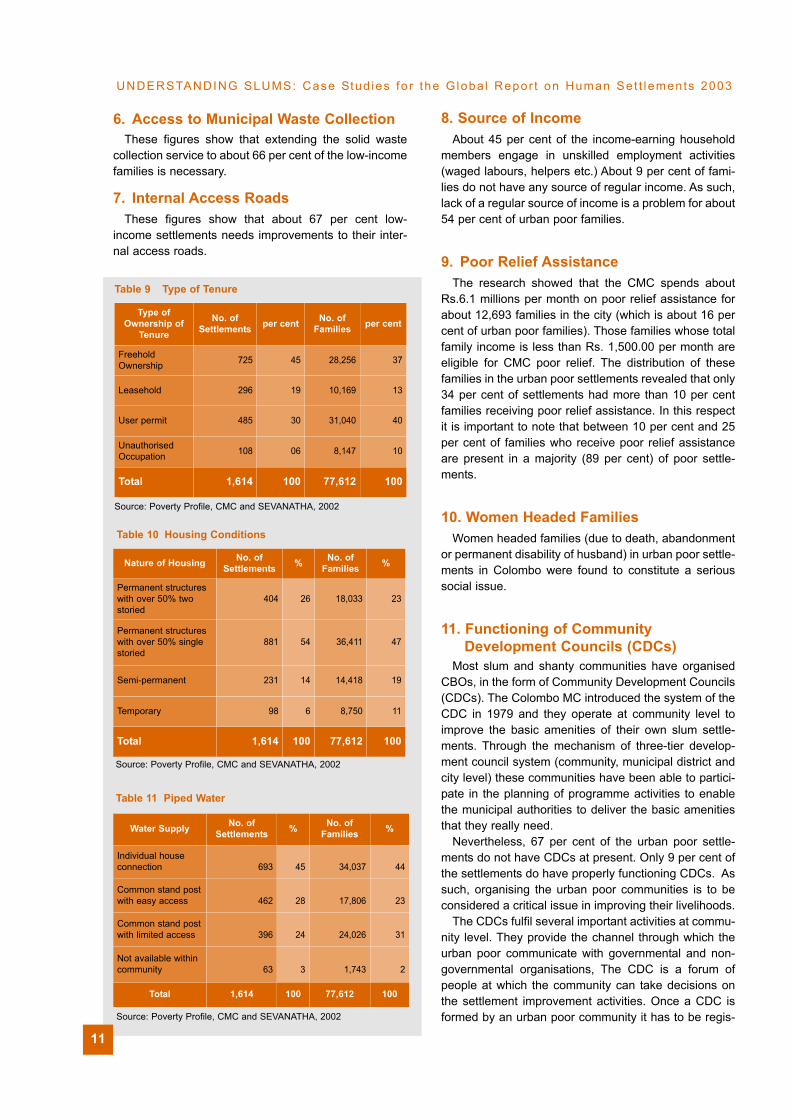
6. Access to Municipal Waste CollectionThese figures show that extending the solid waste
collection service to about 66 per cent of the low-incomefamilies is necessary.
7. Internal Access RoadsThese figures show that about 67 per cent low-
income settlements needs improvements to their inter-nal access roads.
Table 9 Type of Tenure
Source: Poverty Profile, CMC and SEVANATHA, 2002
Type ofOwnership of
Tenure
No. ofSettlements per cent No. of
Families per cent
FreeholdOwnership 725 45 28,256 37
Leasehold 296 19 10,169 13
User permit 485 30 31,040 40
UnauthorisedOccupation 108 06 8,147 10
Total 1,614 100 77,612 100
Table 10 Housing Conditions
Source: Poverty Profile, CMC and SEVANATHA, 2002
Nature of Housing No. ofSettlements % No. of
Families %
Permanent structureswith over 50% twostoried
404 26 18,033 23
Permanent structureswith over 50% singlestoried
881 54 36,411 47
Semi-permanent 231 14 14,418 19
Temporary 98 6 8,750 11
Total 1,614 100 77,612 100
Table 11 Piped Water
Source: Poverty Profile, CMC and SEVANATHA, 2002
Water Supply No. ofSettlements % No. of
Families %
Individual houseconnection 693 45 34,037 44
Common stand postwith easy access 462 28 17,806 23
Common stand postwith limited access 396 24 24,026 31
Not available withincommunity 63 3 1,743 2
Total 1,614 100 77,612 100
11
UNDERSTANDING SLUMS: Case Stud ies fo r the G loba l Repor t on Human Set t lements 2003
tered with the public Health Department of the ColomboMunicipal
Council so that it gains recognition by the municipalcouncil. Some common activities performed by CDCsare as follows.
To represent the community at different forums andagenciesTo promote collective feelings in the communityregardless of religion, ethnicity, sex, age or cast dif-ferencesTo help community realise that overcoming povertyis a common targetTo support the community to get rid of attitudes ofdependency on others and help raise communityconfidenceTo co-ordinate development activities implementedby agencies and people coming from outsideTo co-ordinate communication between outsideagencies and the people in the community to shareinformationTo assist the municipality and other support organi-sations to carry out their project activities (healthawareness campaigns, environmental improvementwork etc.)To assist in community development activities initiat-ed by different organisations in the following areas
Housing advisory/information services Income generation activities Environment protection Maintenance of common services Health and nutrition Pre-school education Skills development Women’s development programmes Savings and credit programmes Cultural projects
To take initiatives in the operation and mainte-nance of the common amenities.
Urban Slums Reports: The case of Colombo, Sri Lanka
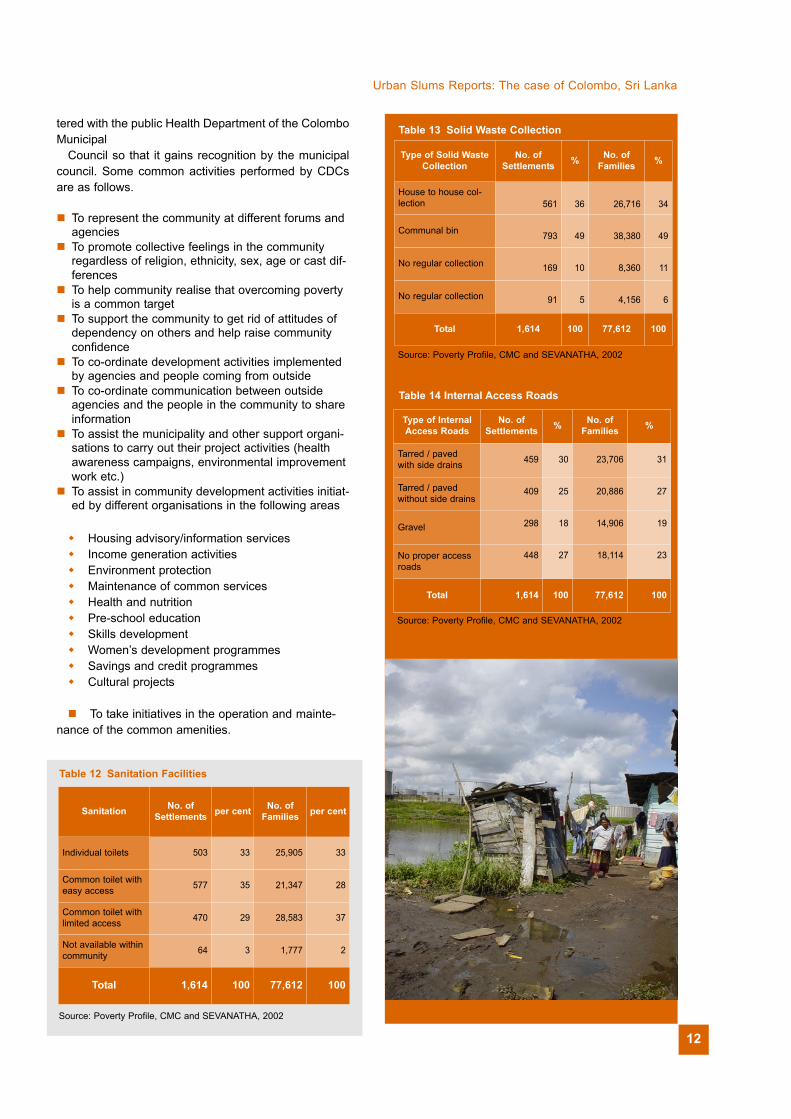
Table 12 Sanitation Facilities
Source: Poverty Profile, CMC and SEVANATHA, 2002
Sanitation No. ofSettlements per cent No. of
Families per cent
Individual toilets 503 33 25,905 33
Common toilet witheasy access 577 35 21,347 28
Common toilet withlimited access 470 29 28,583 37
Not available withincommunity 64 3 1,777 2
Total 1,614 100 77,612 100
12
Table 13 Solid Waste Collection
Source: Poverty Profile, CMC and SEVANATHA, 2002
Type of Solid WasteCollection
No. ofSettlements % No. of
Families %
House to house col-lection 561 36 26,716 34
Communal bin 793 49 38,380 49
No regular collection 169 10 8,360 11
No regular collection 91 5 4,156 6
Total 1,614 100 77,612 100
Table 14 Internal Access Roads
Source: Poverty Profile, CMC and SEVANATHA, 2002
Type of InternalAccess Roads
No. ofSettlements % No. of
Families %
Tarred / pavedwith side drains 459 30 23,706 31
Tarred / pavedwithout side drains
409 25 20,886 27
Gravel 298 18 14,906 19
No proper accessroads
448 27 18,114 23
Total 1,614 100 77,612 100
12. Access to Community CentresCommunity centres are buildings usually located with-
in an urban poor settlement which the people of the par-ticular community use for their common activities.Mostly, the management of the community centresbecomes responsibility of the municipal council if thebuilding belongs to the municipality. If it is owned by thecommunity (gifted by a project), the CDC undertakesthe management of the community centre. DifferentCDCs use their community centres for different kind ofactivities.
13. Availability of Community Saving Programmes
Given that the majority of poor households do nothave access to community savings and credit facilities,the introduction of such programmes for the urban pooris a necessity.
III. SLUMS: THE PEOPLE
L. SHORT LIFE HISTORIES OF SLUM DWELLERS
Case 1: Mrs. Velaudan Vilasani in Samagiwatta,Narahenpita
Mrs. Velaudan, 55 years old, mother of three children(one son and two daughters) lives in a low-incomeshanty settlement variously known as Samagiwatta,Elvitigala Mawatha, Narahenpita, and Colombo 05. Sheis of Indian origin, and migrated to Sri Lanka with herparents when she was a child. They received supportfrom her uncle to find a house in Poorwarama (anothershanty community) and a job for her farther. When shemarried Mr. Madhawan, they faced a lot of problemsfinding a place to live at a reasonable price. They rent-ed a small room near to their parents’ house and start-ed a new life. They were very poor at that time and didnot have a comfortable life.
While her husband was searching for a job and a suit-able place to live, they heard about a plot of land situat-ed on the railway reservation close to her parents’place. This land lot was then used for vegetable farm-ing. They heard about the land from a neighbour. At thattime this land was owned by a businessman called Mr.Edwin from Maharagama. Edwin had divided this landinto several plots for cultivation. About 7 families wereable to take lots, and they paid a rent of aboutRs.140.00 per month. They lived in a small house,which was made of timber planks and tin sheets. It wasa very small room more than a house, where her smallchildren grew up. She worked hours in the farm to sup-port her husband’s business. Not only that, she had to
UNDERSTANDING SLUMS: Case Stud ies fo r the G loba l Repor t on Human Set t lements 2003
Source: Poverty Profile, CMC and SEVANATHA, 2002
Table 15 Source of Family Income
Source of Family Income
No. ofSettlements % No. of
Families %
Over 50 % of familyincome from permanentjob
218 15 9,342 12
Over 50 % of familyincome from self-enter-prise
654 40 26,325 34
Over 50 % of familyincome from unskilledlabour
626 38 34,639 45
Over 50 % of familymembers not employed 116 7 7,306 9
Total 1,614 100 77,612 100
Source: Poverty Profile, CMC and SEVANATHA, 2002
Table 16 Poor Relief Assistance
Range of familiesreceiving poor
relief
No. ofSettlements % No. of
Families %
Below 10 % 42 66 33,189 43
10 per cent – 25 % 377 23 26,104 34
25 per cent – 50 %140 8 14,165 18
Over 50 % 55 3 4,184 5
Total 1,614 100 77,612 100
Table 17 Women Headed Families
Source: Poverty Profile, CMC and SEVANATHA, 2002
Range of Familiesin the Settlement
No. ofSettlements % No. of
Families %
Below 10 %t 1,239 78 49,844 64
10 per cent – 25 % 238 14 17,373 22
25 per cent – 50 % 98 6 6,392 8
Over 50 % 39 2 4,003 6
Total 1,614 100 77,612 100
13
take the produce to the nearest market for sale and shewent from house to house with a vegetable basket onher head selling produce. She was very committed forearning money. Her husband died in 1980. Another 20families were settled in her community by the govern-ment. As a result, she could not continue farming andher family suffered due to the financial crisis. In order toovercome these difficulties she started to work as ahouse maid for one of rich families in Colombo. In themeantime, women in her community started a smallsavings programme under the Women Bank. She joinedthe CBO formed by the members of community and
Women’s Bank. Gradually she and her other communi-ty members received the temporary permit from thegovernment to stay in the same community andimproved the community into a small shanty improve-ment scheme. This is a great achievement in her lifeand changed her life style too. Atpresent , all of her chil-dren are married and live in their own houses in thesame community.
Households in her community have not received legaltitle for their land yet, but they have private piped waterand electricity. Now her children have become activemembers of the CBO and the savings group.
Case 2: Mr. Mahathun, a community member ofBakery Watta shanty community.
Mr. Mahathun is 53 years old, and the father of fivechildren. He was born in Matara district, 150 km awayfrom Colombo.. He came to Colombo in the 1960s look-ing for a job, when he was 18 years old. He was aplumber by profession and worked for a private con-tractor for 30 years. At the beginning it was difficult tofind a boarding house in a decent area within the citydue to high rent. Then he lived with his uncle close tothe Narahenpita Junction, in Colombo 8. He met hiswife who was living in Bakery Watta close to his uncle’shouse. He settled down with his wife’s parents after themarriage. In 1995 his left leg was badly injured. As aresult, he couldn’t continue his job as a plumber.,because the doctor advised him to take a rest. This sit-uation created a lot of financial problems. They didn’thave any savings to face emergencies. Their relativesprovided some assistance. Then he started a businessat his house. He sells commodities that his communitymembers need for their daily life. He earns around Rs.10,000.00 per month. The income he gained from hisbusiness is quite sufficient for his family expenses. Fourof his children are married and live in their own housesin the same community Mahathun’s community is stillnot regularised. Part of their settlements is affected bythe road widening. The Urban Development Authority(UDA) has informed them that no family will be allowedto stay on the same location as they are currently livingon the road reservation. Hence, they organised into aCommunity Development Council to negotiate with UDAfor a better relocation project. Now, Mahathun is playinga leading role in negotiating with the relevant agenciesto get an alternative land for their houses.
Urban Slums Reports: The case of Colombo, Sri Lanka
Table 18 Functioning of the CDCs at Settlement Level
Level of Functioning No. ofSettlements % No. of
Families %
Functioning as institution 126 9 10,131 13
Functioning irregularly 100 6 8,662 11
Not functioning 296 18 19,036 25
No CDCs at community 1,092 67 39,785 51
Total 1,614 100 77,612 100
Source: Poverty Profile, CMC and SEVANATHA, 2002
Table 19 Access to Community Centres
Source: Poverty Profile, CMC and SEVANATHA, 2002
Availability No. ofSettlements % No. of
Families %
Available witheasy access 81 7 7,563 9
Available with lim-ited access 40 2 5,844 7
Not available buteasy access 435 26 18,840 24
Not access 1,058 65 45,365 60
Total 1,614 100 77,612 100
Table 20 Community Savings & Credit Programmes
Source: Poverty Profile, CMC and SEVANATHA, 2002
Coverage No. ofSettlements % No. of
Families %
Over 50 % offamilies 47 3 3,391 4
25 % - 50% offamilies 39 2 2,074 2
Less than 25 %of families 87 6 8,263 11
Not available 1,441 89 63,884 83
Total 1,614 100 77,612 100
14
M. ASPIRATIONS, PLANS AND BARRIERS
Case 1:
According to Ms. Velaudan, she had a lot of aspira-tions and plans when she was young and settled in hercommunity (Samagi Watta). She aspiring for a comfort-able life with her husband and the children like otherfamilies who live in the city. Her dream was to build anew house for the family and to give a good educationto her children, because she understood that it is theonly way that she can avoid her children going intosocially unacceptable life. It has been very difficult to ful-fil her dreams due to the absence of regular and suffi-cient income, insecurity of land tenure and untimelydeath of her husband. After her husband’s death shetook over the responsibility of maintaining the family.The money that was earned from her jobs was justenough for survival. When she needed more money forthe children’s education or any other family matter, theyapproached the moneylender in the area. She borrowedmoney from them and had to pay back with an interestof 20 per cent per month. This system kept both sheand other members of her community perpetuallyindebted to the moneylenders.
Case 2: According to the Mr. Mahatun’s experience, all slum
dwellers have their own dreams of a decent family life.But, it is very difficult to achieve this dream, because theothers in the city neglect people in slums or shanties.Many poor people who live in low-income settlementsdo not own the land. The price of the land and housingrent in the city are very high so that they cannot affordthem. Hence the alternative that they have is toencroach on the marginal or r rent out a small roomavailable in the informal settlements in the city. As thesesettlements are considered illegal, no state or local gov-ernment agency is willing to provide the basic serviceslike water, sanitation, electricity and waste collection.
“The government officials think that we are troublemakers.Officials make a lot of legal barriers as an easy way to bypassour requests. Officials and the business sector always try toevict us from the city. Therefore, we recognised the need foran organisation of our own. In my community we have formeda Community Development Council (CDC) and I am thePresident of our CDC. Now, we are negotiating with theHousing Ministry to get a block of land for our community fromthe city. The government has promised alternative land for ourpeople but we do not know when they are going to allocate it,or where”.
N. HOUSEHOLD INDICATORS FORWOMEN-HEADED AND OTHER HOUSEHOLDS
The information in this section was taken from a sam-ple of Bakery Watta. This data was gathered bySEVANATHA under its research project on Public andPrivate Partnerships for Transport and the Poor inColombo in 2001.
1. Overview of the CommunityBakery Watta is one of the oldest shanty communities
on government owned land in Narahenpita ward inColombo South. This community originated in 1956, byencroaching the area by a group of nine poor house-holds .. By now it has grown into a shanty settlement of64 housing units. The community is now threatened witheviction, because the area was declared a commercialimprovement zone under the development plan of theUDA. But no one has a clear idea of the date andprocess of the development and the people haveformed a CDC to negotiate with the UDA for requestingalternative land within a reasonable distance of theirworking places and other social activities.
The main social indicators for this settlement aregiven below.
2. General Household InformationOver 90 per cent of economically active inhabitants of
Bakery Watta are unskilled labourers and small andpetty traders.
Almost all-housing units are single story houses ofwhich 95 per cent are temporary built with corrugatediron sheets for roof, timber planks for walls and cementrendered floors.
It was found that 5 per cent of households are womenheaded.
3. Income Sources and LevelsThe main sources of income are from activities such
as three-wheel driving, working in construction sites,cleansing work and small trading or hawking (fruit, fishand vegetable etc) and especially the women work asmaids in high income houses in Colombo and in over-seas.
The unemployment rate is as high as about 60 percent among the youth in the community
Twenty per cent of families including women headedfamilies receive public assistance from the government
The average income per family about Rs. 5,000.00per month.
UNDERSTANDING SLUMS: Case Stud ies fo r the G loba l Repor t on Human Set t lements 2003
15
4. Household SizeSixty per cent of families have 5 to 7 members.
Eight per cent of households have more than 10members per unit.
Twenty per cent of housing units have more than 2families. Often when children marry they also settledown in their parents’ house. Some families have rent-ed out a part of their house to earn additional income.
5. Birth/Fertility RateIt is very difficult to collect accurate data from the
community about this matter. The information collectedshowed that 2 babies had died at birth during last 3years in the community. Illegal abortion is also common.
6. Types of TenureNo households have proper legal title for the land.
The land that they occupy is belong to the UrbanDevelopment Authority (UDA)
In 1989, households received an enumaration cardfrom the NHDA and CMC during a slum enumerationsurvey. People use this card for many purposes: toshow their length of stay in the area, to get applicationsto have a water supply from Municipality, to enrol theirchildren in schools and also they are considered astenure entitlement certificates. At present the communi-ty is negotiating with the UDA to obtain permission tostay in the same location or an alternative site close tothe present location.
7. Literacy RateOver 90 per cent of people are literate. The younger
generation is more literate than older.
Some people are capable of using more than onelanguageThere is no significant difference betweenmale and female literacy rates in the community.
8. House SizesThe floor area of the housing units vary between 20
m2 and 50 m2
The average floor area per person is 5 m2
Most houses have 3 rooms: a sleeping room, a din-ing/living and a kitchen.
9. Length of Residency in SlumPeople have been living in the settlement for the last
fifty years.
O. THE COSTS OF LIVING IN SLUMS
Data for this section were taken from the SwarnaRoad Stage II community in Colombo South, collectedby SEVANATHA as part of its pilot project onCommunity Infrastructure Improvements in Urban PoorCommunities, in 2001.
1. Overview of the Slum CommunitySwarna Road Stage II community is one of the urban
poor communities located along the Dehiwala canal inColombo. The settlement was a shanty community.The settlement has been upgraded with the assistanceof the government and an NGO during 1999/2000.There are 89 housing units in the community and theyhave both individual and common services.
2. Commuting to WorkAs in other low-income communities in the city, a
majority of inhabitants of the Swarna Road Stage II areunskilled workers some of them are engaged in, run-ning small businesses and operating three wheelers.Most of their activities are located or based within a 5km radius distance from the community. Most peoplewalk to their workplaces while others use public trans-port. According to the survey, the highest bus farespent per journey was around Rs.20.00 and the aver-age fare is Rs.5.00 per journey.
3. Price of Water and Other ServicesAll the households in the community have individual
water, toilet and electricity connections. Previouslythey used the common water taps and toilets providedby the municipality, for which they did not want to pay. The community sometime collected money for theoperation and maintenance of common amenities in anemergency. The households now pay monthly bills forwater and electricity. Average water bill per month wasabout Rs.200.00 (4 per cent of the family income). Theaverage electricity bill is about Rs.250.00 per month.The community does not need to pay for waste collec-tion or sanitation officially. They pay rates (property tax)to the municipality on a quarterly basis. These varyfrom Rs.50.00 to Rs.100.00.
4. Rental RatesThis is an upgraded settlement located in a very
good residential area about 4 km from the city centre.The average rental value of a house in the settlementis between Rs., 5000.00 and Rs.7,500.00 per month.
Urban Slums Reports: The case of Colombo, Sri Lanka
16
5. Availability of Housing FinanceMost of the families have already improved their
houses with permanent materials, and 30 per cent aretwo-storied. People spend their own savings for con-struction of the houses when they have permission fromthe government to improve their housing. Apart fromthat the community has received finance from the fol-lowing sources:
Housing loans from the National HousingDevelopment Authority, with a maximum loan packageof about Rs.20,000.00 per household.
Some families have received a sum ofRs.10,000.00. in materials grants from a charitableorganisation.
Community members who work in the private sec-tor have obtained loans from their employers for houseconstruction.
The members of the Women’s Bank (a CommunitySavings Group registered as a Co-operative) of the cityhave obtained loans up to a maximum ofRs.100,000.00.
6. Health ProblemsThe most common sicknesses that people in the com-
munity suffering were fevers and coughs. According topublic health inspectors, the following infectious dis-eases can be seen from time to time in the low-incomecommunities: chickenpox; typhoid fever; dysentery; viralhepatitis; food poisoning; encephalitis; and denguefever.
7. DiscriminationMen and women in the settlement have equal rights
and opportunities in terms of property ownership andemployment opportunities. Because of the women’ssavings program and the Community DevelopmentCouncil system in Colombo, women have taken theleadership in many community development pro-grammes. They participate in CDC elections, communi-ty workshops and program implementations. Women donot have any legal or cultural constraints to formal edu-cation. They can study up to university level free ofcharge.
8. Victimisation and InsecurityPeople in Colombo slums have not suffered r from
any severe threats by the state agencies or the privatesector regarding evictions. In the past, developmentprojects had provided opportunities to discuss theissues with the people if they were going to be affect-ed. For the people who were living on land reserva-
tion land along the city canal network, roads and formajor urban development no secure tenure was avail-able.. But in many cases in Colombo, people in such sit-uations have obtained alternative land for resettlementfrom the government reasonably close to their existingworkplaces.
9. Psychological TraumaThere were no figures on suicide rates in the commu-
nity. But, certain indications of violent behaviour can beseen in the community, especially in terms of drugaddiction and alcoholism, and violence against womenand children in the house.
10. Financial Expenditure for HouseholdsIn Colombo, the families in slums and shanty commu-
nities spend a large proportion of their income on food,generally about 50 to 60 per cent. People who rent theirhousing have to spent about 25 per cent of their incomefor this purpose.. Other regular household expenditureitems are water and electricity. People spend about 5 to10 per cent of their monthly income on children’s educa-tion and for health. Another major expenditure item istransport. On average this costs about 10 per cent ofincome. If people have no organised savings program inthe community , they do not make savings from theirmonthly earnings.
P. TYPES OF ASSETS AVAILABLE TO SLUM DWELLERS
Data on community assets presented below were col-lected by SEVANATHA in 2001 from an upgraded shan-ty settlement in Colombo called Bosevana and the low-income shanty settlement called 259 Watta under aresearch project called Sustainable Livelihoods andUrban Upgrading.
1. The Bosevana1.1 Overview of the Bosevana CommunityBosevana is a small shanty community located on a
canal bank close to the high-income housing project atManning Town, Narahenpita, Colombo. In 1987 theNHDA has reclaimed this area and allocated 50 m2 plotsto each of the 37 families. Now, all the families havebuilt permanent houses and enjoy individual services.
1.2 Physical Capital The land lot is the inhabitants’ most important asset.
Each household has received 50 m2 size land lot . Thehouses are mostly built of permanent materials, about
UNDERSTANDING SLUMS: Case Stud ies fo r the G loba l Repor t on Human Set t lements 2003
17
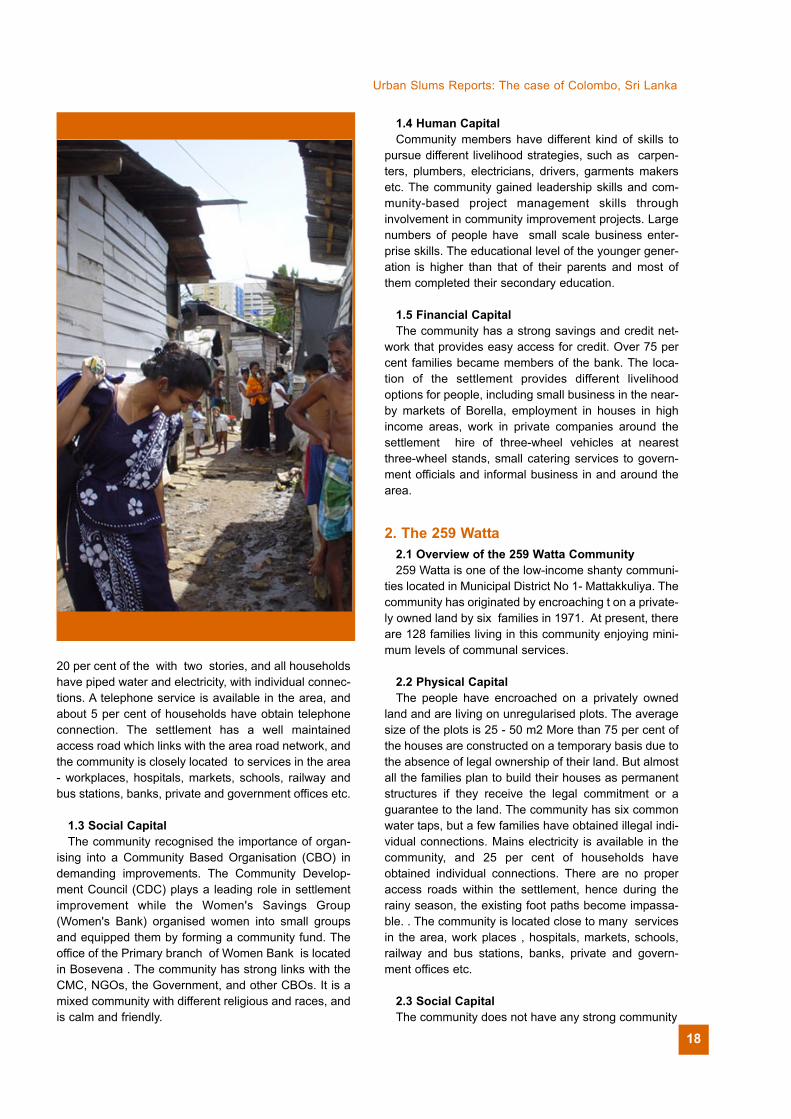
20 per cent of the with two stories, and all householdshave piped water and electricity, with individual connec-tions. A telephone service is available in the area, andabout 5 per cent of households have obtain telephoneconnection. The settlement has a well maintainedaccess road which links with the area road network, andthe community is closely located to services in the area- workplaces, hospitals, markets, schools, railway andbus stations, banks, private and government offices etc.
1.3 Social Capital The community recognised the importance of organ-
ising into a Community Based Organisation (CBO) indemanding improvements. The Community Develop-ment Council (CDC) plays a leading role in settlementimprovement while the Women's Savings Group(Women's Bank) organised women into small groupsand equipped them by forming a community fund. Theoffice of the Primary branch of Women Bank is locatedin Bosevena . The community has strong links with theCMC, NGOs, the Government, and other CBOs. It is amixed community with different religious and races, andis calm and friendly.
1.4 Human CapitalCommunity members have different kind of skills to
pursue different livelihood strategies, such as carpen-ters, plumbers, electricians, drivers, garments makersetc. The community gained leadership skills and com-munity-based project management skills throughinvolvement in community improvement projects. Largenumbers of people have small scale business enter-prise skills. The educational level of the younger gener-ation is higher than that of their parents and most ofthem completed their secondary education.
1.5 Financial CapitalThe community has a strong savings and credit net-
work that provides easy access for credit. Over 75 percent families became members of the bank. The loca-tion of the settlement provides different livelihoodoptions for people, including small business in the near-by markets of Borella, employment in houses in highincome areas, work in private companies around thesettlement hire of three-wheel vehicles at nearestthree-wheel stands, small catering services to govern-ment officials and informal business in and around thearea.
2. The 259 Watta2.1 Overview of the 259 Watta Community259 Watta is one of the low-income shanty communi-
ties located in Municipal District No 1- Mattakkuliya. Thecommunity has originated by encroaching t on a private-ly owned land by six families in 1971. At present, thereare 128 families living in this community enjoying mini-mum levels of communal services.
2.2 Physical Capital The people have encroached on a privately owned
land and are living on unregularised plots. The averagesize of the plots is 25 - 50 m2 More than 75 per cent ofthe houses are constructed on a temporary basis due tothe absence of legal ownership of their land. But almostall the families plan to build their houses as permanentstructures if they receive the legal commitment or aguarantee to the land. The community has six commonwater taps, but a few families have obtained illegal indi-vidual connections. Mains electricity is available in thecommunity, and 25 per cent of households haveobtained individual connections. There are no properaccess roads within the settlement, hence during therainy season, the existing foot paths become impassa-ble. . The community is located close to many servicesin the area, work places , hospitals, markets, schools,railway and bus stations, banks, private and govern-ment offices etc.
2.3 Social Capital The community does not have any strong community
Urban Slums Reports: The case of Colombo, Sri Lanka
18
based organisations. There are few informal leadersactive in the community. It is a mixed community withdifferent religious and racial groups and like the previ-ous one, it is a calm and friendly community.
2.4 Human Capital and Financial CapitalThese are the same as in the Bosevana Community.
IV. SLUMS AND POVERTY:THE POLICIES
Q. POLICIES AND ACTIONS TAKEN TO IMPROVE SLUMS
The government of Sri Lanka, together with therespective local authorities, have implemented severalprogrammes for the improvement of slums and shantiesin the city since early 1970s. A summary of these pro-grammes is provided below .
1. Before 1970Minimum Government Intervention.
Impacts:Slow rate of urbanisation Lower numbers of slum and shanty settlements located in the cityNo major government involvement in improving thelivelihoods of urban poorPeople managed their basic needs by themselves
2. 1970 to 1977
Direct government intervention in preparing andimplementing policies and programmes. Enactment ofthe Ceiling on Housing Property Law No. 01 of 1973(CHP Law)
Impacts:Introduction of new policies and regulations ensuringthe housing rights of urban poorDirect housing construction by government to meetthe housing need of urban poorProvision of tenure rights to slum dwellers Regulation of ownership, size and cost of construc-tion of housesRecognition of the impotence of improving the basicamenities in urban poor settlementsFirst ever government effort to recognise and act onthe housing problem of the urban poor
3. 1978 to 1994The government started its interventions through a
provider approach and gradually changed towards
enabling approach in housing improvement. A numberof programmes and initiatives were taken place:
Establishment of the Urban Development Authority(UDA)
Establishment of the National HousingDevelopment Authority (NHDA)
Establishment of the Common Amenities Board(CBA)
Urban Basic Services Programme, 1978 – 1986
Slum and Shanty Improvement Programme, 1978– 1984
Hundred Thousand Houses Programme and OneMillion Houses Programme, 1978 – 1994
Impacts:
Recognised the need for comprehensive develop-ment programmes to improve urban poor settle-mentsRecognised the participation of local authorities inimplementing the projects at municipal levelPrepared a policy paper on slum and shantyimprovement and obtained cabinet approval forimplementation (by Slums and Shanty Division ofUDA).Created legal and institutional conditions favourablefor community participationPromoted the concept of self help and beneficiaryparticipation in planning and implementing low-income settlements projectsRecognised occupancy rights of shanty dwellers inregularised settlements and improved the basicservicesCountry wide housing programmes with many alter-natives to improve the poor peoples' housing
4. After 1994In 1994, the Government appointed a Presidential
Task Force on Urban Development & Housing to makepolicy development which:
Established a Real Estate Exchange Limited (REEL)programme under the Ministry of Housing,Construction and Urban DevelopmentUrban Renewal Programme implemented by theUDA/NHDAUrban Settlements Improvement Programme(USIP), JBIC/World Bank Funded ProjectMunicipal Councillors’ Rs.1.5 Millions Programmeimplemented by the Colombo MC
UNDERSTANDING SLUMS: Case Stud ies fo r the G loba l Repor t on Human Set t lements 2003
19
Impacts: Prepared a government housing policy to promoteprivate/business sector participation in improvingthe housing stock of the cityCreated legal and institutional conditions favourablefor private/business sector participationEncouraged the direct construction housing by theNHDA and UDAConstructed high rise apartments for the urban poorand planned to relocate all the slum communitiesunder the REEL ProgrammeCMC has taken a policy decision to spend theirratepayer’s money for improving the living condi-tions of urban poorUncertainty of security of tenure of urban poor as aresult of policy inconsistency in housing
R. POVERTY REDUCTION AND SLUM IMPROVEMENT EFFORTS OF COLOMBO MUNICIPALCOUNCIL
The Colombo MC has implemented a number of inno-vative programmes to improve the health and sanita-tion, housing and socio-economic conditions of theurban poor particularly since the early 1980s. Among itsfifteen functional departments, the Public AssistanceDepartment and Public Health Department are keydepartments that implement programmes to improvethe life of slum dwellers in the city. They have concen-trated on the provision of basic services (with theUNICEF assisted Urban Basic Services Programme)and the provision of public amenities, including espe-cially educational and health services, poor relief grants,and social services. There is also a recently introduced“councillors’ fund programme” under which each coun-cillor is allocated a sum of Rs.1.5 millions annually forimprovement of amenities in low-income communities.
S. NGO / CBO INTERVENTIONS
Historically, there was no policy to encourageNGO/CBOs to engage in urban environmental andhousing issues in colombo. For the first time the UDAhad invited local and international NGOs to undertakecommunity development activities under its pilot phaseof slums and shanty upgrading projects from 1978 to1985, but for several reasons such as high overheadcosts, delays in procedures, absence of policies toencourage NGO/CBOs as partners in the developmentprocess, it was not expanded beyond the phase of thepilot project.
Although the Urban Housing Sub Programme of theMillion Houses Programme was a support based pro-gramme implemented through a decentralised govern-ment mechanism, it did not persuade NGOs to work asfacilitators or partners in the poor urban areas.
However, since 1990 several local NGOs have gradual-ly been engaged in environmental issues with grassrootslevel organisations like CBOs for a number of reasons:
The limited success of government programmesThe increase of environmental problems in urbanareasChanges in donor policies to promote NGOs and pri-vate sector participation in the development processInfluence to change government policies from statedominated delivery process to collaborative partici-patory approach
Since 1992, two major government programmes, ie;national poverty alleviation programme and communitywater supply and sanitation programmes, have recog-nised local NGOs as partner organisations for programmeimplementation. Both of these programmes were basedon the rural poor. As far as the role of NGOs in urban shel-ter and environmental management are concerned, thepilot programmes implemented by SEVANATHA andWomen’s Bank stand as examples. The various effortscarried out by the NGOs, CBOs to reduce poverty in thecity can be grouped into the following categories.
1. Community Managed Slum Upgrading(Sites and Services) Projects:In selected low-income communities, programmes
were introduced by NGOs and CBOs to improve thebasic infrastructure in the community. These pro-grammes have incorporated the inputs of the communi-ty as well as their contribution of part of the capital costof the services and labour requirements. In many suchinstances, the community was involved in the activityright from the beginning from the identification of theproblems, designing, making decisions to implementa-tion and operation and maintenance.
2. Environmental Management Programmes:
In some of the low-income areas the community andNGO initiatives were directed at developing communitybased environmental management programmes, espe-cially waste collection and disposal systems. Here too,participation of the community in the designing, imple-mentation and carrying out the work was ensured.Some projects have introduced systems of developingsmall community projects such as waste recycling andpaper making while some communities engaged inmaking compost out of biodegradable waste.
Urban Slums Reports: The case of Colombo, Sri Lanka
20
3. Awareness Programmes in CommunityHealth:
Many NGO initiatives in their early activities aimed atawareness creation in the low-income communities.This work has been especially carried out with women,who often stay at home during the daytime. These pro-grammes involve health awareness programmes, fami-ly planning programmes and programmes forHIV/AIDS/STDs etc.
4. Community Empowerment Programmes:
Empowerment programmes for women by the NGOsand CBOs were seen as a common feature of activitiescarried out by the civil society organisations working inthe low-income areas. These included teaching tech-niques of know-how particularly in the sphere of dealingwith the wider society. Many efforts are now widelyknown by the women in the low-income communitiesand they can obtain information and assistance frombodies such as the Urban Resource Centre maintainedby SEVANATHA and the Women’s Bank
5. Training and Capacity Building Programmes:
Training and Capacity building programmes carriedout by the NGOs are primarily of two kinds. Firstly,training and capacity building for officials from the rele-vant agencies, who work closely with slum dwellers.Secondly, employment training, leadership training, andtechnical training for community leaders. Employmenttraining programmes including training of women onself-employment activities were carried out by theNGOs. Many of these programmes are also linked withcredit programmes, so that trainees can obtain creditfacilities to start off self-employment activities afterbeing trained. The Women’s Bank and SakasuruAramudala (Community Fund) operated bySEVANATHA are some of the community managedfunds that are available for the urban poor.
T. BEST PRACTICES IN COMMUNITY BASED SLUM UPGRADING IN COLOMBO
1. Community Action Planning andManagement (CAP)
This is an approach developed to implement theurban housing sub-programme and was called theCommunity Action Planning and Management approachor CAP. The approach sees people as the mainresources for development rather than as an object ofthe development efforts or as mere recipients of bene-
fits. The objective of the approach is to motivate andmobilise the people of urban low-income communities totake the lead in the planning and implementation ofimprovement activities for their community. At a CAPworkshop, community members interact as partners withthe staff of NHDA, the local authority and the non-gov-ernmental organisations. They discuss the problems ofthe community, identify common solutions and formulateplans of action. The first step in the process of CAP forurban low-income settlements is the two-day communityaction-planning workshop. Following that a number ofhalf-day workshops are organised along the same lines,as issue specific workshops for dealing with any problemor issue which the community wants to raise.
2. Community Development Councils (CDC)
In order to facilitate the interaction between the resi-dents of the community and external agencies, all low-income communities involved in the urban housing subprogramme first have to go through a process of com-munity organisation which results in the establishmentof a Community Development Council or CDC. TheCDCs are established to reduce a sense of overdependency on the external agencies and to developconfidence in the communities’ ability to solve their ownproblems. The CDC fulfils several crucial functionsrelated to the community.
3. Community Construction Contract System (CCCS)
The NHDA understood the importance of a speedydelivery of urban infrastructure services to the urbanpoor, because better infrastructure can quickly improvethe sanitary conditions in a settlement. It was alsounderstood that the active involvement of the communi-ty in the provision of infrastructure could enhance thesense of responsibility of the community for the opera-tion and maintenance of the amenities and this wouldresult in a longer life span for the amenity. As a result, anew approach with extensive community participation inthe planning and construction of infrastructure wasrequired and the community construction contract sys-tem was formulated. In principle, the NHDA decided torecognise CDCs as institutions, with potentials andqualifications to act as contractors.
The community contract construction system hasbecome a standard procedure to get people’s involve-ment in the provision of infrastructure in human settle-ment development not only by the NHDA by also bymany government organisations and local authorities:Kandy Municipal Council, National Water Supply andDrainage Board, Common Amenities Board and NGOsinvolved in urban and rural poverty reduction pro-grammes. This procedure has already made big
UNDERSTANDING SLUMS: Case Stud ies fo r the G loba l Repor t on Human Set t lements 2003
21
impacts on the World Bank funded community watersupply and sanitation projects in Sri Lanka aimed atdesigning new procedures to get construction workthrough CBOs. So far the Treasury of the Sri LankaGovernment has issued three circulars relating to com-munity-based work, stating that government agenciescan award contracts valued up to Rs.1 million to CBOs.Most NGOs in Sri Lanka have been using the CCCSwith some modifications in community based develop-ment activities.
4. Experiences of Public and Private Partnerships to Address Slum Related Problems
Many examples can be found in Colombo where theurban poor communities improving their settlementsworking in partnership primarily with the public sector.The example described below is a recent communityimprovement project in which the community was ableto receive individual water meter connections to thehouses, waste water connections to a drainage system,individual toilet connections to a sewer network and inwhich the Community Development Council performedits role as a contractor to carry out the these improve-ment work.
U. THE COMMUNITY
The community which illustrates this example iscalled Poorwarama Settlement, in Colambage Mawathain Kirula Ward of Colombo. It is a resettlement site, forfamilies removed from a roadside squatter settlement ina nearby town centre, with about 109 families. Eachfamily was given 50 m2 size plot of land with Rs.15,000.00 as cash compensation for their houses. Thecommunity was removed to the new site in 1999.
When the people were asked to move to the newlocation there were no any facilities. The people had towalk about ½ km to fetch water from a street stand postin an adjoining community. No toilet facilities were avail-able and no guidance was given on how to build thehouses. Subsequently, the community made an appealto the Minister of Transport and Highways requesting toprovide basic services. Eventually four stand posts andtwo common toilet blocks were installed. However, therewas no organised effort to develop the community. Thecommunity has organised into a CommunityDevelopment Council and started making requests forsupport to improve their community.
UN-Habitat has informed the SEVANATHA organisa-tion that it could help SEVANATHA to work on commu-nity mobilisation activities to start a Community ActionPlanning Methodology and Community ConstructionContract System for improving the basic amenities.
SEVANATHA identified two communities one of whichwas Poorwarama. During this period the Japan Bankfor International Co-operation (JBIC) provided finan-cial and technical assistance to the government of SriLanka to the Ministry of Urban Development &Housing to improve basic amenities in urban poor set-tlements. A project cell called Urban SettlementsImprovement Programme (USIP) was establishedunder the Ministry to implement the JBIC assisted proj-ect. SEVANATHA has requested the USIP to includethe community of Poorwarama in the USIP's list ofsettlements for improving basic amenities. TheCommunity Development Council approached theUSIP and was subsequently able to obtain JBIC –USIP support to obtain services for the community.
The main actors of the project included theCommunity Development Council (CDC) of the settle-ment, Colombo Municipal Council (CMC), NationalHousing Development Authority (NHDA), RoadDevelopment Authority (RDA), Urban SettlementImprovement Project (USIP) and SEVANATHA.
As the first step, in July 2000, a Community ActionPlanning (CAP) workshop was organised in order toidentify the problems faced by the community and toformulate appropriate actions. Representatives fromrelevant agencies were invited to participate in theworkshop. Of the community members who participat-ed in the workshop, over 50 per cent were women. Atthe workshop, the community has identified a list ofproblems in the settlement with possible solutions.
Subsequently, SEVANATHA and CDC organisedanother meeting to identify the roles and responsibili-ties of each and every partner who were involved inthe project.
It is interesting to note that the partnership approachwhich was adopted in the pilot project provided a plat-form for all the stakeholders to agree on their respon-sibilities and to perform them accordingly. Such a part-nership approach seems to have been more appropri-ate than that of a provider based approach generallypreferred by the government. As a result, the commu-nity itself has taken over the operation and mainte-nance activities for their infrastructure on a self-helpand self-finance basis.
V. LESSONS LEARNED
1. Importance of the Context
During the period from early 1980s to early 1990s,Housing and Urban Development has been one of thekey target areas of the government’s developmentagenda. Implementation of national level programmesand strategies to improve the country’s housing andhuman settlements sector was thus undertaken during
Urban Slums Reports: The case of Colombo, Sri Lanka
22
the above period. The one Hundred Thousand HousesProgramme (1978 - 1983), one Million HousesProgramme (1984 - 1988) and 1.5 Million HousesProgramme (1989 - 1994) were the national pro-grammes. The strong political commitment and supportright from the Cabinet level to the local authority and vil-lage levels were available for implementation of theseprogrammes.
2. Importance of EnablementThe principles of the Million Houses Programme
clearly stated that creating enabling environment forpeople to improve their own houses was the core char-acteristic of the programme. Enabling environments inthe context of legal, institutional, financial and technicalsupport were erected in order to support the implemen-tation of the housing development programmes.
Particularly, the institutional mechanism created by thegovernment to implement the national HousingProgrammes was very effective. The establishment ofNational Housing Development Authority under theMinistry of Housing and Construction, establishing districtoffices of the Authority for each administrative district ofthe country and linking the programme activities at locallevel through Urban and Rural local authorities werenotable initiatives in this context. Bottom-up informationflow and decision-making process were encouraged.
3. Importance of Various Types of CapitalIn addition to the creation of government lead institu-
tional machinery, the programmes supported thestrengthening of people’s organisations - CommunityBased Organisations (CBOs), and Non-GovernmentalOrganisation (NGOs) and invited them to participate inthe housing development process. Participation of thebeneficiary communities and the civil society had con-tributed immensely to bring down the costs of the pro-gramme activities.
4. Importance of Correct TargetingThe involvement of people’s organisations in the iden-
tification of beneficiary families in the planning of villageand local level housing improvement activities and intheir implementation had paved the way for a genuineprocess of people’s participation in the housingimprovement projects. Such a people-centred processenabled identification of correct priorities and targetbeneficiaries for the programme.
ABBREVIATIONS AND GLOSSARY
ACHEO Assistant Chief Health Education OfficerCAP Community Action PlanningCBA Common Amenities BoardCBOs Community Based OrganisationsCCCS Community Contract Construction SystemCDCs Community Development CouncilsCHEO Chief Health Education OfficerCHPL Ceiling on Housing Property LawCMC Colombo Municipal CouncilCMRSP Colombo Metropolitan Regional Structure PlanCSPU Clean Settlements Project UnitDFID Department for International
DevelopmentGDP Gross Domestic ProductsGNP Gross National ProductsHCDC Housing and Community Development
CommitteeHI Health InstructorJBIC Japanese Bank for International CorporationLIs Low-income SettlementsNGOs Non Governmental OrganisationsNHDA National Housing Development AuthorityNWS&DB National Water Supply and Drainage BoardPO Programme OfficerPS Pradeshiya SabhaRDA Road Development AuthorityREEL Real Estate Exchange LimitedRs. Sri Lankan RupeesSLLR&DC Sri Lanka Land Reclamation and
Development CorporationSTP Sustainable Township ProgrammeTUGI The Urban Governance InitiativeUBSP Urban Basic Services ProgrammeUDA Urban Development AuthorityUK United KingdomUMP Urban Management ProgrammeUNDP United Nations Development ProgrammeUSIP Urban Settlements Improvement
ProjectWEDC Water, Engineering and Development CentreWatta A derogatory name for a slum
UNDERSTANDING SLUMS: Case Stud ies fo r the G loba l Repor t on Human Set t lements 2003
23
REFERENCES
Agromart Foundation, (1998), Poverty To Prosperity,Colombo, Sri Lanka
Andrew Cotton (August 1998) Operation &Maintenance – Report 2: Situation Analysis & Action Plan, London School of Hygiene & TropicalMedicine, UK WEDC, Loughborough University, UK
Bandara, YMSM (May 2000) Study on EconomicPotential of Colombo Core Area: Municipal Councils ofColombo, Sri Jayawardanepura Kotte and Dehiwala MtLavinia, SEVANATHA Urban Resource Center,Colombo, Sri Lanka
Bulankulame, SWP, Senanayake, MAP & Mahanama,PKS (May 2000) Study on Past and CurrentDevelopment Efforts of Colombo – Municipal Councilsof Colombo, Sri Jayawardenapura Kotte and DehiwalaMt Lavinia SEVANATHA Urban Resource Center,Colombo, Sri Lanka
CARE International (June 2001), Even the Dogs Bark,Participation, Policy & Urban Poverty, UK,
Carney, Diana (1998) Sustainable Rural Livelihoods-What Contribution Can We Make? Papers presentedat the Department for International Department’sNatural Resource Advisers’ Conference, July 1998,Russel Press Ltd, Nottingham
Central Bank of Sri Lanka (1997), Annual Report –1997, Colombo, Sri Lanka
Central Bank of Sri Lanka (2001), Annual Report,2001, Colombo, Sri Lanka
Central Bank of Sri Lanka (1997), Report onConsumer Finances and Socio-Economic Survey –1996/1997, Colombo, Sri Lanka
Central Bank of Sri Lanka (2000), Report OnConsumer Finances And Socio-Economic Survey,1999/2000, Colombo, Sri Lanka
Central Bank of Sri Lanka (2001), Economic AndSocial Statistics of Sri Lanka - 2001, Colombo, SriLankaChularathna, HMU (October 1999) Urban Poor InColombo, Sri Lanka Status and Directions forDevelopment , SEVANATHA Urban Resource Centre ,Colombo, Sri Lanka
Colombo Municipal Council (1963), Centenary Volume,Colombo, Sri Lanka
Colombo Municipal Council (2001), Municipal BudgetReport, Colombo, Sri Lanka
Colombo Municipal Council & SEVANATHA Urban
Resource Centre (May 1999) City Profile – ColomboSri Lanka, Colombo Consultations Urban ManagementProgramme, Colombo, Sri Lanka
Colombo Municipal Council & SEVANATHA (2002),Poverty Profile – City of Colombo, DFID/UMP/PovertyReduction Project, Colombo, Sri Lanka
De Silva Amarasiri, Wijekoon Ananada, Hormik Robert& Martines Jose (2001) ‘Care Seeking In Sri Lanka :One Possible Explanation for Low Childhood Mortality’,Social Science & Medicine Vol 53 Elsevier Science Ltd
De Silva, Amarasiri (May 2000) Study on PovertyProfile on Colombo Core Area Municipal Councils ofColombo, Sri Jayawardenapura Kotte and Dehiwala MtLavinia, SEVANATHA Urban Resource Center,Colombo, Sri Lanka
Department for International Development (2001),Meeting the Challenge of Poverty in Urban Areas,DfID, London, UK
Department for International Development, ReducingUrban Poverty In India The Evolution of DFID India’sUrban Poverty Reduction Programme DfID, London, UK
Department of Census and Statistics, (2000) StatisticalAbstract, 2000, Ministry of Finance and Planning, SriLanka
Department of Census and Statistics, (2001) StatisticalAbstract, 2001, Ministry of Finance and Planning, SriLanka
Department of Census and Statistics (1871), CensusReport , Ministry of Finance and Planning, Colombo,Sri Lanka
Department of Census and Statistics (1971), CensusReport, Ministry of Finance and Planning, Colombo,Sri Lanka
Department of Census and Statistics, (2001) CensusReport – 2001, Ministry of Finance and Planning, SriLanka
DFID, (Feb 1999) Data & Information on UrbanPoverty – Mission Report [Draft], London, UK
n.a, n.d, Effect of Smoking and Drinking on the FamilyIn A Shanty Community, A Dissertation submitted tothe Sociology Department, University of Colombo, SriLanka
Fonseka, Leo, (November 2000), City DevelopmentStrategy, Colombo, SEVANATHA, Sri Lanka
Ganepola, GAPH (December 1995) Issue Paper onWater Supply & Sanitation Status In Peri- Urban Areas,Ministry of Housing, Construction & Public UtilitiesNational Sector Co- ordination Secretariat, Colombo,Sri Lanka
Urban Slums Reports: The case of Colombo, Sri Lanka
24
Gunarathna, Uditha (1998) Street Children In SriLanka, Sri Lanka Interactive Media Group, Colombo,Sri Lanka
Hasan, Arif (1999) Understanding Karachi Planningand Reform for the Future, CP City Press, Karachi,Pakistan
IIED (April 2000) Poverty Reduction and Urban Governance, Environment & Urbanisation Vol11Number 2, London, UK
IIED – London UK, Environment and Urbanisation’(October 1995) - Urban Poverty II: FromUnderstanding To Action, Vol2 Number 2
IIED – London UK, Environment and Urbanisation’(October 2000) – Civil Society in Action –Transforming Opportunities for the Urban Poor, Vol13Number 2
Jayaratne, KA & Chularathna HMU October 2001Poverty Reduction Through Community Empowerment(A Case Study of Gajabapura – Bo Sevana Low Income Settlement – Colombo) Meeting the Challenge:National Poverty Conference 2001 At BMICH,SEVANATHA Urban Resource Centre, Colombo, SriLanka
Jayaratne, KA , Herath Chularathna , PremakumaraJagath , Arangala Sheela (December 2000)Operation, Maintenance and Sustainability of UrbanServices In Low-income Settlements Colombo, SriLanka, SEVANATHA Urban Resource Center,Colombo, Sri Lanka
Jayaratne KA (January 2001) CATDG Strategic Plan2001 – 2005, Colombo, Sri Lanka
JBIC- Colombo, Concept Document of “Marga Mithuro”(Friends of Roads FOR)
Loughhead Susan, Mittal Onkar & Geofwood (August2001) Urban Poverty & Vulnerability In India,Department for International Development
LUMANTHI : Support Group for Shelter Lalitpur, Nepal,City Consultation Meeting for Poverty Alleviation inLalitpur Sub Metropolitan City, (05th July 1998)
Mallick, Rabial Urban Poverty Vis – A – Vis UrbanGovernance – Case Study of Calcutta & Delhi, CISRS– Calcutta, India
Miles N and J Simpson (31st October 1999) ADiscussion Report for DFID (UK) and the World Bank– Draft – Confidential to DFID and World Bank, GHKInternational Ltd
Ministry of Local Government, Housing andConstruction (1979), Policy Paper – Slum and ShantyUpgrading in Colombo Municipal Council, Sri Lanka
Ministry of Local Government, Housing andConstruction (1984), Upgrading Steps, Colombo, SriLanka
Ministry of Policy Planning & Implementation , A planof Action for the Children of Sri Lanka, NationalPlanning Department, (1991), Colombo, Sri Lanka
Moser Caroline, Gatehouse Michael and Garcia Helen(September 1996) Urban Poverty ResearchSourcebook Module I : Sub – City Level HouseholdSurvey, Urban Management Programme UNDP /UNCHS (Habitat) / World Bank
National Dangerous Drugs Control Board- Sri Lanka,Drug Abuse Monitoring System (December 2001) –Report on Drug Users From Treatment Facilities April –June2001
National Dangerous Drugs Control Board- Sri Lanka,Drug Abuse Monitoring System (June 2001) – Reporton Drug Related Arrests July – December2000
National Housing Development Authority & NationalWater Supply & Drainage Board, Sri Lanka-Evaluationof Low Cost Sanitation Projects, (December 1992)
Pantoja, Enrique (January 2000) The Challenge ofUrban Development in Sri Lanka An Urban SectorConcept Note, Sri Lanka Urban and Water ProgramInfrastructure Sector Unit South Asia Region TheWorld Bank
Phnom Penh Urban Poverty Reduction Programme,Monitoring, Impact Assessment, Information &Communication – Participatory Tools & Techniques forPME Field Work (November 2001
Phnom Penh Urban Poverty Reduction Programme,Urban Poverty Reduction In Phnom Penh – AConcept Note (Draft) June 1999
Porter Ian C (November 2001) Thailand Social MonitorPoverty and Public Policy, The World Bank
Poverty Reduction In South Asia PromotingParticipation by the Poor – Summary of an InformalWorkshop Cosponsored by the World Bank & SAARC,(April1994) October 12 – 15
Premakumara,DGJ, (2001), Community ManagedSettlement Upgrading in Colombo: Case Study inPoorwarama Settlement, SEVANATHA, Colombo, SriLanka
Premakumara,DGJ, (2001), Community BasedInfrastructure Improvement in Swarna Road – Stage II Low-income Settlement in Colombo,SEVANATHA, Colombo, Sri Lanka Proceedings of South Asia Urban Forum, A StrategicApproach to Urban Operations, (June 24, 1999)Washington, DC
UNDERSTANDING SLUMS: Case Stud ies fo r the G loba l Repor t on Human Set t lements 2003
25
Prof. Mendis, W. (1998), Improving Urban LandManagement in Sri Lanka, an article in "Urban LandManagement - Improving Policies & Practices inDeveloping Countries of Asia" edited by Jamal H.Ansari & Nathaniel Von Einsiedel, Oxford & IBHPublishing Co.Pvt.Ltd. - New Delhi, India.
Prof Siddhisena, KAP & Dr Dissanayake, Lakshman(September 1998) A Census of Street People In theColombo municipal Council Area, Department of Demography, University of Colombo, Sri Lanka
Ratnayake Y & Senanayake Bhadrani (2000) HandBook of Drug Abuse Information 1996 – 2000, NationalDangerous Drugs Control Board, Colombo, Sri Lanka
Ratnayake, Y (1999) Hand Book of Drug AbuseInformation 1994 – 1998, Research and Publications Division – National Dangerous DrugsControl Board, Colombo, Sri Lanka
Salim, Maryam (September 2001) ‘Social FundsInnovation Updates’ – The Thailand Social Investment Fund: Providing Social Assistance &Building Social Capital, Social Funds Thematic Groupof the Human Development Network – Social Protection, Vol 1, No1
SEVANATHA – Urban Resource Centre (2002),Partnership to Improve Access and Quality of PublicTransport – Case Study of Colombo, Sri Lanka
SEVANATHA – Urban Resource Centre (2000),Operation, Maintenance and Sustainability of UrbanServices in Low-income Settlements, Colombo, SriLanka
SEVANATHA – Urban Resource Centre , (2001), ASurvey To Determine The Level of Improvements of low-income Settlements In Colombo, Sri Lanka
SEVANATHA – Urban Resource Centre , (2001)Colombo Core Area City Development Strategy –Strategic Development Frame, 2000/2001, Colombo,Sri Lanka
SEVANATHA – Urban Resource Centre , (2001),Urban poverty Reduction Through Community Empowerment In Colombo Municipal Council –Concept Paper, Colombo, Sri Lanka
SEVANATHA Urban Resource Centre (1990),Community Managed Sewer Disposal System Process and Progress, A Community Project Executedby SEVANATHA with the Assistance of JapanEmbassy Small Scale Grant Scheme (SSGS),Colombo, Sri Lanka
Sohail M , Cavill S & Cotton AP (2001) OperationMaintenance and Sustainability of Services for the Urban Poor – Part A : Summary Interim Findings andLessons Learnt, WEDC, Loughborough University, UKSohail M, Cavill S & Cotton AP (2001) Operation,
Maintenance and Sustainability of Services for theUrban Poor, Findings-Part B (Case Studies andAnalysis), WEDC, Loughborough University, UK
Speech by Mr Tan Zhonghi Mayor of the City ofChangsha, PR Chaina at the Asian City Development Strategy Conference, 2000 Fukuoka,Japan (July 2000)
Sri Lanka: A Frame Work For Poverty Reduction,(November 2000)
Sustainable Cities Programme, Urban Air QualityManagement – Final Draft – August 2000, Colombo,Sri Lanka
Sustainable Township Programme (1998), SurveyReport of Urban Low-income Settlements of Colombo,Sri Lanka
UNDP / UNCHS Community Water Supply andSanitation Project - Needs Assessment Survey, (March1997)
UNDP, South Asia Poverty Alleviation Programme –Progress Report 1997 – 1998,
United Nations Centre for Human Settlements(Habitat), Guidelines for the Poverty Profile –Capacity Building for Sustainable Urban Developmentin Ethiopia [Doc1: Draft for Discussion]
United Nations Centre for Human Settlements(UNCHS), Poverty Analysis in Phnom Penh – Individual reports Series [Report 6: Day Krahom (TheRed Land) 1999
Urban Development Authority (1996), Land UseSurvey, Colombo, Sri Lanka
Vanderschueren Franz, Emiel Wegelin, & KadmielWekwete (1996) Policy Programme Options for UrbanPoverty Reduction A Frame Work for Action at theMunicipal Level, Urban Management programmeUNDP / UNCHS (Habitat) / World Bank
Wignaraja, Ponna (1990) Women, Poverty andResources, SAGE Publications, India
Chularathna , HMU (01st October 2001) PelpathwalinThora Nagara : Apata Langa Kara Gatha HekiIlakkayakda? (Cities without Slums: How we canachieve?) (In Native Language), SEVANATHA UrbanResource Centre, Colombo, Sri Lanka
Nagarika Adu Adayam Janawasa WargeekaranayaKireeme Nirnayaka (Niyamaka Vyapruthiya, DisNo 3 & 4) [In Native language] – Urban PovertyReduction Project – Colombo Municipal Council(September 2001) SEVANATHA Urban ResourceCenter, Colombo, Sri Lanka
Ministry of Forest & Environment - Sri Lanka , Sri
Urban Slums Reports: The case of Colombo, SriLanka
26
Lankawe Palath Palana Ayathana Magin BeheraKaranu Labana Ghana Apadrawya Pilibanda DattaPaddatiya (In Native Language) (December 1999),Colombo, Sri Lanka
Sthrie Purusha Bhavaya, Wayasa, Agama,Janawargaya Anuwa Distrikka Saha Pra Le Kottashawala Janagahanaya (Yawakalika) (In NativeLanguage) - Census of Population and Housing2001, (2001) Department of Census and Statistics – Ministry of Finance and Planning , Colombo, Sri Lanka
UNDERSTANDING SLUMS: Case Stud ies fo r the G loba l Repor t on Human Set t lements 2003
27