cold ironing - american association of port … · jh004726a.ppt 2 air emissions contrast cold...
TRANSCRIPT
Emissions Reduction Alternativefor Cruise Ships while in Port
COLD IRONING
DOCK WATTS LCCCruise Workshop
New Orleans, February 17, 2004
1JH004726a.ppt
WHY NOW?• Significant port growth
• Serious health impacts from air pollution
• Ports under pressure to reduce emissions
• Many options to reduce emissions
• Cold Ironing is proven technology that works today

2JH004726a.ppt
AIR EMISSIONS CONTRASTCold Ironing (a.k.a. “shore power”) virtually eliminates emissions from ship aux engines.
Ship Aux Engines Gas Fired Power Plant Percent lb/MWh lb/MWh Reduction
NOx 32.4 0.123 99.6 %
SOx 27.1 0.007 99.9 %
Particulate 1.8 0.025 98.6 %
CO2 1,591.7 810.000 49.1 %
HC and VOC 0.9 0.067 92.6 %• HFO oil ship auxiliary engine emissions based on July 2002 Entec Report prepared for European Community
• Power plant emissions based on Siemans-Westinghouse 2x1 F gas fired combined cycle with Dry Low NOx and SCR
3JH004726a.ppt
WHY CRUISE SHIPS?
• High electric demand while in port (MW)
• High frequency of port calls for same ship (hours)
• High annual electric requirements (MWh)
MWh = Air Emissions
4JH004726a.ppt
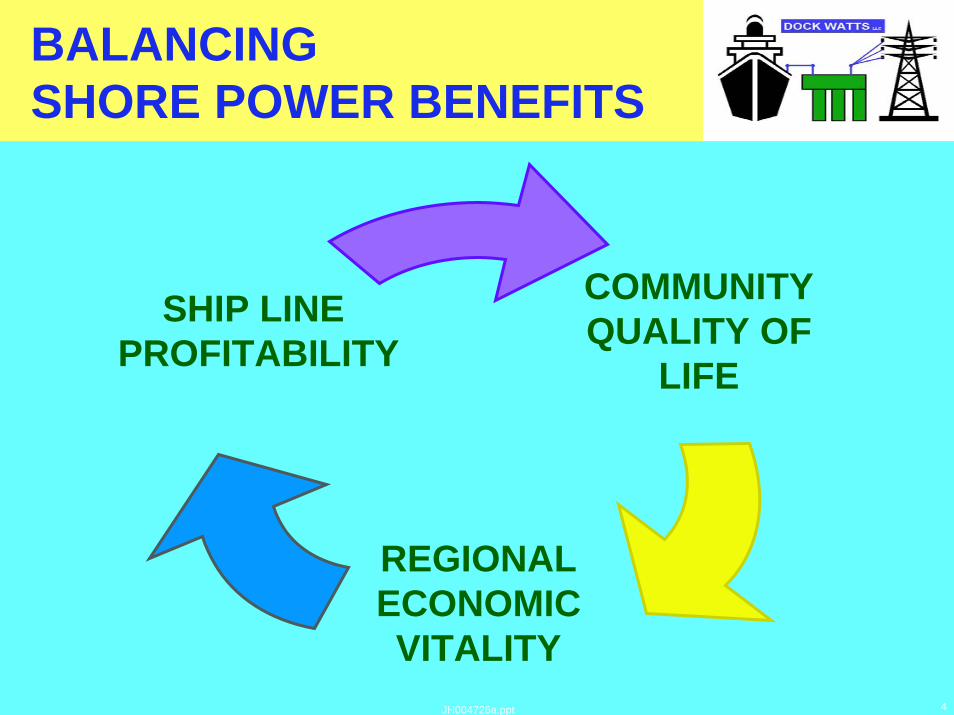
BALANCING SHORE POWER BENEFITS
COMMUNITYQUALITY OF
LIFE
REGIONALECONOMICVITALITY
SHIP LINE PROFITABILITY

5JH004726a.ppt
FORMULA FOR SUCCESS
• Customize solutions – not one size fits all
• Key components for shore power success:
– Development focus and project management
– Willing and capable landlord (port authority)
– Support of Public Agencies (regulators)
– Economical power supply (utility)
6JH004726a.ppt
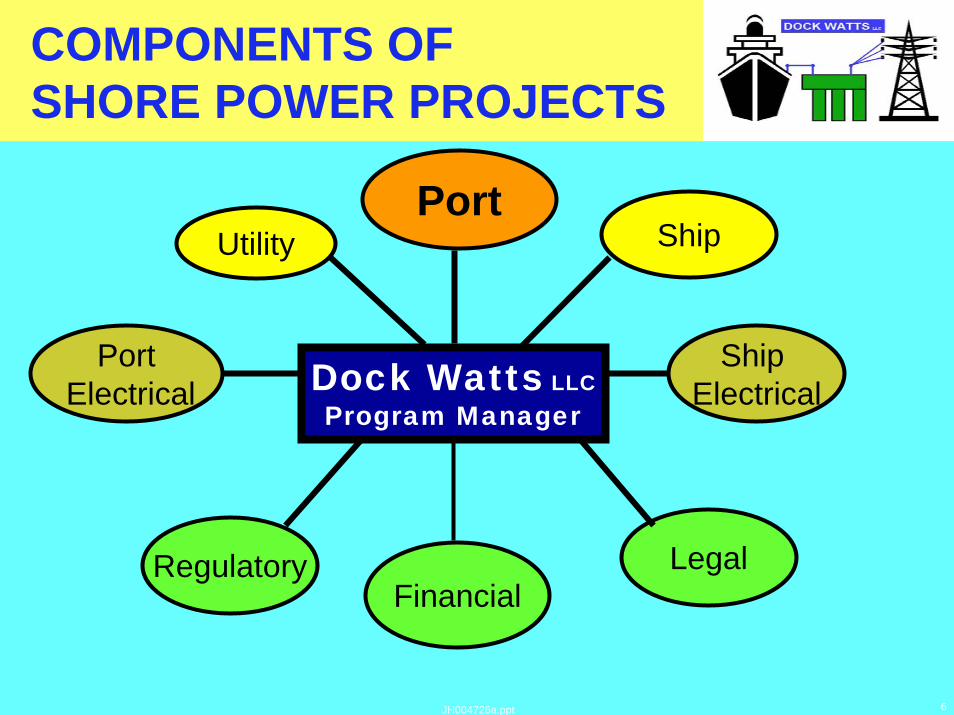
COMPONENTS OFSHORE POWER PROJECTS
Dock Watts LLCProgram Manager
Regulatory
Ship
FinancialLegal
PortElectrical
Ship Electrical
UtilityPort

7JH004726a.ppt
DOCK WATTS’DEVELOPMENT MODEL• Select optimal candidates (ports & ships)
• Optimize design
– Ship on-board equipment; minimize cost, maximize portability
– Connection between ship and port (cable management system)
– Port/terminal electric facilities (distribution, utility interface)
• Capture economic value from emission reductions
• Finance project
• Negotiate economical power supply
8JH004726a.ppt
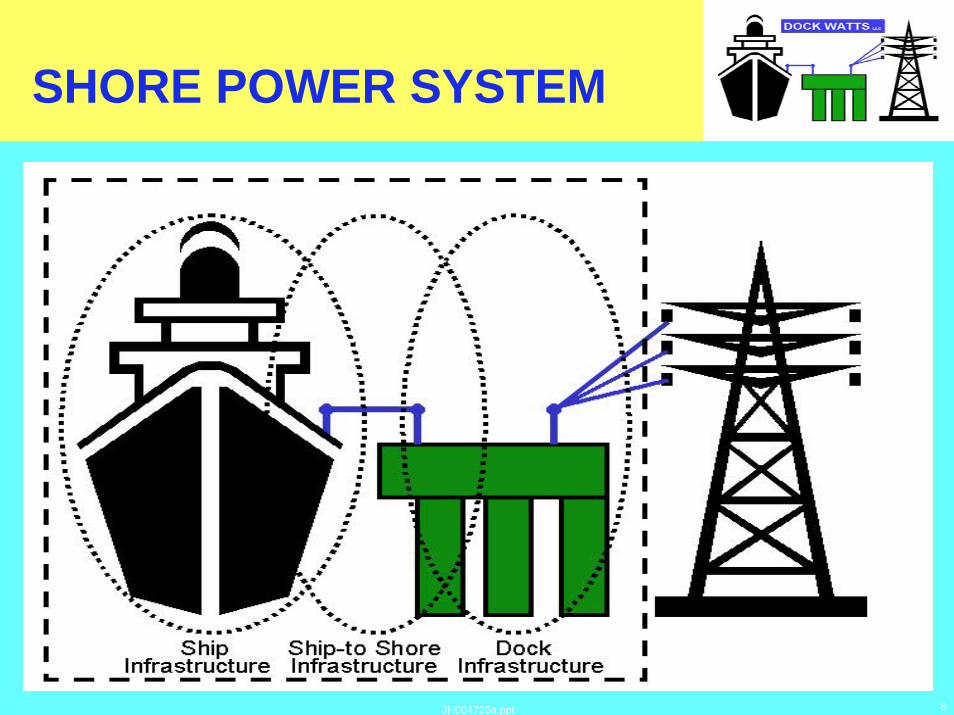
SHORE POWER SYSTEM
9JH004726a.ppt
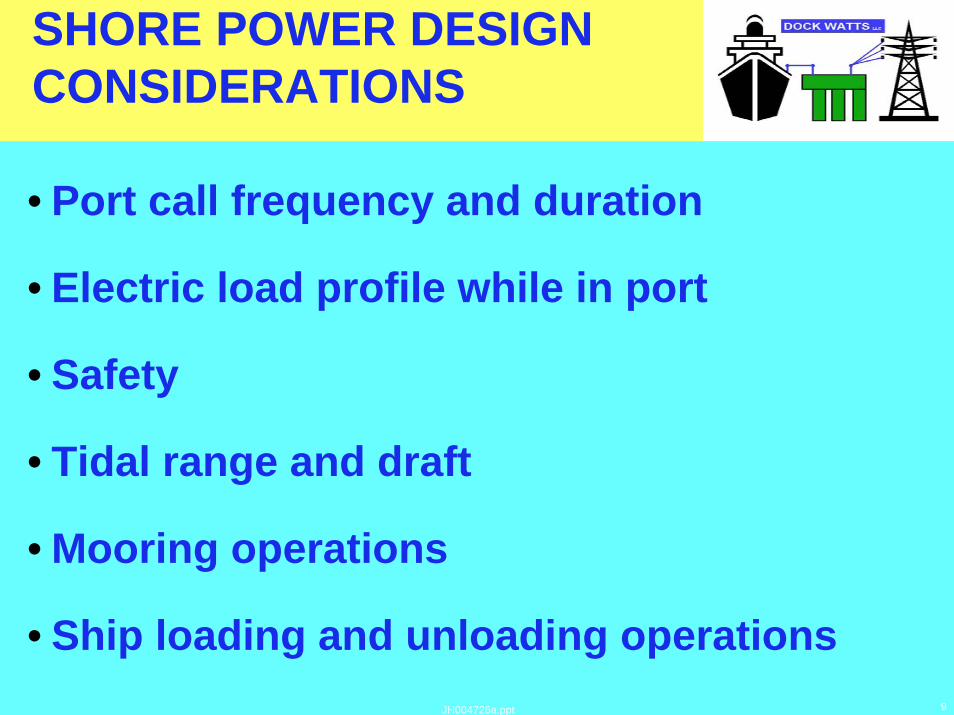
SHORE POWER DESIGN CONSIDERATIONS
• Port call frequency and duration
• Electric load profile while in port
• Safety
• Tidal range and draft
• Mooring operations
• Ship loading and unloading operations
10JH004726a.ppt
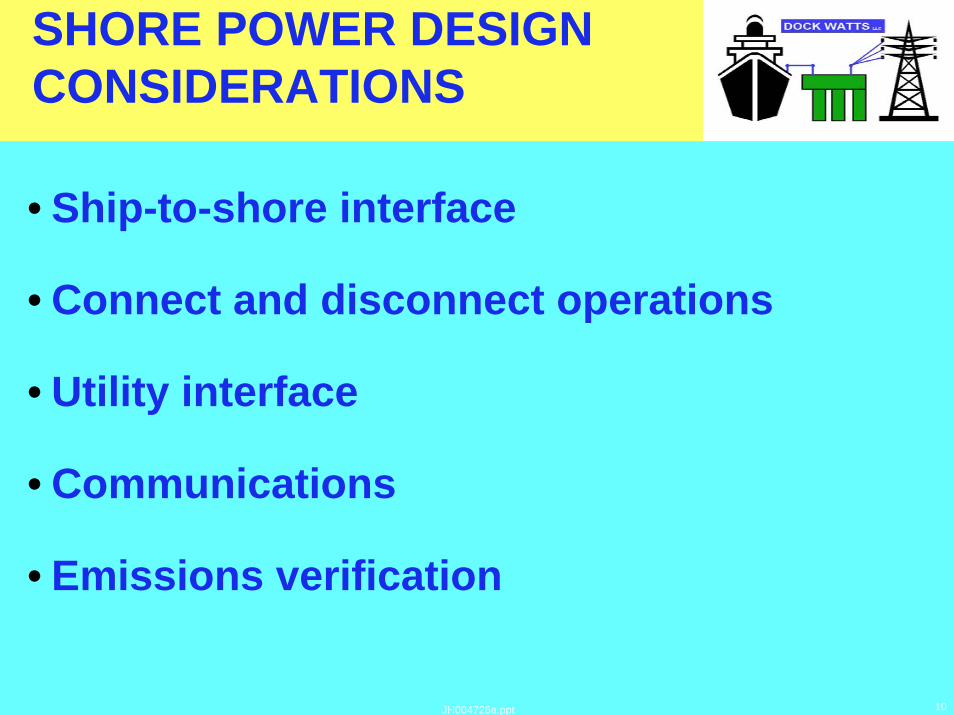
SHORE POWER DESIGN CONSIDERATIONS
• Ship-to-shore interface
• Connect and disconnect operations
• Utility interface
• Communications
• Emissions verification
11JH004726a.ppt
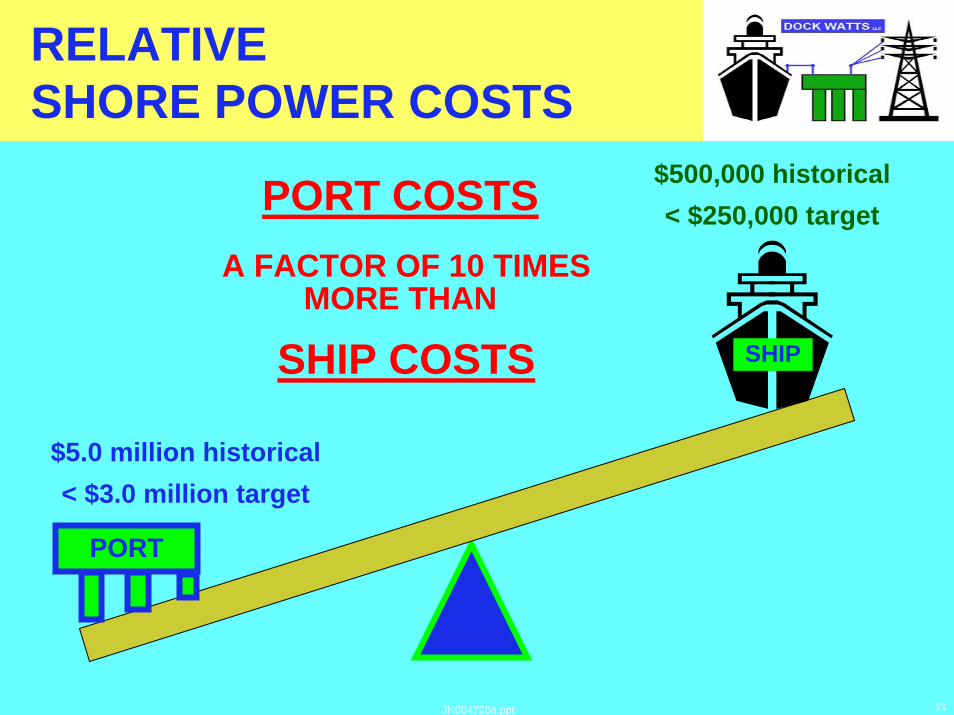
RELATIVESHORE POWER COSTS
PORT
SHIP
$5.0 million historical< $3.0 million target
$500,000 historical< $250,000 targetPORT COSTS
A FACTOR OF 10 TIMES MORE THAN
SHIP COSTS
12JH004726a.ppt
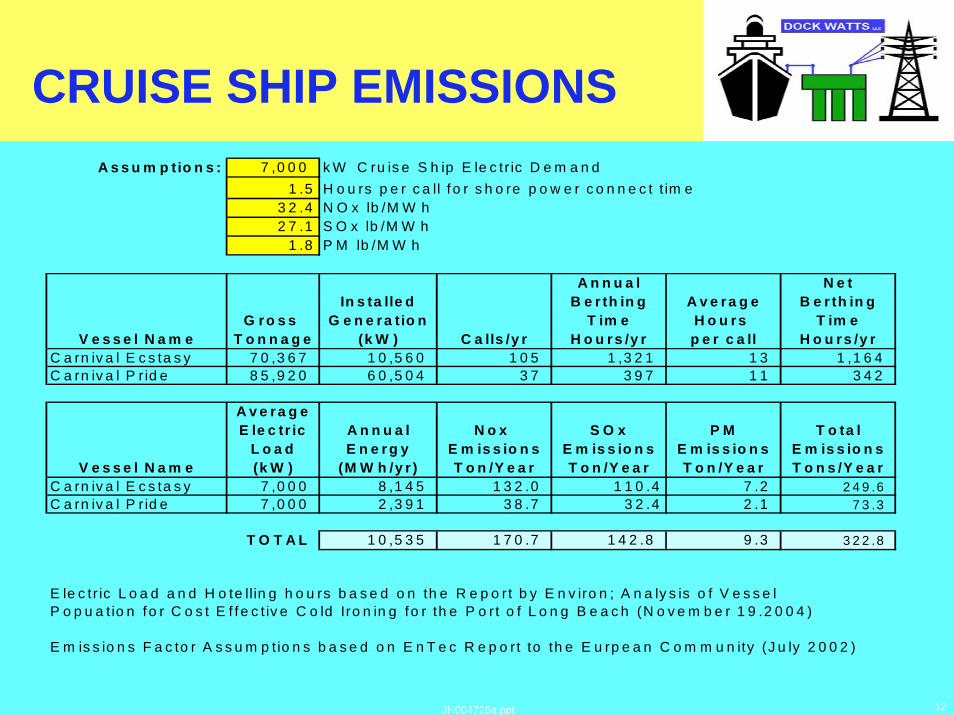
CRUISE SHIP EMISSIONSA s s u m p tio n s : 7 ,0 0 0 k W C ru is e S h ip E le c tr ic D e m a n d
1 .5 H o u rs p e r c a ll f o r s h o re p o w e r c o n n e c t t im e 3 2 .4 N O x lb /M W h 2 7 .1 S O x lb /M W h
1 .8 P M lb /M W h
A n n u a l N e tIn s ta lle d B e r th in g A v e r a g e B e r th in g
G ro s s G e n e ra t io n T im e H o u rs T im eV e s s e l N a m e T o n n a g e (k W ) C a lls /y r H o u r s /y r p e r c a ll H o u rs /y r
C a rn iv a l E c s ta s y 7 0 ,3 6 7 1 0 ,5 6 0 1 0 5 1 ,3 2 1 1 3 1 ,1 6 4 C a rn iv a l P r id e 8 5 ,9 2 0 6 0 ,5 0 4 3 7 3 9 7 1 1 3 4 2
A v e r a g eE le c tr ic A n n u a l N o x S O x P M T o ta l
L o a d E n e r g y E m is s io n s E m is s io n s E m is s io n s E m is s io n sV e s s e l N a m e (k W ) (M W h /y r ) T o n /Y e a r T o n /Y e a r T o n /Y e a r T o n s /Y e a r
C a rn iv a l E c s ta s y 7 ,0 0 0 8 ,1 4 5 1 3 2 .0 1 1 0 .4 7 .2 2 4 9 .6 C a rn iv a l P r id e 7 ,0 0 0 2 ,3 9 1 3 8 .7 3 2 .4 2 .1 7 3 .3
T O T A L 1 0 ,5 3 5 1 7 0 .7 1 4 2 .8 9 .3 3 2 2 .8
E le c tr ic L o a d a n d H o te llin g h o u rs b a s e d o n th e R e p o rt b y E n v iro n ; A n a ly s is o f V e s s e lP o p u a t io n f o r C o s t E f f e c t iv e C o ld Iro n in g fo r th e P o rt o f L o n g B e a c h (N o v e m b e r 1 9 .2 0 0 4 )
E m is s io n s F a c to r A s s u m p t io n s b a s e d o n E n T e c R e p o rt to th e E u rp e a n C o m m u n ity (J u ly 2 0 0 2 )

13JH004726a.ppt
ESTIMATED COST EFFECTIVENESS
ASSUMPTIONS: Shore Side Cost $5,000,000 Per Berth 1 BerthShip Side Cost $500,000 Per Ship 2 Ships
Emissions Reduction Period 5 Years
Net AnnualBerthing Total Nox SOx PM Total
Time Energy Emissions Emissions Emissions EmissionsVessel Name Calls/yr Hours/yr (MWh/yr) Ton/Year Ton/Year Ton/Year Tons/Year
Carnival Ecstasy 1,321 1,164 8,145 132.0 110.4 7.2 249.6 Carnival Pride 397 342 2,391 38.7 32.4 2.1 73.3
TOTAL 170.7 142.8 9.3 322.8
Berth Cost $5,000,000 5 Years NOx Emissions 854 tons NOx Cost/Ton $7,030Ship Cost $1,000,000 5 Years SOx Emissions 714 tons SOx Cost/Ton $8,401Total Cost $6,000,000 5 Years PM Emissions 46 tons PM Cost/Ton $129,169
5 Years Total Emissions 1,614 tons Total Cost/Ton $3,717
* Estimated cost effectiveness based solely on assumed capital cost of facilities and does not reflect operating cost. * Operating cost would include net power cost, connection operations, and facilities maintenance. * Net power cost should reflect difference between the cost of utility supplied power and ship costs to generate on-board power.
Annual emissions based on ship electric load data presented in the November 19, 2004 Environ Report to the Port of Long Beach and emissions factors presented in the July 2002 Entec report to the European Community
14JH004726a.ppt
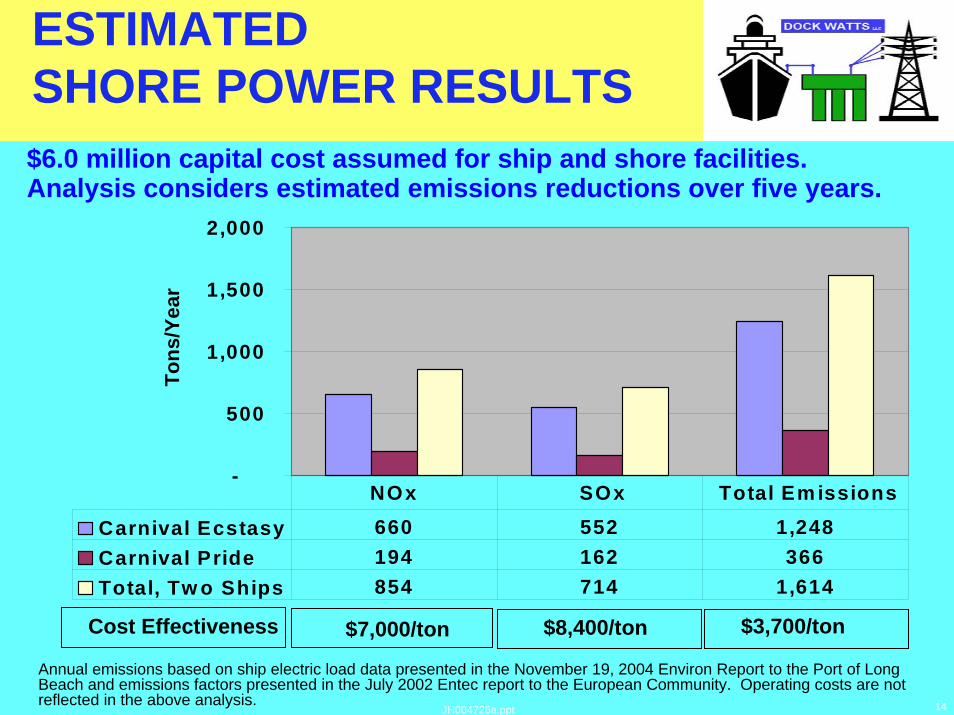
ESTIMATED SHORE POWER RESULTS
Cost Effectiveness $7,000/ton $8,400/ton
$6.0 million capital cost assumed for ship and shore facilities.Analysis considers estimated emissions reductions over five years.
$3,700/ton
-
500
1,000
1,500
2,000
Tons
/Yea
r
Carnival Ecstasy 660 552 1,248 Carnival Pride 194 162 366 Total, Tw o Ships 854 714 1,614
NOx SOx Total Em issions
Annual emissions based on ship electric load data presented in the November 19, 2004 Environ Report to the Port of Long Beach and emissions factors presented in the July 2002 Entec report to the European Community. Operating costs are not reflected in the above analysis.
15JH004726a.ppt
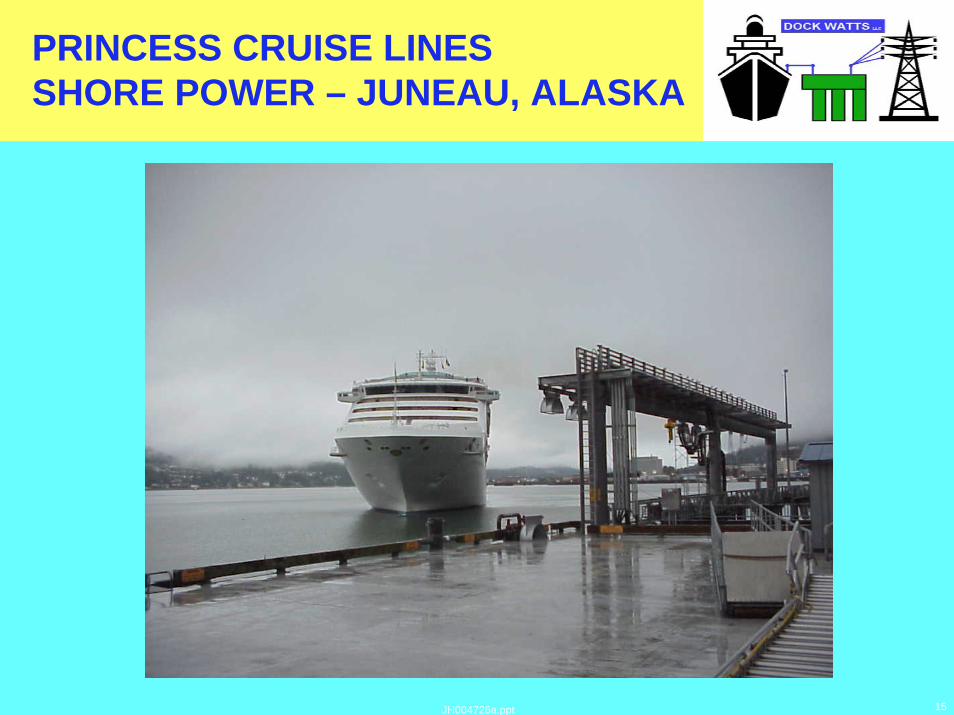
PRINCESS CRUISE LINES SHORE POWER – JUNEAU, ALASKA
16JH004726a.ppt
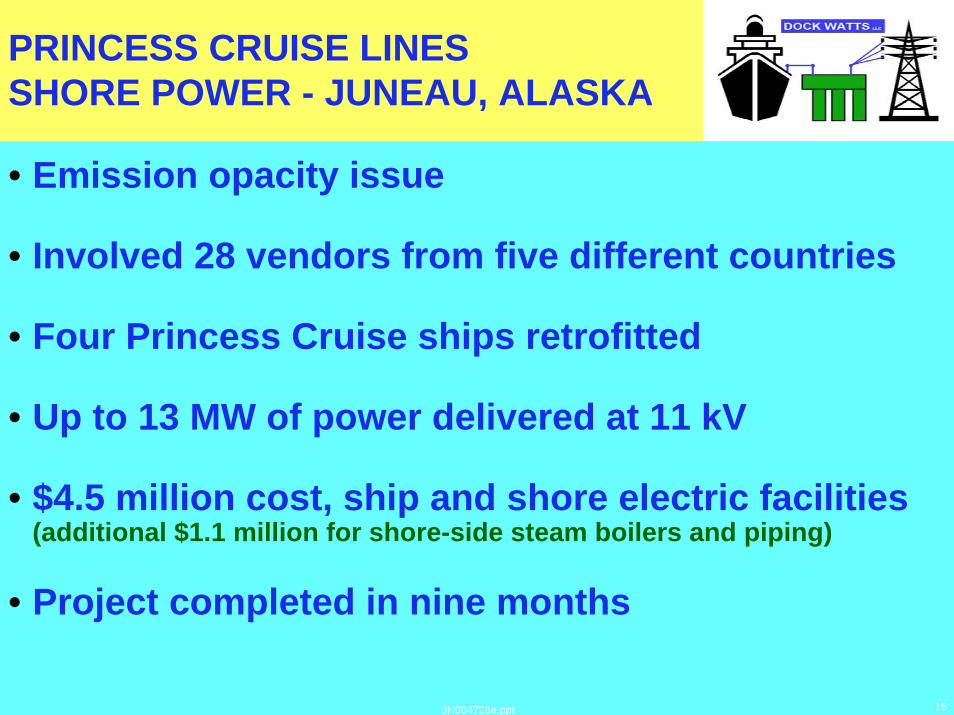
PRINCESS CRUISE LINESSHORE POWER - JUNEAU, ALASKA
• Emission opacity issue
• Involved 28 vendors from five different countries
• Four Princess Cruise ships retrofitted
• Up to 13 MW of power delivered at 11 kV
• $4.5 million cost, ship and shore electric facilities (additional $1.1 million for shore-side steam boilers and piping)
• Project completed in nine months

17JH004726a.ppt
JUNEAU PROJECT TECHNICAL COMPONENTS
• Shore side electric substation
• Cable management system
• Ship modifications
• Synchronized power transfer equipment
• Shore side steam boiler and piping(not recommended for future cruise ship shore power project)

18JH004726a.ppt
CABLE MANAGEMENT SYSTEMJUNEAU, ALASKA

19JH004726a.ppt
MAKING THE CONNECTIONJUNEAU, ALASKA
20JH004726a.ppt
PROACTIVE INDUSTRY ADVOCACY
• Influence air quality regulations
• Capture emission reductions value
• Establish shore power standards
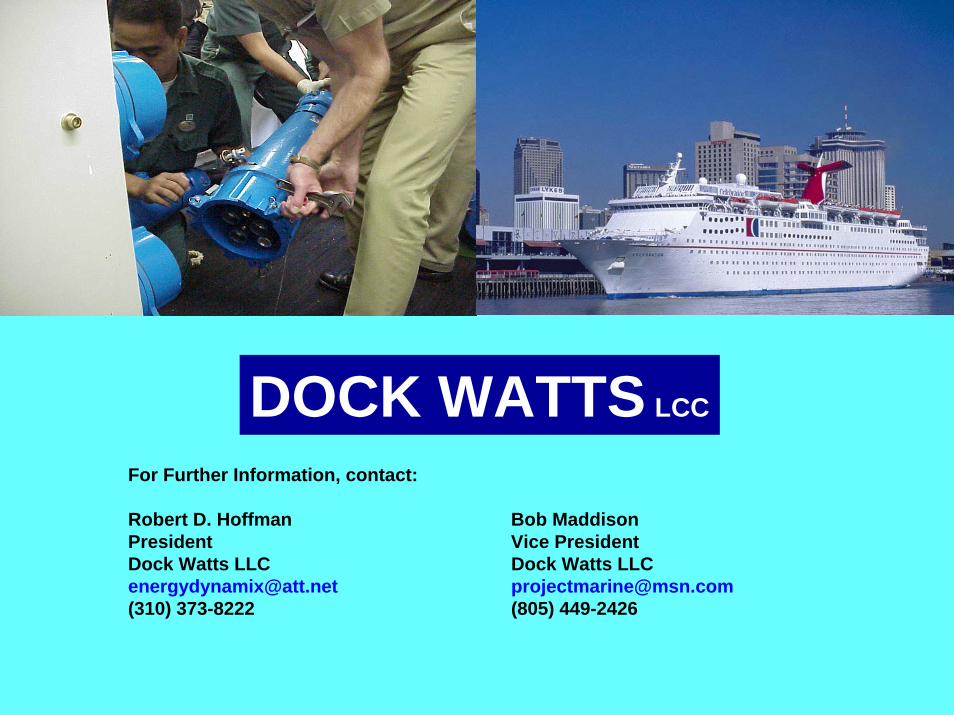
DOCK WATTS LCC
For Further Information, contact:
Robert D. Hoffman Bob MaddisonPresident Vice PresidentDock Watts LLC Dock Watts [email protected] [email protected](310) 373-8222 (805) 449-2426