coke cases
TRANSCRIPT
The Coca-Cola Company
� Develops products� Produces the advertising and
programs to support those products, and
� Sells syrup concentrate to Coca-Cola Enterprises and other bottlers, etc.
Coca Cola Enterprises
� Combines the product concentrate with other ingredients to manufacture and package our beverages.
� Markets and distributes products to retail customers and consumers.
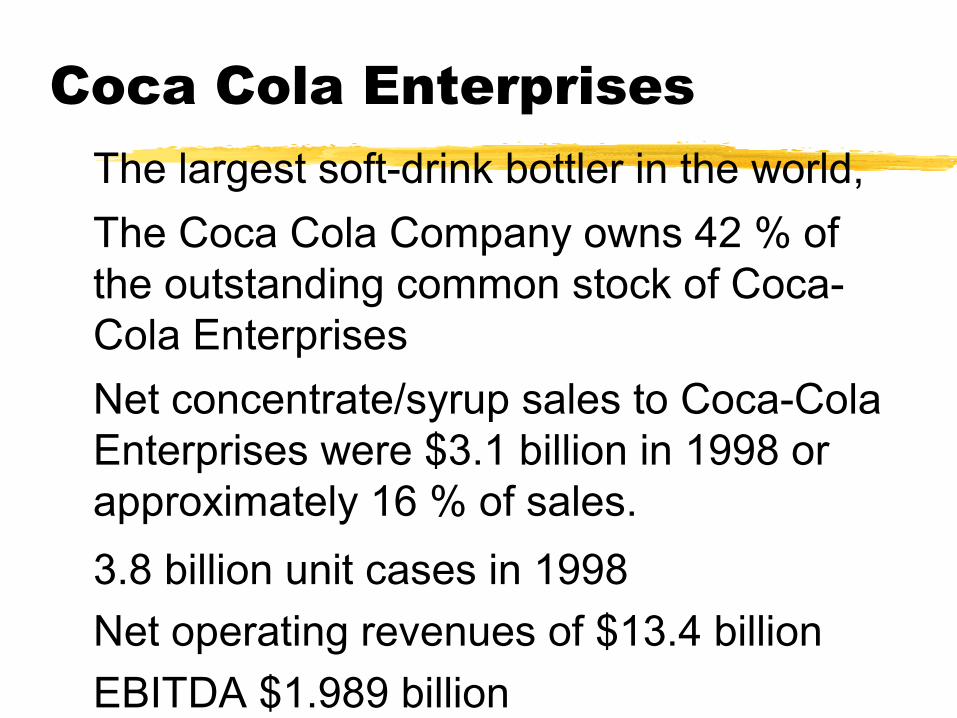
Coca Cola Enterprises� The largest soft-drink bottler in the world,
� The Coca Cola Company owns 42 % of the outstanding common stock of Coca-Cola Enterprises
� Net concentrate/syrup sales to Coca-Cola Enterprises were $3.1 billion in 1998 or approximately 16 % of sales.
� 3.8 billion unit cases in 1998� Net operating revenues of $13.4 billion� EBITDA $1.989 billion
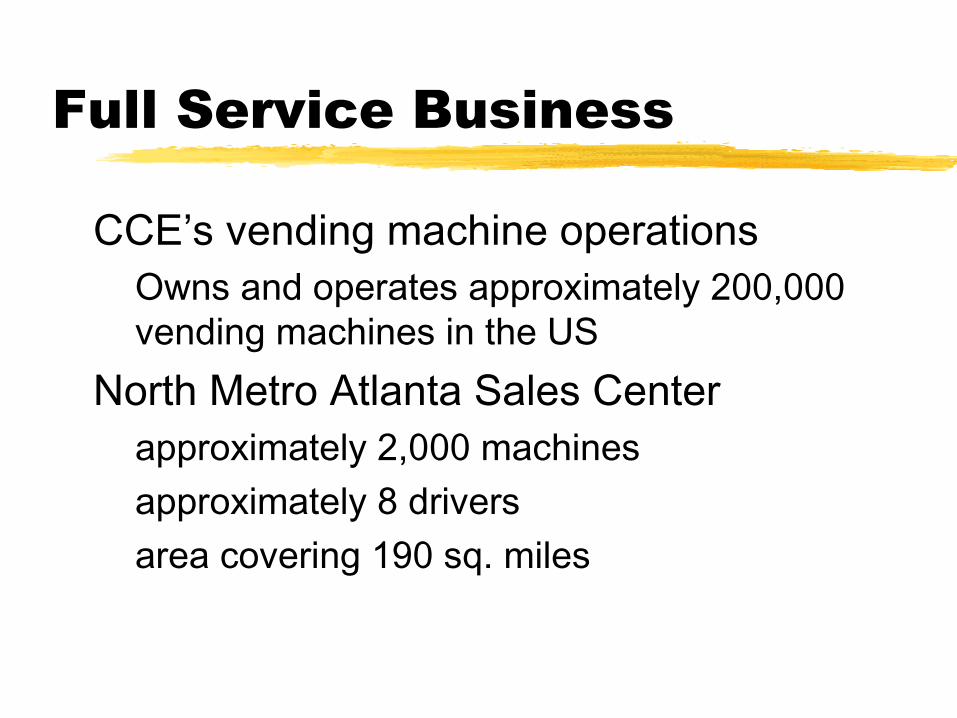
Full Service Business
� CCE’s vending machine operations� Owns and operates approximately 200,000
vending machines in the US� North Metro Atlanta Sales Center
� approximately 2,000 machines� approximately 8 drivers� area covering 190 sq. miles
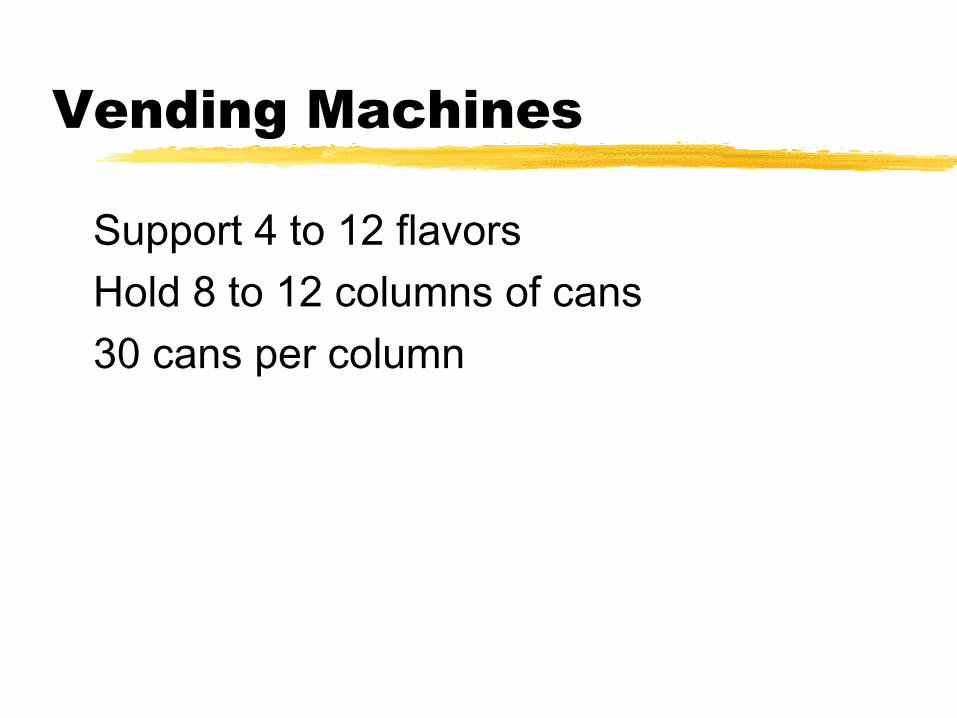
Vending Machines
� Support 4 to 12 flavors� Hold 8 to 12 columns of cans� 30 cans per column
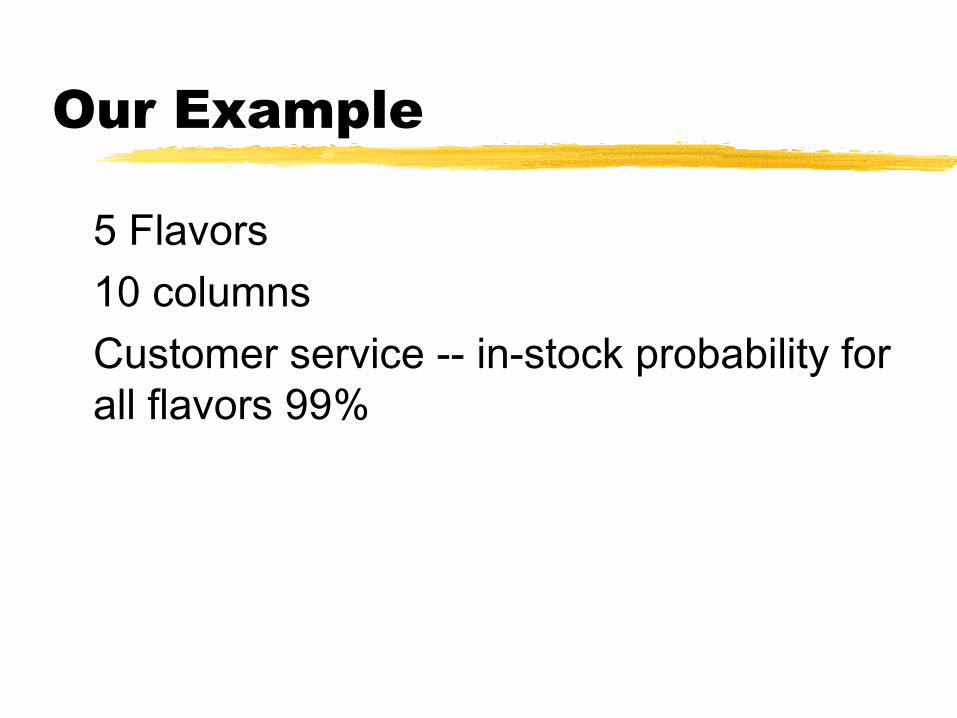
Our Example
� 5 Flavors� 10 columns� Customer service -- in-stock probability for
all flavors 99%
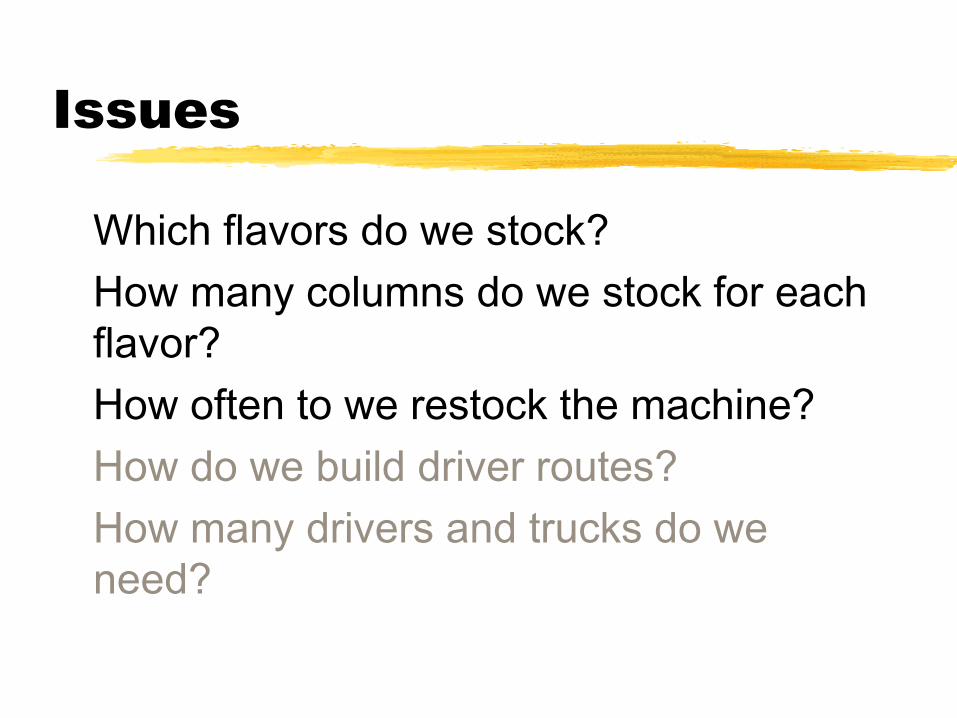
Issues
� Which flavors do we stock?� How many columns do we stock for each
flavor?� How often to we restock the machine?� How do we build driver routes?� How many drivers and trucks do we
need?
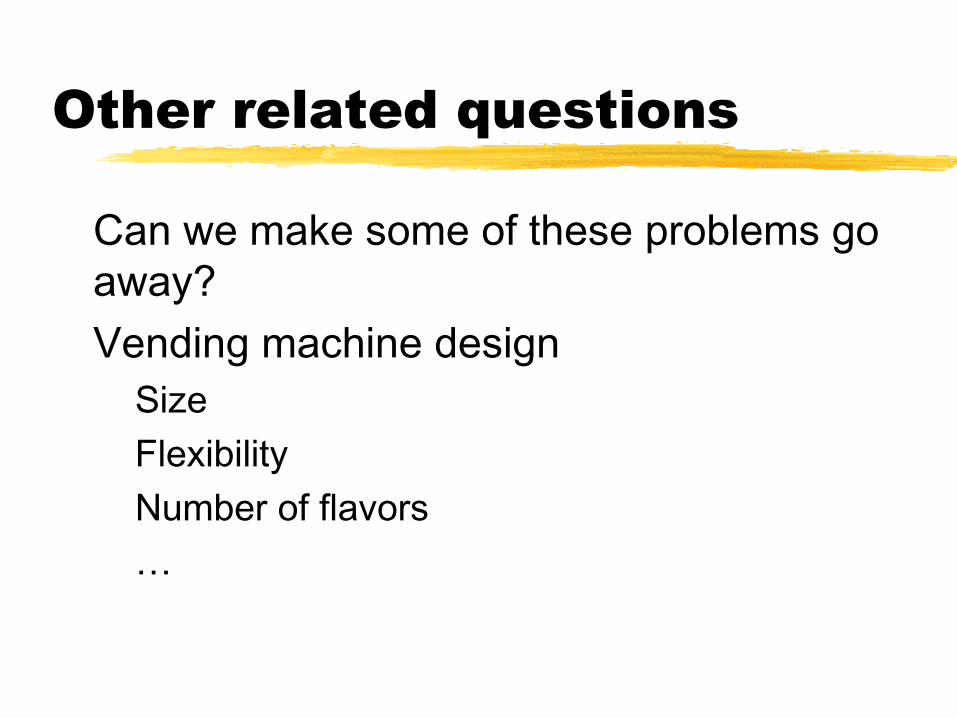
Other related questions
� Can we make some of these problems go away?
� Vending machine design� Size� Flexibility� Number of flavors� …
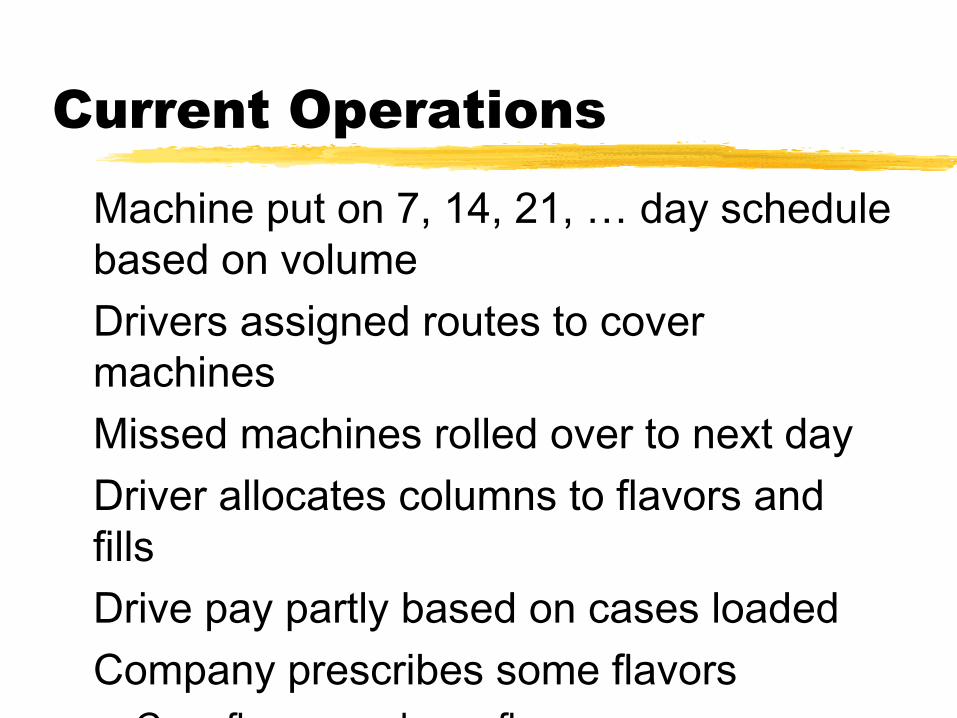
Current Operations� Machine put on 7, 14, 21, … day schedule
based on volume� Drivers assigned routes to cover
machines� Missed machines rolled over to next day� Driver allocates columns to flavors and
fills � Drive pay partly based on cases loaded� Company prescribes some flavors
� Core flavors and new flavors
Which flavors do we stock?
� What are the drivers?� Revenue� � �
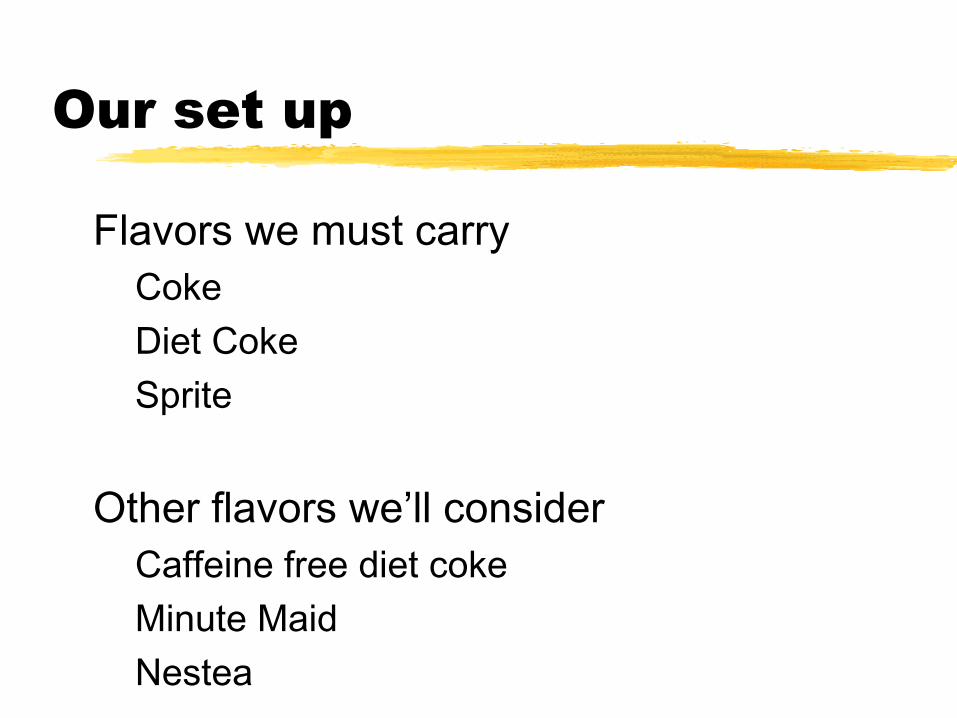
Our set up
� Flavors we must carry� Coke� Diet Coke� Sprite
� Other flavors we’ll consider� Caffeine free diet coke� Minute Maid� Nestea
What data do we need?
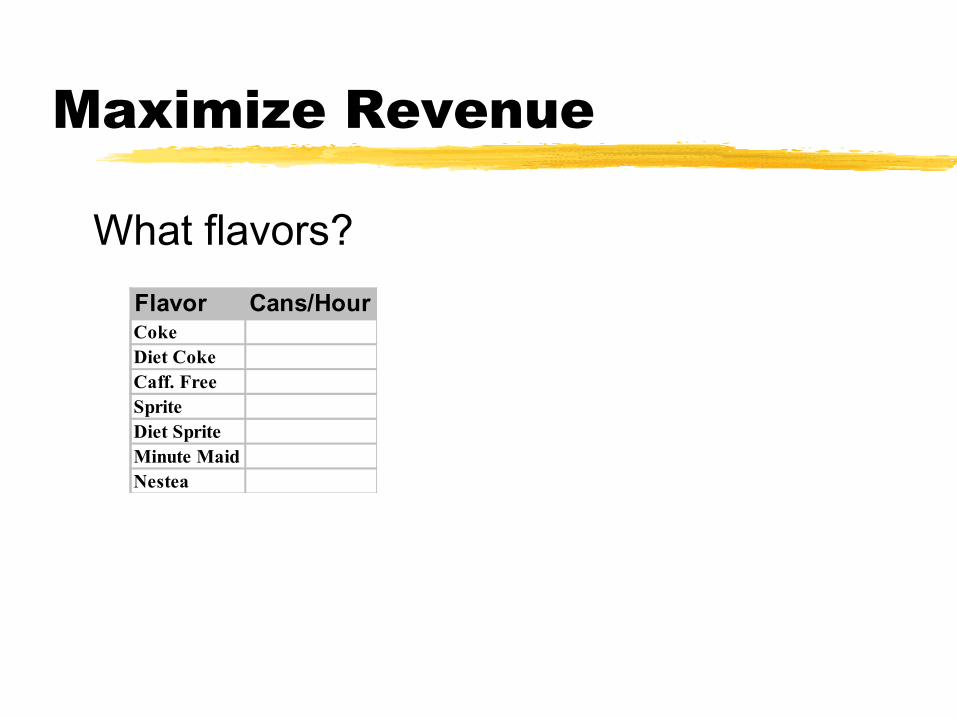
Maximize Revenue
� What flavors?Flavor Cans/HourCokeDiet CokeCaff. FreeSpriteDiet SpriteMinute MaidNestea
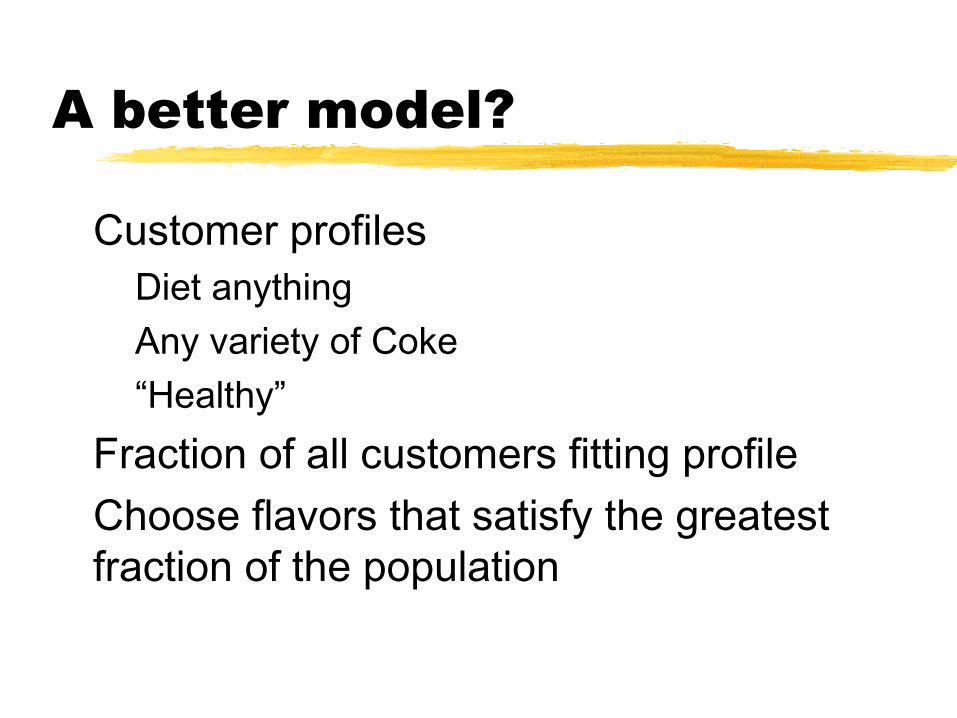
A better model?
� Customer profiles� Diet anything � Any variety of Coke� “Healthy”
� Fraction of all customers fitting profile� Choose flavors that satisfy the greatest
fraction of the population
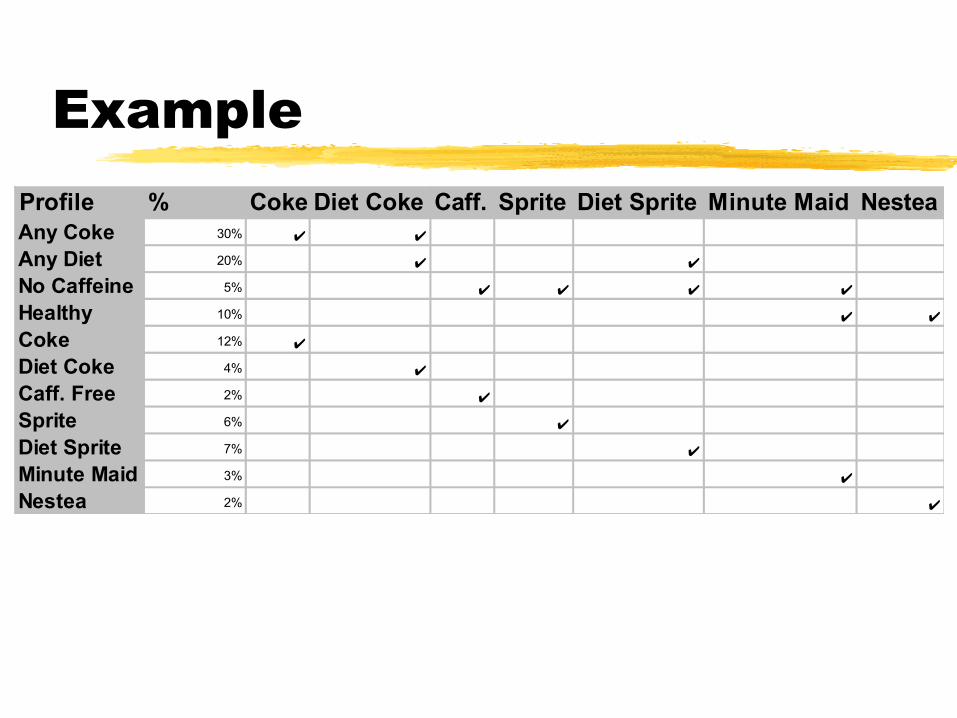
ExampleProfile % Coke Diet Coke Caff. FreeSprite Diet Sprite Minute Maid NesteaAny Coke 30% ✔ ✔
Any Diet 20% ✔ ✔
No Caffeine 5% ✔ ✔ ✔ ✔
Healthy 10% ✔ ✔
Coke 12% ✔
Diet Coke 4% ✔
Caff. Free 2% ✔
Sprite 6% ✔
Diet Sprite 7% ✔
Minute Maid 3% ✔
Nestea 2% ✔
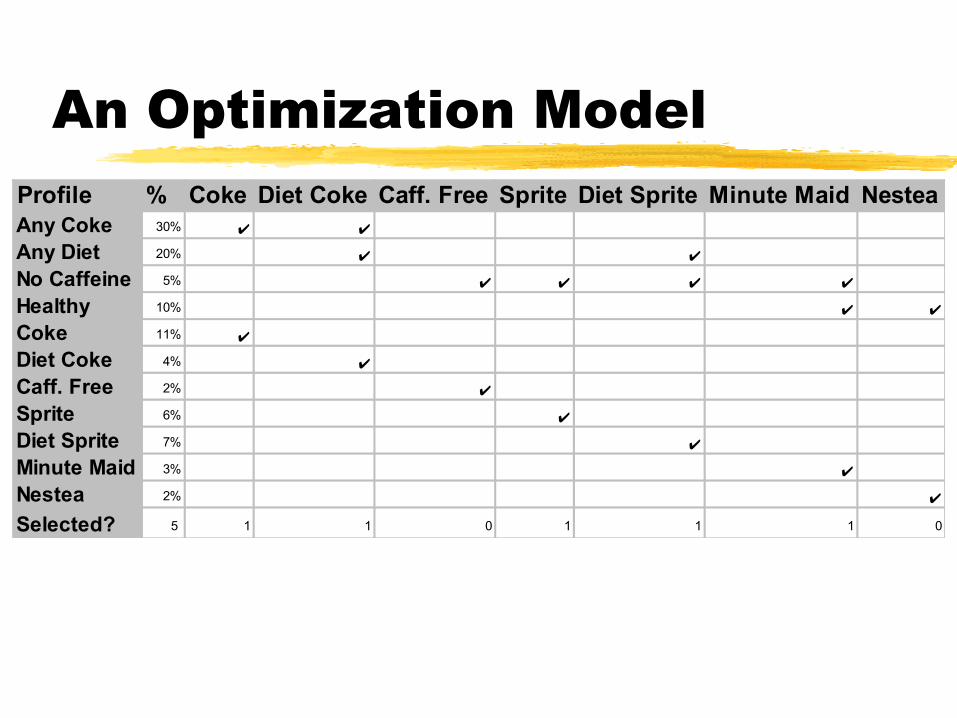
An Optimization Model Profile % Coke Diet Coke Caff. Free Sprite Diet Sprite Minute Maid NesteaAny Coke 30% ✔ ✔
Any Diet 20% ✔ ✔
No Caffeine 5% ✔ ✔ ✔ ✔
Healthy 10% ✔ ✔
Coke 11% ✔
Diet Coke 4% ✔
Caff. Free 2% ✔
Sprite 6% ✔
Diet Sprite 7% ✔
Minute Maid 3% ✔
Nestea 2% ✔
Selected? 5 1 1 0 1 1 1 0
How many columns?
� We have chosen flavors� We know expected sales rates (possibly
based on what else is in the machine)� We stock so that...
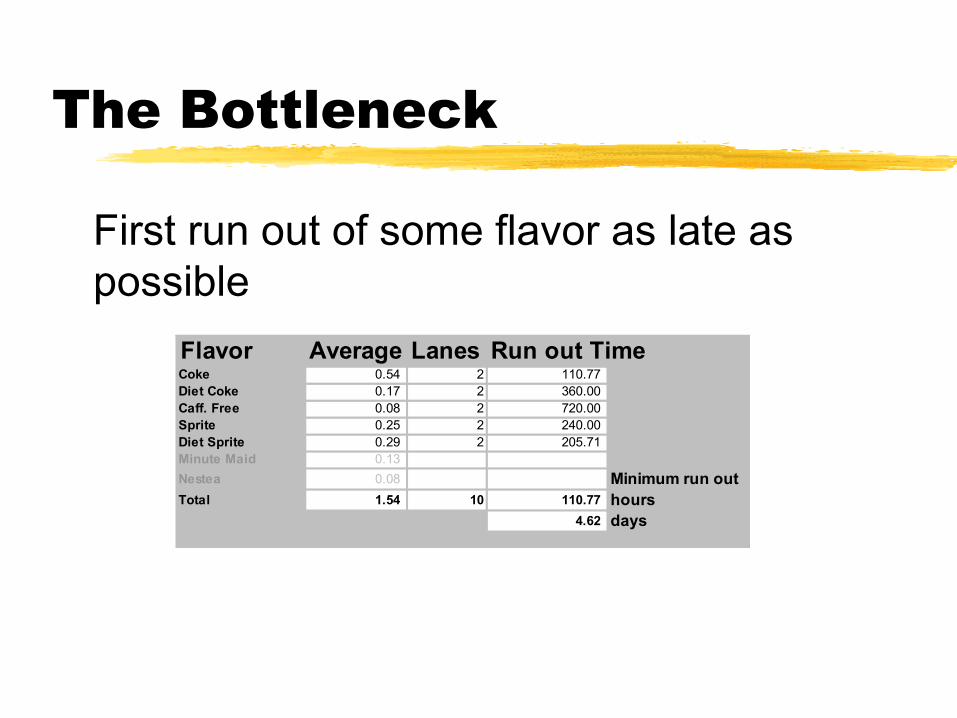
The Bottleneck
� First run out of some flavor as late as possible
Flavor Average Cans/hrLanes Run out TimeCoke 0.54 2 110.77 Diet Coke 0.17 2 360.00 Caff. Free 0.08 2 720.00 Sprite 0.25 2 240.00 Diet Sprite 0.29 2 205.71 Minute Maid 0.13
Nestea 0.08 Minimum run out Total 1.54 10 110.77 hours
4.62 days
How often to restock?
� What are the issues?
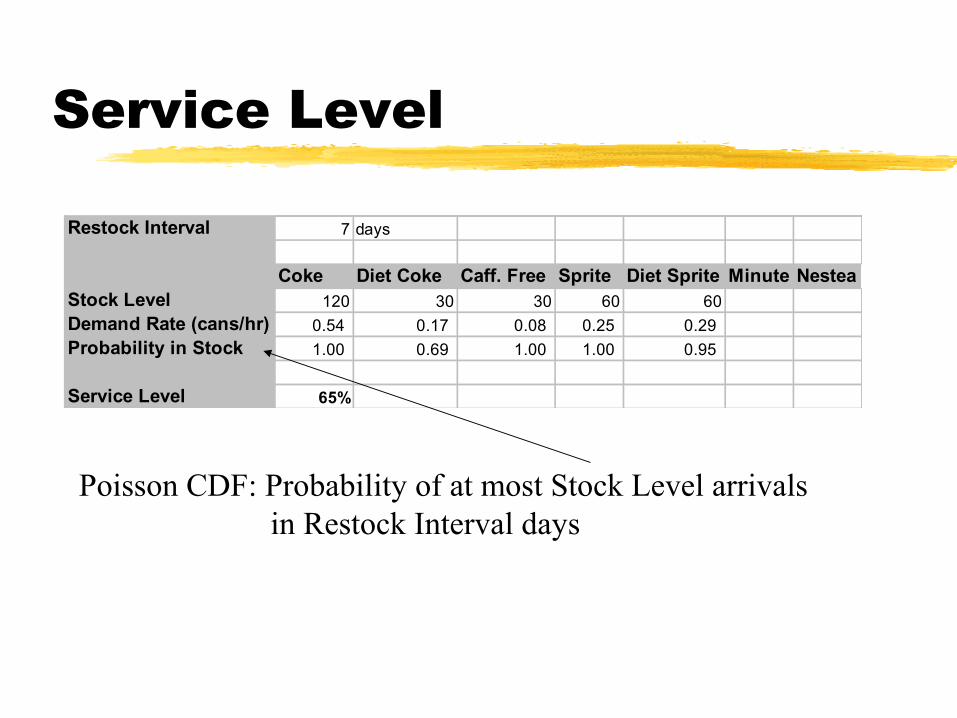
Service Level
Restock Interval 7 days
Coke Diet Coke Caff. Free Sprite Diet Sprite Minute MaidNesteaStock Level 120 30 30 60 60
Demand Rate (cans/hr) 0.54 0.17 0.08 0.25 0.29
Probability in Stock 1.00 0.69 1.00 1.00 0.95
Service Level 65%
Poisson CDF: Probability of at most Stock Level arrivals in Restock Interval days
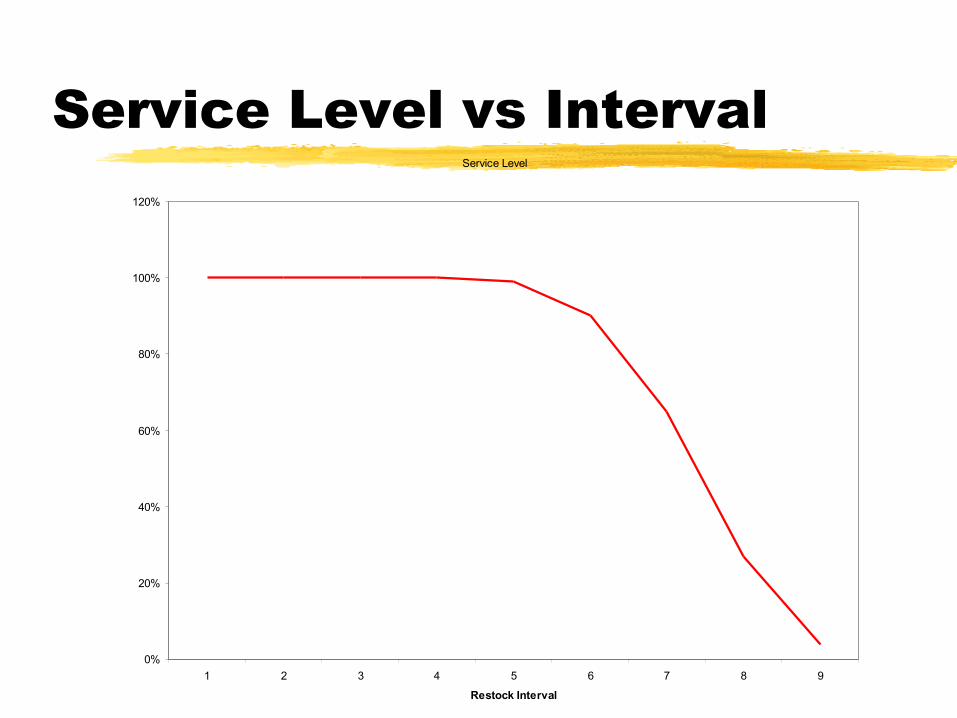
Service Level vs IntervalService Level
0%
20%
40%
60%
80%
100%
120%
1 2 3 4 5 6 7 8 9
Restock Interval