cohort size and youth employment outcomesftp.iza.org/dp8197.pdf · cohort size and youth employment...
TRANSCRIPT

DI
SC
US
SI
ON
P
AP
ER
S
ER
IE
S
Forschungsinstitut zur Zukunft der ArbeitInstitute for the Study of Labor
Cohort Size and Youth Employment Outcomes
IZA DP No. 8197
May 2014
David NewhouseClaudia Wolff

Cohort Size and Youth Employment
Outcomes
David Newhouse World Bank and IZA
Claudia Wolff
World Bank and Stockholm School of Economics
Discussion Paper No. 8197 May 2014
IZA
P.O. Box 7240 53072 Bonn
Germany
Phone: +49-228-3894-0 Fax: +49-228-3894-180
E-mail: [email protected]
Any opinions expressed here are those of the author(s) and not those of IZA. Research published in this series may include views on policy, but the institute itself takes no institutional policy positions. The IZA research network is committed to the IZA Guiding Principles of Research Integrity. The Institute for the Study of Labor (IZA) in Bonn is a local and virtual international research center and a place of communication between science, politics and business. IZA is an independent nonprofit organization supported by Deutsche Post Foundation. The center is associated with the University of Bonn and offers a stimulating research environment through its international network, workshops and conferences, data service, project support, research visits and doctoral program. IZA engages in (i) original and internationally competitive research in all fields of labor economics, (ii) development of policy concepts, and (iii) dissemination of research results and concepts to the interested public. IZA Discussion Papers often represent preliminary work and are circulated to encourage discussion. Citation of such a paper should account for its provisional character. A revised version may be available directly from the author.

IZA Discussion Paper No. 8197 May 2014
ABSTRACT
Cohort Size and Youth Employment Outcomes* This paper utilizes a cross-country panel of 83 developing countries to examine how changes in cohort size are correlated with subsequent employment outcomes for workers at different ages. The results depend on countries’ level of development. In low-income countries, young adults that are born into smaller cohorts are less likely to work, but school attendance remains unchanged. In middle-income countries, young adults in smaller cohorts are less likely to be unemployed and more likely to work outside of agriculture. Neither pattern can be discerned among older adults, although the estimates are imprecise. In sum, reductions in cohort size are associated with moderate improvements in employment outcomes for youth in middle-income countries, but there is scant evidence that these improvements persist into adulthood. JEL Classification: O10, J11, J21 Keywords: youth employment, cohort size, demographics, population Corresponding author: David Newhouse World Bank Social Protection and Labor 1818 H Street NW Washington, DC 20433 USA E-mail: [email protected]
* We would like to thank David Canning for guidance, and Arup Banerji, Sangeeta Raja, and David Robalino for their support, for related work on cohort size and labor market outcomes in Africa. We are grateful to Kathleen Beegle, John Giles, Juanna Jönsen, Erik Lindqvist and Cem Mete for helpful comments, and to Claudio Montenegro for providing access to the International Income Distribution Database. Part of the study was funded by the generous contribution of the Bank-Netherlands Partnership Program (BNPP).
2
1 Introduction The relationship between cohort size and youth employment outcomes is of great interest in developing countries. In countries where cohort size is rising rapidly, better understanding this relationship can help policy-makers anticipate, and potentially address, the types of challenges that members of large cohorts may face when entering the labor market.1 On the other hand, countries in which population growth has begun to fall are hoping to follow in the footsteps of the East Asian tigers, in which a demographic dividend due to declining dependency ratios helped contribute to rapid and sustained economic growth.2 This raises the question of whether and how much declining population growth in these countries contributed to this boom by spurring the movement of workers into more productive employment opportunities.
In this paper, we estimate the correlation between changes in the size of birth cohorts and changes in employment outcomes for workers at different ages, using a newly compiled dataset of 83 lower and middle income countries.3 There is no clear theoretical guidance as to how changes in cohort sizes should affect the labor market outcomes of workers. In neoclassical growth models, for example, the effect of changes in population growth depends on whether the saving rate is assumed to be endogenous or exogenous. In the Solow growth model, which assumes an exogenous savings rate, a rise in population growth leads to a fall in capital per worker and presumably worse employment outcomes. In contrast, in the Ramsey model, the savings rate adjusts in response to changes in population growth, and higher population growth leaves capital per worker unchanged.
Standard labor supply and demand models take a different perspective, and predict
that increases in cohort size will negatively affect workers in the short term. Increasing the pool of workers, all else equal, shifts the supply curve to the right and therefore reduces equilibrium wages. Furthermore, if labor market frictions, efficiency wages, or well-enforced regulations prevent real wages from falling, larger cohort sizes could lead to increased unemployment.
1 Youth employment is also an issue in many developed countries, as young people are more likely to work in the informal sector or to be unemployed. See, for instance, O’Higgins (2001), DeFreitas (2008) or Coenjaerts, Ernst, Fortuny, Rei, and Pilgrim (2009) for global overviews, O’Higgins (2012) for a recent study of youth labor markets in the European Union, O’Higgins (2004) for Europe and Central Asia, Caroleo and Pastore (2003) for Spain, Sweden and Germany, and Perugini and Signorelli (2010) for different European regions. 2 Young (1995) for example argues that factor accumulation, e.g. labor, played an important role in the East Asian miracle. The term “demographic dividend” refers to the potential for countries that are undergoing the demographic transition to benefit from a favorable population age structure. As countries develop economically, reductions in fertility and mortality create a boom generation that is larger than the generations preceding and following it, raising the potential impact of pro-growth as this generation matures (Bloom, Canning, and Sevilla, 2003) 3 The recent expansion of the International Income Distribution Database harmonized by the World Bank makes this study feasible.

3
The effects of cohort size in the longer term, however, are unclear, and depend partly on how the labor market impacts of cohort size translate into household investments in education. If the substitution effect dominates, a decline in equilibrium wages would lead young adults to stay in school longer by lowering the opportunity cost of education. This increased investment in education could in turn have a positive longer term effect on employment outcomes. On the other hand, reduced wages may squeeze poor households’ budgets to the point that they are unable to continue their children’s schooling.
Our paper relates to two strands of the literature. The first consists of several studies that have investigated how cohort size relates to labor market outcomes in developed countries. Welch (1979) examines how increased cohort size due to the post-war baby boom affected the earnings of American workers. The results indicate that larger cohorts earn less, and that most of the effect comes early in their career. Other studies, such as Brunello (2010), Morin (2011), and Wright (1991), also find evidence that larger cohort size can depress earnings for several years. Korenman and Neumark (2000), using a dataset of 15 advanced economies from 1970-1994, find that a larger youth population increases youth unemployment.4 Shimer (2001), on the other hand, examines cohort size effects across US states and finds that youth unemployment falls as cohort size increases. He argues that companies moved to those areas with bigger youth cohorts, because there is a larger pool of well-educated graduates available to hire.
This paper is the first, to our knowledge, to extend this literature by investigating similar questions in developing countries. The labor-market context in developing countries differs from that in more advanced countries in several ways. Labor markets in developing countries tend to be characterized by a large pool of unskilled workers, who tend to work in subsistence jobs in agriculture or petty sales. A significant number of youth enter the labor market early, typically in self-employed jobs or helping out in family businesses. Social safety nets are often unavailable to cushion the effect of unemployment. At the same time, labor market regulations are typically either less restrictive or poorly enforced, which may lead labor market conditions to adjust more rapidly to changes in cohort size.
This work also relates to another strand of the literature that examines the long run
impacts of labor market shocks. For instance, Kahn (2010) and Oreopoulos, von Wachter, and Heisz (2012) find a persistent impact on careers and earnings when graduates enter the labor market in a recession. One reason, according to Liu, Salvanes, and Sorensen (2012), could be the persistent effects of an early skill mismatch in the career. Chi, Freeman, and Li (2012), however, find that Chinese workers that entered the labor market during a recession caught up within three to four years. Our analysis sheds light on whether correlations between cohort size and employment outcomes for youth persist into adulthood in developing countries.
4 Rodriguez-Palenzuela and Jimeno-Serrano (2002) find a similar result for OECD countries.
4
We show that in a broad sample of developing countries, smaller cohort size at birth is positively correlated with that cohort’s employment outcomes 15 to 24 years later. However, the nature of these effects depends on the countries’ level of development. In very low-income countries, youth in smaller cohorts are less likely to work, but this does not translate into greater rates of school attendance. In middle-income countries, youth in smaller cohorts benefit more tangibly. Youth aged 20 to 24 are less likely to be unemployed, and those aged 15 to 19 that do work are also less likely to work in agriculture. In addition, working women aged 15 to 19 who are members of smaller cohorts are more likely to work as wage employees. By and large, however, cohort size effects are weaker for adults. Although adults in smaller cohorts are more likely to be wage workers, the correlations are generally are generally imprecise are only statistically significant for a few age groups.
The estimated correlations between cohort size and labor market outcomes also
reflect other factors that influence each of them. Our econometric specification includes country fixed effects, in order to isolate within country variation in cohort size and employment outcomes. In addition, the key independent variable is cohort size at birth, which eliminates the possibility that subsequent migration or mortality may confound the estimates. Nonetheless, the results cannot be interpreted as unbiased estimates of an exogenously induced change in fertility on future employment prospects. Fertility decisions are influenced by a variety of time-varying factors that are unobserved and are likely related to future employment outcomes. For example, a negative correlation between birth cohort size and future employment could partly reflect a virtuous cycle. Countries that were well-governed, like many of the Asian tigers, could have reduced fertility while simultaneously benefiting from sustained growth. In this case, our results should if anything overestimate the benefits of reducing cohort size in boosting employment outcomes, for all ages.5 Unfortunately, the data necessary to investigate the role of external factors are not available. Therefore, the results should be interpreted more broadly as the overall correlation, based on within-country variation, between cohort size and labor market outcomes via a multitude of channels.
The results suggest that smaller cohort sizes are associated with at best moderate
improvement in outcomes for youth, particularly in middle-income countries. For adults, the overall correlation of cohort size with primary activity and sector is limited, although there are slight indications that adults in smaller cohorts are moderately more likely to work as wage workers in low-income countries. Nonetheless, we conclude that there is scant evidence that smaller cohort sizes substantially improve job opportunities for adults.
The remainder of the paper is organized as follows. Section 3.2 presents the data and descriptive trends in youth employment outcomes and cohort size. Section 3.3 explains 5 While there are also omitted factors such as economic shocks that could understate the the negative relationship between cohort size and employment outcomes, we believe, that the omission of variables reflecting quality of governance is likely to make the overall estimates, if anything, biased upwards.

5
our estimation strategy and results are presented in section 3.4. We conclude with a discussion of our findings in section 3.6.
2 Data
In this section, we examine youth employment outcomes using the most recent year of available data, before documenting trends between 1990 and 2010. We then describe the evolution of cohort size for the same time period.
2.1 Labor Market Data The labor market outcome data comes from the International Income Distribution Survey (I2D2). The I2D2 is a harmonized collection of household and labor surveys from 1990-2010 constructed and maintained by the research group of the World Bank.6 Our data set includes repeated cross-section data from 450 surveys at the individual level in 83 lower, middle and upper middle income countries. The available years and frequency of waves differ among countries as shown in Table 5 in the Appendix.
When combining different micro surveys in one data set, it is important to ensure that questions are asked consistently over time. Although the I2D2 has been harmonized, there can be large changes in variables when the underlying survey changes, due to changes in survey design driven by differences in the formulation of questions or the target group. This will introduce measurement error into our measures of labor market outcomes, which could potentially be correlated with changes in cohort size and bias the estimates. We therefore identify potential structural breaks, using the outlier detection tool “bacon” in Stata. We first identified annualized changes in labor market outcomes amounting to more than four percentage points, which we considered to be outliers. We then used bacon on the full set of observations to identify outliers conditional on changes in GDP. These outliers were excluded from the main analysis. We include all outliers as a robustness check and find little difference to our main results.
We use four labor market outcome variables: (1) Primary activity, (2) Sector of work and (3) Employment status. Primary activity, in turn, is divided into at least three categories: Employed, unemployed, and inactive. For young people between the age of 15 and 24, we further divide inactive workers into two categories, depending on whether they attend school or not.7 As we do not have reliable information on how many hours people work, all young people who have a job and have worked at least 1 hour during the past seven days are classified as employed. This mean that youth who both attend school
6 An earlier version of the data set is described in detail in Montenegro and Hirn (2009). 7 In some surveys in the I2D2, school attendance is unavailable and therefore proxied for by school enrollment.

6
and work are considered to be employed rather than students. Therefore, we also use school attendance as an alternative outcome variable in addition to primary activity. This captures any effects of cohort status on overall school attendance, irrespective of employment.
The second outcome variable is sector of work and is split into agriculture, services
and industry. Agriculture is virtually always the least productive sector, and we therefore interpret working in the agricultural sector as a worse labor market outcome than working in industry or services. Our third outcome variable is employment status, which is divided into four categories: Unpaid workers, self-employed workers, salaried workers, and employers. In general, employment status, like sector of work, is an important and meaningful correlates of job quality in developing countries. In particular, employers and wage employees tend to be better off, along several dimensions, than own-account and unpaid workers.8 To provide further evidence for this ranking of job quality, Figure 1 plots measures of sector and status against countries’ educational attainment. The share of agricultural workers falls, the higher the education level of the country. The same negative relationship holds for the share of unpaid and self-employed workers, while in contrast, the share of wage-employed workers rises with a country’s education level.
Figure 1: Employment Status vs. Average years of Schooling
Note: These Figures provide evidence on employment status as an indicator of job quality. They depict how
8 See Gindling and Newhouse, 2014
7
job status changes with education level. The y-axis denotes the share of people with a particular job status. The education level on the x- axis is measured by average years of schooling. The share of agricultural, unpaid and self-employed workers falls as the level of education increase
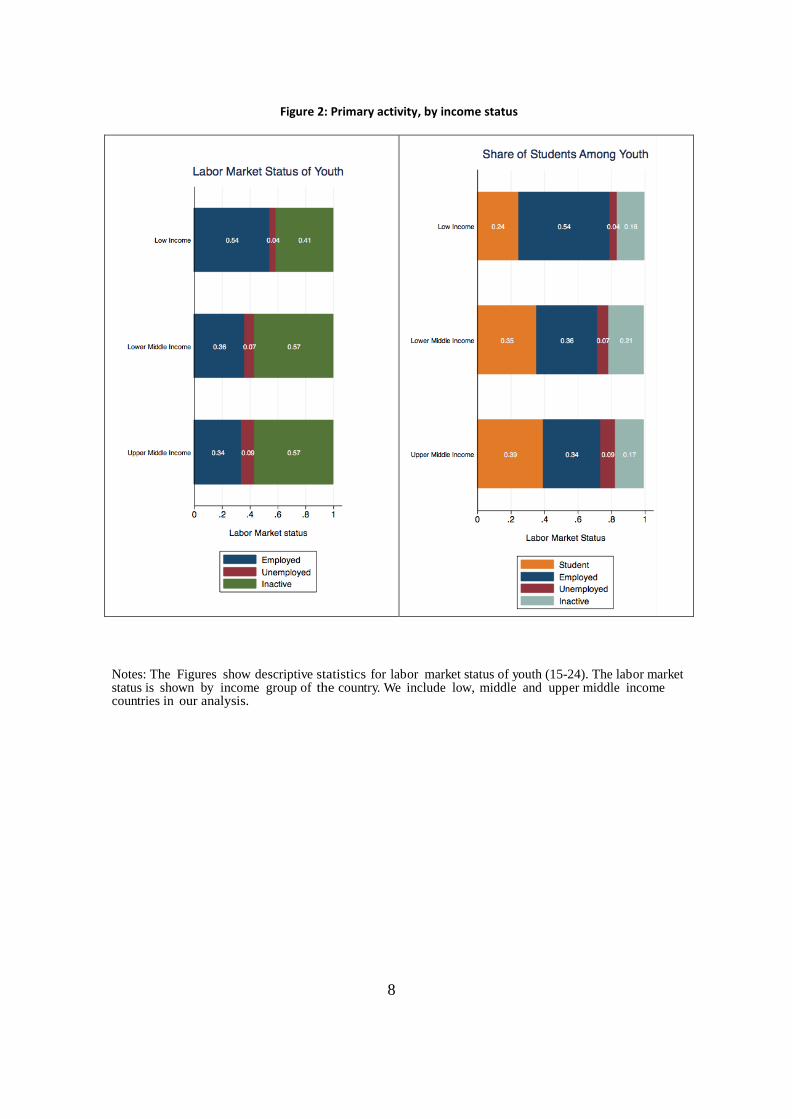
2.1.1 Youth Employment Outcomes We first present descriptive statistics of youth employment outcomes for countries in different income groups, using the standard World Bank classification, which divides countries into four categories: Lower income, middle income, upper middle income and high income.9 High income countries are excluded from the analysis. As shown in Figures 2 and 3, there is substantial variation in youth labor market outcomes across these three income groups. In low income countries, more youth between 15-24 work and fewer are full time students than in middle income countries (Figure 2). In addition, most youth in low-income countries work as unpaid or self-employed workers, and more than 60% of youth work in the agricultural sector (Figure 3).10 These results are consistent with other studies on youth labor market outcomes, which have shown that a large share of youth work in the informal sector or as unpaid workers.11
9 The World Bank uses Gross National Income per capita and divides countries based on the following definition: Low income: $1,025 or less; lower middle income: $1,026 -$4,035; upper middle income: $4,036 - $12,475; high income: $12,476 or more. 10 Labor market outcomes by region are shown in Figures 10 and 11 in the Appendix. 11 See for example O’Higgins (2001) or World Bank (2009).
8
Figure 2: Primary activity, by income status
Notes: The Figures show descriptive statistics for labor market status of youth (15-24). The labor market status is shown by income group of the country. We include low, middle and upper middle income countries in our analysis.

9
Figure 3: Employment status and sector, by income group
Notes: The Figures show details of the employment status and sector where youth (15-24) work. The labor market status is shown by income group of the country. We include low, middle and upper middle income countries in our analysis.
Figure 4 depicts changes in labor market outcomes.12 These changes were generally largest in poor countries, while many middle-income countries experienced relatively minor changes in youth employment outcomes. At the same time, the share of youth attending school rose in most countries. Young adults also appear to be moving into wage employment, while the share of both unpaid youth and those in agriculture have fallen (Figure 4).
12 We calculate changes in youth labor market outcomes by deducting the last wave of available data for a given country from the first wave of data. We annualize the changes by dividing through the available time span.

10
Figure 4: Changes in selected labor market outcomes, by per capita GDP
Notes: This Figure shows the annualized change in the share of youth be- tween 15-24 years old for four labor market outcome variables: (1) attending school, (2) being wage-employed, (3) working unpaid or (4) working in agriculture. We calculate changes in youth labor market outcomes by deducting the last wave of available data for a given country from the first wave of data. We annualize the changes by dividing through the available time span. The changes are calculated separately for gender and country and gender and depicted by initial level of GDP per capita, this is based on the I2D2 data and weighted by population.
2.2 Population Data
The population data used in this paper stem from the Health, Nutrition and Population Statistics of the World Bank. The data base contains country population estimates by gender and five year age group from 1960 onwards. Youth are defined as persons between the ages of 15 to 24. 13
13 See for example World Bank (2009).
11
Figure 5 depicts the evolution of the absolute cohort size for different income groups and regions between 1990 and 2010.14 There is considerable heterogeneity in the growth of youth cohort sizes, depending on countries’ region and level of development. While youth cohorts in Sub-Saharan Africa and South Asia continued to grow, youth cohort sizes fell in Europe and Central Asia. This is consistent with the results for different income groups, as youth cohort sizes grew in low income countries, while they were more stable in many lower and upper middle income countries. Finally, figure 5 shows that there is considerable variation across countries. For example, although the size of the youth cohort size is shrinking in many countries, there is considerable growth in India and Ethiopia. Furthermore, youth cohorts in many countries in Sub-Saharan Africa and South Asia are projected to continue to grow in the near future (Figure 5).
Since the data only cover 83 countries, it is useful to check the extent to which population growth in these countries is representative of all low and middle income countries for which population grows rates are available. The Health and Nutrition Population Statistics of the World Bank includes population growth rates for 196 low and middle income countries between 1960 and 2011. Population growth rates are similar, as the median growth in our sample is 2.2, compared to an overall median of 2.1 percent (Figures 12 in the Appendix).
14 Labor market data is generally unavailable prior to 1990.

12
Figure 5:
Note: This Figure shows the cohort size of 15-24 year olds for 3 different categories: by income group of the country, by region and by country. We see substantial heterogeneity in the evolution of youth cohort sizes across regions and income groups. While youth cohorts in Sub-Saharan Africa and South Asia continue to grow, youth cohorts sizes fall in Europe and Central Asia. The graphs are based on the Health, Nutrition and Population Statistics of the World Bank. The predictions are based on United Nations population projections.

13
3 Estimation Strategy We collapse the individual level I2D2 data into cells based on five-year age groups, gender, survey year and country. Each cell thus contains averages or shares for each group, such as the share of women age 15-19 who were employed in Ethiopia in 1995. Given large gender differences in labor market outcomes, groups are separated by gender. We construct a panel of 83 lower, middle and upper middle income countries for which at least two waves of data exist. We also restrict the sample to countries for which the data span five or more years, in order to measure medium to longer-term changes in cohort size. We include country dummy variables in the model, to control for time-invariant country characteristics. Therefore, the results indicate the extent to which within-country changes in cohort size are correlated with changes in labor market outcomes.
We use a Dirichlet model to estimate the correlates of a set of shares, such as the categories of primary activity, employment status, and sector.15 The Dirichlet distribution is a multivariate generalization of the beta distribution and is appropriate for estimating the correlates of a set of proportions that each lie between zero and one, and sum to one. Imposing these restrictions on the joint model makes the estimates more efficient than a series of separate OLS or Logit regressions. The probability density function of the Dirichlet function is given as follows:
(1) ( )( )
( )( )( )∏
∏
∑=
−
=
=
Γ
Γ
=K
j
Xjk
jj
k
ij
kjy
X
Xyyf
1
1
1
11 ,..., α
α
α
where y1 through yk indicate vectors of proportions, for example the share of 15 to 19 year old women in each of the four categories primary activity status categories (in which case k equals four). Γ is the gamma function, and αj is a parameter from which the expected value and variance of the proportion can be derived. Taking the log and summing over observations gives the log likelihood function:
(2) ( ) ( )( ) ( )( )∑∑∑ ∑=== =
−+Γ−
=
k
jiji
k
jj
N
i
k
jj yXXXLLog
111 1ln1ln ααα
where N is the number of observations in the datset. We use the dirifit command in Stata, with the alternative parameterization recommended by Buis et al (2011) in the 15 In particular, we use the alternative parameterization of the dirifit command in Stata (Buis, et al, 2010). We chose the dirichlet model over the fractional logit model because we are comfortable excluding the one or two countries for which a dependent variable is equal to zero or one.

14
presence of covariates. This models alpha as a multinomial logit function of the covariates X:
(3) ( ) ( )( )
φβ
βα
∑=
+= k
jj
jj
X
XX
1exp1
exp
where φ is an ancillary scale parameter required to identify the model.
The main variable of interest in the vector of independent variables X is log cohort size, but we also include dummies for each country, each year, and gender. (4) ( )tcgagetcgtcg YearCountryGenderCSX ,,,,,,, −= where CS stands for log cohort size, g is age and gender group, c is country, and t is year. The estimated proportions are therefore modeled as a function of log cohort size at birth, gender, and a set of dummy variables indicating country and year.
We estimate these models separately for seven five-year age groups, ranging from age 15 to 19 to age 40 to 44. Each observation is weighted by the square root of the number of observations used to construct the proportion, to correct for the heteroscedasticity arising from differences in the size of the household surveys used to construct the cell means. The standard errors are robust and clustered on country. Below, we report the estimated marginal effect, and its standard error, of log cohort size.16 Therefore, the reported effect represents a rough approximation of the percentage point change in an outcome when cohort size doubles, and dividing the reported coefficients by ten gives a more accurate approximation of the percentage point change when the cohort size increases by 10 percent.
4 Results We first consider the relationship between cohort size and primary activity and school attendance, before turning to sector, status, and the earnings of wage workers. In each case, we also present interactions of cohort size with dummy variables indicating the gender of the cell, and whether the country, based on its average per capita GDP, is in the poorer half of our set of countries.17 4.1 Primary Activity Table 1 presents the results from regressing labor market status on log cohort size as 16 We use the stata command margins, which applies the delta method for continuous variables, to calculate marginal effects. 17 We use a threshold of US $1500, which is roughly the median. We use a country’s average GDP because, conditional on country fixed effects, it is orthogonal to the error term by construction.
15
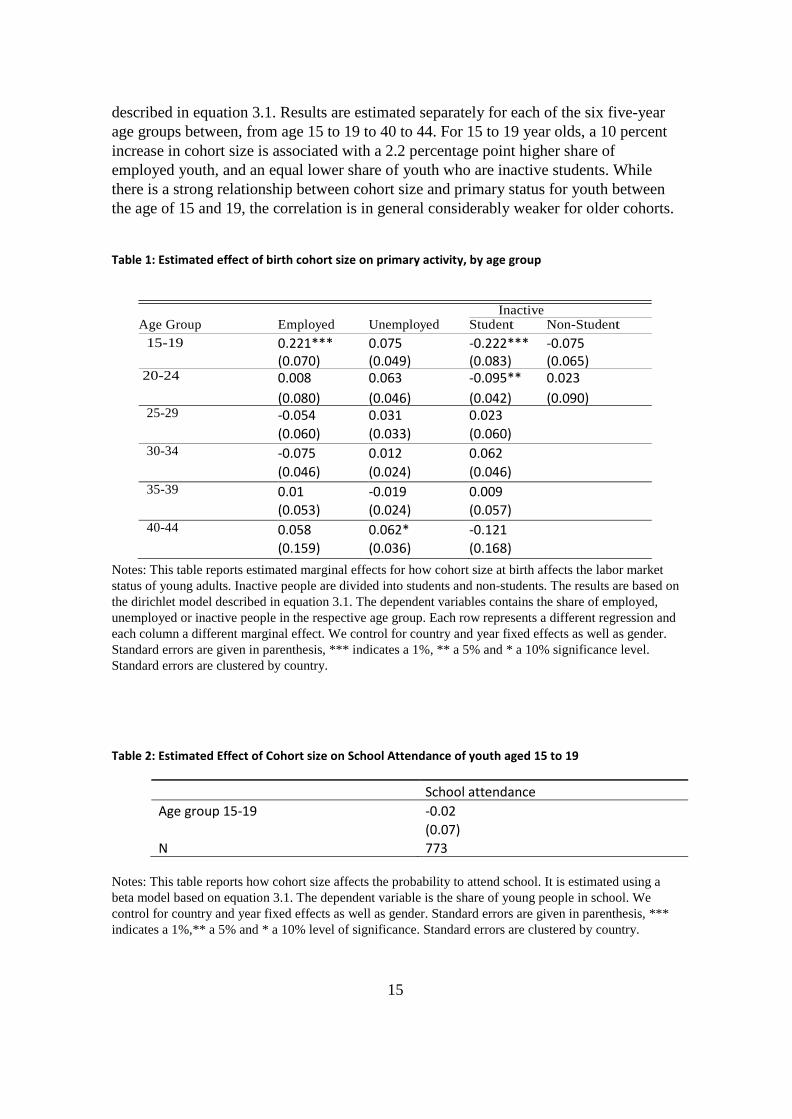
described in equation 3.1. Results are estimated separately for each of the six five-year age groups between, from age 15 to 19 to 40 to 44. For 15 to 19 year olds, a 10 percent increase in cohort size is associated with a 2.2 percentage point higher share of employed youth, and an equal lower share of youth who are inactive students. While there is a strong relationship between cohort size and primary status for youth between the age of 15 and 19, the correlation is in general considerably weaker for older cohorts.
Table 1: Estimated effect of birth cohort size on primary activity, by age group
Inactive
Age Group Employed Unemployed Student Non-Student 15-19 0.221*** 0.075 -0.222*** -0.075
(0.070) (0.049) (0.083) (0.065) 20-24
0.008 0.063 -0.095** 0.023 (0.080) (0.046) (0.042) (0.090)
25-29
-0.054 0.031 0.023 (0.060) (0.033) (0.060) 30-34
-0.075 0.012 0.062 (0.046) (0.024) (0.046) 35-39
0.01 -0.019 0.009 (0.053) (0.024) (0.057) 40-44
0.058 0.062* -0.121 (0.159) (0.036) (0.168)
Notes: This table reports estimated marginal effects for how cohort size at birth affects the labor market status of young adults. Inactive people are divided into students and non-students. The results are based on the dirichlet model described in equation 3.1. The dependent variables contains the share of employed, unemployed or inactive people in the respective age group. Each row represents a different regression and each column a different marginal effect. We control for country and year fixed effects as well as gender. Standard errors are given in parenthesis, *** indicates a 1%, ** a 5% and * a 10% significance level. Standard errors are clustered by country.
Table 2: Estimated Effect of Cohort size on School Attendance of youth aged 15 to 19
School attendance
Age group 15-19 -0.02 (0.07) N 773
Notes: This table reports how cohort size affects the probability to attend school. It is estimated using a beta model based on equation 3.1. The dependent variable is the share of young people in school. We control for country and year fixed effects as well as gender. Standard errors are given in parenthesis, *** indicates a 1%,** a 5% and * a 10% level of significance. Standard errors are clustered by country.

16
Table 2 indicates that in smaller cohorts, youth aged 15 to 19 and 20 to 24 are more likely to be inactive (full-time) students. This raises the question of whether 15 to 19 year olds in larger cohorts are dropping out of school to work, or are taking on side jobs while continuing to attend school. Table 2 reports the results from a beta regression that regresses cohort size on the share of youth attending school.18 The results indicate that cohort size is only weakly related to school attendance overall, as a 10 percent increase in cohort size is correlated with between a -0.2 and 0.1 percentage point change in school attendance. Therefore, we conclude that youth aged 15 to 19 in smaller cohorts are able to forego side jobs that contribute a bit of extra additional income. This may increase the time they have available to study, but does not significantly increase school enrolment or attendance rates.
Primary activity can be a difficult indicator to interpret in the absence of context. For example, economic growth typically reduces employment rates in low-income countries, as more people can afford not to work in low-productivity jobs on the farm or in petty sales. As countries reach middle-income status, growth is associated with higher employment rates, as more productive jobs appear. This U-shaped relationship between employment and GDP is particularly pronounced among women. (Goldin, 1994)
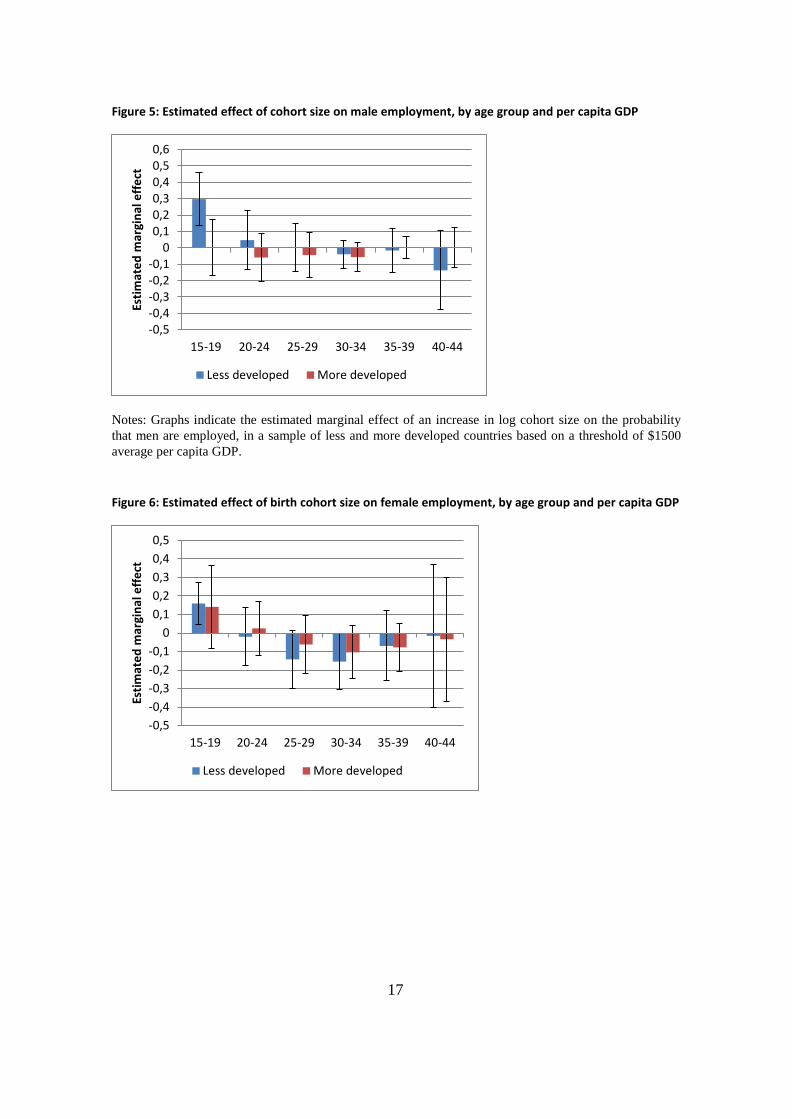
To better understand the estimated effects of cohort size on employment, we disaggregate the results according to gender and income type. Figures 1 and 2 show estimated employment effects by age group, gender, and whether the country’s average per capita GDP exceeds $1,500.19 The positive relationship between cohort size and employment is largely driven by low-income countries and is stronger among men. Young women in larger cohorts are also more likely to be employed, although the estimates are only sufficiently precise to be statistically significant in low-income countries. Members of large cohorts in low-income countries, likely facing worse job prospects and perhaps a lower quality educational experience than their counterparts in smaller cohorts, appear to be taking side jobs in order to contribute a bit to the family income. Figures 3 and 4 tell a different story for unemployment, however. For middle-income countries, larger cohort size is associated with higher levels of unemployment for 20 to 24 year olds. These results suggest that youth in these countries can afford to search longer for work, and may fail to fully account for the negative effects of cohort size when determining their reservation wage.
Finally, the estimated effects on employment and unemployment are generally very weak for adult men. Thus, there is little indication that the increase in the prevalence of side jobs for 15 to 19 year olds in low-income countries leads to persistently higher employment rates. For women, if anything, adults in smaller cohorts are more likely to work.
18 The results from a more traditional fractional multinomial logit model are similar 19 This threshold was selected because it is close to the 50th percentile in the sample.
17
Figure 5: Estimated effect of cohort size on male employment, by age group and per capita GDP
Notes: Graphs indicate the estimated marginal effect of an increase in log cohort size on the probability that men are employed, in a sample of less and more developed countries based on a threshold of $1500 average per capita GDP.
Figure 6: Estimated effect of birth cohort size on female employment, by age group and per capita GDP
-0,5-0,4-0,3-0,2-0,1
00,10,20,30,40,50,6
15-19 20-24 25-29 30-34 35-39 40-44
Estim
ated
mar
gina
l effe
ct
Less developed More developed
-0,5-0,4-0,3-0,2-0,1
00,10,20,30,40,5
15-19 20-24 25-29 30-34 35-39 40-44
Estim
ated
mar
gina
l effe
ct
Less developed More developed

18
Figure 7: Estimated effect of cohort size on male unemployment rate, by age and per capita GDP
Figure 8: Estimated effect of cohort size on female unemployment rate, by age and per capita GDP
-0,15
-0,1
-0,05
0
0,05
0,1
0,15
0,2
0,25
15-19 20-24 25-29 30-34 35-39 40-44
Estim
ated
mar
gina
l effe
ct
Less developed More developed
-0,15-0,1
-0,050
0,050,1
0,150,2
0,250,3
0,350,4
15-19 20-24 25-29 30-34 35-39 40-44
Estim
ated
mar
gina
l effe
ct
Less developed More developed

19
4.2 Employment Status
Primary activity, in general, is a coarse indicator of labor market development. This section therefore considers how cohort size is associated with the shift of workers out of less productive own-account and agricultural work into more productive off-farm and salaried jobs. Table 3 shows the estimated marginal effects of an increase in cohort size on birth on the share of workers in different employment statuses. Larger cohort sizes at birth are consistently associated with a reduction in the share of workers in wage employment. But only among 25 to 29 year olds and 40 to 44 year old men are the estimates sufficiently precise to be statistically significant. In these cases, a 10 percent decline in cohort size is associated with a 1.6 percentage point increase in wage employment. For 40 to 44 year olds, the estimated effect is substantially larger. The magnitude of the estimates for 40 to 44 year old appears to be an outlier, and may be exaggerated due to lack of data, although the direction is consistent with the other age brackets as well.20
While the interpretation of these numbers is subjective, we consider a one to two
percentage point difference to be moderate. For example, in our raw data, a one percentage point increase in the wage employment rate is associated on average with about a $70, or 3.5 percent, one-off increase in a country’s per capita GDP. Extrapolating that suggests that a 1.6 percentage point increase in wage employment would be correlated with about a 6 percent or $110 increase in real per capita GDP, in terms of raw correlations. An alternative benchmark for comparison is the average gender gap for adults in the share of wage employment, which is about 5 percentage points. From that perspective as well, a 1.6 percentage point increase in wage employment is significant. Table 3: Estimated effect of cohort size on employment status, by age group
Age Group Wage-employed Employer Own-account Unpaid 15-19 -0.135 -0.006 0.051 0.09
(0.111) (0.010) (0.085) (0.077) 20-24
-0.087 -0.018 0.044 0.062 (0.056) (0.019) (0.052) (0.044)
25-29
-0.156** -0.003 0.115* 0.043 (0.062) (0.026) (0.065) (0.035) 30-34
-0.126* 0.048 0.06 0.018 (0.075) (0.029) (0.076) (0.060) 35-39
-0.182 0.065 0.152 -0.035 (0.119) (0.101) (0.253) (0.226) 40-44
-0.609** 0.036 0.619* -0.047 (0.265) (0.159) (0.341) (0.162)
20 For 40 to 44 year olds, there are fewer surveys available for which we can match cohort size at birth to labor market outcomes, compared to younger age groups.

20
Figure 9: Estimated effects of cohort size on male wage employment
Figure 10: Estimated effect of cohort size on female wage employment, by age and per capita GDP
Figures 5 and 6 show estimates broken out by gender and average per capita GDP
category. The estimated correlations are generally stronger for low-income countries below the $1500 threshold. Effects are similar in magnitude for men and women, although the male estimates are slightly more precise. At this level of disaggregation, only the estimates for men aged 25 to 29 and 30 to 44 are statistically significant.
-1
-0,8
-0,6
-0,4
-0,2
0
0,2
0,4
15-19 20-24 25-29 30-34 35-39 40-44
Estim
ated
mar
gina
l effe
ct
Less developed More developed
-0,8
-0,6
-0,4
-0,2
0
0,2
0,4
15-19 20-24 25-29 30-34 35-39 40-44
Estim
ated
mar
gina
l effe
ct
Less developed More developed

21
4.3 Sector of Employment
While the last section reported a moderately strong but imprecisely estimated correlation between cohort size and wage employment for all age groups, this section considers sector of employment. Sector is divided into three categories: Agriculture, Industry, and Services. The main focus is on whether smaller cohorts facilitate the structural transformation of workers out of agriculture and into more productive sectors. The results in Table 4 suggest that positive cohort size may be associated with a shift of youth aged 15 to 19 from agriculture to services, but correlations for the other age groups are weak. Figures 9 and 10 again show the breakouts by age group, income category, and gender. For youth aged 15 to 19, the estimated correlations are particularly strong in middle-income countries. In these countries, a reduction of cohort size of 10 percent is associated with a 6 percentage point decline in the share of youth engaging in agriculture, for both men and women. However, as in the aggregate results, the correlation between cohort size and the sector of employment for older adults is small and not statistically significant.
Table 4: Estimated effect of cohort size on sector of employment, by age
Age Group Agriculture Industry Services 15-19 0.178 0.005 -0.183**
(0.124) (0.089) (0.091) 20-24
0.016 0.111 -0.127 (0.098) (0.090) (0.107)
25-29
0.041 0.106 -0.147 (0.086) (0.095) (0.107) 30-34
0.001 0.07 -0.071 (0.147) (0.076) (0.110) 35-39
-0.059 0.015 0.045 (0.227) (0.076) (0.184) 40-44
0.081 -0.054 -0.027 (0.241) (0.064) (0.256)

22
Figure 11: Estimated effect of cohort size on male agricultural employment, by age group and per capita GDP
Figure 12: Estimated effect of cohort size on female agricultural employment, by age group and per capita GDP
-0,8
-0,6
-0,4
-0,2
0
0,2
0,4
0,6
0,8
1
15-19 20-24 25-29 30-34 35-39 40-44
Estim
ated
mar
gina
l effe
ct
Less developed More developed
-0,8-0,6-0,4-0,2
00,20,40,60,8
11,2
15-19 20-24 25-29 30-34 35-39 40-44
Estim
ated
mar
gina
l effe
ct
Less developed More developed

23
4.4 Earnings of Wage Employees
Finally, we present estimates of the conditional correlations between cohort size and the average real wage of salaried employers. Since wages are not defined as a proportion, we use standard OLS regressions and include country fixed effects and dummy variables for each year. Both real monthly wages and cohort size are expressed in logs in order to estimate an elasticity. Nonetheless, the results can be difficult to interpret because in many countries, a small minority of workers is employed in salaried jobs.21 Therefore, changes in average wages can reflect changes in the composition of wage workers, in addition to changes in the wages of existing workers. Figure 9 shows the estimated elasticities. For youth, increased cohort sizes are associated with higher earnings, perhaps due to more educated workers youth entering the labor market. The results are statistically significant at the 10 percent level. For adults, the conditional correlation is negative, which is in line with an outward shift in the supply curve lowering equilibrium wages. In general, however, the estimates are too imprecise to draw firm conclusions on the association between cohort size and the earnings of wage workers. This may result from noise due to measurement error, which can present a formidable challenge to the analysis of self-reported earnings in developing countries. Figure 13: Cohort size and the average earnings of wage workers
Notes : This table shows the correlation of cohort size with the earnings of wage workers. It is estimated based on equation 3.1. The dependent variable is the log wage of people for those people who earn wages. We control for country and year fixed effects as well as gender. Standard errors are given in parenthesis, ∗∗∗ indicates a 1%,∗∗ a 5% and ∗ a 10% significance level. Standard errors are clustered by country.
21 In an unweighted average of the cells in our sample, on average roughly 60 percent of workers are in salaried wage jobs.
-6
-5
-4
-3
-2
-1
0
1
2
3
4
15-19 20-24 25-29 30-34 35-39 40-44
Estim
ated
effe
ct o
n lo
g w
age

24
5 Discussion and Conclusion This paper examines the relationship between cohort size at birth and subsequent employment outcomes for youth and adults in developing countries, utilizing a unique collection of harmonized surveys covering much of the developing world. Although standard supply and demand theory would suggest that larger cohorts uniformly worsen employment outcomes throughout workers’ careers, the empirical results are more subtle. In low-income cohorts, reduced cohort size is associated with lower employment rates, but this does not translate into higher rates of school attendance. For youth in middle-income countries, smaller cohorts are generally beneficial for employment outcomes. In particular, youth aged 15 to 19 that were born into smaller cohorts, if they choose to work, are less likely to work in agricultural employment and young women are more likely to work as wage employees. Smaller cohorts in these countries also tend to have lower unemployment rates between age 20 and 24. The magnitude of these effects can be substantial, as a 10 percent reduction in cohort size is associated with a 1 to 1.5 percentage point reduction in the unemployment rate.
Although smaller cohorts appear to benefit those youth that choose to work in
middle-income countries, there is far weaker evidence of an effect for adults, in either low or middle-income countries. Adults in smaller cohorts are moderately more likely to work as wage employees, but the estimates are only statistically significant for two of the five adult age groups. Furthermore, it is difficult to discern any effects of cohort size on adults’ primary activity, sector of employment, or earnings of wage employees.
Overall, we conclude from these results that reductions in cohort size are associated with moderate improvements in employment outcomes for youth in middle-income countries. They are far from a magic bullet, though, and there is little evidence that the advantages smaller cohorts confer on working youth translate into more productive jobs throughout their career. Without efforts to improve other determinants of worker productivity, such as the quality of human capital, physical infrastructure, and protection for property rights, decreases in the quantity of workers by itself appears to have little discernible relationship with improvements in the quality of jobs for adults in developing countries.
25
References
Bloom, D. E., D. Canning, and J. Sevilla (2003): The Demographic Dividend: A New Perspective on the Economic Consequences of Population Change, vol. 5. Rand Corporation.
Brunello, G. (2010): “The Effects of Cohort Size on European Earnings,” Journal of Population Economics, 23(1), 273–290. Buis, M. L., N. Cox, S. P. Jenkins, 2006."DIRIFIT: Stata module to fit a
Dirichlet distribution," Statistical Software Components S456725, Boston College Department of Economics, revised 19 Apr 2010.
Caroleo, F. E., and F. Pastore (2003): “Youth Participation in the Labour Market in
Germany, Spain and Sweden,” in Youth Unemployment and Social Exclusion in Europe, pp. 109–133. The Policy Press.
Chi, W., R. B. Freeman, and H. Li (2012): “Adjusting to Really Big Changes: The
Labor Market in China, 1989-2009,” Working Paper 17721, National Bureau of Economic Research.
Coenjaerts, C., C. Ernst, M. Fortuny, D. Rei, and M. Pilgrim (2009): “Youth
Employment,” in Promoting Pro-Poor Growth: Employment. DAC Network on Poverty Reduction.
DeFreitas, G. (2008): Young Workers in the Global Economy: Job Chal- lenges in
North America, Europe and Japan. Edward Elgar Pub. Gindling, T. H., and D. Newhouse (2014): “Self-Employment in the De- veloping
World,” World Development, vol 56 no. Goldin, C. (1994): The U-shaped female labor force function in economic
development and economic history. No. w4707. National Bureau of Economic Research.
Kahn, L. B. (2010): “The long-term Labor Market Consequences of Gradu- ating
from College in a Bad Economy,” Labour Economics, 17(2), 303–316. Korenman, S., and D. Neumark (2000): “Cohort Crowding and Youth Labor
Markets (A Cross-National Analysis),” in Youth Employment and Joblessness in Advanced Countries, pp. 57–106. National Bureau of Eco- nomic Research, Inc.
Liu, K., K. G. Salvanes, and E. Sorensen (2012): “Good Skills in Bad Times:
Cyclical Skill Mismatch and the Long-Term Effects of Graduating in a Recession,” IZA Discussion Papers 6820, Institute for the Study of Labor (IZA).
26
Montenegro, C., and M. Hirn (2009): “A New Disaggregated Set of Labor Market Indicators Using Standardized Household Surveys from Around the World,” World Development Report 2009 Background Paper, The World Bank.
Morin, L.-P. (2011): “Cohort Size and Youth Earnings: Evidence from a Quasi-Experiment,” CLSRN Working Papers, UBC Department of Eco- nomics. O’Higgins, S. N. (2001): Youth Unemployment and Employment Policy: a Global Perspective. International Labour Organization. (2004): “Recent Trends in Youth Labor Markets and Youth Employment
Policy in Europe and Central Asia,” CELPE Discussion Paper, Centre of Labour Economics and Economic Policy, University of Salerno.
(2012): “This Time It’s Different: Youth Labour Markets during “The Great Recession”,” Comparative Economic Studies, 54(2), 395–412. Oreopoulos, P., T. von Wachter, and A. Heisz (2012): “The Short- and Long-Term
Career Effects of Graduating in a Recession,” American Economic Journal: Applied Economics, 4(1), 1–29.
Perugini, C., and M. Signorelli (2010): “Youth Labour Market Perfor- mance in
European Regions,” Economic Change and Restructuring, 43(2), 151–185. Rodriguez-Palenzuela, D., and J. F. Jimeno-Serrano (2002): “Youth Unemployment
in the OECD: Demographic Shifts; Labour Mar- ket Institutions, and Macroeconomic Shocks,” Working Paper Series 155, European Central Bank.
Shimer, R. (2001): “The Impact of Young Workers on the Aggregate Labor Market,” The Quarterly Journal of Economics, 116(3), 969–1007. Welch, F. (1979): “Effects of cohort size on earnings: the baby boom babies’
financial bust,” The Journal of Political Economy, pp. S65–S97. World Bank (2009): “Youth and Employment in Africa. The Potential, the Problem,
the Promise,” Discussion paper, The World Bank. Wright, R. E. (1991): “Cohort Size and Earnings in Great Britain,” Jour- nal of
Population Economics, 4(4), 295–305. Young, A. (1995): “The Tyranny of Numbers: Confronting the Statistical Realities
of the East Asian Growth Experience,” The Quarterly Journal of Economics, 110(3), 641–8

35
Appendix
Table 5: Sample of countries and years available in International Income Distribution Database
Country Name Survey Years Income Group Region Albania 1996, 2002, 2005 Upper Middle Income Europe & Central Asia Azerbaijan 1995, 2002 Upper Middle Income Europe & Central Asia Bangladesh 1991, 2000, 2005, 2010 Low Income South Asia Belarus 1998, 2002, 2005 Upper Middle Income Europe & Central Asia Belize 1993, 1994, 1996 - 1999 Lower Middle Income Latin America & Caribbean Bolivia 1997, 1999, 2000, 2003, 2005 - 2008 Lower Middle Income Latin America & Caribbean Brazil 1990, 1992, 1993, 1995-1999, 2001-
2009 Upper Middle Income Latin America & Caribbean
Bulgaria 1995, 2001, 2003, 2007, 2008 Upper Middle Income Europe & Central Asia Burkina Faso 1994, 2003 Low Income Sub---Saharan Africa Cambodia 1997, 2001, 2007, 2008, 2009 Low Income East Asia & Pacific Cameroon 1996, 2001, 2007 Lower Middle Income Sub---Saharan Africa Cape Verde 2000, 2007 Lower Middle Income Sub---Saharan Africa Chile 1990, 1992, 1994, 1996, 1998,
2000, 2003, 2006, 2009 Upper Middle Income Latin America & Caribbean
Colombia 2001 ‐ 2010 Upper Middle Income Latin America & Caribbean Costa Rica 1990 ‐ 2009 Upper Middle Income Latin America & Caribbean Cote d'Ivoire 1995, 2002 Lower Middle Income Latin America & Caribbean Djibouti 1996, 2002 Lower Middle Income Middle East & North Africa Dominican
1996, 1997, 2000, 2010 Upper Middle Income Latin America & Caribbean
Ecuador 1994, 1995, 1998, 1999, 2000, 2003 ‐2010
Lower Middle Income Latin America & Caribbean
Egypt, Arab Rep. 1998, 2005, 2006 Lower Middle Income Middle East & North Africa El Salvador 1991, 1995, 1996, 1998 --‐ 2009 Lower Middle Income Latin America & Caribbean Ethiopia 1995, 1999, 2000, 2004, 2005 Low Income Sub---Saharan Africa Fiji 1996, 2008 Upper Middle Income East Asia & Pacific Georgia 1998, 2005, 2010 Lower Middle Income Europe & Central Asia Ghana 1991, 1998, 2005 Low Income Sub---Saharan Africa Guatemala 2000, 2002, 2003, 2004, 2006 Lower Middle Income Latin America & Caribbean Honduras 1991, 2009 Lower Middle Income Latin America & Caribbean India 1993, 1999, 2004, 2007, 2009 Lower Middle Income South Asia Indonesia 1993, 1995, 1996, 1997, 1999,
2000 ‐2010 Lower Middle Income East Asia & Pacific
Jamaica 1996, 1999, 2001, 2002 Upper Middle Income Latin America & Caribbean Kazakhstan 1996, 2002, 2003 Upper Middle Income Europe & Central Asia Kenya 1997, 2005 Low Income Sub---Saharan Africa Kyrgyz Republic 1997, 2002 Low Income Europe & Central Asia Lao PDR 1997, 2002, 2008 Low Income East Asia & Pacific Lithuania 2000, 2004, 2005, 2006, 2007,
2008 Upper Middle Income Europe & Central Asia
Macedonia, FYR 2000, 2003, 2004, 2005 Upper Middle Income Europe & Central Asia

36
Country Name Survey Years Income Group Regionname Madagascar 1993, 2001 Low Income Sub---Saharan Africa Malawi 1997, 2005 Low Income Sub---Saharan Africa Maldives 1998, 2004 Lower Middle Income South Asia Mali 1994, 2003 Low Income Sub---Saharan Africa Mauritania 2000, 2008 Low Income Sub---Saharan Africa Mauritius 1999, 2001 ‐ 2008 Upper Middle Income Sub---Saharan Africa Mexico 1992, 1994, 1996, 1998, 2000,
2002, 2004‐2006, 2008, 2010 Upper Middle Income Latin America & Caribbean
Moldova 1998, 2002, 2005 Lower Middle Income Europe & Central Asia Mongolia 2002, 2008, 2009 Lower Middle Income East Asia & Pacific Morocco 1991, 1998 Lower Middle Income Middle East & North Africa Mozambique 1996, 2003, 2008 Low Income Sub---Saharan Africa Nepal 1995, 2003, 2008, 2010 Low Income South Asia Nicaragua 1993, 1998, 2001, 2005 Lower Middle Income Latin America & Caribbean Niger 1995, 2002 Low Income Sub---Saharan Africa Nigeria 1993, 2003 Lower Middle Income Sub---Saharan Africa Pakistan 1992, 1999, 2001, 2004, 2005,
2007, 2008 Lower Middle Income South Asia
Panama 1991, 1995, 1997, 1998, 2001‐ 2006, 2009, 2010
Upper Middle Income Latin America & Caribbean
Paraguay 1990, 1995, 1997, 1999, 2001 - 2010 Lower Middle Income Latin America & Caribbean Peru 1997 ‐ 2010 Upper Middle Income Latin America & Caribbean Philippines 1997 ‐ 2002, 2004 ‐ 2010 Lower Middle Income East Asia & Pacific Romania 1994, 2002, 2006, 2007, 2008 Upper Middle Income Europe & Central Asia Rwanda 1997, 2005 Low Income Sub---Saharan Africa Senegal 1995, 2001, 2005 Lower Middle Income Sub---Saharan Africa South Africa 1995, 2000, 2001, 2003 ‐ 2007 Upper Middle Income Sub---Saharan Africa Sri Lanka 1995, 2000, 2002, 2004, 2006, 2008 Lower Middle Income South Asia Tajikistan 1999, 2003 Low Income Europe & Central Asia Tanzania 1991, 1993, 2000, 2001, 2006,
2007, 2009 Low Income Sub---Saharan Africa
Thailand 1990, 1994, 2000, 2002, 2006, 2009 Lower Middle Income East Asia & Pacific Timor---Leste 2001, 2007, 2010 Lower Middle Income East Asia & Pacific Togo 2001, 2006 Low Income Sub---Saharan Africa Tunisia 1997, 2000, 2001 Lower Middle Income Middle East & North Africa Turkey 2000‐ 2010 Upper Middle Income Europe & Central Asia Uganda 1992, 2002, 2005 Low Income Sub---Saharan Africa Ukraine 1999, 2000, 2001, 2002, 2003, 2005 Lower Middle Income Europe & Central Asia Uruguay 2006, 2007, 2008, 2009, 2010 Upper Middle Income Latin America & Caribbean Venezuela, RB 1992, 1995, 1998 - 2003 Upper Middle Income Latin America & Caribbean Vietnam 1993, 1998, 2006, 2008 Lower Middle Income East Asia & Pacific Yemen, Rep. 1998, 2005 Lower Middle Income Middle East & North Africa Zambia 1998, 2002, 2003 Low Income Sub---Saharan Africa

37
Figure 10: The Figures depict the labor status and the share of students among youth (15-24) by region

38
Figure 11: The Figures show the employment status and sector where youth (15-24) work by region

39
Figure 12: The Figures compares two average population growth rates: The overall growth rate in all low and middle income countries between 1960-2011 which labor market data are available and the growth rate in our sample of countries between 1960-2011. The data seems from the Health, Nutrition and Population Statistics of the World Bank.