coal in the energy supply of china · pdf filecoal industry advisory board 1974.1999...
TRANSCRIPT

C O A L I N D U S T R Y A D V I S O R Y B O A R D
1974 .1999
I N T E R N A T I O N A L E N E R G Y A G E N C Y
Coalin the Energy Supply
of ChinaReport of the CIAB Asia Committee

FOREWORD
China, the world’s second largest energy consuming country and the foremost producer and consumer ofcoal, is an increasingly important player in international energy markets. This importance has been clearlyrecognised by the IEA, which signed aMemorandum of Policy Understanding in the Field of Energywiththe State Planning Commission (now the State Planning and Development Commission) in 1996, and whichhas since been developing co-operative relations with China in such diverse areas as energy statistics, policyanalyses and advice on regulatory reforms and market development, energy supply security, energy efficien-cy improvements, cleaner energy technologies and environmental protection.
Coal accounts for over 75% of China’s total commercial primary energy consumption and has been ofcrucial importance to China’s rapid economic expansion. Coal will inevitably remain the overwhelmingindigenous energy resource for the foreseeable future and an understanding of the major trends anddevelopments in this energy sector is essential for analysing the challenges that face China’s economy andenvironment today.
This report, prepared by the Coal Industry Advisory Board (CIAB), an advisory body to the InternationalEnergy Agency, provides an informative overview of the coal industry within the context of China’s energyeconomy. Descriptive rather than prescriptive, it examines the main economic, geographic and environmen-tal issues facing the industry. The importance of China to the climate change challenge is undeniable and theissue of technology transfer to ensure higher coal-burning efficiencies both in the power and industrialsectors is an issue of common interest to China and OECD countries.
This report has been reviewed informally by a number of Chinese organisations and their comments arereflected in the text. The report is published on my responsibility as the Executive Director of theInternational Energy Agency and does not necessarily reflect the views or positions of the IEA, its Membercountries, individual members of the CIAB or any official Chinese body.
Robert PriddleExecutive Director
1


FOREWORDby the CIAB Chairman
Leigh Clifford
China’s future, in political, economic and human terms, is of enormous importance to the world, not leastthe OECD countries. The anticipated development of the Chinese economy over the coming decades willpresent challenges as well as opportunities for investment and partnership to OECD member countries.
China’s present massive demand for coal, and its heavy reliance on the fuel, sets it apart from othereconomies. While China’s future options for energy sources may broaden, coal will continue to fuel China’sfuture economic growth for the foreseeable future. How coal is used in China, in terms of efficiency andemissions control, will be important both to the Chinese society and to other nations.
In 1994 the CIAB asked its then China Committee to survey the situation of coal in China. The first report,produced in 1995, was intended as an internal brief for CIAB members. With the development of IEArelations with China, including an energy seminar in December 1996 and follow-up discussions, the IEASecretariat encouraged the CIAB to expand and update the report and to make it more widely available. Thiswork was carried out in late 1998 and early 1999, through the efforts of the CIAB’s Asia Committee and theIEA Secretariat. The existence of the report owes much to the efforts of two people – Mike Allen, formerlyof Rio Tinto, who undertook the original draft, and Jeff Piper of the IEA Secretariat, who undertook muchof the detailed drafting of the latest revisions and additions.
I trust that this report will serve as a useful guide to those wishing to better understand the present Chinesecoal industry and opportunities for development. The CIAB looks forward to assisting the IEA indeveloping relations with the Chinese energy industries and in encouraging the use of coal in an energy-ef-ficient and environmentally compatible way.
3


Map of China indicating the provinces and major cities

TABLE OF CONTENTS
EXECUTIVE SUMMARY ................................................................................................................... 9
General .......................................................................................................................................... 9
Power generation .......................................................................................................................... 10
The environment ........................................................................................................................... 10
Technology transfer ...................................................................................................................... 11
Future prospects............................................................................................................................ 12
1. THE ECONOMIC CONTEXT ................................................................................................. 13
1.1 Profile of the economy......................................................................................................... 13
1.2 Economic prospects ............................................................................................................. 15
2. CHINA’S ENERGY ECONOMY ............................................................................................. 19
2.1 Energy reserves .................................................................................................................... 19
2.2 Energy supply....................................................................................................................... 19
2.3 Energy consumption ............................................................................................................ 21
2.4 Energy issues........................................................................................................................ 24
3. THE COAL INDUSTRY ............................................................................................................ 27
3.1 Structure of the coal sector................................................................................................... 27
3.2 Coal supply .......................................................................................................................... 31
3.3 Coal consumption ................................................................................................................ 39
3.4 Coal-related infrastructure ................................................................................................... 42
3.5 Coal market issues ............................................................................................................... 46
4. COAL AND THE ENVIRONMENT ........................................................................................ 53
4.1 Background .......................................................................................................................... 53
4.2 Regulatory structure............................................................................................................. 54
4.3 Impact of coal mining .......................................................................................................... 55
4.4 Impact of coal combustion................................................................................................... 56
4.5 Energy policy options .......................................................................................................... 60
5. TECHNOLOGY TRANSFER ................................................................................................... 67
5.1 Foreign investment policies and practices........................................................................... 67
5.2. Electricity sector and Independent Power Producers (IPPs) .............................................. 69
5.3 Clean coal technologies ....................................................................................................... 75
6. FUTURE PROSPECTS.............................................................................................................. 79
6.1 Current reforms in the coal industry .................................................................................... 79
6.2 Challenges............................................................................................................................ 80
6.3 Opportunities for co-operation............................................................................................. 81
7

ANNEXES
GOVERNMENT ORGANISATION CHART............................................................................. 84
I. GOVERNMENT STRUCTURE AND DECISION MAKING........................................ 85
II. HISTORICAL AND DEMOGRAPHIC PERSPECTIVES............................................... 87
III. INFRASTRUCTURE ........................................................................................................ 89
IV. TECHNOLOGY TRANSFER ........................................................................................... 93
V. DATA TABLES.................................................................................................................. 103
FIGURES
1 Indigenous energy production............................................................................................... 21
2 Electricity production by fuel ............................................................................................... 22
3 Total final commercial energy consumption: industry sector............................................... 23
4 Total final commercial energy consumption: residential/commercial sectors ..................... 24
5 Coalfields in China................................................................................................................ 32
6 China’s importance in world hard coal production: 1998 .................................................... 33
7 Total final coal consumption: 1980-1997 ............................................................................. 40
8 Chinese coke production: 1971-1997 ................................................................................... 42
9 Coal exporting provinces: net coal exports to other provinces: 1996 .................................. 48
10 Coal importing provinces: net coal imports from other provinces: 1996 ............................ 49
11 CO2
emissions from coal use by sector: 1980-1996............................................................. 60
12 Electricity consumption: 1980-1996..................................................................................... 72
DATA TABLES IN ANNEX V
1 World Coal Reserves (million tonnes).................................................................................. 103
2 Coal production by Province (million tonnes) ..................................................................... 104
3 Raw coal production by type of coal .................................................................................... 105
4 Coal production by producer ................................................................................................ 106
5 China’s coal exports 1985-1998 (million tonnes)................................................................. 107
6 China’s coal imports 1985-1998 (million tonnes) ................................................................ 107
7 China’s coal flows (million tonnes) ...................................................................................... 108
8 Production statistics for 14 major opencast mines in China................................................. 108
9 Raw coal production by types: 1994-1996 (million tonnes) ................................................ 109
10 Production of washed coal: 1980-1993 (million tonnes) ..................................................... 110
11 Summary of washed coal from state-controlled coal preparation plants.............................. 110
12 China’s freight transport by type: 1980-1996....................................................................... 111
13 Transportation demand in China: by weight-distance.......................................................... 112
14 Comparison of average efficiencies for electricity generation ............................................. 113
8

EXECUTIVE SUMMARY
GENERAL
With a population of nearly 1.25 billion and a recent record of high economic growth, the Chinese economyappears to be on a sound footing to maintain growth. The OECD.
1 estimates that the average annual growthrate for China, including Hong Kong, will be 5.6% over the period 1995 to 2020, compared to 8.5% for theperiod 1971 to 1995. Indeed, by 2020, China could be, by far, the largest economy in the world, in terms ofpurchasing power parity, with a GDP slightly less than half of that of the OECD combined.
As the economy continues to grow, pressure is building for further economic reform. In spite of the manychallenges China faces in opening up its economy, there is a demonstrable commitment on the part of theChinese government to continue the reform process. This reform process appears irrevocable and isexpected to continue, irrespective of changes in the political leadership.
China also acknowledges that its economic development is dependent on its interaction and involvementwith the outside world. China is beginning to appreciate that, as a major economic power, it must accept agreater responsibility than in the past. In particular there is an increasing acceptance by China of theenvironmental effect of its policies and actions on the rest of the world. However, it must be recognised that,in the final analysis, conflicts between environmental issues and economic growth will have to be resolvedby reconciling economic growth with greater environmental protection. The dilemma for China in the shortterm is how to balance the conflicting demands of sustained economic growth with a reasonable commit-ment to the environment.
China is the second largest energy consuming country in the world after the United States, with a very heavydependence on coal. In 1996, coal accounted for over 76% of primary energy supply (excluding combustiblerenewables and waste) and over 62% of final commercial energy consumption. Three quarters of theelectricity generated in China is coal-fired.
2, and China’s coal industry is the world’s largest, producingnearly 1,400 million tonnes ROM (run-of mine) in 1996. Coal production was originally optimisticallyforecast to reach 1,515 million tonnes ROM by the year 2000 and 2,100 million tonnes ROM by 2010, butrecent government moves to match production levels to slowing consumer demand could see production inthe year 2000 at a level closer to 1,100 to 1,200 million tonnes ROM.
While the infrastructure for coal transport, including rail and ports, has improved significantly over the pasteight years, it remains inadequate to meet current demand. However, the completion of the Shuo-huang
1. The World in 2020: Towards a New Global Age, OECD Paris 1997.2. Energy Statistics and Balances of Non-OECD Countries 1995-1996,OECD Paris 1998.
9

railway (the second dedicated coal line) and the Huanghua coal terminal in 2003, will provide up to 60million tonnes per year of new coal transport capacity. Capital rationing and water shortages restrict effortsto improve the quality of product coal through the greater use of coal washing plants, as does lack of demandfor better quality coal and the lack of a fair pricing regime to reflect the value of coal quality. With the strong,longer term, demand forecasts for coal, significant investment is required in infrastructure to meet thisdemand.
Coal is and will remain the main fuel for China in the foreseeable future. It is expected that the high level ofcoal usage will continue and more than likely grow. What will change is the way in which the coal is utilised.There is a large domestic and residential consumer group burning coal directly, which is the sector where theleast efficient methods of combustion occur, resulting in high levels of pollution. As more consumers areprovided with electricity and gas, less coal will be burnt directly in the residential sector. At the industriallevel, many boilers and plants have low thermal efficiencies and lack modern pollution control equipment.
Most of the coal consumed is unwashed. This results in large volumes of waste material being transportedto consumers, placing the transportation system under strain. Furthermore, the burning of unwashed coal iscontributing unnecessarily to pollution problems through higher SO2 and particulate emissions.
POWER GENERATION
Power generation relies on coal as its principal fuel. At the present time about 39% of Chinese coal is burntin power stations, 14% is used for coking, 10% is used for domestic and residential, 1% used for rail and therest is for other, mainly industrial, uses such as in the chemical, cement, ceramics and glass-makingindustries. By contrast, the United States burns some 87% of its coal in power utilities. Plans for powerstation development provide for coal to overwhelmingly remain as the primary fuel.
To meet its enormous appetite for electricity, China will need to develop some 20 GW of additionalgenerating capacity each year.
The Chinese power industry is characterised by a low penetration of clean coal technologies. Many plantsare old and are small/medium units, up to 300 MW in size, designed to burn low quality coal. The inefficientuse of coal in the power sector resulting from low thermal efficiencies causes high levels of pollution andhigher electricity generating costs.
In addition to China’s insufficient generating capacity, there has been under investment in transmissionfacilities. Further inefficiencies and power losses have resulted from a mismatch of the generating capacityand the transmission capacity.
THE ENVIRONMENT
China faces significant environmental challenges, with the prospect of a further deterioration of its environ-ment unless new technologies and remedial policies are more rapidly introduced. China’s existing environ-mental problems affect all parts of society. The increasing energy demands, generated by rising livingstandards, highlight the urgency and importance of addressing the problem.
10

China’s environmental problems extend well beyond its national borders. High pollution levels emanatingfrom China have an effect on the environment of some other countries in the eastern Asia region. China isrecognising it has responsibilities to the international community with regard to environmental matters. Itshould be encouraged and assisted to manage these problems.
As the world’s largest producer and consumer of coal, China faces “special needs” in managing andbalancing the environmental consequences of a growing economy fuelled primarily by coal. There arereadily identifiable potential areas for environmental improvement throughout the whole of the coal chain.At the coal face, for example, opportunities exist to improve mining methods to reduce methane emissionlevels and improve underground mine safety. Management of water and land resources can be improvedthrough the introduction of modern mining practices.
Solid waste disposal is a major problem and can be addressed by increasing the proportion of coal washed.This would have the benefit of improving the quality of coal fed into power stations, thereby improvingthermal efficiencies and reducing the costs of boiler maintenance. Significant problems are also causedthrough the use of high ash coal and the lack of scrubbers in power stations. The pattern of coal use, with somany residential and domestic consumers burning coal directly, is a further significant cause of environmen-tal air pollution.
TECHNOLOGY TRANSFER
Many of the environmental problems facing China can be addressed through the transfer of technology inboth the mining sector and in the use of coal. However, in China there is strong competition for a limitedamount of capital. Whilst the benefits of adopting existing, more efficient, technologies may be obvious tothe outside world, from China’s perspective there must be an economic benefit as well as a social(environmental) benefit for a technology transfer project to rank highly in China’s overall agenda. This isnot a problem peculiar to China; it is common for all developing countries.
In China’s case, there is a large potential to significantly improve the country’s environmental emissionlevels through the transfer of existing and proven technology. Much can be done through the exchange andimplementation of what is standard practice in the mining and power industries in other parts of the world.Major improvements can be achieved across a wide spectrum of environmental issues with «.off-the-shelf.»technology transfers.
However, in order to take advantage of the available technology, the Chinese authorities must address anumber of the legitimate concerns of their foreign partners.
• Firstly there is a need to fully recognise intellectual property rights and ensure the legal means ofprotecting these rights.
• Secondly, China is perceived as a higher risk country which, when coupled with the existing low levelsof return, discourages potential investors. Positive encouragement is needed to provide foreign inves-tors with the confidence to invest.
• Thirdly, the implementation of new technology may be slow because of China’s desire to develop itsown home-grown version. Given the pace of economic development and escalation in the environmen-tal problems resulting from that growth, China may not be able to afford the luxury of waiting for thedevelopment of home grown solutions. China may need to embrace more quickly much of the new
11

technology if it is to achieve acceptable standards of environmental management. China does possessthe technical capability to assimilate the transfer of new technologies.
China recognises many of these issues and is moving to put into place systems and structures for legaland economic co-operation between foreign and Chinese organisations. However, although China is increa-singly receptive to foreign investment and assistance, it does so according to its own terms and schedule,which sometimes may appear unrealistic. Nevertheless, the floating of “red chip” shares on internationalstock exchanges would indicate that China’s understanding of international markets is improving.
FUTURE PROSPECTS
From this desktop study of China, the CIAB Asia Committee has gained an understanding of the areas whereco-operation can be achieved with China through the transfer of clean coal and other technologies. TheCommittee suggests that the initial areas to target are coal mining, coal washing and the more efficientdesign of boilers and environmental equipment for new power plants.
Concentrating on these areas could deliver significant improvements across a wide range of issues – from areduction in pollution and emissions levels, better water and land management practice, safer and moreefficient coal mines, the more efficient use of the transport and distribution system by energy products,higher thermal efficiencies in power stations and ultimately cheaper and more reliable power.
The Committee believes there would be considerable benefit for the Coal Industry Advisory Board and theIEA in further co-operation with and co-ordination on China. This will require high level discussions withvarious Chinese authorities since Chinese collaboration and feedback are critical in the identification andselection of specific interest areas to be targeted.
The following specific recommendations have been agreed by the Committee:
1. The IEA should work with the appropriate Chinese authorities, drawing on the advice and expertise ofthe CIAB as appropriate, to identify specific opportunities for international co-operation in the transferof clean coal technology.
2. The search for such opportunities should focus on the following areas:
• efficient coal mining practices;
• coal washing;
• coal bed methane;
• thermal efficiency of new power plants;
• addition of desulphurisation equipment and low NOx burners and particulate emission controlequipment on power stations.
3. The IEA should explore other possible avenues to deepen co-operation with China in the coal sector.
12

1. THE ECONOMIC CONTEXT
1.1 PROFILE OF THE ECONOMY
BACKGROUND . China seeks to direct and determine its economic development through five year plans.The five-year plans are developed by the Government, in consultation with the provinces, and laid by theleadership before the plenum of the National Peoples’ Congress for approval.
Deng’s “Open Door Policy” was intended to allow foreign investment and technology into China to createmore wealth through modernisation and the subsequent export of goods. It was not intended to create anentirely capitalist society. At the same time it recognised that economic growth could not be controlled inneat geographic or planned units, and that greater affluence means a greater demand for autonomy by thewealthier provinces. There is now a growing disparity between the poor inland provinces and the wealthycoastal regions. Nine of the provinces in the eastern part of the country have a per capita GDP of 9,921Renminbi (Rmb), compared to 5,000 Rmb per capita GDP in the central provinces and 2,890 Rmb per capitaGDP in eleven western provinces. Some 7% of the population are considered to be below the nationalpoverty line (approximately 86 million people).
3 and this disparity encourages the movement of populationtowards the coastal provinces, creating further pressures on these regions. The Chinese leadership recogni-ses the political importance of continued and sustained economic growth in order to ensure social stability.
Government figures indicate that China’s GDP has grown from US$ 148.8 billion in 1976 to US$ 935billion in 1997, with an annual average growth rate over the past 10 years of 10.1%. The structure of China’seconomy is now diverse, with the industrial sector being the largest, accounting for 50.8% of GDP in 1997,compared to 29.5% for services and 19.7% for agriculture. Industrial growth over the past 10 years hasaveraged at 13.9% per year, compared to 8.7% for services and 4.4% for agriculture.
4. However, therecontinues to be a major uncertainty over the quality of China’s GDP statistics and it is widely agreed that thefigures published by China’s statistical authorities underestimate China’s GDP level and overestimate theGDP growth, at least over the last two decades.
5.
ENTERPRISE STRUCTURE. An important aspect of the economy is ownership and employment. Thereare effectively three types of enterprise ownership.
3. World Bank country brief: China at a glance, 28/08/1998.4. World Bank country brief: China at a glance, 28/08/1998.5. IEA World Energy Outlook, 1998 Edition. OECD Paris 1998, Pages 276-278.
13

Their relative importance in terms of percentages of employment and GDP are:
Sector Employment (%) Contribution to GDP (%)
State owned 50 25
Collectives 30 35
Private 20 40
EMPLOYMENT . Under-employment is a major problem in state-owned enterprises and the agriculturalsector. It is estimated that almost half the workforce in state-owned enterprises would be laid off with thewidespread use of effective management systems and processes.
Unemployment is already a significant concern in China, proving a drain on the central treasury and creatingsocial problems. An increase of up to another 60 million or more from state-owned enterprises could becatastrophic in terms of social unrest. This is a dilemma faced by the central government as it pushes forwardwith the reform of the state enterprises. It wants greater efficiency but also minimal loss of employment. Inan effort to ease the social tension arising from layoffs, the government has offered a three year socialcontract during which the unemployed will receive a minimum salary and training. After these three years,if the individual has not found a job, the contract is terminated. Since the recently-introduced unified socialsecurity net only covers the urban population, the remainder are dependent upon family solidarity. This leadsto state organisations being encouraged to retain employees dismissed from core- businesses. Most of thestate organisations have three main sections: core business, logistic business and non-core business. Thedevelopment of the non-core business section is mainly designed to arrange the unemployment inside theorganisation and in the local regions. Although the non-core business can accommodate some employees,many are still losing their jobs in the reform of the state enterprises.
Up to 40% of state enterprises are loss making and technically bankrupt, and the funding of these enterprisesis a major problem for introducing banking reform. Reform of the state-owned sector is hampered by thetwin problems of debt and unemployment.
One of the principal reasons for problem areas existing in the economy has been the rapid growth in the lastfifteen years, during which time there have been three occasions of intentional slowdown in order to cooloverheating. Government statistics indicate that the annual, real growth in 1997 was 8.8%, with GDPrecorded as amounting to US$ 935 billion.
6.
TRADE. China is one of the world’s largest trading economies. A tangible economic manifestation ofChina’s “open door” policy can be observed in its trade performance. China’s 1997 foreign trade totalledUS$ 325 billion, with exports increasing to US$ 187.7 billion and imports to US$ 142.3 billion. China’smain trading partners are Japan, the US, the EU, Korea and Chinese Taipei. The rise in the value of the yenagainst the dollar has impacted China since Renminbi are unofficially aligned with the US dollar.
SAVINGS. China has one of the highest savings rates in the world. National savings, as a percentage ofGNP, have risen from approximately 29% in 1976 to 42.2% in 1997. Savings at the end of 1996 totalled US$464 billion.
6. World Bank country brief: China at a glance, 28/08/1998.
14

FOREIGN INVESTMENT. China is the world’s second largest destination for foreign direct investment(FDI), behind the United States (although some care should be given to these figures due to the phenomenonof “round-tripping” whereby Chinese companies transfer funds to Hong Kong affiliates for re-investment inmainland China, with all the incentives enjoyed by “foreign investors”7). Between 1979 and the end of1997, China cumulatively approved 304,866 enterprises with foreign investment, with contracted foreigninvestment valued at US$ 521.1 billion and paid-in investment at US$ 221.8 billion. FDI increased fromestimated US$ 2.3 billion in 1987 to US$ 45.3 billion in 1997, with the top five investors (Hong Kong,Japan, Chinese Taipei, the US and Singapore) accounting for some 83% of FDI in 1997.
8.
INFLATION. With rapid economic growth, few developed methods of controlling the economy and theneed to subsidise many of the state-owned enterprises, inflation was a problem in the first half of the decade.With the tightening of monetary policy, inflation on a national basis dropped from an average of 17% in1995 to 2.8% in 1997.9. 1998 saw China experience deflation (– 0.8%).
10 and the Government, in responseto this, embarked on an expansionary fiscal policy in the form of a Rmb 100 million treasury bond forinfrastructure construction.
11.
Part of China’s problem lies in the large central government deficits since 1978. The 1994 deficit wasapproximately US$ 13 billion, although the 1996 deficit was reduced to US$ 7.3 billion, in line with budgetforecasts.
Among the methods used to finance the deficits is foreign debt. China has been the largest recipient of WorldBank loans since 1992, totalling US$ 31.13 billion, with US$ 2.8 billion in 1997 and another US$ 2.6 billionpledged for 1998.12. It has also received loans from the Asian Development Bank (over US$ 4 billion) andgovernment aid loans from Japan, but the rise in the value of the Yen discounted the benefit of its lowerinterest rates. China’s foreign currency reserves at the end of 1997 were US$ 140 billion, with the foreigndebt at US$ 138.2 billion in the same year.
13. Debt service ratio was 13% in 1997.
The Chinese are aware of their emerging economic strength, which is a source of both pride and confidence.Despite the recent problems, the basic economy is in a reasonable condition and the issues China faces arebeing addressed by the central and provincial governments.
1.2 ECONOMIC PROSPECTS
Although China still has a rapidly developing economy, official growth rates indicate a slow down, withgrowth estimated at 7.8% for 1998 and around 7% for 1999.
14 Official forecasts project the economy to growby an average of 5.5% per annum from 1995 to 2020 which, if realised, would make China the largesteconomy in the world in purchasing power parity terms.
15. Government policy is to preserve stability bymaintaining economic growth while, at the same time, reforming the state industries.
7. The World in 2020: Towards a New Global Age, OECD Paris 1997. Page 42.8. Ministry of Foreign Trade and Economic Co-operation (MOFTEC) official statistics.9. World Bank country brief: The World Bank and China.
10. China’s economic performance.China Economic Review. February 1999.11. The Outlook for China in 1999.Presentation by Wu Jinglian, Professor of Economics at the Development Research Centre of the
State Council, China, at the 1999 World Economic Forum in Davos, Switzerland.12. World Bank country brief: The World Bank and China.13. US DOE May 1998Country report on China.14. Economic Growth Rate.China Economic Review, February 1999.15. IEA World Energy Outlook, 1998 Edition.OECD Paris 1998. Page 279.
15

The World Bank estimates that China on its own will be the leader in terms of world trade by around 2010and, if Hong Kong and Chinese Taipei are included, this could be reached by 2002.
The Ninth Five Year Plan (1996-2000) gives highest priority to investment in agriculture to achieve selfsufficiency in food production and improved incomes for farmers. Of equal importance is investment ininfrastructure to support both the economic growth objectives and the spread of wealth to the poorer areas.
The principal objectives of the plan are to:
• maintain economic development and growth;
• integrate science, education and technology into the economy;
• reform state-owned enterprises;
• agricultural development to achieve self sufficiency;
• continue opening to the outside world;
• reduce the gap in development between locations;
• achieve simultaneous progress in economic, social and cultural aspects of Chinese society.
China’s basically strong economic fundamentals, steady reform process and the relatively isolated nature ofits economy have helped to insulate it from the worst excesses of the Asian financial crisis. However Chinahas not been completely immune, with export growth being adversely affected, foreign investment expectedto decrease and enterprise reforms staggering.
While China has been able to maintain its fixed exchange rate and continues to pursue a policy of nodevaluation, speculation continues as to whether devaluation will inevitably be necessary in order to makeexports more competitive with those of the neighbouring countries. However, China’s relative financialstability is based on several factors:
• unlike most Southeast Asian countries, capital inflows into China are predominantly composed oflong-term foreign direct investment and not short-term borrowing;
• the Renminbi is not yet convertible for capital transactions and plans for full convertibility by the year2000 have been postponed in response to the Asian crisis;
• China’s foreign reserves totalled over US$ 140 billion in September 1998, and China continues tomaintain a surplus both in its trade balance and current account.
ENTERPRISE RESTRUCTURING. Due to the inefficiencies and huge losses of the state-owned enter-prises, a reform called “modern enterprise system” (corporatisation) was started in 1995 at 100 selected stateenterprises. The reform attempts to improve the performance of state-owned enterprises by leading themonto the market and by upgrading management, production and distribution. The ultimate objectives of the“modern enterprise system” are to allow state-owned enterprises to be responsible for their own losses andprofits. More managerial autonomy will be given to the enterprises concerned. There is talk of allowing themore inefficient enterprises to be taken over, closed down or go bankrupt, but the reality is likely to be thatonly a few will be subject to this policy as a token gesture to try to encourage the others, especially in aperiod of slowing economic growth. This means that the need for subsidies will continue. In practical terms,more emphasis will be given to the formation of conglomerates from among the state-owned enterprises,
16

that will be seen as replicas of the “chaebols” in South Korea. Their purpose will be to contributesignificantly to the growth of the economy, as they are perceived to have done in Korea and Japan.
FINANCIAL RESTRUCTURING. Significant reform of both the banking system and the methods offinancial management will take place before 2001 as the leadership realises that the current situation is anobstacle to economic progress and a significant cost to doing business for both Chinese and foreignconcerns. There will be attempts to reform both the banking system and the methods of financial manage-ment. The reform of the banking system will see the admission of foreign banks (on their own or in jointventures) to do Renminbi or domestic business.
Closely allied to banking sector reform will be the development of financial markets and instruments/pro-ducts, including the reduction of the subsidisation of interest rates, the emergence of inter-bank rates anddevelopment of central bank monetary policy. The mutual fund law is being written and it is expected that anumber of foreign investment managers will have joint ventures operating by the year 2000. The Govern-ment will increase the sophistication of its national debt programmes to fund budget deficits.
Investment markets would also be opened up further to private participation with the introduction of a largernumber of more effectively regulated stock, futures and commodities exchanges. These changes will lead toincreasing pressure to make the Renminbi a fully convertible currency. Authorities permitted convertibilityon the current account in December 1996. Full convertibility, which was expected by 2000, has now beenpostponed as a result of the Asian financial crisis.
In summary, China’s economic future looks promising but is not without problems. Political stability will bean important element but even if the expected stability does not fully materialise, the fundamental economicgrowth looks set to continue.
17

18

2. CHINA’S ENERGY ECONOMY
2.1 ENERGY RESERVES
With coal accounting for 73.4% of the proven reserves of conventional energy in China and 94.3% of fossilenergy.16, it is inevitable that this fuel will continue to play the major role in supplying China’s energy needsinto the future. Coal reserves at the end of 1997 were estimated at 114.5 billion tonnes or some 57.2 billiontoe (tonnes of oil equivalent) which, at current rates of production, would last for nearly a century. Incomparison, oil reserves were estimated at 3.3 billion toe, with a production/reserves ration of 20.5 years,and gas reserves were estimated at 1.16 trillion cubic metres, or some 1.1 billion toe, with a production/re-serves ratio of 52 years (principally reflecting the current low rates of production).
17.
The distribution of energy resources varies widely from region to region, with nearly 67% of coal reservessituated in north and north-western China, while oil and gas reserves are concentrated principally in thenorth-east, east and far west of China, and off-shore. Northern China is the most energy rich region,followed by the south-west (due to hydro) and the north-west.
Regional distribution of Chinese energy resources in 1990: percentage of national resources.18
Region Coal Oil & gas Hydro Total
North-west China 23.6 11.1 9.9 20.0
North China 43.2 10.0 1.2 32.3
North-east China 5.8 47.8 2.0 5.9
East China 11.4 18.4 3.6 9.6
Centre-southern China 6.2 8.0 15.5 8.5
South-west China 9.9 4.7 67.8 23.7
2.2 ENERGY SUPPLY
Coal is the principal fuel source, accounting for over 78% of indigenous energy production in 1996 (comparedto 17.6% for oil, 2.1% for gas, 1.8% for hydro and 0.4% nuclear), with the principal deposits located in Shanxiprovince. Chinese coal production has more than doubled from 620 million tonnes in 1980 to nearly 1.4billion tonnes in 1996, helping to fuel the country’s spectacular economic growth.
16. Some important areas in the sustainable development of the coal industry.Study under the research programme of the China CoalSociety. December 1996.
17. BP Statistical Review of World Energy: 1998.Note that the conversion rates for Chinese coal (from tonnes to toe) and for Chinese gas (cubic metres to toe) have been taken fromthe1996 China Energy Annual Review.
18. China Energy Annual Review 1996.
19

China is the world’s sixth largestoil producer and, in 1997, produced 3.2 million barrels of oil per day,primarily for internal consumption. Nearly 90% is produced onshore and nearly one-third of the totalproduction comes from the Daqing field in north-eastern China. Since 1993, China has become a netimporter of crude oil and, in search of new reserves, China has been targeting the remote Tarim Basin in thenorth-west corner of the country and the offshore areas in the South China Sea.
While natural gas production in China has increased from 3.4 billion cubic metres in 1971 to 22.7 billioncubic metres in 1997, it still remains a marginal fuel within the Chinese energy balance and under-utilisedrelative to the total resource base (1.16 trillion cubic metres). Most gas is produced onshore in Sichuanprovince in western central China, but further developments are being targeted both on and off shore. Thelargest offshore gas field, Yacheng 13-1, began production in 1996, supplying gas to Hainan Island and to apower plant in Hong Kong. The current five-year plan foresees an annual production of 25 billion cubicmetres by the year 2000 and close to 30 billion cubic metres by the year 2005.
19.
Electricity production more than doubled between 1987 and 1997 to 1134 TWh, with coal-fired generationthe overwhelming source of electricity in China. Thermal generation accounted for 81.3%, hydro 17.4% andnuclear 1.3% in 1996. Coal-fired generation alone accounted for 75%.
20. A “ .Business-as-Usual” scenarioestimates electricity generation growing by an average 5.4% per annum to reach 2497 TWh by 2010 and3857 TWh by 2020.21.
China’s strategy for energy development is based on three main geographical areas:
• coal will be the main source of energy in the north-east regions of China,
• nuclear power will be the main focus of energy development in the western regions,
• hydro-power will provide most supplies of energy in the southern regions.
Installed electricity generating capacity in 1995 was 227 GW, of which 70% was coal-fired, 23% hydro, 6%oil-fired and remainder split between gas-fired and nuclear. Annual capacity additions over the past six yearshave been some 16 GW. Installed capacity could reach 757 GW by the year 2020, with 62% coal-fired, 26%hydro, 6% oil and 3% nuclear.
22. At least a fifth of the US$ 100 billion of investment required in the 1996 to2000 period is projected to come from overseas.
23.
China’s current Ninth Five Year Plan (1996-2000) targets the development of“coal by wire” , the construc-tion of thermal power plants near mine-mouths with the electricity distributed to the main consumer demandcentres on the coast by high voltage, long distance, transmission lines. The 2,100 MW Yangcheng powerstation in Shanxi province is the first of such projects, with the power generated by this plant destined forShanghai and the lower Yangtze industrial region. The first of the six 350 MW units is expected to enterservice in mid-2000.
19. IEA World Energy Outlook, 1998 Edition.OECD Paris 1998. Page 294.20. IEA Energy Statistics and Balances of non-OECD countries, 1995-1996. OECD 1998.21. IEA World Energy Outlook, 1998 Edition.OECD Paris 1998. Page 287.22. IEA World Energy Outlook, 1998 Edition.OECD Paris 1998. Page 287.23. International Coal Report. Issue 426. 16 June 1997. Page 21.
20

Figure 1Indigenous energy production
China’s development ofnuclear power is in its early stages, with the 300 MW pressurised water Qinshanplant, south of Shangai, coming into commercial operation in 1993 and the 2× 900 MW Daya Bay complexnear Hong Kong in 1993/4. There are a further four plants under construction, and official plans call for 20GW of nuclear capacity by the year 2010 and between 40 to 50 GW by 2020.
24.
China has the largesthydroelectric potential in the world estimated at 675 GW, of which 290 GW iseconomically exploitable and 56 GW actually exploited (in 1996). By 2020, hydro-power capacity mayreach almost 200 GW.25, including the 18.2 GW Three Gorges project on the Yangtze river.
2.3 ENERGY CONSUMPTION
China’s share of world energy consumption doubled from 4% to 8% between 1970 and 1988. As of 1997,China consumed about 10% of the total world energy demand, with this share expected to increase to 14%by the year 2010 and 16% by 2020, due to a higher anticipated growth rate than other areas of the world.With its economy expected to grow by around 5.5% - 6% per annum over the period 1995 to 2020, Chinacould account for some 23% of the increase in world energy demand.
26.
24. IEA World Energy Outlook, 1998 Edition.OECD Paris 1998. Page 289.25. IEA World Energy Outlook, 1998 Edition.OECD Paris 1998. Page 288.26. IEA World Energy Outlook, 1998 Edition.OECD Paris 1998. Page 275.
21

Figure 2Electricity production by fuel
In 1996, coal accounted for 76% of China’s total commercial primary energy supply of 891 Mtoe, comparedto 19% for oil, 2% gas and hydro, and 0.4% nuclear. Although the IEA forecasts that China’s coal demandwill grow by 3.1% per year between 1995 and 2020, this is notably less than the growth in demand for oil(4.6%), hydro (5.5%), gas (6.5%) and nuclear (9.6%). However coal is still expected to account for 67% oftotal primary energy demand in the year 2020, compared to 24% for oil, 4% for gas, 3% hydro and less than2% for nuclear.27.
Total final consumption of commercial energy in 1996 was 659.8 Mtoe, of which over 62% was coal, nearly22% oil, 11% was electricity and only just over 2% natural gas. The industrial sector alone accounted fornearly 65% of final consumption, which is substantially higher than the OECD average of 31%. Thecommercial and residential sectors accounted for 20% of total final commercial energy consumption and thetransport sector under 9% (compared to an OECD average of 33%).
Total final energy consumption is expected to increase by 3.5% per year to 2020, with electricity forecast togrow most rapidly (5.4% per year), followed by heat (5.3% per year), gas (5.2% per year) and oil (4.5% per
27. IEA World Energy Outlook, 1998 Edition.OECD Paris 1998. Page 280.
22

year). The slower growth in coal (2.4%) reflects the anticipated loss of market share in the industrial andresidential/commercial sectors.
28.
By sector, coal accounted for nearly 72% of final commercial energy consumption by industry in 1996,followed by electricity (11%) and oil (10%). While oil is the predominant energy source in the transportsector as a whole, coal still remains the dominant fuel in the rail sector (5 Mtoe). In the residential sector,coal’s dominance is even more pronounced (75%), with only 10% electricity and 9% oil. Indeed, thecontinuing overriding importance of coal in the urban residential sector presents significant environmentalchallenges and, according to World Health Organisation figures, five of China’s major cities were amongstthe world’s ten most polluted in 1995.
For the residential sector as a whole, non-commercial biomass consumption, at over 206 Mtoe in 1996, wasnearly three times that of coal and twenty times that of electricity. One of China’s goals is to bring electricityto 72 million rural residents who do not now have electricity, which would result in electricity beingavailable to 95% of the population. At present, about 33% of households are not connected to a grid.
29.
Gas remains a marginal fuel within the China, with substantial amounts used for the production of chemicalsand fertilisers. Only minimal amounts are used in electricity generation.
Figure 3Total final commercial energy consumption: industry sector
28. IEA World Energy Outlook, 1998 Edition.OECD Paris 1998. Page 436.29. International Private Power. Fourth-Quarter 1998.
23
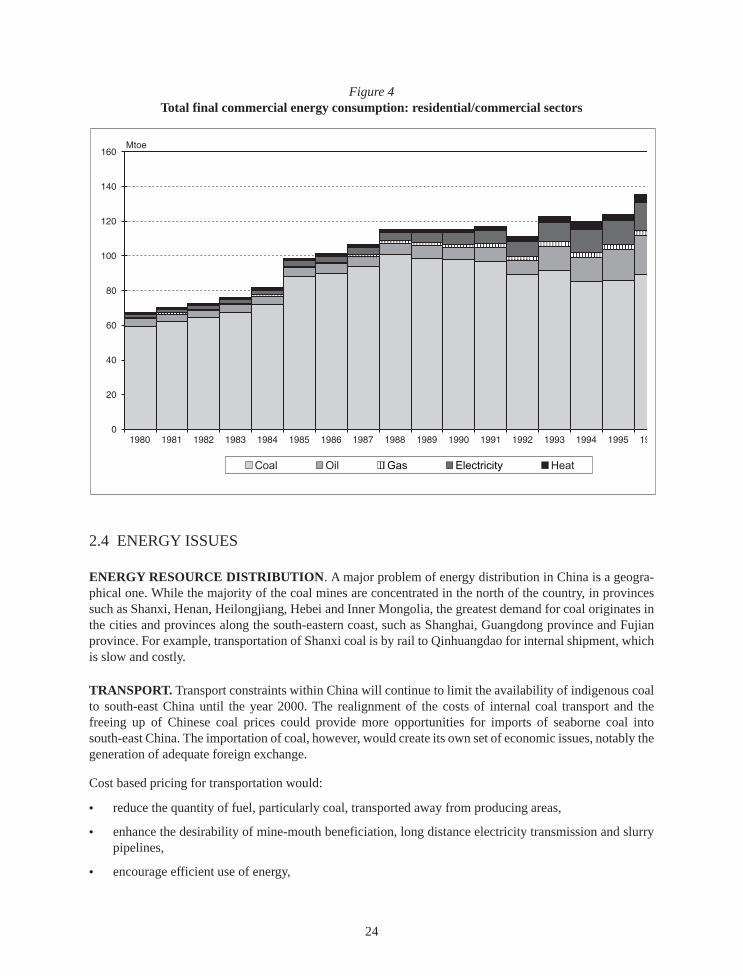
Figure 4Total final commercial energy consumption: residential/commercial sectors
2.4 ENERGY ISSUES
ENERGY RESOURCE DISTRIBUTION . A major problem of energy distribution in China is a geogra-phical one. While the majority of the coal mines are concentrated in the north of the country, in provincessuch as Shanxi, Henan, Heilongjiang, Hebei and Inner Mongolia, the greatest demand for coal originates inthe cities and provinces along the south-eastern coast, such as Shanghai, Guangdong province and Fujianprovince. For example, transportation of Shanxi coal is by rail to Qinhuangdao for internal shipment, whichis slow and costly.
TRANSPORT. Transport constraints within China will continue to limit the availability of indigenous coalto south-east China until the year 2000. The realignment of the costs of internal coal transport and thefreeing up of Chinese coal prices could provide more opportunities for imports of seaborne coal intosouth-east China. The importation of coal, however, would create its own set of economic issues, notably thegeneration of adequate foreign exchange.
Cost based pricing for transportation would:
• reduce the quantity of fuel, particularly coal, transported away from producing areas,
• enhance the desirability of mine-mouth beneficiation, long distance electricity transmission and slurrypipelines,
• encourage efficient use of energy,
24

• bring on new mines and transport infrastructure, and
• cause a shift of some types of economic activity from coastal to interior provinces, initially alongtransportation corridors such as the Yangtze River.
PRICING OF ELECTRICITY AND FUELS. Since 1978, price reform has been a key component ofChina’s liberalisation process and Chinese sources indicate that the market now determines 90% of retailprices and 80% of agricultural and raw materials prices. Pricing of electricity under the old commandeconomy resulted in detrimental consequences for economic development. While deregulation of prices forenergy and industrial staples such as steel (other than military and other limited sectors) has provided animpetus for energy market rationalisation, the government continues to maintain price controls over“strategic” sectors of the economy such as transportation, crude oil, petroleum products, power andtelecommunications.
ENVIRONMENTAL EMISSIONS. Emissions of sulphur-dioxide from coal burning are expected to risefrom 16 million tonnes in 1990 to 30 million tonnes for the year 2000. Carbon dioxide emissions per personhave risen from 2.08 tonnes in 1990 to 2.59 tonnes in 1996. While still much lower than the Japanese figureof 9.36 tonnes per capital or the US figure of 20.05 tonnes per capita in 1996, the CO2 growth rate of 24.5%is high compared to the Japanese increase of 9% or the US increase of 2.8% over the same period. Notsurprisingly, given China’s high dependency on coal, 83% of CO2 emissions in 1996 came from coalcombustion. Between 1990 and 1996, CO2 emissions from coal-fired public electricity and heat generationnearly doubled, whilst the emissions from the use of coal in the manufacturing industries and constructionincreased by 42%.30.
In addition, accompanying particulate emissions have had an adverse effect on the air quality in majorpopulation centres.
EFFICIENCY OF POWER GENERATION AND INDUSTRIAL PLANT. Improved efficiency offersthe opportunity of development based on the notional extra supply without the accompanying growth in theenergy supply sector.
Although several units of 300 MW and 600 MW are now being constructed, 71.8% of the installed thermalcapacity in China is coal-fired and less than 300 MW in size. Indeed, some 34.8% is coal-fired capacity ofless than 100 MW.
31. The small size of the plant, combined with inconsistent fuel quality and low loadfactors due to low plant availabilities or lack of fuel, mean that the average thermal efficiencies range from27% to 29%, compared to around 38% in OECD countries.
32. With the smaller plant consuming 20-40%more fuel than larger plants, it is estimated that some 300 million tonnes of coal could be saved by raisingthe efficiency of boilers and other coal fired plant by 30-35%. Potential savings up to 400 million tonnescould be achieved.
While the authorities intend to replace many of the smaller coal-fired units with larger ones, acute electricityshortages in some regions mean that small and medium sized plants are still being built, and older plants willbe kept in service. Official plans are to replace 8,000 MW of the existing smaller units by 12,000 MW ofnew larger units.33. In April 1999 the Government announced a prohibition on the construction of new small
30. CO2 emissions from fuel combustion 1971-1996.IEA/OECD Paris 1998.31. Information received from the China Coal Information Institute.32. IEA World Energy Outlook, 1998 Edition.OECD Paris 1998. Page 275.
25

coal-fired plants within the area covered by the main grids and a more restrictive policy on new powerprojects generally.
INFRASTRUCTURE INVESTMENT . The annual capital expenditure required in coal production,transportation and use (electricity generation alone) would be around Rmb 284 (US$ 32.6) billion.
A number of investors, including the World Bank and Japanese Investment Banks, continue to invest in theprogressive five year plans to boost the Chinese energy sector through the construction of new mines, oildevelopments and infrastructure. Part of the long term difficulty for China is that the industrial infrastructureavailable in China does not match a modern rising national economy. This is particularly so in the areas ofrail, water transportation and port facilities. It is the lack of efficient transportation that exacerbates theuneven distribution of resources.
Clearly the cost of upgrading the transport infrastructure and installing coal preparation facilities, pipelinesand transmission equipment will require massive investment within an economy in which many sectors arecompeting for the available capital.
33. International Private Power. Fourth-Quarter 1998.
26

3. THE COAL INDUSTRY
3.1 STRUCTURE OF THE COAL SECTOR
3.1.1 Government ministries
There are numerous government ministries affecting the coal industry in China. These are:
• the State Development Planning Commission (SDPC),
• the State Economic and Trade Commission, under which there is:
• State Administration of Coal Industry (SACI),
• the Department of Electric Power,
• State Administration of Machine-Building Industry,
• State Power Corporation,
• Ministry of Foreign Trade & Economic Co-operation,
• Ministry of Land and Natural Resources,
• Ministry of Railways,
• Ministry of Water Resources.
Each Ministry or Administration plays a separate role. As in most countries, all mineral resources are stateowned assets. Developers must pay for any involvement.
China adopted a new Coal Industry Law which became effective in December 1996, the aim of which is toestablish a rational plan for the protection of Chinese coal resources and to standardise production andoperational activities through the development of the coal industry. The new law reinforces the position andresponsibility of the relevant Coal mining bureaux for the administration of the coal industry within therespective administrative regions.
STATE ADMINISTRATION OF COAL INDUSTRY (SACI) , under the State Economic and TradeCommission (SETC), is responsible for administering the coal industry. This administration, established asa result of the meeting of the Ninth National Representative Congress held in March 1998 in Beijing,replaces the oldMinistry of Coal Industry.
27

The main functions of the State Administration of Coal Industry (SACI) are to:
• prepare strategies for the national development of the coal industry,
• establish guidelines, policies and regulations for the coal industry,
• organise the sale, allocation and transport of coal from state owned mines,
• improve the efficiency in coal production through technology, and
• co-ordinate relations between the coal industry, government and associated ministries.
The SACI currently has seven administrative departments.34:
• Foreign Affairs (including general administration),
• Planning and Development (planning the medium and long term development strategy for the coalindustry, including the structural readjustment of the coal sector – as well as managing Governmentfinancial investment and proposing capital construction projects in the coal industry),
• Industrial Management (coal industry rules, norms and regulations. Emphasis on quality standardisationand technological advancement, as well as responsibility for law enforcement and inspections in thecoal sector. Co-ordination of relations in the coal sector and between the coal sector and other industriessuch as the railways and the electricity sector),
• Enterprise and Institution Reforms (drafting proposals on economic, enterprise and institutional re-forms in the coal sector, and implementing the restructuring of the coal companies),
• Personnel,
• Local Township Coal Mines Rectification (management guidance and restructuring or closure of smallmines. Supervisory, inspection (including safety) and approval function for local coal mines),
• Enterprise Down-level Transfer (organising and implementing the transfer of state-owned key coalmines, enterprises and institutions to provincial or other lower administrative levels).
For the purposes of administration, coal production is based around provinces and special autonomousregions. An example is the China Northeast and Inner Mongolia Coal Industry Corporation which adminis-ters the coal industry within three provinces of Northeast China (Heilongjiang, Jilin, Liaoning) and InnerMongolia. The SACI controlled about 38% of national production at the beginning of 199835, with thebalance of the output coming from “local mines” operated by provincial, county and collective organisa-tions. Apart from the enterprises operating the mines and larger mining regions, the SACI was alsoresponsible for the enterprises operating the preparation plants, the gasification companies and the machine-ry equipment factories, as well as the China Local Coal Mine Corporation which managed the local minesin China.
However, mines owned by the SACI were transferred to the provincial authorities during 1998, leaving theSACI as a purely regulatory body for the industry.
34. China Coal. English Supplement. Volume 3.35. China to miss export target, International Coal Report, 5 October 1998.
28

CHINA COAL INDUSTRY ASSOCIATION (CCIA).
Established in March 1999 to serve as a bridge between the government and coal firms as the coal sector ismoved towards a more market-orientated structure. Registered with the Ministry of Civil Affairs, the CCIAis under the guidance of the State Administration of Coal Industry and is expected to play an increasinglyimportant role in promoting market reform, drafting industrial regulations concerning quality, technologyand management standards, and enhancing foreign co-operation and exchanges.
36.
CHINA NATIONAL COAL INDUSTRY IMPORT EXPORT CORPORATION (CNCIEC).
Most of the coal enterprises and coal users do not have the independent autonomy to export or import coal.The activities of importing and exporting have to be supervised through the CNCIEC, which is a State runforeign economic trade and co-operation enterprise founded in 1982. Its activities are as follows:
• coal & coke trading – both import and export,
• import and export of coal mining equipment and related technologies, and
• domestic sales of imported commodities (coal, equipment).
CNCIEC is the official export channel for Chinese coal, though not the sole export vehicle. It has established80 wholly owned subsidiaries, branches and representative offices.
37. It is responsible for all exports to Japanand Korea and, in 1997, exported 27 million tonnes of China’s 30.7 million tonnes of coal exports and280,000 tonnes of coke. CNCIEC exports reached 29.25 million tonnes in 1998, with a target of 40 milliontonnes for the year 2000.
38. Other licensed exporters are: the Shanxi Provincial Government Coal Import andExport Corporation, which handled 2.2 million tonnes in 1997, Shenhua Trading Company and Minmetal.
CNCIEC also plays a major role in the importation of coal, importing 1.4 million tonnes in 1997, and holdsthe government’s equity in the Qinhuangdao port. In August 1997, the Chinese authorities allocated toCNCIEC, as wholly owned subsidiary companies, the China National Coal Sales and TransportationCorporation (CNCSTC), the China National Local Coal Mines Corporation, the China Production andTechnology Development Corporation and the Ping Shou Coal Industry Corporation (previously owned andoperated by the Occidental Petroleum group). The Ping Shou mining region provides some 30% of Chinesecoal exports.
In 1997, CNCIEC established a joint venture company Sunshield Resources Pty. Ltd. in Sydney, Australiato expand Chinese ownership of Australian mines and to help with coal imports to China’s developingindependent private power projects.
China Coal Overseas Development Corporation (CODCO), another CNCIEC subsidiary, was established toundertake foreign engineering and overseas development projects. CODCO has pursued projects in theMuralaung and Singlurus coalfields in Kalimantan, as well as providing technical assistance to the Kiwiracoal mine in Tanzania and pursuing projects in Colombia and Turkey.
36. New coal industry association launched.China Daily. 19 March 1999.37. CNCIEC web site: www.chinacoal.com.38. Coal exports strike rich seam, diversify markets. China Daily. 23 January 1999.
29

3.1.2 Industry structure
Coal mines may be classified into three types:
• the 94 key state-owned mines, which were centrally administered by the State Administration of CoalIndustry, and which have now been transferred to the provincial authorities;
• local coal mines managed by provincial, county governments;
• township, village and private mines managed by small collective organisations or individuals.
In the 1980’s, small collective township mines were actively encouraged by the central government as a wayof alleviating coal shortages, especially in the rural areas. In the period 1980 to 1984, 41% of the growth incoal production came from rural mines which now produce over 40% of the national output.
Investment in the coal sector was neglected and heavy reliance was placed on increased production from thecollective and private mines. The government recognised that while small scale operations were uncoordi-nated and inefficient, they had contributed to rural energy supply and provided employment in rural areas.
In recognising the limitations of the small township mines and the need to expand coal production, the StateCouncil adopted a new “Industrial Policy for the 1990’s” in March 1994. The policy stated that theconstruction of large key State-owned mines must be accelerated and efforts made to promote the transfor-mation and improvement of local mines and mines operated by townships. Investment funds were to bemade available, including permitting foreign investment in mine construction, coal transportation andprocessing, and integrated planning and construction of coal preparation and processing plants with minedevelopment. With the glut of coal at the beginning of 1998, Government policy is to increase the economicefficiency of the existing larger mines and to open new ones whilst, at the same time, closing the 25,800small illegal mines which can undercut the prices of the larger mines due to their very low capital costs andthe fact that they ignore safety regulations. The closure of the small illegal mines is intended to reduceannual production by 250 million tonnes and to more closely match supply with demand.
In August 1998 there were 94 main state owned coal companies, 2,500 local government owned mines and75,000 smaller mines run by township and village enterprises.
39. Among these smaller mines, which producesome 44% of national output, some 25,800 are due for closure under the plans announced by the StateAdministration of Coal Industry in spring 1998.
In 1996 the work-force totalled 5 million, of which the state owned enterprises employed 3.3 million and thelocal government owned enterprises employed 0.71 million. The remaining employment (about 1 million)came from small collective and private coal organisations.
HEALTH AND SAFETY . In 1995, some 5,990 people lost their lives in mining accidents. This is 907, or15.2%, less than in the previous year. 40% of fatalities were due to gas, with a further 34% due to roofcollapse. Nearly 72% of fatalities occurred in the small township mines, 30% of which operated withoutpermits and up to 70% failed to meet minimal safety requirements. The annual industry death rates in thesemines, at 8.45 fatalities per million tonnes of coal produced, is over seven times that of the main state coalmines, at 1.18 fatalities per million tonnes of coal produced. Moreover these mines are small in scale, poorlyequipped and labour intensive. Since December 1994, there has been a more rigorous enforcement of theminimal safety codes, merging and upgrading of a number of the mines and efforts to close down the illegal
39. Xinhau News Agency, 23 August 1998, quoted inAsian Energy News, September 1998.
30

ones.40. The 1996 mining law obliged coal companies, from July 1997, to buy accidental injury insurance fortheir workers, which will provide compensation up to 20 times greater than had previously been the case.
ROYALTIES AND TAXES. Coal mining royalties are collected through two taxes specific to mining, theResource Tax and the Mineral Resource Compensation Fee. The resource tax for coal is levied at a ratebetween Rmb 0.3/tonne and Rmb 5/tonne (0.04 to 0.6 US$ per tonne), whilst the mineral resourcecompensation fee, a sales tax, is calculated as 1% of the annual sales revenue, adjusted by a “miningrecovery rate coefficient” (which factors the variance between actual output and the approved mine designcapacity).41.
Value Added Tax on coal is levied at a rate of 13%, lower than the standard rate of 17%. All businesses areliable to an income tax at the rate of 33%, although there are concessions for certain joint ventures.
3.2 COAL SUPPLY
According to an estimate by the authorities, China’s total estimated coal resources within a depth of 2,000metres total 5,570 billion tonnes.
42, although much of this total would not be economically recoverable.
In a ranking of coal reserves, China is third in the world after the USA and Russia (world coal reserves areshown in the Table 1 of Annex V). China has 11% of the world’s proven recoverable reserves with 114.5billion tonnes, with 75% classified as bituminous, 12% anthracite and 13% lignite. Steam coal accounts for83% of the total, with coking and gas coals 17%. Steam coal reserves are mainly concentrated in the northand north-west, accounting for 46% and 38% of the national total respectively. The average sulphur contentof the steam coal reserves is 1.12%, with an ash content of 16.84%.
43.
Whilst China’s reserves are large, the proportion of coal reserves available to depths of 150 metres is small.In the future, the bulk of the reserves will need to be mined from depths exceeding 150 metres.
PRINCIPAL DEPOSITS . Coal bearing strata are widely distributed in China, with the main coalfieldslocated in north and north-west China. Some 65% of all proven recoverable reserves occur in the provincesof Shanxi, Shaanxi and Inner Mongolia. Most of the deposits are of Carboniferous, Permian and Jurassicage. Carboniferous coals are found over extensive areas of eastern China.
The pattern of coal production in China has altered significantly over the past 40 years. Whereas the northand east of the main coal belt was formerly the main production area, emphasis has shifted to the coalfieldsof Shanxi, Shaanxi and Inner Mongolia.
40. China Coal Industry Yearbook 1996, China Coal Industry Publishing House, Beijing, China, 1997.41. Coal licensing and production tax regimes. IEA Coal Research. London 1998.42. Coalbed Methane Resources in China. Ye Jianping and Tang Shuheng. Proceedings of the International Workshop of Coalbed
Methane Recovery and Utilization. December 1998.43. China Energy Annual Review 1996.
31

Figure 5Coalfields in China
Source: US DoE. EIA.Country Energy Profile. China. February 1995.
North-east. In the North-east of China, the provinces of Heilongjiang, Jilin, and Liaoning contain signifi-cant coal deposits. In the east of Heilongjiang are the Henang (Jurassic) and Shuangyashan (Carboniferous-Permian) coalfields, while southern Jilin contains the Tonghua (Carboniferous-Permian-Jurassic), Liaoyuanand Yinchengtsu (Jurassic), and Chiaho and Holung (Carboniferous) basins. In central Liaoning, there arethe Tiefa and Kangping coalfields and the Penchi basin, with the Fouhsin basin in the west of the province.
North-Central . The most concentrated coal-bearing area in the country lies in the north-central part of easternChina, and extends across the provinces of Shaanxi, Shanxi, Hebei, Henan, Shandong and Anhui, and intoInner Mongolia.
32

Note that statistical data on the Chinese coal industry should be treated with some caution as much of it isnot consistent.
COAL PRODUCTION . Between 1980 and 1996, production more than doubled from 620 million tonnesto 1,397 million tonnes, with annual growth rates of around 2.7% in the early 1990’s peaking to a staggering9.6% in 1995, before dropping back to 2.6% in 1996. However, since then production has declined, withtotal output in 1997 some 3.5% lower than the previous year, at 1,348 million tonnes, and first estimates for1998 some 11% lower at 1,200 million tonnes. There are plans to reduce output by a further 100 milliontonnes to less than 1,100 million tonnes in 1999.
44.
Figure 6China’s importance in world hard coal production: 1998
Eleven Chinese provinces produced over 50 million tonnes a year of coal in 1996, and over 60% of Chineseproduction came from seven of the 26 producing provinces. Shanxi province is both the leading coalproducing and coal consuming region in the country, producing nearly 25% of total Chinese production (349million tonnes) and exporting nearly 63% of its output to other provinces (and 5% overseas).
Other important coal producing provinces, largely concentrated in the north-central and north-easternregions of the country, are Henan (108 million tonnes), Sichuan (96 million tonnes), Shandong (90 million
44. China’s coal sector seeks to get back into black.China Daily. 8 January 1999.
33

tonnes), Heilongjiang (82 million tonnes), Hebei (82 million tonnes) and Inner Mongolia (73 milliontonnes). Details of coal production by province can be found in Table 2 of Annex V.
The largest coal mining area is Datong in Shanxi province, with production in 1996 at over 31 milliontonnes. Other major coal mining areas, producing over 10 million tonnes in 1996, were:
• Xishan (17.6 Mt), Yangquan (15.6 Mt), Pingshuo (12.2 Mt) and Jincheng (10.7 Mt) in Shanxi province;
• Pingdingshan (20.8 Mt) in Henan province;
• Yanzhou (16.1 Mt) and Xinwen (11.2 Mt) in Shandong province;
• Jixi, (13 Mt), Hegang (12.8 Mt) and Shuangyashan (10 Mt) in Heilongjiang province;
• Kailuan (17.8 Mt) and Fengfen (10.9 Mt) in Hebei province;
• Tiefa (12.2 Mt) in Liaoning province;
• Xuzhou (13.3 Mt) in Jiangsu province;
• Huaibei (15.7 Mt) and Huainan (11.9 Mt) in Anhui province.45.
Whilst the data indicates that approximately 47% of the coal produced is officially classed as coking coal,caution is required in the interpretation of the Chinese definition as only 17% of total production is washedor beneficiated. Furthermore, throughout the 1980’s, the proportion of total production classified as cokingcoal has remained stable in the range of 45-49% of total production. Production figures by coal type areshown in Table 3 of Annex V.
The major share of production comes from State-owned mines. Table 4 of Annex V shows the productionfrom each category of mine. From these figures it is evident that, between 1980 and 1995, the share ofproduction from central and local state-owned mines declined significantly from just under 82% to less than56%, with the major increases coming from the rural collective and private mines.
With the depletion of reserves in the north of China, production is shifting to the eastern fields in Shanxi andInner Mongolia. In addition, the State Administration of Coal Industry has directed that the future emphasisshould be on the development of new large, efficient, mines.
According to Government figures, the total investment for state-owned key mines in 1996 was 18.12 billionRmb, an increase of 8.3% over the previous year, while newly added fixed assets totalled 744 million Rmb.In the same year, 30 new mines with a total annual production capacity of 12.5 million tonnes werecommissioned, compared to 51 new mines with a capacity of 26.2 million tonnes commissioned theprevious year. At the end of 1996, 316 new mines were under construction, with a total foreseen capacity of177.1 million tonnes.46.
OPEN CUT MINING. It is estimated that only 7% of proven recoverable reserves can be mined by opencut methods, of which 70% is lignite.
47. Open cut mining contributes approximately 5% of the total coaloutput. Future production development will result from increases in underground mining capacity asgeological conditions are not amenable to large scale open cut mining.
45. China Energy Annual Review 1996.46. China Coal Industry Yearbook 1997, China Coal Industry Publishing House, Beijing, China, 1998.47. China Energy Annual Review 1996.
34

Of the 78 open cut mines in China, 22 are State owned. The State mines produced 32.3 million tonnes of coalin 1995. The average size of the open cut mines in China is much smaller than in Australia, USA or SouthAfrica. Key production statistics for major open cut mines are shown in Table 8 of Annex V.
Concentration of open cut mines within the three main areas of mining activity in China
Area Number ofOpen cut mines
Average productivity of each mine(million tonnes/year)
Central Area 20 7.4
North-eastern area 11 9.4
Western area 9 5.3
Total 40 7.5
Production will be about 50% from the Central area, 30% from the North-eastern area and the balance fromthe Western area.
A number of advantages of open cut methods are leading to an expansion of operations:
• HIGHER PRODUCTION. The maximum output for an underground mine in China is 4.0-5.0 milliontonnes per year. Open cut mines currently under development will produce 8.0-15.0 million tonnes peryear.
• SHORTER CONSTRUCTION PERIODS. The development time for a surface mine is one quarter toone third of the time necessary to construct an underground mine with the same production capacity.
• LOWER COST. The cost of open cut mining is 13-14% lower than that for underground mining.
• HIGHER LABOUR PRODUCTIVITY. Labour productivity in surface mining is over twice that ofunderground mines.
• LOWER UNIT INVESTMENT. The investment required to produce a tonne of coal from an open cutmine is 20-30% less than for an underground mine.
• HIGHER COAL RECOVERY. The average rate of coal recovery in underground mining was only32%, whilst the level in a surface mine is over 95%.
• CONDITIONS. Open cut mining offers employees improved working conditions and a higher safetyrecord.
UNDERGROUND MINING. Coal seams differ from region to region but are considered to be easy tomine with seam thickness averaging 2.7 metres. Seams are generally flat to slightly dipping with approxi-mately 20% dipping from 10o to 25o. The average depth of all mines is estimated at 330 metres, althoughsome mines are at a depth of 1,000 metres.
State owned mines typically have longwall retreat faces, and operate with a low degree of mechanisation. Atthe main state-owned mines, the mechanisation levels both for face mining and roadway development areabout 74 percent. The mechanisation degree at the local government mines is much smaller than that of themain state-owned mines.
35
Non-state owned mines are totally unmechanised, with annual production rates in the range of 5,000 tonnesto 100,000 tonnes.
Some 46% of the state-owned coal mines are estimated to have a high methane content, at over 10 cubicmetres/tonne, and as a result, carry a higher safety risk. Seven out of every ten coal-mine explosions inChina are caused by methane and more than 40% of the deaths in the industry are attributed to it. However,the “gassy” mines also offer substantial opportunities for coal bed methane operations (reference below).
Productivity in Chinese coal mines compares poorly with world standards:
• Chinese mines produce between 100 and 1,250 tonnes/man year.
• Poland and Germany produce between 400 and 6,000 tonnes/man year.
• Australia produces 7,600 tonnes/man year.
• The United States produces 10,600 tonnes/man year.
Government plans provide for productivity levels to rise to 1,500 tonnes/man year. Part of the reason for lowproductivity is the inclusion of non-productive ancillary workers in the productivity calculations. The totalworkforce includes all employees in a mining district, including workers involved in education and thehealth services. The State Administration of Coal Industry redeployed 500,000 employees in the period1990-1995 and the aim is to reduce the workforce by a further 500,000 by the year 2000.
Chinese coal mines achieved significant improvements during the Seventh “Five Year Plan” (1986-1990)with annual increases of 5.4% in worker productivity, through a 20% increase in mechanisation andincreased production from rural mines.
COAL PREPARATION. Chinese coal is classified into three main product types; anthracite, bituminouscoal and brown coal. Within each category of coal there are numerous sub-classifications. Productionfigures by various coal classifications are shown in Table 9 of Annex V.
The tonnage of raw coal being washed has increased by 68% between 1980 and 1993 (reference Table 10 ofAnnex V). In 1995 some 280 million tonnes of production was washed, which was equivalent to approxi-mately 22% of total production. The Ministry of Coal Industry set an ambitious target to raise the level ofcoal washed to 500 million tonnes by the year 2000.
48. While it was originally difficult to increase theproportion of total production coal washed, given the large increases in production that were forecast to theyear 2000 and the restricted availability of water resources, the recent decline in overall production may helpto achieve the target. Certainly the trend, before the glut of coal emerged towards the end of 1997, was notpromising, as can be seen by examining the capital investments over the period 1993-1996:
48. Activity Development and Use Clean Energy Technology Promote Sustainable Energy Development.Paper presented by ShiDinghuan of the Department of High Technology, Ministry of Science and Technology at the China-EU Conference in Brussels,4-5 March 1999.
36

1993 1994 1995 1996
Number of new mines 24 33 51 30
Total capacity (Mt) 11.2 7.1 26.2 12.5
Number of new washeries 5 3 6 7
Capacity (Mt) 10.6 6.7 7.8 11.5
At the end of 1996 a further 14 washeries were under construction, with a total capacity of 33.6 milliontonnes. However, no construction of new washery plants was started during 1996 and only one had beenstarted in the previous year, compared to the 10 started in 1994.
49.
Two thirds of the coal that is washed is for the production of coking coal, and only 11% of steam coal iswashed. Recovery rates for both coking and steam coal are low by world standards reflecting inefficienciesin the preparation plants. A summary of tonnages of coal washed in State-controlled preparation plants isshown in Table 11 of Annex V.
COAL TRADE. The north Asian region is the principal export market for Chinese coal, with Japanreceiving nearly 40%, South Korea 27% and Chinese Taipei 16% of total exports. China and Japan have along term trade agreement in place for the export of coking and steaming coal. Chinese coal exports, ataround 29 million tonnes, accounted for 2% of total Chinese coal production and represented about 6% ofthe world coal trade in 1996.
50. During 1998, the Chinese coal export authorities sought to expand exportsas a method of overcoming problems of over-production, setting a very optimistic target of 35 milliontonnes for the year and 50 million by the year 2000. Exports in fact amounted to 32.5 million tonnes in1998.
51. Chinese coal exports are listed in Table 5 of Annex V.
In 1996, China imported over 3.2 million tonnes, principally steam coal (including anthracite) fromAustralia, South Africa, Russia, Vietnam and Indonesia and some coking coal from Australia and NewZealand. It has been suggested that China will be importing between 6 and 8 million tonnes per year in threeto five years time, mainly steam coal and semi-anthracite.
52. Chinese coal imports are shown in Table 6 ofAnnex V.
COAL BED METHANE. Coal Bed Methane, commonly known as coal gas, is a high quality natural gasabsorbed in coal seams. It is also a greenhouse gas which is some 20 times more potent than carbon dioxide.Coal mining is estimated to contribute an estimated 10% of total methane emissions from human activities,and China alone accounts for up to a third of this.
53. When captured, methane can be a highly efficient, cleanand cost-effective fuel.
Chinese coal bed methane reserves to a depth of 2,000 metres are estimated at 35,000 billion cubic metres,distributed mainly in the Erdousi Basin, Hatu Basin of Xinjiang, Huainan and Huaibei, South Sichuan andnorth-west Guizhou and the Liupanshui coalfields. Of this, 34% is at a depth of less than 1,000 metres.
49. China Coal Industry Yearbook 1997, China Coal Industry Publishing House, Beijing, China, 1998.50. Coal Information 1997. IEA/OECD Paris 1997.51. Coal exports strike rich seam, diversify markets, China Daily. 23 January 1999.52. China to miss export target, International Coal Report, 5 October 1998.53. “Development of Coal-Bed Methane Resources”project specification, Global Environment Facility, UNDP.
37

While some 728 million cubic metres were drained in 1997.54, around 19.4 billion cubic metres escape into
the atmosphere each year (which is close to the total annual production of natural gas).
Regional distribution of CBM resources in China.55
Area Resources (billion metres3) Percentage
Northeast 2,479.8 7.4%
North 21,125.4 62.8%
Northwest 5,063.6 15.1%
South 4,967.8 14.8%
Total 32,636.6 100.0%
Mining areas with good prospects for coal bed methane extraction are: Huainan, Yangquan, Liliu, Jincheng,Huaibei, Hancheng, Panjiang, Dengeng, Huangling, Tianfu, Tiefa, Shuangyashan, Songzao, Fuxin andFushun mining areas.
There are 290 mines which are designated as “gassy”, with estimated reserves of 259 billion cubic metres.A total of 156 mines are fitted with extraction systems, although recovery rates are around 21% comparedto the rates of up to 50% in the United States.
56. Higher methane emission rates will occur as deeper minesare built and increased ventilation costs and safety risks will result.
While China has begun to develop coal bed methane as a source of clean energy for power generation,development is still in the initial stages. The State Administration of Coal Industry has carried out 4demonstration projects with financial assistance of US$ 10 million from the Global Environment Facility ofthe United Nations Development Programme (UNDP) between 1992 and 1998. One project has the Xi’anBranch of the China Coal Mining Research Institute conducting a comprehensive evaluation of coal bedmethane resources to identify areas where coal bed methane resources may be exploited. The other threeprojects being implemented separately in Kailuan, Tiefa and Songzao areas involve underground horizontaldrilling and surface vertical drilling processes to extract coal bed methane. The State Administration of CoalIndustry has begun to co-operate with foreign companies such as the Enron Company of USA on coal bedmethane exploration, testing and evaluation in Huainan, Liliu, and the Pingdingshan mining areas.
The State Administration of Coal Industry recognised the importance of coal bed methane development bycreating a National Coal Bed Methane Leading Group in 1993. The group, working under the leadership ofVice Coal Minister Han Ying, was established to co-ordinate the national coalbed methane developmentwork. The State Administration of Coal Industry announced the development of coal bed methane as one ofthe three strategic projects for the coal industry at the National Coal Industry Working Conference in 1994and it became a “task of key importance” in the country’s Ninth Five Year Plan (1996-2000).
In May 1996 the China United Coal Bed Methane Corporation (CUCBM) was set up to commercialiseprospecting, development, transport, marketing and utilisation of CBM in China, in co-operation with
54. Welcome Address by Karl Schultz, CBM Programs Manager, USEPAat the International Workshop on Coalbed Methane Recoveryand Utilization. Beijing. 12 November 1998.
55. The Prospects of Exploration and Development and International Co-operation of Coalbed Methane in China.Paper presented bySun Maoyuan, Xin Wenjie and Fan Zhiqiang of China United Coalbed Methane Co. Ltd. at the China-EU Conference in Brussels,4-5 March 1999.
56. Financial AnalysisModel for Coalbed Methane Projects at ChineseCoal Mines.Zhu Chao, Liu Xin and Wang Wanxing. Proceedingsof the International Workshop on Coalbed Methane Recovery and Utilization. December 1998.
38

foreign companies. In January 1998, CUCBM signed an agreement with Texaco for the first commercialdevelopment of Coal Bed Methane in Anhui Province, covering an area of 2,676 km2 with estimated CBMresources exceeding 60 billion cubic metres. Total investment is expected to amount to US$ 500 million,with output reaching 500 million cubic metres per year. By the end of 1998, three exploratory wells had beensunk.
57.
Preparations are also underway for a further four additional exploratory projects between China United andthe US firms ARCO and Philips, to jointly explore the gas resources in the Sanjioa, North Sanjiao, Shilouand the Linxing concessions situated in the Hedong coalfield in the west of Shanxi province. Estimatedcoal-bed methane resources there exceed 440 billion cubic metres, and at least 45 exploratory wells and 1,200to 2,800 production wells will be drilled with a total investment of US$ 3 billion. Annual output is expectedto reach 3 billion cubic metres by 2010 when the four projects are fully operating commercially.
58. By theend of 1998, six exploratory wells had been sunk.
CUCBM itself has targeted the Qinshui basin in central Shanxi province as a major area for development,with preliminary exploration indicating that some 200 billion cubic metres are distributed over an area of1200 km2. By the end of 1998, 10 wells had been sunk and a further 10 were planned. A 200 km pipelinemay be constructed to transport this gas east to Anyang or Zhengzhou in Henan Province, to connect to theZhongyuan oilfield pipelines.59.
By the year 2000, CUCBM plans to produce 1 billion cubic metres of CBM annually and up to 10 billioncubic metres by 2010, of which 7 billion cubic metres is planned from Shanxi Province alone.
Methane gas extraction represents an important area for further co-operation and development to:
• improve mine safety,
• reduce greenhouse gas emissions, and
• provide a valuable source of fuel for power generation.
3.3 COAL CONSUMPTION
DEMAND. Coal contributed 76% of China’s total commercial primary energy supply in 1996. During theperiod 1980 to 1996, coal consumption increased in China at an average rate of 5.6% a year, faster than theaverage growth rate of 5.3% a year for total primary commercial energy consumption. However, in 1997,coal consumption may have declined.
The IEA forecasts that the growth in coal demand, at 3.1% per year between 1995 and 2020, will be notablyless than that of other fuels. However, coal is still expected to remain the dominant fuel used in China for theforeseeable future, accounting for 67% of total primary energy demand in the year 2020.
60.
57. The Prospects of Exploration and Development and International Co-operation of Coalbed Methane in China.Paper presented bySun Maoyuan, Xin Wenjie and Fan Zhiqiang of China United Coalbed Methane Co. Ltd. at the China-EU Conference in Brussels,4-5 March 1999.
58. China to exploit coal-bed methane resource. Power in Asia. 19 October 1998.59. Development Strategy and Target for Coalbed Methane Industry in China.Sun Maoyuan, Vice-President of CUCBM. Proceedings
of the International Workshop on Coalbed Methane Recovery and Utilization. December 1998.60. IEA World Energy Outlook, 1998 Edition.OECD Paris 1998. Page 280.
39
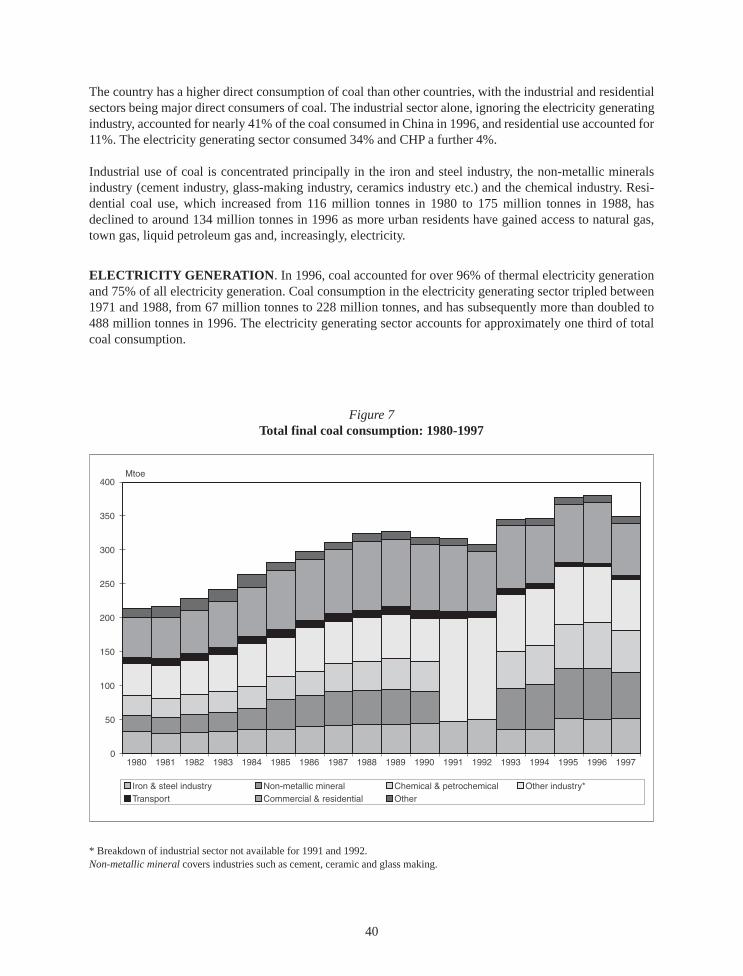
The country has a higher direct consumption of coal than other countries, with the industrial and residentialsectors being major direct consumers of coal. The industrial sector alone, ignoring the electricity generatingindustry, accounted for nearly 41% of the coal consumed in China in 1996, and residential use accounted for11%. The electricity generating sector consumed 34% and CHP a further 4%.
Industrial use of coal is concentrated principally in the iron and steel industry, the non-metallic mineralsindustry (cement industry, glass-making industry, ceramics industry etc.) and the chemical industry. Resi-dential coal use, which increased from 116 million tonnes in 1980 to 175 million tonnes in 1988, hasdeclined to around 134 million tonnes in 1996 as more urban residents have gained access to natural gas,town gas, liquid petroleum gas and, increasingly, electricity.
ELECTRICITY GENERATION . In 1996, coal accounted for over 96% of thermal electricity generationand 75% of all electricity generation. Coal consumption in the electricity generating sector tripled between1971 and 1988, from 67 million tonnes to 228 million tonnes, and has subsequently more than doubled to488 million tonnes in 1996. The electricity generating sector accounts for approximately one third of totalcoal consumption.
Figure 7Total final coal consumption: 1980-1997
* Breakdown of industrial sector not available for 1991 and 1992.Non-metallic mineralcovers industries such as cement, ceramic and glass making.
40

The IEA’s 1998 World Energy Outlook forecasts that electricity generated from coal will account for1,729 TWh in the year 2010, compared to 810 TWh in 1996, and may grow to 2,612 TWh by the year 2020.While this forecast indicates that coal’s share in the electricity generation mix may fall from 75% in 1996 to68% by the year 2020, as hydro and nuclear penetrate further, coal-fired electricity generation is projectedto increase by 5% per annum. Inputs to power plants could increase at a slightly lower rate, due toanticipated efficiency improvements, but this could still mean coal consumption, for electricity generationalone, exceeding 1,300 million tonnes by the year 2020.
COKE PRODUCTION . Coke production in China, which expanded steadily between 1971 and 1984,from 22 million tonnes to 45.6 million tonnes, tripled in the period 1984 to 1997 to 138 million tonnes. Thiswas a direct result of the rapid increase in steel production and China now appears to be one of the most steelintensive countries in the world. In addition, the Chinese steel industry uses, on average, one-third moreenergy per tonne of steel than the US industry.
61.
Nearly 40% of all Chinese coke is produced in the main coal-producing province of Shanxi. Hebei provinceproduced around 8% of the national total, followed by Liaoning at 6% and Sichuan at 5.5%. Besides beingproduced by the major steel companies, coke is also produced in Shanxi province by local entrepreneurs atsmall beehive coke plants (these are temporary structures made of bricks which can easily be assembled ortorn down).62. The Government has periodically suggested that it will cut back beehive coke production asit is a major source of pollution, but the economic incentives are very strong to keep them operating. Theywill only gradually be closed down as more modern, commercial mechanical (recovery type) coke plants arebuilt.
China is now the world’s largest coke exporter, with exports having increased from around 1 million tonnesin 1991 to over 10 million tonnes in 1997 (almost half of the world coke trade). Chinese coke is consideredto be the most competitive in the world, with the majority of it being beehive coke. With the increasingapplication of PCI in the domestic steel business since 1994, more coke is becoming available for export anda number of the large steel mills, such as Baosteel, have been developing an export business for their surpluscoke.
63. The imposition of an anti-dumping levy by the Indian Government on Chinese coke imports in April1998 pushed down prices further and led to increased Chinese coke exports to Europe and America. In anattempt to strengthen the position of its coke exporters, the Chinese government intends to restrict thenumber of companies permitted to export coke to seven and to cut beehive coke production in Shanxiprovince by at least 30%.64.
61. IEA World Energy Outlook, 1998 Edition.OECD Paris 1998. Page 283.62. Coking coal. The Outlook for the Future.Jennifer Bennett. FT Energy Publishing. London. 1996.63. Chinese coke exports, turning point or crisis.? World Coal. October 1998.64. China cuts coke production.International Coal Report. 30 November 1998.
41

Figure 8Chinese coke production: 1971-1997
Note that in the China Statistical Yearbook 1991-1996, the total production of coke by regions is 114.8 million tonnes for 1994. However,the same source indicates, in the energy balance for 1994, a lower figure of 98.8 million tonnes (as used above).
3.4 COAL-RELATED INFRASTRUCTURE
The inability of the transport system to meet demand has been the major constraint in the supply of coalwithin China. Rail capacity is inadequate to support the level of coal production, which leads to theaccumulation of coal stockpiles at mines. The Chinese Government has recognised the limitation of theexisting infrastructure and has given priority to increasing the capacity and efficiency of the nation’stransportation system. Investment in the transport sector has increased to 2.6% of GDP since 1991.
ROAD. Road transportation carried about 20% of all freight in 1995, with most activity being concentratedin the coastal areas. Road transport of coal is used extensively by small mines which do not have direct railaccess. In 1995 some 28 million tonnes was transported by road in the Shanxi province alone. Poor qualityroad surfaces are a major problem in the less developed areas.
The short haul delivery of coal to dispersed users is dominated by small trucks in the 3-5 tonne range. Onlong-haul routes larger trucks, in the 15-25 tonne range, have been in use since the early 1980’s to overcomeshortcomings in the rail system. The growth in production and number of rural mines was a factor in the use
42

of trucks since the 1980s, as many of the mines are not connected to the rail system. A road network linkingsmall mines to the railhead or waterways will be an important future development.
RAIL. Railways are a major part of China’s transportation system and coal is a major commodity of the railsystem (nearly 45% of railway transport capacity in 1996, compared to 7% for metal ores, and 6% for ironand steel, non-metal ores and mineral building materials). Administration of the rail system has shifted fromthe central ministry and is handled by 12 regional administrators. The length of railway track grew from21,800 kilometres to 56,678 kilometres between 1949 and 1996, with electrified track covering 10,082kilometres of this distance. There are plans to extend the railway system to 70,000 kilometres by the year2000. Every province except Tibet is linked to the rail system. Of the railway line added since 1949, 75%has been built to the west of the north-south Beijing-Guangzhou artery for defence reasons. The systemwhich serves the industries and mines in the eastern half of the country is severely overburdened
• PRIORITY. Coal and coke are given priority access to the railway system because of their importanceto the economy. Coal and coke accounted for 45% of rail freight tonnage in 1995, with average railhauls of around 580 kilometres.
65. As local officials only control the rail network within their ownprovince, large customers must cultivate relationships with officials in each region to guaranteescheduled wagons. Rail space is booked monthly and not usually confirmed until 10 to 15 days beforeshipment.
• FREIGHT DENSITY. Existing infrastructure is estimated to be capable of carrying only 60% ofdemand. Annual lost production due to the nation-wide rail congestion has been valued at Rmb 400billion (US$ 46 billion). Freight densities averaged 15 million tonnes per kilometre during the secondhalf of the 1980s. This level was double that of the USA and three times that of India. Steamlocomotives with payloads to 3,000 tonnes still play a major role in the Chinese rail system. Trafficvolume has increased 7% annually since 1980 through better use of the existing network. See Table 13in Annex V (Transportation Demand in China: By Weight-Distance).
• TRACK. The greatest part of the network is 1.453 metre standard gauge, single track while 18,423 ki-lometres is double track and 10,082 kilometres is electrified. There are 10,000 kilometres of industrialline with gauges ranging from 0.762 to 1.067 metres.
• INVESTMENT. The central government has announced a national objective of constructing new linesto meet the forecast rail freight demand of 1.8 billion tonnes by 2000 (of this some 850 million tonneswill be coal). Major development projects have been announced which will enable coal reserves in thewest to access the demand centres on the eastern seaboard and in the south-west regions. Ten majorprojects for railway construction, electrification and double tracking are due to be completed before theyear 2000. Beijing is exploring different options to pay for this development. Hundreds of millions ofdollars in World Bank and Asian Development Bank loans have already been secured. Funding for“joint-venture” railway lines developed outside the national rail network is being solicited frominvestors (though not necessarily foreign firms).
Since control of the rail system shifted to the 12 regional administrations, local rail agencies have felt freeto raise their rates. Rail freight pricing has climbed significantly to fund expansion, which had beenhampered by subsidised rates.
65. Programs and Priorities for Increasing Coal Burning Efficiency in China and Implications for Greenhouse Gas Emissions.Paperpresented by Zhengang Xu, Yaqin Gao and Xiangqin Lei to the Global Environment Facility workshop on June 16,17 1997 inAmsterdam, The Netherlands.
43

The coal-dedicated 638 km Da-Qin electrified railway, from the country’s largest coal mining area, Datong,in the north of Shanxi province to the largest coal export port at Qinhuangdao, east of Beijing, became fullyoperational recently. This facility has an annual transport capacity of 100 million tonnes.
66.
Construction of a second coal dedicated railway began in 1997. This 600 km double track electrified line,running from Shuozhou in Shanxi Province to Huanghua on the coast of Hebei Province, will have acapacity of between 30 and 60 million tonnes per annum in the short term and up to 100 million tonnes inthe longer term. Once completed, it will significantly expand the transport capacity of coal produced in theShenfu-Dongsheng coalfield and the central region of Shanxi Province. A new coal loading port atHuanghua is also under construction.
The idea has also been floated of reopening an existing rail link from China’s north-eastern provinces to theSiberian port of Nakhodka. This is being investigated by the Japanese trading firm Marubeni for thepossibility of bringing some 5 to 6 million tonnes of Chinese coal to the international market. However, thiswould involve transhipment from Chinese gauge to Russian gauge wagons, requiring the construction of atranshipment facility and investment of US$ 20 million.
67.
INLAND WATERWAYS. Inland navigation has historically been China’s most important form of transpor-tation, although it is often unsuitable for coal distribution as it generally does not provide the most directrouting. In 1995 some 24.5 million tonnes of coal was transported along inland waterways and forecasts forthe year 2000 suggest up to 60 million tonnes will be moved in this manner. However there may be limitedscope for increasing the capacity of inland waterways in the short term as insufficient funds have beenallocated to the maintenance of existing navigable channels. Unreliable water channels also restrict the useof long haul shipping.
The major waterways for coal transportation are:
• CHANGJIANG (Yangtze River). The Changjiang has an all-year navigable distance of nearly3,000 km. The most important section is between Zhicheng (Hubei) and Nantong (Jiangsu), near themouth of the river. This section is serviced by river ports at Zhicheng, Wuhan, Yuxikou, and Nanjingwith rail connections to the north. New coal-loading facilities have been constructed at Zhicheng andWuhan to handle vessels up to 10,000 DWT. Coal from Shanxi, Hubu, Henan and Anhui provinces isdispatched to the coastal provinces of Jiangsu, Zhejiang and Shanghai.
• HUANG HE (Yellow River). The Huang He has been of limited importance as a coal route largelybecause navigable sections of the river were poorly connected to coal sources. Dredging of a 550 kmsection linking the Shenmu coalfield with the existing waterway and railroad at Jiaozuo (Henan) hasprovided an alternative to the rail system.
• THE GRAND CANAL. The southern section of the canal between Hangzhou and Xuzhou has beenupgraded to be 40m wide and 4m deep. It is now suitable for single and double barges carrying parcelsof 1,300-1,500 tonnes and 2,600-3,000 tonnes respectively. The waterway could provide an alternativeor supplementary route for coal coming from southern Shandong and northern Anhui destined forShanghai and markets on the lower Changjiang.
66. China: a new zest for exports,World Coal. October 1997.67. Entwicklung von Angebot und Nachfrage auf dem Steinkohlenmarkt(1997) by Hans Gruß, in Zeitschrift für Energiewirtschaft.
Vol. 1/98. Page 17.
44

• ZHUJIANG (Pearl River). The Pearl River delta is a major receival focus for coal. A number of privatepower stations (Shajiao B & C), as well as Mawan, rely on imported coal. Vessels are limited to38,000 DWT.
COASTAL SHIPPING. Coastal coal shipments in China were 165 million tonnes in 1991. Almost all coalshipments are in a north to south direction. Distances range from 1,350 km to 2,500 km, from Qinhuangdaoto Shanghai and Guangzhou respectively. Vessels vary from small general cargo coasters of 5,000 DWT tolarger handy-sized bulk carriers of 20,000-30,000 DWT. Of the 58 sizeable ports along China’s coast, 15 areunder the jurisdiction of the Ministry of Communications (MOC). The main coal-loading ports are in thenorth (Qinhuangdao, Qingdao, Shijiusuo and Lianyungang), while the main unloading ports are in the southand eastern provinces. Shanghai accounts for almost half of the coal unloadings.
COAL PORTS. The capacity of Chinese coal ports was estimated at 125 million tonnes in 1995. This isexpected to increase to 220 million tonnes by the year 2003. Thirteen deep-water coal berths have been builtin recent years. A further twelve berths were built in inland waterways of the Grand Canal and YangtzeRivers. Port capacity has increased over the past decade as port administrations have been decentralised. TheMinistry of Communications technically has responsibility for the administration of Chinese ports.
Major coal loading facilities are located at Qinhuangdao, Qingdao, Shijiusuo (renamed Rizhao), Lianyun-gang, Dalian and Zhanjiang. Capacity of these ports was 120 million tonnes in 1995. Each port is capable ofloading handy sized vessels of 20,000 DWT - 35,000 DWT.
Qinhuangdao, Rizhao, Lianyungang and Qingdao are capable of loading Panamax sized vessels. Rizhao andQinghungdao are capable of loading Cape size vessels of 100,000 DWT capacity. Qinghungdao has anannual capacity of some 78 million tonnes and is currently being expanded to 100 million tonnes capacity.In addition to the 4 major ports, there are a number of other ports capable of handling smaller vessels.
State approval has been received for the construction of a new 30 million tonne coal port at Huanghua inHebei province. Phase 1 costing US$ 600 million will consist of four berths capable of accommodating35000 DWT vessels. The port is expected to be completed by the year 2000. Major expansion is planned forTianjin port where five new berths will be built with a forecast capacity of 70 million tonnes by the year2000.
The major coal receival facilities are located in the ports of Shanghai, Ningbo, Huangpu, and Yingkou.Yingkou has an unloading capacity of 5 million tonnes and is the site of China’s first receival facility forself-unloading vessels of 26,000 DWT capacity.
There are plans to build Cape size receival facilities in the Mawan and Zhuhai areas of Guangdong province.
SLURRY PIPELINE. A joint venture was established in 1994 to build and operate coal slurry pipelines inChina. The State Administration of Coal Industry holds a 49% share in the joint venture consortium throughits subsidiary, China Coal Construction and Development Corporation, while the majority share is held byan international group of US and Australian firms.
It is proposed that an 800 kilometre pipeline be built from Shanxi province to Qingdao in the coastalprovince of Shandong. It is proposed to construct the pipeline on a Build-Operate-Transfer (BOT) basis,with completion during the Ninth Five Year Plan.
45

The pipeline will have an annual capacity of 15 million tonnes, of which 5 million tonnes will be suppliedto local power stations. There are intentions to export the coal to South Korea, Taiwan and Japan.
Sponsors of the slurry pipeline claim that costs of pipelines over a 750 kilometre distance are half the costof rail and a quarter of the cost of road transport, based on US experience. Slurry pipelines provide additionalenvironmental benefits including minimal noise, no dust and no loss due to transport or handling whencompared to alternate transport methods. Slurry pipelines contribute to lower pollution and higher efficiencyduring combustion compared to burning the equivalent amount of unwashed coal, as the coal is ‘cleaned’ fortransport via the pipeline. Research is continuing in China into the transport and use of coal water mixtures.
3.5 COAL MARKET ISSUES
GEOGRAPHICAL MIS-MATCH BETWEEN COAL PRODUCING AND COAL CONSUMINGREGIONS. A major challenge for the Chinese coal industry is that the main coal producing regions, in thecentre-north and north-east of the country, are a considerable distance from some of the principle coal-consuming provinces in the east and south-east of the country (reference figures 10 and 11). Net coalimports, from other provinces, are highest in the coastal provinces such as Jiangsu (65 million tonnes),Zhejiang (45 million tonnes), Guangdong (42 million tonnes) and Shanghai (41 million tonnes), all ofwhich, apart from Jiangsu, produce relatively small amounts of coal themselves (less than 10 milliontonnes). By contrast, the net coal exporting provinces such as Shanxi, Inner Mongolia, Henan and Heilon-gjiang, (all of which are major coal consumers themselves) are significant distances from the coast.
68. Byway of example, the distance from Datong in Shanxi province to Shanghai is 1,800 kilometres by rail, whilefrom Datong to Guangzhou in Guangdong Province is 2,600 kilometres by rail, or 3,300 kilometres by railand sea.69. Each year about 620 million tonnes of coal are transported by rail over an average distance of580 kms.
For this reason, Chinese officials have proposed a strategy of “coal-by-wire”, the construction of mine-mouthpower stations in the coal-mining regions that would transmit power to the high demand centres along thecoast. However, given the very serious water shortage in the whole of northern China, which affects everyaspect of the economic and social development of the region, this strategy will require further debate. Whetherthe further establishment of very large scale thermal power capacity in these very dry regions can be justifiedon a broader economic and social basis remains an issue.
TRANSPORTATION BOTTLENECKS . With coal accounting for a larger percentage of freight than anyother commodity in China, the inability of the transportation network to meet the level of demand has hadmajor implications for China’s coal industry. Significant stockpiles have built up at the mines, which havethen been forced to curtail production. Indeed, in the past it was often the lack of rail transport capacity,rather than the lack of demand for the coal, which acted as a break on production and encouraged a numberof coastal power stations to turn to the international market for supplies. Some estimates have put the costof these bottlenecks at as much as US$ 100 billion per year in opportunity costs due to the fact that materialsare unable to reach manufacturing facilities.
70.
68. China Energy Statistic Yearbook, 1991-1996. Beijing, China. 1998.69. Quoted inChinese coal prospects to 2010, IEA Coal Research, London. 1994.70. International Private Power. Fourth-Quarter 1998.
46

COAL PREPARATION. With only approximately 22% of total coal production washed, and the largetonnages of coal being physically transported across substantial distances, it is evident that the scarcetransportation resources are being used uneconomically to transport large amount of dirt and rocks inaddition to coal. It has been estimated that, of the total of 620 million tonnes of coal transported by train eachyear, 459 million tonnes is raw, unwashed coal. Calculated on the basis of 15% of coal waste on average, thismeans that nearly 69 million tonnes of waste is being transported annually.
71. Increased preparation of coalprior to transportation could help to relieve the pressure on the overburdened freight network and improvethe quality of the coal being supplied to power stations and industrial consumers, thereby improving thethermal efficiencies, reducing the cost of boiler maintenance, and impacting significantly on CO2 emissions.However, this will necessarily require substantial quantities of water, together with better utilisation andrecovery of mine and wastewater. At present, coal mining involves the drainage of about 4 tonnes of waterfor each tonne of raw coal output.
Further study is required into coal preparation techniques and the recovery of waste and mine water.
WATER SUPPLY. The availability of water supplies for coal mining operations is a concern, with seriouswater shortages and quality problems occurring in the northern coal basin. Indeed, the proposal for sitingnew power stations adjacent to coal mines will further exacerbate the need for water and may not bepractical until an adequate water supply is assured. Coal preparation processes at existing plants contributeto the wastage of water, as up to one third of the plants do not recycle the water.
Resolution of the water supply problem is critical to addressing a number of the environmental issues andimproving the efficiency of the coal mining, transportation and power sectors.
RESTRUCTURING. Between 1992 and 1997, official figures indicate that 883,000 jobs were cut from thetotal workforce of 3.66 million in the state-owned coal-mining sector.
72, with a further reduction of 390,000during 1998 and 400,000 planned for 1999.
73. All laid off workers from these state-owned mines aretransferred to enterprise-based re-employment centres, where they receive a wage of between 140 and 380Rmb per month, according to local living standards. These centres also pay into workers’ personal pension,health care and unemployment insurance accounts, organise free training and provide job information, withthe cost shared equally by government, enterprises and social organisations. They are designed to provide acushion to workers who had previously been used to life-long guaranteed employment with a state-ownedemployer who provided housing, health care and pensions to fill the gap left by the lack of a social welfarenet. Laid off workers looked after by such re-employment centres are not counted as jobless in China.
74.Given that these centres are scheduled to disappear by the end of 2003, China will have to adopt newpolicies to enable the restructuring of the state-owned enterprises to continue without provoking socialtensions in the economically depressed areas.
In addition, there is the planned closure of nearly 25,800 small mines, which would add substantially to thenumber of job losses. However, many of these illegal small mines are protected by their local governmentsfor both the income they generate and the employment that they provide. Official sources estimate that, inShanxi Province for example, 15% of each farmer’s income comes from coal mining.
75. Implementation of
71. Programs and Priorities for Increasing Coal Burning Efficiency in China and Implications for Greenhouse Gas Emissions.Paperpresented by Zhengang Xu, Yaqin Gao and Xiangqin Lei to the Global Environment Facility workshop on June 16,17 1997 inAmsterdam, The Netherlands.
72. Coal out of the black.China Economic Review. May 1998.73. China’s coal sector seeks to get back into black.China Daily. 8 January 1999.74. Employment facilities’coverage increasing. China Daily. 26 November 1998.75. Closure of small mines progressing.China Daily. 13 May 1999.
47

Figure 9Coal exporting provinces: net coal exports to other provinces: 1996
48

Figure 10Coal importing provinces: net coal imports from other provinces: 1996
49

closures and redundancies on the scale suggested, without alleviating social policies, could increase socialtensions in the affected regions and difficulties with the local authorities concerned, especially as the bigcoal provinces of Shanxi, Henan, Hebei and Heilongjiang already have some of the highest unemploymentlevels in the country. Therefore there inevitably has to be a question mark over both the scale and the finalnumber of small mines that will eventually be closed.
This would appear to be confirmed by the appointment of an enforcement group of 130 representatives ofthe State authorities at the beginning of 1999, to supervise the closure of the small mines in eight coalmining provinces, and the admission that some town and city leaders had been sacked for “disguising thetruth and cheating the supervisory delegation sent by the central government”.
76. The remit of the team is toeliminate the illegal mines that operate within the mining areas of the large State-owned mines. By the endof April 1999, official statistics indicated that over 20,000 small mines had been successfully closed andproduction cut, as a result, by more than 80 million tonnes.
77. The Government also indicated its willingnessto compensate the local governments affected by the loss in revenue resulting from the closure programme.
As part of the restructuring process, companies involved in coal mining have also been diversifying,branching out into other industries and businesses. It is estimated that, by the end of 1998, the number ofcoal-related diversified economic enterprises may have grown to 17,000, employing more than 1.8 millionpeople.78.
COAL PRICING: Until January 1994 China operated a dual pricing system for coal. Under this arrange-ment there were two types of coal, “allocated coal” produced from state, provincial and county mines and“free market coal” produced by small township mines:
• ALLOCATED COAL prices or plan prices were fixed for state mine production. Surcharges werepermitted once quota production levels were achieved. The allocation of the “plan coal” was negotiatedannually between producers, large customers and the central government agencies according to thepriorities of central and provincial governments. Artificially low pricing led to losses by many of thestate mines, as well as not providing any incentives to improve productivity or improve coal quality bywashing. Production targets and quotas were the principal determinants of performance. Rail transportcapacity shortages, not demand, forced mine inventories to rise and production to slow down, com-pounding the mines’ losses.Low rail freights added to the economic inefficiency by hindering the development of alternativetransportation systems (such as waterways).
• FREE MARKET COAL was sold at negotiated prices. Collective and individual mines would sell theircoal on the free market provided transport access was secured. Production was sold to the state miningbureaux when transport access was not available. Although firm data is not available, it is believed thatthe proportion of coal sold at de-regulated prices was small.
Prices varied according to regional supply/demand situations. The increase in demand in the coastal andsouthern parts of China caused the price differential between plan and market prices to widen. Risingdomestic prices and shortages of rail capacity made coal imports economical in some instances.
76. Team supervises mine closures.China Business Weekly. 18 April 1999.77. Closure of small mines progressing.China Daily. 13 May 1999.78. Coal market steady as she goes.China Daily. 24 December 1998.
50

State owned mines supplied State owned enterprises at low prices and then were not paid. Over 90% of Stateowned mines incurred losses in 1993. Only half the private mines were losing money as they were able tosell much of their production at market prices.
The dual pricing system led to the inefficient allocation of coal. Prices between regions varied widely andfluctuated with demand leading, to a number of market distortions:
• an inefficient pattern of coal transport,
• lack of coal beneficiation and mismatch of coal quality,
• inappropriate selection of coal vis-à-vis other fuels, and
• inefficient coal combustion into end use energy.
The dual system was abolished in January 1994 for most of the coal market and measures were introducedto make the coal industry profitable in the long run. In 1996, more than two thirds of the coal prices wereopened to the market. The effect of the liberalisation was to increase the prices charged by the state-ownedenterprises to more realistic market levels and, in the process, give an incentive for the less cost-intensivesmall mines to rapidly expand production from 422 million tonnes in 1992 to 573 million tonnes in 1995.Indeed, this was one of the principal causes of the oversupply which emerged during the latter part of 1997.
Prices are determined by negotiations between coal producers and users, although the prices of coal used forelectricity generation are still supervised by the government and the government co-ordinates the sales ofcoal through annual meetings. In 1996, coal prices for final users were about 176% of producer prices insome of the regions.
STATE AID. Subsidies to the main State-owned coal mines were progressively reduced from Rmb 5.75billion in 1992 to Rmb 600 million in 1996. Despite the relaxation in coal prices from 1994 onwards, 72%of the state owned coal enterprises still lost money in 1996, although this was a significant improvement onthe 1993 level of 90%.
In 1997, the main State-owned mines made a profit of Rmb 200 million, but weak demand, combined withoverproduction blamed on the 75,000 small mines.
79, saw this transformed into a Rmb 3.71 billion (US$446.9 million) loss in 1998. It has been estimated that, by the end of November 1998, State-OwnedEnterprises and local governments had defaulted on Rmb 36.1 billion (US$ 4.4 billion) worth of paymentsfor purchases of coal from the big State-owned mines.
80.
Some 81% of the main State-owned mines registered losses in 1998. The Government projects that thisshould decrease to 60% in 1999, with the total deficit of the sector reduced by 50% compared to 1998.
81.Under the current Ninth Five Year Plan, the government has allocated US$ 360 million for low interest loansto the state-owned coal enterprises.
82.
79. Coal out of the black, China Economic Review, May 1998.80. Shake-up nigh for China’s troubled coal industry.Financial Times. 16 March 1999.81. China’s coal sector seeks to get back into black.China Daily. 8 January 1999.82. Coal licensing and production tax regimes. IEA Coal Research. London 1998.
51

Year Deficit 83 % change
1992 5.75 billion Rmb
1993 3.26 billion Rmb – 43.3%
1994 1.97 billion Rmb – 39.6%
1995 1.03 billion Rmb – 47.7%
1996 0.60 billion Rmb – 41.7%
1997 – 0.20 billion Rmb – 100.0%
1998 3.71 billion Rmb
FOREIGN INVESTMENT. With the government’s policy towards foreign investment having changed inrecent years, it has published a preliminary list of 16 coal projects for which it is seeking foreign investmentduring the current Five Year Plan. These include seven mines with a combined capacity of nearly 40 milliontonnes per year.
Incentives for foreign participation include two years tax exemption after the mine becomes profitable, witha further three years at a 50% tax rate. Other incentives for Sino-foreign investment enterprises include thepossible exemption of the normal 22% import duty levied on equipment purchased overseas.
84.
By March 1999, official sources indicate that China had received US$ 9.34 billion in contracted foreigncapital in its coal industry, of which US$ 4.18 billion had actually been used.
85.
83. Sources:China Coal Industry Yearbooks 1996 & 1997, China Coal Industry Publishing House, Beijing, China, 1997 & 1998, andCoal out of the black, China Economic Review, May 1998.
84. Coal licensing and production tax regimes.IEA Coal Research. London. 1998.85. Foreign investment to improve coal sector.China Daily. 18 March 1999.
52

4. COAL AND THE ENVIRONMENT
4.1 BACKGROUND
With the world’s largest population and an expanding economy, China faces a difficult task in managing theenvironmental effects of its development. The extent of the environmental problem is widespread. It hasbeen estimated that the total cost of air and water pollution damage in China could be US$ 54 billion, ornearly 8% of GDP in 1995.86.
Gas and particulate emissions from the energy sector can lead to nitrification of water, die-back of forestthrough sulphur dioxide and nitrous oxide emissions, toxication of lakes and streams, acid rain and synergisticeffects of multiple pollutants. World Health Organisation (WHO) figures for 1995 indicate that five of China’scities (Beijing, Shanyang, Xian, Shanghai and Guangzhou) were amongst the world’s ten most polluted cities,with particulate matter levels between 2.5 and 6 times higher than WHO safety limits.
87. Each year anestimated 178,000 people in major cities suffer early deaths due to the high pollution levels, and indoor airpollution, mainly from burning coal and biomass for cooking and heating, causes an estimated 111,000premature deaths annually.
88.
Nearly 80% of China’s urban river water is polluted to some degree, with more than 30% of industrial wastewater and 80% of municipal waste water dumped into the river without treatment. In 1997, the total wastewater discharge was 41.6 billion tonnes, with 22.7 billion tonnes of industrial waste water.
89.
In 1993 China produced more than 700 million tonnes of solid waste, of which 600 million tonnes wasindustrial waste (In 1997, industrial solid waste had increased to 1.06 billion tonnes). Only 40% of this wastreated in any way.
China’s energy production and consumption sectors can do a great deal to reduce their environmental impact.Conservation programs are needed to remedy a situation where energy consumption per unit of output iscurrently four to five times that of developed countries.
New energy conservation technologies could possibly save up to 300 million tonnes of standard coalequivalent by raising the energy efficiency of Chinese plant. A further 300 million tonnes of standard coalequivalent could be saved by upgrading the main energy consumption sectors to world levels.
86. Clear Water, Blue Skies: China’s Environment in the New Century.The World Bank. 1997.87. Environment and Sustainable Energy Development. A Strategy and Action Plan for UNDP in China.Arthur N. Holcombe, UNDP
Resident Representative, Beijing, November 1997.88. Clear Water, Blue Skies: China’s Environment in the New Century.The World Bank. 1997.89. State of the Environment China 1997, SEPA, NORAD and UNEP.
53
Funding agencies such as the World Bank, the Asian Development Bank and the United Nations Environ-ment Program require detailed consideration of environmental aspects in the planning processes for energyprojects that they underwrite.
4.2 REGULATORY STRUCTURE
China has extensive environmental protection legislation in place. The National People’s Congress passedthe Environmental Protection Law in 1989. Other statutes concern water and air pollution and the preserva-tion of natural resources.
China has developed a thorough administrative network of environmental protection organisations. TheState Environmental Protection Commission (SEPC) is the highest national organisation. It has repre-sentatives from more than 60 ministries and departments and meets twice a year to formulate policy. TheState Environmental Protection Administration (SEPA) is effectively the SEPC’s secretariat and the mainadministrative organ for producing environmental laws and regulations. SEPA answers to the State Council.
Under this umbrella most provincial, municipal county, township and village-level governments haveenvironmental protection bureaux (EPBs) or offices (EPOs). Local bureaux are responsible for allinspection and enforcement of regulations promulgated by SEPA, except in the case of major issues whenSEPA itself will deal with the problem. In addition, each ministry and department associated with anindustrial activity that generates pollutants contains its own environmental protection office (EPO).
Despite an extensive regulatory network, local enforcement efforts are a problem. The government has hadlimited success in enforcing environmental regulations, especially outside the major cities such as Beijingand Shanghai. Funding is limited and most bureaux are understaffed.
Local officials are poorly trained and lack a thorough understanding of the regulations and, in many cases,also lack the political weight to enforce policy. Furthermore, the legislation itself tends to be vague, with thepenalties for certain offences not specified. Monthly effluent fees are far cheaper than the cost of retrofittinga factory with an environmentally-friendly technology.
AGENDA 21. Although administrative and legislative resources for combating environmental pollutionhave existed in China for more than two decades, the government recently offered a serious response to thecountry’s deteriorating environment. On March 25, 1995, the State Council approved “Agenda 21”, acomprehensive national plan for sustainable development, and this became a major objective of China’sNinth Five Year Plan (1996-2000). As a result, China became the first country to produce a plan along theguidelines called for at the United Nations Conference on Environment and Development held in Rio deJaneiro, Brazil, in June 1992.
Although environmental issues have finally come to the fore in China, developmental concerns andeconomic prosperity still take precedence over environmental protection. There are signs, however, that thegovernment is putting more weight behind clean up efforts.
“Agenda 21” will guide the effort and charts China’s social and economic development for the next15 years. It is a strategy paper clearly aimed at winning the international financial backing necessary toachieve future goals. The first 62 “priority projects”, which have been incorporated into the Ninth Five-Yearplan (1996-2000), include programmes for agricultural development, cleaner industrial production, conser-vation of natural resources, water pollution control, solid and hazardous waste disposal, and pollution
54

control. For energy, the priority projects identified include the construction of an Integrated GasificationCombined Cycle (IGCC) demonstration plant, the construction of a 150 MW Pressurised Fluidised BedCombustion Combined Cycle demonstration plant and the development, utilisation and demonstration ofrenewable energy (solar, wind and biomass). The original list has since been expanded to include, in theenergy sector, the exploitation, development and utilisation of Coal Bed Methane, and the efficiencyimprovement and pollution control of medium-small sized boilers.
“Agenda 21” has plenty of political might behind it. Formulated by the State Development PlanningCommission and the State Science and Technology Commission (now Ministry of Science and Technology,headed by Zhu Lilan), it has obtained the support of the United Nations Development Programme, the WorldBank and the Asian Development Bank. “Agenda 21” promotes an entirely new approach to environmentalprotection in China. In the past, all efforts were directed at treating pollutants after they were produced.“Agenda 21” stresses sustainable development – the use of clean, efficient production processes anddevelopment strategies that are not only cheaper but create less pollutants.
SEPA expects it will take another 10 years for environmental legislation and green technology to matureenough to slow environmental degradation substantially. By 2010 the agency hopes to have an efficientoperation in place.
In the meantime, lack of funding remains the biggest obstacle to a greener China. The country’s Eighth FiveYear Plan (1991-1995), budgeted 0.85% of GNP, or approximately Rmb 85 billion (US$ 10 billion), forenvironmental protection. In the Ninth Five-Year Plan (1996-2000), China intends to increase its environ-mental expenditure to 1% of GNP by the year 2000 and to 1.5% by 2005. While the SEPA believes thatbetween 1.5% and 2% of GNP is needed to mount a serious attack on the country’s pollution problem, China’soverall expenditure on environment, when measured as a percentage of GNP, does compares favourably withmany industrialised countries.
4.3 IMPACT OF COAL MINING
Coal mining activities in China have had serious environmental effects.
Underground mining has led to severe subsidence affecting some 400,000 hectares, with a large proportionof this being farmland. This is a growing problem with up to 20,000 hectares per year being added to thetotal land mass disturbed. In addition, some 2,200 hectares has been affected by opencast mining.
There are more than 1000 refuse piles in the country, with a total accumulation of 3 billion tonnes andoccupying a land area of 5,500 hectares. Currently, 150 to 200 million tonnes of refuse from coal miningactivities is being added each year and, in addition, a significant number of these refuse piles are sufferingfrom spontaneous combustion problems.
Methane gas emissions are also a major contributing factor to atmospheric pollution, with approximately 6billion cubic metres discharged from mine ventilation each year.
90. Spontaneous combustion of coal in minesis estimated to consume 100 million tonnes of coal each year.
Coal mining and production activities can also lead to disruption of aquifers, and freshwater consumptionand wastewater disposal problems. Increases in the amount of coal mined and washed in the northern coal
90. Programs and Priorities for Increasing Coal Burning Efficiency in China and Implications for Greenhouse Gas Emissions.Paperpresented by Zhengang Xu, Yaqin Gao and Xiangqin Lei to the Global Environment Facility workshop on June 16,17 1997 inAmsterdam, The Netherlands.
55

production areas will have a major impact due to serious water storage problems in the region. Drained minewater is released into the river system with only 15% treated prior to discharge. Compounding the problemis the large volume of coal washing effluent which is all freely discharged. It is estimated that 30 millioncubic meters of water containing 300,000 tonnes of coal is discharged each year.
4.4 IMPACT OF COAL COMBUSTION
Coal accounts for over 75% of total commercial primary energy supply in China and coal burning is themajor source of atmospheric pollution, with particulates and SO2 the main priorities for the authorities.While it is estimated that, in 1997, the rate of smoke prevention and particulate and dust control reached88.4% and that most larger power plants in China have emissions control devices for particulates, efficien-cies vary widely. More than 98 percent of particulate matter can be removed, with electricity costsincreasing only by between 1-3 percent.
PARTICULATES. Particulate emissions from coal-fired plant of 6 MW and above increased by just under10% between 1990 and 1994, from 3.63 million tonnes to 3.98 million tonnes. In 1994, this amounted to28% of the national total of 14.14 million tonnes.
Particulate emissions are greatly affected by the ash content of the coal burned and the Chinese average of28% ash, in the coal received for use in the power plants, is high. Some 60% of China’s coal has an ashcontent ranging from 25% to 35%, with higher ash coals found in Guangxi (43%) and Jiangxi (40%). Nanningpower plant even burns coal with 53% ash content, whilst the Guilin power plant uses coal with 50% ashcontent. Improvements have, however, been made with respect to particulate emissions, with the widespreadadoption of electrostatic precipitators (ESP) in new large-capacity utility plants and with the retrofitting ofold plants. The proportion of units equipped with ESP increased from 16% in 1986 to 34% in 1990 and to59.5% by the end of 1996, with a further 22% of boilers having some form of particulate scrubber/cyclonecontrol.91. As a result the amount of dust discharged has decreased from 16.5 gm/kWh in 1980 to 4.2 gm/kWhin 1996, and the overall particulate emissions have been stabilised despite the increase in power generated.
The government has set a target of 80% of units to be equipped with ESP by the year 2000. The averageefficiency of particulate control units has also improved from 85% in 1980 to 95.6% in 1995 and is plannedto reach 97.5% by the year 2000.
92.
SULPHUR. According to Kato (1991), the average sulphur content of China’s coal is 1.35 percent and SO2
emissions are directly related to increased coal burning. Coal already accounts for over 70 percent of totalSO2 emissions in Asia and this share is increasing. Emissions vary widely in different regions of China dueto the differences in quantities and qualities (particularly sulphur and ash content) of the coal consumed, thealkalinity of soils, and climatic conditions. The most directly measurable environmental impact is acid rain,which affects 30% of the total territory and occurs primarily in central and south-western China.
93. The twoprimary reasons for this are: (1) the much higher sulphur content of coal in the south, and (2) the mostlyalkaline soil in the north neutralises a portion of SO2 emissions in northern regions.
91. Electric Power Industry Development and Environmental Protection in China,Ministry of Electric Power Industry. PRC. 1997,section 3.1.1.
92. East Asia – air pollution control and coal-fired power generation. IEA Coal Research. June 1998.93. State of the Environment China 1997, SEPA, NORAD and UNEP.
56

In China, annual averageconcentrations of SO2wereabout 2 tons/km2– similar to the United States.However,regional concentrations vary widely. For example, around Chongqing, Sichuan Province, average annualconcentrations are about 36 tons/km2, and in the Chongqing urban area, SO2 concentrations reach600 tons/km2. The State Environment Protection Administration has calculated that the economic losses fromacid rain and sulphur dioxide pollution amounted to Rmb110 billion (US$ 13.25 billion) in 1995.
94.
Ambient air standards are divided into three categories: I, II, and III. The most stringent category I standardsapply to cities and areas designated by the central government. Local governments establish II and III areas.Category I, II and III standards limit concentrations of SO2 to 20, 60, and 100 ug/m3 respectively.
In 1992 the State Council approved a trial scheme for charging for SO2 discharges from industrial plants invarious cities and regions.
95, with the charge not exceeding 0.2 Rmb per kg of SO2 emitted. It is unclear howthe trials have progressed.
New national emission standards were issued by the Chinese authorities in December 1996 requiring all newcoal-fired power plant burning coal with more than 1.0% sulphur content to add SO2 control technology tomeet an emissions limit of 650mg/m3. New plant burning coal with 1.0% sulphur, or less, could do sowithout the use of SO2 control technology. In addition to these national standards, local province and cityregulations are more stringent in some areas of the country, and are designed to encourage the installation offlue gas desulphurisers (FGD) on plants using higher sulphur coals. The authorities have established a targetfor the year 2000 of between 10 and 12 GW of power capacity being fitted with FGD.
96.
Between 1990 and 1994, SO2 emissions from coal-fired power plant of 6 MW and above increased by nearly40%, from 4.18 million tonnes to 5.81 million tonnes. This accounted for 31.8% of the total national SO2
emissions of 18.25 million tonnes in 1994.97. By 1997, total SO2 emissions are reported to have increased to
23.46 million tonnes, of which 79% was generated by the industrial sector (including the electricitygenerating sector) and over 20% by the domestic sector.
98. Nearly 85% of SO2 emissions is attributed to theburning of coal.99.
The average sulphur content of the coal burned in the electricity generating sector in 1990 was as follows:
• 60% were lower sulphur coals (sulphur concentration of less than 1%),
• 31% were medium-sulphur coals (sulphur concentration = 1 ~ 2%), and
• 9% were high-sulphur coals (sulphur concentration > 2%).
94. Acid rain causes heavy losses.China Daily. 5 April 1999.95. Electric Power Industry Development and Environmental Protection in China, Ministry of Electric Power Industry. PRC. 1997,
section 2.1.3.96. Emission standards handbook, IEA Coal Research, London 1997.97. East Asia – air pollution control and coal-fired power generation. IEA Coal Research. June 1998.98. State of the Environment China 1997, SEPA, NORAD and UNEP.99. China Energy Annual Review 1996.
57

Since the 1970s, the Ministry of Electric Power Industry has experimented with various types of FGDtechnology.100. By the end of 1996, a total capacity of 1145 MW was fitted with FGD, and this is expectedto increase to over 2.2 GW by the year 2000, as follows:
Project MW installed FGD Technology Date installed
Luohang, Chongqing (1st phase) 2× 360 Lime gypsum wet 1993
Baima, Sichuan 25 Lime gypsum drier 1991
Huangdao, Shangdong 100 Rotating spray drier 1991
Taiyuan, Shanxi 200 Simplified lime gypsum wet 1996
Gaoba, Sichuan 100 CFBC technology 1996
Chengdu, Sichuan 100 Electron beam absorption 1997
Luohang, 2nd phase 2× 360 Lime gypsum wet During 9th 5 year plan
Westerm part, Shenzen 300 Sea water scrubbing During 9th 5 year plan
Chongqing 2× 200 Lime gypsum wet During 9th 5 year plan
Banshan, Hangzhou 2× 125 Lime gypsum wet During 9th 5 year plan
Beijing first co-generation plant 2× 100 Lime gypsum wet During 9th 5 year plan
Zianguan, Nanjing 125 Limestone injection During 9th 5 year plan
Guiyang 50 Integrated particulate andsulphur control
To be studied during 9th
5 year plan
So while FGDs are now slowly being included in the design of new coal-fired power plant in order tocomply with domestic environmental regulations, or guidelines of multilateral organisations like the WorldBank, the bulk of power generation equipment in China is not fitted with SO2 reduction equipment.Although not compulsory in some provinces, FGDs may be installed when plant is constructed to avoid therisk of having to retrofit the plant at a later date.
OXIDES OF NITROGEN . Total NOx emissions from utility boilers were about 1.5 million tonnes in 1988and, in the absence of control measures, could exceed 3 million tonnes by the year 2000. Pulverised coalutility boilers operate with an average emission rate of 600 ~ 1200 mg/m3.
CARBON DIOXIDE. China is one of more than 150 countries which signed the Framework Conventionon Climate Change at the UN Conference on the Environment and Development held in Rio de Janeiro inJune 1992. China’s commitment to the convention is evidenced by the preparation of a national responsestrategy for global climate change. Greenhouse gases are the main item of concern (principally carbondioxide and carbon monoxide).
Carbon dioxide is a trace gas which can influence atmospheric temperature at concentrations as low as 330parts per million. The atmospheric carbon dioxide level has increased by 15% over the last century and isnow increasing at 0.4% per year. On an energy content basis, coal combustion releases 25% more carbondioxide than oil and 75% more than natural gas. Non-OEDC countries, including China, are making anincreasing contribution to global emissions: 44% in 1973, 55% in 1988 rising to 60% of by 2005. Theincrease is likely to accelerate because of the higher growth rates in energy consumption in those countriesand the higher reliance on coal in the fuel mix.
100. Electric Power Industry Development and Environmental Protection in China,Ministry of Electric Power Industry. PRC. 1997,Sections 3.1.2 and 1.2.2.
58
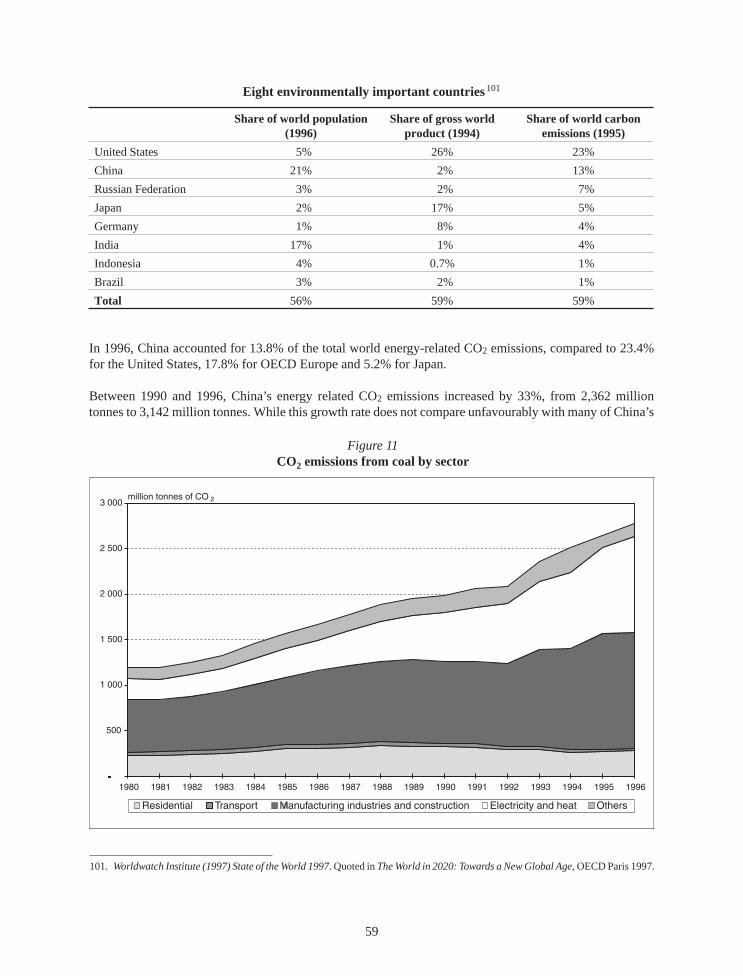
Eight environmentally important countries .101
Share of world population(1996)
Share of gross worldproduct (1994)
Share of world carbonemissions (1995)
United States 5% 26% 23%
China 21% 2% 13%
Russian Federation 3% 2% 7%
Japan 2% 17% 5%
Germany 1% 8% 4%
India 17% 1% 4%
Indonesia 4% 0.7% 1%
Brazil 3% 2% 1%
Total 56% 59% 59%
In 1996, China accounted for 13.8% of the total world energy-related CO2 emissions, compared to 23.4%for the United States, 17.8% for OECD Europe and 5.2% for Japan.
Between 1990 and 1996, China’s energy related CO2 emissions increased by 33%, from 2,362 milliontonnes to 3,142 million tonnes. While this growth rate does not compare unfavourably with many of China’s
101. Worldwatch Institute (1997) State of the World 1997. Quoted inThe World in 2020: Towards a New Global Age, OECD Paris 1997.
Figure 11CO2 emissions from coal by sector
59

non-OECD Asian neighbours, the additional amount of CO2 this represents is substantial, at nearly 780million tonnes. Indeed, this amount represents more than 50% of the net increase in world CO2 emissionsduring the period.102.
In a business-as-usual scenario, China’s CO2 emissions could increase annually by 3.8% to 5,322 milliontonnes by the year 2010 and to 7,081 million tonnes by the year 2020, which would then see China accountingfor some 19% of total world CO2 emissions.103. This underlines the importance of China to the ultimatesolution to the climate change question.
In 1996, 83.3% of China’s energy-related CO2 emissions came from the combustion of coal, compared to15.5% for oil and 1.3% for gas. Between 1990 and 1996, emissions from coal use increased by over 31%,from 1,991 million tonnes to 2,616 million tonnes of CO2. This included a nearly doubling of emissions fromthe use of coal in the electricity generating sector (to 1,058 million tonnes of CO2) and an increase of over40% from coal use in the industrial sector.
Business-as-usual forecasts indicate CO2 emissions from the coal-fired power stations increasing annuallyby 4.4% to 1,787 million tonnes by the year 2010 and to 2,523 million tonnes by the year 2020.
104, whichunderlines the opportunities which exist, in the context of the expected high rates of growth in energy demand,to invest cost-effectively in efficient, coal-fired electricity generation.
4.5 ENERGY POLICY OPTIONS
China’s desire for economic development, together with the increasing population and escalating trendtowards urbanisation will result in increased energy consumption leading to a rise in atmospheric pollution,including greenhouse gas emissions. The challenge for China is sustainability, to minimise environmentaldamage without impeding social and economic development.
Energy use in China is not very efficient and there are huge possibilities to improve energy efficiencies inalmost every sector. China’s energy consumption per unit of GDP is 5 times that of the US and 12 times thatof Japan.
Energy efficiency options in the energy sector fall into three broad categories:
1. Technological improvements: increasing the efficiency of the energy production and transmission sector,and reducing energy losses in the conversion and end use sectors.
2. Promoting the substitution of lower emission fuels, such as natural gas, and developing alternativeenergy sources such as coal-bed methane, hydropower and nuclear energy.
3. Regulatory and market mechanisms.
4.5.1 Technological improvements
Although 75% of all electricity generated in China is produced using coal, the electricity generating sectoronly consumes around one third of the total supply of coal. The consideration of efficient clean coaltechnologies therefore has go beyond the power sector alone, important though this sector is.
102. CO2 emissions from fuel combustion. 1971 – 1996.IEA/OECD Paris. 1998.103. IEA World Energy Outlook, 1998 Edition.IEA/OECD Paris 1998.104. IEA World Energy Outlook, 1998 Edition.IEA/OECD Paris 1998.
60

Priority areas are:
• coal preparation,
• the electricity generating sector,
• the coke-making industry,
• industrial boilers.
COAL PREPARATION. An important factor in remediation programs will be the progressive spread ofcoal preparation and cleaning processes to reduce sulphur dioxide and nitrous oxide emissions and to alsoreduce ash, trace elements and dust. Coal washing can increase coal combustion efficiency by over 20%,with efficiencies of 28% in a pulverised coal boiler burning raw coal increasing up towards 35% whenburning cleaned coal. A difficulty in China, however, is the proportion of ash and sulphur in the coal isrelatively high, and the coal itself is relatively difficult to wash. Cleaning cost are therefore relativelyhigh.
105.
China currently only washes some 22% of its coal. The current Ninth Five Year Plan requires all new andmany existing coal mines to install coal preparation facilities, with the objective to washing 30% of all coalby the year 2000 (covering 58% of that produced by state-owned enterprises).
The increasing mechanisation of mines has led to an increase in the percentage of coal fines produced which,in many places, are simply being stockpiled. With the high demand for sized coal both in the residential andindustrial sectors, an increase in the manufacture of coal briquettes from the coal fines would permit asubstantial conservation of energy resources and additionally have significant environmental benefits as thestockpiles present a serious source of pollution.
Annual household coal consumption in China is around 170 million tonnes, while household coal briquetteproduction is estimated at some 50 million tonnes.
106. In addition, scope also exists within the annual400 million tonnes of coal consumption by industrial boilers to increase the penetration of industrial coalbriquettes from the current level of 22 million tonnes. Briquettes have significant environmental advantagesover raw coal, with higher thermal efficiencies and considerably less ash and sulphur.
China has been researching and developing “Coal water mixture” (CWM) technology since 1982 and nowhas 6 plants built with a total capacity of 1 million tonnes a year.
107. CWM is a mixed product of 62%-70%coal , 29%-37% water and 1% additive, and has been developed in China as an oil replacement fuel. TheZaozhuang CWF plant, located at a coal mine, has an annual production capacity of 50,000 tonnes and usescoal slime or coal fines from a wash plant as its feed material.
108. Given that some 10 million tonnes per yearof coal slime are currently discharged from coal preparation plants, scope exists here for further investmentin CWF facilities, possibly in conjunction with the development of mine-mouth power plants.
105. Programs and Priorities for Increasing Coal Burning Efficiency in China and Implications for Greenhouse Gas Emissions.Paperpresented by Zhengang Xu, Yaqin Gao and Xiangqin Lei to the Global Environment Facility workshop on June 16,17 1997 inAmsterdam, The Netherlands.
106. Programs and Priorities for Increasing Coal Burning Efficiency in China and Implications for Greenhouse Gas Emissions.Paperpresented by Zhengang Xu, Yaqin Gao and Xiangqin Lei to the Global Environment Facility workshop on June 16,17 1997 inAmsterdam, The Netherlands.
107. Priority Areas in the Development of Clean Coal Technology. Zhu Deren of the Central Coal Mining Research Institute and ChengYuqi of the Technology and Research Centre for the Coal Industry, published in China Coal. English Supplement Volume 3.
108. Developments in coal-liquid mixtures.IEA Coal Research. April 1994. London.
61

Preparation of coal and the prior removal of impurities presents a number of distinct advantages:
• cost of the product for the user (the coal purchased has a higher energy content);
• cost of transport, by avoiding the unnecessary transport of waste material;
• a higher energy efficiency in the combustion of the fuel (especially if there has been blending to fit thespecific boilers);
• lower maintenance costs for both utility and industrial boilers;
• environmental and cost benefits due to lower emissions and ash.
ELECTRICITY GENERATING SECTOR. In 1996, coal-fired plants generated three quarters of China’selectricity and consumed 488 million tonnes. Forecasts are for coal-fired generation in China to increasefrom 810 TWh in 1996 to 2,612 TWh by the year 2020, consuming some 1,300 million tonnes.
There are a number of problems associated with Chinese power plants, such as their small average size,inconsistent fuel quality and low load factors due to low plant availabilities or lack of fuel. As a result, theaverage thermal efficiencies range between 27% and 29%, compared to an OECD average of around 38%.In other words, some 26% more CO2 is produced in China than in OECD countries to produce the sameamount of electricity.
The efficiency of power generation is being increased through three main measures.109:
• The use of larger 300 MW and 600 MW sets for new installations.
• The renovation of sets with capacities below 200MW – 50 such sets were renovated during to 8th FiveYear Plan period.
• The progressive replacement of old smaller sets with larger ones – 150 such old sets were replaced inthe 5 years period up to 1995.
As a result the amount of coal required to generate 1 kWh dropped from around 450 gm in 1980 to around410 gm in 1996.
Nevertheless, most of the coal plants in China are less than 300 MW in size, although with the rapid increasein electricity demand in recent years, several units of 300 MW and even 600 MW are being constructed.There are also plans to retrofit or phase out some inefficient small-scale thermal plants. The authorities haveannounced that capacity totalling 10.86 GW will be closed by the end of the year 2000.
110, but the acuteelectricity shortages mean that small and medium sized plant will continue to be built and older plants keptin service.111.
There are also schemes to develop co-generation.112 of heat with power production. Some 19GW of power
generating capacity (about 11% of the total thermal capacity) produced some usable extra heat in 1996, mainlyfrom the smaller units of up to 200 MW.
109. Electric Power Industry Development and Environmental Protection in China,Ministry of Electric Power Industry. PRC. 1997,section 1.3.1.
110. China’s small power plants feel the squeeze. Global Private Power. January 1998.111. IEA World Energy Outlook, 1998 Edition.OECD Paris 1998. Page 288.112. Electric Power Industry Development and Environmental Protection in China, Ministry of Electric Power Industry. PRC. 1997,
section 1.3.2.
62

A high priority goal for China is “coal by wire”; the construction of coal-fired electricity generating plantsat the mine mouths, far away from the densely populated areas, and transporting the electricity to the mainconsumer area via long distance transmission lines.
An increased use of FGD’s to capture SO2 emissions, wider use of low NOx burners and greater penetrationof more efficient clean coal technologies are a number of the possible options. For an in-depth analysis ofthe electricity generating industry and the scope for more efficient coal-fired technologies, referencesection 5.3.
COKE PRODUCTION . As Chinese steel production expanded from 66 million tonnes in 1990 to 90 milliontonnes in 1995, coke production facilities expanded rapidly. The government’s increasingly market approachto the economy, together with the growing enticement of the international market, encouraged the mushroo-ming of hundreds of small beehive coking plants across Shanxi Province, in addition to the larger, moremodern, full recovery type mechanical coke batteries built by the state-owned steel companies. Each of thesebeehive coking plants, which require only a very modest capital outlay, produce some 60,000 to 80,000 tonnesof coke per year. The main cost factors are coal prices, transportation and taxes, since labour costs areinsignificant. While providing much needed employment in the rural areas of Shanxi Province, the rapid andunplanned development of these beehive coking plants has had quite a disastrous impact on local air, waterand soil quality.113.
Recognising the serious environmental problem, the Chinese government is making moves to reduce beehivecoke production and to invest in more modern, efficient and less polluting coke production technologies.However, the economic and employment incentives to keep the beehive coke industry going in ShanxiProvince are very strong, with some operations even subsidised by local authorities. It would appear inevitablethat these highly polluting operations will only very gradually disappear.
INDUSTRIAL BOILERS. China is estimated to have over 500,000 industrial boilers, including a smallnumber of gas and oil-fired units, in such sectors as the metallurgical industry, machine building industry,light industry and urban heat supply. These boilers, often located in densely populated metropolitan areas,consume around 400 million tonnes of coal annually and, with their low smoke stacks, are responsible formuch of China’s ground-level air pollution, especially particulates and SO2. With their low thermalefficiencies, they emit some 500 million tonnes of carbon dioxide annually and are responsible for over 36%of particulate and 39% of SO2 emissions114.
Anational initiative to develop higher efficiency small and medium scale coal-fired industrial boilers throughthe adoption of advanced technology is among China’s top priorities over the near term. However, given thatit will be impossible to eliminate these boilers in the short run, there is also a policy to develop retrofittechnologies.115.
Improving the standard of electric motors and associated industrial equipment is also very important sincesuch equipment accounts for almost half of China’s total electricity use. However, economic growth is likelyto provide the only effective impetus for the replacement of less efficient capital on a large scale.
113. The Emergence of China as a Major Coke Supply Source.Presentation by R. Oreskovic of MACI Minerals to the March 1997conference on “Coping with the tightening coke supply: Is a crisis looming.?”, Charlotte, NC, USA.
114. Mr Shen Longhai, Chinese Embassy. Contribution in the roundtable on “The Clean Coal Initiative” held at the World Bank onJune 24-25, 1996.
115. Programs and Priorities for Increasing Coal Burning Efficiency in China and Implications for Greenhouse Gas Emissions.Paperpresented by Zhengang Xu, Yaqin Gao and Xiangqin Lei to the Global Environment Facility workshop on June 16,17 1997 inAmsterdam, The Netherlands.
63

China is likely to foster programmes that involve demand side management, particularly for energyintensive users. Emphasis will be placed on building efficiency into the front end of new industries wherethe investment is far lower than for retrofitted technology. Estimates of global “demand side managementtechnical potential” range from 15% to 40%.
Experience in East Germany demonstrated a 25% reduction of carbon dioxide emissions between 1990 and1993 through the replacement of obsolete processes with low emission new technologies.
Recycling offers many potential energy related benefits. Research by the International Iron and SteelInstitute has shown that substantial energy savings can be achieved through increased use of recycledmaterials.
4.5.2 Energy diversification
POLICY. In addition to efforts to reduce energy consumption, Government policy is to diversify away fromthe current over-dependence on coal, by strengthening oil and gas exploration and development, speedingup the development of hydropower and nuclear power for electricity generation, and developing ruralenergy (including small hydro-power, solar and geothermal) and renewables.
The residential sector alone accounts for around 11% of total coal use and is responsible for a largeproportion of ground-level air pollution as the coal burned contains high levels of sulphur and ash. The coalis used for household cooking, water boilers and heating. The government’s strategy for the urban residentialsector is to increase the penetration of natural gas, coal gas and electricity, as well as expanding districtheating systems and developing co-generation.
HYDRO. China has given a high priority to the development of hydropower. According to official figures,China has the world’s largest hydro-electric potential in the world estimated at 676 GW, of which about 290GW is economically exploitable and 60 GW actually exploited at the end of 1997. Of the 60 GW inoperation, 18.84 GW (24 hydroelectric projects) have involved US$ 3.7 billion of foreign capital, repre-senting about 19% of the total foreign capital used in the power industry.
116.
The most ambitious and controversial project to date is the construction of the world’s largest dam, the ThreeGorges, on the Yangtze river. At an estimated total cost of 240 billion Rmb (US$ 29 billion), it is the mostexpensive power project in the world and, once completed, will be the world’s largest hydropower plant witha total capacity of 18.2 GW from 26 generating units of 700 MW. However, this will represent less than 4%of China’s total expected electricity generating capacity of 501 GW when it comes into operation around theyear 2010.
A major problem for China is that much of the hydro resources are located away from the centres of highpopulation and industrial activity, and the majority of the existing active capacity is small scale.
NUCLEAR. China’s three generating units operating at Qinshan and Daya Bay provide only about 1% ofChina’s electricity. This should rise to 2% when a further four plants, 8 units totalling 6,600 MW, beginoperation between 2001 and 2005. However, nuclear is an expensive option and, being a relatively newsector for China, carries heavy start-up and infrastructure costs. In addition, much of the advanced techno-
116. China to speed up Hydropower Exploitation. China Daily. 21 October 1998, quoted in Asian Energy News. November 1998.
64
logy has to be imported from abroad, although China does plan to develop its own advanced nuclear reactorssuch as the AC-600 PWR.
OIL AND GAS. China has also decided that its state petroleum companies should seek access to overseassupplies of oil and gas through investment, rather than just purchasing these fuels on the market. Explorationand production projects in at least 20 countries have been signed so far or are under negotiation. By the endof 1997, more than US$ 8 billion had been pledged for oil concessions in Sudan, Venezuela, Iraq andKazakhstan, plus US$ 12.5 billion to lay four oil and gas pipelines (totalling 13,500 km) from Central Asiaand Russia to China.
RENEWABLES. China is eager to develop geothermal and wind resources, all located in remote oreconomically undeveloped provinces where coal and oil resources and infrastructure are lacking. Geother-mal reservoirs have been identified in western Yunnan and southern Tibet, where the 25 MW Yangbajingpower station supplies 50% of the electricity of the Lhasa power grid. The potential for wind energy existsin Guangdong Province on the south-east coast and in the far north, in Inner Mongolia. China now hasinstalled more than 100,000 small wind power generators.
117 and Xinjiang province in north-western Chinahas announced plans to add 66 wind power generators to an existing wind power plant to create what wouldbe the largest wind power base in Asia. Plans are to increase China’s total wind generating capacity from57.4 MW in 1996 to between 350 and 600 MW by the year 2000.
In addition, several small tidal power stations have been constructed in China. The largest is 3.2 MWJiangxia tidal power station in Zhejiang.
118.
4.5.3 Regulatory issues and market mechanisms
ENFORCEMENT. As already indicated, China does have an extensive set of environmental laws in placeand a network of environmental officials throughout the country. Nonetheless, local enforcement doesremain a problem, and the government has had only limited success in enforcing environmental regulationsoutside the major cities. Recognising the importance of strengthening the enforcement of environmentallaws, SEPA is budgeting for the necessary training and administrative resources, and the Government hasrecently revised its criminal law to include a regulation on “Crime of Environment and Resources Destruc-tion”. To some extent, however, the problems with compliance are due to the overriding priority given toeconomic development and the vagueness of the standards in many of the environmental laws and regula-tions.
PENALTIES. With monthly effluent fees far cheaper than the cost of retrofitting a factory with anenvironmentally-friendly technology, many industries treat the fees more like a power bill than a fine.According to one estimate, waste discharge fees are only 5% of waste treatment costs, encouraging factoriesto turn off their treatment mechanisms. In Henan province only 30% of treatment facilities are in use at anyone time.
117. Activity Development and Use Clean Energy Technology Promote Sustainable Energy Development.Paper presented by ShiDinghuan of the Department of High Technology, Ministry of Science and Technology at the China-EU Conference in Brussels,4-5 March 1999.
118. Activity Development and Use Clean Energy Technology Promote Sustainable Energy Development.Paper presented by ShiDinghuan of the Department of High Technology, Ministry of Science and Technology at the China-EU Conference in Brussels,4-5 March 1999.
65

In recent years, however, SEPA has become a much stronger administrative body. Beginning in 1996, itplanned to implement very strict environmental regulations with provisions for mandatory enforcement,with fines rigorously enforced according to Western standards – per pollutant/per day. However, to achievepollution control objectives would require a substantial increase in pollution charges, both to lower currentemission levels and to finance the substantial investments necessary to achieve the desired environmentalobjectives. In addition, pollution levies are currently assessed only on discharges that exceed the standard;in other words, emissions cost the polluter nothing until the standards are breached.
119.
PRICING. China’s increasing market orientation opens the possibility of using market-based mechanismsto internalise the environmental costs of energy production and use. Full cost pricing of coal wouldencourage more efficient production. Given the huge amount of coal transported and the significantdistances covered, full cost pricing of transportation would encourage more efficient and greater use of coalpreparation technologies at the mine-mouth to increase the market value of the transported product. This inturn would increase the efficiency of coal combustion and have important environmental benefits both interms of curtailing traditional pollutants and CO2 emissions. It could also ensure priority was given toexploiting those coal reserves with lower sulphur and ash-forming constituents.
TAXATION . The tax burden evidently varies according to the energy source. For coal and natural gas, theValue Added Tax is levied at a rate of 13% (compared the standard 17% levied which is also applied on oil).There are also natural resource taxes levied on coal, oil and gas. An SO2 pollution charge based on thesulphur content of coal is also collected.
Where pricing signals are not adequately internalising environmental factors, consideration has to be givento the use of taxation. For example, quality-based pricing could be enhanced by levying different tax or VATrates on washed and unwashed coal.
119. China’s Health and Environment.World Resources 1998-99. World Resources Institute.
66

5. TECHNOLOGY TRANSFER
5.1 FOREIGN INVESTMENT POLICIES AND PRACTICES
Before 1990, foreign direct investment (FDI) did not exist in China’s public utilities and energy sector, incontrast with the rest of the economy where inflows over the two decades since reforms began have madeChina the world’s second largest destination for FDI.
120. The Chinese central government finds itself in aquandary regarding foreign investment, which is reflected in its policies. There are differences of opinionbetween those who realise that foreign investment can bring capital, much-needed technology and usefulwestern management skills, and those who are opposed to foreign investment on the grounds that westernpractices are bourgeois and corrupting. This difference of opinion has led to an ongoing debate that accountsfor some of the swings in policy and practice. In China, policy tends to follow practice as suspicion isovercome, to some degree, by experience.
The Chinese leadership appreciates that foreign investors do need to have at least the prospect of making areasonable return on their investments. In fact, the size of the potential market has made involvement inChina almost unavoidable for many major foreign companies, with a general consensus that, whilst thefuture investment climate and returns may be uncertain, one cannot afford not to have a presence there.However, the recent economic downturn in Asia generally and the impact that this is having on the Chineseeconomy is leading to a re-evaluation of this approach.
China also places a strong emphasis on the development of home-grown intermediate technologies, evidentin the development of clean coal electricity generating technologies. However, the pace at which suchtechnologies may need to be introduced in the expanding economy, to address the increasing environmentalconcerns, could suggest that a more optimal approach would be licensing agreements. Local manufacturingcapabilities could be being established to produce equipment of foreign design, which would give a boost todomestic employment as well as address Chinese concerns about self-sufficiency. This would necessarilyrequire the payment of a fair royalty and the adequate protection of intellectual property rights. The localpopulation would also need to be capable of supporting the transferred technology, which would requiretraining issues to also be addressed.
The central government realises that foreign investment can be permitted in sensitive key areas without lossof control. Areas which are now opening to foreign investment include: infrastructure (roads, rail), petroche-mical industry, chemical industry, iron and steel industry, agriculture, accounting, insurance, retailing and
120. For further details, referenceChina and the World Energy System.: New Links. Mehmet Ögutcü. The Journal of Energy andDevelopment, Vol. 23, No. 2, December 1998.
67

consulting121. Since the central and provincial governments realise that they are at risk if they becomehighly dependent on one supplier or a very small group of foreign investors, it is policy and practice tospread the investment opportunities among a variety of investors.
In the energy industry, policy will encourage foreign investment in order to achieve the planned economicgrowth, while ensuring that China is not held hostage to foreign demands. Foreign investment is allowed incoal mines, coal transportation and electric power generation, though on a less than 50% basis. However, aforeign party in a joint venture energy project is allowed to have more than a 50% interest in many cases.
The thrust of foreign investment policy has been to develop the eastern coastal regions first on the premisethat, as they developed, their factor input costs would increase and investors would naturally then lookfurther inland. So far, the policy has led to an increasing discrepancy between the wealthier and poorerprovinces and even within provinces. The central government can be expected to encourage more invest-ment in the internal provinces.
There is increasing confidence by the Chinese in their own abilities to improve their economy. This strongtide of sentiment can be expected to increase and broaden with further economic growth.
GUIDELINES - POWER INVESTMENT. Within the framework of the Chinese Companies Law,specific areas of activity may also be regulated by the respective Ministry. An example is the power industry.In March, 1994 the then Ministry of Electric Power laid down its own guidelines applicable to the forms ofinvestment foreign investors may choose. For foreign investors:
• investment in the expansion or upgrading of existing power plants cannot exceed the purchase of up to30% of the equity;
• co-operation is limited to 20 years for thermal plants and 30 years for hydro, excluding the constructionperiod;
• a controlling stake in power plants that have units over 300 MW each, or a capacity over 600 MW, mustbe held by the Chinese party;
• foreign exchange must be balanced throughout construction and operation, and the Chinese party maynot guarantee foreign exchange income.
In practice, 100% foreign-owned power projects are limited to those that have been made available underthe government’s build-own-transfer (BOT) programme, a programme for which there is currently noexplicit legislation or regulation. Both legislation and regulation are under development.
122.
INTELLECTUAL PROPERTY RIGHTS. China joined the Paris Convention for the Protection ofIndustrial Property in 1985, which obliges countries to protect trade secrets. However, the lack of nationallegislation in this area has made it difficult for foreign companies to protect their trade secrets. Mostcompanies rely on the confidentiality clauses in contracts to protect business or technical information, withtrade secrets often protected through the use of Confidentiality Agreements or Non-Disclosure Agreementswith the key personnel in the joint venture. Such agreements can be for an indefinite time period and do notrequire the approval by the authorities.
121. Investment in China’s Future. Zhang Xiaoqiang. Published inInvesting in Asia. ADB, OECD 1997.122. International Private Power Quarterly. Fourth Quarter 1998.
68

Technology transfer agreements in China are normally limited to ten years, with rights to use the technologyand know-how usually remaining with the licensee at the end of the term of the agreement. Where thetechnology is patented and the patent is valid beyond ten years, then the term of the technology transferagreement is extended.
123.
The investment climate in China for technologically advanced industries has improved in recent years, withthe introduction of new intellectual property legislation and the accession by China to a number ofinternational agreements and conventions. However, China has still some way to go and it is only byensuring that foreign companies have the legal means of protecting their property rights that China will beable to fully benefit from the opportunities presented by technology transfer.
Note that further details concerning the commercial, legal and tax practices, as well as the financialmechanisms and organisational structures relating to technology transfer, can be found in Annex IV.
5.2 ELECTRICITY SECTOR AND INDEPENDENT POWER PRODUCERS (IPPs)
5.2.1 Overview of the electricity sector
GOVERNMENT POLICY. China’s goal, by the year 2000, is to bring electricity to the 72 million ruralresidents, in 24,800 remote villages and 649 towns, who are not currently connected to a grid, which wouldresult in electricity then being available to 95% of the population.
China’s strategy for developing electricity generating capacity is based on three regional strategies:
• mine-mouth coal plants in the north,
• hydro-power in the west, and
• nuclear in the south-east.
Priority is being given to projects in the central and western parts of the country, with coal-fired plantsencouraged in Shanxi, Inner Mongolia, Shaanxi, Guizhou and Henan provinces.
DEPARTMENT OF ELECTRIC POWER. The reforms of March 1998 saw the abolition of the Ministryof Electric Power. The administrative and regulatory functions were allocated to the Department of ElectricPower, a sub-group of the State Economic and Trade Commission, while the state assets in the power sectorwere transferred to the State Power Corporation.
STATE POWER CORPORATION. The State Power Corporation was established in January 1997 as partof the ongoing process of market reform, in order to separate the commercial and government functions ofthe Ministry of Electric Power. The 80% of China’s generating assets owned by the state were transferredfrom the Ministry of Electric Power to the State Power Corporation in the March 1998 reforms, while theremaining 20% are owned by collectives and private investors.
123. Intellectual Property Law in the People’s Republic of China. Charles D. Paglee.(http://www.qis.net/chinalaw/intel1.htm).
69

It would appear that the central government is favouring a vertical separation of the generating, transmissionand distribution functions. Among the current proposals are plans to create five regional generation groups,establish an entity charged with the responsibility of formulating end-user tariffs nation-wide, and theestablishment of a unified high-voltage transmission network.
ELECTRICITY PRODUCTION , which grew at an annual average of 8.14% a year between 1978 and1997, stood at 1134 TWh in 1997.
124. A “Business-as-Usual” scenario estimates electricity generationgrowing by an average 5.4% per annum to reach 2497 TWh by 2010 and 3857 TWh by 2020.
125. In 1996thermal generation accounted for 81.3%, hydro 17.4% and nuclear 1.3% of production.
Problems with power shortages have diminished as new supplies have come on-line and some regions now,in fact, face temporary oversupply problems due to a combination of lower than expected economic growth,the rapid expansion of electricity supplies and lost demand from closed factories. Supply shortages,however, do still affect many areas of the country, especially during peak load periods. Serious shortagesexist in Shandong province on the east coast as a result of rapid economic growth, some peak time shortagesexist in Shanghai and Jaingsu province, and some serious shortages exist in most of the north-westernprovinces. Occasional shortages also occur in those provinces, mainly in the south-west and central areas ofthe country, which are dependent upon hydro-power when rainfall has been inadequate.
126.
INSTALLED ELECTRICITY GENERATING CAPACITY in 1995 was 227 GW, of which 70% wascoal-fired, 23% hydro. 6% oil-fired and remainder split between gas-fired and nuclear. Installed capacitycould reach 757 GW by the year 2020, with 62% coal-fired, 26% hydro, 6% oil and 3% nuclear.
127. At theend of 1997 capacity had reached 254 GW.
128, and a further 14.6 GW of new capacity was installed by theState Power Corporation in 1998.
129.
THERMAL EFFICIENCY of Chinese electricity generating plants is low, between 27% and 29%compared to an OECD average of around 38%.
ELECTRICITY CONSUMPTION . The electricity consumption pattern in 1996 was: residential 13.6%,commercial/public sector 9.4%, industrial consumption 68.2%, agriculture 7.4%, transportation and others1.4%.
TRANSMISSION GRIDS. China has 15 semi-autonomous power grids.130:
• Northeast Grid (Jiaoning, Jiln, Heilongjiang, eastern Inner Mongolia): 29,495 MW (15.5% hydro);
• North China (Beijing, Tianjin, Hebei, Shanxi, western Inner Mongolia): 32,930 MW (4.9% hydro);
• East China (Shanghai, Jainsu, Anhui, Zhejiang): 38,221 MW (6.5% hydro);
• Central China (Henan, Jianxi, Hubei, Hunan): 33,739 MW (35.3% hydro);
124. The Active Role Played by the State Development Bank of China in Supporting the Energy Development in China.Paper presentedby Duan Zhiji of The State Development Bank of China to the China-EU Conference in Brussels, 4-5 March 1999.
125. IEA World Energy Outlook, 1998 Edition.OECD Paris 1998. Page 287.126. China’s Electric Power Options: An analysis of economic and environmental costs. Advanced International Studies Unit, Battelle
Memorial Institute. June 1998.127. IEA World Energy Outlook, 1998 Edition.OECD Paris 1998. Page 287.128. The Active Role Played by the State Development Bank of China in Supporting the Energy Development in China.Paper presented
by Duan Zhiji of The State Development Bank of China to the China-EU Conference in Brussels, 4-5 March 1999.129. China Electric Power News, 31 January 1999.130. International Private Power Quarterly. Fourth Quarter 1998.
70

• Northwest (Shaanxi, Ningxia, Gansu, Qinghai): 13,702 MW (38.4% hydro);
• Shandong Province: 13,606 MW (0.4% hydro);
• Fujian Province: 7,007 MW (57.3% hydro);
• Guangdong Province: 23,925 MW (11.6% hydro);
• Guangxi Province: 5,430 MW (58.7% hydro);
• Sichuan Province: 11,905 MW (42% hydro);
• Yunnan Province: 4,460 MW (67.8% hydro);
• Guizhou Province: 4,430 MW (45.7% hydro);
• Hainan Province: 1,560 MW (32.6% hydro);
• Xinjiang Province: 3,308 MW (21.8% hydro);
• Tibet: 185 MW (69.9% hydro).
giving a grid-connected capacity of nearly 224 GW. Although they are interconnected, there is littleinterchange of power as there are only a few interconnection points.
TRANSMISSION LINES. The total length of transmission lines of 35 kV and above was 539,400 km atthe end of 1994. Line-loss was reported to be 8.77% for the system under the direct management of statepower companies in 1995. This excludes much of the low voltage system and all losses downstream of thebusbar where the power becomes the responsibility of the purchasing enterprises. Total line-loss could be ashigh as 16-20%.131.
TRANSMISSION INVESTMENT. Investment in power transmission as a percentage of the total invest-ment in thermal power, hydraulic power and power transmission (excluding nuclear and others) droppedfrom 24% in 1980 to 17% in 1993. The rapid increase in generating capacity has resulted in high failure ratesfor the existing network and in some cases an under utilisation of the existing generating capacity. Forexample, power stations in the Shentou area (Shanxi Province), which have a total capacity of 2,300 MW,can only transmit 1,500 MW to end users. The State Power Corporation does have plans to invest Rmb 120billion (about US$ 14.5 billion) on upgrading the transmission networks in 280 cities between 1998 and theyear 2000.
Generating capacity and electricity output are unevenly distributed between the various networks andregions, with the north and east providing most capacity and output. Indeed, one of the objectives of the18,200 GW Three Gorges hydro-electric project, scheduled to enter service by 2010, is to provide a nationalgrid network. The necessary high voltage transmission system is being built separately from the hydroproject.132.
TARIFF SETTING. The current Chinese electricity pricing system, named “quotas and tariffs” wasintroduced in July 1993. Three types of electricity are defined: (1) in-plan quotas, (2) out-of-plan quotas, and(3) above-quota. Different electricity tariffs are applied to each type of electricity.
131. Energy Demand in Five Major Asian Developing Countries. World Bank Discussion Paper No 277. April 1995.132. International Private Power Quarterly. Fourth Quarter 1998.
71

Figure 12Electricity consumption: 1980-1996
Note that the apparent decline in industrial consumption in 1993 is due to a change in methodology. From 1993 onwards, consumptionin coal mines is excluded from (final) industry and included in the energy sector statistics. Consumption in coal mines is not availableseparately for the previous years.
1. Catalogue price is applied to in-plan electricity provided by state-owned plants built before 1992.
2. Out-of-plan quota electricity is provided by joint-investment plants and state-owned plants built after1992.
3. Above-quota electricity applies for purchases from other grids or auto-generators.
A distinction is also made between old and new consumers. Prices for old consumers are set by combiningthe three types of tariffs whilst new consumers are charged a combination of the out-of-plan and above-planprices. New consumers, who were paying almost twice as much as old consumers, have been seeing the gapbetween the two sets of prices decrease. While the government intends to unify the price of electric powerwithin grids within the near future, it faces a number of obstacles. Prices do also remain controlled for someresidential customers, large state-owned enterprises and agricultural customers.
The Chinese government has been experimenting with a “time-of-use” pricing system for non-industrialcustomers with the aim of achieving more efficient use of the available capacity. However, problemspreventing the wider application of such a pricing system include:
• the basic prices being too low;
• the difference between peak and off-peak prices not being substantial enough to provide an incentive tothe consumer to conserve energy;
72

• electric metres of poor quality or too expensive;
• inadequate tariff collection.133.
For private power projects, Chinese tariffs are usually based on a single price, which is intended to covercapital and interest repayments, a return on equity of around 15% and the pass-through of variable costs.However, the tariff approval process is seen to lack transparency, as well as being subject to annual reviewsand other reopeners. It has been estimated that a reasonable initial price for a standard coal-fired plant, dueto enter service from 1999 and using domestic equipment and construction, would be about 5.2 US¢/kWh,of which fixed costs would account for about two thirds. Lower prices, down to 4.7 US¢/kWh, were possiblebut this would be based on plants with immediate access to cheap coal.
134.
5.2.2 Role of independent power producers (IPPs)
The first law governing electrical power generation came into effect in April 1996. This recognised a role forforeign investment, including direct investment in power plants through joint ventures or foreign-ownedcompanies, provided that these investments conformed to government policy and objectives. Foreign loans,but no direct foreign investment, are allowed for setting up power grids.
135.
Foreign investment during the Ninth Five Year Plan is expected by the government to account for a fifth ofthe national investment in the power sector. This would translate into some 6 GW to 8 GW of the 40 GWnew capacity needed by the year 2000 and 45.6 GW of the estimated 228 GW called for by the year 2010.
A potential market of this scale has proved a strong attraction to many international private powercompanies since China has open up to private investment. However, the country has proved to be one of themost problematic markets for developers.
136. Problems in the past have included the limits on the rate ofreturn, the negotiation of tariff pass-through in the power purchase agreements, currency convertibility, theevolving legal and regulatory framework and the absence of central guarantees.
137. However, there areindications that this may be changing, with a number of successful project financings since 1996. Govern-ment policy is to encourage the development of larger private power developments, defined generally asbeing at least 300 MW.
It was estimated, in October 1998, that China’s power industry had used US$ 11.65 billion in loans frominternational financial organisations and foreign governments (US$ 6.65 billion from the World Bank, US$1.22 billion from the Asian Development Bank and US$ 3.64 billion from the Japanese government), andattracted US$ 10 billion from 36 foreign direct investment projects in the power sector.
138.
At the end of 1998, some 8.4 GW of private capacity was operation, with 77% of this coal-fired (includingone 400 MW plant dual coal/oil), 11% gas-fired and 11% oil or diesel-fired. Of these, all the plants of600 MW and above are coal-fired and they accounted for 60% of the total private capacity:
133. China’s Electric Power Options: An analysis of economic and environmental costs. Advanced International Studies Unit, BattelleMemorial Institute. June 1998.
134. China’s small power plants feel the squeeze. Global Private Power. January 1998.135. China.Energy Information Administration. May 1998.136. Private power in China: the implications for coal. International Coal Report. 16 June 1997.137. Greenfield private power.China. Global Private Power Update. Financial Times. September 1998.138. Foreign Funds Fuel Power Industry.China Daily. 25 October 1998 quoted in Asian Energy News. November 1998.
73

• Shajiao B (700 MW), Shajiao C (1,980 MW) and Zhujiang 1 (600 MW) in Guangdong province,
• Shidongkou (1,200 MW) in Shanghai,
• Jingyuan II (600 MW) in Gansu province.139.
The Shajiao B coal-fired plant was the first Build-Operate-Transfer IPP project in China and was completedin 1987. Coal for the plant comes by rail from Shanxi province to Qinhuangdao port and is then shippeddown the coast to the power plant.
140.
Over 50% of the operational private power capacity is situated in coastal Guangdong province, with a further19% in Shanghai. For coal-fired plants, this raises serious issues relating to fuel sourcing, whether to useindigenous supplies with the associated risks of uncertain qualities and availabilities, or whether to turnincreasingly to the international market.
In an effort to encourage the use of indigenous coal and to avoid the constraints posed by the limitations ofits overloaded rail network, China’s current Ninth Five Year Plan (1996-2000) targets the development of“coal by wire”, constructing mine-mouth power stations and investing in high voltage, long distancetransmission lines to take the electricity to the main consumer demand centres on the coast. The 2,100 MWYangcheng power station in Shanxi province is the first of such projects, with low-sulphur anthracite coalbeing purchased under a long term contract from a number of local mines within a 20 mile radius of the siteand the electricity generated destined for Shanghai and the lower Yangtze industrial region. A joint venturebetween the American IPPAES (25%), North China Power Group (25%), local utilities in Jiangsu and Shanxi,and a local investment company, the first of the six 350 MW units is expected to enter service in mid-2000.
A further 8,284 MW of coal-fired private power capacity is planned to become operation by the end of theyear 2000, including nine plants which will have a capacity of 600 MW or more:
• Hefei No. 2 (700 MW) in Anhui province,
• Fuzhou (700 MW) and Meizhou Wan (734 MW) in Fujian province,
• Zhuhai Power (1,400 MW) and Zhujiang 2 (600 MW) in Guangdong province,
• Laibin B (700 MW) in Guangxi province,
• Hanfeng Power (1,320 MW) in Hebei province,
• Rizhao Power (700 MW) and Weihai (600 MW) in Shandong province.141.
Of particular note amongst these projects are Laibin B and Meizhou Wan. Laibin B is China’s firstbuild-operate-transfer plant to be competitively bid and to be 100% foreign own and financed. The total costof this project is US$ 620 million, with 25% equity and 75% a combination of a commercial loan and exportcredits. Electricité de France holds 60% of the US$ 155 million equity stake, with the remaining 40% heldby GEC-Alstom. The 700 MW plant is expected to be operational late in 1999 or early in the year 2000.
142.Meizhou Wan is the second wholly foreign-owned build-operate-transfer and is similar in many ways toLaibin B, except that it is a build-operate-transfer scheme that originated at provincial, rather than national,level and its entire input fuel requirements (one to two million tonnes of coal a year) will be provided by low
139. Greenfield private power.China. Global Private Power Update. Financial Times. September 1998.140. Coal-fired independent power production in developing countries. IEA Coal Research. April 1998.141. Greenfield private power.China. Global Private Power Update. September 1998.142. International Private Power Quarterly. Fourth Quarter 1998.
74

sulphur imports from Indonesia’s PT Kaltim Prima Coal under a 15 year coal supply agreement. MostChinese schemes do not involve long term fuel supply arrangements and all previous projects have involvedthe supply of at least a majority of the coal from indigenous sources.
143.
A trend which may emerge as a result of the Asian economic crisis is the acquisition of existing generatingassets in combination with the development of greenfield projects. This strategy has the advantage of animmediate revenue stream, a track record in terms of plant operation and the power offtaker’s ability to makeits payments, and possibly the acquisition of a site which already has permits for the installation of newcapacity. An example of such an acquire and expand scheme, which is also one of the largest private powerschemes of 1998, is the Shandong Zhonghua scheme.
144. When fully operation in 2004, the ShandongZhonghua Power Company will own 3,000 MW of coal-fired capacity capable of producing some 16 TWhof output for the coastal province. The 2.2 billion US dollar project involves the acquisition of the 600 MWShiheng-I plant (which has been in operation since 1987) and the 600 MW Shiheng-II plant currently beingcommissioned, as well as the construction of the 600 MW Heze II and the 1,200 MW Liaocheng powerplants. The owners of the joint venture company include the Shandong Electric Power Group (36.6%), asubsidiary of the Hong Kong-based China Light and Power (29.4%), and Electricité de France (19.6%).
5.3 CLEAN COAL TECHNOLOGIES
GOVERNMENT POLICY. Clean coal technology is part of the “Agenda 21” plan for sustainabledevelopment. To control coal-related pollution from power plants, China is planning the following actions:
• Utilisation of large capacity coal-fired units including 300 MW and 600 MW sub-critical units and thedevelopment of super-critical units. Closure of the smaller scale, inefficient, thermal power plants.
• Research and development of Clean Coal Technologies for power generation, including CirculatingFluidised Bed Combustion (CFBC), Pressurised Fluidised Bed Combustion (PFBC), and IntegratedGasification Combined Cycle (IGCC), as well as SO2 and NOx removal technologies for conventionalcoal-fired plants, and ash and slag utilisation.
• Promoting the development and dissemination of energy saving and environmental protection measuresand technologies such as retrofitting old power plants with more efficient boilers and other equipment,and adding desulphurisation equipment and electrostatic precipitators.
• Retrofitting projects in existing power plants to overcome SO2 pollution problems.
• Installation of low-polluting boilers with fluidised bed combustors which retain the largest part ofsulphur in the combustion bed. There are 1,000 fluidised bed combustors (FBCs) in service with 300 ofthese being circulating type (CFBCs). The boilers are a domestic design with industrial-sized unitsranging from 3 MW to 12 MW. There are plans to develop both 60 MW and 100 MW size units. Thereare a number of imported boilers ranging in size from 12 MW to 100 MW.PILOT . An example of the last group is the 100 MW CFB demonstration project at the Neijian powerplant, in Neijian (Sichuan Province). The boiler will be supplied by Ahlstrom Pyropower. Theguaranteed desulphurisation efficiency of the boiler is greater than 90% at a calcium to sulphur ratio of2.2, while NOx emissions will be limited to less than 400 mg/m3.
143. Shandong, Fujian coal-fired deals close financing, Global Private Power, May 1998.144. Global Trends.Global Private Power. October 1998.
75

While there is an inevitable concentration, within the context of an expanding market for electricity, on theintroduction of new technologies in order to increase thermal efficiencies in China, there is also significantscope for low-cost improvements to existing pulverised coal-fired plant. This includes both improvementsto existing technical processes by retrofitting as well as to associated operating and maintenance procedures.The exchange of experience between utility personnel from IEA countries and their Chinese counterpartscould help to very effectively identify low cost methods of improving the performance of existing coal-firedplants.
FLUE GAS DESULPHURISERS (FGD). China is trying to develop the capability to manufacture FGDequipment. International co-operation projects are in place for the development and use of low-cost FGDequipment. Demonstration projects for simplified FGD equipment of the wet limestone-gypsum andsemi-dry spray drier types are operating at the 300 MW unit at the Taiyuan No 1 power plant (ShanxiProvince) and a 210 MW unit at the Huangdan power plant (Shandong Province). The two FGD systemswill remove SO2 by 80% and 70% respectively. Funding is provided under the Green Aid Plan (GAP)managed by the Ministry of International Trade and Industry in Japan. In addition, the Chengdu thermalpower plant in Sichuan Province is commissioning FGD using Electron beam absorption technology, fundedby private finance.
The Southwest Electric Power Design Institute, together with other institutions, has developed a spray dryerabsorption system which is operating commercially on a 200 MW unit at the Baima power plant in SichuanProvince. The desulphurisation level is between 80% and 90%. The system is reported to be ready forapplication in coal-fired units up to 200 MW in size.
The Thermal Power Research Institute (TPRI) is developing a system for limestone direct injection (LDI)into the furnace. The system is undergoing testing at a 1 MW pilot plant, with desulphurisation expected tobe between 80% and 85%.
Huaneng International Power Development Corporation (HIPDC) has installed two Mitsubishi limestone-gypsum wet scrubbers FGD installations at the 2× 360 MW Luohuang power plant (Sichuan Province). Theplant burns coals with 3.5 ~ 5% sulphur content and the desulphurisation efficiency is around 95%.
A few desulphurisation projects for retrofitting old power plants are also under construction, utilisingGerman funds under Chinese-German Financial Co-operation.
145.
SUPER-CRITICAL STEAM CYCLE. Today’s state-of-the-art supercritical coal-fired plant has a conver-sion efficiency of some 42% to 45%, about 5 percentage points higher than that of the conventionalsub-critical plants which continue to be built in most projects in non-OECD countries. There are more than350 supercritical plants are in operation worldwide (principally in the former Soviet Union, Europe, Japanand the US).146.
In China, the 1,200 MW Shidongkou super-critical plant in Shanghai was built by the Swiss-Swedish ABBGroup and commissioned in 1991 and 1992. Efficiency is reported to be 42%, with fuel delivered to theplant by coast through Qinhuangdao, China’s main port for coal exported from Shanxi and adjacentprovinces. The plant was acquired by Huaneng Power International in late 1997, along with the right todevelop a second 1,200 MW phase of the power station.
147.
145. East Asia – air pollution control and coal-fired power generation. IEA Coal Research. June 1998.146. Regional Trends in Energy Efficient, Coal-Fired, Power Generation Technologies. CIAB/IEA. 1998.147. Huaneng Acquires Shanghai Power Generator.Global Private Power. December 1997.
76

Shanghai Electric Corporation and Westinghouse have signed a joint venture agreement whereby the USmanufacturer will take a 36% stake in the Chinese company. Shanghai Electric Turbine Generator Works isestimated to have about 30% of China’s power generation market.
Siemens Power Generation is engaged in an ongoing joint venture with Dongfang Boiler Works for theproduction of 660 MW steam turbines. Siemens are willing to introduce super-critical steam cycle in newpower plants.
CIRCULATING FLUIDISED BED COMBUSTION (CFBC). A number of different institutions andmanufacturing companies are involved in developing CFBCs, which are especially suitable for the coals ofsouth-west China which have a high sulphur/ash content and a low volatility/ash melting point.
148.
The Engineering Thermophysics Research Institute (ETRI) has developed a 12 MW CFBC boiler inco-operation with Jinan Boiler Works. ETRI is designing a 50 MW CFBC boiler with Wuhan Boiler Works.
The Thermal Power Research Institute (TPRI) and Jinan Boiler Works are designing a 60 MW CFBC boilerwith a high temperature cyclone. TPRI has also developed a 12 MW CFBC boiler.
Beijing Babcock & Wilcox Ltd has purchased a license for a CFBC boiler from Riley Stoker (US). Thelargest capacity being constructed is about 50 MW.
Dongfang Boiler Works has introduced CFBC technology from Foster Wheeler Corp. (USA). The largestboiler being designed is 50 MW.
TPRI is developing a 100 MW CFBC together with other institutions. The final target is to design200 ~ 300 MW CFBC boilers by the end of the year 2000.
PRESSURISED FLUIDISED BED COMBUSTION (PFBC). The Southeast University (SEU) withsupport from the State Science and Technology Commission (now renamed the Ministry of Science andTechnology) began constructing a 1 MW experimental bench scale PFBC facility in 1984 at SEU. This wasfollowed by the construction of a 15 MW PFBC pilot plant as an attempt to try to reduce the lead time tocommercialisation. The pilot plant was a retrofit of an old steam plant at the Jiawang power plant (JiangsuProvince), with the Southeast University being primarily responsible for the R&D and working in co-opera-tion with the Jiangsu Electric Power Bureau, Harbin Boiler Works, and other institutions. There are nowplans to build a 100 MW intermediate test unit with the aim of eventually establishing a unit greater than 300MW with a thermal efficiency close to an IGCC unit.
149.
INTEGRATED COAL GASIFICATION COMBINED CYCLE (IGCC). China is considering introdu-cing IGCC-based power plants in two phases.
• The first IGCC demonstration plant in the 200 to 400 MW range is planned to be constructed during thecurrent Five Year Plan, as one of the Agenda 21 priority projects, and will be contracted to foreigncompanies. Key technologies will studied and evaluated in detail, as part of the technology deve-lopment strategy of the Ministry of Science and Technology, and then developed domestically.
148. East Asia – air pollution control and coal-fired power generation. IEA Coal Research. June 1998.149. East Asia – air pollution control and coal-fired power generation. IEA Coal Research. June 1998.
77

• After putting the IGCC plant into commercial operation, new plants will be built to utilise locallymanufactured equipment, including the gasifier, gas clean-up devices and air separation equipment(oxygen-blown gasifiers).
OTHER PROJECTS worth mentioning include:
• a pressurised fluidised bed gasification project, supported by the Ministry of Science and Technologyand co-operatively undertaken by Beijing Research Institute of Coal Chemistry (BRICC) and ShanghaiPower Equipment Research Institute (SPERI), and
• a hot gas clean-up and desulphurisation project, supported by the UNDP, the Ministry of Science andTechnology, and the State Administration of Coal Industry. Test facilities for the study of the desulphu-risation process are located at BRICC.
Harbin Boiler Ltd. has undertaken the manufacture of Texaco Gasifiers with a coal feed rate of 600 ton-nes/day. Based on Texaco technology, three gasifiers have been subcontracted from Ube Industries Ltd(Japan) and manufactured by Harbin Boiler Ltd.
LOW NO X BURNERS. China is examining a range of options for NOx control and staged combustionburners have been recently installed in 300 MW and 600 MW units. China and the Netherlands signed anagreement in November 1996 to install 12 low NOx burners in an existing 100 MW boiler at the Gaojingpower plant in Beijing, with the objective of demonstrating that considerable reductions of NOx can beachieved at a reasonable cost.
78

6. FUTURE PROSPECTS
6.1 CURRENT REFORMS IN THE COAL INDUSTRY
In the context of the transition to a “socialist market economy”, the emphasis for the development of the coalindustry has been placed on “market-oriented coal production” to ensure a closer balance between supplyand demand, improving the economic viability of the industry through restructuring and the better manage-ment of enterprises, improving the industry’s safety record and enhancing the living standards of theworkforce. The targets elaborated under the current Five Year Plan call for indigenous coal production toreach 1.45 billion tonnes per annum by the year 2000, of which 610 million tonnes would be produced bytownship coal mines. During this period, new capacity additions would equal 175 million tonnes, with afurther 180 million tonnes of capacity becoming available in the subsequent Tenth “Five Year Plan”(2001-2005). In addition, by the year 2000, it is planned that 60% of China’s coal mines and enterpriseswould be economically viable and no longer dependent upon financial assistance, and 500,000 workerswould have been shifted to non-coal business operations.
150.
However, these targets have had to be revised as a result of the glut of coal in China which emerged towardsthe end of 1997 and led to record stock levels during 1998 (200 million tonnes at the end of Septemberaccording to one source.
151). Due partly to the slowdown in economic activity, and therefore in the demandfor coal, the glut has been blamed by the authorities on the “unrestrained production by small coal mines”,which “disrupted the market, squandered resources and brought about numerous fatalities”.
152. The smallmines, often illegal, are viewed as competing unfairly with the larger mines in that they have lower safetyand environmental standards, resulting in lower production costs. Since the liberalisation of coal prices inJanuary 1994, they have been able to undercut the prices charged by the larger mines and, as a result, havehad an economic incentive to increase their output substantially. In addition, many of these illegal smallmines are protected by their local governments for the income they generate and the employment that theyprovide. It has been estimated that there are some 51,200 illegal coal mines operating in China, with anannual production capacity of 430 million tonnes (approximately one third of total national production).
153.
Following the one month shutdown of coal production in February 1998 and the sharp losses suffered by theindustry during the first half of 1998 due to the record stock levels and slack demand, the Chinese authoritiesannounced an overhaul of the coal sector in an attempt to reverse a sharp fall in coal prices, improveefficiency and boost the profitability of the big state mines. Large coal mining corporations would be formed
150. China Coal Industry Yearbook 1996, China Coal Industry Publishing House, Beijing, China, 1997.151. China Coal Industry News, quoted in China Daily. 26 October 1998.152. Xinhua News Agency, 23 August 1998, quoted in Asian Energy News, September 1998.153. State determined to shut down small coal mines.China Daily. 13 November 1998.
79

through mergers and smaller mines would be sold off, contracted out, merged or turned into share-holdingcompanies.154. It was announced that some 25,800 small coal mines operating without production licences,or those producing low quality coal, would be shut down by the end of 1999, thereby cutting annualproduction by 250 million tonnes in order to better balance supply with demand. The State Administrationfor Coal Industry would also no longer own any coal mines, passing ownership and day-to-day managementover to the provincial and municipal authorities, and exercising instead only strategic control over thesemines. By 24 August 1998, the 94 key State mines, which accounted in 1995 for 503 million tonnes, or 39%of national production, had all been transferred over to the provincial authorities.
Despite official reports that up to 13,000 small mines had been closed by the end of February 1999, withsome of the mine entrances closed with explosives, the difficulties in the coal market have continued. InApril 1999, the authorities announced the establishment of a team of representatives from the Stateauthorities to supervise the closure of the small mines, indicating that “the toughest barriers to theimplementation of the overhaul lie in the local governments that are reluctant to take action against themines (which) are a major source of their business interests”.
155. The same month saw 11 of the key Statemines apply for bankruptcy, with officials recognising that up to 14 key State mines could go bankruptduring 1999.156.
There is an acknowledgement that the restructuring process has to be speeded up if the Government’sobjective of removing subsidies to the key State mines by the end of the year 2000 is to be met.
6.2 CHALLENGES
China is, and will remain, the world’s foremost producer and consumer of coal. The vast resources, theeconomic, political and social imperatives for using indigenous fuels and the increasing internal demand forenergy will ensure a major role for coal well into the next century. Coal has been, and will continue to be,the main motor of China’s economic growth, although the patterns of coal demand are certain to change. Theelectricity generating sector will become an increasingly important customer and the direct burning of coalin the residential sector will gradually give way to electricity and gas. Direct coal use in the industrial sector,currently the main consumer of coal, can also be expected to be a less significant part of coal demand in thefuture.
Challenges facing the Chinese authorities with respect to the coal industry include:
• ensuring the progressive closure of the illegal mines and managing the resulting economic and socialimpacts in the regions concerned (especially re-employment considerations);
• the need to continue restructuring the main state-owned mines to improve efficiencies and ensure thatthey are put on a fully commercial footing (including consideration of permitting further foreigninvestment and eventually ownership);
• the need to mechanise the bulk of underground coal mines;
• ensuring independent mine inspections rigorously enforce safety regulations;
• increasing the priority given to the construction of coal preparation plants;
154. Overhaul for coal sector, Financial Times, 4 May 1998.155. Team supervises mine closures.China Business Weekly. 18 April 1999.156. Restructuring pushes coal mines into bankruptcy.China Business Weekly. 2 May 1999.
80

• the need to balance the transportation of coal with the transportation of electricity, with the establish-ment of mine-mouth power generation plants (although this will require water shortage issues to beaddressed);
• the need to resolve water supply, water quality and mine waste disposal issues;
• expanding the capture and use of Coal Bed Methane;
• ensuring full cost pricing of coal to encourage more efficient production;
• ensuring full cost pricing of transport to give a commercial incentive to mine-mouth coal preparation;
• examination of using financial instruments, such as taxation, to encourage the prioritised use of washedor low sulphur coals over unwashed or higher sulphur coals;
• the potential for increased coal exports and imports, particularly recognising the Chinese regionaldiversity of energy demand and supply.
As the world’s largest coal producer and already a significant exporter, China’s performance will haveimplications on the world coal market. Depending on the balance between internal supply and demand, aswell as the outcome of the government’s policies and the willingness to embrace market principles in themanagement of the industry, China could emerge in the future as either a net importer or a net exporter ofcoal.
6.3 OPPORTUNITIES FOR CO-OPERATION
As this desktop study has highlighted, the way coal is currently used in China does present a number ofchallenges, not least in terms of energy and market efficiencies, but also its effects upon the environment.Opportunities exist, especially within the context of the increasing demand for coal-fired electricity genera-ting capacity, for further mutually beneficial co-operation between the CIAB, the IEA and China.
The CIAB Asia Committee suggests that the initial areas to target are coal mining, coal washing and themore efficient design of boilers and environmental equipment for new power plants. Concentrating on theseareas could deliver significant improvements across a wide range of issues – from a reduction in pollutionand emissions levels, better water and land management practice, safer and more efficient coal mines, moreefficient use of the transport and distribution system by energy products, higher thermal efficiencies inpower stations and ultimately cheaper and more reliable power.
The Committee believes there would be considerable benefit for the Coal Industry Advisory Board and theIEA in further co-operation on China. This will require high level discussions with various Chineseauthorities since Chinese collaboration and feedback are critical in the identification and selection ofspecific interest areas to be targeted.
The following specific recommendations have been agreed by the Asia committee:
1. The IEA should work with the appropriate Chinese authorities, drawing on the advice and expertise ofthe CIAB as appropriate, to identify specific opportunities for international co-operation in the transferof clean coal technology.
81

2. The search for such opportunities should focus on the following areas:
• efficient coal mining practices;
• coal washing;
• coal bed methane;
• thermal efficiency of new power plants;
• addition of desulphurisation equipment and low NOx burners and particulate emission controlequipment on power stations.
3. The IEA should explore other possible avenues to deepen co-operation with China in the coal sector.
The Asia Committee also recognises that improving the efficiency of existing industrial boilers andcoal-fired electricity generating plant is an important objective. It notes the Technology Co-operationAgreement pilot project between the IEA, in collaboration with the IEA Working Party on Fossil Fuels andthe Climate Technology Initiative, to identify low-cost options for Chinese utilities to improve their existingpulverised coal-fired plants. The exchange of experience between utility personnel, mine operators, processcontrol instrumentation suppliers and operators, equipment maintenance contractors, etc. could be a veryeffective, low cost, method of improving the performance of existing coal-fired plants. It is intended that thecombined knowledge and practices of utilities in several IEA countries will be exchanged directly with theChinese utilities, thereby providing an effective transfer of experience with a potential to lead to rapidimplementation. Where technological improvements may be required to gain the required gains in efficiencyand environmental performance, the experience of IEA member countries’ utilities will help to identify andprioritise a technology replacement strategy to obtain maximum benefit with minimum capital outlay.
China already participates in two IEA Implementing Agreements, on small hydro and nuclear fusion, andhas expressed an interest in participating in coal-related technology co-operation agreements. This should beencouraged and supported.
The Asia Committee also underlines the importance of encouraging the selection of energy efficient, cleancoal technologies when new coal-fired plant is under consideration in China and to the options available topromote such technologies (such as the possible use of the Clean Development Mechanism in the event ofthe Kyoto Protocol being ratified). Consideration should also be given to the licensing of Clean CoalTechnologies to China, so that more of the plant construction can be undertaken within China and therebygive a boost to domestic employment as well as promoting self-sufficiency. However, this will only occur ifthe royalty is fair and there is an adequate protection of intellectual property.
157.
Finally, the Asia Committee believes that there is much that can be done to improve co-ordination betweenthe China activities of the IEA and those of the Coal Industry Advisory Board. Better co-ordination willassist in developing an integrated strategy and approach vis-à-vis China and ensure a closer sharing ofinformation and experience on China activities between the respective bodies.
157. The Challenge of Coal Technology Transfer. R.E. Wilhelm. Exxon Corporation. Published inThe Future Role of Coal: Markets,Supply and the Environment. OECD/IEA 1999.
82

ANNEXES
83

Sou
rce:
Chi
naE
cono
mic
Rev
iew
,Apr
il19
98
84

ANNEX I
GOVERNMENT STRUCTURE AND DECISION MAKING
PRESIDENT. The President is the head of state. The President is appointed by the National People’sCongress (NPC), which endorses his candidacy after he has been selected by the Party. Currently, theposition is held by Jiang Zemin, who also holds the Chairmanship of the State Central Military Commissionand the position of Secretary General of the Party. This is the first time that all these posts have been held bythe same person and Jiang Zemin is seen to enjoy broad support in the country.
CHINESE COMMUNIST PARTY. Holders of high State office have their primary allegiance to the Party.Membership of the Party is not open to all and is valued for the access it can provide to power. Everyorganisation, especially public organisations, has a committee of the party. The committee has a partysecretary and is composed of several groups. Members of each committee have regular meetings and theparty members normally take most of the important positions in organisations. Membership of the Partytotals around 50 million, out of a population of approximately 1.2 billion.
The Communist Party is headed by the Central Committee. Within the Central Committee, the real powerlies with the Political Bureau or Politburo. The Secretary General is a key position, although the degree ofpower will depend on the existence or otherwise of a paramount leader, and on his network or power base.
The Central Discipline Inspection Commission has the power to inspect and review the activities of localcadres. It can set policy as to new admissions to the Party and will normally determine exclusions from theParty.
STATE CENTRAL MILITARY COMMISSION. This body is effectively an independent body, account-able to the Party, that provides the public link between the State and the armed forces. The State CentralMilitary Commission has been putting more emphasis on professionalism and is attempting to move thePeople’s Liberation Army away from having its own business interests.
STATE COUNCIL. The executive arm of the Government is the State Council, equivalent to a cabinet orcouncil of Ministers.
The head of the State Council is the Premier, Zhu Rongji. He is supported by six Vice Premiers and eightState Councillors, usually representing different parts of, or ethnic groups in, China. The 15 members of theState Council have some real authority and are theoretically accountable to the National Peoples’ Congress.
85

MINISTRIES AND COMMISSIONS. Ministries and Commissions, which run the government, report tothe State Council. Policy is officially only set by the State Council, but in practice policy is made by theParty, and declared through the State Council. The members of the Standing Committee of the Politburowield the most power over policy determination at the macro level. The Ministries and Commissions,reporting to the State Council and their respective Vice-Premiers in the State Council, decide more detailedpolicy. The reforms, approved in March 1998, reduced the number of ministries from 40 to 29 and aims toreduce to size of the civil service.
The policy of depending on economic reform and growth to keep the party in power, while at the same timeholding the country together, has given prominence to Premier Zhu Rongji. The day-to-day policy isimplemented through the State Economic and Trade Commission, the Ministry of Finance, the People’sBank of China, the State Investment Bank and various corporations, either state-owned monopolies orconglomerates, reporting directly to the State Council. The State Development Planning Commission SDPC(formerly the State Planning Commission, SPC) implements the central planning aspects of China’seconomy and has responsibility for approving all major projects. In this role, the SDPC acts as the screeningbody for the State Council in exercising tight control over provincial powers and in ensuring that scarceresources are allocated in accordance with national objectives.
All major projects over US$ 10 million, or US$ 30 million for certain zones and areas, have to be submittedto the SDPC for approval before they can be implemented. The approval procedure considers technical,environmental, strategic, financial and legal aspects, including the standing of the foreign and Chineseparties involved, and the employment opportunities to be created. Smaller value projects in sensitive areas,such as railways and telecommunications, also have to be submitted to the SDPC. As part of the ongoingreform process, the State Council is considering changing the approval process.
CHINESE PEOPLE’S POLITICAL CONSULTATIVE CONFERENCE (CPPCC). This body acts inan advisory capacity and has a sounding board role. It has few powers but has tended to become more vocal.
PROVINCIAL GOVERNMENT. The Governor and the Mayor are the chief executives in the provincesand municipalities. There is a strong degree of autonomy for the provinces to manage their own affairs. Thefurther their distance from Beijing and the greater their wealth, the greater the possibility for autonomy.However, between 1994 and 1997, the Central government won the respect of the provincial officialsthrough its control of the economy and the lending policies of the banking sector. Nevertheless the constanttension between the centre and the provinces remains.
86

ANNEX II
HISTORICAL AND DEMOGRAPHIC PERSPECTIVES
HISTORY. The People’s Republic of China was founded in 1949. The new Constitution, which has beenamended on various occasions, provides a central leadership role for the Chinese Communist Party.
In 1956, there occurred the “One Hundred Flowers” campaign to flush out and eradicate intellectuals whowould not comply fully with the Party. It was followed by the “Great Leap Forward” in 1959, with itsresultant serious economic consequences. In 1966 the “Cultural Revolution” started and continued fornearly 10 years. The impact of the “Cultural Revolution” on the Chinese economy, people and culture wasenormous. Fortunately, Deng Xiaoping and Zhou Enlai were able to halt the campaign and encourage bothagricultural production and reward for effort.
Deng took control during 1977 and launched “The Open Door Policy”, whereby foreign investment andinternational trade were encouraged. In addition to economic reform, Deng reformed the leadership of theParty, slimmed the Peoples’ Liberation Army and started to make it more professional, encouraged moreeducation to a higher level and diluted the power of the Central Government.
With Deng’s death in 1997, the challenges he has left behind are those of transition. President Jiang Zemingand Premier Zhu Rongji are continuing the open door policy and market-oriented reforms. With all theproblems of the planned economy, such as low efficiency and big losses in state-owned enterprises, theChinese government intends to move its command economy towards a more market-oriented one whilecontinuing to preserve the Communist Party’s supremacy in the whole system. The new government leaderswere elected at the first meeting of the Ninth National Representative Congress held in March 1998 inBeijing. Regardless of all the challenges facing reform, Premier Zhu Rongji has expressed his determinationto continue the reforms of the government and state-owned enterprise sector, and further promote the“socialist market economy”.
POPULATION. The population of China was approximately 1.22 billion in 1997, or some 20% of theworld’s population. The growth rate of the population varies between districts, but the overall net rate isslightly less than 1% per annum.
158. Estimates of growth indicate that the population of China will reach1.5 billion between 2020 and 2025.
ETHNICITY. While there are 56 different ethnic groups in China, the population is overwhelminglyChinese Han, with minority groups accounting for only approximately 8% of the population. The minoritygroups include Uygurs, Tibetans and the Mongols of Inner Mongolia. The minority groups are found mainlyin the North, West and South West of China.
The majority of the population is in the East and Centre of China, with a sparser population in the West andNorth.
158. U.S. Department of State.Background notes: China,April 1998.
87

URBANISATION. Since there is a big gap in living standards and job opportunities between the country-side and the cities, there has been an influx of people from the countryside into the principal cities seekingwork and better pay since the end of the 1970s. This movement has been significantly noticeable in themajor eastern cities, such as Guangzhou and Shanghai. Informed observers estimate that the migrantpopulation may be as high as 200 million people. Shanghai, which in 1995 had a population close to 14.2million people in the municipality and immediately surrounding areas, is expected to have a populationnearer to 20 million by 2010. Currently only 30 percent of the Chinese population live in urban areas.
EDUCATION. The Chinese are noted for placing a high value on education and using the education systemto produce an elitist, governing class. China has a rigid education system. Students who graduate fromprimary schools have to pass all the local exams to enter middle schools and high schools. Only thosestudents who pass the national administration tests are allowed to enter universities or colleges. There arequotas each year as to how many new students a high education organisation can have. The State EducationCommission sets the quotas. In 1997, China selected 100 leading universities around the country to receivemost of the education and research funding. With the expectation of experiencing the outside world andhaving a high quality of life, many young intelligent people seek opportunities to study overseas. By the endof 1996, approximately 150,000 Chinese were studying overseas at the tertiary level.
LANGUAGE. China has one great unifier – a common language. The ideograms are used throughout thecountry and Putonghua (Mandarin) is the official standard dialect spoken in government throughout China.There are eight major dialects, innumerable sub-dialects and 53 minority languages. All laws and courtproceedings are recorded in the common script and Mandarin is the official language of the courts.
CULTURE. Traditions are based on family units and the preservation of social order is by loyalty to thefamily, a belief in the superiority of the Chinese race and obligation on a favour for favour basis outside thecircle of family and close friends. Chinese people are sensitive to race andrenqing(humanised obligation),and attach great importance to cultivating, maintaining and developingguanxi (connections or rela-tionships). People withinguanxiare consciously committed to each other and even undertake the exchangeof favours in spite of official policies against such practices.Guanxihelped many Chinese survive the hardtimes during the cultural revolution. The whole system has been underpinned by a belief in the absoluteauthority of the Emperor or central government.
ECONOMY . China is a vast country with a huge population. Its economy is growing and rapidly evolving.Since the adoption of the “Open Door Policy” by Deng Xiaoping in early 1980s, China has transformeditself into a diverse, yet planned, “socialist market economy”. Whilst the central government retains controlover the direction and priorities of development, there is sufficient evidence of an emerging market side tothe economy, particularly in the coastal regions and Special Economic Zones. The National People’sCongress elevated the status of the private sector in the state hierarchy in April 1999, a significant symbolicstep in favour of a market economy.
The challenge of high inflation in the first half of the 1990’s, generated by rising demand, has recently givenway to deflation; a consequence of the over capacity in many production sectors and the depressed consumerconfidence resulting from the growth in unemployment and unease about job security. This is creating newchallenges for the Chinese government in managing the powerful economic and social forces underlying thereform process. Reconciling the greater expectations on the part of the population to share in the economicwealth, which has seen peasants and agricultural workers migrating to the booming coastal regions, is aparticularly important issue. As further economic reforms are introduced and with the deregulation of manymarkets, major structural adjustment will be required to the economy in order to avoid unemployment fromthe closure of bankrupt State enterprises rising too rapidly.
88

ANNEX III
INFRASTRUCTURE
OVERVIEW. Modern road and rail building within China took place during the late nineteenth and earlytwentieth centuries. Development tended to remain in the east due to the vastness of the country and theaccess to sea routes along the east coast. China’s transport system at the end of 1996 comprised1,185,800 kilometres of roads, 1,166,500 kilometres of civil aviation routes, 110,800 kilometres of inlandwaterways, 56,700 kilometres of railways and 19,300 kilometres of petroleum and gas pipelines. Thecountry also operates 460 ports along its 18,000 kilometre coastline, 16 of which handle the bulk of thenation’s foreign trade.
China has a relatively small transport sector for a country with a land mass of 9.6 million square kilometres,compared with other large countries. India, for instance, has 60,000 kilometres of railways and a land massof 2.9 million square kilometres. The intensity of China’s freight utilisation is among the highest in theworld as 38% of the population and 55% of the industrial production is located in the country’s eastern zone,while mineral resources, particularly coal, must be transported from the central, north and eastern provinces.Freight intensity measured in tonnes per unit of GNP is ten times the level of India and Brazil.
Railways, ports and airports are owned and operated by the central authorities, while roads and waterwaysfall under the general jurisdiction of the provinces. Highways and waterways are operated by mixed publicand private interests, but remain regulated by more than one layer of government. Table 12 in Annex Villustrates China’s freight transport by type over the period 1980-1996. In 1996 the following figuresapplied:
• railways handled 36% of long haul cargo, which was mostly coal;
• waterways accounted for 49% of total freight. Coal represented 17% of waterborne freight.
Inland waterways are an important mode of transport in east, central and south-west China, especially alongthe Yangtze and Pearl River basins and estuaries.
Between 1980-1990, the transport sector grew at an annual rate of about 8%, whilst the economy wasgrowing at an average of 9-10% per annum. Investment in the transport sector declined as a percentage ofGDP from 1.7% in 1980 to 1.0% in 1990.
The following are the main transportation systems:
WATER. China has a natural infrastructure provided by the two great rivers, the Huang He (Yellow River)in the north and the Chang Jiang (Yangtze River) in the centre. The Pearl River in Guangdong is anothermajor transport artery. The main commercial development of China has been along the principal rivers,while the growth of Guangdong can be attributed, in part, to its access to the sea and the port of Hong Kong.The Yangtze River valley, with Shanghai at its estuary, carries over 70% of all China’s inland waterwayfreight tonnage and is scheduled for significant development, i.e. Three Gorges Hydropower Project.
89
Inland navigation has historically been China’s most important form of transportation. The 138,600 kmnetwork of rivers, tributaries and canals handle a large share of east-west traffic and link the landlockedcentral part of the country with the eastern region. There are about 110,800 km of navigable waterways withjust over 50% having a depth of one metre or more.
• NETWORK . China’s major river routes can be grouped in three basins: the Heilongjiang (Amur River)system on the north east border with Russia, which is frozen in winter, the Changjiang (Yangtze River)system in central China and the Zhujiang (Pearl River) system in the south. The importance of theHuanghe (Yellow River) on the northern plains is limited by heavy silting. The west-to-east flow ofthese rivers is complemented by the historically important north-south Grand Canal, which was firstconstructed 700 years ago. This vital canal is over 1,500 km long and links Beijing and Hangzhou.There is also a shorter canal to the east of the Beijing-Hangzhou canal known as the North JiangsuCanal.
• VESSELS. About half of China’s inland waterways suffer from shallow depths of less than one metrewhich can only be used by vessels of between 10 and 80 DWT. Other portions of the system are blockedperiodically by droughts, floods or ice in winter. Fewer than 5,000 km are wide and deep enough toaccommodate vessels over 1,000 DWT through river channels, canals and locks. Many of the vesselsare therefore small 20-110 tonne barges carrying low value bulk commodities. On the Yangtze and PearlRivers, barges carrying 1,000-3,000 tonnes are common.
However, a lack of co-ordination between government authorities in the development and utilisation of thewaterways system has seen the construction of irrigation, flood control and power dams with little regard fortheir adverse effect on water flows for the movement of shipping. Hundreds of dams, flood gates and otherobstructive structures have been built across navigable waterways, preventing larger vessels from movingupstream.
COASTAL SHIPPING . China’s merchant navy is made up of 1,500 vessels including 776 cargo, 11refrigerated cargo, 70 container, 17 roll-on, roll-off cargo, 181 petroleum, 9 chemical tanker, 250 bulk and 2liquefied gas ships. China operates an additional 183 ships under Maltese and Liberian registry. China hasmade significant strides in expanding and modernising its merchant navy, which remains mainly under themanagement of the state-owned China Ocean Shipping Company. The country supplemented its ownshipbuilding programme with substantial purchases of large second-hand vessels at bargain prices duringthe world-wide shipping slump. China has a merchant fleet of over 250 bulk carriers. The capacity forcoastal shipments is constrained by the limited loading and unloading capacity.
RAIL. The railways account for an estimated 36% of China’s cargo movement and 36% of its passengertraffic. China’s basic rail system was mainly built prior to World War II and is inadequate for China’s currentneeds. While the major arteries are being maintained, ambitious plans to extend and double track the railsystem, both north-south and east-west, are in place, with a focus on coal transportation. The pace ofconstruction is increasing, with over 1200 kms of new track (including 600 kms of double track), completedbetween 1990 and 1995. US$ 50 billion will need to be spent on the railways in the period 1995-2000 tocomplete the planned extensions. However, foreign direct investment in railways and their management isnot permitted. Rail freight rates are being increased to market levels, which should provide funds forongoing development.
ROAD. Vehicle growth rates of 13% pa since 1978 are likely to continue and place a heavy demand ondevelopment funds. Construction is in progress for two east-west routes from Shanghai to Chengdu andKorgas to Lianyungang and two north-south routes from Beijing to Macau and Tongjiang to Sanya. Theseprojects are scheduled for completion in the year 2000 at an estimated aggregate investment of
90

US$ 52 billion. The first major highways to be built with the aid of direct foreign investment are beingconstructed in Guangdong. The Ministry of Communication has plans to build between 30,000 and35,000 kilometres of high-grade highways during the next 30 years.
PORTS.Tianjin, Dalian, Qinhuangdao, Qingdao, Shanghai (including Pudong), Ningbo, Xiamen, Yantianand Shekou are the major ports in China. While foreign investment in the construction and management ofports has been allowed for some time, the bulk of investment in upgrading ports has been locally generated.
AIR. The Chinese air transportation system is registering an annual growth of between 8% and 10%. Thefuture growth in air traffic (passenger and cargo combined) in China has been assessed at a minimum of 8%to 9% per annum continuously through to 2010. Over the next decade, the passenger component is expectedto increase six fold from its end 1994 level.
China has numerous airports, but only Shanghai, Beijing and the new Hong Kong airports can be categori-sed as international. Plans and funding have now been approved for the development of a new airport atGuangzhou to international standards. Hong Kong’s new Chek Lap Kok airport has been fully completedand started to operate in July 1998. The lack of airport capacity is a major infrastructural problem for China.
TELECOMMUNICATIONS. Telecommunication needs in China are being met by a mixed approachpolicy. China does not want foreign operators to own, or otherwise control, the telecommunicationsnetworks and so the Ministry of Posts, Telegraphs and Telecommunications imports telecommunicationstechnology from private sector companies in Japan, Hong Kong, Sweden, Germany, Britain, Canada and theUSA. China does have a reasonable chance of success in meeting its telecommunication needs of asufficiently reliable, if somewhat basic, framework to support the pace of economic development over thenext ten years. At present there is approximately one telephone per 40 people, including business installa-tions, and an extra 20 million lines were added in 1996. Forecast annual investment in the telecommunica-tions field for the period 1996-2000 is US$ 12 billion.
91

92

ANNEX IV
TECHNOLOGY TRANSFER
A. GOVERNMENT AND OTHER BODIES
There are 5 major groups of organisation involved in energy policy and clean coal technology in China.These are: Government administrative institutions (i.e. State Commissions), Government industrial institu-tions (i.e. State Administration of Coal Industry), scientific organisations (i.e. Universities, the Academy ofSciences), environmental organisations (i.e. State Environmental Protection Administration), and Imple-menting organisations (i.e. China Energy Investment Company).
GOVERNMENT ADMINISTRATIVE BODIES
The State Administration of Coal Industry (under the State Economic and Trade Commission), the StateEnvironmental Protection Commission (SEPC), the Ministry of Science and Technology, and the StateDevelopment Planning Commission are the Government administrative institutions mainly involved inclean coal technology policy-making. Each body has its own charter and operates under the State Council.
• PLANNING. The State Development Planning Commission (SDPC) is the most powerful institutiondealing with social and economic planning. It formulates medium/long-term plans and allocatesresources for sectoral development. The SDPC now consists of 19 departments, with the energy powerdepartment being mainly responsible for power projects of 500 MW and larger.
The State Economic and Trade Commission was created in 1993 to co-ordinate the implementation ofproduction plans set by the SDPC and to deal with the allocation of resources for sectoral technologydevelopment. While it was originally designed to be a counter-balance to the influence of the SDPC inthe overall economy, the recent reforms have greatly strengthened its role. As a result of the reforms, ithas absorbed six state ministries including coal, power, the metallurgical industry, the machine buildingindustry and internal trade.
• FUNDING. The government has created the State Energy Investment Corporation to be the primarychannel for government funding for thermal power projects. It will function like a bank and assess theeconomic and financial viability of new projects. It is expected to eventually become independent ofstate planners, but it is currently strongly influenced by them.
159.
• SCIENCE. The Ministry of Science and Technology formulates energy related science and technologypolicies. It has less power than other Governmental administrative institutions because of limitedcontrol on financial resources (Shi, Dinghuan & Chen, 1992). Through member research institutions,the Ministry of Science and Technology has carried out research on clean coal technology assessment,forecasting and selection of priority areas for implementation.
159. China.International Private Power Quarterly. Fourth Quarter 1998.
93

• DEVELOPMENT. China International Engineering Consulting Corporation (CIECC) is the deve-lopment arm of the State Development Planning Commission and acts as a consultant and sometimesequity participant in building and operating power plants.
OTHER GROUPS
CHINA ELECTRIC COUNCIL INTERNATIONAL (CECI). This body estimates China’s needs for electricpower generation and issues solicitations at the State level for power plant construction and operation. It alsoco-ordinates the implementation of loan agreements with multilateral agencies.
BUREAU OF INTERNATIONAL CO-OPERATION (BOIC). The State Power Corporation has the BOICas its foreign relations window. The BOIC has the function of co-ordinating all the economical and technicalco-operation activities of China’s power sector and is the chief executive agency for implementing loanagreements on new power projects with the World Bank, the Overseas Economic Co-operation Fund(OECF, Japan) and other organisations.
CHINA ACADEMY OF SCIENCES (AoS). The AoS advises Government on science and technologyissues and influences policy making on clean coal technologies. Together with the SDPC it manages theEnergy Research Institute (ERI), which is the largest national energy policy research body.
CHINA ENERGY RESEARCH SOCIETY (CERS) is a non-government organisation, active in the field ofenergy policy research. Its role is to advise the Government on energy policy as an independent think-tank.
NATIONAL RESEARCH CENTER FOR SCIENCE AND TECHNOLOGY FOR DEVELOPMENT(NRCSTD). This policy research organisation has been involved in energy technology assessment and policyadvice with support from the Ministry of Science and Technology. Among its functions is that of adviser tothe Government. The NRCSTD tends to be focused on long-term policy options for science and technologydevelopment in China.
STATE ENVIRONMENTAL PROTECTION ADMINISTRATION. This body co-ordinates energy relatedpolicy research to integrate energy saving and environmental protection objectives into the energy infrastruc-ture development strategy. Policy guidance for clean coal technology development is carried out at theContemporary Environmental and Economic Policy Research Center under SEPA’s control.
STATE ENERGY INVESTMENT CORPORATION. This body is responsible for assessing the financial andeconomic viability of new projects, and awarding loans. Currently under direct influence of the SDPC, it issoon expected to become independent from state planners.
BOT INVESTMENT AND DEVELOPMENT CORPORATION. A non-government commercial entityowned by nine shareholders, one of which is the Huaneng Group. The BOT Corporation organises andundertakes investments under the guidance of the SDPC but as an independent commercial entity.
B. COMMERCIAL, LEGAL AND TAX PRACTICES
There are very few private enterprises in China owned entirely by Chinese nationals, but there is a gradualtrend to do so. Until the “Open Door” policy was introduced, all enterprises were owned collectively,usually by the state or otherwise by the commune (also known as town and village enterprises). After 1978,it became possible for foreign enterprises to own businesses through joint ventures, but not all sectors are
94

open to foreign investment. Examples of restrictions are railways, airports, telecommunications networksand general construction. All land ownership vests in the state but leases can be owned by corporations.
INVESTMENT APPROVAL. All foreign investment requires approval by the appropriate authorities andit is this process that is used to determine investment priorities, by the speed with which approval is grantedor by the obstacles raised to slow down the approval process. The approval process may take place at thelocal level only or may require a central government review as well. Most local authorities can process andapprove an investment with a value up to US$ 10 million without reference to the central government but,in certain locations such as Shanghai, the local authorities have approval authority up to US$ 30 million.
LEGAL STRUCTURES. The legal methods for a foreign body or person to have a presence in China are:
• appointment of an agent or distributor;
• representative office;
• equity joint venture;
• contractual joint venture;
• wholly foreign owned enterprise;
• special licence.
AGENTS AND DISTRIBUTORS are appointed where a foreign company wishes to do business in theChinese domestic market without having a corporate presence.
A REPRESENTATIVE OFFICE is one which requires local authority approval, allowing the business tomake contacts, promote itself and obtain market information. A representative office is not allowed to sellany services or goods and it does not have an independent legal status. Its Chinese staff must be hired froma state agency.
EQUITY JOINT VENTURES were the first joint ventures allowed by China and are still used occasional-ly today. They have separate legal status and limited liability for their partners. The foreign partner mustcontribute at least 25% of the share capital, with no maximum limitation. The highest authority in an equityjoint venture is the board of directors and not the partners. Equity joint ventures are governed by the Law onEquity Joint Ventures and its Implementation Regulations which can be relatively inflexible. These twopieces of law require the parties to share their profits and distribute their assets on winding up in accordancewith the ratio of their capital contributions. This can be a problem where contributions have been made otherthan in monetary terms.
A CONTRACTUAL JOINT VENTURE is usually one of two types – integrated or un-integrated.Integrated means that the management is jointly supplied. An un-integrated joint venture has the manage-ments of the two partners working separately to carry out their specific tasks and obligations as set out in thejoint venture agreement. An integrated contractual joint venture will be considered as a separate legal entityif there is a board of directors, it has an enterprise name and an independent accounting system. Anun-integrated contractual joint venture can take a variety of different forms, for example a co-operationagreement or compensation trading arrangement, but it may not be regarded as a separate legal entity.
Equity and contractual joint ventures differ in several respects. Contractual joint ventures have to complywith the Contractual Joint Venture Law which is reasonably flexible and has no accompanying Implemen-tation Regulations. Another difference between the two joint ventures is the form of their constitutional
95

documents. For contractual joint ventures, the terms of their joint venture agreements are more importantthan the Contractual Joint Venture Law. The law sets down certain requirements with respect to capital-debtratios, timing of payments and similar matters. Percentage ownership by the foreign entity can exceed 50%or be almost nothing. The commonest form of foreign involvement in China is through contractual jointventures.
WHOLLY FOREIGN OWNED ENTERPRISES (WFOE) are a more recent development. The statutewas made law in 1988 and permits one or more foreign enterprises to create a legally separate body in Chinathat is entirely owned by the foreign enterprise(s). That body has the freedom to choose management, decideon recruitment, financial, sales and other key policies, and to have apparent full control. The drawback canbe the lack of a local partner who knows and can handle negotiations/relationships with the local authoritiesand local staff. WFOEs are becoming more widely used, but are not yet as popular as contractual jointventures.
SPECIAL LICENCES are issued for specific activities, e.g. a foreign law firm permitted by the Ministryof Justice to open a branch in China to advise on foreign law. The terms of the licence will be decided on acase by case basis, but will normally specify what is allowed to be done, the party(ies) licensed, staffing,duration of licence, requirements regarding capital or equipment and any geographical constraints. A foreignparty with a special licence can undertake the licensed business in China and will be subject to tax on itsprofits.
BUSINESS LICENCES are issued to all businesses whether Chinese or foreign. They specify the areas ofactivity in which the business may operate. Contracts concluded with an enterprise that are in areas outsideits licensed scope of business are likely to be considered void and unenforceable in the event of a disputebeing taken to court.
Recently, China has brought into being a comprehensive Companies Law, covering the formation of limitedliability companies and the flotation of companies on a recognised stock exchange. The law states that it isapplicable to foreign investment enterprises and, in the event of conflict with the laws relating to foreigninvestments, the law on foreign investments shall take precedence.
DISPUTE RESOLUTION. An important element of business is the dispute resolution process. In Chinathe preferred method is conciliation or arbitration since this reflects the underlying cultural values. Courtsdo exist to which commercial cases can be referred and these operate on a county, provincial and state level.There are several problems in referring matters to a People’s Court:
• this approach is discouraged;
• Chinese lawyers are few and many are not experienced;
• the courts are not impartial in the western judicial sense; judgements may be made in accordance withlocal and national political guidance;
• the process is not conducted in the manner typical of western judicial systems and there is not the sameunderlying code or common law or precedent to draw on;
• the process can be time-consuming;
• guanxi(i.e. relationships) can play a part;
• the successful plaintiff cannot always be sure of recovery even if he wins.
96

ARBITRATION. In respect of arbitration, the National Arbitration Law came into effect in September1995 affecting economic and technology contract arbitration commissions. One of the main elements of thelaw is that People’s Courts are not permitted to try an action in which the parties have an arbitrationagreement or for which an arbitration award has been given, but applications to set aside an award can beheard in certain circumstances.
The National Labour Law came into effect in January 1995 and applies to every business in China. Thepurpose of the law is to set out the basic rights and obligations for both employers and employees as wouldtypically be found in labour law. The implementation of the law will be by state and provincial officials,principally labour bureaux.
TAXATION in China has become more unified. All businesses are liable to pay the Enterprise Income Taxon their profits and individuals pay income tax at rates between 5% and 45% of income. Tax on businessesis levied at the rate of 33% (30% national tax and 3% local tax), but there are concessions:
• joint ventures and WFOEs in special economic zones generally have a tax rate of 15% and, in certainother zones, the tax rate is 24%;
• joint ventures of over 10 years pay no tax in the first two profit making years and, in the third to fifthprofitable years, pay tax at half the national rate;
• special situations, such as investment in ports, have additional tax relief by way of extended periods ofexemption and lower rate taxes;
• joint ventures in special economic zones are allowed to import and export free of customs duties, payingduty only if they pass or sell on their imports into the domestic economy; exceptions (i.e. no duties arepaid) can be found in infrastructure projects where the imported goods are capital goods for use in theproject;
• accelerated depreciation allowances are available to certain joint ventures if approved by the local taxbureau and the Ministry of Finance.
In addition to corporate and personal income tax, there are the Value Added Tax, the Consumption Tax andthe Business Tax, to which all foreign invested and local enterprises have been subject since January 1994.The VAT standard rate is 17% levied on sales, with some mineral products subject to a lower, 13% rate. VATis not due on imports of equipment for processing and assembly operations. Consumption Tax is a purchasetax payable on manufactured goods in China or imports of tobacco, alcohol, cosmetics, jewellery, other“luxury” items and vehicle fuels. Rates vary as would be expected. The tax is generally not payable onexports. The Business Tax is payable by certain classes of business only, mainly in the provision ofcommercial services (including construction, but excluding educational, agricultural, medical and welfareservices). The tax is similar to a turnover tax and the standard rates are 3% and 5% of turnover.
While the outline of the tax law is clear, the details are lacking and therefore there is still some confusionover these new taxes. Interpretations between different tax bureaux vary considerably and are influenced bythe interpretations offered by taxpayers as well as by relationships and the quotas the local bureaux believethey have to collect.
In summary, China has some legal framework but it is constantly changing. There will need to be substantialstrengthening of the legal framework and its administration if China is to continue to receive the foreigncapital it needs for its planned development.
97

PROJECT DEVELOPMENT. Projects requiring central government approval go through three stages:
• project proposal;
• feasibility study;
• contract negotiation.
Theproject proposal must be reasonably well defined technically, and financially. It has to be vetted andapproved by the provincial officials before it is submitted to the relevant ministry in Beijing for scrutiny. Theproposal will also set out the parties, their intended roles, responsibilities and capital inputs. It will includefinancial models and cash flow statements.
Once the project proposal is approved, work begins on thefeasibility study which is the formal documen-tation for submission to the approving authorities. After approval at the provincial and ministerial levels, itis submitted to the State Development Planning Commission and, if over a certain size or in sensitive areas,it will also be submitted to the State Council. The State Development Planning Commission will normallyrefer the matter to the Ministry of Finance in respect of foreign exchange and proposed levels of foreignborrowings.
On approval by the State Development Planning Commission and the relevant Ministry, the projectcontract negotiationsare finalised between the joint venture partners (if there is a joint venture) and therelevant provincial and central government bodies for supply of land, offtake agreements, foreign exchangeand so on. When they are finalised and signed, the new company required for the project can then beregistered.
The stages described are simple in outline but require patience, tact and good negotiation skills at everypoint. The foreign investor is normally advised to select a local partner who knows the local government andcan handle labour procurement. It is equally important for the foreign investor to come to know the localgovernment officials who will review the proposed investment. Selecting the wrong joint venture partnercan delay the process by years.
C. FINANCIAL MECHANISMS
China is still in the process of specifying the rules regulating foreign and domestic private investment. Fiveissues are considered critical in determining the business environment for private investment. These are:
• sectoral policies, to steer investment in particular industrial sectors;
• evolution of stock exchanges;
• role of state owned enterprises (SOEs) and privatisation;
• allowed rate or return on equity; and
• currency convertibility.
In March 1994 the then Ministry of Electric Power issued the “Interim Regulations on the Use of ForeignInvestments in the Electric Power Industry”. China introduced a new Electricity Law effective from 1 April1996, which provides for State sovereignty control and management of the national grid. It does permitforeign majority ownership of power stations in China. The new law establishes separate legal status for
98

power generation enterprises. All new power stations will be built and operated as limited liabilitycompanies.
Chinese stock exchanges are still in their infancy and the Government has a “cautious attitude” towards fullydeveloping these markets.
160. Foreigners may only hold shares with no-voting rights or class-N shares.
As for SOEs and privatisation, a merger and acquisitions market was due to be launched in Shanghai(Business Week 13/3/95), where assets from Shanghai-based public enterprises will be sold to the highestdomestic bidder. Foreigners will not be permitted to invest.
Former Prime Minister Li Peng had been trying to control the returns on projects with foreign participationby introducing a cap on the return on equity since 1992. The return on investment is performance based with12% for less than 62% plant availability (5,500 hours), 15% for availability between 62% and 90%, and22% for higher availabilities as of November 1994. However, China would benefit from a greater relianceon transparent bidding processes, which let market forces establish returns, and less reliance on regulatingrates of return.
In July 1996, China took an important step towards full currency convertibility when it allowed foreigncompanies to buy and sell Rmb, in authorised banks, without first seeking government permission. Thispolicy applies to current account transactions and will enable convertibility for purposes of trade, debtpayment and the repatriation of profits. However, plans for full currency convertibility by the year 2000have now been shelved as a result of the Asian crisis.
CO-FINANCING. Co-financing is the provision by multilateral organisations of direct loans to Govern-ments or State organisations and the simultaneous arrangement of international syndicated loans fromcommercial banks. This funding mechanism is proving attractive as a way of reducing political risk andattracting international commercial banks into providing loans to developing countries.
The Enhanced Co-financing Operation (ECO) facility is a guarantee aimed at protecting commercial lendersfrom political risk, leaving them to bear only the commercial risks of the projects in which they areinvesting.
The ECO program has been applied in China in the case of the 1,200 MW Yangzhou thermal power project,with US$ 300 million as a direct loan from the World Bank and US$ 120 million arranged by the WorldBank through international syndication.
The Asian Development Bank (ADB) has set up its first parallel co-financing agreement to help finance theQitaihe (Heilongjiang Province) thermal energy and environmental improvement project. A consortium ofseven banks including the Japanese Dai-Ichi Kangyo Bank and Mitsubishi Bank, as well as the KoreaDevelopment Bank, will supply the US$ 66 million 16-year parallel co-financing facility arranged by theADB through the People’s Bank of China. The ADB will provide US$ 166 million in preliminary loans.
161.
DOMESTIC STOCKS AND BONDS. With the development of the domestic share and bond markets inChina, there are increasing prospects of raising domestic capital. The market is still dominated by theissuance of equity, in particular Class A-shares, but international operators forecast a rapid catch-up in theissue of bonds.
160. EIR 9/12/1994.161. PiA, 12/6/1996.
99

AES China Generating Co. (AES Chigen), a subsidiary of AES Corp. of Arlington, Va., has six ongoingdevelopments with Chinese State and private companies for coal-fired power plants. In late February 1994AES Chigen issued 10-million Class A common shares raising about US$ 160 million.
FOREIGN STOCKS AND BONDS. International capital markets are also willing to support the issuanceof foreign equity, such as American Depository Receipts (ADR) or Global Depository Receipt (GDR), andforeign bonds.
The China Huaneng Group (CHG) was set up in 1988. It owns the Huaneng Power Generation Corporation(HPGC), a power producer focusing on replacing oil-fired with coal-fired power plants by primarily usingdomestic equipment and funds, and 60% of the Huaneng International Power Development Corporation(HIPDC), with the remaining 40% being owned by other Chinese institutions. HIPDC was established bythe central government to promote financing sources for the development of the electricity generation sectorand uses international financing to develop, build, own, and operate new power plants equipped mainly withimported machinery. By the end of 1992, HIPDC’s installed capacity was about 3.5% of the national total,or 5,800 MW.
Huaneng Power International (HPI) was established in 1994, as part of a restructuring of the HIPDC, todevelop greenfield projects of at least 300 MW with foreign participation. HIPDC still owns 40.23% of HPI,with local Chinese investment companies owning 34.77% and 25% listed on the New York Stock Exchange.It has five operating power plants totalling 2,900 MW, a 600 MW plant under construction and 13 projectstotalling 11,500 MW under development. HPI has financed its projects with export credits from the countryof origin of the power generating equipment used, together with a mix of commercial and Chinesegovernment loans. Its pricing structure allows for full recovery of operating expenses, including debt servicecosts and foreign exchange fluctuations.
Apart from raising foreign funds through equity offerings and debt issues, HPI formed a joint venture at theend of 1994 with Southern Electric Inc. (USA) to develop a 2x 600 MW power plant at Nanjing in JiangsuProvince with total investment estimated to be around US$ 1.1 billion.
162.
Shares of Huaneng Power International (HPI) of Beijing began trading on the New York Stock Exchange inOctober 1994 in the form of American Depository Receipts (ADR). Each ADR is worth 40 HPI’s “class N”shares, which are for foreign investors only, while the company’s “class A” shares can only be owned andtraded by Chinese investors.
The HPI offering followed the offering of 30% of Shandong Huaneng Power Development Corporation(SHPDC) on the New York Stock Exchange and other Exchanges in August 1994 (the remaining shares areowned by three Chinese state-owned companies). Incorporated in June 1994, SHPDC was the first Chinesestate-owned company listed in the USA. SHPDC has three major projects totalling 1,750 MW of capacity inoperation and a further 4,300 MW of capacity under development.
In 1995, the then Ministry of Electric Power created the China Power Investment Corporation (CPIC) toraise capital internationally for power projects via a subsidiary company based in Hong Kong, the ChinaPower International Holdings Ltd (CPIH). CPIH will float public power plant assets, issue corporate bonds,establish power development funds and channel foreign investment for build-operate-transfer power pro-jects.
163.
162. Peregrine Investments Holdings, May 1995.163. International Private Power Quarterly. Fourth Quarter 1998
100

EXPORT CREDIT AGENCIES. One of the major tools available to the sponsors of projects in difficultcountries, especially within the context of the Asian economic crisis, is to borrow funds pursuant to anexport/import bank guarantee. Under EXIM arrangements, the government of a country that exports capitalgoods may offer guarantees of the performance of the buyer country.
164.
The guarantees usually cover foreign exchange convertibility, expropriation risk, war and civil uprising risksand are designed to give exporters, and through them the project sponsors, comfort that the exporter will notend up out of pocket by lending on a project in a country with a difficult political environment.
The guarantees usually conform to an OECD convention, cover up to 85% of the value of exports and havea maximum life of about 15 years.
ECA guarantees can be provided in any of 3 forms:
• export credits;
• import credits; and
• advances.
Under an export credit arrangement, the exporter of the goods lends funds to the project and, pursuant to theEXIM guarantee, is comforted that the performance of the off-taking government will not affect repaymentof the debts.
Under a buyer credit arrangement, the EXIM guarantee of the exporting country would be used to supportthe project borrowing’s from commercial lenders; under these circumstances, the commercial lenders wouldusually accept certain other project risks. Alternatively, the exporting government may agree to advance thenecessary funds; again the issue of project risk comes into play.
D. ORGANISATIONAL STRUCTURES
MULTILATERAL ORGANISATIONS. Multilateral organisations, like the World Bank and the AsiaDevelopment Bank (ADB), participate as minority sponsors in infrastructure development projects, therebyreducing the political risk attached to large scale power projects in developing countries. The involvementof such organisations enhances the attractiveness of many projects to the commercial institutions.
SPECIALISED INVESTMENT FUNDS. Specialised investment funds usually contribute to projectswith small equity positions. The participation of funds which have the International Finance Corporation(IFC) or the ADB among their founders may reduce some of the political risks of the projects.
The Asian Infrastructure Fund (AIF), started in March 1994 with a target capitalisation of US$ 1 billion, hasclosed the first tranche of US$ 500 million. Sponsors are Peregrine Investments Holdings (Hong Kong) andFrank Russell Company (USA), and lead investors are the International Finance Corporation (IFC) and theAsian Development Bank (ADB). The fund will make minority equity investments in infrastructuredevelopment projects in Asia.
164. Reference for further information:“Cleaner Coal Combustion in China: The role of international aid and export credits for energydevelopment and environmental protection, 1988-1997”.Paper prepared by Peter Evans, Centre for International Studies, MIT.
101

The Global Power Investment Company (GPI), started in April 1994 with a target capitalisation of US$ 2.5billion, has closed the first tranche of US$ 450 million. Sponsors are Quantum Industrial Holdings (USA)and GE Capital (USA) with US$ 200 million, and the IFC with US$ 60 million. The fund is aiming at powerutilities as strategic investors. The fund provides a mix of financing, including equity, subordinated debt,completion guarantees and bridge financing to cover the risky construction period for power projects. Oncea project is operating, the “mezzanine” share can be reduced by re-financing with more long-term debt.
STRATEGIC ALLIANCES. Strategic alliances appear to be the preferred organisational structure for IPPsin the Asian region. Investment firms team up with domestic or international engineering and constructioncompanies, fuel suppliers, equipment manufacturers, and firms with experience in operation and manage-ment, like electric utilities.
JOINT VENTURE. Joint venture schemes, with the participation of international and domestic companies,are the usual organisational structure for mixed international-domestic IPP projects. Examples include:
• PSEG Global (formerly Community Energy Alternatives) has a 30% stake in the 600 MW coal-fired20-year BOT plant, which began commercial operation in Gansu Province in November 1997. TheState Development and Investment Corporation holds a 50% stake, the Gansu Electric Power Construc-tion Investment and Development Corporation has 15%, and the Gansu Electric Power Corporation theremaining 5%.
• Siemens AG has a joint venture agreement, through Siemens Power Generation Group Hanfeng GmbH,for a 1,320 MW coal-fired plant at Hanfeng in Hebei Province. Siemens has a 40% stake, with theremainder held by Hebei Electric Power Corporation and North China Power Group, a utility servingHebei and other neighbouring provinces. Commercial operation is scheduled to start in phases, begin-ning in the year 2000, and capacity could eventually be expanded to 2,400 MW.
165.
ROLE OF ELECTRIC UTILITIES. International electric utilities are looking for opportunities in Chinato become involved in international projects. In some cases the utilities act as project sponsors by investingin independent power projects and in other instances seek to become involved in the operation andmanagement activities.
165. International Private Power Quarterly. Fourth Quarter 1998.
102

Annex V
DATA TABLES
Table 1World Coal Reserves (million tonnes)
Country Anthraciteand Bituminous
Sub-Bituminousand Lignite
Total Share ofWorld Total
North America 111864 138528 250392 24.2%
Latin America 5649 4548 10197 1.0%
Europe 59061 97606 156667 15.2%
Former USSR 104000 137000 241000 23.4%
Africa & Middle East 60598 1267 61865 6.0%
China 62200 52300 114500 11.1%
India 68047 1900 69947 6.8%
Indonesia 962 31101 32063 3.1%
Other Asia 1638 2402 4040 0.4%
Australia 45340 45600 90940 8.8%
Total World 519358 512252 1031610 100.0%
Source.: BP Statistical Review of World Energy, June 1998
103

Table 2Coal Production by Province (million tonnes)
1991 1992 1993 1994 1995 1996 .% change1996/91
% of total1996
Shanxi 291.6 296.9 310.2 324.0 347.3 348.8 19.6 25.0
Henan 89.7 90.3 92.8 96.0 103.3 107.8 20.1 7.7
Sichuan 69.0 70.9 79.3 88.0 95.6 96.3 39.4 6.9
Shandong 60.5 63.5 68.0 78.0 88.3 89.5 47.8 6.4
Heilongjiang 85.1 84.0 73.3 77.0 79.4 82.0 -3.7 5.9
Hebei 61.4 62.6 63.8 68.0 81.0 81.7 33.0 5.8
Inner Mongolia 49.2 50.4 42.6 61.0 70.6 73.2 48.6 5.2
Guizhou 37.2 41.6 45.3 51.0 54.7 61.4 65.0 4.4
Liaoning 52.4 54.0 55.7 55.0 56.3 60.4 15.4 4.3
Hunan 33.1 36.0 42.1 49.0 55.7 59.9 80.7 4.3
Anhui 30.8 33.7 36.1 41.0 44.4 50.9 64.9 3.6
Shaanxi 32.9 34.2 33.6 37.0 42.5 46.1 40.2 3.3
Yunnan 21.9 23.8 24.0 26.0 28.0 30.7 40.0 2.2
Xinjiang 21.1 22.0 23.9 26.0 27.2 29.9 41.4 2.1
Jiangsu 24.7 24.6 25.1 25.0 26.5 26.1 5.5 1.9
Jilin 25.6 25.0 24.2 25.0 26.4 26.0 1.6 1.9
Jiangxi 21.2 20.9 21.0 23.0 28.8 24.4 14.8 1.7
Gansu 15.4 15.4 18.0 21.0 24.7 22.2 43.9 1.6
Ningxia 14.0 13.8 13.6 14.0 14.8 16.2 15.2 1.2
Hubei 8.1 8.9 9.9 12.0 15.3 15.2 87.8 1.1
Guangxi 9.9 10.9 12.0 12.0 13.9 12.5 26.1 0.9
Fujian 8.6 9.1 9.8 10.0 11.3 11.7 36.3 0.8
Beijing 10.0 10.2 10.5 10.0 10.0 10.1 1.7 0.7
Guangdong 9.3 9.5 9.5 9.0 10.7 9.6 3.1 0.7
Qinghai 2.9 2.8 2.3 3.0 2.8 3.0 3.5 0.2
Zhejiang 1.4 1.4 1.4 1.0 1.3 1.2 -11.5 0.1
Total 1087.4 1116.4 1148.0 1242.0 1360.7 1396.7 28.4
Source.: China Energy Statistical Yearbook (1991-1996)
104

Table 3Raw Coal Production By Type of Coal
Year Coking Coal Steam Coal Anthracite Lignite Total
1980 308.33 158.53 128.97 24.31 620.15
1981 303.99 163.15 131.11 23.39 621.64
1982 331.14 171.17 139.05 24.97 666.33
1983 347.84 187.93 151.86 26.90 714.53
1984 373.82 215.58 169.72 30.11 789.23
1985 391.09 266.69 182.28 32.22 872.28
1986 415.71 261.56 184.75 32.02 894.04
1987 454.94 247.48 192.34 33.20 927.96
1988 462.72 277.84 202.61 36.70 979.88
1989 499.66 293.73 217.97 42.78 1054.15
1990 512.77 308.76 212.85 45.50 1079.88
1991 518.26 306.86 214.37 44.79 1084.28
1992 527.46 318.86 220.96 47.27 1114.55
1993 539.98 335.52 234.13 41.74 1151.37
1994 572.46 361.43 248.66 46.98 1229.53
1995 607.49 370.86 264.33 49.50 1292.18
1996 622.77 411.13 285.65 54.53 1374.08
Sources.: China Energy Databook. 1996, Ministry of Coal Industry Yearbooks 1995, 1996, 1997Warning.: mismatches in production figures between different sources (differs from table 2, matches tables 4 & 9)
105
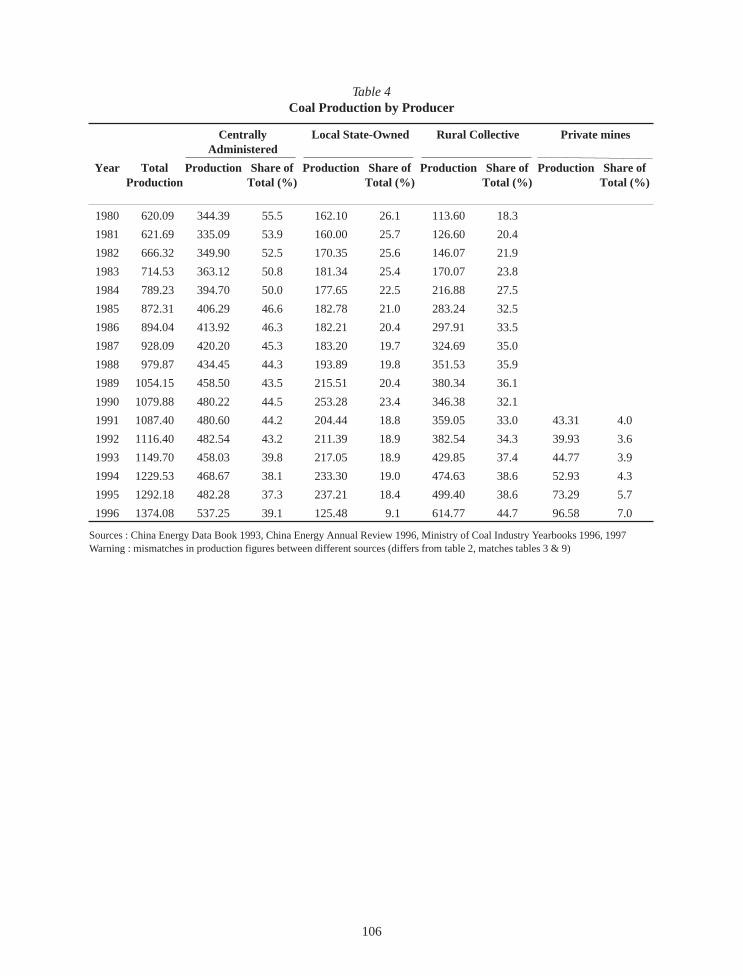
Table 4Coal Production by Producer
CentrallyAdministered
Local State-Owned Rural Collective Private mines
Year TotalProduction
Production Share ofTotal (%)
Production Share ofTotal (%)
Production Share ofTotal (%)
Production Share ofTotal (%)
1980 620.09 344.39 55.5 162.10 26.1 113.60 18.3
1981 621.69 335.09 53.9 160.00 25.7 126.60 20.4
1982 666.32 349.90 52.5 170.35 25.6 146.07 21.9
1983 714.53 363.12 50.8 181.34 25.4 170.07 23.8
1984 789.23 394.70 50.0 177.65 22.5 216.88 27.5
1985 872.31 406.29 46.6 182.78 21.0 283.24 32.5
1986 894.04 413.92 46.3 182.21 20.4 297.91 33.5
1987 928.09 420.20 45.3 183.20 19.7 324.69 35.0
1988 979.87 434.45 44.3 193.89 19.8 351.53 35.9
1989 1054.15 458.50 43.5 215.51 20.4 380.34 36.1
1990 1079.88 480.22 44.5 253.28 23.4 346.38 32.1
1991 1087.40 480.60 44.2 204.44 18.8 359.05 33.0 43.31 4.0
1992 1116.40 482.54 43.2 211.39 18.9 382.54 34.3 39.93 3.6
1993 1149.70 458.03 39.8 217.05 18.9 429.85 37.4 44.77 3.9
1994 1229.53 468.67 38.1 233.30 19.0 474.63 38.6 52.93 4.3
1995 1292.18 482.28 37.3 237.21 18.4 499.40 38.6 73.29 5.7
1996 1374.08 537.25 39.1 125.48 9.1 614.77 44.7 96.58 7.0
Sources.: China Energy Data Book 1993, China Energy Annual Review 1996, Ministry of Coal Industry Yearbooks 1996, 1997Warning.: mismatches in production figures between different sources (differs from table 2, matches tables 3 & 9)
106

Table 5China’s coal exports.: 1985-98 (in million tonnes)
Year Thermal Coking Total
1985 5.27 2.50 7.77
1986 4.13 2.70 6.83
1987 6.25 3.70 9.95
1988 11.45 4.20 15.65
1989 11.64 3.70 15.34
1990 13.28 4.00 17.28
1991 15.80 4.20 20.00
1992 15.96 3.70 19.66
1993 15.15 4.66 19.82
1994 19.89 4.30 24.19
1995 24.06 4.56 28.62
1996 24.40 4.60 29.00
*1997 26.13 4.60 30.73
*1998 32.28
Sources.: IEA statistics; China Energy Statistical Yearbook (1991-1996)* Estimates
Table 6China’s coal imports.: 1985-98 (in million tonnes)
Year Thermal Coking Total
1985 2.11 0.20 2.31
1986 1.44 0.50 1.94
1987 1.42 0.30 1.72
1988 1.64 0.05 1.69
1989 1.79 0.50 2.29
1990 1.10 0.90 2.00
1991 0.77 0.60 1.37
1992 0.83 0.40 1.23
1993 0.90 0.53 1.43
1994 0.99 0.22 1.21
1995 1.28 0.35 1.63
1996 2.50 0.36 3.22
*1997 2.00 0.40 2.40
*1998 1.57
Sources.: IEA statistics; China Energy Statistical Yearbook (1991-1996)* Estimates
107

Table 7China’s Coal Flows (million tonnes)
Year Coalproduction
Coalconsumption
Exports Imports Stock changes
1980 620 626 6 2 10
1981 622 624 7 2 7
1982 666 659 6 2 - 3
1983 715 698 7 2 -13
1984 789 768 7 2 -17
1985 872 828 8 2 -39
1986 894 876 7 2 -13
1987 928 935 10 2 16
1988 980 994 16 2 28
1989 1054 1034 15 2 - 7
1990 1080 1055 17 2 - 9
1991 1087 1088 20 1 19
1992 1116 1106 20 1 8
1993 1151 1154 20 1 21
1994 1240 1232 24 1 15
1995 1361 1335 29 2 1
1996 1397 1372 29 3 9
1997 1348 1306 31 2 -13
*1998 1236 1205 32 2 0
Sources.: IEA statistics; China Energy Statistical Yearbook (1991-1996)* Estimates
Table 8Production statistics for the 14 major opencast coal mines in China
No Name of mine Annual output ofcoal (MT)
Annual Volumeof overburden
(Million metres3)
Stripping ratio(m3/tonne)
Labour productivity(tonnes perman shift)
1 Antaibo 10.00 49.15 4.91 14.60
2 Haizhou 5.74 11.86 2.07
3 Fushun 3.45 15.20 4.40 3.98
4 Huolinhe 3.40 8.67 2.60 11.20
5 Pingzhuang 1.52 12.00 7.89 1.61
6 Lingquan 1.32 9.24 6.98 1.14
7 Yimin 1.30 2.21 1.70 8.10
8 Hami 1.29 7.48 5.79 2.20
9 Hegong 1.17 8.10 6.93 2.44
10 Yima 1.00 2.65 2.65 3.49
11 Xinqui 0.61 10.15 16.60
12 Gongwusu 0.56 2.92 5.23 1.86
13 Dafong 0.52 1.66 3.21 2.68
14 Jiaoping 0.33 2.18 6.54 1.12
108

Table 9Raw Coal Production by Types - 1994-1996 (in million tonnes)
1994Production
Share% 1995Production
Share% 1996Production
Share%
Anthracite 248.7 20.2 264.3 20.5 285.7 20.8
Bituminous Coal 933,9 76.0 978.4 75.7 1033.9 75.2
Of which:
Bituminous used for coking
– Lean/Poor 16.4 1.3 20.9 1.6 15.1 1.1
– Lean 45.3 3.7 51.6 4.0 53.3 3.9
– Coking 108.6 8.8 111.2 8.6 118.6 8.6
– Fat 86.2 7.0 78.7 6.1 82.0 6.0
– 1/3 Coking 82.0 6.7 89.1 6.9 100.3 7.3
– Gas/Fat 52.5 4.3 58.9 4.6 65.9 4.8
– Gas 120.7 9.8 131.9 10.2 116.7 8.5
– Others 60.9 5.0 65.3 5.0 70.9 5.2
General Bituminous
– 1/2 Medium Caking 58.8 4.8 64.2 5.0 63.5 4.6
– Soft Caking 82.7 6.7 83.1 6.4 87.2 6.3
– Non-Coking 15.1 1.2 19.0 1.5 17.7 1.3
– Long-flame 91.8 7.5 92.6 7.2 112.7 8.2
– Others 113.0 9.2 112.0 8.7 130.1 9.5
Brown Coal 47.0 3.8 49.5 3.8 54.5 4.0
Total 1229.5 1292.2 1374.1
Source.: China Coal Industry Yearbooks 1996, 1997Warning.: mismatches in production figures between different sources (differs from table 2, matches tables 3 & 4)
109
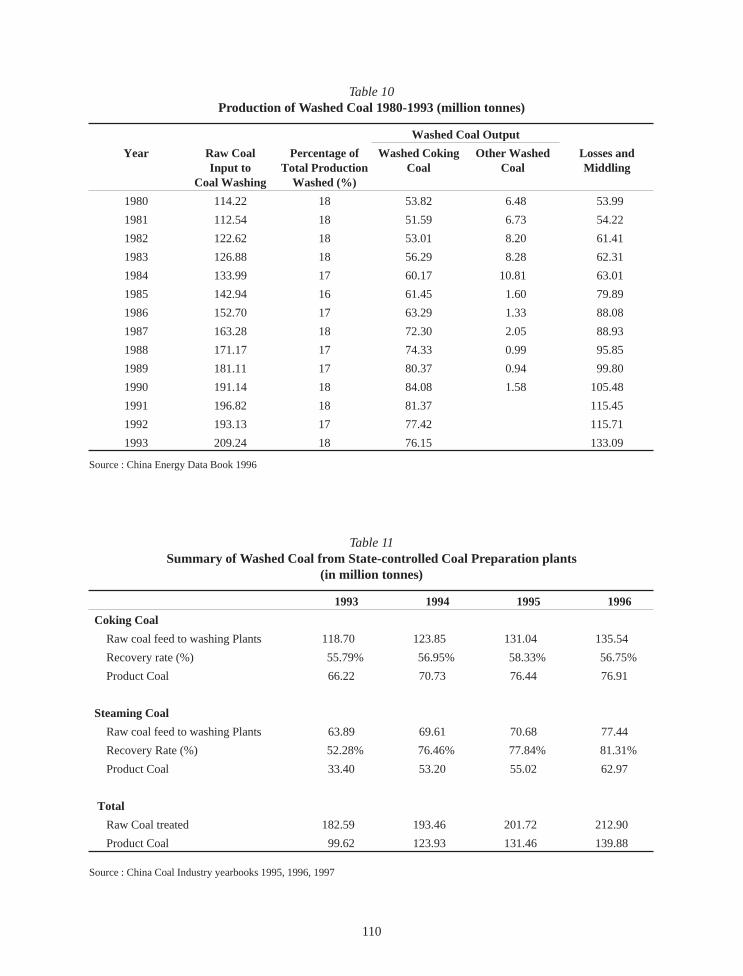
Table 10Production of Washed Coal 1980-1993 (million tonnes)
Washed Coal Output
Year Raw CoalInput to
Coal Washing
Percentage ofTotal Production
Washed (%)
Washed CokingCoal
Other WashedCoal
Losses andMiddling
1980 114.22 18 53.82 6.48 53.99
1981 112.54 18 51.59 6.73 54.22
1982 122.62 18 53.01 8.20 61.41
1983 126.88 18 56.29 8.28 62.31
1984 133.99 17 60.17 10.81 63.01
1985 142.94 16 61.45 1.60 79.89
1986 152.70 17 63.29 1.33 88.08
1987 163.28 18 72.30 2.05 88.93
1988 171.17 17 74.33 0.99 95.85
1989 181.11 17 80.37 0.94 99.80
1990 191.14 18 84.08 1.58 105.48
1991 196.82 18 81.37 115.45
1992 193.13 17 77.42 115.71
1993 209.24 18 76.15 133.09
Source.: China Energy Data Book 1996
Table 11Summary of Washed Coal from State-controlled Coal Preparation plants
(in million tonnes)
1993 1994 1995 1996
Coking Coal
Raw coal feed to washing Plants 118.70 123.85 131.04 135.54
Recovery rate (%) 55.79% 56.95% 58.33% 56.75%
Product Coal 66.22 70.73 76.44 76.91
Steaming Coal
Raw coal feed to washing Plants 63.89 69.61 70.68 77.44
Recovery Rate (%) 52.28% 76.46% 77.84% 81.31%
Product Coal 33.40 53.20 55.02 62.97
Total
Raw Coal treated 182.59 193.46 201.72 212.90
Product Coal 99.62 123.93 131.46 139.88
Source.: China Coal Industry yearbooks 1995, 1996, 1997
110

Table 12China’s Freight Transport by Type, 1980-1996
Railway Highway Waterway Pipeline Civil Aviation TotalFreight transport (m tonnes)
1980 1,113 3,820 427 105 0.09 5,465
1985 1,307 5,381 633 137 0.20 7,458
1990 1,507 7,240 801 158 0.37 9,706
1992 1,576 7,809 925 148 0.58 10,459
1993 1,627 8,403 979 148 0.69 11,157
1994 1,631 8,949 1,071 151 0.83 11,803
1995 1,659 9,404 1,132 153 1.01 12,348
1996 1,688 9,839 1,274 160 1.15 12,962
Share of freight transport (%)
1980 20.4 69.9 7.8 1.9 0.002 100
1985 17.5 72.2 8.5 1.8 0.003 100
1990 15.5 74.6 8.3 1.6 0.004 100
1992 15.1 74.7 8.8 1.4 0.006 100
1993 14.6 75.3 8.8 1.3 0.006 100
1994 13.8 75.8 9.1 1.3 0.007 100
1995 13.4 76.2 9.2 1.2 0.008 100
1996 13.0 75.9 9.8 1.2 0.009 100
Volume of freight (bn tonne-km)
1980 572 76 505 49 0.14 1,203
1985 813 169 770 60 0.42 1,813
1990 1,062 336 1,159 63 0.82 2,621
1992 1,158 376 1,326 62 1.34 2,922
1993 1,196 407 1,386 61 1.66 3,051
1994 1,246 449 1,569 61 1.86 3,326
1995 1,287 470 1,755 59 2.23 3,573
1996 1,297 501 1,786 59 2.49 3,645
Source.: China Statistical Yearbook. 1997 and Li, Binsheng, July 1994, “China’s Coal Sector”, unpublished manuscript, East-WestCenter, Coal Project, Honolulu, Hawaii, 27 p.
111

Table 13Transportation Demand in China.: By Weight-Distance
1980 1985 1990 1993 1994 1995 1996
Freight Traffic(Billion tonne-km)
1202.6 1812.6 2620.8 3051.0 3326.1 3573.0 3645.4
Railway 571.7 812.6 1062.2 1195.5 1245.8 1287.0 1297.1
Highway 76.4 169.3 335.8 407.1 448.6 469.5 501.1
Waterway, of which 505.3 770.0 1159.2 1386.1 1568.7 1755.2 1786.3
– Domestic waterway 152.1 237.1 345.1 472.7 n.a. n.a. n.a.
– Ocean shipping 353.2 532.9 814.1 913.4 n.a. n.a. n.a.
Pipeline 49.1 60.3 62.7 60.8 61.2 59.0 58.5
Civil aviation 0.1 0.4 0.8 1.7 1.9 2.2 2.5
Passenger Traffic(billion person-km) 228.1 443.6 562.8 785.8 859.1 900.2 914.3
Railway 138.3 241.6 261.3 348.3 363.6 354.6 332.5
Highway 73.0 172.5 262.0 370.1 422.0 460.3 490.9
Waterway 12.9 17.9 16.5 19.6 18.4 17.2 16.1
Civil aviation 4.0 11.7 23.0 47.8 55.2 68.1 74.8
n.a. not availableSources.: China Statistical Yearbook. 1997 and Peregrine, China Infrastructure.: Making Connections, May 1994
112

Table 14Comparison of average efficiencies for electricity generation.: China Vs Japan
China
Generation Generation& Auxiliary
Transmission Distribution Total
% % % % %
1987 30.9 28.4 91.5 93.3 24.2
1988 30.9 28.5 91.8 93.3 24.4
1989 30.9 28.5 91.8 93.2 24.4
1990 31.3 28.7 91.9 93.1 24.6
1991 31.5 28.9 91.8 93.1 24.7
1992 31.8 29.3 91.7 93.0 25.0
Japan
Generation Generation& Auxiliary
Transmission Distribution Total
% % % % %
1987 38.5 36.7 94.0 96.3 33.2
1988 38.6 36.9 94.3 96.4 33.5
1989 38.8 37.1 94.4 96.3 33.7
1990 38.8 37.1 94.3 96.4 33.7
1991 38.8 37.1 94.2 96.3 33.7
1992 38.8 37.1 94.2 96.3 33.7
113