co-digestion of cultivated microalgae and sewage sludge from municipal waste water treatment
TRANSCRIPT
Bioresource Technology 171 (2014) 203–210
Contents lists available at ScienceDirect
Bioresource Technology
journal homepage: www.elsevier .com/locate /bior tech
Co-digestion of cultivated microalgae and sewage sludge from municipalwaste water treatment
http://dx.doi.org/10.1016/j.biortech.2014.08.0690960-8524/� 2014 Published by Elsevier Ltd.
⇑ Corresponding author. Tel.: +46 21 10 70 35; fax: +46 21 10 14 80.E-mail address: [email protected] (J. Olsson).
Jesper Olsson a,⇑, Xin Mei Feng b, Johnny Ascue b, Francesco G. Gentili c, M.A. Shabiimam d,Emma Nehrenheim a, Eva Thorin a
a The School of Business, Society and Engineering, Mälardalen University, Box 883, SE-721 23 Västerås, Swedenb JTI – Swedish Institute of Agricultural and Environmental Engineering, Box 7033, SE-750 07 Uppsala, Swedenc Department of Wildlife, Fish and Environmental Studies, Swedish University of Agricultural Sciences, SE-901 83 Umeå, Swedend Centre for Environmental Science and Engineering, Indian Institute of Technology Bombay, Powai, Mumbai 400 076, India
h i g h l i g h t s
�Microalgae were co-digested with asewage sludge mixture in batchstudies.� Highest CH4-yield, of
408 ± 16 Ncm3 g VS�1 was reached in37 �C with 37% microalgae.� In 55 �C the same increase in methane
yield with microalgae added couldnot be seen.� The microalgae seems to be easily
degraded with a short lag phase in thebatches.
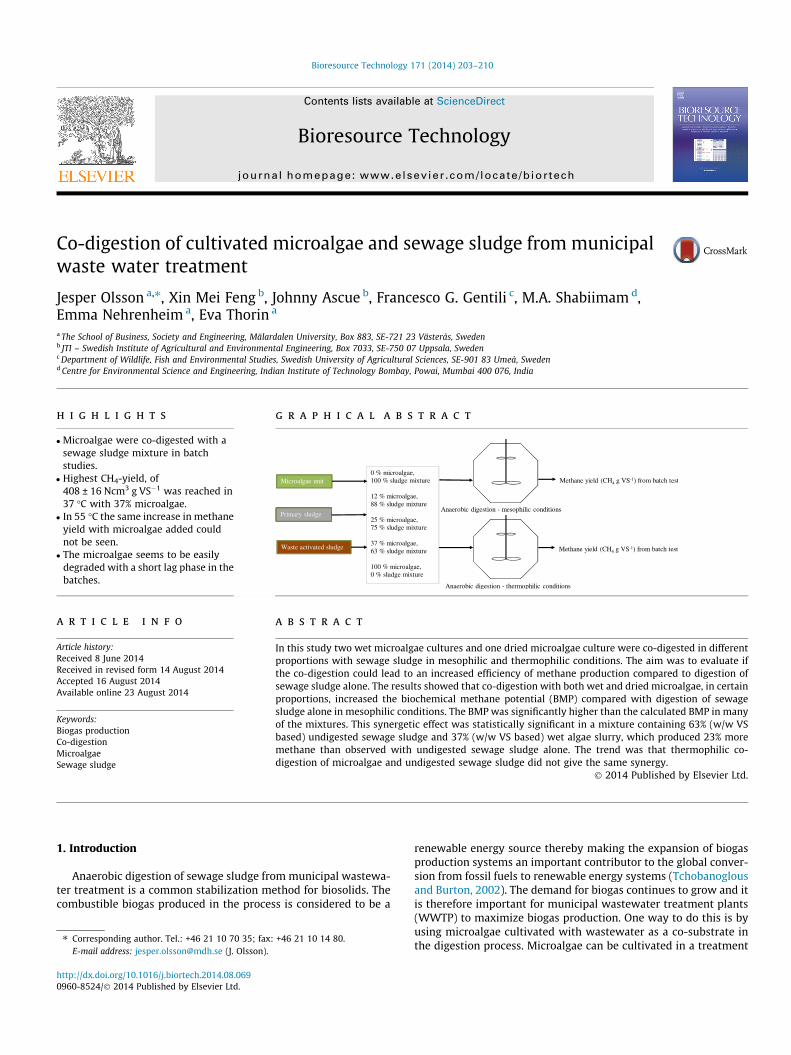
g r a p h i c a l a b s t r a c t
Methane yield (CH4 g VS-1) from batch test
Methane yield (CH4 g VS-1) from batch test
Microalgae unit
Waste activated sludge
Primary sludge
0 % microalgae, 100 % sludge mixture
12 % microalgae,88 % sludge mixture
25 % microalgae,75 % sludge mixture
37 % microalgae,63 % sludge mixture
100 % microalgae, 0 % sludge mixture
Anaerobic digestion - mesophilic conditions
Anaerobic digestion - thermophilic conditions
a r t i c l e i n f o
Article history:Received 8 June 2014Received in revised form 14 August 2014Accepted 16 August 2014Available online 23 August 2014
Keywords:Biogas productionCo-digestionMicroalgaeSewage sludge
a b s t r a c t
In this study two wet microalgae cultures and one dried microalgae culture were co-digested in differentproportions with sewage sludge in mesophilic and thermophilic conditions. The aim was to evaluate ifthe co-digestion could lead to an increased efficiency of methane production compared to digestion ofsewage sludge alone. The results showed that co-digestion with both wet and dried microalgae, in certainproportions, increased the biochemical methane potential (BMP) compared with digestion of sewagesludge alone in mesophilic conditions. The BMP was significantly higher than the calculated BMP in manyof the mixtures. This synergetic effect was statistically significant in a mixture containing 63% (w/w VSbased) undigested sewage sludge and 37% (w/w VS based) wet algae slurry, which produced 23% moremethane than observed with undigested sewage sludge alone. The trend was that thermophilic co-digestion of microalgae and undigested sewage sludge did not give the same synergy.
� 2014 Published by Elsevier Ltd.
1. Introduction
Anaerobic digestion of sewage sludge from municipal wastewa-ter treatment is a common stabilization method for biosolids. Thecombustible biogas produced in the process is considered to be a
renewable energy source thereby making the expansion of biogasproduction systems an important contributor to the global conver-sion from fossil fuels to renewable energy systems (Tchobanoglousand Burton, 2002). The demand for biogas continues to grow and itis therefore important for municipal wastewater treatment plants(WWTP) to maximize biogas production. One way to do this is byusing microalgae cultivated with wastewater as a co-substrate inthe digestion process. Microalgae can be cultivated in a treatment

204 J. Olsson et al. / Bioresource Technology 171 (2014) 203–210
step in photo bioreactors or microalgae ponds in the final polishingwastewater treatment in the WWTP (Larsdotter, 2006) or as atreatment for nutrient rich side streams like reject water fromsludge dewatering (Ficara et al., 2014; Rusten and Sahu, 2011).Simultaneous nutrient recovery, water treatment and biomassproduction are thus possible. Successful cultivation of microalgaein wastewater has been demonstrated in recent studies (Odlareet al., 2011; Su et al., 2011).
Rusten and Sahu (2011), Ficara et al. (2014) and Ma et al. (2014)have evaluated the process of cultivation of microalgae from rejectwater, and have found that microalgae remove nitrogen andphosphorous from the reject water, consequently reducing theimpact of returning side streams to the main stream of the treat-ment plant. Microalgae have also been used to successfully reducenutrients in nutrient rich digested piggery wastewater (Wanget al., 2013a).
According to Wang et al. (2013b), waste activated sludge (WAS)can be a suitable co-substrate with microalgae. Co-digesting a mic-roalgae mix containing Chlorella sp. with varying amounts of wasteactivated sludge (WAS), 59–96% in mass of VS-content, the biogasyield is improved which is 73–79% larger than the gas yield frompure algae digestion sets. Krustok et al. (2013) have shown in ananaerobic batch experiment with municipal food waste andharvested microalgae cultivated in lake water that the biogas pro-duction is improved after addition of microalgae. The experimenthas been carried out with fermentation bottles where 0%, 12%,25% and 37% of the food waste is replaced with harvested microal-gae. During the first 25 days of fermentation the replacement of12% food waste with microalgae has given the highest biogasproduction rate. A possible explanation for the synergetic effectof co-digesting microalgae with other substrates is an optimizationof the C/N-ratio. Since anaerobic digestion is inhibited when usingmicroalgae alone as a substrate due to the high protein content inthe algae biomass (Brune et al., 2009; Wiley et al., 2011) other car-bon rich substrates can enhance the C/N-ratio. The use of co-diges-tion of substrates to stabilize the digestion process by improvingthe C/N-ratio has been suggested by several authors (Brune et al.,2009; Khalid et al., 2011; Mata-Alvarez et al., 2011). Yen andBrune (2007) have reported increased gas yields from co-digestionof microalgae with waste paper from recycling bins by adjustingthe low C/N-ratio in microalgae. The results have shown that anoptimum C/N-ratio for co-digestion of algal sludge and wastepaperis in the range of 20/1–25/1. The anaerobic co-digestion betweencorn silage and the marine microalga Nannochloropsis salina havealso shown a better process stability and enhanced biogas yieldsby microalgae addition (Schwede et al., 2013). This positive influ-ence in co-digestion according to Schwede et al. (2013) can beexplained by an optimized C/N-ratio but also enhanced alkalinityand addition of important trace elements for the digestion. Theenhanced alkalinity that microalgae bring to the co-digestion hasalso been mentioned by Formagini et al. (2014). In this study vin-asse from ethanol production was co-digested with microalgae.The alkalinity of the algae suspension is higher but not enoughto keep the pH –level stabilized to a neutral level together withthe vinasse (Formagini et al., 2014).
Although there have been recent development in the field ofco-digestion of microalgae with other substrates, there is still alack of knowledge regarding co-digestion of microalgae with a rep-resentative mix of sewage sludge for a municipal WWTP in boththermophilic- and mesophilic conditions. This would be importantknowledge for further studies and development of systems forusing microalgae as a co-substrate together with traditional waste-water treatment and anaerobic digestion in full scale applications.Earlier studies in the area of co-digestion between sewage sludgeand microalgae have only focused on co-digesting the microalgaeand the biological waste activated sludge (WAS). However, the
experiments have only been made in mesophilic conditions(Ficara et al., 2014; Wang et al., 2013b).
This study was designed to investigate cultivation of indigenousmicroalgae from a nearby lake and in municipal wastewater andusing it as a co-substrate in anaerobic digestion with undigestedsewage sludge in various proportions. The methane potentials ofthe different mixtures were evaluated in anaerobic batch tests inmesophilic and thermophilic conditions. The aim of the studywas to investigate whether co-digestion of microalgae and sewagesludge were more efficient for biogas production than digestion ofthe sewage sludge alone.
2. Methods
2.1. Substrates and inocula
To get a broad approach in the study three different microalgaecultures were used as a co-substrate to the undigested sewagesludge. The inoculums used in the BMP-experiments were all takenfrom digesters at waste water treatment plants so that the microculture were already adapted to the undigested sewage sludge.
2.1.1. Microalgae A – wetMicroalgae A were cultivated in a water sample from Lake
Mälaren taken in mid-June 2012. Cultivation began on the day ofthe water sampling, without any prior preservation or storage step.Batch cultivation was set up in two 120 dm3 glass aquariums eachcontaining 10.5 dm3 lake water and 21.5 dm3 tap water. A modi-fied version of the nutrient mix Jaworski’s medium (3.5 dm3) asdescribed by Odlare et al. (2011) was added to each aquarium inorder to ensure sufficient growth of microalgae. The aquariumswere placed in a room with constant light. Light intensity at thebeginning of the cultivation period was measured at 7000 lux(100 lmol photons m�2 s�1). The microalgae culture were allstored at 2 �C until the start of the anaerobic batch tests.
2.1.2. Microalgae B – wetMicroalgae B were cultivated in a water sample taken in mid-
December 2012 at the same place in Lake Mälaren. The batch cul-tivation setup was the same as for microalgae A.
2.1.3. Microalgae C – dryA third microalgae culture was cultivated in municipal waste-
water in a photo bioreactor placed on the roof of the power plantin Umeå, northern Sweden (63�52). This culture was a mixture ofnatural green freshwater algal species and was grown in a650 dm3 open natural light photo bioreactor for 5 days in August2012. The photo bioreactor was constructed following the openponds principle, and water flow was generated by a mechanicaldevice (paddles). A metal supporting structure held the photo bio-reactor above the roof surface. The reactor was made from thinfiberglass in order to allow light penetration on all surfaces. Themunicipal wastewater influent was collected at the local wastewa-ter treatment plant (Umeva, Umeå) and transported once a week tothe power plant station. A 1 m3 tank was used for transportationand for partial settling of the influent (Axelsson and Gentili, 2014).
Treated flue gases from the local combined heat and powerplant (Umeå Energi, Umeå), which burns municipal and partlyindustrial solid wastes were pumped from the smokestack andbubbled into the algae culture through a ceramic tubular gas dif-fuser (Cole-Parmer, USA) at approximately 3 dm3/min. The bub-bling was stopped at night. The length of the night varied from4 h 45 min in the beginning of August to 8 h 40 min at the end ofthe same month (Axelsson and Gentili, 2014).
J. Olsson et al. / Bioresource Technology 171 (2014) 203–210 205
2.1.4. Undigested sewage sludgeThe substrate to be co-digested with the microalgae in the
anaerobic batch tests were undigested sewage sludge collectedfrom the municipal WWTP in Västerås, central Sweden. The pro-cess configuration at the WWTP consists of:
1. Mechanical treatment with screens, sand grit and pre-sedimentation
2. Biological treatment with an activated sludge process. In thebiological treatment a poly-electrolyte is also added betweenthe aeration and the sedimentation to lower the amount of out-going phosphorous.
The undigested sewage sludge was a representative mixture ofprimary sludge from the pre-sedimentation and a poly-electrolytetreated waste activated sludge from the biological treatment. Thesludge sample was taken directly after the gravimetric thickeningstep of the mixed sludge and transported in 25 dm3 containers. Itwas then stored at +2 �C prior to the experiments. Undigested sew-age sludge D was taken in mid-June 2012 and undigested sewagesludge E was taken in mid-December 2012, prior to the respectiveexperiment.
2.1.5. Inocula for anaerobic digestionThe different inocula used in the experiments were:F – Mesophilic digester at the municipal WWTP in Västerås
from 2012.G – Mesophilic digester at the municipal WWTP in Västerås
from 2013.H – Thermophilic pilot digester at the municipal WWTP in Upp-
sala from 2013.In order to ensure degradation of the remaining easily degrad-
able organic matter and to remove dissolved methane, the inoculawere stored with an anaerobic headspace for 10 days prior to thestart of each experiment. Mesophilic inoculum were incubated at37 �C and the thermophilic inoculum was incubated at 55 �Caccording to the method described by Angelidaki et al. (2009).
Anaerobic digestion batch tests using a substrate with knowntheoretical methane potential were used to evaluate the activityof the inocula. In this study cellulose were used with a theoreticalmethane potential of 415 Ncm3/g VS. Inocula are not suitable touse if the yield is less than 70% of the substrate’s theoretical poten-tial. This value is based on the combined experience of the refer-ence group and authors in the unique study of Carlsson andSchnürer (2011).
2.1.6. TS- and VS-content in the substrates and inoculaThe content of total solids (TS) and volatile solids (VS) in the
microalgae slurries, the undigested sewage sludge and the inoculawere determined using standard techniques (APHA, 1995).
2.2. Anaerobic batch test
Anaerobic batch experiments were conducted to determine themethane potential of different mixtures of microalgae cultures andundigested sewage sludge according to the protocol described byDererie et al. (2011) with substrate:inoculum ratio 1:2 based onVS. The mesophilic experiment (37 �C) with microalgae A andundigested sewage sludge was performed in 1 dm3 conical flasks.Flasks were filled with substrate equivalent to 2.1 g VS (at3 g VS dm�3 loading rate) and inoculum F equivalent to 4.2 g VS(6 g VS dm�3) and the total volume was made up to 0.7 dm3 withtap water. For the thermophilic experiment (55 �C) with microal-gae A anaerobic digestion was performed in 0.1 dm3 conicalbottles. Substrate equivalent to 0.21 g VS (corresponding to3 g dm�3) and inoculum F equivalent to 0.42 g VS (corresponding
to 6 g dm�3) were added to flasks and the volume was made upto 0.07 dm3 with tap water. For the mesophilic and thermophilicexperiment with microalgae B and C 0.5 dm3 conical flasks wereused. In this case the working volume in each flask was0.398 dm3, the added substrate was equivalent to 1.4 g VS(3.5 g VS dm�3) and added inoculum G and H was equivalent to2.8 g VS (7.0 g VS dm�3), respectively. Different substrate mixtureswere prepared for both the mesophilic and the thermophilic exper-iments by replacing undigested sludge with the cultivated microal-gae. The algae concentrations were chosen based on the previousstudy made by Krustok et al. (2013). All substrate mixtures andblanks (inoculum only) were run in triplicate and incubated on arotary shaker at 130 rpm (model: Orbital shaker 4535/4536) for35 days incubations time in the experiments with microalgae Aand for 57 days incubation time in the experiments with microal-gae B and C. All the substrate mixtures are presented in Table 1.
2.3. Analytical procedure
Gas production was determined by measuring pressure in theflasks using a pressure gauge (model: GMH 3111) equipped witha pressure sensor (GMSD 2BR, �1000 to 2000 mbar), while a gassample was taken for methane content analysis. Pressure was nor-malized to take into account the volume of gas under standardconditions (Ncm3) i.e. at atmospheric pressure and at 0 �C. Thefrequency of pressure measurements and sampling depended onthe biogas production rate. Methane content was analyzed by gaschromatography (PerkinElmer Arnel Clarus 500; column: 7’’HayeSep N 60/80, 1/8’’ SF; FID Detector 250 �C, carrier gas: helium,flow 31 cm3/min, injector temperature: 60 �C; injection usingHeadspace sampler Turbo Matrix 110). Methane production wasestimated based on the total biogas pressure, the gas volume,methane content and the gas temperature. The estimated methaneproduction from the inoculum was subtracted from the total meth-ane production. Methane production was calculated relative to theamount of VS added to each bottle under standard conditions(Ncm3).
The calculated BMP were determined by combining the mea-sured BMP-results from the anaerobic batch test on pure algaeand on pure sewage sludge (mix. no. 9, 13, 17, 19, 23 and 27)(see Table 1).
Confidence intervals (p = 0.05) were calculated using MicrosoftExcel to indicate statistically significant differences betweentreatments.
2.4. Estimation of the theoretical BMP
The composition of a substrate influences the biogas productionand the methane content of the biogas. The important parametersof the substrate are TS, VS and the nutrient composition.
The organic fraction of the substrate can be divided into lipids,carbohydrates and protein. Approximate methane yield for lipidsare 1.0 m3 kg VS�1, for proteins 0.53 m3 kg VS�1 and for carbohy-drates 0.38 m3 kg VS�1 (Carlsson and Schnürer, 2011).
In order to estimate the theoretical methane potential of themicroalgae and the sewage sludge, the substrates were analyzedfor lipids, protein and carbohydrates. The amount of lipids wasdetermined by SBR analysis (Schmid-Bondzynski-Ratslaff) accord-ing to standard method No. 131 from the Nordic Committee ofFood Analysis (NMKL, 1989). The Kjeldahl method for nitrogenanalysis was used to determine the protein content. The nitrogencontent was multiplied by 6.25, which is the conversion factorfor protein in food samples (Salo-väänänen and Koivistoinen,1996). Ammonium content was determined using a standard tech-nique (APHA, 1995). Carbohydrates could then be calculatedaccording to Eq. (1).
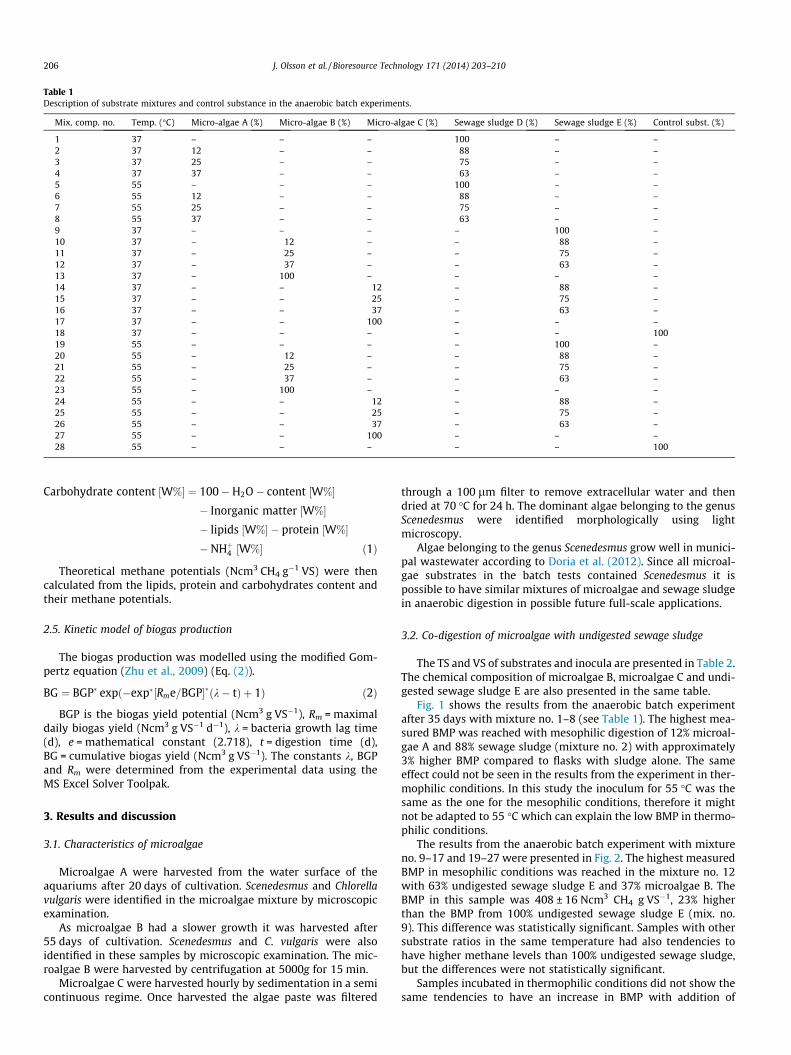
Table 1Description of substrate mixtures and control substance in the anaerobic batch experiments.
Mix. comp. no. Temp. (�C) Micro-algae A (%) Micro-algae B (%) Micro-algae C (%) Sewage sludge D (%) Sewage sludge E (%) Control subst. (%)
1 37 – – – 100 – –2 37 12 – – 88 – –3 37 25 – – 75 – –4 37 37 – – 63 – –5 55 – – – 100 – –6 55 12 – – 88 – –7 55 25 – – 75 – –8 55 37 – – 63 – –9 37 – – – – 100 –10 37 – 12 – – 88 –11 37 – 25 – – 75 –12 37 – 37 – – 63 –13 37 – 100 – – – –14 37 – – 12 – 88 –15 37 – – 25 – 75 –16 37 – – 37 – 63 –17 37 – – 100 – – –18 37 – – – – – 10019 55 – – – – 100 –20 55 – 12 – – 88 –21 55 – 25 – – 75 –22 55 – 37 – – 63 –23 55 – 100 – – – –24 55 – – 12 – 88 –25 55 – – 25 – 75 –26 55 – – 37 – 63 –27 55 – – 100 – – –28 55 – – – – – 100
206 J. Olsson et al. / Bioresource Technology 171 (2014) 203–210
Carbohydrate content ½W%� ¼ 100�H2O� content ½W%�� Inorganic matter ½W%�� lipids ½W%� � protein ½W%�� NHþ4 ½W%� ð1Þ
Theoretical methane potentials (Ncm3 CH4 g�1 VS) were thencalculated from the lipids, protein and carbohydrates content andtheir methane potentials.
2.5. Kinetic model of biogas production
The biogas production was modelled using the modified Gom-pertz equation (Zhu et al., 2009) (Eq. (2)).
BG ¼ BGP� expð�exp�½Rme=BGP��ðk� tÞ þ 1Þ ð2Þ
BGP is the biogas yield potential (Ncm3 g VS�1), Rm = maximaldaily biogas yield (Ncm3 g VS�1 d�1), k = bacteria growth lag time(d), e = mathematical constant (2.718), t = digestion time (d),BG = cumulative biogas yield (Ncm3 g VS�1). The constants k, BGPand Rm were determined from the experimental data using theMS Excel Solver Toolpak.
3. Results and discussion
3.1. Characteristics of microalgae
Microalgae A were harvested from the water surface of theaquariums after 20 days of cultivation. Scenedesmus and Chlorellavulgaris were identified in the microalgae mixture by microscopicexamination.
As microalgae B had a slower growth it was harvested after55 days of cultivation. Scenedesmus and C. vulgaris were alsoidentified in these samples by microscopic examination. The mic-roalgae B were harvested by centrifugation at 5000g for 15 min.
Microalgae C were harvested hourly by sedimentation in a semicontinuous regime. Once harvested the algae paste was filtered
through a 100 lm filter to remove extracellular water and thendried at 70 �C for 24 h. The dominant algae belonging to the genusScenedesmus were identified morphologically using lightmicroscopy.
Algae belonging to the genus Scenedesmus grow well in munici-pal wastewater according to Doria et al. (2012). Since all microal-gae substrates in the batch tests contained Scenedesmus it ispossible to have similar mixtures of microalgae and sewage sludgein anaerobic digestion in possible future full-scale applications.
3.2. Co-digestion of microalgae with undigested sewage sludge
The TS and VS of substrates and inocula are presented in Table 2.The chemical composition of microalgae B, microalgae C and undi-gested sewage sludge E are also presented in the same table.
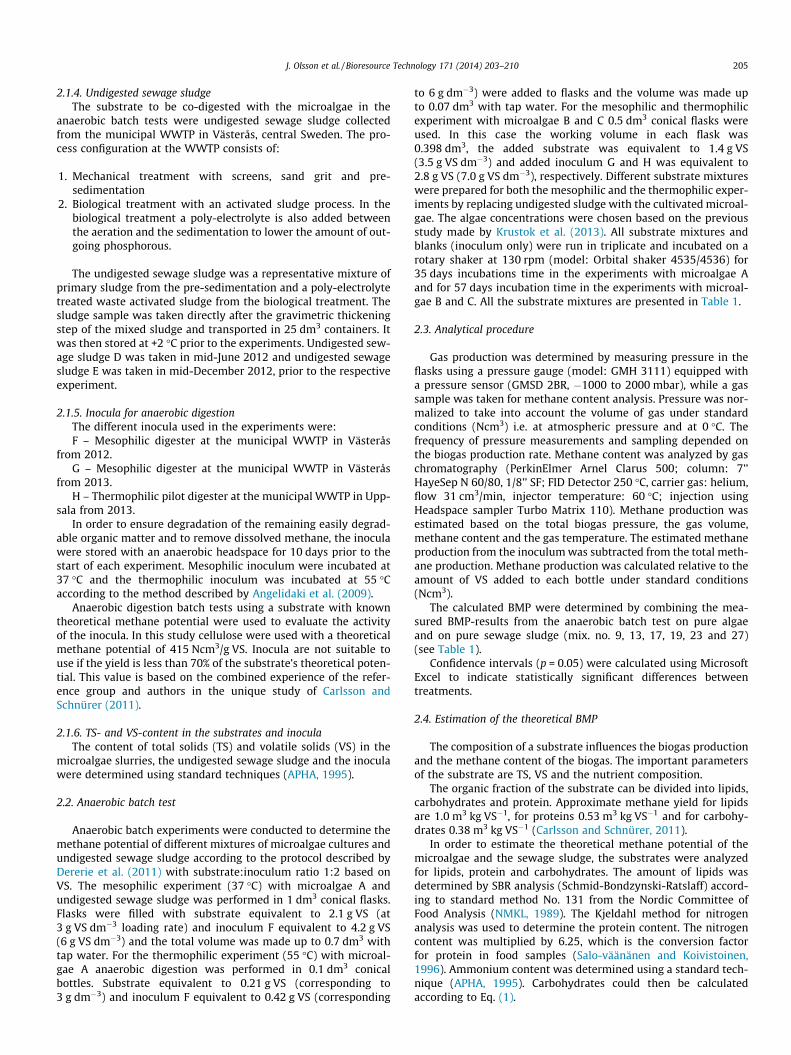
Fig. 1 shows the results from the anaerobic batch experimentafter 35 days with mixture no. 1–8 (see Table 1). The highest mea-sured BMP was reached with mesophilic digestion of 12% microal-gae A and 88% sewage sludge (mixture no. 2) with approximately3% higher BMP compared to flasks with sludge alone. The sameeffect could not be seen in the results from the experiment in ther-mophilic conditions. In this study the inoculum for 55 �C was thesame as the one for the mesophilic conditions, therefore it mightnot be adapted to 55 �C which can explain the low BMP in thermo-philic conditions.
The results from the anaerobic batch experiment with mixtureno. 9–17 and 19–27 were presented in Fig. 2. The highest measuredBMP in mesophilic conditions was reached in the mixture no. 12with 63% undigested sewage sludge E and 37% microalgae B. TheBMP in this sample was 408 ± 16 Ncm3 CH4 g VS�1, 23% higherthan the BMP from 100% undigested sewage sludge E (mix. no.9). This difference was statistically significant. Samples with othersubstrate ratios in the same temperature had also tendencies tohave higher methane levels than 100% undigested sewage sludge,but the differences were not statistically significant.
Samples incubated in thermophilic conditions did not show thesame tendencies to have an increase in BMP with addition of
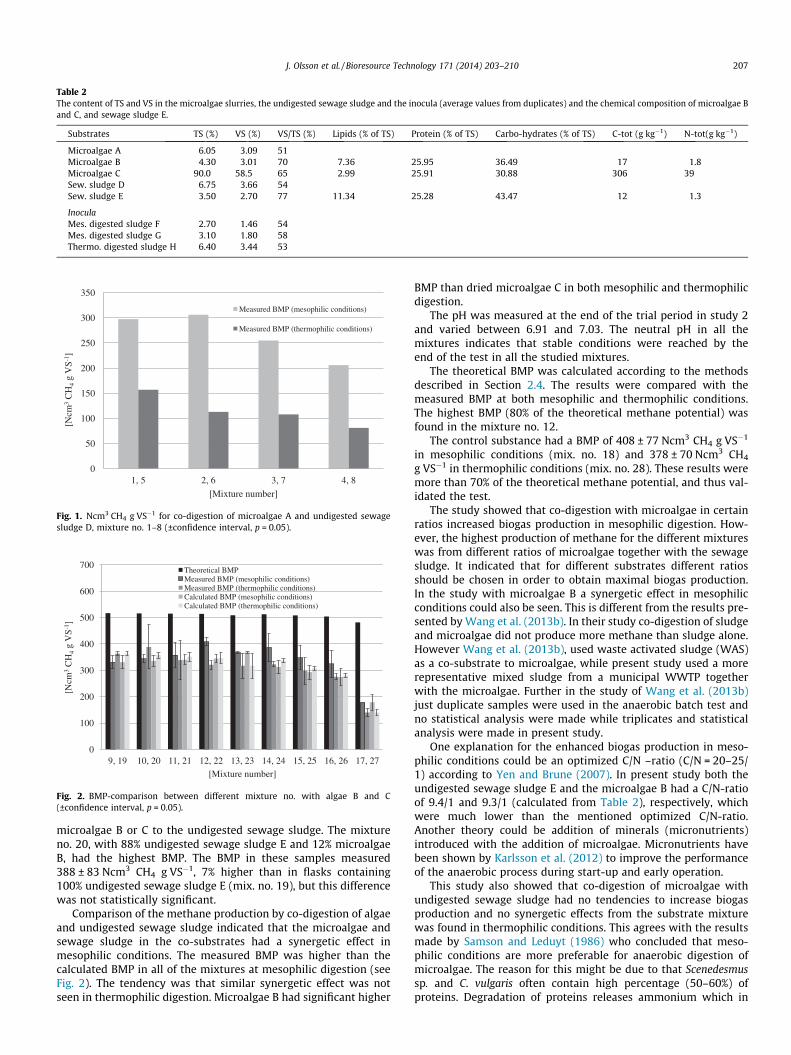
Table 2The content of TS and VS in the microalgae slurries, the undigested sewage sludge and the inocula (average values from duplicates) and the chemical composition of microalgae Band C, and sewage sludge E.
Substrates TS (%) VS (%) VS/TS (%) Lipids (% of TS) Protein (% of TS) Carbo-hydrates (% of TS) C-tot (g kg�1) N-tot(g kg�1)
Microalgae A 6.05 3.09 51Microalgae B 4.30 3.01 70 7.36 25.95 36.49 17 1.8Microalgae C 90.0 58.5 65 2.99 25.91 30.88 306 39Sew. sludge D 6.75 3.66 54Sew. sludge E 3.50 2.70 77 11.34 25.28 43.47 12 1.3
InoculaMes. digested sludge F 2.70 1.46 54Mes. digested sludge G 3.10 1.80 58Thermo. digested sludge H 6.40 3.44 53
0
50
100
150
200
250
300
350
1, 5 2, 6 3, 7 4, 8
[Ncm
3C
H4
g V
S-1]
[Mixture number]
Measured BMP (mesophilic conditions)
Measured BMP (thermophilic conditions)
Fig. 1. Ncm3 CH4 g VS�1 for co-digestion of microalgae A and undigested sewagesludge D, mixture no. 1–8 (±confidence interval, p = 0.05).
0
100
200
300
400
500
600
700
9, 19 10, 20 11, 21 12, 22 13, 23 14, 24 15, 25 16, 26 17, 27
[Ncm
3C
H4
g V
S-1]
[Mixture number]
Theoretical BMPMeasured BMP (mesophilic conditions)Measured BMP (thermophilic conditions)Calculated BMP (mesophilic conditions)Calculated BMP (thermophilic conditions)
Fig. 2. BMP-comparison between different mixture no. with algae B and C(±confidence interval, p = 0.05).
J. Olsson et al. / Bioresource Technology 171 (2014) 203–210 207
microalgae B or C to the undigested sewage sludge. The mixtureno. 20, with 88% undigested sewage sludge E and 12% microalgaeB, had the highest BMP. The BMP in these samples measured388 ± 83 Ncm3 CH4 g VS�1, 7% higher than in flasks containing100% undigested sewage sludge E (mix. no. 19), but this differencewas not statistically significant.
Comparison of the methane production by co-digestion of algaeand undigested sewage sludge indicated that the microalgae andsewage sludge in the co-substrates had a synergetic effect inmesophilic conditions. The measured BMP was higher than thecalculated BMP in all of the mixtures at mesophilic digestion (seeFig. 2). The tendency was that similar synergetic effect was notseen in thermophilic digestion. Microalgae B had significant higher
BMP than dried microalgae C in both mesophilic and thermophilicdigestion.
The pH was measured at the end of the trial period in study 2and varied between 6.91 and 7.03. The neutral pH in all themixtures indicates that stable conditions were reached by theend of the test in all the studied mixtures.
The theoretical BMP was calculated according to the methodsdescribed in Section 2.4. The results were compared with themeasured BMP at both mesophilic and thermophilic conditions.The highest BMP (80% of the theoretical methane potential) wasfound in the mixture no. 12.
The control substance had a BMP of 408 ± 77 Ncm3 CH4 g VS�1
in mesophilic conditions (mix. no. 18) and 378 ± 70 Ncm3 CH4
g VS�1 in thermophilic conditions (mix. no. 28). These results weremore than 70% of the theoretical methane potential, and thus val-idated the test.
The study showed that co-digestion with microalgae in certainratios increased biogas production in mesophilic digestion. How-ever, the highest production of methane for the different mixtureswas from different ratios of microalgae together with the sewagesludge. It indicated that for different substrates different ratiosshould be chosen in order to obtain maximal biogas production.In the study with microalgae B a synergetic effect in mesophilicconditions could also be seen. This is different from the results pre-sented by Wang et al. (2013b). In their study co-digestion of sludgeand microalgae did not produce more methane than sludge alone.However Wang et al. (2013b), used waste activated sludge (WAS)as a co-substrate to microalgae, while present study used a morerepresentative mixed sludge from a municipal WWTP togetherwith the microalgae. Further in the study of Wang et al. (2013b)just duplicate samples were used in the anaerobic batch test andno statistical analysis were made while triplicates and statisticalanalysis were made in present study.
One explanation for the enhanced biogas production in meso-philic conditions could be an optimized C/N –ratio (C/N = 20–25/1) according to Yen and Brune (2007). In present study both theundigested sewage sludge E and the microalgae B had a C/N-ratioof 9.4/1 and 9.3/1 (calculated from Table 2), respectively, whichwere much lower than the mentioned optimized C/N-ratio.Another theory could be addition of minerals (micronutrients)introduced with the addition of microalgae. Micronutrients havebeen shown by Karlsson et al. (2012) to improve the performanceof the anaerobic process during start-up and early operation.
This study also showed that co-digestion of microalgae withundigested sewage sludge had no tendencies to increase biogasproduction and no synergetic effects from the substrate mixturewas found in thermophilic conditions. This agrees with the resultsmade by Samson and Leduyt (1986) who concluded that meso-philic conditions are more preferable for anaerobic digestion ofmicroalgae. The reason for this might be due to that Scenedesmussp. and C. vulgaris often contain high percentage (50–60%) ofproteins. Degradation of proteins releases ammonium which in
208 J. Olsson et al. / Bioresource Technology 171 (2014) 203–210
higher temperature (thermophilic conditions) will be converted, toa higher extent, into ammonia. This substance can be toxic tomethanogenic bacteria which might explain why there was a lowerbiogas production in thermophilic conditions.
Scenedesmus sp. and C. vulgaris were found in both microalgae Aand B. The study made by Frigon et al. (2013) showed that purestrains of different types of Scenedesmus and C. vulgaris producemethane from 258 ± 7 to 410 ± 6 and from 263 ± 3 to 361 ±11 Ncm3 CH4 g VS�1 in 37 �C, respectively. BMP of microalgae Aalone were not analyzed, however, microalgae B produced367 ± 4 Ncm3 CH4 g VS�1, which is within the range of the previousstudy.
The microalgae C, which was dried and was dominated byScenedesmus had given BMP values that was lower than resultsreported by Frigon et al. (2013) for Scenedesmus but similar withresults reported by Mussgnug et al. (2010) for Scenedesmusobliquus (177.9 Ncm3 CH4 g VS�1). The low BMP in microalgae Cis probably due to that S. obliquus is dominant in microalgae C,or due to the drying process as reported by Mussgnug et al.(2010). The lower amount of lipids in microalgae C compared withmicroalgae B (see Table 2) could also be part of the explanationwhy the BMP was lower for microalgae C.
3.3. Degradation rate and kinetic modeling
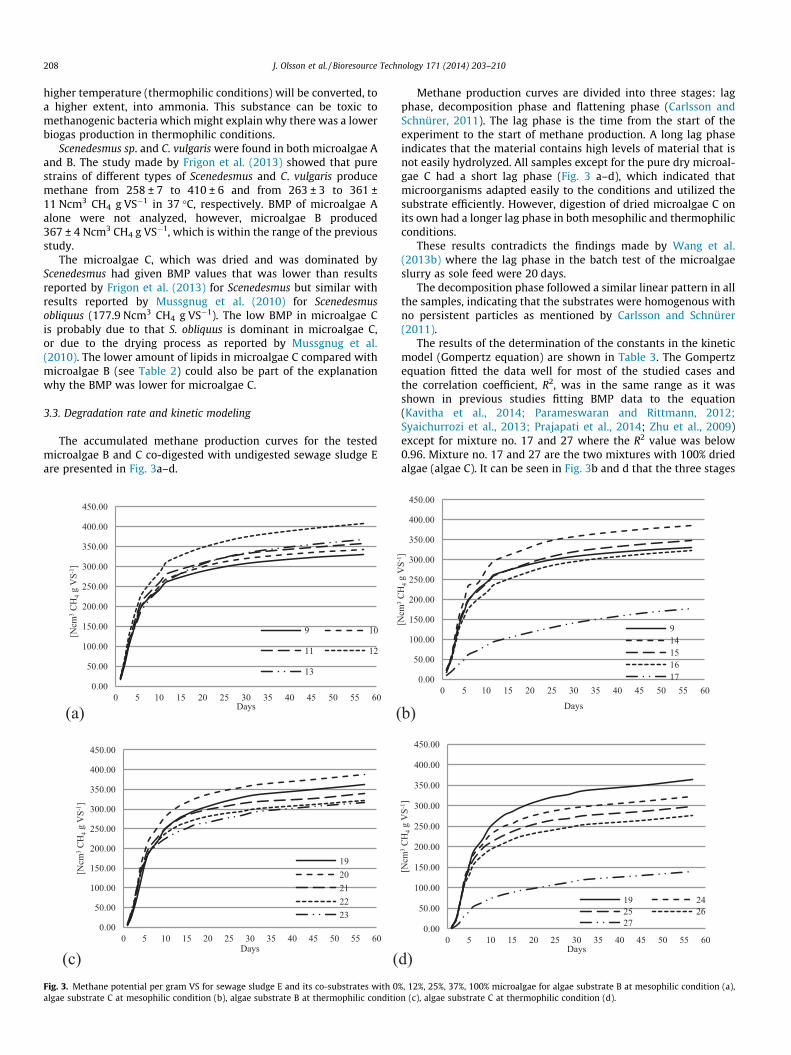
The accumulated methane production curves for the testedmicroalgae B and C co-digested with undigested sewage sludge Eare presented in Fig. 3a–d.
(a) (
(c) (
0.00
50.00
100.00
150.00
200.00
250.00
300.00
350.00
400.00
450.00
0 5 10 15 20 25 30 35 40 45 50 55 60
[Ncm
3C
H4
g V
S-1]
Days
9 10
11 12
13
0.00
50.00
100.00
150.00
200.00
250.00
300.00
350.00
400.00
450.00
0 5 10 15 20 25 30 35 40 45 50 55 60
[Ncm
3C
H4
g V
S-1]
Days
1920212223
Fig. 3. Methane potential per gram VS for sewage sludge E and its co-substrates with 0algae substrate C at mesophilic condition (b), algae substrate B at thermophilic conditio
Methane production curves are divided into three stages: lagphase, decomposition phase and flattening phase (Carlsson andSchnürer, 2011). The lag phase is the time from the start of theexperiment to the start of methane production. A long lag phaseindicates that the material contains high levels of material that isnot easily hydrolyzed. All samples except for the pure dry microal-gae C had a short lag phase (Fig. 3 a–d), which indicated thatmicroorganisms adapted easily to the conditions and utilized thesubstrate efficiently. However, digestion of dried microalgae C onits own had a longer lag phase in both mesophilic and thermophilicconditions.
These results contradicts the findings made by Wang et al.(2013b) where the lag phase in the batch test of the microalgaeslurry as sole feed were 20 days.
The decomposition phase followed a similar linear pattern in allthe samples, indicating that the substrates were homogenous withno persistent particles as mentioned by Carlsson and Schnürer(2011).
The results of the determination of the constants in the kineticmodel (Gompertz equation) are shown in Table 3. The Gompertzequation fitted the data well for most of the studied cases andthe correlation coefficient, R2, was in the same range as it wasshown in previous studies fitting BMP data to the equation(Kavitha et al., 2014; Parameswaran and Rittmann, 2012;Syaichurrozi et al., 2013; Prajapati et al., 2014; Zhu et al., 2009)except for mixture no. 17 and 27 where the R2 value was below0.96. Mixture no. 17 and 27 are the two mixtures with 100% driedalgae (algae C). It can be seen in Fig. 3b and d that the three stages
b)
d)
0.00
50.00
100.00
150.00
200.00
250.00
300.00
350.00
400.00
450.00
0 5 10 15 20 25 30 35 40 45 50 55 60
[Ncm
3C
H4
g V
S-1]
Days
914151617
0.00
50.00
100.00
150.00
200.00
250.00
300.00
350.00
400.00
450.00
0 5 10 15 20 25 30 35 40 45 50 55 60
[Ncm
3C
H4
g V
S-1]
Days
19 2425 2627
%, 12%, 25%, 37%, 100% microalgae for algae substrate B at mesophilic condition (a),n (c), algae substrate C at thermophilic condition (d).
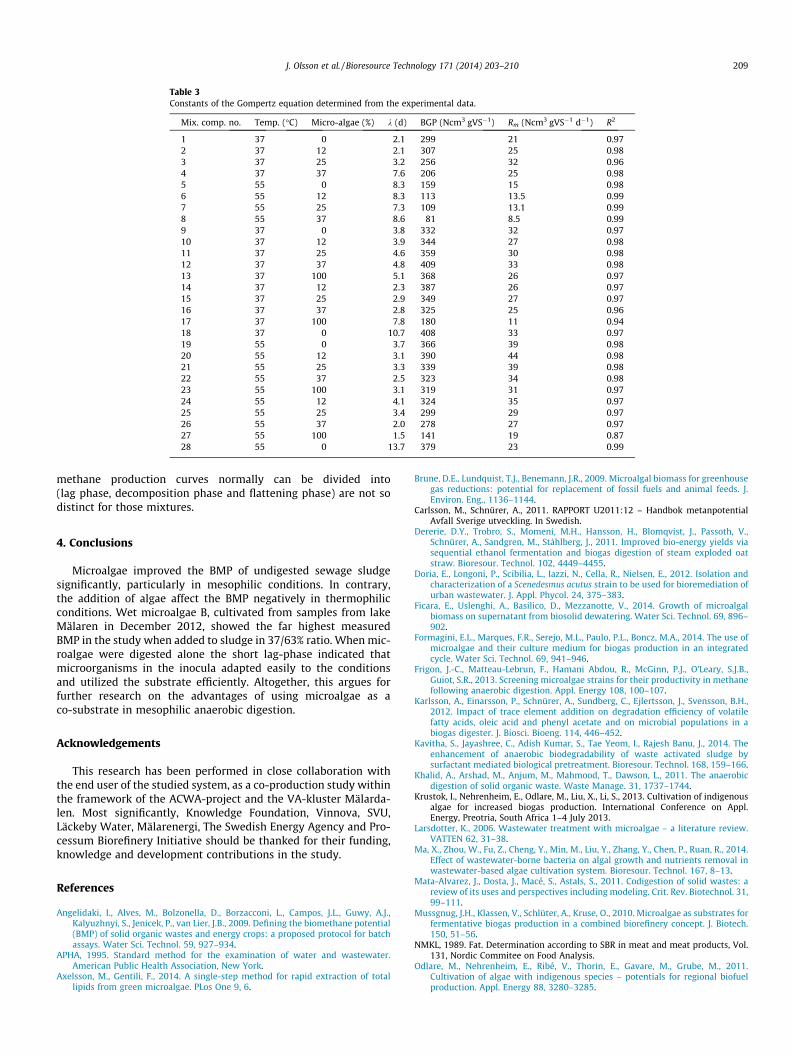
Table 3Constants of the Gompertz equation determined from the experimental data.
Mix. comp. no. Temp. (�C) Micro-algae (%) k (d) BGP (Ncm3 gVS�1) Rm (Ncm3 gVS�1 d�1) R2
1 37 0 2.1 299 21 0.972 37 12 2.1 307 25 0.983 37 25 3.2 256 32 0.964 37 37 7.6 206 25 0.985 55 0 8.3 159 15 0.986 55 12 8.3 113 13.5 0.997 55 25 7.3 109 13.1 0.998 55 37 8.6 81 8.5 0.999 37 0 3.8 332 32 0.9710 37 12 3.9 344 27 0.9811 37 25 4.6 359 30 0.9812 37 37 4.8 409 33 0.9813 37 100 5.1 368 26 0.9714 37 12 2.3 387 26 0.9715 37 25 2.9 349 27 0.9716 37 37 2.8 325 25 0.9617 37 100 7.8 180 11 0.9418 37 0 10.7 408 33 0.9719 55 0 3.7 366 39 0.9820 55 12 3.1 390 44 0.9821 55 25 3.3 339 39 0.9822 55 37 2.5 323 34 0.9823 55 100 3.1 319 31 0.9724 55 12 4.1 324 35 0.9725 55 25 3.4 299 29 0.9726 55 37 2.0 278 27 0.9727 55 100 1.5 141 19 0.8728 55 0 13.7 379 23 0.99
J. Olsson et al. / Bioresource Technology 171 (2014) 203–210 209
methane production curves normally can be divided into(lag phase, decomposition phase and flattening phase) are not sodistinct for those mixtures.
4. Conclusions
Microalgae improved the BMP of undigested sewage sludgesignificantly, particularly in mesophilic conditions. In contrary,the addition of algae affect the BMP negatively in thermophilicconditions. Wet microalgae B, cultivated from samples from lakeMälaren in December 2012, showed the far highest measuredBMP in the study when added to sludge in 37/63% ratio. When mic-roalgae were digested alone the short lag-phase indicated thatmicroorganisms in the inocula adapted easily to the conditionsand utilized the substrate efficiently. Altogether, this argues forfurther research on the advantages of using microalgae as aco-substrate in mesophilic anaerobic digestion.
Acknowledgements
This research has been performed in close collaboration withthe end user of the studied system, as a co-production study withinthe framework of the ACWA-project and the VA-kluster Mälarda-len. Most significantly, Knowledge Foundation, Vinnova, SVU,Läckeby Water, Mälarenergi, The Swedish Energy Agency and Pro-cessum Biorefinery Initiative should be thanked for their funding,knowledge and development contributions in the study.
References
Angelidaki, I., Alves, M., Bolzonella, D., Borzacconi, L., Campos, J.L., Guwy, A.J.,Kalyuzhnyi, S., Jenicek, P., van Lier, J.B., 2009. Defining the biomethane potential(BMP) of solid organic wastes and energy crops: a proposed protocol for batchassays. Water Sci. Technol. 59, 927–934.
APHA, 1995. Standard method for the examination of water and wastewater.American Public Health Association, New York.
Axelsson, M., Gentili, F., 2014. A single-step method for rapid extraction of totallipids from green microalgae. PLos One 9, 6.
Brune, D.E., Lundquist, T.J., Benemann, J.R., 2009. Microalgal biomass for greenhousegas reductions: potential for replacement of fossil fuels and animal feeds. J.Environ. Eng., 1136–1144.
Carlsson, M., Schnürer, A., 2011. RAPPORT U2011:12 – Handbok metanpotentialAvfall Sverige utveckling. In Swedish.
Dererie, D.Y., Trobro, S., Momeni, M.H., Hansson, H., Blomqvist, J., Passoth, V.,Schnürer, A., Sandgren, M., Ståhlberg, J., 2011. Improved bio-energy yields viasequential ethanol fermentation and biogas digestion of steam exploded oatstraw. Bioresour. Technol. 102, 4449–4455.
Doria, E., Longoni, P., Scibilia, L., Iazzi, N., Cella, R., Nielsen, E., 2012. Isolation andcharacterization of a Scenedesmus acutus strain to be used for bioremediation ofurban wastewater. J. Appl. Phycol. 24, 375–383.
Ficara, E., Uslenghi, A., Basilico, D., Mezzanotte, V., 2014. Growth of microalgalbiomass on supernatant from biosolid dewatering. Water Sci. Technol. 69, 896–902.
Formagini, E.L., Marques, F.R., Serejo, M.L., Paulo, P.L., Boncz, M.A., 2014. The use ofmicroalgae and their culture medium for biogas production in an integratedcycle. Water Sci. Technol. 69, 941–946.
Frigon, J.-C., Matteau-Lebrun, F., Hamani Abdou, R., McGinn, P.J., O’Leary, S.J.B.,Guiot, S.R., 2013. Screening microalgae strains for their productivity in methanefollowing anaerobic digestion. Appl. Energy 108, 100–107.
Karlsson, A., Einarsson, P., Schnürer, A., Sundberg, C., Ejlertsson, J., Svensson, B.H.,2012. Impact of trace element addition on degradation efficiency of volatilefatty acids, oleic acid and phenyl acetate and on microbial populations in abiogas digester. J. Biosci. Bioeng. 114, 446–452.
Kavitha, S., Jayashree, C., Adish Kumar, S., Tae Yeom, I., Rajesh Banu, J., 2014. Theenhancement of anaerobic biodegradability of waste activated sludge bysurfactant mediated biological pretreatment. Bioresour. Technol. 168, 159–166.
Khalid, A., Arshad, M., Anjum, M., Mahmood, T., Dawson, L., 2011. The anaerobicdigestion of solid organic waste. Waste Manage. 31, 1737–1744.
Krustok, I., Nehrenheim, E., Odlare, M., Liu, X., Li, S., 2013. Cultivation of indigenousalgae for increased biogas production. International Conference on Appl.Energy, Preotria, South Africa 1–4 July 2013.
Larsdotter, K., 2006. Wastewater treatment with microalgae – a literature review.VATTEN 62, 31–38.
Ma, X., Zhou, W., Fu, Z., Cheng, Y., Min, M., Liu, Y., Zhang, Y., Chen, P., Ruan, R., 2014.Effect of wastewater-borne bacteria on algal growth and nutrients removal inwastewater-based algae cultivation system. Bioresour. Technol. 167, 8–13.
Mata-Alvarez, J., Dosta, J., Macé, S., Astals, S., 2011. Codigestion of solid wastes: areview of its uses and perspectives including modeling. Crit. Rev. Biotechnol. 31,99–111.
Mussgnug, J.H., Klassen, V., Schlüter, A., Kruse, O., 2010. Microalgae as substrates forfermentative biogas production in a combined biorefinery concept. J. Biotech.150, 51–56.
NMKL, 1989. Fat. Determination according to SBR in meat and meat products, Vol.131, Nordic Commitee on Food Analysis.
Odlare, M., Nehrenheim, E., Ribé, V., Thorin, E., Gavare, M., Grube, M., 2011.Cultivation of algae with indigenous species – potentials for regional biofuelproduction. Appl. Energy 88, 3280–3285.
210 J. Olsson et al. / Bioresource Technology 171 (2014) 203–210
Parameswaran, P., Rittmann, B.E., 2012. Feasibility of anaerobic co-digestion of pigwaste and paper sludge. Bioresour. Technol. 124, 163–168.
Prajapati, S.K., Kumar, P., Malik, A., Vijay, V.K., 2014. Bioconversion of algae tomethane and subsequent utilization of digestate for algae cultivation: a closedloop bioenergy generation process. Bioresour. Technol. 158, 174–180.
Rusten, B., Sahu, A., 2011. Microalgae growth for nutrient recovery from sludgeliquor and production of renewable bioenergy. Water Sci. Technol. 64, 1195–1201.
Salo-väänänen, P.P., Koivistoinen, P.E., 1996. Determination of protein in foods:comparison of net protein and crude protein (N � 6.25) values. Food Chem. 57,27–31.
Samson, R., Leduyt, A., 1986. Detailed study of anaerobic digestion of Spirulinamaxima algal biomass. Biotechnol. Bioeng. 28, 1014–1023.
Schwede, S., Kowalczyk, A., Gerber, M., Span, R., 2013. Anaerobic co-digestion of themarine microalga Nannochloropsis salina with energy crops. Bioresour. Technol.148, 428–435.
Su, Y., Mennerich, A., Urban, B., 2011. Municipal wastewater treatment and biomassaccumulation with a wastewater-born and settleable algal-bacterial culture.Water Res. 45, 3351–3358.
Syaichurrozi, I., Budiyono, Sumardiono, S., 2013. Predicting kinetic model of biogasproduction and biodegradability organic materials: biogas production fromvinasse at variation of COD/N ratio. Bioresour. Technol. 149, 390–397.
Tchobanoglous, G., Burton, L.F., 2002. Wastewater Engineering: Treatment andReuse, fourth ed. McGraw & Hill.
Wang, H., Hu, Z., Xiao, B., Cheng, Q., Li, F., 2013a. Ammonium nitrogen removal inbatch cultures treating digested piggery wastewater with microalgaeOedogonium sp.. Water Sci. Technol. 68, 269–275.
Wang, M., Sahu, K.A., Björn, R., Chul, P., 2013b. Anaerobic co-digestion of microalgaeChlorella sp. and waste activated sludge. Bioresour. Technol. 142, 585–590.
Wiley, P.E., Campell, J.E., McKuin, B., 2011. Production of biodiesel and biogas fromalgae: a review of process train options. Water Environ. Res. 82, 326–338.
Yen, H., Brune, D., 2007. Anaerobic co-digestion of algal sludge and waste paper toproduce methane. Bioresour. Technol. 98, 130–134.
Zhu, B., Gikas, P., Zhang, R., Lord, J., Jenkins, B., Li, X., 2009. Characteristics and biogasproduction potential of municipal solid wastes pretreated with a rotary drumreactor. Bioresour. Technol. 100, 1122–1129.