climate friendly climate research policy brief … · climate friendly climate research policy...
TRANSCRIPT
CLIMATE FRIENDLY CLIMATE RESEARCH POLICY BRIEF “PROBLEM ANALYSIS”
July 7th 2014
Carbon emissions of universities and research organizations – and therefore also research programming – are high and, in most regions, on the rise. This paper focuses specifically on the emissions of universities, research programming and climate conferences.
The majority of universities quantify their CO2 Emissions according to the GHG Protocol. Although emission profiles differ remarkably and are often difficult to compare, university emissions are in many cases comparable to companies whose emissions are regulated by the EU Emissions Trading System.
The carbon footprint of research programming has not been assessed to date. What is clear, is that international research programs – consequentially with a high number of international meetings – also have a high carbon footprint. In the case of JPI operations, emissions have been calculated at 197 tCO2 in 2011. In sum climate research and international climate conferences make a not insubstantial contribution to global emissions.
The material presented here is based in particular on the JPI CLIMATE – Climate Friendly Climate Research project, coordinated by the Austrian Alliance of Sustainable Universities.
This work is licensed under the Creative Commons Attribution-ShareAlike 3.0 Unported
License. To view a copy of this license, visit http://creativecommons.org/licenses/by-sa/3.0/
Overview/Background Climate change research and research programming, especially in terms of publicly funded research programs, aim to support society in tackling the grand societal challenge of climate change and to underpin the necessity of reducing the carbon footprint of its activities. Ironically, the carbon emissions of universities and research organizations as well as international research programming – are high and in some regions on the rise. This is due to the considerably carbon-intensive working style that researchers, research policy-makers and their institutions have developed, fuelled by growing expectations of international cooperation, low air fares and an increasing use of resource-intensive infrastructures. However, crucial to scientific communication is also credibility, which can be severely undermined by such activities, which are often inconsistent with the message that climate scientists in particular advocate.
In consideration of the grand societal challenge of climate change that is central to research efforts initiated by JPI CLIMATE, the Governing Board of JPI CLIMATE adopted the JPI CLIMATE sustainability principle of “taking into account the challenges of climate change in the work of the JPI, based on active reflection of operations (e.g. “green meetings”) and formulating the endeavour of constant improvement of the operations’ climate performance” or, as Erica Thompson (2011) from Imperial College London recently stated, to “making our actions consistent with our scientific predictions”.
But more importantly than the issue of credibility is the example set by the research system. Science can offer society positive role models. Scientists and other staff from the research sector are making a strong statement if they communicate to both the public and decision-makers that they are actually acting in line with the implications of their findings and working towards reducing the steadily increasing ecological and carbon footprint of the research system.
Introduction
In spite of recognition among scientists and their institutions that action must be taken to mitigate climate change, higher education account for a considerable proportion of a given nations’ emissions. For example, UK universities are responsible for over 12% of the UK’s public sector carbon emissions. According to Camco 20111, annual emissions of UK institutions of higher education amount to 1,983,962 tCO2. These figures do not contain emissions generated by procurement, international students and business travel. In the United States, GHG emissions from higher education institutions show average annual emissions from all institutional classifications to be 52,434 tCO2. Total tCO2 of U.S. higher
1 See “Wider Public Sector Emissions Reduction Potential Research – Non-technical Summary” by Bryan, Cohen and Stephan (2011). Last accessed on 13 March 2013 at: http://tools.decc.gov.uk/assets/decc/11/tackling-climate-change/saving-energy-co2/2262-summ-camco-report-public-sector-emissions.pdf.
2
education institutions in 2005 added up to 121 million tCO2, or nearly 2% of total annual U.S. GHG emissions, comparable to approximately 25% of total Californian emissions2.
As shown, the carbon emissions of higher education as a whole are considerable. Those of individual universities and research organizations are also not negligible. Whilst over 11.000 European Union (EU) companies are regulated by the EU Emissions Trading Scheme (EU-ETS), research organizations only report emissions on a voluntary basis. Nevertheless, their emissions are often comparable to those of companies and several emit well over 50,000 tons per year, for example, the University of Paris Diderot which emitted 29,086 tCO2in 2011 on a global scale the University of Toronto (Canada), which emitted 164,491 tons in 20103.
Consequently, one could argue that universities and research institutions have a particular responsibility to take action to reduce their emissions, whether voluntarily or through regulation. However, at the time of writing little evidence was found4 – beyond voluntary strategies – of policies to reduce the emissions caused by research either at the university, institute or research programming levels.
The primary aim of this work package of the pilot project “Climate Friendly Climate Research” was to measure the scope of the problem (i.e. how large is the contribution of higher education to GHG emissions) and identify the key contributing factors (e.g. travel, electricity, …).
Methods One of the main goals of this work package was the compilation of the state of scientific knowledge on the climate impacts of research and research programming. In our analysis, we investigate the scope of the ‘problem’ primarily in a European context.
To do this, the carbon footprint of individual researchers, several large scientific conferences and research programming was made based on a literature review. The CO2 emissions of universities and the JPI program itself were analyzed in further details. To
2 See “Greenhouse Gas Emissions from U.S. Institutions of Higher Education” by Sinha et. al. in the Journal of the Air & Waste Management Association (2012). Last accessed on 13 March 2013 at: http://www.tandfonline.com/doi/pdf/10.3155/1047-3289.60.5.568. 3 See University of Toronto Environmental Footprint, last accessed 17th of May 2013 http://sustain.fs.utoronto.ca/campus-footprint/ 4 With one exception: “All UK universities are required to start measuring and reporting their indirect carbon emissions from procurement activities, business travel, daily commuting, international student travel and end of term travel come into force in 2012/13.” See page 7 of the People & Planet Green League Report 2012 at: http://peopleandplanet.org/dl/gl2012_report.pdf.
3

accurately calculate the emissions the Green House Protocol Standard and the “atmosfair tool”5 to quantify emissions of meetings was used.
Data of JPI meetings were made available by the secretariat and a matrix was developed to map out emissions of the year 2011. Several assumptions were made for the calculation, the accuracy level is assumed to be between 90-95%.
To assess the main sources of emissions of universities and research institutions, the team reviewed a number of sustainability reports and other relevant publications from universities. On the basis of the published data, a matrix was developed for analyzing the CO2 emissions in three dimensions with the aim of concentrating research efforts on: 1) sources of emissions, 2) regions, and 3) levels (individual, university, research landscape, etc.). The matrix was developed on the basis of the Greenhouse Gas Protocol (GHP) Standard (developed by the World Resource Institute) and the ACU standard. In addition, the primary energy demand was evaluated where possible, in order to make energy efficiency measures more visible. Due to potential for immediate and effective action, the project has focused in particular on the areas of mobility and international research.
Since many universities use the GHP Standard to quantify emissions, we also divided sources of emissions into three Scopes:
- Scope 1: Encompasses emissions generated by company-owned6 assets. Examples of emission categories in Scope 1 are in-house electricity generation and transportation of vehicles owned by the organization.
- Scope 2: Includes purchased heat and electricity. - Scope 3: Refers to other emissions that are not the result of company-owned assets,
but are the result of a company’s activities. Employee commuting (in non-company owned vehicles) and purchased water are examples. Only relevant Scope 3 emissions are mandatory to quantify (if emissions are expected to be more than 1% of total emissions) . Several research institutions do not take them into account.
Our analysis of climate research emissions take into account all emission sources (provided data is available) which are listed in Scope 1-3 of the GHP. However, due to the rather limited scope of the research project and to the fact that data on minor emitting sources are rare, only main emitting sources were analyzed. Additionally, our research was limited to desktop and internet research. Consequently, we were dependent on existing carbon inventories and sustainability reports as well as scientific and media articles.
Analysis As mentioned above, recommendations emerging from the work package “problem analysis” will be tailored to different stakeholder groups. Likewise, the problem analysis has
5 See www.atmosfair.de 6 Reference is made to „company-owned“ assets as the GHP Standard was designed for companies.
4

been broken down into stakeholder groups and key elements of research that can be evaluated alone. These different stakeholder groups and research elements are the following:
- Individual researchers - Individual research projects - Research institutes - Universities - Research programming and funding - Scientific conferences
In the course of analyzing the scope of the problem in terms of these stakeholder groups and research elements, we also uncovered gaps in current research that should be addressed, but which went beyond the scope of this pilot research project. These areas will be identified in more detail in the section of this paper entitled “Policy Options and Recommendations”.
Individual researchers:
Research has shown that the average (climate) researcher’s CO2 emissions are considerably higher than those of the average citizen. Canadian scientist Ryan K. Brook7, from the University of Calgary, calculated his research-related emissions (i.e. not including his emissions from non-research related activities) over a period of ten years and came to the result of an average of 8.3 tCO2 per year. In comparison, Brooks noted that the average inhabitant of Toronto, Canada produces 8.6 tCO2 per year. In other words, his research activities alone correspond to approximately those of a citizen of Toronto.
A European example that was found is that of scientists at the Norwegian Institute for Air Research (NILU). In his article, Stohl8 calculated CO2 emissions caused by all types of business travel carried out by NILU employees for the years 2005-2007. Stohl’s analysis showed that NILU scientists produced on average 3.9-5.5 tCO2 as a result of their business travel. More than 90% of this was due to air travel, with 3% coming from ground travel and 5% from hotel usage. In the same article, Stohl also showed that non-scientific staff at NILU averaged CO2 emissions between 1.9 and 2.4 tCO2 due to travel, thus considerably lower than scientific staff. In 2008, the year that his article was published, the global average for annual emissions was 4.5 tCO2 per person.
As can be seen, per capita emissions of researchers is considerably higher than national and global averages. This has also been shown to be related to a large degree to their (air)
7 Ryan K. Brook, University of Calgary, in “Ignoring the Elephant in the Room: The Carbon Footprint of Climate Change Research”. Accessed at: http://arctic.synergiesprairies.ca/arctic/index.php/arctic/article/view/144/179. 8 A. Stohl, Norwegian Institute for Air Research, in “The travel-related carbon dioxide emissions of atmospheric researchers”. Accessed at: http://hal.archives-ouvertes.fr/docs/00/30/41/03/PDF/acpd-8-7373-2008.pdf.
5

travel. For more information regarding specific, travel-related activities of researchers, see the section on scientific conferences below.
Individual research projects:
Currently no data concerning the CO2 emissions of individual research projects was discovered. This could be due to research projects generally having limited budgets that do not foresee – and therefore do not finance – carbon audits of individual projects. Also it is quite difficult to compare carbon footprints of research projects due to the different nature of projects. For more information, please see the section “Policy Options and Recommendations” below.
Research institutes:
Due to the fact that an estimation of university CO2 emissions on a per capita basis yields lower than average per capita emissions for research, as a consequence of factoring students into the calculations, it was decided to also analyze several research institutes. Looking at individual research institutes allows for a more accurate representation of CO2 emissions related to research activities. As shown above, according to Stohl’s analysis, CO2 emissions for the Norwegian Institute for Air Research were 3.9-5.5 tCO2 per capita for 2005-2007. Since his analysis only looked at emissions caused by business travel (conference visits, workshops, field campaigns, instrument maintenance, etc.), actual per capita emissions for NILU scientist are certainly higher than this.
A non-European research institute, the Forest Research Institute Malaysia (FRIM), calculated its carbon footprint for 20119. According to its analysis, the FRIM produced 5,332 tCO2 in 2011, resulting in approximately 6.1 tCO2 on a per capita basis. This amount included all GHG emissions from FRIM’s core research and development (R&D) activities, including electricity consumption, research related travels and transportation required for conducting the R&D activities. While the FRIM calculated that this amount is roughly 50 times less than the amount of carbon being sequestered by the trees in FRIM, it still shows the considerably above average carbon footprint of research, particularly when one takes into consideration that the majority of research institutes do not have 420 hectares of their campus covered by forest that serve as carbon sinks.
Universities:
As mentioned in the first section of this paper, total CO2 emissions of universities can be considerable. According to Sinha et. al. (2012), universities in the United States average
9 See http://www.frim.gov.my/?p=6958 for the article. Last accessed on 26 March 2013.
6

52,434 tCO2 per year10, however, a number of large universities emit considerably more than this average, such as the University of Toronto.
For this project we analyzed the CO2 emissions for several universities in Europe. Due to the limited scope of this project, we had to limit our analysis to existing carbon inventories. As a result, our pool of possible universities to evaluate was relatively small (nine universities) and did not include some of the larger European universities, for example the Universidad Complutense de Madrid, with a combined student body and staff of over 125,000. The following universities have been included in our analysis: University of Natural Resources and Life Sciences, Vienna (AT), University of Plymouth (UK), Erasmus University of Rotterdam (NL), University of Oslo (NO), University of Versailles Saint-Quentin-en-Yvelines (FR), University of Paris Diderot (FR), University of Paris-Dauphine (FR), Ca’Foscari University of Venice (IT), and Politecnico di Milano (IT).
The following table shows each university, total number of students, faculty and staff, total CO2 emissions for a specific year or years11, and the per capita CO2 emissions based on total university emissions divided by the total number of students and faculty.
University Total students and faculty
Total CO2 emissions
(tCO2) Year
Annual per capita CO2 emissions
(tCO2)
University of Natural Resources and Life Sciences, Vienna (AT) 12,456 8,231 2011 0.81
University of Plymouth (UK) 33,000 12,293 2009/2010 0.37
Erasmus University Rotterdam (NL) 20,479 12,601 2010 0.62
University of Oslo (NO) 35,000 31,731 2009 0.91
University of Versailles Saint-Quentin-en-Yvelines (FR) 20,41012 22,500 2006/2007 1.10
University of Paris Diderot (FR) 30,300 29,086 2011 0.96
University of Paris-Dauphine (FR) 10,269 13 9,200 2007 0.90
10 See “Greenhouse Gas Emissions from U.S. Institutions of Higher Education” by Sinha et. al. in the Journal of the Air & Waste Management Association (2012). Last accessed on 13 March 2013 at: http://www.tandfonline.com/doi/pdf/10.3155/1047-3289.60.5.568. 11 Several of the universities have not measured Scope 3 activities, e.g. (air) travel, and therefore have higher total and per capita emissions than are listed here. 12 In 2012 13 Students and professors (no other staff or faculty included)
7

Ca’ Foscari University of Venice (IT) 19,428 14 12,366 2009 0.64
Politecnico di Milano (IT) 20,027 22,791 2009/2010 1.14
The scope of universities’ CO2 footprint calculations differ considerably and hence are difficult to compare. The majority of universities quantify their CO2 emissions according to the GHG Protocol. Nevertheless the numbers of emission sources under scope 3 which entail so called indirect emissions, such as employee business travel, waste disposal, product use, emissions of purchased materials etc. differ remarkably. These emissions can account for between 0% (Univ. Of Plymouth, simply because they didn’t calculate them) and 70% (Paris Diderot) of university emissions. Figure 1 shows the universities emissions according to GHP scopes.
14 Only students for 2010
8
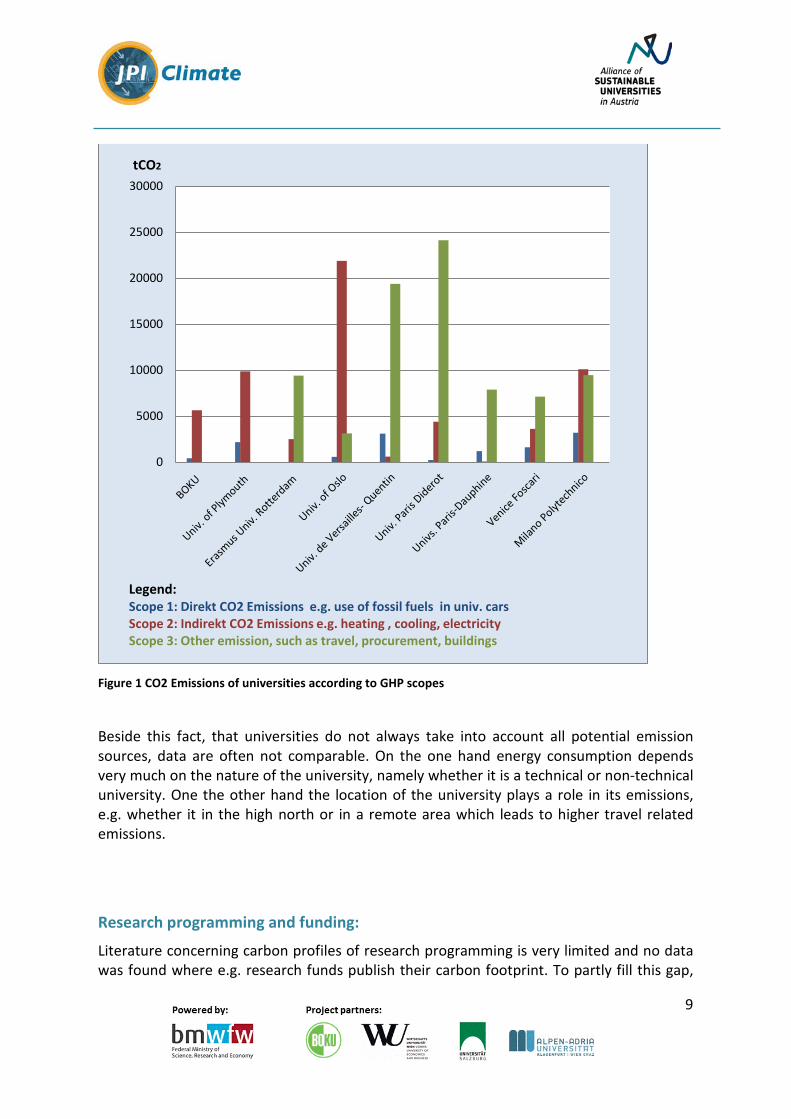
Figure 1 CO2 Emissions of universities according to GHP scopes
Beside this fact, that universities do not always take into account all potential emission sources, data are often not comparable. On the one hand energy consumption depends very much on the nature of the university, namely whether it is a technical or non-technical university. One the other hand the location of the university plays a role in its emissions, e.g. whether it in the high north or in a remote area which leads to higher travel related emissions.
Research programming and funding:
Literature concerning carbon profiles of research programming is very limited and no data was found where e.g. research funds publish their carbon footprint. To partly fill this gap,
0
5000
10000
15000
20000
25000
30000
Legend: Scope 1: Direkt CO2 Emissions e.g. use of fossil fuels in univ. cars Scope 2: Indirekt CO2 Emissions e.g. heating , cooling, electricity Scope 3: Other emission, such as travel, procurement, buildings
tCO2
9
the CO2 emissions of JPI research programming and funding agencies had been quantified using the “atmosfair tool” and GHP Standard.
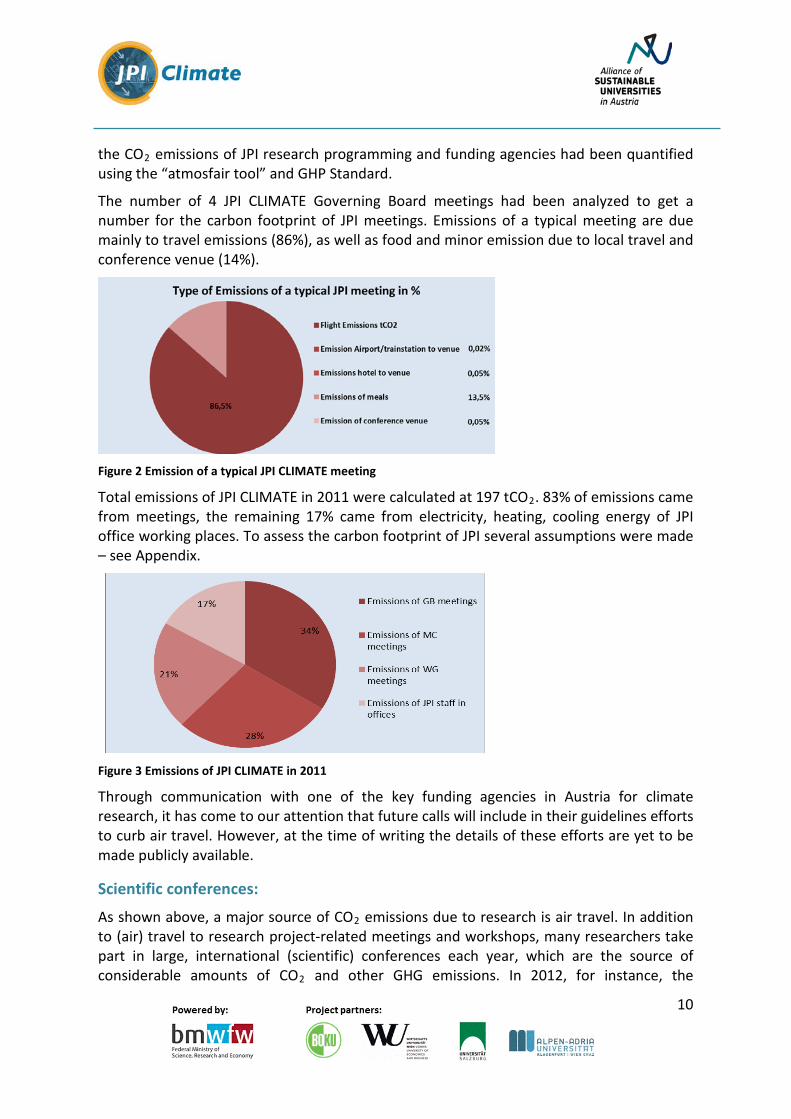
The number of 4 JPI CLIMATE Governing Board meetings had been analyzed to get a number for the carbon footprint of JPI meetings. Emissions of a typical meeting are due mainly to travel emissions (86%), as well as food and minor emission due to local travel and conference venue (14%).
Figure 2 Emission of a typical JPI CLIMATE meeting
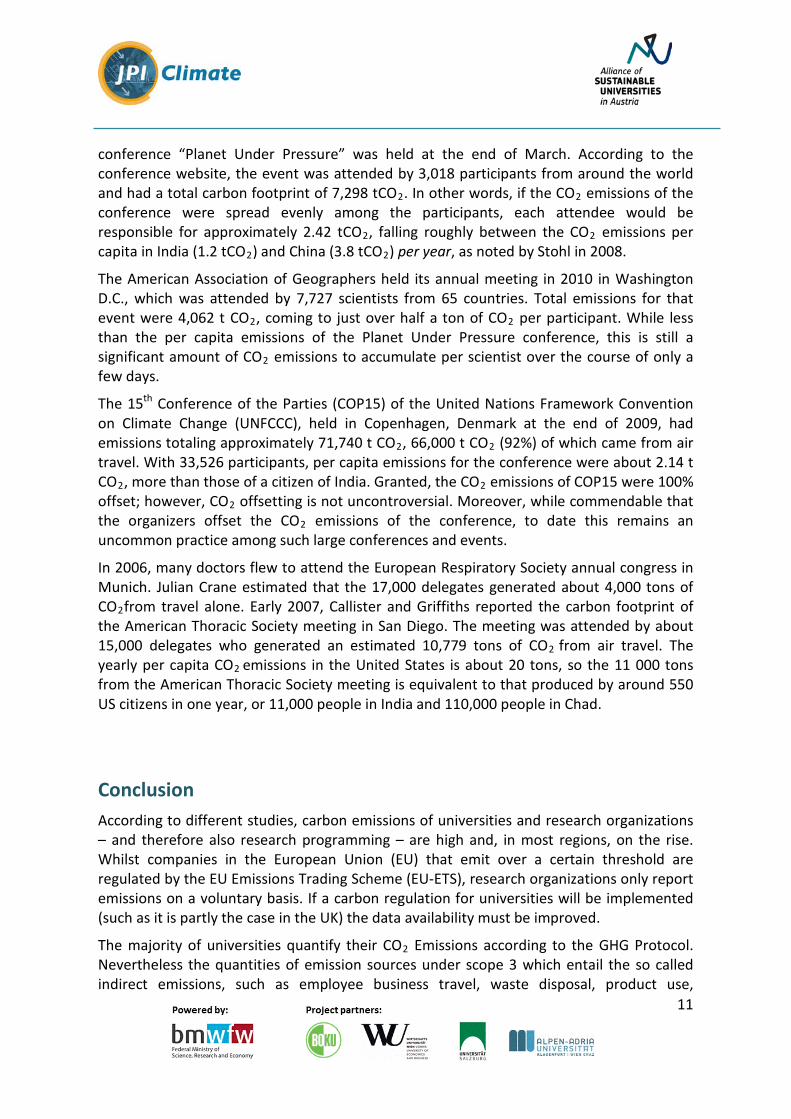
Total emissions of JPI CLIMATE in 2011 were calculated at 197 tCO2. 83% of emissions came from meetings, the remaining 17% came from electricity, heating, cooling energy of JPI office working places. To assess the carbon footprint of JPI several assumptions were made – see Appendix.
Figure 3 Emissions of JPI CLIMATE in 2011
Through communication with one of the key funding agencies in Austria for climate research, it has come to our attention that future calls will include in their guidelines efforts to curb air travel. However, at the time of writing the details of these efforts are yet to be made publicly available.
Scientific conferences:
As shown above, a major source of CO2 emissions due to research is air travel. In addition to (air) travel to research project-related meetings and workshops, many researchers take part in large, international (scientific) conferences each year, which are the source of considerable amounts of CO2 and other GHG emissions. In 2012, for instance, the
10
conference “Planet Under Pressure” was held at the end of March. According to the conference website, the event was attended by 3,018 participants from around the world and had a total carbon footprint of 7,298 tCO2. In other words, if the CO2 emissions of the conference were spread evenly among the participants, each attendee would be responsible for approximately 2.42 tCO2, falling roughly between the CO2 emissions per capita in India (1.2 tCO2) and China (3.8 tCO2) per year, as noted by Stohl in 2008.
The American Association of Geographers held its annual meeting in 2010 in Washington D.C., which was attended by 7,727 scientists from 65 countries. Total emissions for that event were 4,062 t CO2, coming to just over half a ton of CO2 per participant. While less than the per capita emissions of the Planet Under Pressure conference, this is still a significant amount of CO2 emissions to accumulate per scientist over the course of only a few days.
The 15th Conference of the Parties (COP15) of the United Nations Framework Convention on Climate Change (UNFCCC), held in Copenhagen, Denmark at the end of 2009, had emissions totaling approximately 71,740 t CO2, 66,000 t CO2 (92%) of which came from air travel. With 33,526 participants, per capita emissions for the conference were about 2.14 t CO2, more than those of a citizen of India. Granted, the CO2 emissions of COP15 were 100% offset; however, CO2 offsetting is not uncontroversial. Moreover, while commendable that the organizers offset the CO2 emissions of the conference, to date this remains an uncommon practice among such large conferences and events.
In 2006, many doctors flew to attend the European Respiratory Society annual congress in Munich. Julian Crane estimated that the 17,000 delegates generated about 4,000 tons of CO2from travel alone. Early 2007, Callister and Griffiths reported the carbon footprint of the American Thoracic Society meeting in San Diego. The meeting was attended by about 15,000 delegates who generated an estimated 10,779 tons of CO2 from air travel. The yearly per capita CO2 emissions in the United States is about 20 tons, so the 11 000 tons from the American Thoracic Society meeting is equivalent to that produced by around 550 US citizens in one year, or 11,000 people in India and 110,000 people in Chad.
Conclusion According to different studies, carbon emissions of universities and research organizations – and therefore also research programming – are high and, in most regions, on the rise. Whilst companies in the European Union (EU) that emit over a certain threshold are regulated by the EU Emissions Trading Scheme (EU-ETS), research organizations only report emissions on a voluntary basis. If a carbon regulation for universities will be implemented (such as it is partly the case in the UK) the data availability must be improved.
The majority of universities quantify their CO2 Emissions according to the GHG Protocol. Nevertheless the quantities of emission sources under scope 3 which entail the so called indirect emissions, such as employee business travel, waste disposal, product use,
11

emissions of purchased materials differ remarkably. These emissions can equate to between 0% (Univ. Of Plymouth, simply because they didn’t calculate them) and 70% (Paris Diderot) of a universities’ emissions.
In our analysis we could not find any linkage whether universities being in remote areas of Europe have higher emissions than universities being in the centre. While this correlation might exist, the currently available data are not detailed enough to make such analysis.
The carbon footprint of research programming has not been assessed to date. What is clear, is that international research programs – consequentially with a high number of international meetings – also have a high carbon footprint. Research programming, individual researches and universities have several options to remarkably reduce their carbon footprint. Many of these option have negative abatement costs, and a hence both, reducing the CO2 emissions and saving money.
Figure 4 Total CO2 Emissions, number of Students and location of university
0
5000
10000
15000
20000
25000
30000
35000No. of Students
CO2 Emissions of given year
tCO2
12

Appendix: Assumptions made to quantify JPI Emissions
Assumptions
Emissions of JPI conferences
No of participants in management committee meetings 30 Persons
No of participants in working groups meetings 10 Persons
No. of locals per meeting 3 locals
No of working group meetings in 2011 10 meetings
Duration of meeting 2 days
Average distance airport/intern. train station to venue roundtrip 30 km
JPI members travel from Airport/train station to venue by taxi 50%
JPI members travel from Airport/train station to venue by public transport 50%
Average distance hotel to venue - roundtrip 5 km
Local Transport - Taxi 20%
Local Transport - Public Transport 50%
Local Transport - Bike, Foot 30%
Catering costs per day per person/2 meals 80 €
Average size of venue area 100 m²
Reduction of travel due to back to back with other meetings 10%
All meals are non-vegetarian and not specifically local food
Average building code of venue
No transportation of goods
No emissions from hotel stay included
13

Emissions of JPI staff
Full time equivalents in JPI office 2,5 Persons
JPI staff (incl. Governing Board) 40 Persons
Working time for Governing Board 10%
Working time for Management Comittee 15%
Working time forWorking groups 10%
Sum Fulltime equivalents 35%
14
About JPI CLIMATE The Joint Programming Initiative on Connecting Climate Knowledge for Europe (JPI CLIMATE) acts as a strategic platform for aligning national research priorities in the area of climate research and also for launching joint funding activities. It has fourteen member countries (Austria, Belgium, Denmark, Estonia, Finland, France, Germany, Ireland, Italy, Norway, Spain, Sweden, the Netherlands, and the United Kingdom).
JPI CLIMATE contributes to coordinated knowledge development and connecting that knowledge to decision-making on climate change adaptation and mitigation. By connecting science and decision making processes JPI CLIMATE aims to provide the knowledge necessary to meet the challenge of making Europe both climate-friendly and climate-proof, and reach the target of becoming a energy-efficient, low carbon society.
In consideration of the grand societal challenge of climate change being central to research efforts that are initiated by the JPI, it seeks to contribute to mitigating the carbon footprint of its work and activities. In doing so, JPI CLIMATE is committed to increasing the credibility of climate impact research and function as a role model for other groups of society in terms of responsible, climate-friendly science and research.
About the Alliance of Sustainable Universities in Austria The Alliance of Sustainable Universities in Austria was founded in 2012 as an informal network of universities that aims at promoting sustainability issues in Austrian universities and thus to contribute to a more sustainable society. Currently nine Austrian universities are members of the network. Through its common appearance, the Alliance strengthens sustainability issues generally and also provides added motivation to its members to integrate sustainability at their institutions and adds support to these efforts. The main objectives of the alliance are to exchange good and best practice-experiences and to start joint activities in the fields of research, education, operations, society/knowledge transfer and identity, which are conducted in the framework of working groups. Within the Alliance the participating universities have committed to developing a sustainability strategy as part of the performance agreements for 2013-2015 that each university negotiates with the Austrian ministry for Science, Research and Economy.
15
Authors Schmitz, Dominik*; Getzinger, Günter**; Helgenberger, Sebastian*; Kirchhoff, Tobias***; Pawloff, Adam*; Röthler, David****; Zagel, Bernhard*****
* University of Natural Resources and Life Sciences, Vienna
** Alpen-Adria University, Klagenfurt, Vienna, Graz
*** Vienna University of Economics and Business
**** PROJEKTkompetenz.eu, Austria
***** University of Salzburg
Contact Adam Pawloff, MA (project lead)
Centre for Global Change and Sustainability
University of Natural Resources and Life Sciences, Vienna
Borkowskigasse 4
1190 Vienna
Austria
Tel: ++43 1 47654 7703
Email: [email protected]
Further CFCR Policy Briefs and Recommendations Zagel, B. et. al. (2014): CLIMATE FRIENDLY CLIMATE RESEARCH POLICY BRIEF “EXISTING SOLUTIONS”.
Kirchhoff, T. et. al. (2014): CLIMATE FRIENDLY CLIMATE RESEARCH POLICY BRIEF “FEASIBILITY ASSESSMENT”.
Getzinger, G. et. al. (2014): CLIMATE FRIENDLY CLIMATE RESEARCH - RECOMMENDATIONS
Published online: http://ccca.boku.ac.at/kooperationen/verantwortung
16