climate change studies: modelling for scenarios in vietnam · climate change impact and...
TRANSCRIPT

Regional Technical Workshop on Application of Modelling Tools for Climate Change Impact and Vulnerability Assessment
8-9 September 2009, MRCS, Bangkok, Thailand------------------------------------------------------------------------------
Climate Change Studies: Climate Change Studies: Modelling for Scenarios Modelling for Scenarios
in Vietnamin Vietnam
Tran Dinh TrongTran Dinh TrongVietnam Institute of Meteorology, Hydrology and Vietnam Institute of Meteorology, Hydrology and
EnvironmentEnvironment

OutlineOutline1. Introduction2.2. Overview on Climate Change Studies in Overview on Climate Change Studies in
VietnamVietnam2.1 Climate change status2.1 Climate change status2.2 Climate change studies2.2 Climate change studies
3.3. Climate Change ModellingClimate Change Modelling3.1 Methods for generating the climate change scenarios3.2 MRI/AGCM3.3 PRECIS3.4 MAGICC/SCENGEN 5.3, Statistical Downscaling
4. Climate Change Scenario4. Climate Change Scenario4.1 Criteria for Choosing Vietnam climate change scenario4.2 Official scenario for Vietnam

LAOS
NORTH RE ION
CAMBODIA
sOu REGION
QUANG
CHINA
I PHONG 4-IANOI
NORTHERN DEL MIDLANO3
PACIFIC OCEAN -F
THU, " 4'.
THIENIJJ -
QUAUG HAM 04k HANG
OAST CENTRAL HIGH DS
A AlA VUNG TRU
ME)(ONG P Llm
NH HOA
1. Introduction1. Introduction- Country position: Southeastern Asia, 8o27 to 23o23N and 102o08 to 109o30E
-Area: 330,990 km2
-The coastline length: 3,260 km
- Climate: Tropical monsoon suffering from natural disasters such as typhoons, floods,drought,… which affected regularly to socio-economic development
-- Climatic Regions: 7Climatic Regions: 7

OutlineOutline1. Introduction2.2. Overview on Climate Change Studies in Overview on Climate Change Studies in
VietnamVietnam2.1 Climate change Status2.1 Climate change Status2.2 Climate change studies2.2 Climate change studies
3.3. Climate Change ModellingClimate Change Modelling3.1 Methods for generating the climate change scenarios3.2 MRI/AGCM3.3 PRECIS3.4 MAGICC/SCENGEN 5.3, Statistical Downscaling
4. Climate change Scenario4. Climate change Scenario4.1 Criteria for Choosing Vietnam climate change scenario4.2 Official scenario for Vietnam

.
co
0)
co
0) 1
co
(0
0)
U
- -
9 -
Annual average temperature increased by 0.10C per decade from 1900 to 2000
2.1 Climate change Status:2.1 Climate change Status:

Tây Bắc - Nhiệt độ trung bình năm(dT=0.50C/50năm)
-1.5
-1.0
-0.5
0.0
0.5
1.0
1958 1965 1972 1979 1986 1993 2000 2007Năm
0C
Đông Bắc Bộ - Nhiệt độ trung bình năm(dT=0.60C/50năm) y = 0.0129x - 0.3267
-1.0
-0.5
0.0
0.5
1.0
1958 1965 1972 1979 1986 1993 2000 2007
Năm
0C
Đồng bằng Bắc Bộ - Nhiệt độ trung bình năm(dT=0.60C/50năm)
-1.0
-0.5
0.0
0.5
1.0
1.5
1958 1965 1972 1979 1986 1993 2000 2007
Năm
0C
Bắc Trung Bộ - Nhiệt độ trung bình năm(dT=0.40C/50năm)
-1.5
-1.0
-0.5
0.0
0.5
1.0
1.5
1958 1965 1972 1979 1986 1993 2000 2007
Năm
0C
Nam Trung Bộ - Nhiệt độ trung bình năm(dT=0.30C/50năm)
-1.0
-0.5
0.0
0.5
1.0
1958 1965 1972 1979 1986 1993 2000 2007
Năm
0C
Tây Nguyên - Nhiệt độ trung bình năm(dT=0.30C/50năm)
-1.0
-0.5
0.0
0.5
1.0
1.5
1958 1965 1972 1979 1986 1993 2000 2007
Năm
0C
Nam Bộ - Nhiệt độ trung bình năm(dT=0.60C/50năm)
-1.0
-0.5
0.0
0.5
1.0
1958 1965 1972 1979 1986 1993 2000 2007
Năm
0C
T trends in
7 climatic regions

Ii 4
I i ---
t I I
i r I
I
L
I L
liii IiI 1I
IIII i I
Ii \i 'i' II J
if
IiI Ij
'
6LO-X6OO-=J
1-
-- - -; - -
U.-
JI._____
-WI, irm
OcL -
o c -
0 ; oo
o C1L
o L
00: n :
Variation tendencies of Variation tendencies of precipitationprecipitation are complex and region and are complex and region and season specific season specific

uenseJj U
SNIddI1IHd -( - *j6ueueO
NI 31 A
Increase in quantity and intensity of extreme-weather events (typhoon, flood, flash flood, drought, heavy rainfall);

Hanoi City living with floods ! (November 2008)

Flooding in An Giang province Source: http://www.sqqp.orq.vn/moitruonqdothi/200813/144808,

More droughtsMore droughts

usap
a nw
fl
UU
V1W
MU
I?
iY1f
lU
iirii
- More abnormal: patterns and directions of storm;- Storms are moving toward southern;- Storm season: moving to the late of years

Sea level increased about 0.2m in the last 50 years
Changes in sea level at Hon Dau oceanographical station

Vti Nani
tniUaI Naffanal CoiniiiiiiiieatiOQ
liii,: Ib UniI, N.I* Ir4...rL CIInMt Cba
Vietnam Initial National Communication (INC) to the UNFCCC in 2003: identified water resources, coastal areas, agriculture, aquaculture, forestry, energy, transport and public health as the most vulnerable to climate change
Vietnam Second National Communication (SNC):emphasizes adaptation and emphasizes adaptation and provides guidance to promote provides guidance to promote Climate Change Adaptation (CCA) Climate Change Adaptation (CCA) measures in Viet Nammeasures in Viet Nam
2.2 Climate change studies2.2 Climate change studies

MINISTRY OF NATURAL RESOURCES ANI) ENV IRONMENT
CLIMATE CHANGE SCENARIOS, SEA LEVEL RISE FOR VIETNAM
Hanoi, 4 April 2009
Climate change, Climate change, sea level rise sea level rise scenarios for scenarios for VietnamVietnam is developed is developed basing on different basing on different emission scenarios: low emission scenarios: low (B1), medium (B2) and (B1), medium (B2) and high (A2, A1FI). high (A2, A1FI).
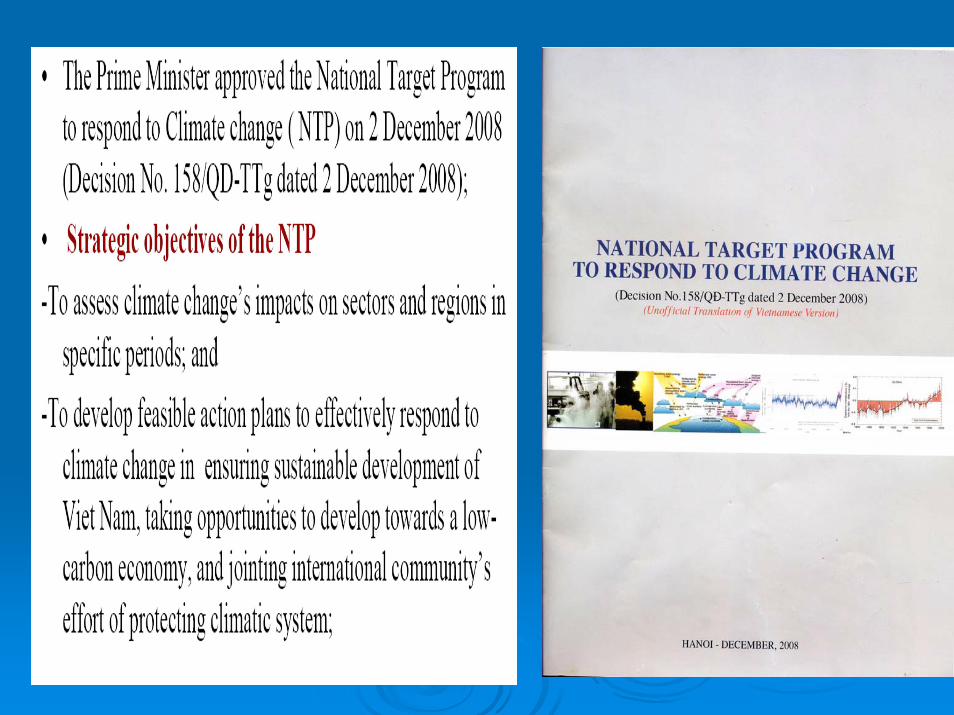
The Prime Minister approved the ationii1 Target Program
to respond to Climate change (YIP) on 2 [)eceniber 2008
(Decision Yo. l8/QD-TTg dated 2 r)eceniber 208);
Stritgk objettivs of the NTP
Io assess climate change's impacts Ofl sectors and regions in
specilic penods and
-To develop feasible action plans to effectively respond to
climate change in ensuring sustailltb Ic development of
Viet Yam. taking opportunities to develop towards a low-
carbon cc onoirmy, and jointing iiiternatioiial community's
eftrt of protecting climatic system:
NATIONAL TARGET PROGRAM TO RESPOND TO CLIMATE CHANGE
(Decision No.1 58/QD-TTg dated 2 December 2008) (Unoff UU(l 110 nIaiion 0/ I'Ie(lt(lflltSt I,1onJ
HANOI - DECEMBER. 200S

X Configure Region
Configure Region: MEKONG_DEC
Resolution: .22 nx: 143 fly: 163
Cancel
Help
Undo Toggle Map Done Undoall
Warmest day tenipecatu.e 4°C)
bt' 2010's I
.i.
4 'I
a
Coolest day temperature It) ±3 I rc
O 'e\1. .b'q' I
r
0,'
2010's
Development of Climate Change Scenario Development of Climate Change Scenario for Vietnam and the Regionfor Vietnam and the Region
Funding: SEA START Implementing: IMHEN
+
CLIMATE CHANGE AND
DISASTER PREPAREDNESS ViehiOm
awnIng Jo hoe with cOma?. change of adapting 100 new reality
(A c000hywpor? c', aVrtyhicwr V Jit. hi &,Wechw,ge)
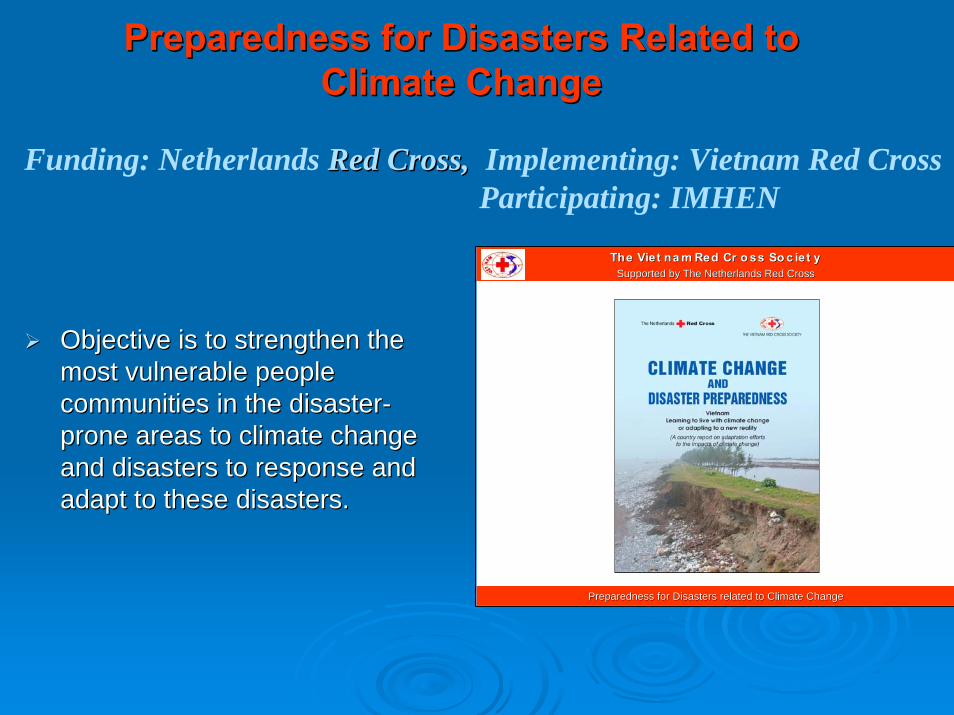
Preparedness for Disasters Related to Preparedness for Disasters Related to Climate ChangeClimate Change
Objective is to strengthen the Objective is to strengthen the most vulnerable people most vulnerable people communities in the disastercommunities in the disaster--prone areas to climate change prone areas to climate change and disasters to response and and disasters to response and adapt to these disasters.adapt to these disasters.
Funding: Netherlands Red Cross, Red Cross, Implementing: Vietnam Red Cross Participating: IMHEN
The Viet na m Red Cr o ss So c iet yThe Viet na m Red Cr o ss So c iet ySupported by The Netherlands Red CrossSupported by The Netherlands Red Cross
Preparedness for Disasters related to Climate ChangePreparedness for Disasters related to Climate Change

a ,4r.od.a4 .qo.5 UI ..6utq DoOtud
P.tTRY OF NATURAL RESOURCES AND ENVIRCFPiT
VIETNAM
NATIONAL STRATEGY STUDY
ON
CLEAN DEVELOPMENT MECHANISM
FINAL REPORT
a&NOu 2USd
Vietnam National Strategy Study on Vietnam National Strategy Study on Clean Development MechanismClean Development Mechanism
Current Current CDMCDM policy status;policy status;GHG abatement potential in GHG abatement potential in Vietnam;Vietnam;CDM market opportunities for CDM market opportunities for Vietnam;Vietnam;Analysis of institutional setAnalysis of institutional set--up and up and institutional requirements;institutional requirements;Implementing CDM: criteria and Implementing CDM: criteria and approval processes;approval processes;Realisation of CDM opportunities in Realisation of CDM opportunities in Vietnam;Vietnam;Summary of VietnamSummary of Vietnam’’s National s National CDM Strategy.CDM Strategy.
Funding: WB Implementing: IMHEN

Asia Least-cost Greenhouse Gas Abatement Strategy
Viet Nam
Asian Developmont Bank Global Enviranmønt F5illty
United Nations Deyelomsnt Programme
Asia Least Asia Least -- Cost Greenhouse Gas Abatement Cost Greenhouse Gas Abatement Strategy (ALGAS) ProjectStrategy (ALGAS) Project
Vietnam is one of the 12 Asian Vietnam is one of the 12 Asian Countries participating in this Countries participating in this UNDP/GEF/ADB project.UNDP/GEF/ADB project.Started in 1995 and completed in Started in 1995 and completed in 1997.1997.Aims to enhance and improve the Aims to enhance and improve the national capacitynational capacity of the participating of the participating countries.countries.Conducting Conducting GHG InventoryGHG Inventory based on based on the IPCC Guidelines for the year 1993.the IPCC Guidelines for the year 1993.Assessing Assessing mitigationmitigation options. options. Developing the Developing the leastleast--costcost GHG GHG abatement strategy and action plan.abatement strategy and action plan.
Funding: UNDP/GEF/ADBUNDP/GEF/ADB Implementing: IMHEN

CLIMATE CHANGE IN ASIA:
VIET NAM
ASIAN DEVELOPMENT BANK
Climate Change in Asia: Vietnam.Climate Change in Asia: Vietnam.
A regional study on Global Environment IssueA regional study on Global Environment Issuefunded by ADB.funded by ADB.Project started in 1992, Report was published Project started in 1992, Report was published by ADB in 1994. by ADB in 1994. Scope includes Scope includes GHG emission inventoryGHG emission inventorybased on 1990 data. based on 1990 data. Provided Provided mitigation optionsmitigation options for energy and for energy and industrial, building, transportation, agricultural, industrial, building, transportation, agricultural, forestry and land use sectors. forestry and land use sectors. Assessment of the impactsAssessment of the impacts on agriculture, on agriculture, monsoon and water resources, coastal zone, monsoon and water resources, coastal zone, forestry, human health, energy system, forestry, human health, energy system, transport and infrastructure. transport and infrastructure. Policy optionsPolicy options to cope with climate change for to cope with climate change for agriculture, water resources, coastal agriculture, water resources, coastal protection, forestry, human health and natural protection, forestry, human health and natural disasters were discussed. disasters were discussed.
Funding: ADB Implementing: IMHEN

OutlineOutline1. Introduction2. Overview on Climate Change Studies in 2. Overview on Climate Change Studies in
VietnamVietnam2.1 Climate change Status2.1 Climate change Status2.2 Climate change studies2.2 Climate change studies
3. Climate Change 3. Climate Change ModellingModelling3.1 Methods for generating the climate change scenarios3.2 MRI/AGCM3.3 PRECIS3.4 MAGICC/SCENGEN 5.3, Statistical Downscaling
4. Climate change Scenario4. Climate change Scenario4.1 Criteria for Choosing Vietnam climate change scenario4.2 Official scenario for Vietnam

(a)
e n-I 22
AAPEGEIOPA2 SM RCa - CC5RINIES - CCSRJNIES2 CGCMI CSIRO Mk2 CSMIM DOE PCM ECHAM S/n-SO ECHAM4/OPYC GFDL_Hls_a - GFDLHSOI Glass - GOALS - HadOM2 HaCMS - IPSL-CM2 MRII MRI2 - Mean
0 80 20 40 60 Years from start of experiment
Precpatoc
ToNnpv
Va MACICC 4.1
friollel for tire 4ssessiiierrt of
Greerri lolIse-ijas Ii chic cr1 Climate C Ir.irrrje N CAR
4s uteri iii the IPCC Tint ri Assessinietit Retrort
Vei 51cm 1.1
Ccmmcejrt ammrl Sciemmtitic Prow ammirrrirro: T.ML.VIrgley. &C.B. Rapem
Desitmi: T.Trl.L. Wrtey. Fri. Sairriori. fri. l4utume, S.C.B. Rarrer
Usem Interlace: Fri. Sairriori. S. frlcGitmtmis
File Edit Rim View SCEHGEN ReadMe Help
74 CG1H 4.1
SCENGEN -I (/oha1 awl Rgio,sa! ( lintate ('Image .Vce,,arh. (,enera1,1r
1CAR
C00ce14 'I Sciergik rvI, ar,,rI.In.r TIlL kM,$e
fl.U.c 1.MI M.fl IA lk*o#. U S,*ne., SI,I1A,ISe
Ve(n),, LI. S,PICkAe, ZOOj
[]
- Global Climate Models
- Assemble
- Dynamic Models
- Statistical Dowscaling- MAGICC/SCENGEN- Graphics- inter- extrapolations
100°E 102°E 104°E 106°E 108°E 110°E 112°E 114°E
6°
8°
10
12
14
16
18
20
22
24
N
N
°N
°N
°N
°N
°N
°N
°N
°NTrung quèc
C̈ m pu chia
Th¸ i Lan
Q§ . Hoµng Sa
L µ o
Q§ . Tr- êng Sa
3.1 How to generate the regional climate change scenarios3.1 How to generate the regional climate change scenarios

Statistical Downscaling: Perfect Prognosis (PP), Model Output Statistics (MOS)
Xác diflh ham chuyén (Transfer function)
HChon liàni c1iun
Perfect Prognosis (PP)
SO Iiu Reanalyse theo Iu'âI (1961-1990)
S lieu quan trc dia phiio'ng (1961-1990)
Kjch ban biën dOl khi hu theo lri toân câu trong th k 21 (Co th str ding trrc tip hoãc thông quan
phân rnëm MAGICC/SCENG E N)
Mode! Output Statistics (MOS)
So lieu mô phOng cüa mô hinh (ECHAM.
HadCM....) 19614990
Kich ban bién dôi khi hãu cho khu vuc nhó

Earth Simulator (ES)
The Edith Simulator (ES), a super-computer, began operation in March 2002. The ES is one of the three essential
elements for projecting or predicting global change according to recommendations made In 1996 by an expert cominutlee of the Science and Technology Agency (now merged into MEXT), the other two being procesn studies
by modeling and observation systems.
The ES was ranked hrst In the world among the Top 500' supercomputers from 2002 to 2004, during which time substantial experiments on climate change projection were conducted. The research results contributed to the IPCC's AR4.The fastest computation made bythe ES was 35.86 Teraflops (102 calculations per second). Even today, the ES might be the fastest supercomputeramong those mainly available forEarth sciences.
The ES allowed the Kyosel Project to make substantial contributions to the IPCC5 AR4. using this supercomputer system, the KAKUSHIN Program is expected to make inmpomtaut contributions to the 1PCCs Fifth Assessnient Report (AR5I.
10
3.2 MRI/AGCM 3.2 MRI/AGCM
MRI/AGCM MRI/AGCM →→Japan Japan Meteorology Research InstituteMeteorology Research Institute--Atmospheric Global Circulation Model:Atmospheric Global Circulation Model:-- Resolutions: 20 km, 60 km, 120 km, 180kmResolutions: 20 km, 60 km, 120 km, 180km-- Scenario: A1BScenario: A1B-- Computer: Computer: -- Earth Simulator Earth Simulator ––ESES-- MRIMRI--AGCM AGCM →→IPCC AR4 (2007)IPCC AR4 (2007)-- MRIMRI--AGCM AGCM →→IPCC AR5 (2014)IPCC AR5 (2014)

0 I I
2 3 4 78 1onth
1 I I
9 10 11 12
Preciptcon (mm/day) Lon=105.8 Lat=21.02 HANOI Back=OBS PCP 1DD 8Iue=Present SPQA Red =Future SFOA
2
0 i I I I I
1 2 .3 4- 5 6 7 8 10 11 12 K4onth
PrecpItaiion (mm/day) Lon=107.08 Lat=1O.37 VUNGTAU Black=OBS GPCF 1DD 8Iue=Presnt SPOA Red =Future SFOA
20 18
1 14
12 13
E8 E
4- 2
0 2345678 10 11 12
Month
Red =Fu!ure SF0A
Precpitation (mm/day) Lon=109.2 Lcit=12.2 NHATRANG BIack=OB GPCP 1DD 9IuPrsrit SPOA
25 1) a)
20
Surface air lemperature Lon=105.8 Lat=21.02 Black=OBS JRA 2.5de'i 9Iu=Prserit SPOA
35
30
15
10
(C) Hanoi
Ped=Future SFO
67 onth
10 11 12
Temperature and precipitation simulated by MRI/AGCMTemperature and precipitation simulated by MRI/AGCM

16
14
14
II
Temperature DJF FP (Deg. C)
I I I I I
2
I
Is
Temperature JJA FF (Deq.C)
I I I I I
2
a
-a.
000 050 100 115E
16
14
14
II
Rainfall DJF (FF)/P (unit 74
50
40
30
20
0
Il 20
16
14
14
II
Rainfall JJA FP (unit %)
50
40
30
20
0
Il 20
2O
E IQQE 105E I IQE I IE
L
Differences between present and the end of 21Differences between present and the end of 21stst centurycentury

flie Region tools Extras Analysis Tools Monitor Help
Met Office
New Region
vielnam2 Resolubon:.22
nic 101 fl1 112
I Conhigure Region
All Regions
PRECIS Uersion I?
Expenment name: tiiefriain24 1 2O_ I 979_0 1
Expeliment descnphion: ECHA td4_ B2
RUNIO: abcak
Scenano
ECHAhI4:5RE5 62
echjd No 5uIphur
Run PRECI5
Slop PRECIS
- Penod
1 Ii- Slart 197911211 Run lor2l '.eam
o months 0 Dei,s
Dia.gno: Iics
Dail surce and upperarda1a
plus clima.te meaning
Oulput VThLt pp
PRECIS (Providing Regional PRECIS (Providing Regional Climates for Impacts Climates for Impacts Studies): developed by Studies): developed by Hadley center, UK;Hadley center, UK;PRECIS: Dynamical PRECIS: Dynamical Downscaling For generating Downscaling For generating regional climate change regional climate change scenario;scenario;Simple interface with detail Simple interface with detail manual.manual.Present and future simulation Present and future simulation under: A2, B2, A1B.under: A2, B2, A1B.
3.3 PRECIS

41AL3 WHAJ\14
I
PRECIS POSITION IN THE PROGRESS OF CLIMATE CHANGE MODELLING

:30H
28H
24N
20N
ION
ON
90E gE 94E gE 9E 100E Id2E Id4E IOOE lOBE hOE
300
2N -
2-4-N
2N -
ION-
8N
6N
90E 9E 94E 9E 9E I OOE 102E IO-4E IOOE 106E
SOW
28W
24W
20W
'OW
12W
iON
SW
5W
0E 92E 94E gSE 98E IOOE IOZE 104E lOSE lOBE hOC
4N
20N
law
12W
ION C
6N
9E OiE 04E OE 9IE IOOE Id2E 1040 1000 IdOE 1100
30W
28W
24N
20N
iON
ON
90E 92E 94E 96E OSE 100E 102E 104E lOSE lOBE hOE
28W
24W
22W -
20W
16W -
14W -
ION
SW -
6W -
90E 92E 94E 06E 98E IOOE 102E 104E lO$E lOBE hOE
SON
288
248
20N
ION
ON
90E 92E 94E 96E WOE 100E 102E 104E lOSE lOBE hOE
304-
284- :p 2-I-N -
228 -
208 -
108 -
14W -
12W
ION -
ON
0
0fl2 o?c mE
1980-1999 2010-2019
2020-2029Temperature Simulated by Precis (A2)
2030-2039 2040-2049 2050-2059
2060-2069 2070-2079 2080-2089

03E 96E 90E 102E 105E beE IIIE 114E 117E 120E 03E 96E 90E 102E 105E beE IIIE 114E 117E 120E
27N
E 102E WOE IOOE
03E MOE MOE 102E WOE IOME IIIE 114E 117E 120E 03E MOE MOE 102E WOE IOME IIIE 114E 117E 120E g3FqaFg F
03E 96E 90E 102E 105E beE bilE 114E 117E 120E 03E 96E 90E 102E 105E beE bilE 114E 117E 120E 03E 96E 90E 102E 105E beE bilE 114E 117E 120E
Temperature Simulated by Precis (B2)2010-2019 2020-2029 2030-2039
2040-2049 2050-2059 2060-2069
2070-2079 2080-2089 2090-2099

0
90E 92E 94E E 96E ICOE 102E 104E IG6E 106E hOE
30N
28N
26N
24N
22N -
20N
1 8N
I 5N
1 4N
1 ZN
ION
8N
6N
90E 92E 94E 96E 1E 102E 104E 1O&E 1OE hOE
30N
28N -
26N
24N-
22N -
2UN
1 SN -
I 6N -
1 4N-
1211-
ION-
811-
6N -
90E 2E 4E -E E 1!.E 1*E 14E lOE 1E hOE
30N
6N
90E E 4E uE E I E I E 1 14E 1 JE hOE
28N
26N-
2-I-N -
22N
20N -
18N -
16N -
1 -4-N -
12N
ION -
8N -
]901 390k -I!11 3O1 3001 396 396 3$-6 3?6 306
- N9
- N9
- NOl
Nt I
N8
IOE 30W
28W
26W -
24W
22W
20N
18W
16W
14W -
12W
ION
8W
6N
9ÔE E -4E 9E 9E IOOE Id2E ld4E ld6E I0E hOE
Temperature differences between simulation and baseline (1980-1999) (A2)
2010-2019 2020-2029 2030-2039
2060-20692040-2049 2050-2059

2441
22 N
20N
16N
1 6N
14N
1211
iON
8N 1O'E1O1E1O-2E:3E1O4E1C5E1EiC)E1O8EI.9Ei10E
Temperature differences between simulation and baseline (1980-1999) (A2)
2090-2099
0C
28N
24N
20N
iON
a
9ÔE 1 OOE ithE 104E lOSE lOBE 11 OE
3011 3901 3001 3*01 3101 3001 396 306 3*6 316 306 NO
NO I
NOl
NOZ :::
24N
20N -
iON -
ON -
4.
OOE 92E 94E OAE 9AE 100E ld2E ld4E lOSE lOSE hOE 30W
28W
26W
24W
22W
20N -
18W -
I 6W
I 4W -
12W -
iON -
3W
6N
9ÔE 9±E -4E 9WE OWE ICOE 102E Id4E lONE lOWE hOE
30N
28N
26N
2-4-N
22N
20N
1 6N
1 4N
1 ZN
I ON
aN
6N
90E 92E 94E 96E 96E 1COE 102E 104E 1OE 1OE hOE
30N
2$N
2N
2-I-N
22N
20N
iNN
1 NM
1-4-N
I 2N
I ON
6N 12
E 94E E 9E ICOE 102E ld4E ld6E lO&E hOE
::i 24-N -
22N -
20-
iON -
1 -4-N -
iON -
ON-
90E 92E 94E 96E 98E 100E VOlE 104E lOSE lOSE hOE
28N
ZON
24N
ZON
1 SN
1 ZN
ION
5N
goE iE gE E 9E IOOE Id2E 104E IdE 106E hOE
28N
24N
22W
20W -
15W -
14W -
1 ON
ON
OOE 92E 94E 96E WOE WOE 102E 104E lOSE lOBE 110
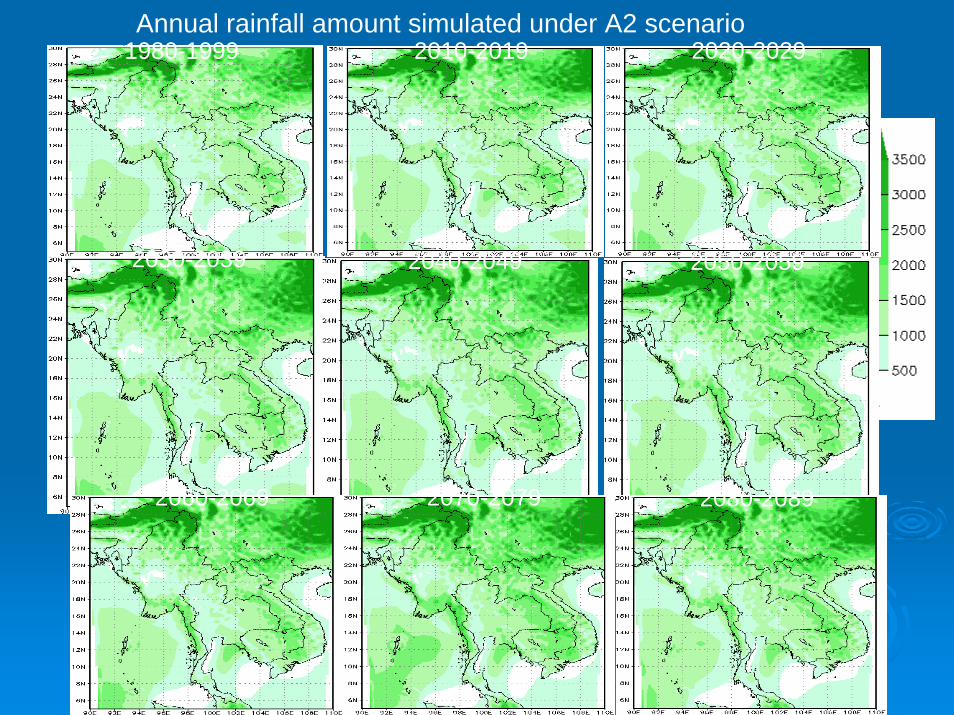
Annual rainfall amount simulated under A2 scenario1980-1999 2010-2019 2020-2029
2030-2039 2040-2049 2050-2059
2060-2069 2070-2079 2080-2089
iC'JE1O1E1O2E1O3E1O4(1O5E1O6C1O7E1O8ElO9E11(E
24N
n1
2O
16
16 P
1 4
12P -
10
iOGL1QElO2E1O3E1O4E1O5E1O6ElO7E1O8El9E1OE
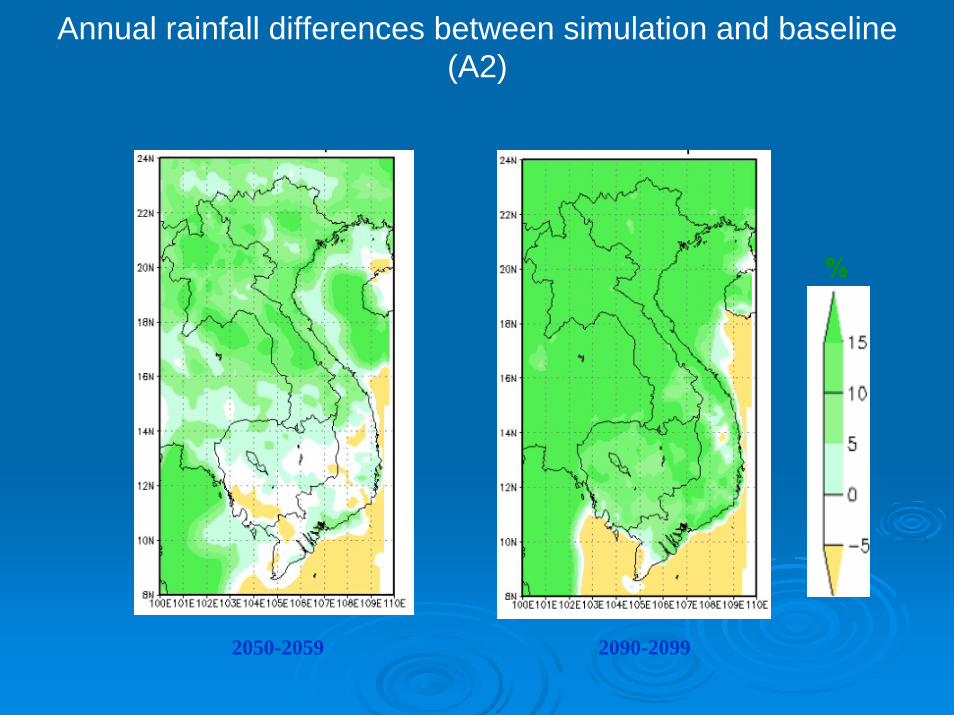
2050-2059 2090-2099
%
Annual rainfall differences between simulation and baseline (A2)

33N -
27N
2-I-N
21 N
18N
1 5N
1 2N
9N
8N
- t %,_
P-L -4f
4 . I
.
93E 96E PL 102E 105E 106E II1E 114E 117E 12:::L
3500
3000
2500
2000
500
000
500
6E 99E 1JE 1O5E 1c8E lIE 114E li7E l2O
3500
3000
2500
2000
500
000
500
Rainfall simulation (B2)
2050’s 2090’s

7 MAGICC 5.3
File Etht Run View SCEN6EN
Molel for the Assessment of
Greenhouse-gas lmlucel Climate Change
NCAR
As used in the IPCC Third Assessment Report
Version 5.3
Concept and Scientific Programming: T.M.L. Wigley, S.C.[I. Raper
Des4Jn: T.M.L. WiUley, M. Salmon, M. Hulme, S.C.B. Raper
User ln*erIace: M. Salmon. S. McGinnis
Help
L1H
74 SCENGEN 5.3 12
SCENGEN A Global and Regional Climate Change Scenario Generator
Concept nd Scientific Projrmminj: T.M.L Wkjley
Design: T.M.L. Wigley. M. Hulme. M. Salmon. S. McGinnis
User Inteiface: S. McGinnis. M. Salmon
Dt Set Development: C. Doutriaux. ft Knutti. S. Scherrer
Other Contributeis: 0. Brown, 1. Jiang. P.D. Jones, M. New. B.D. Santer
Development Suppo[te(1 bj The U.S. Environmental Protection Agency
Version 5.3. May 2008
NCAR
OK
Sflt Comu1thghc.
3.4 MAGICC/SCENGEN 5.3, Statistical Downscaling3.4 MAGICC/SCENGEN 5.3, Statistical DownscalingMAGICC/SCENGEN 5.3/2007: already be updated AR4 MAGICC/SCENGEN 5.3/2007: already be updated AR4
Advantages than Advantages than Magicc/ScengenMagicc/Scengen 4.1:4.1:-- Resolution 2,5Resolution 2,5oox2,5x2,5oo
-- AOGCMsAOGCMs database: more and flexible for database: more and flexible for ScengenScengen

OutlineOutline1. Introduction2. Overview on Climate Change Studies in 2. Overview on Climate Change Studies in
VietnamVietnam2.1 Climate change Status2.1 Climate change Status2.2 Climate change studies2.2 Climate change studies
3. Climate Change 3. Climate Change ModellingModelling3.1 Methods for generating the climate change scenarios3.2 MRI/AGCM3.3 PRECIS3.4 MAGICC/SCENGEN 5.3, Statistical Downscaling
4. Climate change Scenario4. Climate change Scenario4.1 Criteria for Choosing Vietnam climate change scenario4.2 Official scenario for Vietnam

4.1 Criteria for Choosing Vietnam climate change 4.1 Criteria for Choosing Vietnam climate change scenarioscenario
1)1) Plausibility of global climate change scenariosPlausibility of global climate change scenarios2)2) Level of details of climate change scenarios: climatic Level of details of climate change scenarios: climatic
regionsregions3)3) Inheritability: Vietnam INC, SNCInheritability: Vietnam INC, SNC4)4) UpUp--toto--date: AR4date: AR4--200720075)5) Local appropriateness: agreement with the local Local appropriateness: agreement with the local
evolutionsevolutions6)6) Completeness of scenarios: can include high, medium, Completeness of scenarios: can include high, medium,
low scenarios low scenarios 7)7) Possibility of self updating.Possibility of self updating.

4.2 Official scenario for Vietnam4.2 Official scenario for Vietnam
a) a) TemperatureTemperature::TTwinterwinter increase > increase > TTsummersummer IncreaseIncrease
TTNorthernNorthern increase > increase > TTSouthernSouthern IncreaseIncrease

B! (Aundic Reaion
-
I)edes ni the 21 Ceiituiv 2020 2030 2040 2060 2070 20II' 20)1' 2100
Nort1iWt CHI 07 11 12 14 1. 1r l 1,7
NorthlEart CH 07 10 1 14 1, 1 1 1.1
NorthDe1tt 0.5 0.7 0.9 1.2 1.4 1. 1.5 1. 1.6
North Central 1 6 0 8 11 1 4 1.6 1. I I 1 9
SouthOentral u4 0.6 u;; u.9 1.0 1,2 1.2 1.2 1.2
CentialHighLnds 0.3 0.5 0± 0.8 0.9 1.(' 1.) 1.1 1.1
South 04 06 08 10 11 1.3 i 14 14
A2
(Aun7dlc Reaion -
I)edes ni the 21 Centuiv 2020 2030 2040 0'1 2060 2070 2081' 2090 2100
North Wt 0 0 8 1 '. 1 3 1.7 2.0 2.4 2 3.3
North East O 07 10 13 1.6 1.9 2H 2 3.2
North De1tt 0.5 0.7 1.0 1 3 1.6 1.8 2.3 2. 3.1
North Central '6 0 9 1 1 1.8 2.2 2, - 1 3.6
South Central 0.4 0.5 0.5 1 U 1.2 1.5 IH .1 2.4
CentialHighLnds 0.3 0.5 0.7 0.8 1.0 1. 1.5 1.8 2.1
South 04 06 08 10 1.3 1.6 1 2=; 2.6
B2
(1undic Reaion -
I)edes ni the 21 Ceiituiv 2020 2030 2040 0'1 2060 2070 2081] 2091' 2100
Nort1iWt C' 07 11 13 1.6 1.9 2.1 24 2.6
NorthlEart C' 07 10 12 1.6 1.8 2.1 2 25 North De1tt 0.5 0.7 0.9 1.2 1.5 1.8 2.'II 2.2 2.4
North Central I 0 8 11 1 1.8 2.1 2.4 2.6 2.8
SouthOentral U4 0.5 u;; u.9 1.2 1.4 1. 1.8 1.9
CentialHighL.nds 0.3 0.5 OX 0.8 1.0 1.2 1.4 1.5 1.6
South 0 4 0 6 0 8 1 0 1.3 1.6 1.8 1.9 2.0
Annual Mean Temperature Changes (Annual Mean Temperature Changes (ooCC) relative to period from 1980) relative to period from 1980--1999 for Scenarios: B1, B2, A21999 for Scenarios: B1, B2, A2

b) b) Rainfall:Rainfall in dry season can decrease in most Rainfall in dry season can decrease in most
climate zones, especially in Southern climate zones, especially in Southern climate zones. Rainfall in the rainy season climate zones. Rainfall in the rainy season and the total annual rainfall can increase and the total annual rainfall can increase in all climate zones.in all climate zones.

ZOUS pI'1Od 2020 22L' 214ü 2051' 2060 20711 2080 2090 2!u[I
11 1.6 23 2.9 12 3,5 16 3.7 3.7
North West Mar-May -1.1 -1.6 -2.3 -2.8 -3.0 -3.4 -3.6 -3.7 -3.7
Jun-Aug 2.4 3.5 4.8 5.9 6.7 7.9 7.6 7.8 7.8
Sep-Nov 0.4 0.6 0.9 1.1 1.2 1,3 1.4 1.4 1.4
Dec-Feb 0.8 1.1 1.6 1.9 2.1 2.9 2.5 2.5 2.5
Mr-May -0.9 -1.3 -1.8 -2.2 -2.4 -2.7 -2.8 -2.9 -2.9 North East
Jun-Aug 2.5 3.7 5.1 6.3 7.1 7.9 8.1 8.3 8.3
Sep-Nov I'S 1.9 12 1.5 17 1.9 1 9 2.12 2 U
Dec-Fr1' 0.9 1.2 1.8 2.1 2.4 2.6 2.8 2.8 2.8
Mr-May -1.3 -2.2' -2.7 -3.4 -3.8 -4.1 -4.3 4.5 -4.5
North Delta j 2.9 4.4 6.1 7.5 8.5 9.2 9.7 9.9 9.9
Sep-Nov 0.9 1.4 1.9 2.4 2.7 2. 3.1 3.5 3.1
ri:-F1:i Cl 6 11.9 12 1.5 1 7 2.1 1.9 2.0 2.0
II -I4ay -1.9 -2.9 -4 9 -4.9 -5.6 -6.12 -6.3 -6.5 -6.5 North
Central Jun-Aug 2.9 4.2 5.9 7.2 8.2 8.9 9.4 9.5 9.5
Sep-Nov 1.7 2.5 3.5 4.2 4.8 5.2 5.5 6.7 5.6
Bi (hun te 1\ Ioiitli [)ec des in the 2 J C itiiry
B2
Chin ate \1oiit}i I)e ades iii tile 21 Ceiitiiiv zones pe110 2020 203J 2040 050 2060 2070 2080 2090 2100
I'-Feb 1 1 I.f 2.3 16 4.2 4.8 5.2 5.6 North Mar-May -1.1 -1.6 -2.3 -2,9 -3.5 -4.1 -4.6 -5.2 -5.6 West
Jun-Aug 2.4 3.5 4.8 6.2 7.6 8.8 10.0 11.0 11.9
Sep-Nov 0.4 'ILH 0.9 1.1 14 1. 1.8 2.0 2.2
T'i:-Feb 0.8 1.1 1.6 2.5 2.4 2.8 3.2 3.5
-3,9
3,
-4,4 Mar-i1a7 -0.9 -1.3 -1.8 -2.3 -2.8 -3.3 -3.7 North East
Jun-Aug 2.5 3.7 5.1 6.6 8.1 9.4 10.6 11.7 12.7
Sep-Nov 0.6 0.5 1 2 1.6 1.9 2.2 2.5 2.8 3.0
Dec-Feb 0.9 Is 1.8 2.3 2.7 3.2 3.6 3.9 4.3
Mar-May -1.3 -2.0 -2.7 -3.6 43 -5.0 -5.7 -6.2 -6.8
Jun-Aug 2.9 4.4 6.1 7.9 9.6 11.1 12.6 13,915.1 Sep-Nov 0.9 1.4 1.9 2.5 3.1 3.5 4.0 4.4 4.8 ]1'ri:-Feb 0.6 0.1' 1.2 1.6 1.9 2.2 2.5 2.8 3.0
Mar-May -1.9 -2.9 -4.0 -5.2 -6.3 -7.3 -8.3 -9.1 -9.9
Jun-Aug 2.9 4.2 5.9 7.6 9.3 10.8 12.2 13.4 14.6
1.7 2.5 3.5 4.5 54 6.1: 7.1 7.8 .5
Lec-Feb -2.0 -2.5 -4.2 -5.4 -0.5 -7.6 -8.6 -9.5 -10.2 South Mar-May -2.8 41 -5.7 -7.4 -9.0 -10.5 -11.9 -13.1 -14.2
A2
2040
2.2
-2.1
4.6
0.8
14
-1.7
4,9
1.2
1.6
-2.6
5.8
1.9
'11
-3.3
5.6
3.3
-s Ii:
-5,5
1.5
4.6
-5.7
I) e a des in the 21 C en tiny 1055 2060 2071' 2080 90 2100
2.9 3.6 4.4 5.3 6.2 7.2
-2.8 -3.5 -4.3 -5.2 -6.1 -7.1
5.9 7.5 9.3 11.0 12.2 15.1
11 14 17 2.1 2.4 2.8
1.9 2.4 3.111 3.5 4.2 4.9
-2.2 -2.8 -3.4 41 -4.9 -5.6
6.3 7.9 9.8 11.8 13.7 16.1
1.5 1.9 2.4 2.8 3,3 3.8
2.0 2.7 3.4 4.0 4.7 5.5
-3.4 43 -5.3 -6.3 .74 -8.6
7.5 9.4 11.7 14.0 16.3 19.1
2.4 3.0 3.6 4.5 5.3 6.1
1.5 1 9 2.4 2.8 3.4 3.8
-4.9 -6.2 -7.7 -9.2 -10.9 -12.6
7.3 9.1 11.3 13.6 15.9 18.5
4.3 14 i 7.9 9.4 10.8
-5.3 -:.3 -8.0 -9.6 -10.5 -13.0
-7.1 -8.9 -11.0 -13.2 -15.6 -18.1
1.9 2.5 3.1 3.7 4.3 5.0
6.1 7.6 9.1: 11.3 13.3 15.3
-7.4 -9.2 -11.5 -13.8 -15.7 -18.5
Chin ate zones
1don th peiios 2020 2031.'
f'-Feb 1.2 17 North Mar-May -1.2 -1.6 West
Jun-Aug 2.5 3.5
Sep-Nov 0.5
T'ri: -Feb 0.8 1.1
Mar-May -0.9 -1,3 North East
Jii n-Aug 2.7 37
Sep-Nov 0.5
Dec-Feb 0.9 1: Mr -ilay -1.4 -2.0
North Delta Jun-Aug 3.1 41
Sep-Nov 1.0 1.4
]1'': -Feb 0.6 rh.
Mar-May -2.1 -2.9 North Centr d
Ju n-Aug 3.0 4.6
Sep-Nov 15 2.1
I' -c-Feb -2.2 3i.i
South Mr -i1a -3.0 -4.2 Centrd
Jii n-Aug 0.8 1.2
Sep-Nov 2.5 3.5
D cc-Feb -3.1 44
Seasonal Seasonal Rainfall changeRainfall changess (%) in Vietnam climate zones relative to the (%) in Vietnam climate zones relative to the period of 1980period of 1980--1999, 1999, forfor scenarioscenarios: B1, s: B1, B2B2, A2, A2

B!
Chinitie Reioii -
I)e ades in the 21 (I1enttii v
2u20 2030 2040 200 2060 200 2080 2090 2100
Noi'th West 1 4 2.1 3.0 3 6 4.1 4 4 4 6 4.8 4.8 NiiithEast 14 2.1 30 36 4.1 4 4.7 48 4.8 Npith I:elta 1.6 2.3 3.2 3.9 4.5 48 5.1 5.2 5.2 Noith Cential 1 2.2 3.1 38 43 47 4.9 U .O
South Ceiitial 0 7 1 0 1.3 1 6 1.8 2 0 2 1 2.2 2.2 Central Highlands 0 3 0.4 0.5 0.7 0 - 0.9 0.9 1.0 1.0 South 0 3 0 4 0.6 0.7 0 8 0.9 1 0 1,0 1 iS)
B2
C1rniitic Region Decades in the 2.1 Century
2020 2030 2040 2050 2060 2070 2080 2090 2100
North West 1.4 2.1 3.0 3.8 4.6 5.4 6.1 6.T 7.4
North East 1.4 2.1 3.0 3.8 4.7 5.4 6.1 6.8 7.3
North Delta. 1.6 2.3 3.2 4.1 5.0 5.9 6.6 7.3 7.9
North Centra.l 1.5 2.2 3.1 4.0 4.9 5.7 6.4 7.1 7.7 South Centra.! 0.7 1.0 1.3 1.7 2.1 2.4 2.7 3.0 3.2
efltI11 High1and
0.3 0.4 0.5 0.7 0.9 1.0 1.2 1.3 1.4
South 0.3 0.4 0.6 0.8 1.0 1.1 1.2 1.4 1.5
A2
Chin at Reioii I)eades ill the 21 (Z1entiuv
- 2u20 2030 2040 200 2060 2070 2080 2090 2100
North West 1.6 2.1 2.8 3.7 4.5 5.6 6.8 8.0' 9.3
1. 22 28 28 46 5 68 8.0 93 Noith Lit- I 6 2 3 3.0 38 5 (J 6 1 7.4 8.7 10.1
Noi th C enti al 1.8 2.3 3.0 3.7 4.8 5.9 1.1 8.4 9.7
South CetraI 0.7 10 1 2 1.7 2 1 2 5 30 3.6 4.1
Centi ai Hih1aiids 0 3 'II 4 0.5 0.7 I) 9 1.1 1.3 1.5 1.8 South 0.3 04 0.6 0.7 1.0 1.2 1.4 1.6 1.9
Annual Rainfall Changes (%) relative to period of 1980Annual Rainfall Changes (%) relative to period of 1980--19991999for scenarios: B1, B2, A2for scenarios: B1, B2, A2
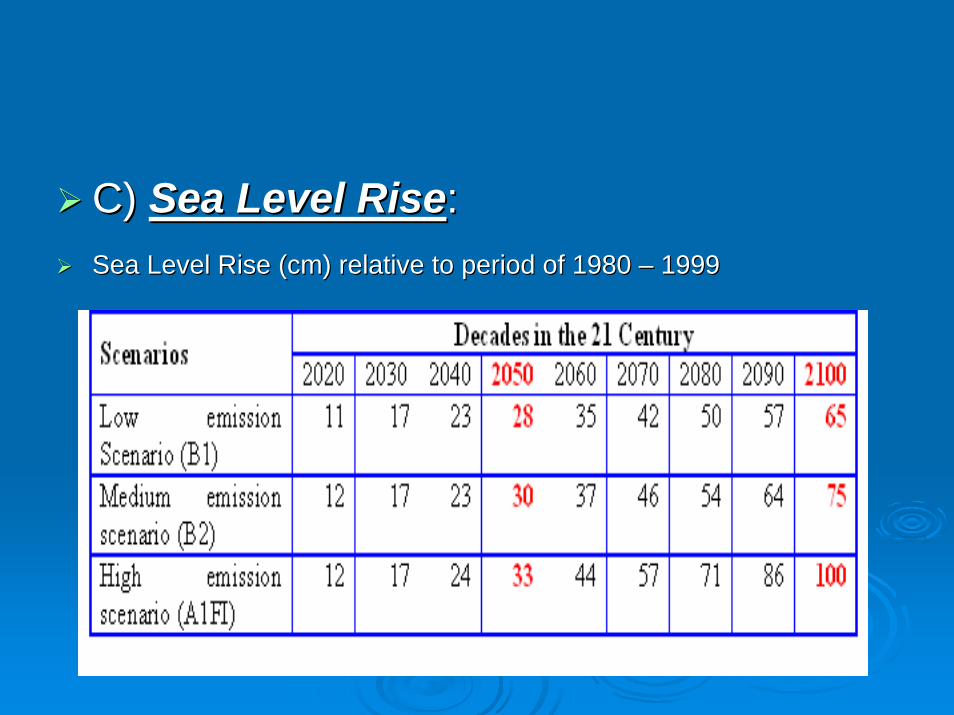
I}Ies i t1 21 (et ry
2020 2030 2040 2000 2060 2070 2010 2090 2199
Lv rmiior Scenario (El)
I I 17 23 20 35 42 50 57 65
Medium emiaaion
scenario B2)
12 17 23 30 37 46 54 64
High emission
scenario (AIFI)
12 17 24 33 44 57 71 26 199
C) C) Sea Level RiseSea Level Rise::Sea Level Rise (cm) relative to period of 1980 Sea Level Rise (cm) relative to period of 1980 –– 19991999

Acknowledgment:Acknowledgment:IMHEN, IMHEN, MoNREMoNRE, Tran , Tran ThucThuc, Nguyen Van , Nguyen Van ThangThang, Tran Hong Thai, Hoang , Tran Hong Thai, Hoang DucDucCuongCuong, Le Thanh Sang, Nguyen , Le Thanh Sang, Nguyen MongMong CuongCuong..
Contact: Contact: [email protected]@vkttv.edu.vn
Thanks for your attention!Thanks for your attention!