climate change: how did we get here and what do we do now?
DESCRIPTION
Climate Change: How did we get here and what do we do now?. Eugene S. Takle, PhD, CCM Professor of Atmospheric Science Department of Geological and Atmospheric Sciences Professor of Agricultural Meteorology Department of Agronomy Director, Climate Science Initiative Iowa State University - PowerPoint PPT PresentationTRANSCRIPT
PROJECT TO INTERCOMPARE REGIONAL CLIMATE SIMULATIONS
Climate Change: How did we get here and what do we
do now?Eugene S. Takle, PhD, CCM
Professor of Atmospheric Science
Department of Geological and Atmospheric Sciences
Professor of Agricultural Meteorology
Department of Agronomy
Director, Climate Science Initiative
Iowa State University
Ames, Iowa 50011
Noon Rotary Club, Ames, IA 28, July 2008
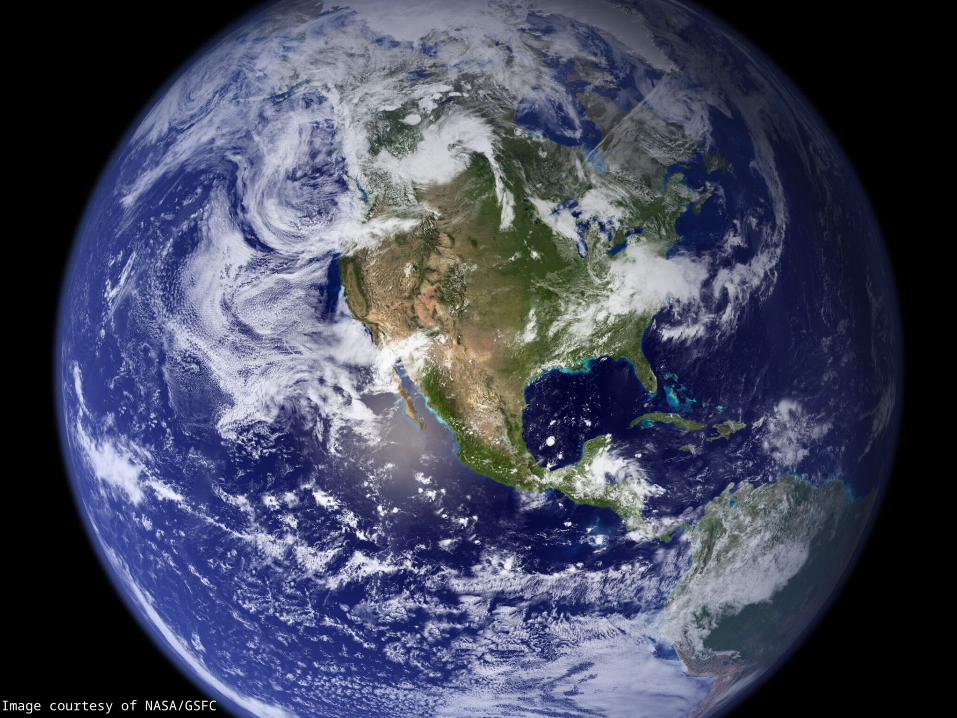
Image courtesy of NASA/GSFC
PROJECT TO INTERCOMPARE REGIONAL CLIMATE SIMULATIONS
Outline
Comparison of natural variability of climate and human induced climate change
Projections of future climate change Impact of climate change on “regions suitable for
rain-fed agriculture”, including the US Midwest Climate change for Iowa and the Midwest:
adaptation strategy
Except where noted as personal views or from the Iowa Environmental Mesonet, all materials presented herein are from peer-reviewed scientific reports
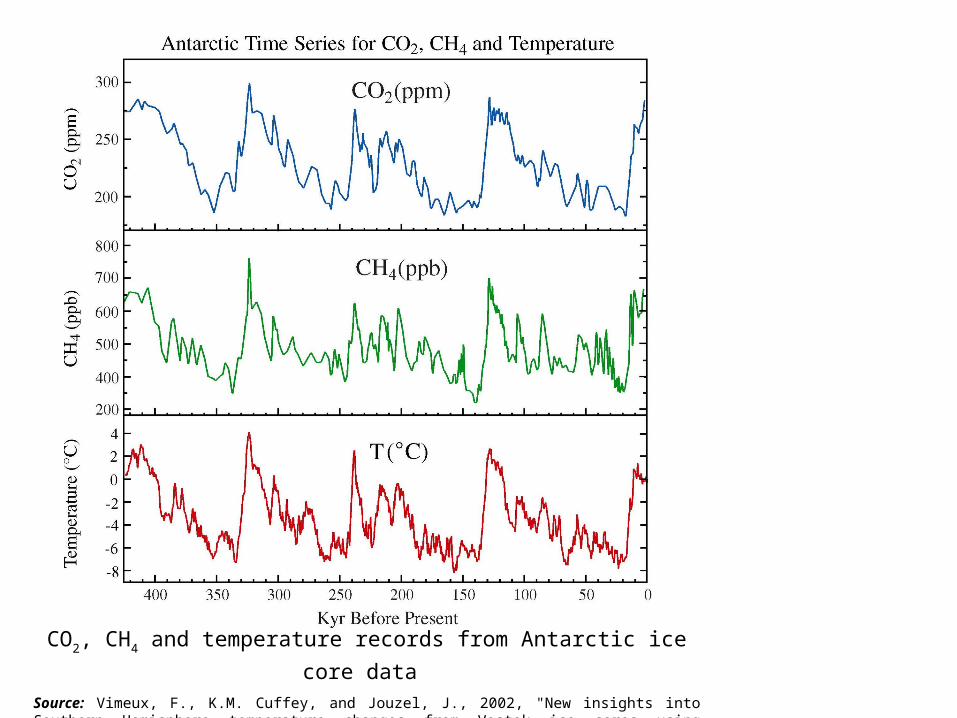
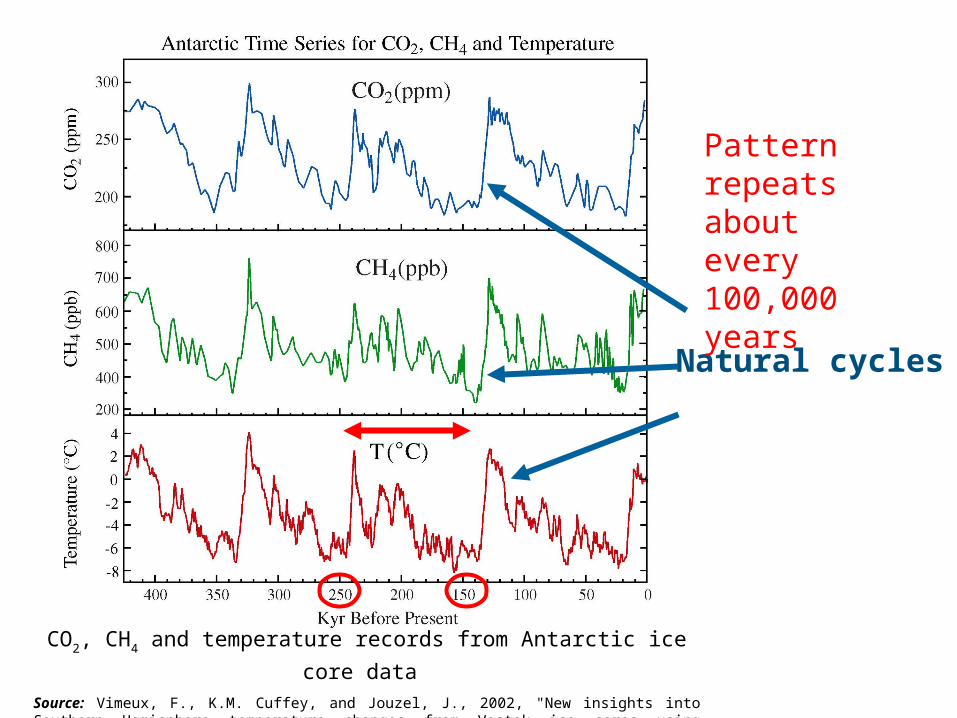
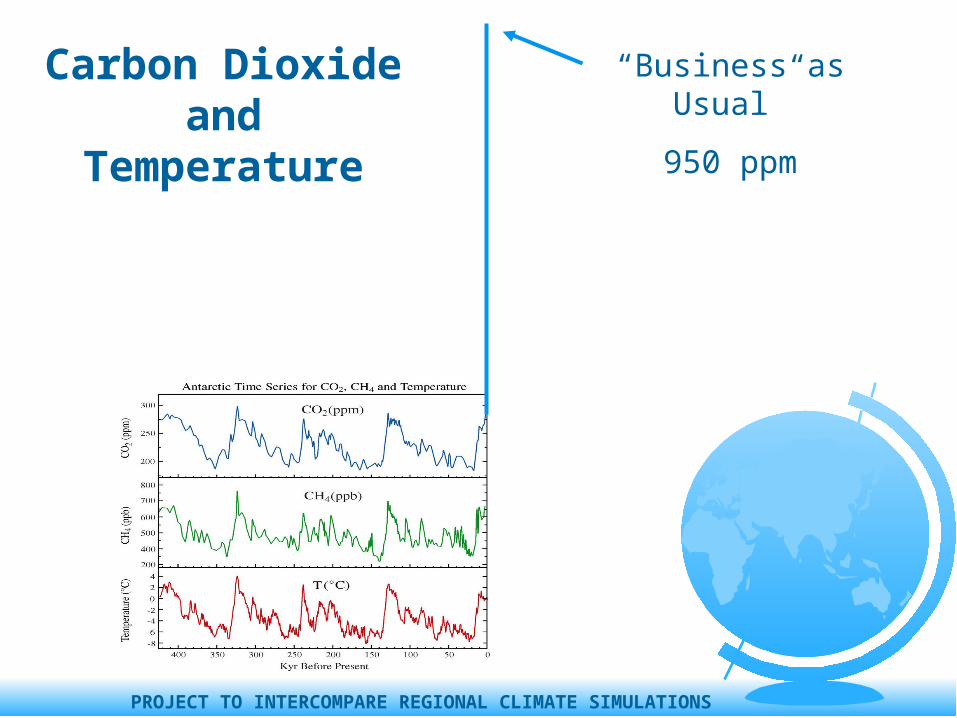
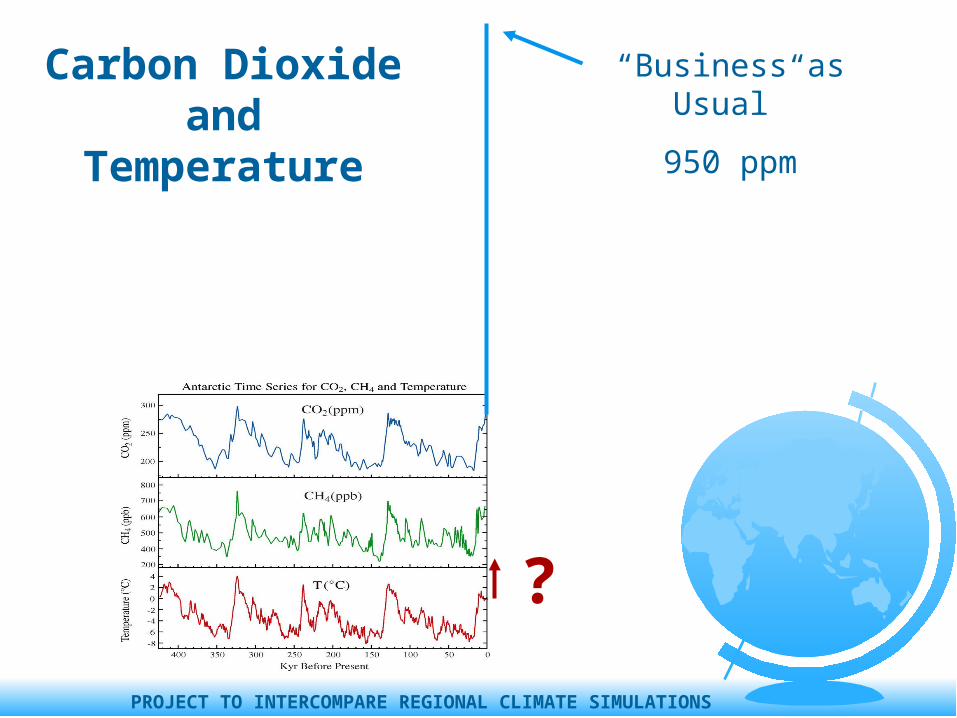
CO2, CH4 and temperature records from Antarctic ice core data Source: Vimeux, F., K.M. Cuffey, and Jouzel, J., 2002, "New insights into Southern Hemisphere temperature changes from Vostok ice cores using deuterium excess correction", Earth and Planetary Science Letters, 203, 829-843.
CO2, CH4 and temperature records from Antarctic ice core data Source: Vimeux, F., K.M. Cuffey, and Jouzel, J., 2002, "New insights into Southern Hemisphere temperature changes from Vostok ice cores using deuterium excess correction", Earth and Planetary Science Letters, 203, 829-843.
Natural cycles
Pattern repeats about every 100,000 years
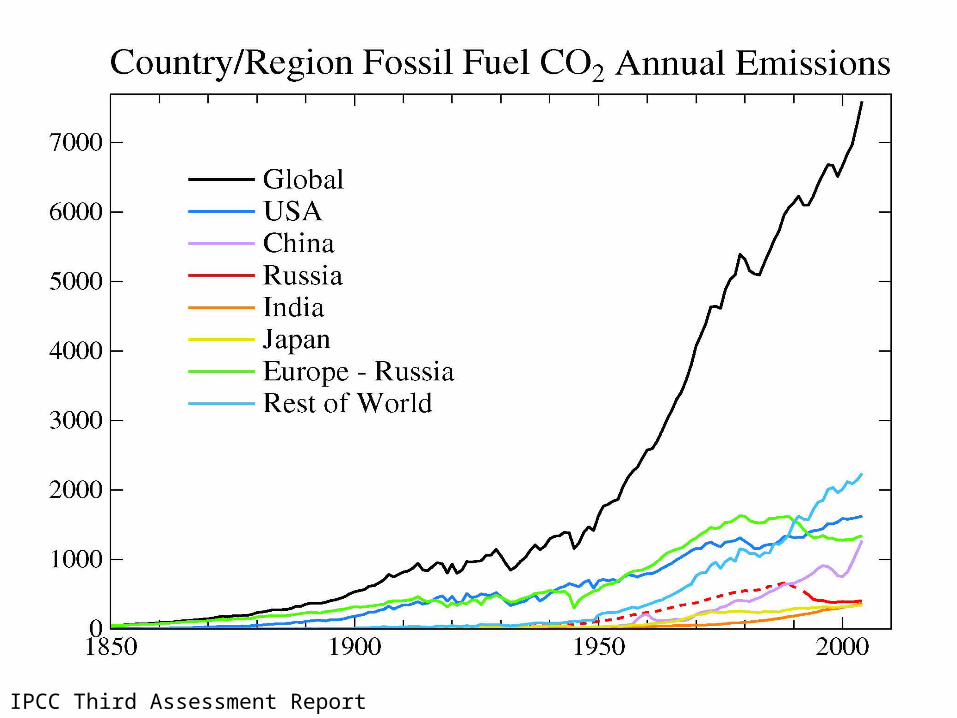
IPCC Third Assessment Report
PROJECT TO INTERCOMPARE REGIONAL CLIMATE SIMULATIONS
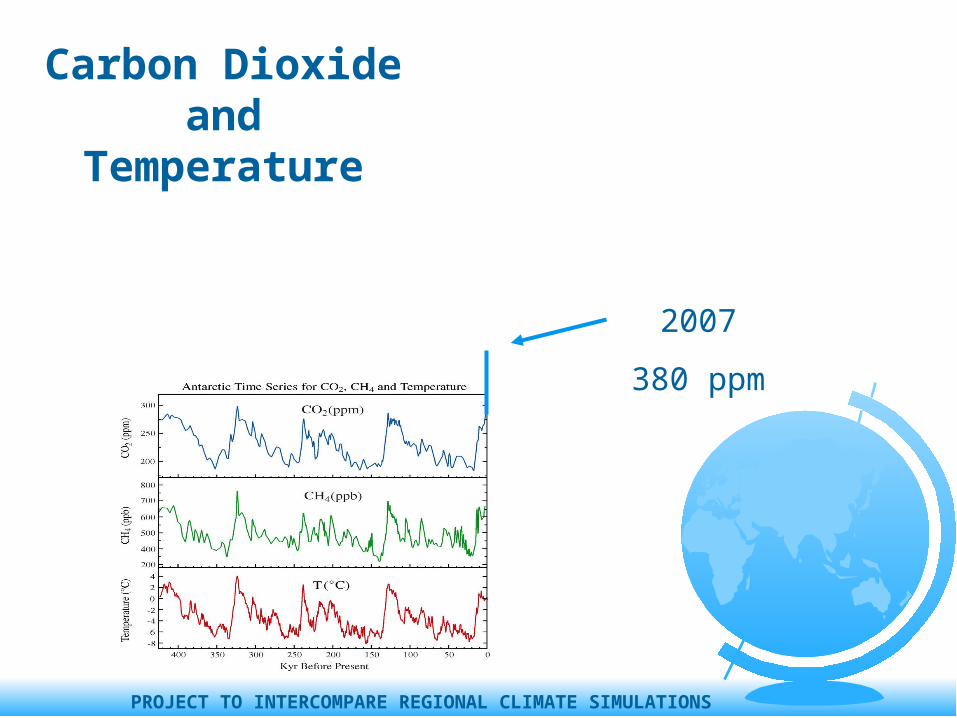
2007
380 ppm
Carbon Dioxide and Temperature
PROJECT TO INTERCOMPARE REGIONAL CLIMATE SIMULATIONS
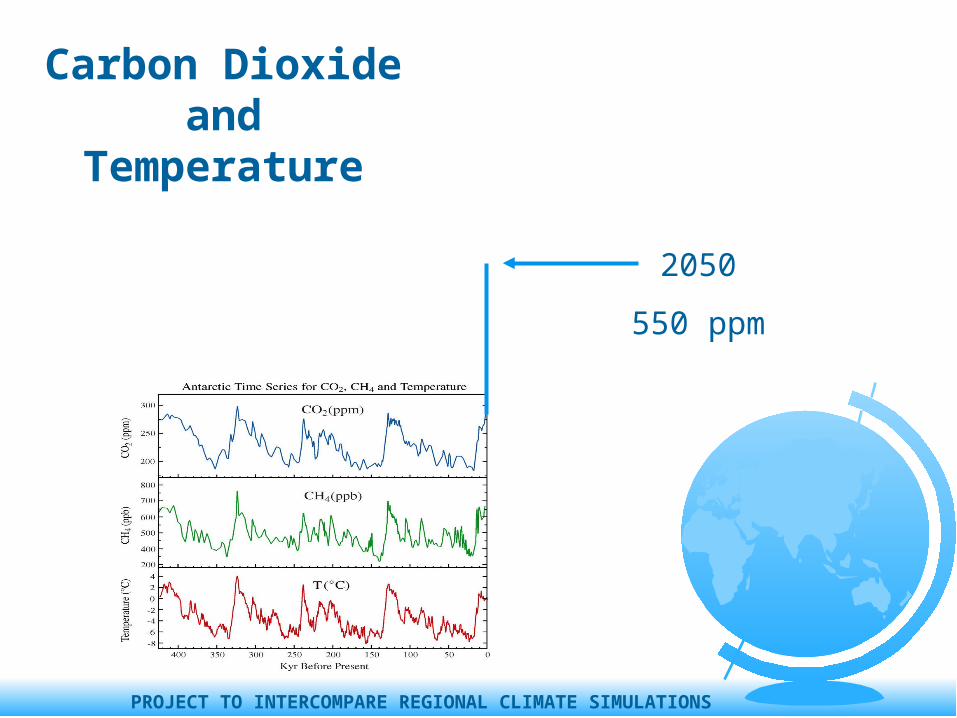
2050
550 ppm
Carbon Dioxide and Temperature
PROJECT TO INTERCOMPARE REGIONAL CLIMATE SIMULATIONS
“Business as Usual”
950 ppm
Carbon Dioxide and Temperature
PROJECT TO INTERCOMPARE REGIONAL CLIMATE SIMULATIONS
“Business as Usual”
950 ppm
?
Carbon Dioxide and Temperature
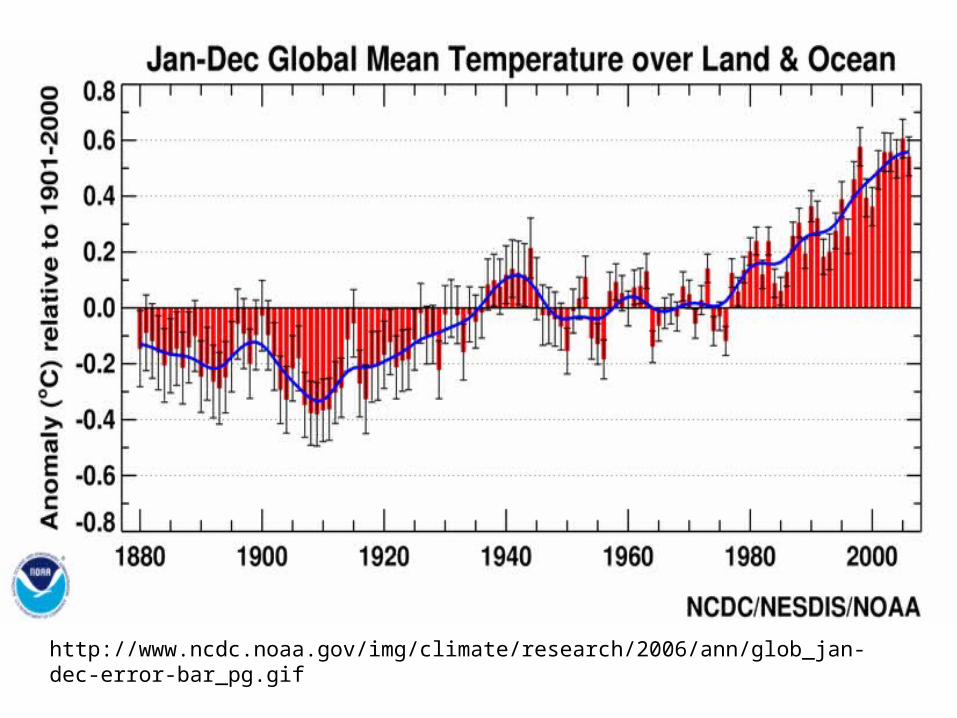
http://www.ncdc.noaa.gov/img/climate/research/2006/ann/glob_jan-dec-error-bar_pg.gif

Source: IPCC, 2001: Climate Change 2001: The Scientific Basis
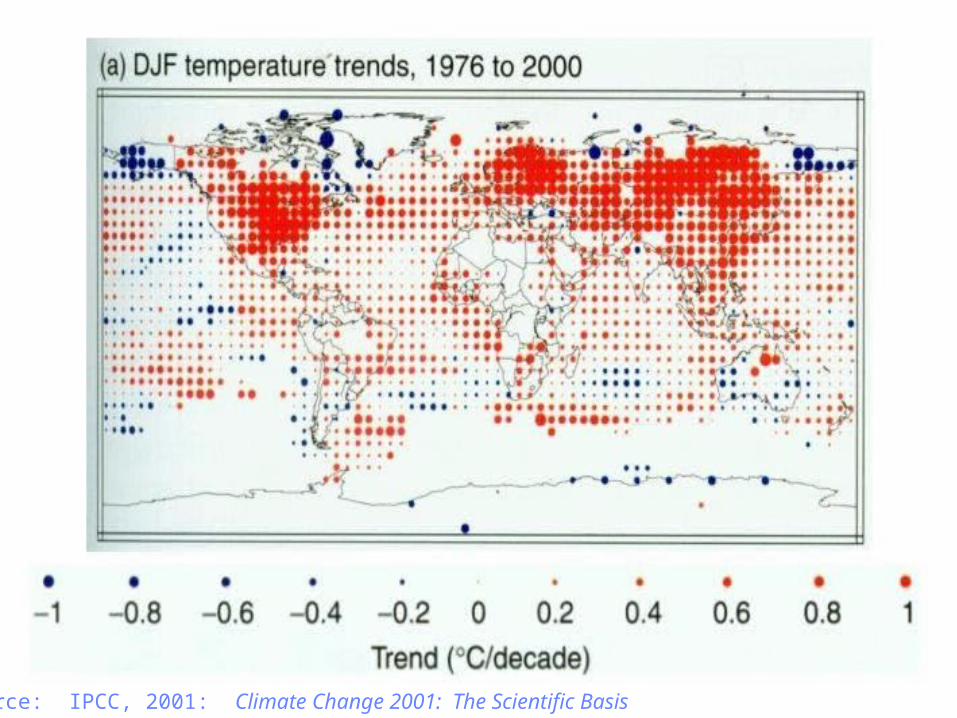
Source: IPCC, 2001: Climate Change 2001: The Scientific Basis
PROJECT TO INTERCOMPARE REGIONAL CLIMATE SIMULATIONS
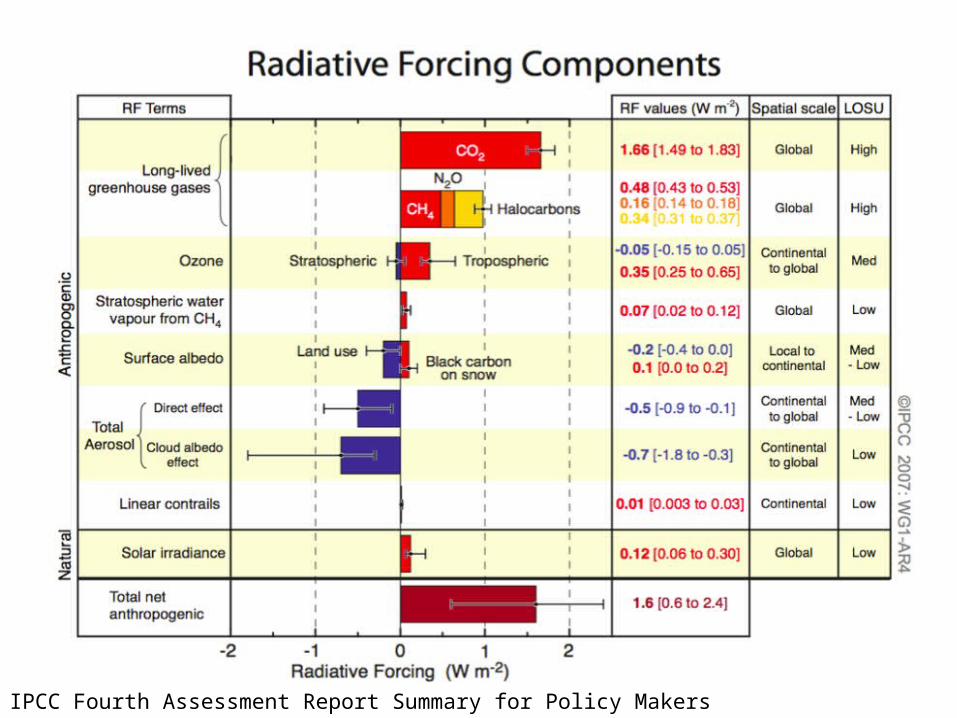
PROJECT TO INTERCOMPARE REGIONAL CLIMATE SIMULATIONSIPCC Fourth Assessment Report Summary for Policy Makers

PROJECT TO INTERCOMPARE REGIONAL CLIMATE SIMULATIONS
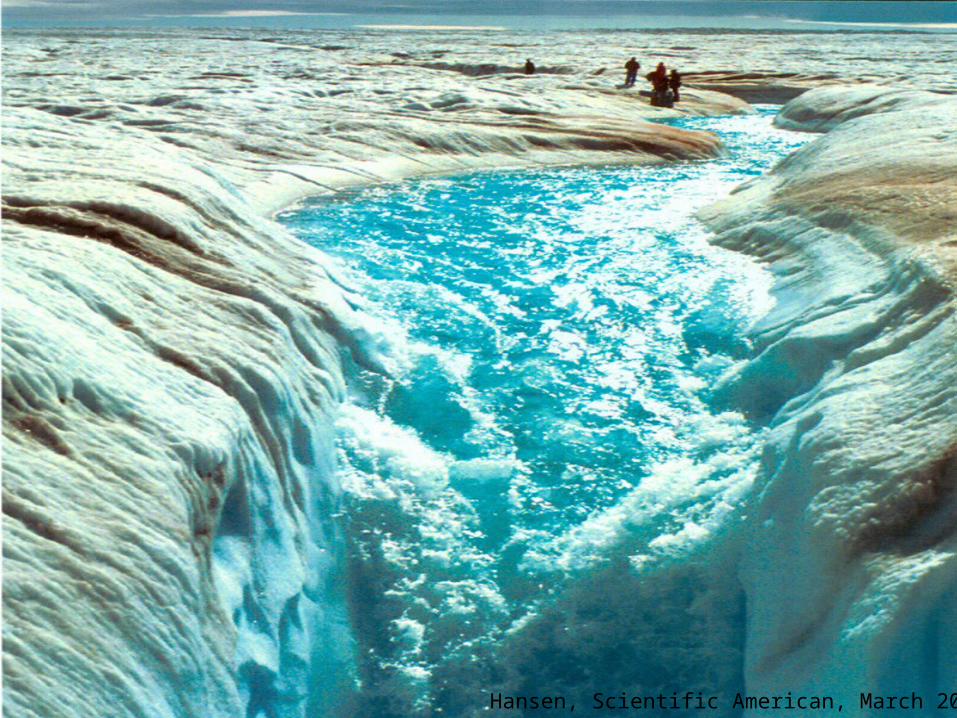
PROJECT TO INTERCOMPARE REGIONAL CLIMATE SIMULATIONSHansen, Scientific American, March 2004
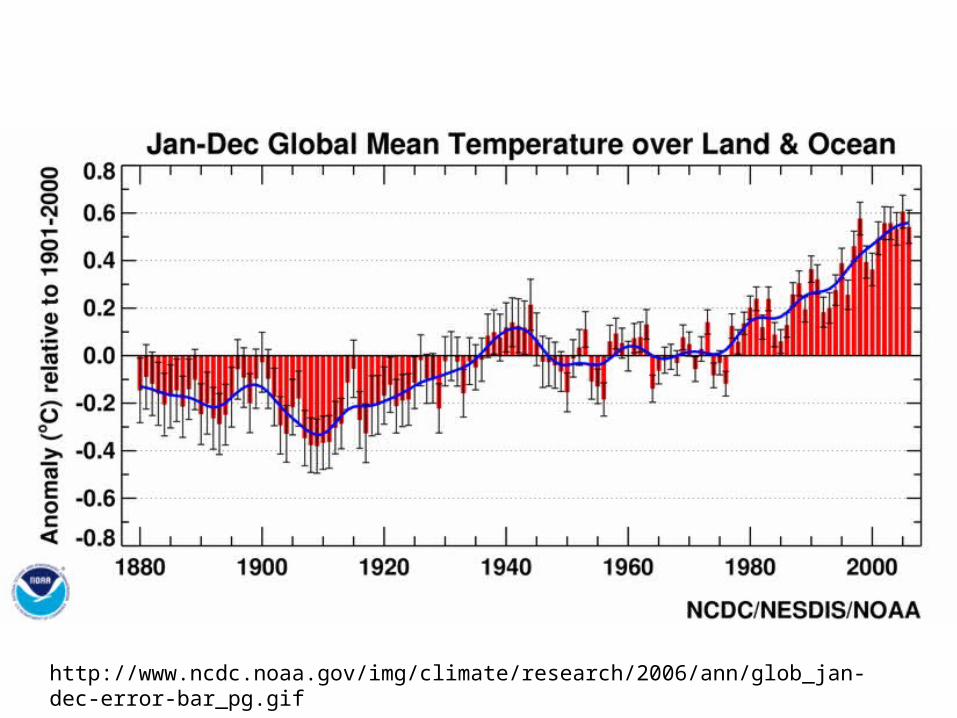
http://www.ncdc.noaa.gov/img/climate/research/2006/ann/glob_jan-dec-error-bar_pg.gif
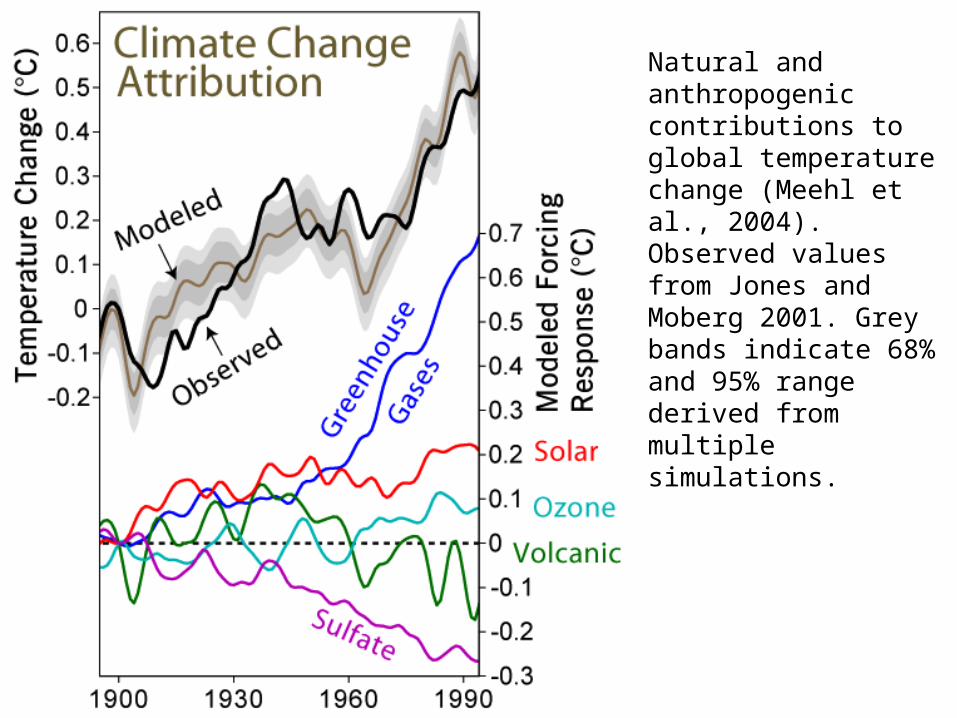
Natural and anthropogenic contributions to global temperature change (Meehl et al., 2004). Observed values from Jones and Moberg 2001. Grey bands indicate 68% and 95% range derived from multiple simulations.
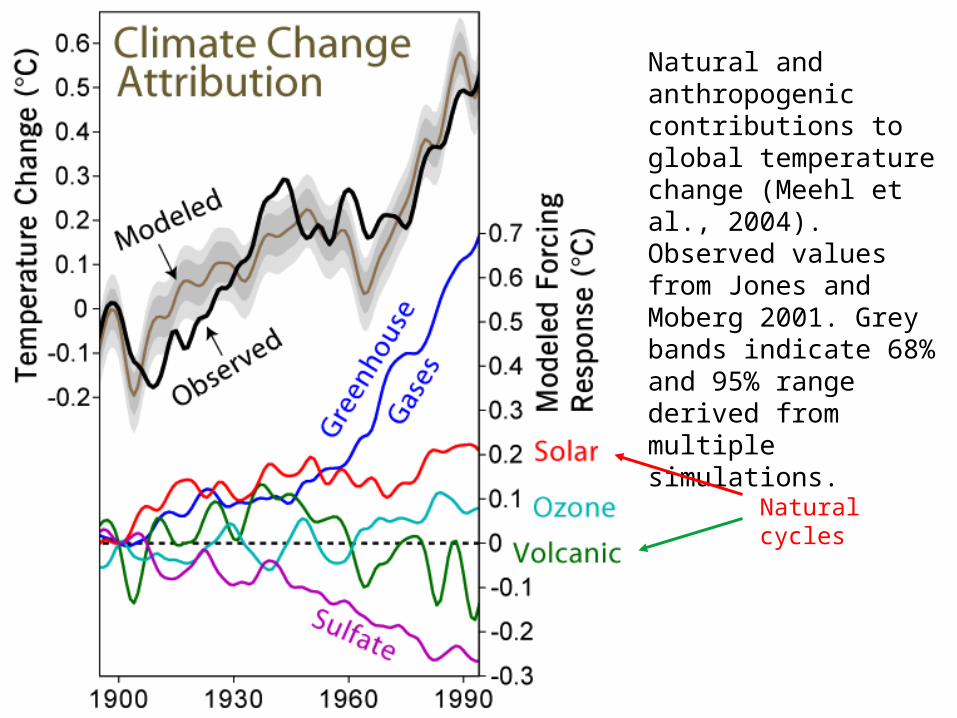
Natural and anthropogenic contributions to global temperature change (Meehl et al., 2004). Observed values from Jones and Moberg 2001. Grey bands indicate 68% and 95% range derived from multiple simulations.
Natural cycles
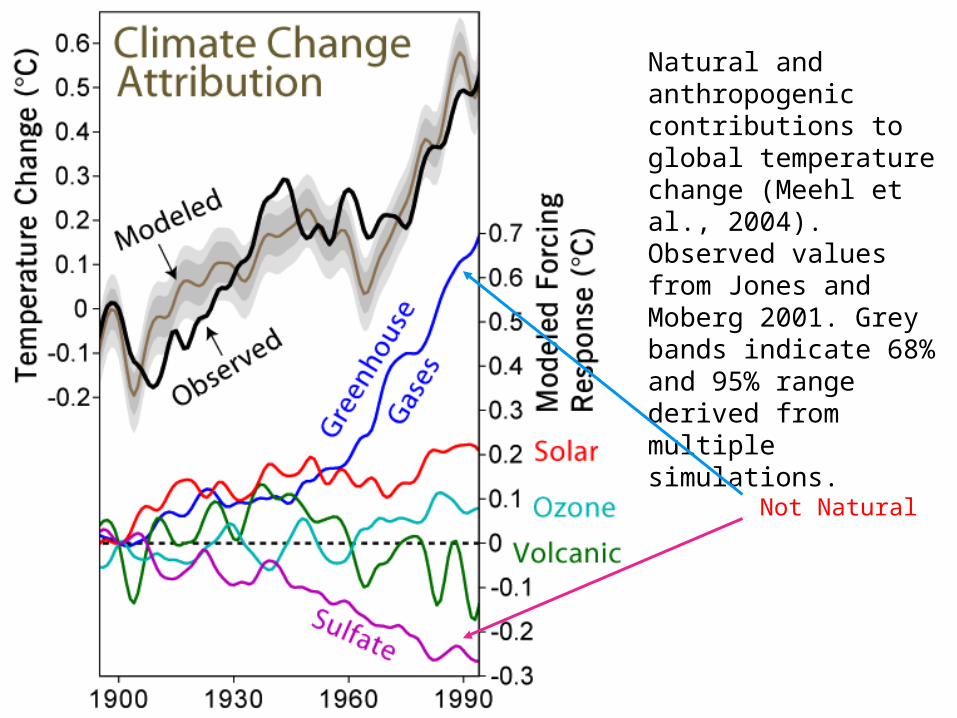
Natural and anthropogenic contributions to global temperature change (Meehl et al., 2004). Observed values from Jones and Moberg 2001. Grey bands indicate 68% and 95% range derived from multiple simulations.
Not Natural
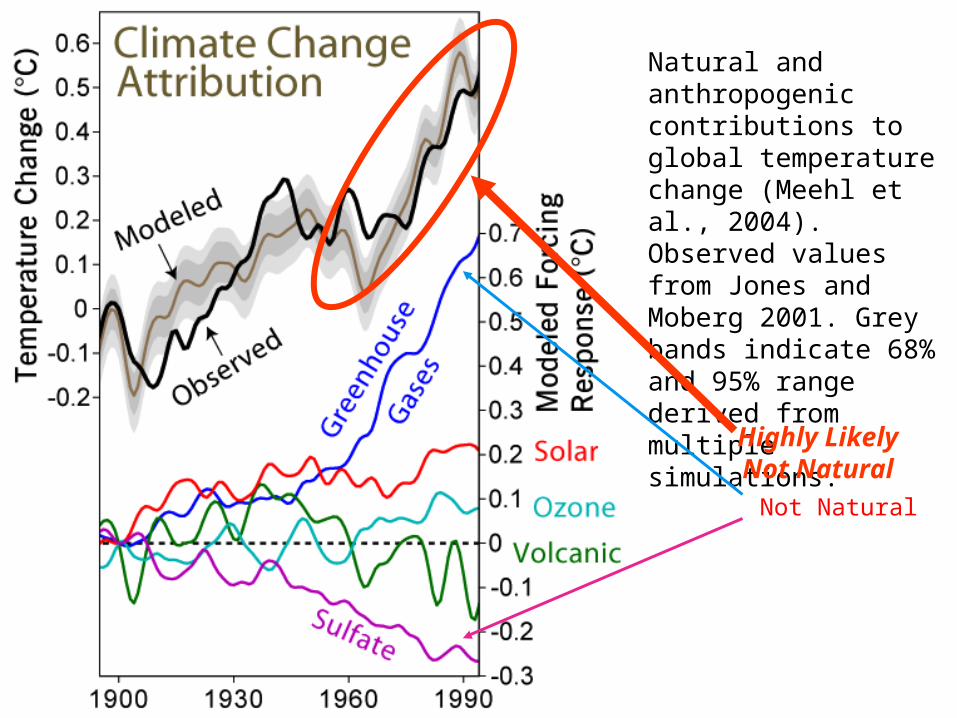
Natural and anthropogenic contributions to global temperature change (Meehl et al., 2004). Observed values from Jones and Moberg 2001. Grey bands indicate 68% and 95% range derived from multiple simulations.
Not Natural
Highly Likely Not Natural
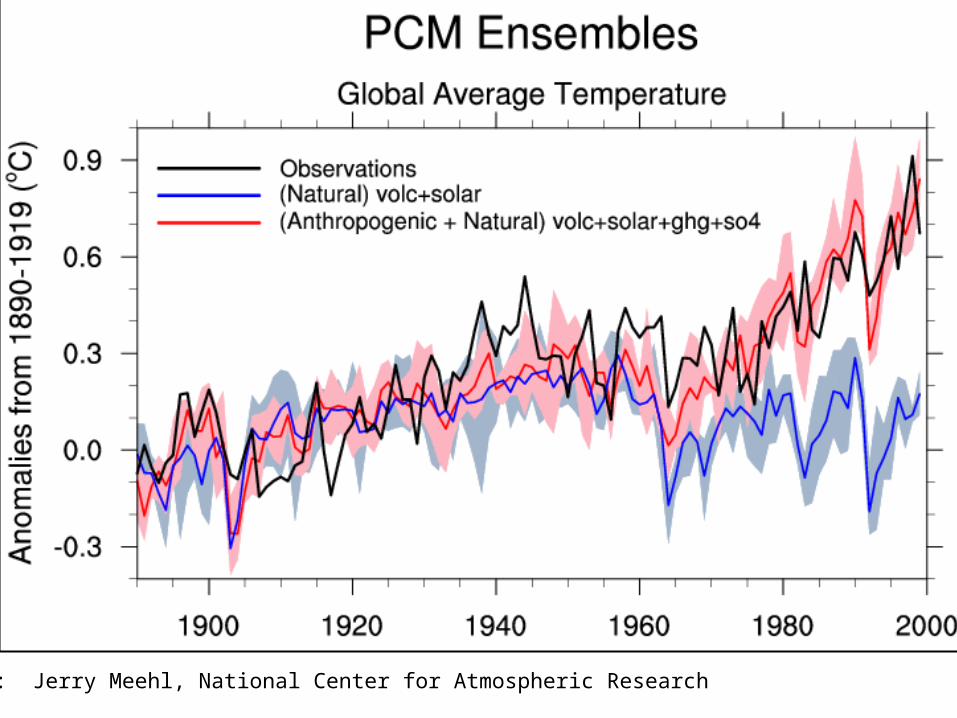
Source: Jerry Meehl, National Center for Atmospheric Research
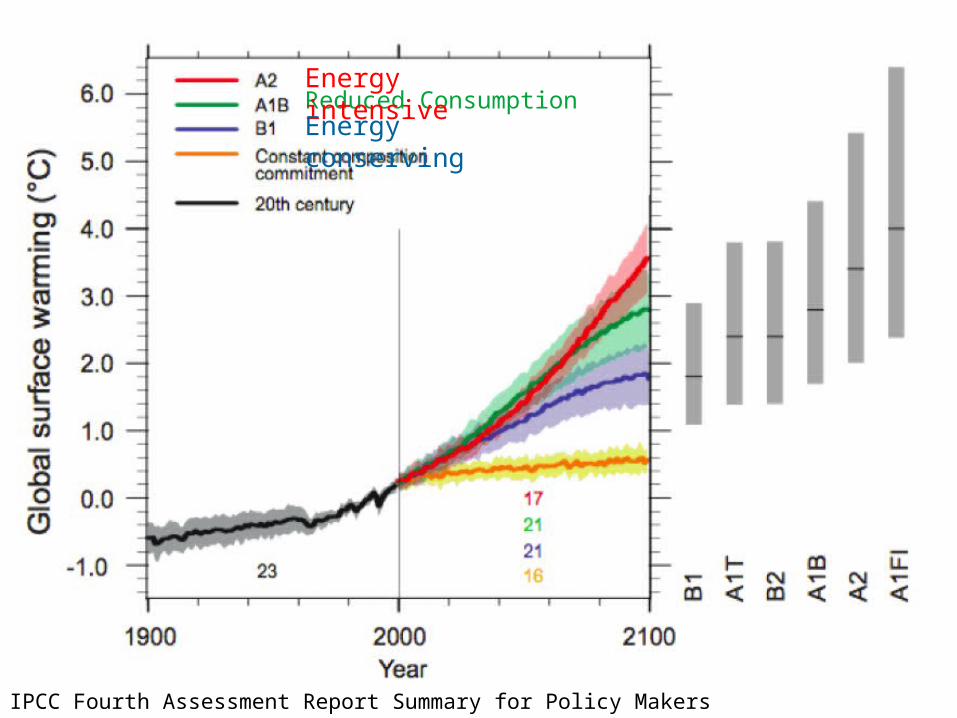
PROJECT TO INTERCOMPARE REGIONAL CLIMATE SIMULATIONSIPCC Fourth Assessment Report Summary for Policy Makers
Reduced ConsumptionEnergy intensive
Energy conserving

PROJECT TO INTERCOMPARE REGIONAL CLIMATE SIMULATIONSIPCC Fourth Assessment Report Summary for Policy Makers
The planet is committed to a warming over the next 50 years regardless of political decisions
Energy intensive
Energy conservingReduced Consumption
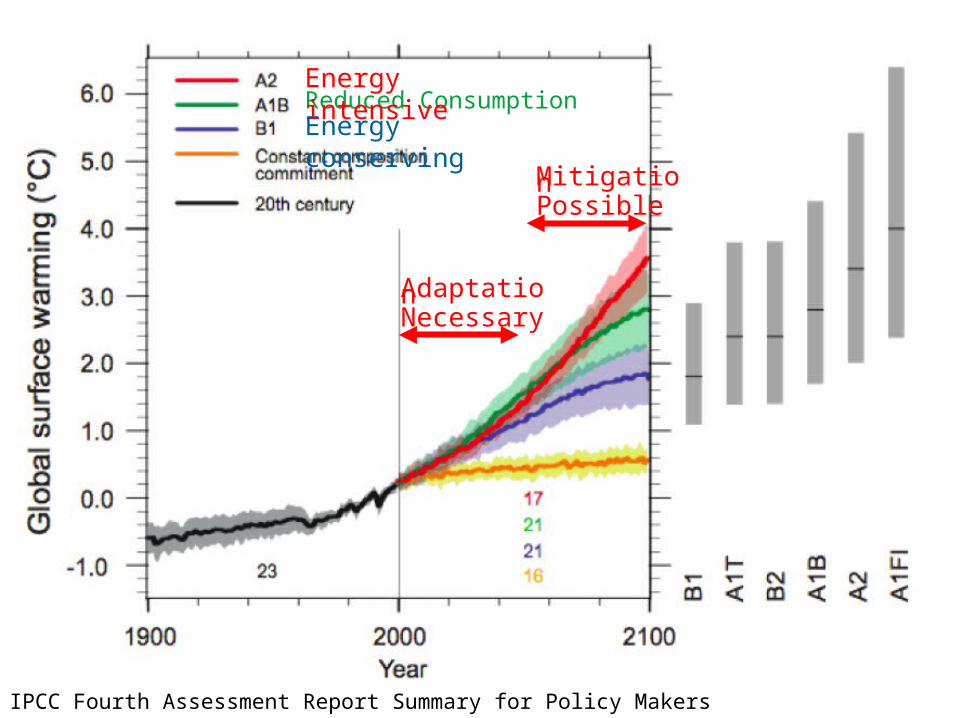
PROJECT TO INTERCOMPARE REGIONAL CLIMATE SIMULATIONSIPCC Fourth Assessment Report Summary for Policy Makers
Reduced ConsumptionEnergy intensive
Energy conserving
AdaptationNecessary
MitigationPossible
PROJECT TO INTERCOMPARE REGIONAL CLIMATE SIMULATIONS
PROJECT TO INTERCOMPARE REGIONAL CLIMATE SIMULATIONS
PROJECT TO INTERCOMPARE REGIONAL CLIMATE SIMULATIONS
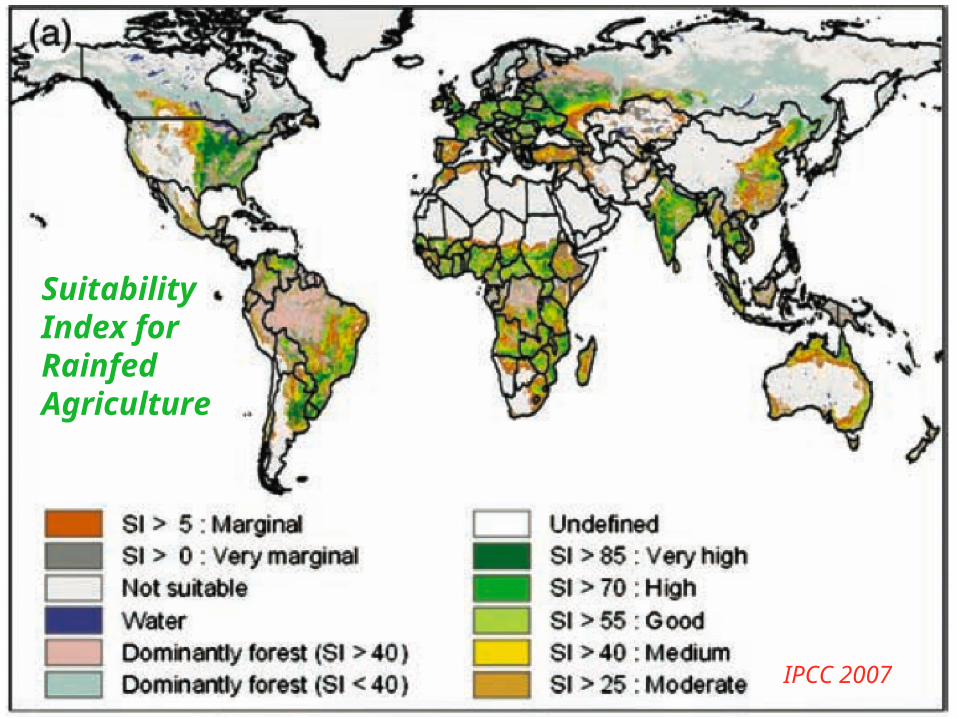
Suitability Index for Rainfed Agriculture
IPCC 2007
PROJECT TO INTERCOMPARE REGIONAL CLIMATE SIMULATIONS
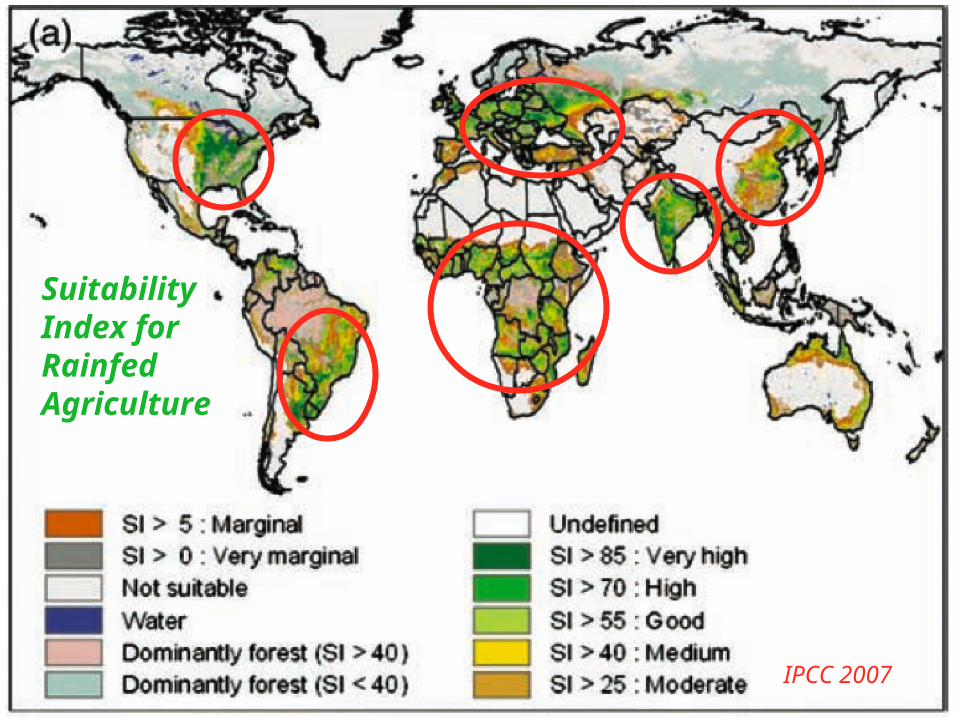
Suitability Index for Rainfed Agriculture
IPCC 2007
PROJECT TO INTERCOMPARE REGIONAL CLIMATE SIMULATIONS
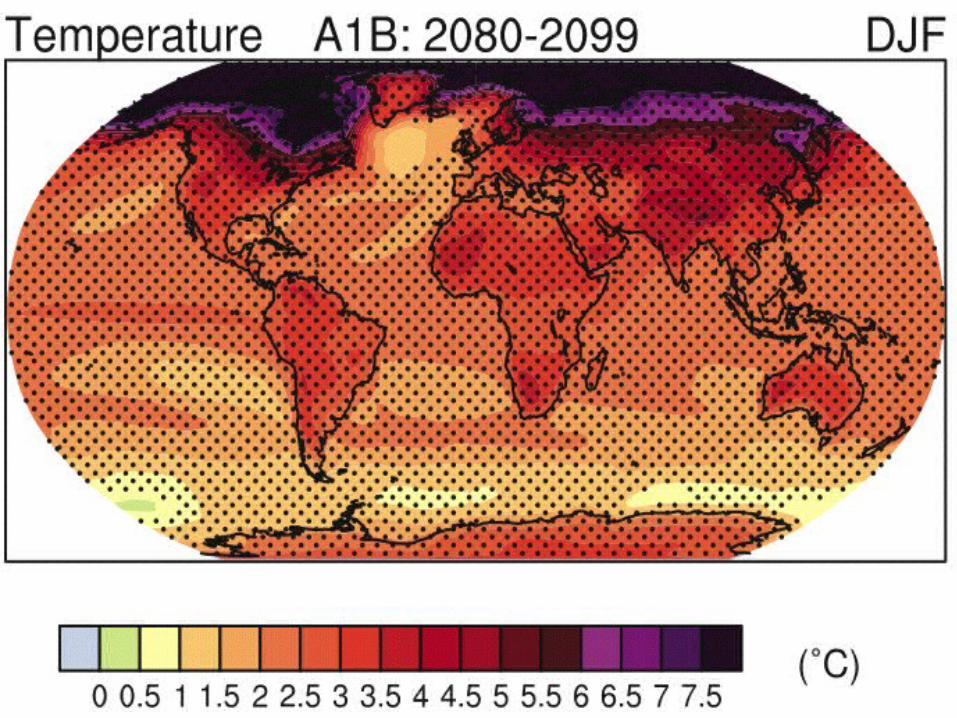
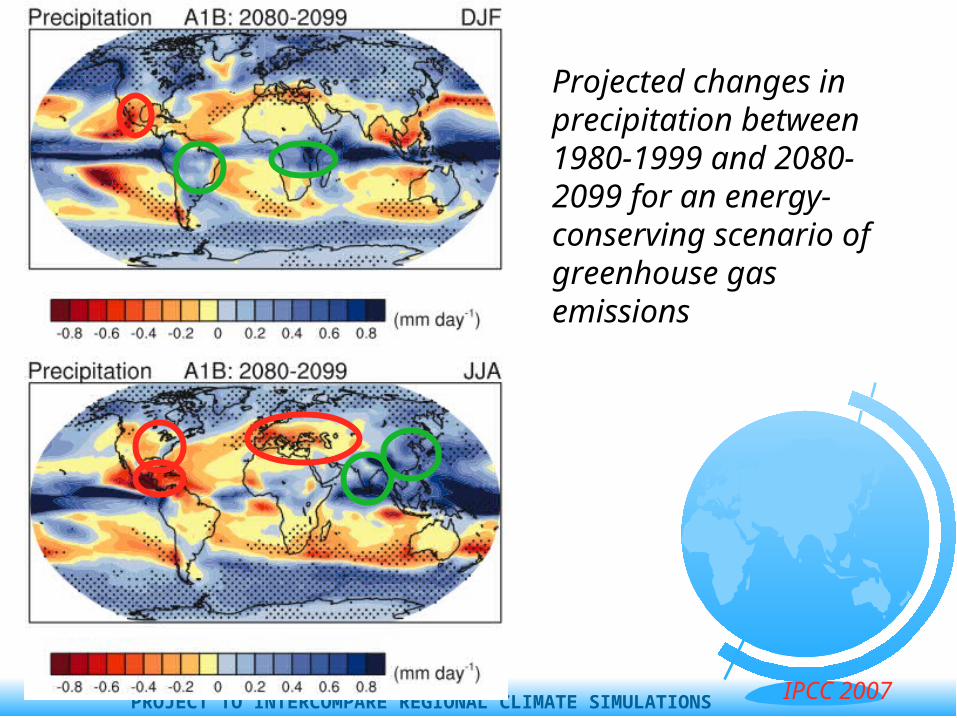
Projected changes in precipitation between 1980-1999 and 2080-2099 for an energy-conserving scenario of greenhouse gas emissions
IPCC 2007
PROJECT TO INTERCOMPARE REGIONAL CLIMATE SIMULATIONS
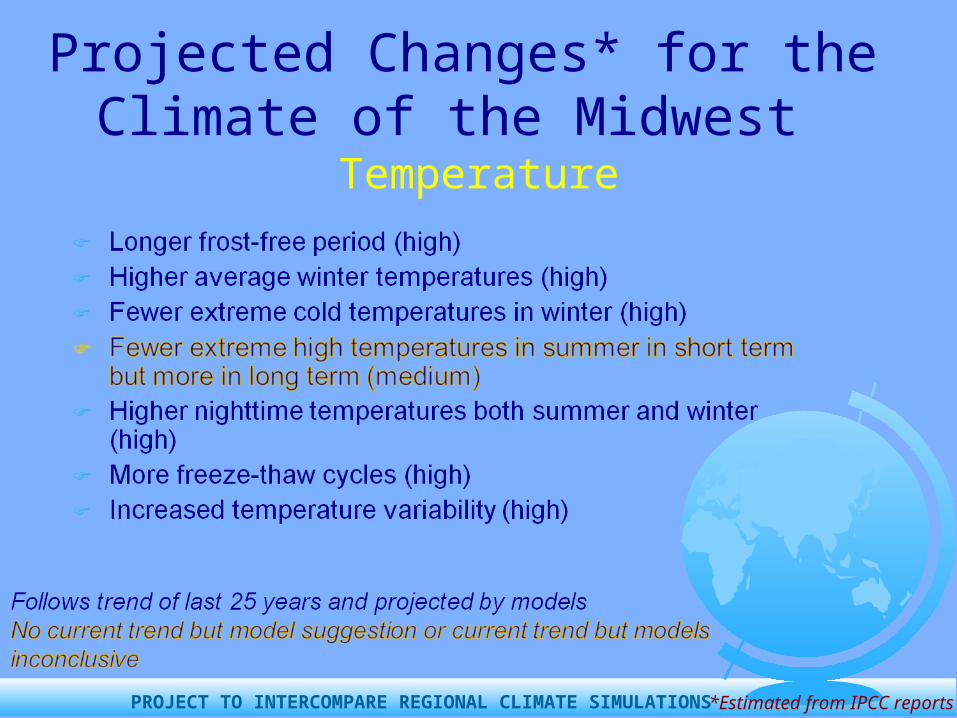
Projected Changes* for the Climate of the Midwest
Temperature
*Estimated from IPCC reports
PROJECT TO INTERCOMPARE REGIONAL CLIMATE SIMULATIONS
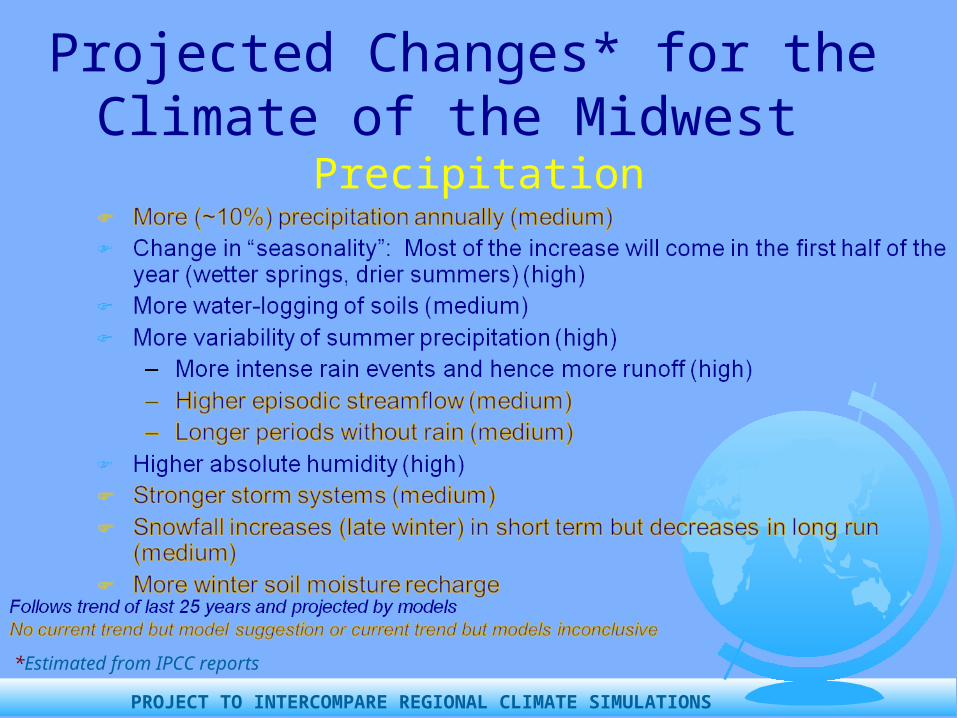
Projected Changes* for the Climate of the Midwest
Precipitation
*Estimated from IPCC reports

PROJECT TO INTERCOMPARE REGIONAL CLIMATE SIMULATIONS
Projected Changes* for the Climate of the Midwest
Other
*Estimated from IPCC and CCSP reports
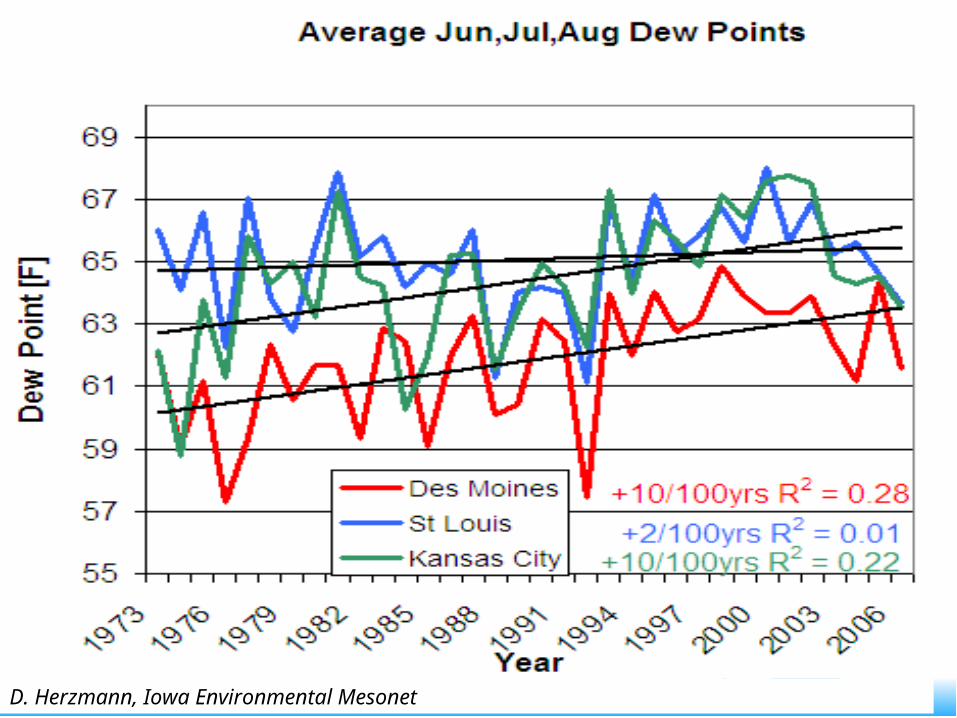
PROJECT TO INTERCOMPARE REGIONAL CLIMATE SIMULATIONSD. Herzmann, Iowa Environmental Mesonet
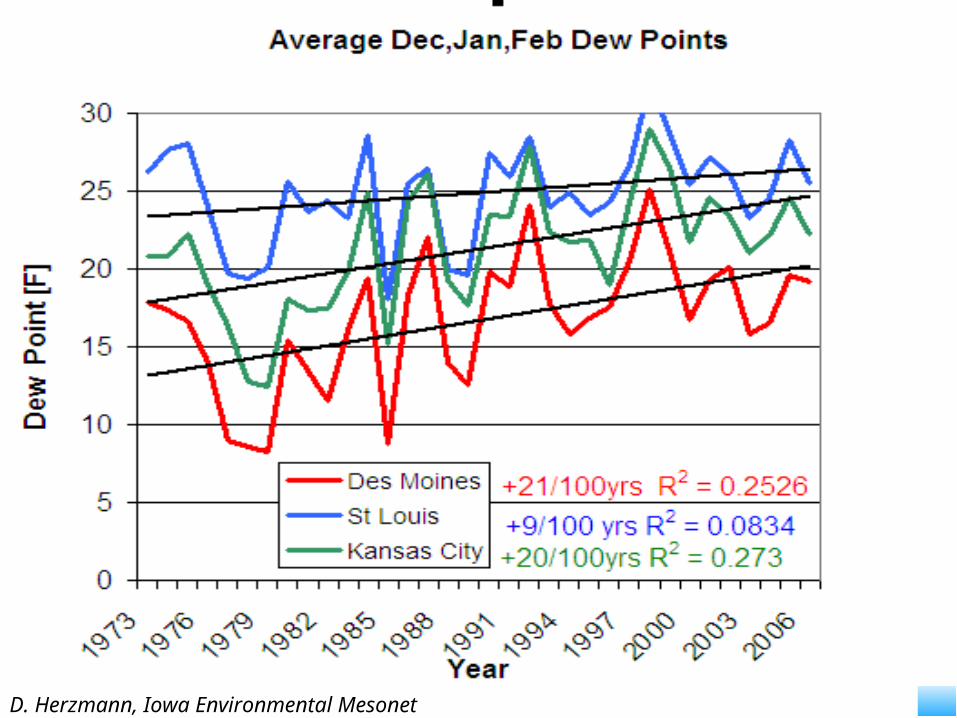
PROJECT TO INTERCOMPARE REGIONAL CLIMATE SIMULATIONSD. Herzmann, Iowa Environmental Mesonet
PROJECT TO INTERCOMPARE REGIONAL CLIMATE SIMULATIONS
For More Information For peer-reviewed evidence supporting everything you have seen in this presentation,
see my online Global Change course:http://www.meteor.iastate.edu/gccourse
Contact me directly:[email protected]
Current research on regional climate and climate change is being conducted at Iowa State Unversity under the Regional Climate Modeling Laboratory
http://rcmlab.agron.iastate.edu/
North American Regional Climate Change Assessment Program
http://www.narccap.ucar.edu/
For this and other climate change presentations see my personal website:
http://www.meteor.iastate.edu/faculty/takle/
Or just Google Eugene Takle