climate and habitat availability determine 20th century ...core.ac.uk/download/pdf/57313.pdf ·...
TRANSCRIPT
This is a repository copy of Climate and habitat availability determine 20th century changes in a butterfly's range margin.
White Rose Research Online URL for this paper:http://eprints.whiterose.ac.uk/1294/
Article:
Hill, J K orcid.org/0000-0003-1871-7715, Thomas, C D orcid.org/0000-0003-2822-1334 and Huntley, B (1999) Climate and habitat availability determine 20th century changes in abutterfly's range margin. Proceedings of the Royal Society B: Biological Sciences. pp. 1197-1206. ISSN 1471-2954
https://doi.org/10.1098/rspb.1999.0763
[email protected]://eprints.whiterose.ac.uk/
Reuse
Unless indicated otherwise, fulltext items are protected by copyright with all rights reserved. The copyright exception in section 29 of the Copyright, Designs and Patents Act 1988 allows the making of a single copy solely for the purpose of non-commercial research or private study within the limits of fair dealing. The publisher or other rights-holder may allow further reproduction and re-use of this version - refer to the White Rose Research Online record for this item. Where records identify the publisher as the copyright holder, users can verify any specific terms of use on the publisher’s website.
Takedown
If you consider content in White Rose Research Online to be in breach of UK law, please notify us by emailing [email protected] including the URL of the record and the reason for the withdrawal request.

Climate and habitat availability determine 20th
century changes in a butter¯y's range margin
Jane K. Hill1*, Chris D. Thomas2 and Brian Huntley1
1Environmental Research Centre, Department of Biological Sciences, University of Durham, Durham DH1 3LE, UK( [email protected]; [email protected])2Centre for Biodiversity and Conservation, School of Biology, University of Leeds, Leeds LS2 9JT, UK ([email protected])
Evidence of anthropogenic global climate change is accumulating, but its potential consequences forinsect distributions have received little attention. We use a c̀limate response surface' model to investigatedistribution changes at the northern margin of the speckled wood butter£y, Pararge aegeria. We relate itscurrent European distribution to a combination of three bioclimatic variables.We document that P. aegeriahas expanded its northern margin substantially since 1940, that changes in this species' distribution overthe past 100 years are likely to have been due to climate change, and that P. aegeria will have the potentialto shift its range margin substantially northwards under predicted future climate change. At current ratesof expansion, this species could potentially colonize all newly available climatically suitable habitat in theUK over the next 50 years or more. However, fragmentation of habitats can a¡ect colonization, and we
show that availability of habitat may be constraining range expansion of this species at its northernmargin in the UK. These lag e¡ects may be even more pronounced in less-mobile species inhabitingmore fragmented landscapes, and highlight how habitat distribution will be crucial in predicting species'responses to future climate change.
Keywords: climate change; habitat fragmentation; metapopulation; Pararge aegeria
1. INTRODUCTION
Evidence of a discernible human impact on globalclimates is accumulating (Houghton et al. 1996) and thishas generated an urgent need to be able to predict thee¡ects of climate change on species' abundances anddistributions. Insects are likely to be particularly respon-sive to climate change, and available data indicate thatthe most likely response is for species' distributions to shiftpolewards and to higher elevations (Coope 1978;Parmesan 1996; Parmesan et al. 1999). However, the
spatial distribution of habitats is likely to have a greatimpact on the capacity of insects to respond to climatechange. Recent anthropogenic habitat destruction maymean that new climatically suitable habitats are beyondthe reach of migrants, preventing species from trackingclimate change. Thus, although they have received littleattention, the interacting e¡ects of climate and habitatavailability may be crucial in determining insect distribu-tions both now and in the future (Lawton 1995; Yonow &Sutherst 1998; Thomas et al. 1999).
Many butter£y species have distributions that appear
directly constrained by climate (Pollard 1979; Turner et al.1987; Dennis & Shreeve 1991), yet it is not clear whetherspecies will be able to track changing climates. Manyspecies conform to a metapopulation structure (e.g.Thomas & Hanski 1997), where the spatial and temporalavailability of habitat is crucial for the persistence of
populations even within areas of suitable climate. Thepresence of apparently suitable habitat that is unoccupied,together with low colonization rates in fragmented land-scapes, have highlighted the di¤culties butter£ies have inreaching isolated habitats (Thomas et al. 1992). Thus,butter£y distributions will be unable to shift in responseto climate change if new habitats are fragmented and tooisolated to be colonized.
The relationship between a species' geographical distri-bution and present climate can be modelled by a surfacerepresenting the probability of encountering that species
under a given combination of climate conditions. Thisc̀limate response surface' may then be used to predictpotential future distributions of the species in response toforecast climate scenarios (Beerling et al. 1995; Huntley1995; Huntley et al. 1995). Here we use this approach witha model species of UK butter£y, the speckled wood,Pararge aegeria (L). This species, along with other UKspecies, has undergone marked changes in its distributionover the past 150 years that may have been related to pastclimate change (Emmet & Heath 1990). After contrac-tion of its distribution at the end of the 19th century,
P. aegeria has subsequently re-expanded its distribution,but has not yet recolonized all areas formerly occupied(¢gure 1a,b). We use a climate response surface to investi-gate the importance of climate in determining Europeandistributions of P. aegeria. Towards the northern andeastern margins of its range, the species is restricted towoodland; we focus on the UK at a ¢ner resolution toinvestigate whether incorporation of habitat availability,
Proc. R. Soc. Lond. B (1999) 266, 1197^1206 1197 & 1999 The Royal Society
Received 4 February 1999 Accepted 2 March 1999
*Author for correspondence.
as well as climate, signi¢cantly improves the ¢t of themodel to current distributions.We test the performance ofthe model with historical climate data, for which we cantest model predictions against available distribution datafor that period.We then use the model to predict potentialfuture European distribution under a climate changescenario for the end of the 21st century, and we alsopredict potential future UK distribution incorporatingcurrent availability of habitat.
2. MATERIAL AND METHODS
(a) Generating the model at a European scale for
current climate and distribution
Current European records were collated from a number of
sources (e.g. Aagaard & Gulbrandsen 1976; Marttila &
Saarinen 1996; Tolman 1997; local butter£y recorders, unpub-
lished data) and converted to presence or absence on a 50 km
Universal Transverse Mercator (UTM) grid (¢gure 2a). The
1198 J. K. Hill and others Climate and butter£y distribution
Proc. R. Soc. Lond. B (1999)
( )a ( )b
()c ( )d
(a) (b)
(c) (d)
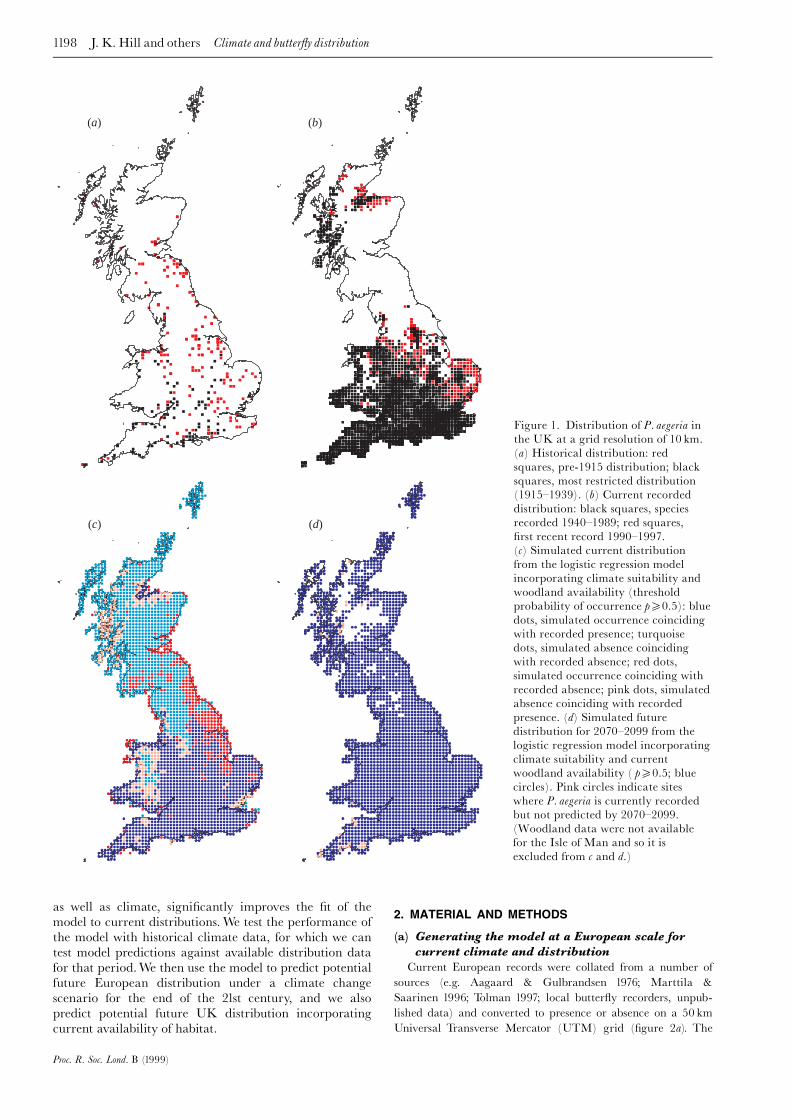
Figure 1. Distribution of P. aegeria inthe UK at a grid resolution of 10 km.
(a) Historical distribution: red
squares, pre-1915 distribution; black
squares, most restricted distribution
(1915^1939). (b) Current recordeddistribution: black squares, species
recorded 1940^1989; red squares,
¢rst recent record 1990^1997.
(c) Simulated current distribution
from the logistic regression model
incorporating climate suitability and
woodland availability (threshold
probability of occurrence p50.5): blue
dots, simulated occurrence coinciding
with recorded presence; turquoise
dots, simulated absence coinciding
with recorded absence; red dots,
simulated occurrence coinciding with
recorded absence; pink dots, simulated
absence coinciding with recorded
presence. (d) Simulated future
distribution for 2070^2099 from the
logistic regression model incorporating
climate suitability and current
woodland availability ( p50.5; blue
circles). Pink circles indicate sites
where P. aegeria is currently recorded
but not predicted by 2070^2099.
(Woodland data were not available
for the Isle of Man and so it is
excluded from c and d.)
Clim
ateand
butter£ydistribution
J.K.Hill
andothers
1199
Proc.
R.Soc.
Lond.
B(19
99)
( )a ( )b
()c ( )d
(b)
(d)
(a)
(c)
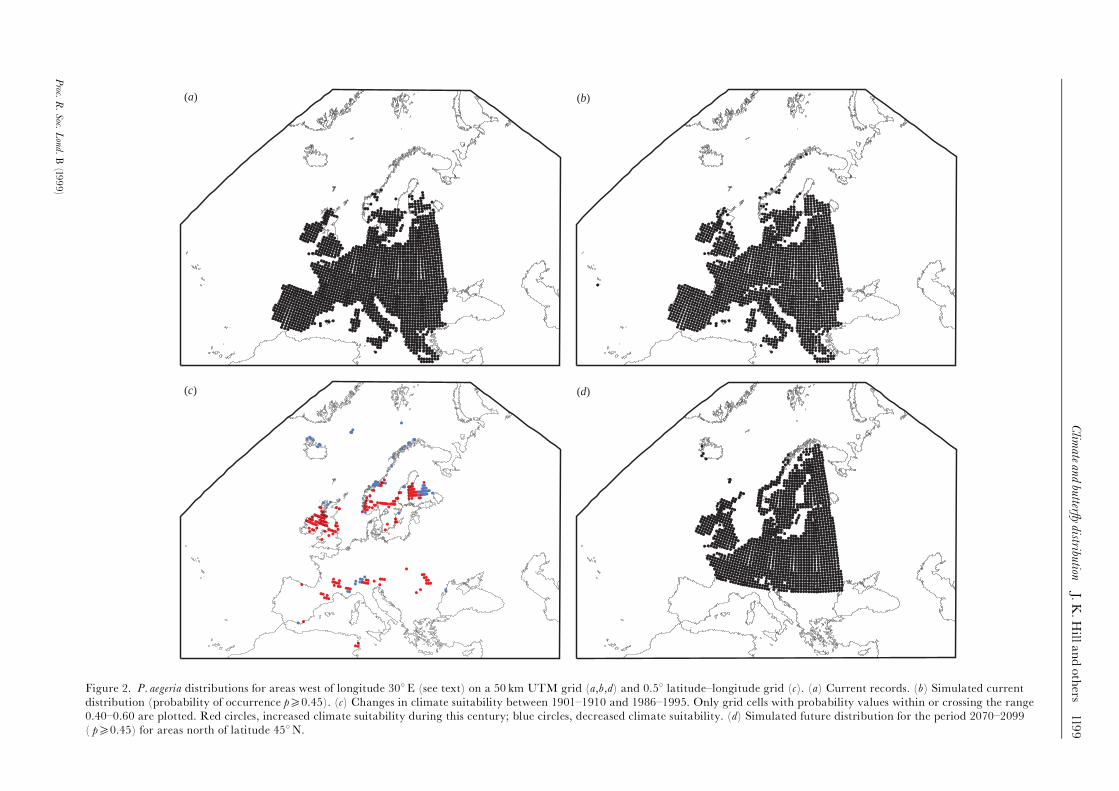
Figure 2. P. aegeria distributions for areas west of longitude 308E (see text) on a 50 km UTM grid (a,b,d) and 0.58 latitude^longitude grid (c). (a) Current records. (b) Simulated current
distribution (probability of occurrence p50.45). (c) Changes in climate suitability between 1901^1910 and 1986^1995. Only grid cells with probability values within or crossing the range
0.40^0.60 are plotted. Red circles, increased climate suitability during this century; blue circles, decreased climate suitability. (d) Simulated future distribution for the period 2070^2099
( p50.45) for areas north of latitude 458N.
grid extended from the Azores east to longitude 308E (reliable
records could not be obtained for areas further east), and from
the Mediterranean Sea (reliable records could not be obtained
for North Africa) north to Svalbard (a total of 2648 grid
squares). Particular e¡orts were made to de¢ne accurately the
species' northern range limit on the basis of data obtained from
recorders in the relevant countries. Any inaccuracies in the
mapped distribution are likely to arise only from small areas in
the central or southern parts of the species' range where it may
be locally absent but be recorded as present in our data.We used
mean monthly temperature, precipitation and cloudiness from a
meteorological station data set relating to the climate normal
period of 1931^1960 (Leemans & Cramer 1991) to interpolate
values for locations at the midpoint and mean elevation of each
50 km cell (Huntley et al. 1995). We computed a number of
derived climatic and bioclimatic variables, and evaluated several
possible combinations of these variables as predictors of the
species' distribution. We ¢tted climate response surfaces
describing the species' European distribution in terms of each
combination of variables (Huntley et al. 1995).We then used each
response surface to simulate P. aegeria distribution for the current
climate. The goodness-of-¢t between simulated and observed
butter£y distributions was used as a test of the response surface,
and was assessed by using the �-statistic (Monserud & Leemans
1992). The best performing model used three bioclimatic
variables re£ecting principal limitations on growth and survival
of P. aegeria: annual temperature sum above 5 8C (GDD5; the
developmental threshold for larvae) (Lees 1962; Blakeley 1997),
coldest month mean temperature (MTCO; related to overwin-
tering survival); and moisture availability (AET/PET; related to
host-plant quality and expressed as an estimate of the ratio of
actual to potential evapotranspiration) (Huntley et al. 1995).
(b) Re¢ning the model to take account of habitat
availability
Current P. aegeria records at a 10 km resolution were obtained
for the UK from the Biological Records Centre (ITE Monks
Wood) and Butter£y Conservation. Values for the three biocli-
mate variables used to ¢t the response surface were derived for
locations at the midpoint and mean elevation of each 10 km
cell (total of 2805 cells) using the same data sets and techni-
ques as before. The climate response surface generated from the
data at 50 km resolution was then applied to these ¢ner-scale
climate data to simulate the probability of occurrence of
P. aegeria in the UK. Distribution of potential P. aegeria habitat
was measured by using data from the ITE landcover data set,
derived from satellite remote-sensed data (Fuller et al. 1994), for
the percentage cover of woodland landcover types (combining
deciduous and coniferous woodlands). Availability of woodland
in each 10 km cell was expressed as the maximum percentage
cover of woodland in any 1km square within each 10 km
square. This measure was chosen, after testing a variety of
alternative measures, because it identi¢ed grid squares within
which there are extensive woodlands, as opposed to others with
numerous small patches classi¢ed as woodland (the pixel size
of the land cover data set is 25m), and performed better as a
predictor of the species' distribution than did the alternative
measures.
We used logistical regression to model the species' observed
UK distribution in relation to climate suitability (represented
by the probability of occurrence predicted by the response
surface) and woodland cover; both variables were arcsine
transformed before analysis. The probability of butter£y
occurrence from the logistical-regression model was then
compared with observed P. aegeria distribution in the UK at a
resolution of 10 km.
(c) Testing the modelling approach by using
historical data
We obtained annual climate data for the period 1901^1996
from the Climate Research Unit 0.58 gridded monthly climate
data set (CRU05) (New et al. 1999a,b). These data are derived
from long-term meteorological station records and are interpo-
lated to a global 0.58 latitude^longitude grid. Because these
climate data are at a resolution di¡erent from those used
previously to ¢t the response surface, we generated another
climate response surface with 0.58 data; this was then used to
predict historical distributions. For the relevant subset of the 0.58
grid (a total of 4169 grid squares) we computed the same three
bioclimate variables as before (GDD5, MTCO, AET/PET) for
the decades 1901^1910 (when P. aegeria had a very restricted
distribution in the UK) and 1986^1995. We remapped the
present European distribution of P. aegeria to this grid and ¢tted
a climate response surface based on climate data for the decade
1986^1995. From this response surface and the bioclimate
variable values for the two decades, distributions were simulated
for both decades and compared with observed current and
historical P. aegeria distributions for the two decades.
(d) Predicting potential future distributions
We obtained output from a transient climate change simula-
tion made by means of the HADCM2 general circulation model
for the period 2070^2099. The simulation chosen combined the
negative forcing of sulphate aerosols with the positive forcing of
greenhouse gases (Mitchell et al. 1995) and can be viewed as a
conservative simulation of the likely magnitude of climate
change over the next century. Mean anomalies between the
periods 1931^1960 and 2070^2099 in the transient simulation
were computed for the model grid cells for 36 meteorological
variables (monthly mean temperature, precipitation and cloudi-
ness). These anomalies were then interpolated to the 50 km
UTM grid across Europe, and added to the previously interpo-
lated observed climate values for the period 1931^1960. The new
values were then used, as before, to compute values for the three
bioclimate variables (GDD5, MTCO and AET/PET) for the
climate scenario for 2070^2099. These predicted future values
were then used with the climate response surface ¢tted to the
50 km grid data to generate a simulated potential distribution
for P. aegeria for the period 2070^2099.
To simulate potential P. aegeria distribution in the UK, the
anomalies from the HADCM2 simulation were applied to the
meteorological data for the 10 km grid, and values for the three
bioclimate variables computed for the period 2070^2099 as
before. The climate response surface for P. aegeria generated from
the 50 km grid European data sets was then used to predict the
butter£y's probability of occurrence in the UKunder the changed
climate scenario. These values for probability of occurrence were
then used in the logistic regression (see above) to predict
P. aegeria's potential distribution in the UK, taking into account
habitat availability. The habitat availability values were those for
the present as there was no obvious basis on which we could
predict how this might change over the next century.
(e) Rates of range expansion
To estimate the time required for P. aegeria to colonize newly
available climatically suitable habitats in the UK, we used the
1200 J. K. Hill and others Climate and butter£y distribution
Proc. R. Soc. Lond. B (1999)
area method (Van den Bosch et al. 1990) to calculate the rate of
expansion of the area that the species has occupied in the UK
this century. We plotted the area occupied each decade (square
root of the area of number of 10 km squares with butter£y
records) against year, and calculated the marginal velocity of
range expansion (E) from the slope (C) of this line (E�C/p�)
(Lensink 1997).
3. RESULTS
(a) Current European distribution
Table 1 shows mean values for the three bioclimate vari-ables for the period 1931^1960. There was a good ¢tbetween currently observed (¢gure 2a) and simulated(¢gure 2b) butter£y distributions based on the 50 km
UTM grid data sets (�� 0.803 at a threshold probabilityof butter£y occurrence of 0.45; 2096 simulated occur-rences compared with 2064 observed occurrences).Given, however, that P. aegeria currently occurs in morethan 77% of squares, a more valuable test of the responsesurface is its ability to simulate accurately the species'northern range margin; visual inspection showed thatthis was also good overall (¢gure 2a,b). However, themodel predicted occurrence in a few areas in the UKbeyond the species' current limits. These areas includedthe Isle of Man and the Western Isles, and also localities
along the east and west coasts of England where thespecies was historically present before its 19th centuryrange contraction (¢gure 1a). The model was also good atpredicting range margins in Fennoscandia, although itpredicted occurrence in part of south-west Sweden in anarea where P. aegeria has never been recorded. The modelalso predicted absence in the core of the Alps in grid cellswhere P. aegeria is restricted to speci¢c habitats (e.g. south-facing slopes and valley bottoms) below the mean eleva-tion of the grid cell; such predicted absences are to beexpected given that the model was ¢tted to bioclimate
values for the mean elevation of the grid squares. Analternative response surface model, ¢tted to the climateinterpolated for the minimum elevation of each grid cell,successfully simulated occurrence in these Alpine gridsquares when run with the climate for the minimumelevation; however, this model was less successful at simu-lating distributions at the northern range margins, andtherefore we present data only for models ¢tted to meanelevation climate data.
(b) Current UK distribution and habitat availability
The current UK distribution of P. aegeria at a 10 kmgrid resolution is shown in ¢gure 1b. The logistical regres-sion model incorporating climate suitability (simulatedprobability of butter£y occurrence) and woodland avail-ability predicted 78% of P. aegeria presence or absence ingrid cells correctly (�2�1236.1, 2 d.f., p50.0001;
�� 0.569) (¢gure 1c). Both variables were signi¢cantlyand positively related to butter£y presence, and the prob-ability (p) of P. aegeria occurrence is described by theequation
lnp
1ÿ p
� �
� 2:88� C � 1:98�W ÿ 3:84,
where p is the species' probability of occurrence, C is thespecies' probability of occurrence, as predicted for the10 km grid cell using the climate response surface, andWis the availability of woodland habitat, expressed as themaximum percentage of woodland land cover types inany 1km square within the 10 km grid cell. Standarderrors for coe¤cients are, respectively: 2.88� 0.10;1.98� 0.15; 3.84� 0.16.
As at the European scale, the majority of the grid cells
where P. aegeria occurs, but was not simulated, are gridcells of high relief (such as the Welsh mountains andWestern Highlands of Scotland) where the bioclimatevariables used re£ect the mean elevation whereas thespecies occurs in speci¢c habitats at low elevation. Asbefore, P. aegeria was predicted to occur in areas currentlybeyond its northern range margin in England, but whichit occupied in the 19th century (¢gure 1a).
(c) Predicted historical European distribution
At a latitude^longitude grid resolution of 0.58 there
was also a good ¢t between the observed distribution ofP. aegeria and its simulated distribution from the responsesurface using climate data for 1986^1995 (�� 0.844 at athreshold probability of occurrence of 0.46; 2716 observedoccurrences, 2725 simulated occurrences). As for the50 km grid, the response surface performed well at thespecies' range margins, although once again it predictedoccurrences in south-west Sweden where P. aegeria hasnever been recorded, and further north in England thanthe species is currently found. As before, it did not predictdistributions in the core of the Alps or mountainousregions in Scotland where P. aegeria is recorded from
unusually warm microclimates.Table 2 shows mean di¡erences in the three bioclimate
variables between historical (1901^1910) and current(1986^1995) climates. Values of the three variables wereweighted by the cosine of the latitude of each cell whencalculating mean values to take account of decreasing cellarea and increasing the number of cells with increasinglatitude. These data show that during this centuryclimates in the study area have on average becomewarmer and drier. Simulated historical distributions wereslightly more restricted than simulated current distribu-
tions (2670 simulated historical occurrences comparedwith 2725 simulated current occurrences; thresholdprobability of occurrence� 0.46). We compared di¡er-ences between the two simulations by calculating changesin the species' probability of occurrence for each grid cell.
Climate and butter£y distribution J. K. Hill and others 1201
Proc. R. Soc. Lond. B (1999)
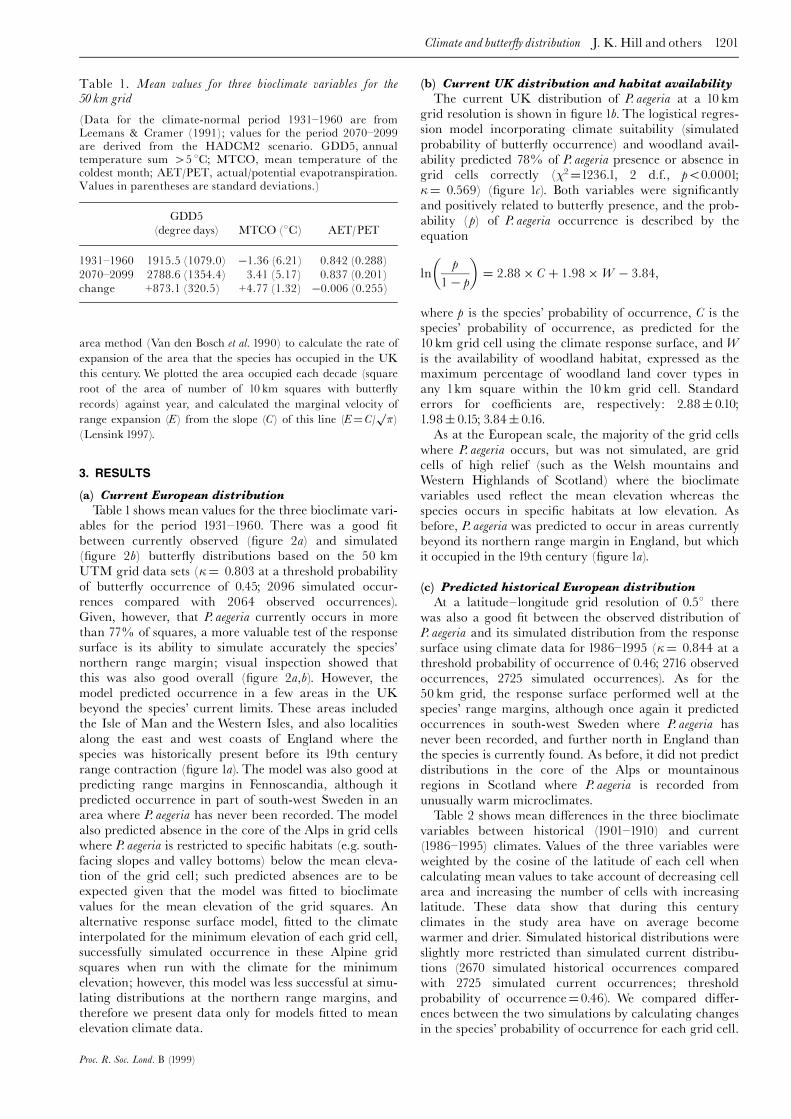
Table 1. Mean values for three bioclimate variables for the50 km grid
(Data for the climate-normal period 1931^1960 are fromLeemans & Cramer (1991); values for the period 2070^2099are derived from the HADCM2 scenario. GDD5, annualtemperature sum 45 8C; MTCO, mean temperature of thecoldest month; AET/PET, actual/potential evapotranspiration.Values in parentheses are standard deviations.)
GDD5
(degree days) MTCO (8C) AET/PET
1931^1960 1915.5 (1079.0) ÿ1.36 (6.21) 0.842 (0.288)
2070^2099 2788.6 (1354.4) 3.41 (5.17) 0.837 (0.201)
change +873.1 (320.5) +4.77 (1.32) ÿ0.006 (0.255)
We focused on grid cells with current or historical valuesfor probability of occurrences within the range 0.40^0.60,or where the change in probability values between thetwo decades crossed this range. This range was chosen tohighlight grid cells for which changes in climate would be
most likely to a¡ect butter£y occurrence.Figure 2c illustrates these changes and shows that
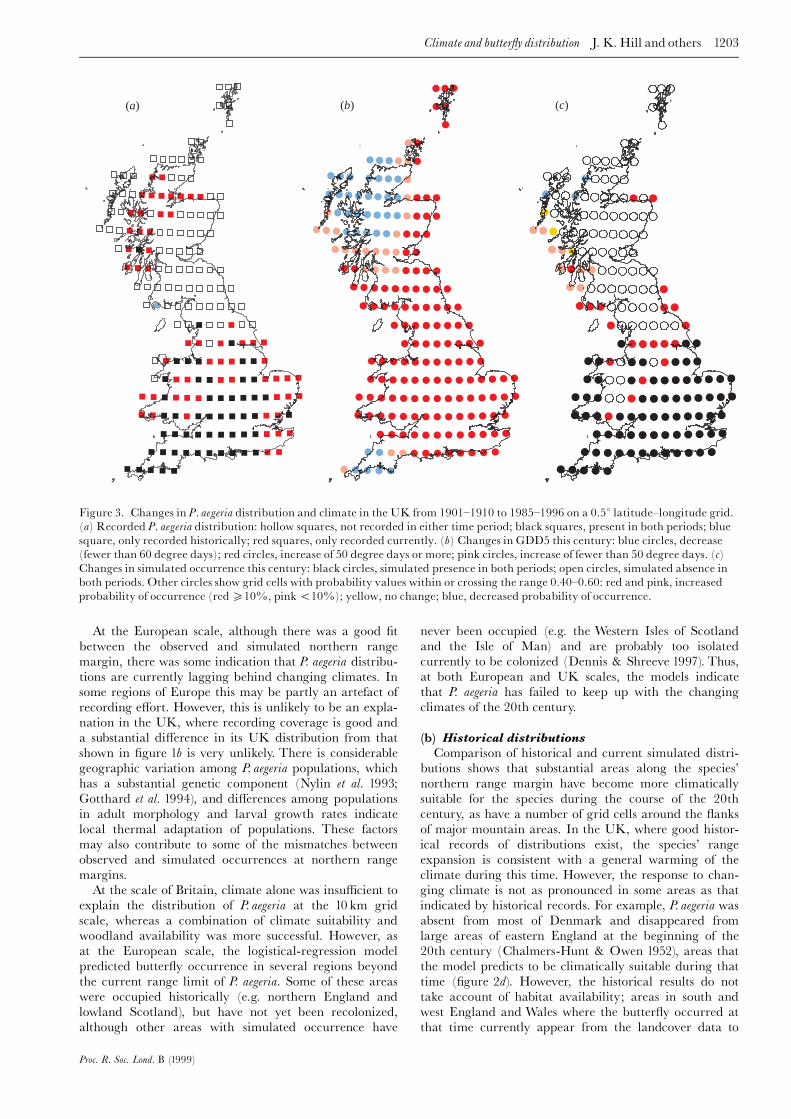
substantial areas along the species' northern rangemargin in both the UK and Fennoscandia have becomemore climatically suitable for the species in the course ofthe 20th century. We then focused on Britain (a total of196 grid cells) (¢gure 3), for which there are reasonablehistorical butter£y records (¢gures 1a and 3a). Figure 3billustrates changes in GDD5 in Britain between 1901^1910and 1985^1996, and shows that most of Britain hasbecome warmer during this period. There are 30 cells
with values lying within the speci¢ed range of probabilityvalues (0.40 0.60) and which have improved in climatesuitability this century (¢gure 3a). Of these 30 cells, tenhave been recolonized since the 1940s and the remainderwere either occupied (four cells) or unoccupied (16 cells)throughout this period. Only three cells with probabilityvalues lying within the speci¢ed range have declined inclimatic suitability in the UK during this century; allthree are on the west coast of Scotland. One cell has beenunoccupied in both periods, and the two other cells havebeen recolonized since the 1940s (and have simulated
probabilities of current occurrence of 0.34 and 0.46; see¢gure 3c).
(d) Predicted future European distributions
Table 1 shows mean di¡erences for the three bioclimatevariables between the climate-normal period of 1931^1960and future predicted climates. These data indicate thatclimates within the study area will on average becomewarmer and drier by the end of the 21st century. Thesimulated potential future distribution of P. aegeria for theperiod 2070^2099 is shown in ¢gure 2d (using the
probability threshold of occurrence of 0.45 derived fromthe current climate simulation). The model predictsconsiderable northward extension of the potential distribu-tion of P. aegeria, and indicates that P. aegeria would havethe potential to extend its range throughout the UK, withonly the highest mountains in Scotland being excluded. InFennoscandia the species' potential range extends almostto the Arctic coast, reaching southern Finnmark, andextends along the west coast of Norway as far as theLofoten Islands. The southern range margin of P. aegeria(in North Africa) was not included in the response surface,
making it impossible to predict future changes at thesouthern margin; areas south of latitude 458N have there-fore been excluded from the simulated future distribution.
In the UK, predictions from the logistical-regressionmodel are for P. aegeria to occur throughout the UK, withthe exception of the high mountain areas in centralScotland (¢gure 1d). At a resolution of 10 km, a su¤cient
extent of woodland is present almost everywhere that theclimate is suitable for the butter£y, so that habitat avail-ability at a 10 km resolution does not generally constrainthe species' potential future range.
(e) Expansion rates
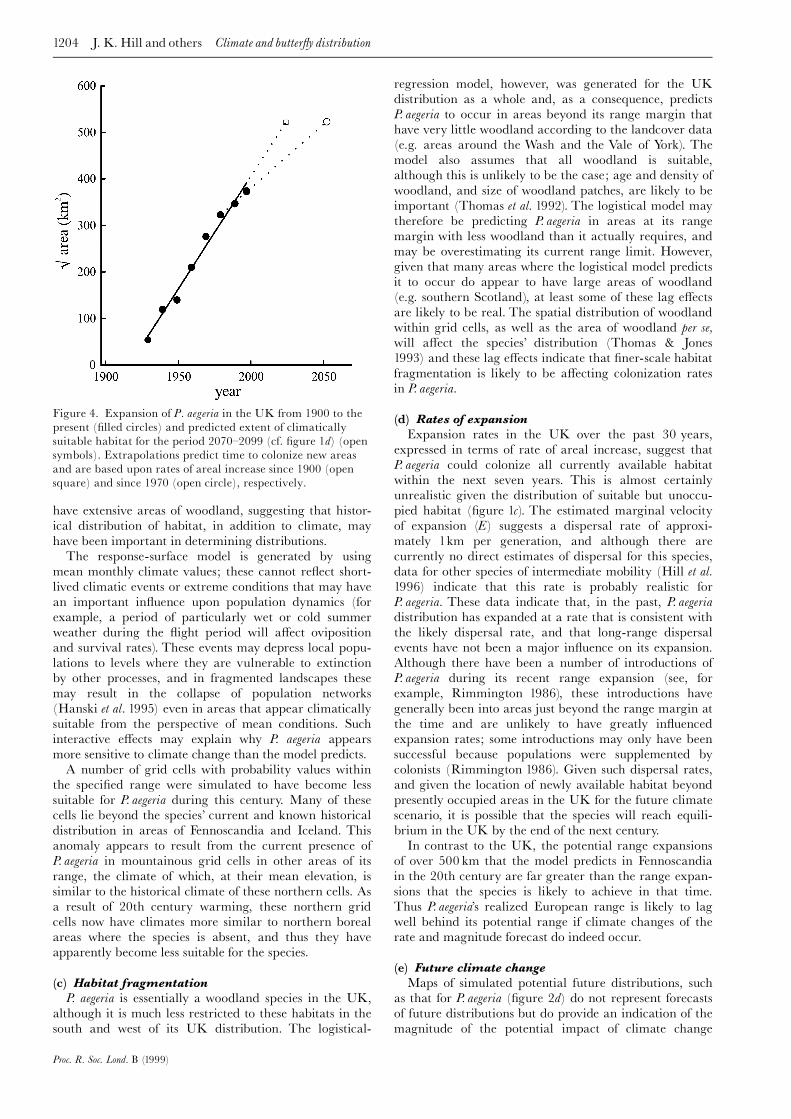
Extrapolation of the rate of increase of the area occu-pied suggests that P. aegeria could colonize all currentlysuitable habitat in the UK within the next three years(¢gure 4), although, because it does not take into accountthe relative locations of empty and occupied habitats, thisestimate is probably unrealistic. Expressing the expansion
rate of P. aegeria in the UK this century as the marginalvelocity of expansion (E) of the area occupied, which weestimate as 2.7 kmyrÿ1 (without correcting for geome-trical distribution of potential new areas for colonization)(Lensink 1997; see ¢gure 4), emphasizes this point andsuggests that colonization of more isolated areas ofsuitable habitat may take much longer than three years.Furthermore, there is some indication from ¢gure 4 thatexpansion rate has already declined over the past30 years; recalculating the marginal velocity of expan-sion for the period since 1970 results in a reduced estimate
of 1.6 kmyrÿ1. Nonetheless, the rate of areal increase forthis recent expansion predicts P. aegeria to have colonizedall currently suitable habitats in the UK within the nextseven years, and, furthermore, to be able to colonizewithin the next 50 years all areas of the UK predicted tobe suitable during the late 21st century (¢gure 4). Onceagain, however, these estimates are likely to be unrealisticbecause they take no account of the location of suitableempty habitat, much of which is remote from currentlyoccupied areas and would take much longer to be colon-ized if the marginal velocity of the recent expansion,
rather than the rate of areal increase, is taken as an indi-cation of the likely rate of future range expansion.
4. DISCUSSION
(a) Performance of models
The high values for the �-statistic for the responsesurfaces ¢tted to both the 50 km and 0.58 latitude^longitude grids indicate that climate is important indetermining P. aegeria distribution at a European scale,and that butter£y distributions can be modelled very
successfully by using three appropriate bioclimate vari-ables. A test of the model with historical data indicatedthat recent range expansions are consistent with aresponse to the changing climate, con¢rming the robust-ness of this approach (Beerling et al. 1995). It is likely thatthis modelling approach will also be successful for otherbutter£y species, although di¡erent combinations ofbioclimate variables may be more appropriate; forexample, distributions of species with thermoregulatinglarvae may be more responsive to a combination of vari-ables that includes hours of sunshine (Bryant et al. 1997).
1202 J. K. Hill and others Climate and butter£y distribution
Proc. R. Soc. Lond. B (1999)
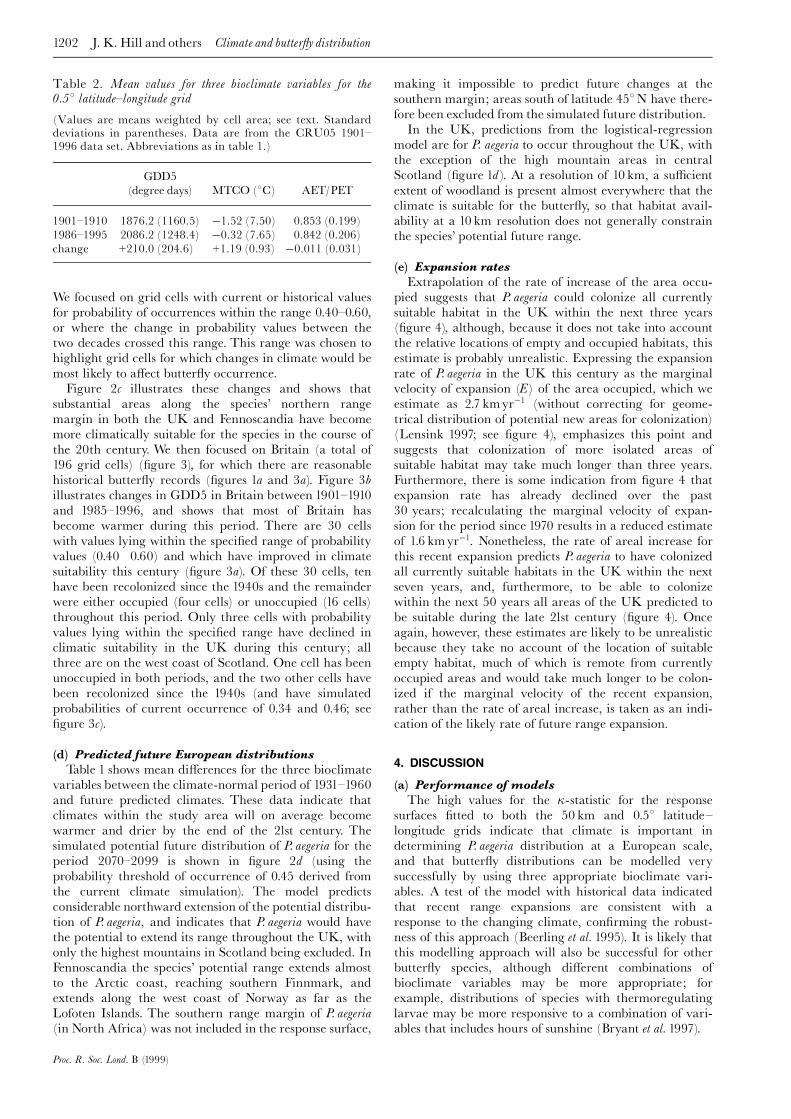
Table 2. Mean values for three bioclimate variables for the0.58 latitude^longitude grid
(Values are means weighted by cell area; see text. Standarddeviations in parentheses. Data are from the CRU05 1901^1996 data set. Abbreviations as in table 1.)
GDD5
(degree days) MTCO (8C) AET/PET
1901^1910 1876.2 (1160.5) ÿ1.52 (7.50) 0.853 (0.199)
1986^1995 2086.2 (1248.4) ÿ0.32 (7.65) 0.842 (0.206)
change +210.0 (204.6) +1.19 (0.93) ÿ0.011 (0.031)
At the European scale, although there was a good ¢tbetween the observed and simulated northern rangemargin, there was some indication that P. aegeria distribu-tions are currently lagging behind changing climates. Insome regions of Europe this may be partly an artefact ofrecording e¡ort. However, this is unlikely to be an expla-nation in the UK, where recording coverage is good anda substantial di¡erence in its UK distribution from thatshown in ¢gure 1b is very unlikely. There is considerablegeographic variation among P. aegeria populations, whichhas a substantial genetic component (Nylin et al. 1993;Gotthard et al. 1994), and di¡erences among populationsin adult morphology and larval growth rates indicatelocal thermal adaptation of populations. These factorsmay also contribute to some of the mismatches betweenobserved and simulated occurrences at northern rangemargins.
At the scale of Britain, climate alone was insu¤cient toexplain the distribution of P. aegeria at the 10 km gridscale, whereas a combination of climate suitability andwoodland availability was more successful. However, asat the European scale, the logistical-regression modelpredicted butter£y occurrence in several regions beyond
the current range limit of P. aegeria. Some of these areaswere occupied historically (e.g. northern England andlowland Scotland), but have not yet been recolonized,although other areas with simulated occurrence have
never been occupied (e.g. the Western Isles of Scotlandand the Isle of Man) and are probably too isolatedcurrently to be colonized (Dennis & Shreeve 1997). Thus,at both European and UK scales, the models indicatethat P. aegeria has failed to keep up with the changingclimates of the 20th century.
(b) Historical distributions
Comparison of historical and current simulated distri-butions shows that substantial areas along the species'northern range margin have become more climatically
suitable for the species during the course of the 20thcentury, as have a number of grid cells around the £anksof major mountain areas. In the UK, where good histor-ical records of distributions exist, the species' rangeexpansion is consistent with a general warming of theclimate during this time. However, the response to chan-ging climate is not as pronounced in some areas as thatindicated by historical records. For example, P. aegeria wasabsent from most of Denmark and disappeared fromlarge areas of eastern England at the beginning of the20th century (Chalmers-Hunt & Owen 1952), areas thatthe model predicts to be climatically suitable during that
time (¢gure 2d). However, the historical results do nottake account of habitat availability; areas in south andwest England and Wales where the butter£y occurred atthat time currently appear from the landcover data to
Climate and butter£y distribution J. K. Hill and others 1203
Proc. R. Soc. Lond. B (1999)
( )a ( )b ( )c(a) (b) (c)
Figure 3. Changes in P. aegeria distribution and climate in the UK from 1901^1910 to 1985^1996 on a 0.58 latitude^longitude grid.
(a) Recorded P. aegeria distribution: hollow squares, not recorded in either time period; black squares, present in both periods; blue
square, only recorded historically; red squares, only recorded currently. (b) Changes in GDD5 this century: blue circles, decrease
(fewer than 60 degree days); red circles, increase of 50 degree days or more; pink circles, increase of fewer than 50 degree days. (c)Changes in simulated occurrence this century: black circles, simulated presence in both periods; open circles, simulated absence in
both periods. Other circles show grid cells with probability values within or crossing the range 0.40^0.60: red and pink, increased
probability of occurrence (red510%, pink510%); yellow, no change; blue, decreased probability of occurrence.
have extensive areas of woodland, suggesting that histor-ical distribution of habitat, in addition to climate, may
have been important in determining distributions.The response-surface model is generated by using
mean monthly climate values; these cannot re£ect short-lived climatic events or extreme conditions that may havean important in£uence upon population dynamics (forexample, a period of particularly wet or cold summerweather during the £ight period will a¡ect ovipositionand survival rates). These events may depress local popu-lations to levels where they are vulnerable to extinctionby other processes, and in fragmented landscapes thesemay result in the collapse of population networks
(Hanski et al. 1995) even in areas that appear climaticallysuitable from the perspective of mean conditions. Suchinteractive e¡ects may explain why P. aegeria appearsmore sensitive to climate change than the model predicts.A number of grid cells with probability values within
the speci¢ed range were simulated to have become lesssuitable for P. aegeria during this century. Many of thesecells lie beyond the species' current and known historicaldistribution in areas of Fennoscandia and Iceland. Thisanomaly appears to result from the current presence ofP. aegeria in mountainous grid cells in other areas of its
range, the climate of which, at their mean elevation, issimilar to the historical climate of these northern cells. Asa result of 20th century warming, these northern gridcells now have climates more similar to northern borealareas where the species is absent, and thus they haveapparently become less suitable for the species.
(c) Habitat fragmentation
P. aegeria is essentially a woodland species in the UK,although it is much less restricted to these habitats in thesouth and west of its UK distribution. The logistical-
regression model, however, was generated for the UKdistribution as a whole and, as a consequence, predictsP. aegeria to occur in areas beyond its range margin thathave very little woodland according to the landcover data(e.g. areas around the Wash and the Vale of York). Themodel also assumes that all woodland is suitable,although this is unlikely to be the case; age and density of
woodland, and size of woodland patches, are likely to beimportant (Thomas et al. 1992). The logistical model maytherefore be predicting P. aegeria in areas at its rangemargin with less woodland than it actually requires, andmay be overestimating its current range limit. However,given that many areas where the logistical model predictsit to occur do appear to have large areas of woodland(e.g. southern Scotland), at least some of these lag e¡ectsare likely to be real. The spatial distribution of woodlandwithin grid cells, as well as the area of woodland per se,will a¡ect the species' distribution (Thomas & Jones1993) and these lag e¡ects indicate that ¢ner-scale habitat
fragmentation is likely to be a¡ecting colonization ratesin P. aegeria.
(d) Rates of expansion
Expansion rates in the UK over the past 30 years,expressed in terms of rate of areal increase, suggest thatP. aegeria could colonize all currently available habitatwithin the next seven years. This is almost certainlyunrealistic given the distribution of suitable but unoccu-pied habitat (¢gure 1c). The estimated marginal velocityof expansion (E) suggests a dispersal rate of approxi-
mately 1km per generation, and although there arecurrently no direct estimates of dispersal for this species,data for other species of intermediate mobility (Hill et al.1996) indicate that this rate is probably realistic forP. aegeria. These data indicate that, in the past, P. aegeriadistribution has expanded at a rate that is consistent withthe likely dispersal rate, and that long-range dispersalevents have not been a major in£uence on its expansion.Although there have been a number of introductions ofP. aegeria during its recent range expansion (see, forexample, Rimmington 1986), these introductions have
generally been into areas just beyond the range margin atthe time and are unlikely to have greatly in£uencedexpansion rates; some introductions may only have beensuccessful because populations were supplemented bycolonists (Rimmington 1986). Given such dispersal rates,and given the location of newly available habitat beyondpresently occupied areas in the UK for the future climatescenario, it is possible that the species will reach equili-brium in the UK by the end of the next century.In contrast to the UK, the potential range expansions
of over 500 km that the model predicts in Fennoscandia
in the 20th century are far greater than the range expan-sions that the species is likely to achieve in that time.Thus P. aegeria's realized European range is likely to lagwell behind its potential range if climate changes of therate and magnitude forecast do indeed occur.
(e) Future climate change
Maps of simulated potential future distributions, suchas that for P. aegeria (¢gure 2d) do not represent forecastsof future distributions but do provide an indication of themagnitude of the potential impact of climate change
1204 J. K. Hill and others Climate and butter£y distribution
Proc. R. Soc. Lond. B (1999)
Figure 4. Expansion of P. aegeria in the UK from 1900 to the
present (¢lled circles) and predicted extent of climatically
suitable habitat for the period 2070^2099 (cf. ¢gure 1d) (opensymbols). Extrapolations predict time to colonize new areas
and are based upon rates of areal increase since 1900 (open
square) and since 1970 (open circle), respectively.
upon species' distributions. Species are likely to respondindividually to future climate change, and new associa-tions among species are likely to arise as climate changes(Huntley et al. 1995; Huntley 1991, 1996; Davis et al.1998b). Newly suitable habitats may also contain newpredators and competitors, making the actual outcomesof any change di¤cult to predict precisely (Davis et al.1998a). However, the results presented here are in agree-ment with current empirical data showing a general pole-ward shift of species distributions over the past century(Parmesan 1996; Parmesan et al. 1999). Our results revealthat even moderately mobile species such as P. aegeriaappear to be lagging behind current climates. Such lagsare likely to be even greater in less mobile species in frag-mented landscapes, and in species with more restrictedhabitat requirements. The consequences of lags for thesespecies will be of particular concern because these speciesare likely to be of high conservation value. Furtherresearch is needed to investigate whether such lags are
common and the degree to which species will be unableto keep track of climate changes in landscapes that arebecoming increasingly fragmented.
We thank the Biological Records Centre (ITE Monks Wood),Richard Fox (Butter£y Conservation), Per Stadel Nielsen (Den-mark), Nils Ryrholm (Sweden), Òistein Berg (Norway), KimmoSaarinen (Finland) and many recorders in the UK for providingbutter£y records.We also thankWolfgang Cramer (PIK Potsdam)for providing the spline surfaces used to interpolate both the pre-sent climate and the HADCM2 anomalies. The output from theHADCM2 transient simulation was supplied by the ClimateImpacts LINK Project (Department of the Environment Con-tract EPG 1/1/16) on behalf of the Hadley Centre and the UKMeteorological O¤ce; David Viner (CRU UEA) kindly facili-tated access to these data. Mark New (CRU UEA) madeavailable the CRU05 gridded historical climate data set. Thisstudy was funded by Natural Environment Research Councilgrant GR9/3016.
REFERENCES
Aagard, K. & Gulbrandsen, J. 1976 Prikkart over norske dagsommer-fugler. Trondheim: Universitetet I Trondheim.
Beerling, D. J., Huntley, B. & Bailey, J. P. 1995 Climate and the
distribution of Fallopia japonica: use of an introduced species to testthe predictive capacity of response surfaces.J.Veg. Sci. 6, 269^282.
Blakeley, D. S. 1997 Overwintering biology of Pararge aegeria.MPhil thesis, University of Leeds.
Bryant, S. R., Thomas, C. D. & Bale, J. S. 1997 Nettle-feeding
nymphalid butter£ies: temperature, development and distri-
bution. Ecol. Entomol. 22, 390^398.Chalmers-Hunt, J. M. & Owen, D. F. 1952 The history and
status of Pararge aegeria (Lep. Satyridae) in Kent. Entomologist85, 145^154.
Coope, G. R. 1978 Constancy of insect species versus incon-
stancy of Quaternary environments. In Diversity of insect faunas(ed. L. A. Mound & N. Walo¡ ), pp. 176^187. Oxford:
Blackwell.
Davis, A. J., Jenkinson, L. S., Lawton, J. H., Shorrocks, B. &Wood,
S.1998aMaking mistakes when predicting shifts in species range
in response to globalwarming.Nature 391,783^786.Davis, A. J., Lawton, J. H., Shorrocks, B. & Jenkinson, L. S.
1998b Individualistic species responses invalidate simple
physiological models of community dynamics under global
environmental change. J. Anim. Ecol. 67, 600^612.
Dennis, R. L. H. & Shreeve,T. G. 1991 Climatic change and the
British butter£y fauna: opportunities and constraints. Biol.Conserv. 55, 1^16.
Dennis, R. L. H. & Shreeve, T. G. 1997 Diversity of butter£ies
on British islands: ecological in£uences underlying the roles
of area, isolation and the size of the faunal source. Biol. J.Linn. Soc. 60, 257^275.
Emmet, A. M. & Heath, J. 1990 The butter£ies of Great Britain andIreland. Colchester, UK: Harley Books.
Fuller, R. M., Groom, G. B. & Jones, A. R. 1994 The land
cover map of Great Britain: an automated classi¢cation of
Landsat thematic mapper data. Photogram. Eng. Rem. Sen. 60,553^562.
Gotthard, K., Nylin, S., & Wiklund, C. 1994 Adaptive
variation in growth rate: life history costs and consequences
in the speckled wood butter£y, Pararge aegeria. Oecologia 99,
281^289.
Hanski, I., PÎyry, J., Pakkala, T. & Kuussaari, M. 1995
Multiple equilibria in metapopulation dynamics. Nature 377,
618^621.
Hill, J. K., Thomas, C. D. & Lewis, O. T. 1996 E¡ects of habitat
patch size and isolation on dispersal by Hesperia comma butter-£ies: implications for metapopulation structure. J. Anim. Ecol.65, 725^735.
Houghton, J. T., Meira Filho, L. G., Callander, B. A., Harris,
N., Kattenberg, A. & Maskell, K. (eds) 1996 Climate change1995: the science of climate change. Intergovernmental Panel on
Climate Change (IPCC) and Cambridge University Press.
Huntley, B. 1991 How plants respond to climate change: migra-
tion rates, individualism and the consequences for plant
communities. Ann. Bot. 67, 15^22.Huntley, B. 1995 Plant species' response to climate change:
implications for the conservation of European birds. Ibis 137(suppl. 1), 127^138.
Huntley, B. 1996 Quaternary palaeoecology and ecology. Quat.Sci. Rev. 15, 591^606.
Huntley, B., Berry, P. M., Cramer, W. & McDonald, A. 1995
Modelling present and potential future ranges of some
European higher plants using climate response surfaces. J.Biogeogr. 22, 967^1001.
Lawton, J. H. 1995 The responses of insects to climate change.
In Insects in a changing environment (ed. R. Harrington & N .E.
Stork), pp. 3^26. London: Academic Press.
Leemans, R. & Cramer, W. 1991 Research Report RR-91-18.
Laxenburg: International Institute for Applied Systems
Analysis (IIASA).
Lees, E. 1962 Factors determining the distribution of the
speckled wood butter£y (Pararge aegeria (L.)) in Gt Britain.
Entomol. Gaz. 13, 101^113.Lensink, R. 1997 Range expansion of raptors in Britain and the
Netherlands since the 1960s: testing an individual-based
di¡usion model. J. Anim. Ecol. 66, 811^826.Marttila, O. & Saarinen, K. 1996 Perhostutkimus Suomessa.Finland: EtalÌ-Karjalan Allergia JaYmpÌristÎinstituutti.
Mitchell, J. F. B., Johns, T. C., Gregory, J. M. & Tett, S. 1995
Climate response to increasing levels of greenhouse gases and
sulphate aerosols. Nature 376, 501^504.Monserud, R. A. & Leemans, R. 1992 Comparing global vege-
tation maps with the Kappa statistic. Ecol. Model. 62,
275^293.
New, M. G., Hulme, M. & Jones, P. D. 1999a Representing 20th
century space^time climate variability. I. Development of a
1961^1990 mean monthly terrestrial climatology. J. Climat.(In the press.)
New, M. G., Hulme, M. & Jones, P. D. 1999b Representing
twentieth century space^time climate variability. II.
Development of 1901^1996 monthly grids of terrestrial
surface climate. J. Climat. (In the press.)
Climate and butter£y distribution J. K. Hill and others 1205
Proc. R. Soc. Lond. B (1999)
Nylin, S., Wiklund, C. & Wickman, P.-O. 1993 Absence of
trade-o¡s between sexual size dimorphism and early male
emergence in a butter£y. Ecology 74, 1414^1427.Parmesan, C. 1996 Climate and species' range. Nature 382,
765^766.
Parmesan, C. (and 12 others) 1999 Climate warming changing
species' distributions. Nature. (In the press.)
Pollard, E. 1979 Population ecology and change in range of the
white admiral butter£y Ladoga camilla L. in England. Ecol.Entomol. 4, 61^74.
Rimmington, W. E. 1986 A reintroduction attempt, the
speckled wood (Pararge aegeria): notes and views. AES Bull.45, 169^175.
Thomas, C. D. & Hanski, I. 1997 Butter£y metapopulations. In
Metapopulation dynamics: ecology, genetics and evolution (ed. I. A.
Hanski & M. E. Gilpin), pp. 359^386. New York: Academic
Press.
Thomas, C. D. & Jones,T. M. 1993 Partial recovery of a skipper
butter£y (Hesperia comma) from population refuges: lessons for
conservation in a fragmented landscape. J. Anim. Ecol. 62,
472^481.
Thomas, C. D., Thomas, J. A. & Warren, M. S. 1992
Distributions of occupied and vacant butter£y habitats in
fragmented landscapes. Oecologia 92, 563^567.Thomas, J. A., Rose, R. J., Clarke, R. T., Thomas, C. D. &
Webb, N. R. 1999 Intraspeci¢c variation in habitat
availability among ectothermic animals near their climatic
limits and their centres of range. Funct. Ecol. (In the press.)
Tolman, T. 1997. Butter£ies of Britain and Europe. London:
HarperCollins.
Turner, J. R. G., Gatehouse, C. M. & Corey, C. A. 1987 Does
solar energy control organic diversity? Butter£ies, moths and
the British climate. Oikos 48, 195^205.Van den Bosch, F., Metz, J. A. J. & Dickman, O. 1990 The velo-
city of spatial population expansion. J. Math. Biol. 28,
529^565.
Yonow,T. & Sutherst, R.W. 1998 The geographic distribution of
the Queensland fruit £y, Bactocera (Dacus) tryoni, in relation to
climate. Aust. J. Agric. Res. 49, 935^953.
As this paper exceeds the maximum length normally permitted,
the authors have agreed to contribute to production costs.
1206 J. K. Hill and others Climate and butter£y distribution
Proc. R. Soc. Lond. B (1999)