clean development mechanism project design document … wind farms in... · clean development...
TRANSCRIPT
PROJECT DESIGN DOCUMENT FORM (CDM PDD) - Version 03.1. CDM – Executive Board page 1
CLEAN DEVELOPMENT MECHANISM PROJECT DESIGN DOCUMENT FORM (CDM-PDD)
Version 03 - in effect as of: 28 July 2006
CONTENTS A. General description of project activity B. Application of a baseline and monitoring methodology C. Duration of the project activity / crediting period D. Environmental impacts E. Stakeholders’ comments
Annexes Annex 1: Contact information on participants in the project activity Annex 2: Information regarding public funding Annex 3: Baseline information
Annex 4: Monitoring plan Appendix 1: Location Map Appendix 2: Minutes of local stakeholder meeting

PROJECT DESIGN DOCUMENT FORM (CDM PDD) - Version 03.1. CDM – Executive Board page 2 SECTION A. General description of project activity A.1 Title of the project activity: >> Title: Enercon Wind Farms in Karnataka Bundled Project – 30.40 MW Version: 1.0 Date of completion of PDD: 15 November 2006 A.2. Description of the project activity: >> Objective of the Project The objective is development, design, engineering, procurement, finance, construction, operation and maintenance of Enercon Wind Farm (Chitradurga) Ltd 8.8 MW and other wind power projects of 21.60 MW capacity (“Project”) in the Indian state of Karnataka to provide reliable, renewable power to the Karnataka state electricity grid which is part of the Southern regional electricity grid. The Project will lead to reduced greenhouse gas emissions because it displaces electricity from fossil fuel based electricity generation plants. Nature of Project The Project harnesses renewable resources in the region, and thereby displacing non-renewable natural resources thereby ultimately leading to sustainable economic and environmental development. Enercon (India) Ltd (“Enercon”) will be the equipment supplier and the operations and maintenance contractor for the Project. The generated electricity will be supplied to Karnataka Power Transmission Company Ltd (“KPTCL”)/ Bangalore Electricity Supply Company Ltd (“BESCOM”) / Hubli Electricity Supply Company Ltd (“HESCOM”) under long-term power purchase agreements (PPA). Enercon Wind Farm (Chitradurga) Ltd is owned by Enercon (India) Ltd and Enercon GmbH and the rest of the projects are owned by Enercon’s customers. The details of the Projects are as under:
1. Enercon Wind Farms (Chitradurga) Ltd: 8.80 MW 2. Steelfab Offshore 0.80 MW 3. Dewanchand Ramsaran: 0.80 MW 4. Elpro International: 0.80 MW 5. Gautam Ladkat: 0.80 MW 6. Sameer Ladkat: 0.80 MW 7. Panama Business Centre: 1.60 MW 8. Balasahab Ladkat: 1.60 MW 9. Panama Infrastructure: 1.60 MW 10. MK Agrotech Private Ltd: 1.60 MW 11. Srinivas Sirigeri: 0.80 MW 12. R.K.Marbles: 0.80 MW 13. Dempo Industries: 0.80 MW 14. Desai Brothers: 0.80 MW 15. Abhilash Garments & Estates (P) Ltd: 0.80 MW 16. Prasad Global Solutions: 1.60 MW 17. Siddaganga Oil Extractions Ltd.: 1.60 MW

PROJECT DESIGN DOCUMENT FORM (CDM PDD) - Version 03.1. CDM – Executive Board page 3
18. Gangadhar Narsingdas Agarwal: 4.00 MW Contribution to sustainable development The Project meets several sustainable development objectives including: • contribution towards the policy objectives of Government of India and Government of Karnataka of
incremental capacity from renewable sources;
• contribution towards meeting the electricity deficit in Karnataka;
• CO2 abatement and reduction of greenhouse gas emissions through development of renewable technology;
• reducing the average emission intensity (SOx, NOx, PM, etc.), average effluent intensity and average solid waste intensity of power generation in the system;
• conserving natural resources including land, forests, minerals, water and ecosystems; and
• developing the local economy and create jobs and employment, particularly in rural areas, which is a priority concern for the Government of India;
A.3. Project participants: >> Name of Party involved ((host) indicates a host Party)
Private and/or public entity(ies) project participants (*) (as applicable)
Kindly indicate if the Party involved wishes to be considered as project participant (Yes/No)
Government of India (Host) Enercon (India) Ltd No Government of Japan Japan Carbon Finance No The contact details of the entities are provided in Annex – 1. All the projects have authorized Enercon (India) Ltd to take them through the CDM process. A.4. Technical description of the project activity: A.4.1. Location of the project activity: >> A.4.1.1. Host Party(ies): >> The host party to the project activity is the Government of India. A.4.1.2. Region/State/Province etc.: >> The Project is located in the State of Karnataka that forms part of the Southern regional electricity grid of India.

PROJECT DESIGN DOCUMENT FORM (CDM PDD) - Version 03.1. CDM – Executive Board page 4 A.4.1.3. City/Town/Community etc: >> Sub-project No. 1 is located in Bhrampura village, Hiriyur talkuk of Chitradurga district. Sub-Projects 2 to 14 are located in village Ittegehalli, Myakenahalli, Katheholle, Goolihosahalli, Lakkihalli, Lingadevarahalli, Mulashiranahalli, all located in Jogimatti wind Zone of Chitradurga district. Sub-Projects 15 to 18 are located in Kapatagudda Wind Zone of Gadag district. A.4.1.4. Detail of physical location, including information allowing the unique identification of this project activity (maximum one page): >> For sub-project 1, the project area extends between latitude 14o 02’ & 14o 04’ North and longitude 76o 27’ & 76o 28’ East. This sub-project is connected to the Aiamangla 66/11 kV KPTCL sub-station. For sub-projects 2 to 10, the project area extends between latitude 13o 57’ & 14o 01’ North and longitude 76o 24’ & 76o 29’ East. These sub-projects are connected to the Hiriyur 220/66/11 kV KPTCL sub-station. For sub-projects 11 to 14, the project area extends between latitude 13o 58’ & 14o 02’ North and longitude 76o 17’ & 76o 20’ East. These sub-projects are connected to the Ramgiri 66/11 kV KPTCL sub-station. For sub-projects 15 to 18, the project area extends between latitude 14o 11’ & 14o 14’ North and longitude 76o 43’ & 76o 45’ East. These sub-projects are connected to the Dambal 110/33/11 kV KPTCL sub-station. The sites are located at a distance of 200 km from Bangalore by road. The nearest railway station is at Bangalore. A location map is attached at Appendix – 1. A.4.2. Category(ies) of project activity: >> The project activity is considered under CDM category zero-emissions ‘grid-connected electricity generation from renewable sources’ that generates electricity in excess of 15 MW (limit for small scale project). Therefore as per the scope of the project activity enlisted in the ‘list of sectoral scopes and related approved baseline and monitoring methodologies (version 02 Mar 05/07:23)’, the project activity may principally be categorized in Scope Number 1, Sectoral Scope - Energy industries (renewable/ non-renewable sources). A.4.3. Technology to be employed by the project activity: >>
The Project involves 38 wind energy converters (WECs) of Enercon make 800 kW E-48 with internal electrical lines connecting the Project with local evacuation facility. The WECs generates 3-phase power at 400V, which is stepped up to 33 KV. The Project can operate in the frequency range of 47.5–51.5 Hz and in the voltage range of 400 V ± 12.5%. The other salient features of the state-of-art-technology are: • Gearless Construction - Rotor & Generator Mounted on same shaft eliminating the Gearbox. • Variable speed function – has the speed range of 18 to 33 RPM thereby ensuring optimum efficiency
at all times.

PROJECT DESIGN DOCUMENT FORM (CDM PDD) - Version 03.1. CDM – Executive Board page 5 • Variable Pitch functions ensuring maximum energy capture. • Near Unity Power Factor at all times. • Minimum drawl (less than 1% of kWh generated) of Reactive Power from the grid. • No voltage peaks at any time. • Operating range of the WEC with voltage fluctuation of -20 to +20%. • Less Wear & Tear since the system eliminates mechanical brake, which are not needed due to low
speed generator which runs at maximum speed of 33 rpm and uses Air Brakes. • Three Independent Braking System. • Generator achieving rated output at only 33 rpm. • Incorporates lightning protection system, which includes blades. • Starts Generation of power at wind speed of 3 m/s. Enercon (India) Ltd has secured and facilitated the technology transfer for wind based renewable energy generation from Enercon GmbH, has established a manufacturing plant at Daman in India, where along with other components the "Synchronous Generators" using "Vacuum Impregnation" technology are manufactured.
A.4.4 Estimated amount of emission reductions over the chosen crediting period: >> Crediting Period for the Project: fixed for 10 years Years Annual estimation of emission
reductions in tones of CO2e
2008 73,211 2009 73,211 2010 73,211 2011 73,211 2012 73,211 2013 73,211 2014 73,211 2015 73,211 2016 73,211 2017 73,211
Total estimated reductions (tonnes of CO2e) 732,110
Total number of crediting years 10
Annual average over the crediting period of estimated reductions (tonnes of CO2e)
73,211

PROJECT DESIGN DOCUMENT FORM (CDM PDD) - Version 03.1. CDM – Executive Board page 6 A.4.5. Public funding of the project activity: >> There is no ODA financing involved in the Project. SECTION B. Application of a baseline and monitoring methodology B.1. Title and reference of the approved baseline and monitoring methodology applied to the project activity: >> The approved consolidated baseline and monitoring methodology ACM0002 Version 6.0 (19 May 2006) has been used. The titles of these baseline and monitoring methodologies are “Consolidated baseline methodology for grid-connected electricity generation from renewable sources” and “Consolidated monitoring methodology for grid-connected electricity generation from renewable sources. B.2 Justification of the choice of the methodology and why it is applicable to the project activity: >> The Project is wind based renewable energy source, zero emission power project connected to the Karnataka state grid, which forms part of the Southern regional electricity grid. The Project will displace fossil fuel based electricity generation that would have otherwise been provided by the operation and expansion of the fossil fuel based power plants in Southern regional electricity grid. The approved consolidated baseline and monitoring methodology ACM0002 Version 6 is the choice of the baseline and monitoring methodology and it is applicable because: • the Project is grid connected renewable power generation project activity • the Project represents electricity capacity additions from wind sources • the Project does not involve switching from fossil fuel to renewable energy at the site of project
activity since the Project is green-field electricity generation capacities from wind sources at sites where there was no electricity generation source prior to the Project, and
• the geographical and system boundaries of the Southern electricity grid can be clearly identified and information on the characteristics of the grid is available.
B.3. Description of the sources and gases included in the project boundary >> The project boundary encompasses the physical, geographical site of the Project sited at the Project Location. It would include the wind turbine installations and pooling sub-stations up to the Metering Point. According to ACM0002, for the baseline emission factor, the spatial extent of the project boundary includes the project site and all power plants connected physically to the electricity system that the CDM project power plant is connected to. The Indian electricity system is divided into five regional grids, viz. Northern, Eastern, Western, Southern, and North-Eastern. Each grid covers several states. As the regional grids are interconnected,

PROJECT DESIGN DOCUMENT FORM (CDM PDD) - Version 03.1. CDM – Executive Board page 7 there is inter-state and inter-regional exchange. A small power exchange also takes place with neighbouring countries like Bhutan and Nepal. Power generation and supply within the regional grid is managed by Regional Load Dispatch Centre (RLDC). The Regional Power Committees (RPCs) provide a common platform for discussion and solution to the regional problems relating to the grid. Each state in a regional grid meets its demand with its own generation facilities and also with allocation from power plants owned by the Central Sector such as NTPC and NHPC etc. Specific quotas are allocated to each state from the Central Sector power plants. Depending on the demand and generation, there are electricity exports and imports between states in the regional grid. The regional grid thus represents the largest electricity grid where power plants can be dispatched without significant constraints and thus, represents the “project electricity system” for the Project. As the Project is connected to the Southern regional electricity grid, the Southern grid is the “project electricity system”. Grid connected captive power plants have not been included because adequate detail of data (for example, fuel consumption) is not available. In addition, data on certain utility power plants was not available and these were excluded from the project electricity system. Even though data on individual renewable energy projects is not available, they have been included using appropriate assumptions. Source Gas Included? Justification/ Explanation
CO2 Included Main emission source CH4 Excluded This source is not required to be
estimated for wind energy projects under ACM0002
Bas
elin
e
Electricity generation from power plants connected to the Southern Grid
N2O Excluded This source is not required to be estimated for wind energy projects under ACM0002
CO2 Excluded CH4 Excluded
Proj
ect
Act
ivity
Electricity generation from the Project
N2O Excluded
Wind energy generation does not have any direct GHG emissions.
B.4. Description of how the baseline scenario is identified and description of the identified baseline scenario: >> According to ACM0002, for project activities that do not modify or retrofit an existing electricity generation facility, the baseline scenario is the following: Electricity delivered to the grid by the project would have otherwise been generated by the operation of grid-connected power plants and by the addition of new generation sources, as reflected in the combined margin (CM) calculations described below. As the Project does not modify or retrofit an existing generation facility, the baseline scenario is the emissions generated by the operation of grid-connected power plants and by the addition of new generation sources. This is estimated using calculation of Combined Margin multiplied by electricity delivered to the grid by the Project.

PROJECT DESIGN DOCUMENT FORM (CDM PDD) - Version 03.1. CDM – Executive Board page 8 B.5. Description of how the anthropogenic emissions of GHG by sources are reduced below those that would have occurred in the absence of the registered CDM project activity (assessment and demonstration of additionality): >> Step 0: Preliminary screening based on the starting date of the project activity If project participants wish to have the crediting period starting prior to the registration of their project activity, they shall:
a) Provide evidence that the starting date of the CDM project activity falls between 1 January 2000 and the date of the registration of a first CDM project activity, bearing in mind that only CDM project activities submitted for registration before 31 December 2005 may claim for a crediting period starting before the date of registration.
b) Provide evidence that the incentive from the CDM was seriously considered in the decision to proceed with the project activity. This evidence shall be based on (preferably official, legal and/or other corporate) documentation that was available at, or prior to, the start of the project activity.
The Project start date is prior to the date of validation of the PDD. Wind power projects prior to the implementation Project were required to share CDM revenues with KPTCL in accordance with the PPAs approved by Karnataka Electricity Regulatory Commission (KERC). While KPTCL requested KERC to retain the sharing of CDM revenues, KERC removed the sharing of CDM revenues with KPTCL while approving the PPAs for the Project recognizing the nascent stage of the CDM market and potential adverse impact on new investments. The various regulatory orders that a) allowed CDM benefits to be shared between KPTCL and the developers for earlier projects, and b) did not allow KPTCL to share CDM benefits with developers will be provided to the validator. Enercon’s management had considered CDM benefits in wind power development and already had experience with CDM process (CERUPT tender of 2001, Letter of Intent for other wind power projects in Karnataka in December 2003, etc.). It had also informed its customers of the CDM benefits. Evidence for this is available which will be provided to the validator. Enercon had entered into discussions with a CER purchaser for purchase of emission reductions and a Memorandum of Understanding was signed on 1st July 2005, which is prior to the start date of the Project. Step 1: Identification of alternatives to the project activity consistent with current laws and regulations
Sub-step 1a. Define alternatives to the project activity:
1. Identify realistic and credible alternative(s) available to the project participants or similar project developers that provide outputs or services comparable with the proposed CDM project activity. These alternatives are to include:
The proposed project activity not undertaken as a CDM project activity;
All other plausible and credible alternatives to the project activity that deliver outputs and on services (e.g. electricity, heat or cement) with comparable quality, properties and application areas;
PROJECT DESIGN DOCUMENT FORM (CDM PDD) - Version 03.1. CDM – Executive Board page 9 If applicable, continuation of the current situation (no project activity or other alternatives
undertaken).
Alternative(s) available to the project participants or similar project developers include:
(a) The Project is not undertaken as a CDM project activity.
(b) Setting up of comparable utility scale fossil fuel fired or hydro power projects that supply to the Karnataka grid under a PPA.
(c) Continuation of the current situation where no project activity or any of the above Alternatives are undertaken would not be applicable as Karnataka had energy (MU) shortages of 0.7% and peak (MW) shortages of 9.8% in 2005-06 (Source: Southern Region Power Sector Profile, August 2006, Ministry of Power).
Sub-step 1b. Enforcement of applicable laws and regulations
2. The alternative(s) shall be in compliance with all applicable legal and regulatory requirements, even if these laws and regulations have objectives other than GHG reductions, e.g. to mitigate local air pollution. This sub-step does not consider national and local policies that do not have legally-binding status.
3. If an alternative does not comply with all applicable legislation and regulations, then show that, based on an examination of current practice in the country or region in which the law or regulation applies, those applicable legal or regulatory requirements are systematically not enforced and that non-compliance with those requirements is widespread in the country. If this cannot be shown, then eliminate the alternative from further consideration.
4. If the proposed project activity is the only alternative amongst the ones considered by the project participants that is in compliance with all regulations with which there is general compliance, then the proposed CDM project activity is not additional.
There are no legal and regulatory requirements that prevent Alternatives (a) and (b) from occurring. Proceed to Step 2 (Investment analysis) or Step 3 (Barrier analysis). (Project participants may also select to complete both steps 2 and 3.) Step 2: Investment Analysis Determine whether the proposed project activity is the economically or financially less attractive than other alternatives without the revenue from the sale of certified emission reductions (CERs). To conduct the investment analysis, use the following sub-steps: Sub-step 2a. - Determine appropriate analysis method 1. Determine whether to apply simple cost analysis, investment comparison analysis or benchmark
analysis (sub-step 2b). If the CDM project activity generates no financial or economic benefits other than CDM related income, then apply the simple cost analysis (Option I). Otherwise, use the investment comparison analysis (Option II) or the benchmark analysis (Option III).
Sub-step 2b. – Option I. Apply simple cost analysis 2. Document the costs associated with the CDM project activity and demonstrate that the activity
produces no economic benefits other than CDM related income. Sub-step 2b. – Option II. Apply investment comparison analysis
PROJECT DESIGN DOCUMENT FORM (CDM PDD) - Version 03.1. CDM – Executive Board page 10 3. Identify the financial indicator, such as IRR, NPV, cost benefit ratio, or unit cost of service (e.g.,
levelized cost of electricity production in $/kWh or levelized cost of delivered heat in $/GJ) most suitable for the project type and decision-making context.
Sub-step 2b. – Option III. Apply benchmark analysis 4. Identify the financial indicator, such as IRR, NPV, cost benefit ratio, or unit cost of service (e.g.,
levelized cost of electricity production in $/kWh or levelized cost of delivered heat in $/GJ) most suitable for the project type and decision context.
Option I – Simple cost analysis is not applicable as the project activity sells electricity to the grid and obtains economic benefits in the form of electricity tariffs.
Enercon proposes to use Option II – Investment comparison analysis and the financial indicator that is identified is the post-tax return on equity or the equity IRR.
The post tax return on equity and equity IRR is used as the appropriate financial indicator because in the Indian power sector, a 14% post tax return on equity is an established benchmark for projects in public or private sector based on cost-plus regulations (Source: Central Electricity Regulatory Commission, Terms and Conditions of Tariff, Regulations 2004 dated 26 March 2004) for utility scale power plants (similar to Alternative (b)). Incentives, foreign exchange variations and efficiency in operations are in addition to this benchmark of 14%.
For determining the tariffs for wind power projects, the electricity regulatory commissions of the state of Rajasthan and Gujarat have considered the return on equity at 14% while the electricity regulatory commissions of the state of Madhya Pradesh, Maharashtra and Karnataka have considered the return on equity at 16%. (Source: RERC Order dated 29 September 2006). There are some essential differences between the Project (whether implemented with or without CDM revenues) and the Alternatives identified in Sub-step 1(b) (utility scale fossil fuel and hydro projects). These should be taken into account while setting the appropriate level of equity IRR.
• The project activity tariff structure is a single-part tariff structure as compared to utility scale fossil fuel and hydro projects, which have two-part tariff structure. This implies that project activity carries a higher investment risk than the utility scale fossil fuel and hydro projects (Alternative (b)) where the investment recovery is decoupled from the level of actual generation achieved by the project due to variations in offtake.
Thus, in case of the project activity, issues such as transmission unavailability, back-down of generation or part-load operations, which are beyond the control of the investors are likely to affect the project activity more severely and therefore the project activity investors would require higher rate of return to compensate them for these additional risks.
• In case of utility scale fossil fuel and hydro projects (Alternative (b)), these are by reference to cost-plus approach whereby the projects recover their full investment cost each year if they are able to reach specified level of plant availability. In case of the Project, it does not recover its full investment cost in the initial years as the tariffs are back-loaded. This increases the investment risks in the project activity compared to the alternatives.
Based on the above considerations, 16% post-tax equity IRR is considered to be the appropriate post-tax equity return. If the Project has a post-tax equity IRR of less than 16%, then it can be considered to be additional. Sub-step 2c. Calculation and comparison of financial indicators (only applicable to options II and III):
PROJECT DESIGN DOCUMENT FORM (CDM PDD) - Version 03.1. CDM – Executive Board page 11 5. Calculate the suitable financial indicator for the proposed CDM project activity and, in the case of
Option II above, for the other alternatives. Include all relevant costs (including, for example, the investment cost, the operations and maintenance costs), and revenues (excluding CER revenues, but including subsidies/fiscal incentives where applicable), and, as appropriate, non-market cost and benefits in the case of public investors.
6. Present the investment analysis in a transparent manner and provide all the relevant assumptions in the CDM-PDD, so that a reader can reproduce the analysis and obtain the same results. Clearly present critical techno-economic parameters and assumptions (such as capital costs, fuel prices, lifetimes, and discount rate or cost of capital). Justify and/or cite assumptions in a manner that can be validated by the DOE. In calculating the financial indicator, the project’s risks can be included through the cash flow pattern, subject to project-specific expectations and assumptions (e.g. insurance premiums can be used in the calculation to reflect specific risk equivalents).
7. Assumptions and input data for the investment analysis shall not differ across the project activity and its alternatives, unless differences can be well substantiated.
8. Present in the CDM-PDD submitted for validation a clear comparison of the financial indicator for the proposed CDM activity and:
(a) The alternatives, if Option II (investment comparison analysis) is used. If one of the other alternatives has the best indicator (e.g. highest IRR), then the CDM project activity can not be considered as the most financially attractive;
(b) The financial benchmark, if Option III (benchmark analysis) is used. If the CDM project activity has a less favourable indicator (e.g. lower IRR) than the benchmark, then the CDM project activity cannot be considered as financially attractive.
The key assumptions used for calculating the benchmark (post-tax equity IRR) are set out below. This has been done for the 8.8 MW Enercon Wind Farm (Chitradurga) Ltd which is executed through a Special Purpose Vehicle (SPV) and thus brings out transparently the equity IRR:
Capacity of Machines in kW 800 Number of Machines 11 Project Capacity in MW 8.80 Project Commissioning Date 1-May-06 Project Cost per MW (Rs. In Millions) 50.0 Operations
Plant Load Factor 26.5% Insurance Charges @ % of capital cost 0.18% Operation & Maintanance Cost base year @ % of capital
cost 1.25% % of escalation per annum on O & M Charges 5.0%
Tariff
Base year Tariff for 10 years - Rs./Kwh 3.40 Annual Escalation (Rs./kWh per Year) 0.00

PROJECT DESIGN DOCUMENT FORM (CDM PDD) - Version 03.1. CDM – Executive Board page 12
Tariff applicable after 10 years (Rs/kWh)
Cost plus 16% return on equity
Project Cost Rs Million
Land and Infrastructure, Generator & Electrical Equipments, Mechanical Equipments, Civil Works, Instrumentation & Control, Other Project Cost, Pre operative Expenses, etc.
Total Project Cost 440
Means of Finance Rs Million Own Source 30% 132 Term Loan 70% 308 Total Source 440 Terms of Loan
Interest Rate 8.50%
Tenure 10 Years
Moratorium 6 Months Income Tax Depreciation Rate (Written Down Value basis)
on Wind Energy Generators 80% On other Assets 10%
Book Depreciation Rate (Straight Line Method basis) On all assets 7.86%
Book Depreciation up to (% of asset value) 90% Income Tax
Income Tax rate 30% Minimum Alternate Tax 10% Surcharge 10% Cess 2%
Working capital
Receivables (no of days) 45 O & m expenses (no of days) 30 Working capital interest rate 12%
CER Revenues
CER Price in US$ -
PROJECT DESIGN DOCUMENT FORM (CDM PDD) - Version 03.1. CDM – Executive Board page 13
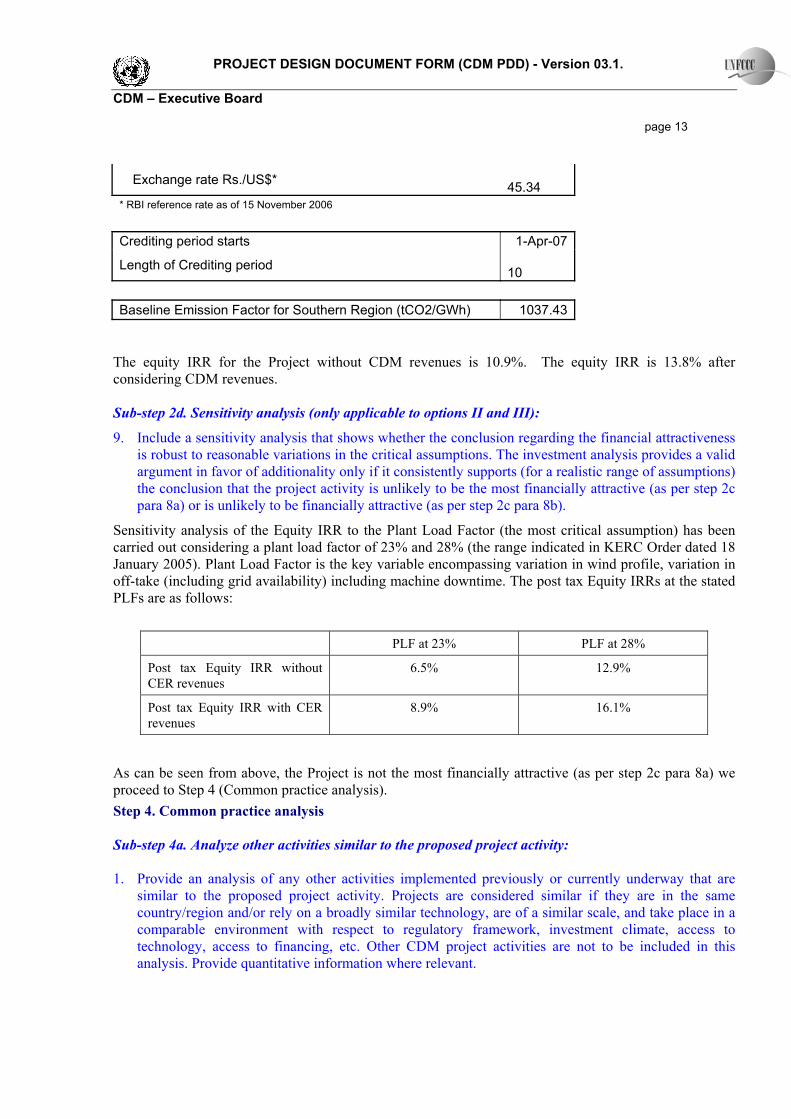
Exchange rate Rs./US$* 45.34
* RBI reference rate as of 15 November 2006 Crediting period starts 1-Apr-07
Length of Crediting period 10
Baseline Emission Factor for Southern Region (tCO2/GWh) 1037.43
The equity IRR for the Project without CDM revenues is 10.9%. The equity IRR is 13.8% after considering CDM revenues. Sub-step 2d. Sensitivity analysis (only applicable to options II and III):
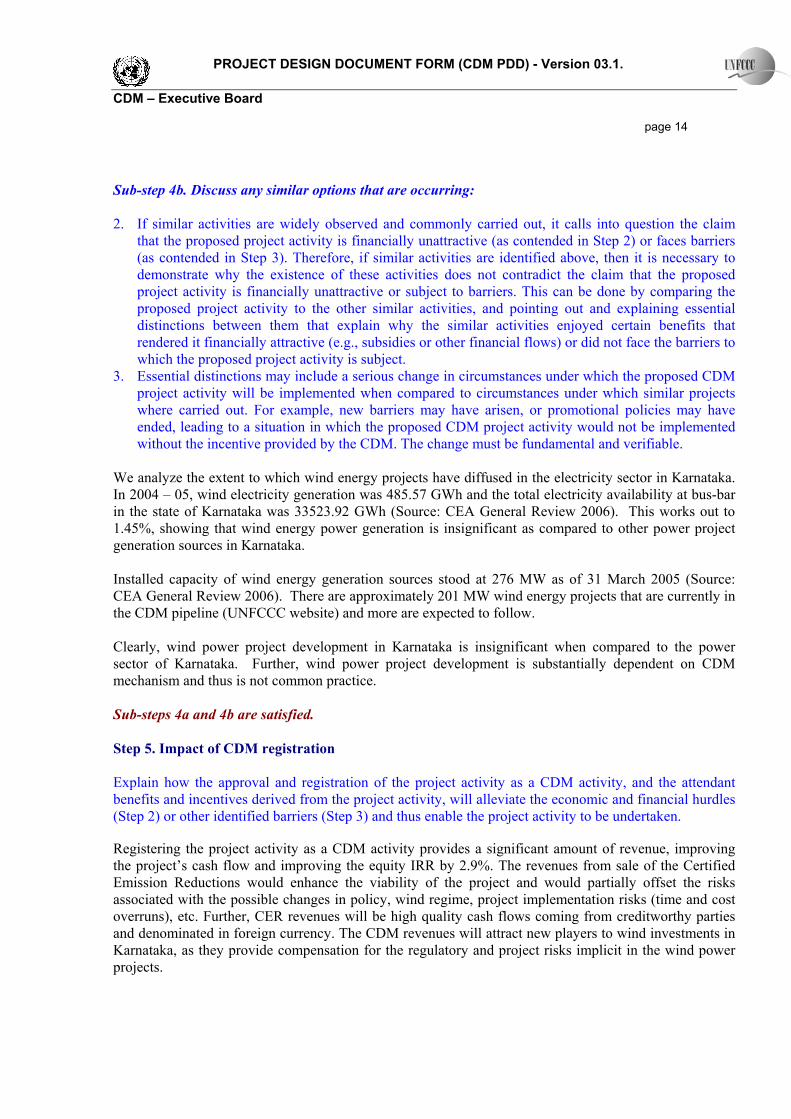
9. Include a sensitivity analysis that shows whether the conclusion regarding the financial attractiveness is robust to reasonable variations in the critical assumptions. The investment analysis provides a valid argument in favor of additionality only if it consistently supports (for a realistic range of assumptions) the conclusion that the project activity is unlikely to be the most financially attractive (as per step 2c para 8a) or is unlikely to be financially attractive (as per step 2c para 8b).
Sensitivity analysis of the Equity IRR to the Plant Load Factor (the most critical assumption) has been carried out considering a plant load factor of 23% and 28% (the range indicated in KERC Order dated 18 January 2005). Plant Load Factor is the key variable encompassing variation in wind profile, variation in off-take (including grid availability) including machine downtime. The post tax Equity IRRs at the stated PLFs are as follows:
PLF at 23% PLF at 28%
Post tax Equity IRR without CER revenues
6.5% 12.9%
Post tax Equity IRR with CER revenues
8.9% 16.1%
As can be seen from above, the Project is not the most financially attractive (as per step 2c para 8a) we proceed to Step 4 (Common practice analysis). Step 4. Common practice analysis Sub-step 4a. Analyze other activities similar to the proposed project activity: 1. Provide an analysis of any other activities implemented previously or currently underway that are
similar to the proposed project activity. Projects are considered similar if they are in the same country/region and/or rely on a broadly similar technology, are of a similar scale, and take place in a comparable environment with respect to regulatory framework, investment climate, access to technology, access to financing, etc. Other CDM project activities are not to be included in this analysis. Provide quantitative information where relevant.
PROJECT DESIGN DOCUMENT FORM (CDM PDD) - Version 03.1. CDM – Executive Board page 14
Sub-step 4b. Discuss any similar options that are occurring: 2. If similar activities are widely observed and commonly carried out, it calls into question the claim
that the proposed project activity is financially unattractive (as contended in Step 2) or faces barriers (as contended in Step 3). Therefore, if similar activities are identified above, then it is necessary to demonstrate why the existence of these activities does not contradict the claim that the proposed project activity is financially unattractive or subject to barriers. This can be done by comparing the proposed project activity to the other similar activities, and pointing out and explaining essential distinctions between them that explain why the similar activities enjoyed certain benefits that rendered it financially attractive (e.g., subsidies or other financial flows) or did not face the barriers to which the proposed project activity is subject.
3. Essential distinctions may include a serious change in circumstances under which the proposed CDM project activity will be implemented when compared to circumstances under which similar projects where carried out. For example, new barriers may have arisen, or promotional policies may have ended, leading to a situation in which the proposed CDM project activity would not be implemented without the incentive provided by the CDM. The change must be fundamental and verifiable.
We analyze the extent to which wind energy projects have diffused in the electricity sector in Karnataka. In 2004 – 05, wind electricity generation was 485.57 GWh and the total electricity availability at bus-bar in the state of Karnataka was 33523.92 GWh (Source: CEA General Review 2006). This works out to 1.45%, showing that wind energy power generation is insignificant as compared to other power project generation sources in Karnataka. Installed capacity of wind energy generation sources stood at 276 MW as of 31 March 2005 (Source: CEA General Review 2006). There are approximately 201 MW wind energy projects that are currently in the CDM pipeline (UNFCCC website) and more are expected to follow. Clearly, wind power project development in Karnataka is insignificant when compared to the power sector of Karnataka. Further, wind power project development is substantially dependent on CDM mechanism and thus is not common practice. Sub-steps 4a and 4b are satisfied. Step 5. Impact of CDM registration Explain how the approval and registration of the project activity as a CDM activity, and the attendant benefits and incentives derived from the project activity, will alleviate the economic and financial hurdles (Step 2) or other identified barriers (Step 3) and thus enable the project activity to be undertaken. Registering the project activity as a CDM activity provides a significant amount of revenue, improving the project’s cash flow and improving the equity IRR by 2.9%. The revenues from sale of the Certified Emission Reductions would enhance the viability of the project and would partially offset the risks associated with the possible changes in policy, wind regime, project implementation risks (time and cost overruns), etc. Further, CER revenues will be high quality cash flows coming from creditworthy parties and denominated in foreign currency. The CDM revenues will attract new players to wind investments in Karnataka, as they provide compensation for the regulatory and project risks implicit in the wind power projects.

PROJECT DESIGN DOCUMENT FORM (CDM PDD) - Version 03.1. CDM – Executive Board page 15 B.6. Emission reductions:
B.6.1. Explanation of methodological choices: >> According to the approved baseline methodology ACM0002, the emission reductions ERy by the project activity during a given year “y1” is ERy = BEy – PEy – Ly……………….(1) where EGy is the electricity supplied to the grid, EFy is the CO2 emission factor of the grid and Ly is the amount of emissions leakage resulting from the project activity. Baseline Emissions for the amount of electricity supplied by project activity, BEy is calculated as BEy = EGy * EFy …………………….(2)
where EGy is the electricity supplied to the grid, EFy is the CO2 emission factor of the grid as calculated below. The emission factor EFy of the grid is represented as a combination of the Operating Margin (OM) and the Build Margin (BM). Considering the emission factors for these two margins as EFOM,y and EFBM,y, then the EFy is given by: EFy = wOM * EFOM,y + wBM * EFBM,y…………………………..(2)
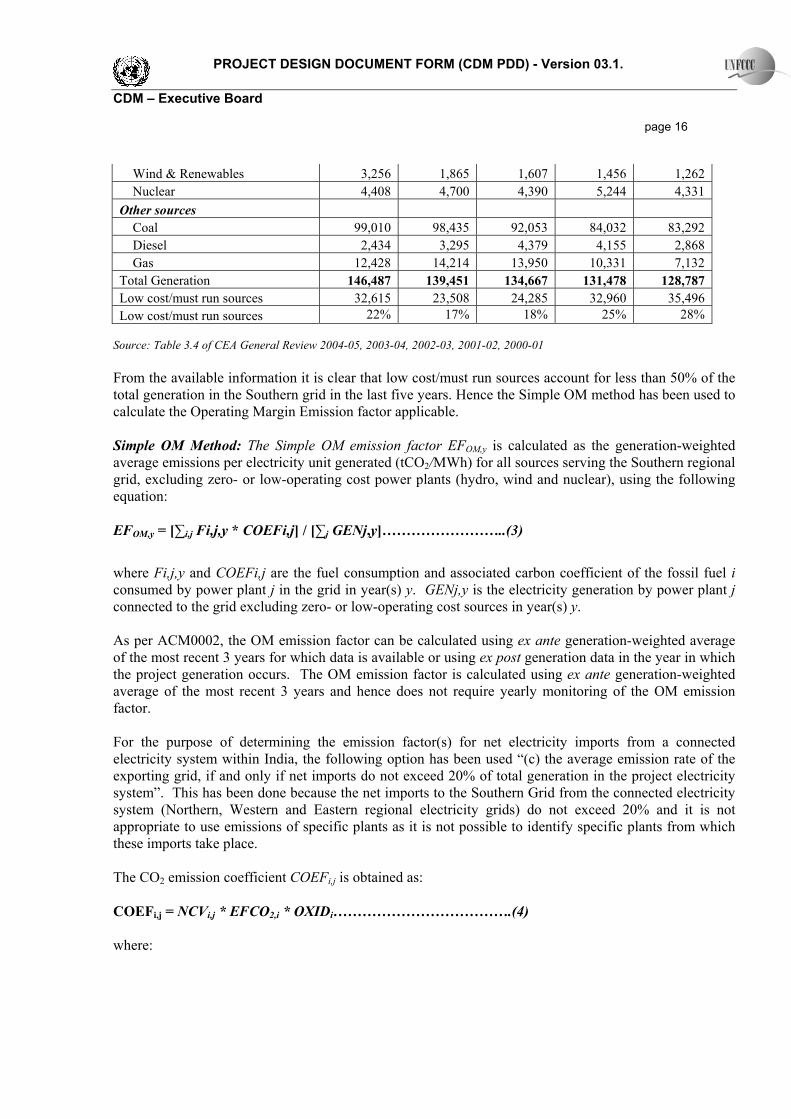
with respective weight factors wOM and wBM (where wOM + wBM = 1). The Operating Margin emission factor As per ACM0002, dispatch data analysis should be the first methodological choice. However, this option is not selected because the information required to calculate OM based on dispatch data is not available in the public domain for the Southern electricity regional grid. The Simple Operating Margin approach has been used to calculate the Operating Margin emission factor applicable in this case. As per ACM 0002 the Simple OM method can only be used where low cost must run resources constitute less than 50% of grid generation based on average of the five most recent years. The generation profile of the Southern grid in the last five years is as follows: Generation in GWh 2004-05 2003-04 2002-03 2001-02 2000-01 Low cost/must run sources
Hydro 24,951 16,943 18,288 26,260 29,902
1 Throughout the document, the suffix y denotes that such parameter is a function of the year y, thus to be monitored at least annually.
PROJECT DESIGN DOCUMENT FORM (CDM PDD) - Version 03.1. CDM – Executive Board page 16
Wind & Renewables 3,256 1,865 1,607 1,456 1,262 Nuclear 4,408 4,700 4,390 5,244 4,331
Other sources Coal 99,010 98,435 92,053 84,032 83,292 Diesel 2,434 3,295 4,379 4,155 2,868 Gas 12,428 14,214 13,950 10,331 7,132
Total Generation 146,487 139,451 134,667 131,478 128,787 Low cost/must run sources 32,615 23,508 24,285 32,960 35,496 Low cost/must run sources 22% 17% 18% 25% 28%
Source: Table 3.4 of CEA General Review 2004-05, 2003-04, 2002-03, 2001-02, 2000-01 From the available information it is clear that low cost/must run sources account for less than 50% of the total generation in the Southern grid in the last five years. Hence the Simple OM method has been used to calculate the Operating Margin Emission factor applicable. Simple OM Method: The Simple OM emission factor EFOM,y is calculated as the generation-weighted average emissions per electricity unit generated (tCO2/MWh) for all sources serving the Southern regional grid, excluding zero- or low-operating cost power plants (hydro, wind and nuclear), using the following equation: EFOM,y = [∑i,j Fi,j,y * COEFi,j] / [∑j GENj,y]……………………..(3)
where Fi,j,y and COEFi,j are the fuel consumption and associated carbon coefficient of the fossil fuel i consumed by power plant j in the grid in year(s) y. GENj,y is the electricity generation by power plant j connected to the grid excluding zero- or low-operating cost sources in year(s) y. As per ACM0002, the OM emission factor can be calculated using ex ante generation-weighted average of the most recent 3 years for which data is available or using ex post generation data in the year in which the project generation occurs. The OM emission factor is calculated using ex ante generation-weighted average of the most recent 3 years and hence does not require yearly monitoring of the OM emission factor. For the purpose of determining the emission factor(s) for net electricity imports from a connected electricity system within India, the following option has been used “(c) the average emission rate of the exporting grid, if and only if net imports do not exceed 20% of total generation in the project electricity system”. This has been done because the net imports to the Southern Grid from the connected electricity system (Northern, Western and Eastern regional electricity grids) do not exceed 20% and it is not appropriate to use emissions of specific plants as it is not possible to identify specific plants from which these imports take place. The CO2 emission coefficient COEFi,j is obtained as: COEFi,j = NCVi,j * EFCO2,i * OXIDi……………………………….(4) where:

PROJECT DESIGN DOCUMENT FORM (CDM PDD) - Version 03.1. CDM – Executive Board page 17 NCVi,j is the net calorific value (energy content) per mass or volume unit of a fuel i, OXIDi is the oxidation factor of the fuel, EFCO2,i is the CO2 emission factor per unit of energy of the fuel i. Build Margin Emission Factor The Build Margin emission factor EF_BMy (tCO2/GWh) is given as the generation-weighted average emission factor of the selected representative set of recent power plants represented by the 5 most recent plants or the most recent 20% of the generating units built (summation is over such plants specified by k):2 EFBM,y = [∑i Fi,m,y*COEFi] / [∑k GENk,m,y]………………………..(5) as the default method. The summation over i and k is for the fuels and electricity generation of the plants in sample m mentioned above. The choice of method for the sample plant is the most recent 20% of the generating units built as this represents a significantly larger set of plants for a large regional electricity grid have a large number of power plants connected to it and is therefore appropriate. The calculation of the net generation for 5 most recent built and for the most recent 20% of the generation units built is shown in the calculation of Build Margin in Annex – 3. The Build Margin is calculated on ex ante based on the most recent information available on power plants already built for sample group m at the time of the PDD preparation. Combined Margin Emission Factor As already mentioned, baseline emission factor (EFy) of the grid is calculated as a combined margin (CM), calculated as the weighted average of the operating margin (OM) and build margin (BM) factor. In case of wind power projects default weights of 0.75 for EFOM and 0.25 for EFBM are applicable as per ACM0002. No alternate weights are proposed. Using the above mentioned formulas for calculation of operating margin and build margin emission factors and their respective weights for calculation of combined margin emission factor, the baseline carbon emission factor (CM) is 1,037.43 tCO2e/GWh or 1.03743 tCO2e/MWh. Project Emissions: The project activity uses wind power to generate electricity and hence the emissions from the project activity are taken as nil. PEy = 0
2 The project participant is to demonstrate which is appropriate for the proposed project to the Operational Entity, otherwise, more conservative one is selected.

PROJECT DESIGN DOCUMENT FORM (CDM PDD) - Version 03.1. CDM – Executive Board page 18 Leakage: Emissions Leakage on account of the project activity is ignored in accordance with ACM0002. Ly = 0
B.6.2. Data and parameters that are available at validation: >>
Data / Parameter: Net Calorific Value of Coal, Furnace Oil, HSD, Light Oil, LSHS, Lignite Data unit: Terra Joules per 103 tons Description: The Net Calorific Value has been used for calculating the emission coefficients of fuels. Source of data used: Data published in Table 1.3 of Central Electricity Authority (CEA) General Review of
Power Sector for 2004-05, 2003-04 and 2002-03 has been used for all fuels except for HSD. Calorific value of HSD is taken from data published by CEA on petroleum fuels used by GT and Diesel power plants in India in 2003-04.
Value applied: 2002-03 2003-04 2004-05 Coal 17.46 15.99 15.72 Furnace oil 44.91 43.40 43.68 Light oil 40.86 42.65 43.00 LSHS/HHS/HSD
44.06 43.13 43.64
Lignite 11.25 11.46 11.40 HSD 42.71 42.71 42.71
Justification of the choice of data or description of measurement methods and procedures actually applied :
As per ACM0002, wherever available, country specific Net Calorific Values should be used for calculation. Accordingly the Net Calorific Value data published by the Central Electricity Authority, Ministry of Power, Govt. of India has been used. HSD Calorific values are not published in the CEA General Review, hence the value as per CEA data on petroleum fuels used by GT and Diesel power plants in India in 2003-04 was used. This publication is only available for 2003-04 hence the 2003-04 Calorific value has been used for all three years i.e. 2002-03, 2003-04 and 2004-05.
Any comment:
Data / Parameter: Net Calorific Value of Naphtha, Natural Gas Data unit: Terra Joules per M.cum Description: The Net Calorific Value has been used for calculating the emission coefficients of
Naphtha and Natural Gas. Source of data used: Data published by CEA on petroleum fuels used by GT and Diesel power plants in
India in 2003-04. Value applied:
2002-03 2003-04 2004-05 Natural Gas 34.12 34.12 34.12

PROJECT DESIGN DOCUMENT FORM (CDM PDD) - Version 03.1. CDM – Executive Board page 19
Naphtha 46.89 46.89 46.89 Justification of the choice of data or description of measurement methods and procedures actually applied :
HSD Calorific values are not published in the CEA General Review, hence the value as per CEA data on petroleum fuels used by GT and Diesel power plants in India in 2003-04 was used. This publication is only available for 2003-04 hence the 2003-04 Calorific value has been used for all three years i.e. 2002-03, 2003-04 and 2004-05.
Any comment:
Data / Parameter: Carbon Emission Factor Data unit: Tonnes Carbon per Terra Joule Description: Carbon Emission Factor has been used for calculating the emission coefficients of
different fuel types Source of data used: In case of Coal and Lignite, Carbon Emission Factor as per India’s first National
Communication to the UNFCCC has been used. For all other fuels, default values as per table 1-4 of Revised 1996 IPCC Guidelines for National Greenhouse Gas Inventories: Workbook has been used.
Value applied: Coal 26.13 Furnace oil 21.10 Light oil 20.00 LSHS/HHS/HSD 20.20 Lignite 28.95 Natural Gas 15.30 Naphtha 20.00 HSD 20.20
Justification of the choice of data or description of measurement methods and procedures actually applied :
As per ACM0002, wherever available, country specific values of Carbon Emission Factors should be used for calculation. Accordingly the Emission Factors data as per India’s first National Communication to UNFCCC has been used in case of Coal and Lignite. Country specific Emission Factors for other fuel types are not available. Hence default values as per the IPCC Guidelines have been used.
Any comment:
Data / Parameter: Oxidation Factor Data unit: Fraction of Carbon oxidised Description: Oxidation Factor has been used for calculating the emission coefficients of different
fuel types Source of data used: Default values obtained from Table 1-6 of Revised 1996 IPCC Guidelines for National
Greenhouse Gas Inventories: Workbook Value applied:
Coal 0.98 Furnace oil 0.99 Light oil 0.99 LSHS/HHS 0.99 Lignite 0.98 Natural Gas 1.00 Naphtha 0.99
PROJECT DESIGN DOCUMENT FORM (CDM PDD) - Version 03.1. CDM – Executive Board page 20
Naphtha 0.99 HSD 0.99
Justification of the choice of data or description of measurement methods and procedures actually applied :
Only IPCC default values are available.
Any comment:
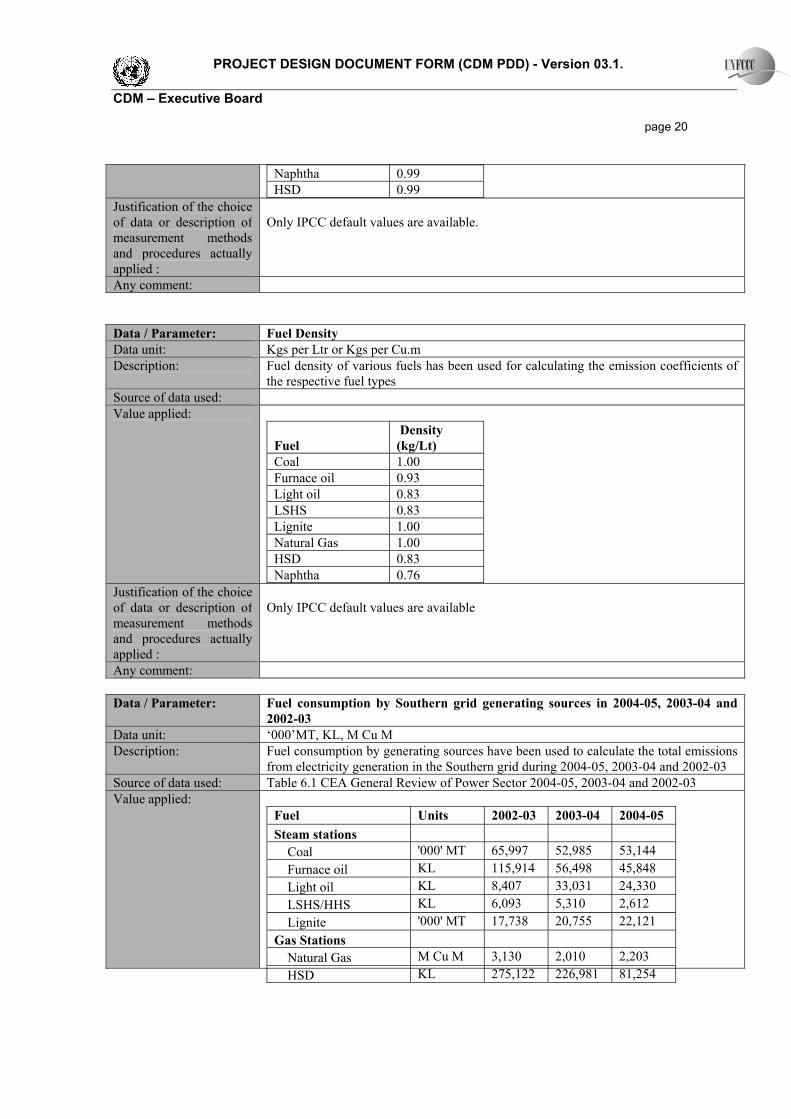
Data / Parameter: Fuel Density Data unit: Kgs per Ltr or Kgs per Cu.m Description: Fuel density of various fuels has been used for calculating the emission coefficients of
the respective fuel types Source of data used: Value applied:
Fuel Density (kg/Lt)
Coal 1.00 Furnace oil 0.93 Light oil 0.83 LSHS 0.83 Lignite 1.00 Natural Gas 1.00 HSD 0.83 Naphtha 0.76
Justification of the choice of data or description of measurement methods and procedures actually applied :
Only IPCC default values are available
Any comment:
Data / Parameter: Fuel consumption by Southern grid generating sources in 2004-05, 2003-04 and 2002-03
Data unit: ‘000’MT, KL, M Cu M Description: Fuel consumption by generating sources have been used to calculate the total emissions
from electricity generation in the Southern grid during 2004-05, 2003-04 and 2002-03 Source of data used: Table 6.1 CEA General Review of Power Sector 2004-05, 2003-04 and 2002-03 Value applied:
Fuel Units 2002-03 2003-04 2004-05 Steam stations
Coal '000' MT 65,997 52,985 53,144 Furnace oil KL 115,914 56,498 45,848 Light oil KL 8,407 33,031 24,330 LSHS/HHS KL 6,093 5,310 2,612 Lignite '000' MT 17,738 20,755 22,121
Gas Stations Natural Gas M Cu M 3,130 2,010 2,203 HSD KL 275,122 226,981 81,254

PROJECT DESIGN DOCUMENT FORM (CDM PDD) - Version 03.1. CDM – Executive Board page 21
HSD KL 275,122 226,981 81,254 Naphtha KL 485,496 719,694 289,451
Diesel Stations LSHS KL - 647,451 465,220 Diesel KL 865,938 14,903 63,039
Justification of the choice of data or description of measurement methods and procedures actually applied :
The data source, i.e. Central Electricity Authority is a Government of India organisation, which is mandated to publish such information under section 73 (i) and 73(j) of the Indian Electricity Act 2003.
Any comment:
Data / Parameter: Net electricity generation by fossil fuel fired power plants in the Southern grid in 2002-03, 2003-04 and 2004-05
Data unit: GWh Description: Net electricity generation by fossil fuel fired power plants in the Southern grid has been
used to calculate the average emission intensity of electricity generated in the Southern grid. This data is used as an input in the Operating margin emission factor calculation.
Source of data used: Table 3.4 of CEA General Review of Power Sector for 2002-03, 2003-04 and 2004-05 Value applied:
Net generation in GWh Steam Gas Diesel 2004-05 90,726 12,007 2,363 2003-04 90,104 13,811 3,205 2002-03 84,255 13,637 4,283
Justification of the choice of data or description of measurement methods and procedures actually applied :
The data source, i.e. Central Electricity Authority is a Government of India organisation, which is mandated to publish such information under section 73 (i) and 73(j) of the Indian Electricity Act 2003.
Any comment:
Data / Parameter: Imports from other regional grids into the Southern grid in 2002-03, 2003-04 and 2004-05
Data unit: GWh Description: Electricity imports from other regional grids are used as an input into the calculation of
operating margin. Source of data used: Table 5.8 of CEA General Review of Power Sector for 2002-03, 2003-04 and 2004-05 Value applied:
Net generation in GWh 2004-05 2003-04 2002-03 Western Region 2 116 Eastern Region 292 77 Northern Region 13 North-eastern Region

PROJECT DESIGN DOCUMENT FORM (CDM PDD) - Version 03.1. CDM – Executive Board page 22 Justification of the choice of data or description of measurement methods and procedures actually applied :
The data source, i.e. Central Electricity Authority is a Government of India organisation, which is mandated to publish such information under section 73 (i) and 73(j) of the Indian Electricity Act 2003.
Any comment:
Data / Parameter: Sample group of power plants added to the Southern grid in recent times Data unit: MW, GWh Description: The sample group of new additions to the Southern grid comprising 20% of the grid’s
net generation during 2004-05 have been used for calculating the build margin emission factor
Source of data used: Table 2.8 of CEA General Review of Power Sector for 2004-05, 2003-04,2002-03,2001-02,2000-01,1999-00,1998-99,1997-98,1996-97 and 1995-96
Value applied: Please refer Annex – 3
Justification of the choice of data or description of measurement methods and procedures actually applied :
The data source, i.e. Central Electricity Authority is a Government of India organisation, which is mandated to publish such information under section 73 (i) and 73(j) of the Indian Electricity Act 2003.
Any comment:
Data / Parameter: Gross electricity generation during 2004-05 by power plants considered for Build margin calculations.
Data unit: GWh Description: Net generation by the sample group of power plants has been used to arrive at the net
electricity supply by these power plants to the Southern grid. Source of data used: − Hydro Generation data obtained from CEA Performance Review of Hydro Power
Stations 2004-05 − Steam Generation data obtained from Section 2, CEA Thermal Performance
Review 2004-05 − Diesel Generation data obtained from SREB Annual Report 2004-05 − In case of Gas power plants, two data sources have been used. Section 10, CEA
Thermal Performance Review 2004-05 and Annexure 6 of SREB Annual Report 2004-05. Data from SREB Annual Report has been taken for plants that are not covered under the CEA Thermal Performance Review. In particular generation data for the following plants has been taken from SREB Annual Report 2004-05
− Neyvelli TPS (Zero unit) − Peddapuram CCGT − Pillaiperumalnallur GTPP − Lanco Kondapalli
− Generation data for Nuclear Power plants taken from website of Nuclear Power Corporation of India, http://www.npcil.nic.in/kaigaaps.asp
− Wind generation data is obtained from Table 3.4, CEA General Review 2004-05 Value applied:
Please refer Annex – 3 Justification of the choice The data source, i.e. Central Electricity Authority is a Government of India

PROJECT DESIGN DOCUMENT FORM (CDM PDD) - Version 03.1. CDM – Executive Board page 23 of data or description of measurement methods and procedures actually applied :
organisation, which is mandated to publish such information under section 73 (i) and 73(j) of the Indian Electricity Act 2003. The Southern Regional Electricity Board is a Government of India undertaking, responsible for administration of Southern grid operations. Data from SREB Annual Report 2004-05 has been considered in respect of plants whose generation data is not available in the CEA Thermal Performance Review. Many power generating stations in India house multiple generating units (both in case of Hydro and Thermal) and in many cases unit wise generation data is not published. Therefore some times it is not possible to determine the actual amount of electricity generated by a new unit that was added in recent times. In such cases pro-rata generation depending on capacity has been used. Plant wise generation for Nuclear power units is not available in the CEA publication or SREB Annual Report. Generation data reported for the Kaiga Atomic Power station for 2004-05 on the website of Nuclear Power Corporation of India Limited, http://www.npcil.nic.in/kaigaaps.asp, has been used. Unit or project–wise generation data for wind installations is not available in the public domain. For the build margin sample for Southern region, the earliest plant was commissioned on 2 July 1999. The wind generation in the build margin for the Southern region is therefore based on the following assumptions: Additions to installed capacity of wind energy generators has been considered
from 1 April 1999 to 31 March 2005. This is arrived at by subtracting the wind energy generation capacity as on 31 March 1999 (808.51 MW) from wind energy generation capacity as on 31 March 2005 (2056.7 MW).
A capacity utilisation factor of 20% has been assumed. The effect of capacity additions throughout the year has been ignored. This is
conservative in the scenario where there is rapid wind energy capacity addition in the last year.
This gives wind energy generation of 2,187 GWh for the year 2004-05. From CEA data, the wind energy generation in Southern region is 3,079 GWh. Based on the above assumptions, this suggests that the capacity as on 31 March 1999 (808.51 MW) generated 892 GWh (3079 GWh – 2187 GWh) during 2004 – 05, which works out to a capacity utilisation factor of 12.6% which is conservative.
Any comment:
Data / Parameter: Auxiliary consumption during 2004-05 by power plants considered for Build margin calculations.
Data unit: GWh Description: Auxiliary consumption by the sample group of power plants has been used to arrive at
the net electricity supply by these power plants to the Southern grid. Source of data used: − Auxiliary consumption for Hydro units is considered at 0.5% as per CERC norms
applicable to Surface hydro electric power generating stations with static excitation system.
− Auxiliary consumption for Steam units taken from Section 11, CEA Thermal Performance Review 2004-05
− State level average auxiliary consumption of Gas and Diesel Power plants as per Table 5.5 CEA General Review 2004-05 has been used in the absence of plant specific auxiliary consumption data.
− Auxiliary Consumption for Nuclear Power Plants taken as the: State average for the respective generation type from Table 5.5 CEA General Review 2004-05
Value applied: Please refer Annex – 3
PROJECT DESIGN DOCUMENT FORM (CDM PDD) - Version 03.1. CDM – Executive Board page 24 Justification of the choice of data or description of measurement methods and procedures actually applied :
The data source, i.e. Central Electricity Authority is a Government of India organisation, which is mandated to publish such information under section 73 (i) and 73(j) of the Indian Electricity Act 2003. The Southern Regional Electricity Board is a Government of India undertaking, responsible for administration of Southern grid operations. Actual auxiliary consumption of Hydro power units is not available in the CEA publications. Hence the auxiliary consumption norm of 0.5% set by Central Electricity Regulatory Commission for determination of tariff for Hydro units has been used. Nuclear power in India is generated by the Government owned Nuclear Power Corporation of India Limited. Therefore the entire nuclear power generation pertains to NPCL alone. Hence the state average auxiliary consumption for Nuclear power actually refers to the auxiliary consumption rate achieved by the NPCL plant. In case of Gas and Diesel plants, plant wise data is not available. Hence the state averages (for the respective fuel type) of auxiliary consumption have been applied. Auxiliary consumption of wind considered as “Nil” as wind power generation does not involve any auxiliary consumption. This is conservative.
Any comment:
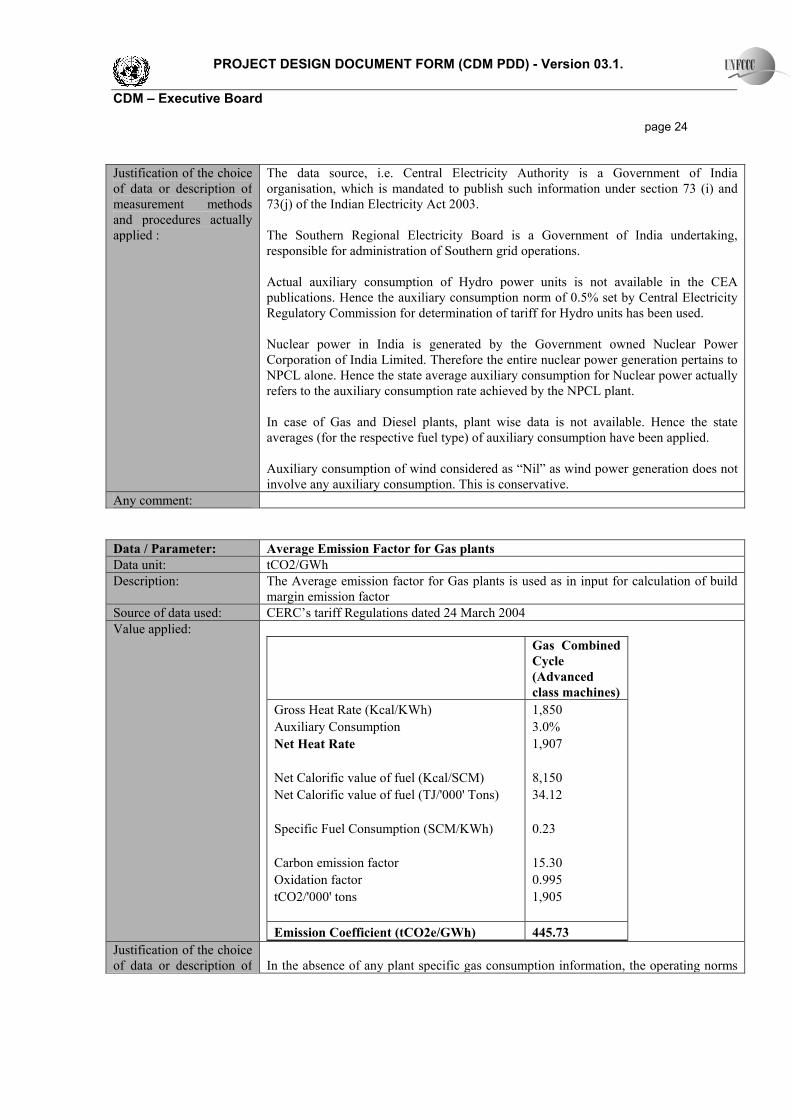
Data / Parameter: Average Emission Factor for Gas plants Data unit: tCO2/GWh Description: The Average emission factor for Gas plants is used as in input for calculation of build
margin emission factor Source of data used: CERC’s tariff Regulations dated 24 March 2004 Value applied:
Gas Combined Cycle (Advanced class machines)
Gross Heat Rate (Kcal/KWh) 1,850 Auxiliary Consumption 3.0% Net Heat Rate 1,907 Net Calorific value of fuel (Kcal/SCM) 8,150 Net Calorific value of fuel (TJ/'000' Tons) 34.12 Specific Fuel Consumption (SCM/KWh) 0.23 Carbon emission factor 15.30 Oxidation factor 0.995 tCO2/'000' tons 1,905 Emission Coefficient (tCO2e/GWh) 445.73
Justification of the choice of data or description of
In the absence of any plant specific gas consumption information, the operating norms

PROJECT DESIGN DOCUMENT FORM (CDM PDD) - Version 03.1. CDM – Executive Board page 25 measurement methods and procedures actually applied :
set by CERC, for tariff determination of Gas power plants, has been considered for arriving at the applicable emission rates for gas plants included in the build margin calculations.
Any comment:
Data / Parameter: Average Emission Factor for Diesel plants Data unit: tCO2/GWh Description: The Average emission factor for Diesel plants is used as in input for calculation of
build margin emission factor Source of data used: CEA norms for Diesel power plants Value applied:
CEA norms for Diesel Generating units
Low speed, 4 stroke engine
Gross Heat Rate (Kcal/KWh) 1,900 Auxiliary Consumption 3.0% Net Heat Rate 1,959 Net Calorific value of fuel (Kcal/Kg) 10,270 Net Calorific value of fuel (TJ/'000' Tons) 43.00 Specific Fuel Consumption (SCM/KWh) 0.19 Carbon emission factor 20.20 Oxidation factor 0.99 tCO2/'000' tons 3,153 Emission Coefficient (tCO2e/GWh) 601.34
Justification of the choice of data or description of measurement methods and procedures actually applied :
In the absence of any plant specific gas consumption information, the operating norms set by CEA for Diesel power plants has been considered for arriving at the applicable emission rates for Diesel plants included in build margin calculations.
Any comment:
Data / Parameter: Average Emission Factor for Coal plants Data unit: tCO2/GWh Description: The Average emission factor for Coal plants is used as in input for calculation of build
margin emission factor. Source of data used: CEA Thermal Performance Review 2004-05
* CEA data for lignite consumption for Tamil Nadu has been considered. **: GCV of lignite as per CERC Order dated 26 September 2006 for determination of tariff for NLC-I (600 MW). **: Station heat rate assumed to be same as that for NLC-II (1470 MW) as per CERC Order dated 26 March 2004 for determining tariff.
Value applied:

PROJECT DESIGN DOCUMENT FORM (CDM PDD) - Version 03.1. CDM – Executive Board page 26
Coal/lignite fired stations
Coal consumption
Installed Capacity
Gross generation
Auxiliary consumption
Net Generation
Emission Coefficient (tCO2/ 1000 tonnes of fuel)
Specific emissions (tCO2e/MWh)
Million Tonnes MW GWh % GWh
Southern Region Ramagundam S.T.P.S. 10,490 2,600 16,952 6.59% 15,835 1,476 978 Raichur 6,923 1,470 10,737 8.82% 9,790 1,476 1,044 Simhadri 5,556 1,000 8,123 5.65% 7,664 1,476 1,070 Neyveli TPS (Zero unit) * 1,370 250 1248 1,186 1,303 Neyveli FST (Ext) ** 3,371 420 3,238 9.0% 2,947 1,186 1,357
Justification of the choice of data or description of measurement methods and procedures actually applied :
The data source, i.e. Central Electricity Authority is a Government of India organisation, which is mandated to publish such information under section 73 (i) and 73(j) of the Indian Electricity Act 2003. In case of Neyveli TPS (Zero unit), it is the only lignite based non-Central sector power plant in Tamil Nadu. Accordingly, CEA data for lignite consumption for Tamil Nadu has been considered. As per CERC order dated dated 26 March 2004 for determining tariff the station heat rate of Neyveli FST (Ext) is considered equivalent to the station heat rate for NLC-II (1470 MW), accordingly the SHR of NLC II has been applied in case of Neyveli FST (Ext).
Any comment: B.6.3 Ex-ante calculation of emission reductions: >>
Ex-ante calculation of emission reductions is equal to ex-ante calculation of baseline emissions as project emissions and leakage are nil. Baseline emission factor (combined margin) = 1037.43 tCO2e/GWh Annual electricity supplied to the grid by the Project = 30.40 MW (Capacity) x 26.5% (PLF) x 8760 (hours) / 1000 GWh = 70.57056 GWh Annual baseline emissions = 1037.43 tCO2e/GWh x 70.57056 GWh = 73,211 tCO2e
B.6.4 Summary of the ex-ante estimation of emission reductions: >>
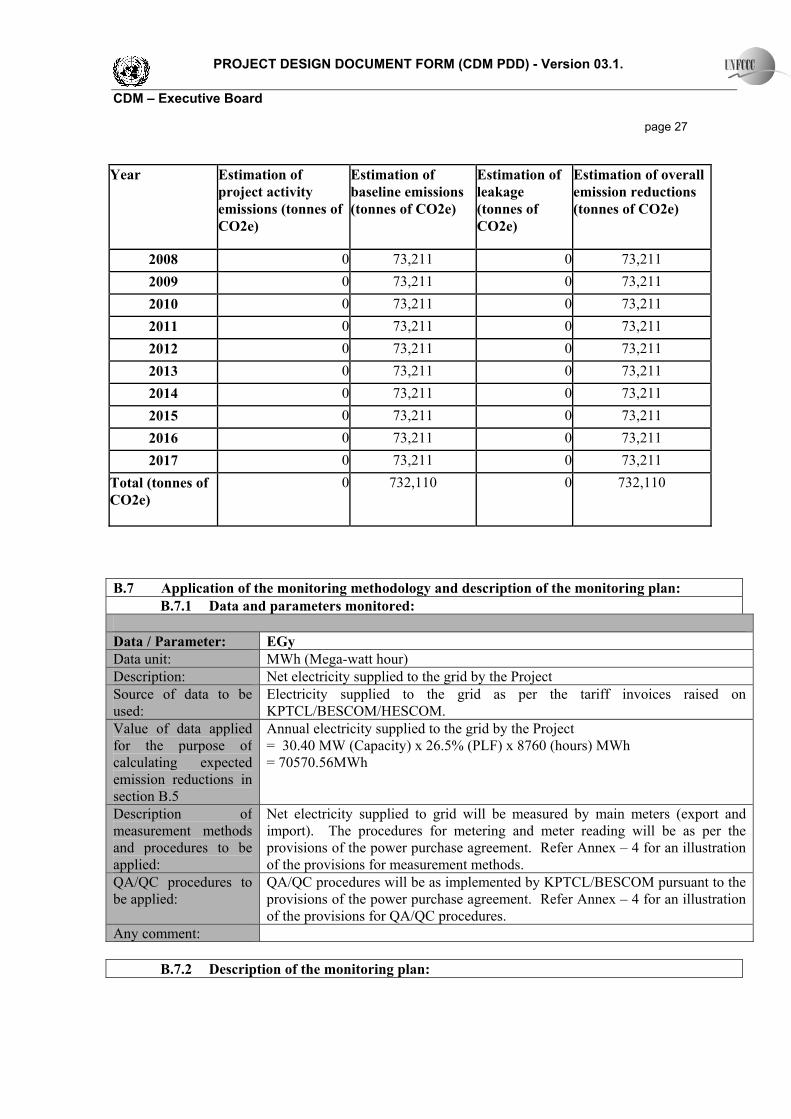
PROJECT DESIGN DOCUMENT FORM (CDM PDD) - Version 03.1. CDM – Executive Board page 27 Year Estimation of
project activity emissions (tonnes of CO2e)
Estimation of baseline emissions (tonnes of CO2e)
Estimation of leakage (tonnes of CO2e)
Estimation of overall emission reductions (tonnes of CO2e)
2008 0 73,211 0 73,211 2009 0 73,211 0 73,211 2010 0 73,211 0 73,211 2011 0 73,211 0 73,211 2012 0 73,211 0 73,211 2013 0 73,211 0 73,211 2014 0 73,211 0 73,211 2015 0 73,211 0 73,211 2016 0 73,211 0 73,211 2017 0 73,211 0 73,211
Total (tonnes of CO2e)
0 732,110 0 732,110
B.7 Application of the monitoring methodology and description of the monitoring plan:
B.7.1 Data and parameters monitored: Data / Parameter: EGy Data unit: MWh (Mega-watt hour) Description: Net electricity supplied to the grid by the Project Source of data to be used:
Electricity supplied to the grid as per the tariff invoices raised on KPTCL/BESCOM/HESCOM.
Value of data applied for the purpose of calculating expected emission reductions in section B.5
Annual electricity supplied to the grid by the Project = 30.40 MW (Capacity) x 26.5% (PLF) x 8760 (hours) MWh = 70570.56MWh
Description of measurement methods and procedures to be applied:
Net electricity supplied to grid will be measured by main meters (export and import). The procedures for metering and meter reading will be as per the provisions of the power purchase agreement. Refer Annex – 4 for an illustration of the provisions for measurement methods.
QA/QC procedures to be applied:
QA/QC procedures will be as implemented by KPTCL/BESCOM pursuant to the provisions of the power purchase agreement. Refer Annex – 4 for an illustration of the provisions for QA/QC procedures.
Any comment: B.7.2 Description of the monitoring plan:
PROJECT DESIGN DOCUMENT FORM (CDM PDD) - Version 03.1. CDM – Executive Board page 28 >> Approved monitoring methodology ACM0002 / Version 06 Sectoral Scope: 1, “Consolidated monitoring methodology for zero-emissions grid-connected electricity generation from renewable sources”, by CDM - Meth Panel is proposed to be used to monitor the emission reductions. This approved monitoring methodology requires monitoring of the following: • Electricity generation from the project activity; and • Operating margin emission factor and build margin emission factor of the grid, where ex post
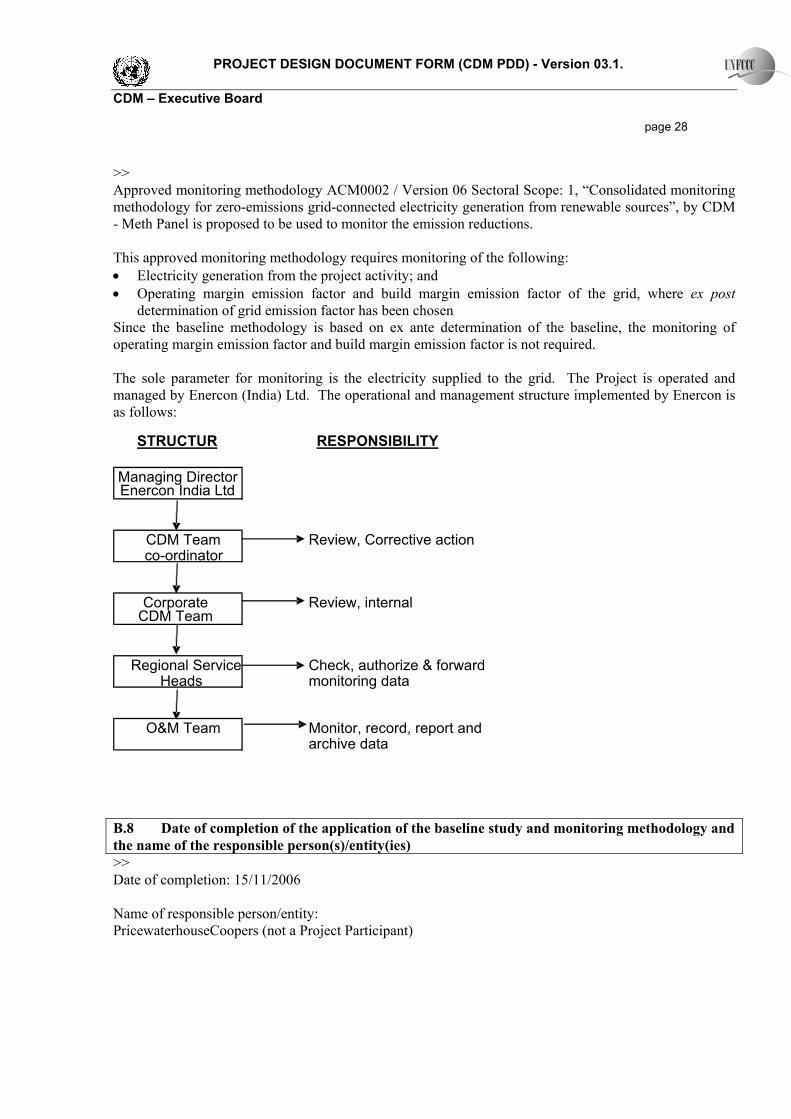
determination of grid emission factor has been chosen Since the baseline methodology is based on ex ante determination of the baseline, the monitoring of operating margin emission factor and build margin emission factor is not required. The sole parameter for monitoring is the electricity supplied to the grid. The Project is operated and managed by Enercon (India) Ltd. The operational and management structure implemented by Enercon is as follows:
STRUCTUR RESPONSIBILITY
Enercon India LtdManaging Director
CDM Team co-ordinator
Review, Corrective action
Corporate CDM Team
Review, internal
Check, authorize & forwardmonitoring data
Regional ServiceHeads
O&M Team Monitor, record, report and archive data
B.8 Date of completion of the application of the baseline study and monitoring methodology and the name of the responsible person(s)/entity(ies) >> Date of completion: 15/11/2006 Name of responsible person/entity: PricewaterhouseCoopers (not a Project Participant)

PROJECT DESIGN DOCUMENT FORM (CDM PDD) - Version 03.1. CDM – Executive Board page 29 SECTION C. Duration of the project activity / crediting period C.1 Duration of the project activity: C.1.1. Starting date of the project activity: >> 17/08/2005 C.1.2. Expected operational lifetime of the project activity: >> 20 years C.2 Choice of the crediting period and related information: C.2.1. Renewable crediting period C.2.1.1. Starting date of the first crediting period: >> C.2.1.2. Length of the first crediting period: >> C.2.2. Fixed crediting period: C.2.2.1. Starting date: >> 01/04/2007, being the expected date of registration of the Project. C.2.2.2. Length: >> 10 years SECTION D. Environmental impacts >> D.1. Documentation on the analysis of the environmental impacts, including transboundary impacts: >> Enercon appointed Aditya Environmental Services Private Limited to conduct Rapid Environmental Impact Assessment Study, in the districts of Chitradurga and Gadag where the project activity of Enercon is located, to assess the impact of the project on the local environment Environmental Impact Assessment (EIA) of this project is not an essential regulatory requirement, as it is not covered under the categories as described in EIA Notification of 1994 or the Amended Notification of
PROJECT DESIGN DOCUMENT FORM (CDM PDD) - Version 03.1. CDM – Executive Board page 30 2006. However, Enercon conducted the EIA to study impacts on the environment resulting from the project activity. The EIA study included identification, prediction and evaluation of potential impacts of the CDM activities on air, water, noise, land, biological and socio-economic environment within the study area. The ambient air concentrations of Suspended Particulate Matter, Respirable Particulate Matter, Oxides of Nitrogen, Sulphur dioxide and Carbon Monoxide were monitored and were found under limits as specified by CPCB. The noise levels were observed through out the study period and were found to be in the permissible range. Water quality monitoring studies were carried out for determination of physico-chemical characteristics of bore wells. The ph level of water was found to be under the specified limits. The study area represents part of Chitradurga and Gadag districts. The terrain comprises hilly areas which are sparingly populated, the hills are generally covered with shrubs and grass and trees are not found on the hilltops. Moreover the project area doesn’t fall under any protected land for wildlife and it has no adverse ecological impacts on the surroundings, flora and fauna found in the vicinity of the project area. The wind-farms do not effect the path of migratory birds. D.2. If environmental impacts are considered significant by the project participants or the host Party, please provide conclusions and all references to support documentation of an environmental impact assessment undertaken in accordance with the procedures as required by the host Party: >> EIA demonstrated that there is no major impact on the environment due to the installation and operation of the windmills. The local ecology is not likely to get impacted by this type of project activity. The local population confirmed that there is no noise or dust nuisance due to windmills. The EIA also ruled out any adverse impacts due to the project activity. SECTION E. Stakeholders’ comments >> E.1. Brief description how comments by local stakeholders have been invited and compiled: >> The comments from local stakeholders were invited through local stakeholder meeting conducted on 2 September at Arashinagundi Village, Hiriyur in Chitradurga District and 15 June 2006 in Dhoni, Mundaragi in Gadag district. An advertisement was placed in a local newspaper in Vijaya Karnataka on 19 August 2006 inviting the local stakeholders for the meeting for the Chitradurga district projects and in Vijaya Karnataka on 4 June 2006 for the Gadag district projects. The local stakeholder consultation meeting had representatives from the nearby villages, representatives of Enercon and representative of Aditya Environmental Services (consultant to Enercon) in Chitradurga district and representative of Care Sustainability (consultant to Enercon) in Gadag district. The minutes of the two meetings are set out in Appendix 2. E.2. Summary of the comments received: >> The queries/comments from local villagers in Chitradurga district covered:

PROJECT DESIGN DOCUMENT FORM (CDM PDD) - Version 03.1. CDM – Executive Board page 31
• Comment that there is a significant impact on the economic and social life in and around Chitradurga villages due to the wind power projects. Further, there are no rainfall shortages due to wind mills.
• Query on afforestation work carried out by Enercon • Query on impact on ground water • Query on generation capacity of wind mills • Query on scope of purchasing wind mills by the public • Query on revenue land being used wherever electrical overhead lines pass
The local villagers in Chitradurga district responded to the questions queries made by Enercon as follows: • No noise pollution as the projects are located in hilltops and away from villages • No water draining, soil erosion due to wind mills • No problem with cattle grazing in the hills • Better food production due to better quality of electricity and less load shedding • No deforestation except while road formation and installation of machines • No damage or accidents during construction or erection The queries/comments from local villagers in Gadag district covered: • Comment that wind mills do not impact adversely • Comment that local labour has been used during construction and operation phase • Comment that water table has decreased during recent times but not on account of wind mills • Comment that water supply to agriculture field was not impacted during construction • Comment that there is no disturbance or high noise level due to operation of the wind mills • Comment that there have been no accidents and no disturbance or heavy traffic on account of wind
mills • Comment that no dust emissions were observed at project site or in the neighbourhood • Comment that project has not affected migratory path of birds • Suggestion that planting of medicinal plants may be carried out at the down plains • Suggestion that help should be extended to villagers by providing “lift/transportation” • Suggestion that additional watchmen be deployed to warn of forest fire E.3. Report on how due account was taken of any comments received: >> Enercon provided the following responses in relation to the comments received from the local stakeholders in Chitradurga district: • Enercon is carrying out afforestation work in all the hills where the wind turbines are installed. • There is no impact on ground water due to wind mills. • Generation capacity of wind mills is 800 kW. • It is possible to purchase wind mills. In Maharashtra, farmers association has purchased one wind
machine. • Revenue land is not being used wherever electrical overhead lines pass. Access to the land is
required only for line inspection in case of a fault.

PROJECT DESIGN DOCUMENT FORM (CDM PDD) - Version 03.1. CDM – Executive Board page 32 Enercon provided the following responses in relation to the comments received from the local stakeholders in Gadag district: • Regarding planting medicinal plants, Enercon is currently doing it at the project site and would also
be planting on the slopes. • Regarding assistance with transport, Enercon would do their best to provide help to the villagers in
the emergency cases. • Regarding forest fire warning/safety, Enercon would be constructing a three feet trench on the slopes
and around the project site. It has also instructed watchmen and security guards to be vigilant and provide warning in the cases of occurrences of forest fires.

PROJECT DESIGN DOCUMENT FORM (CDM PDD) - Version 03.1. CDM – Executive Board page 33
Annex 1
CONTACT INFORMATION ON PARTICIPANTS IN THE PROJECT ACTIVITY Organization: Enercon (India) Limited Street/P.O.Box: Kolsite House, Plot No. 31, Shah Industrial Estate, Veera Desai Road, Andheri
(West) Building: City: Mumbai State/Region: Maharashtra Postfix/ZIP: 400 053 Country: India Telephone: +91-22-5522 7794 FAX: +91-22-5692 1175 E-Mail: [email protected] URL: Represented by: Title: Associate Vice President Salutation: Mr. Last Name: Raghavan Middle Name: First Name: A Department: Corporate Mobile: +91-98200 45724 Direct FAX: +91-22-5692 1175 Direct tel: +91-22-5522 7794 Personal E-Mail: [email protected] Organization: Japan Carbon Finance, Ltd. Street/P.O.Box: 6th Floor, 1-3 Kundankita, 4-chrome Building: Chiyoda-ku City: Tokyo State/Region: Postfix/ZIP: 102-0073 Country: Japan Telephone: +81 3 5212 8870 FAX: +81 3 5212 8886 E-Mail: [email protected] URL: http://www.japancarbon.co.jp/ Represented by: Title: Director General Salutation: Mr. Last Name: Ari Middle Name: First Name: Masato

PROJECT DESIGN DOCUMENT FORM (CDM PDD) - Version 03.1. CDM – Executive Board page 34 Department: Carbon Finance Department Mobile: Direct FAX: +81 3 5212 8886 Direct tel: +81 3 5212 8878 Personal E-Mail: [email protected]

PROJECT DESIGN DOCUMENT FORM (CDM PDD) - Version 03.1. CDM – Executive Board page 35
Annex 2
INFORMATION REGARDING PUBLIC FUNDING

PROJECT DESIGN DOCUMENT FORM (CDM PDD) - Version 03.1. CDM – Executive Board page 36
Annex 3
BASELINE INFORMATION
Emission Coefficients
2004-2005
Type of FUEL
Net Calorific Value (TJ/ 103
tonnes or TJ/Mcum)
Carbon Emission
Factor (t C/ TJ )
Fraction of Carbon Oxidised
Oxidation Factor
Emission Coefficient (tCO2/ 103 tonnes or
tCO2/Mcum) Steam stations
Coal 15.72 26.13 0.98 1,476 Furnace oil 43.68 21.10 0.99 3,346 Light oil 43.00 20.00 0.99 3,122 LSHS/HHS/HSD 43.64 20.20 0.99 3,200 GAS 34.12 15.30 1.00 1,905 Lignite 11.40 28.95 0.98 1,186
Gas Stations Natural Gas 34.12 15.30 1.00 1,905 HSD 42.71 20.20 0.99 3,131 Naphtha 46.89 20.00 0.99 3,404
Diesel Stations LSHS 43.64 20.20 0.99 3,200 Diesel 43.00 20.20 0.99 3,153
2003-2004
Type of FUEL
Net Calorific Value (TJ/ 103
tonnes or TJ/Mcum)
Carbon Emission
Factor (t C/ TJ )
Fraction of Carbon Oxidised
Oxidation Factor
Emission Coefficient (tCO2/ 103 tonnes or
tCO2/Mcum) Steam stations
Coal 15.99 26.13 0.98 1,502 Furnace oil 43.40 21.10 0.99 3,324 Light oil 42.65 20.00 0.99 3,096 LSHS/HHS/HSD 43.13 20.20 0.99 3,163 GAS 34.12 15.30 1.00 1,905 Lignite 11.46 28.95 0.98 1,192
Gas Stations Natural Gas 34.12 15.30 1.00 1,905 HSD 42.71 20.20 0.99 3,131 Naphtha 46.89 20.00 0.99 3,404
Diesel Stations LSHS 43.13 20.20 0.99 3,163 Diesel 42.65 20.20 0.99 3,127
PROJECT DESIGN DOCUMENT FORM (CDM PDD) - Version 03.1. CDM – Executive Board page 37
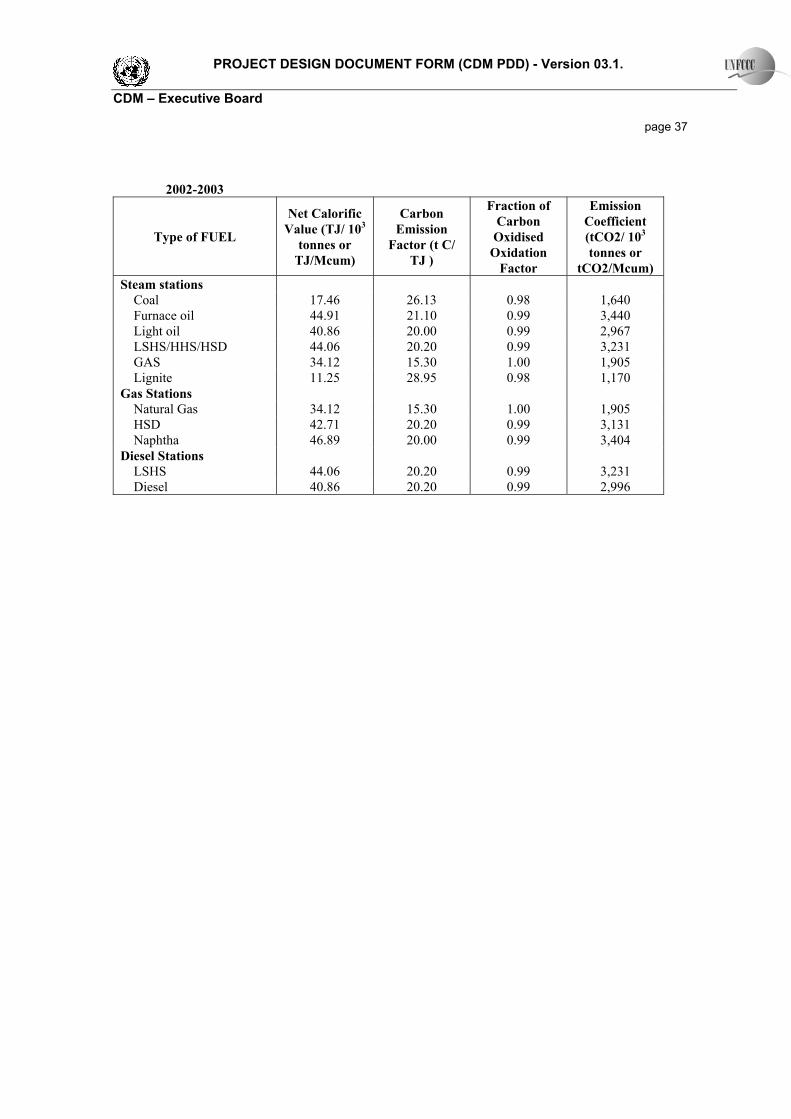
2002-2003
Type of FUEL
Net Calorific Value (TJ/ 103
tonnes or TJ/Mcum)
Carbon Emission
Factor (t C/ TJ )
Fraction of Carbon Oxidised
Oxidation Factor
Emission Coefficient (tCO2/ 103 tonnes or
tCO2/Mcum) Steam stations
Coal 17.46 26.13 0.98 1,640 Furnace oil 44.91 21.10 0.99 3,440 Light oil 40.86 20.00 0.99 2,967 LSHS/HHS/HSD 44.06 20.20 0.99 3,231 GAS 34.12 15.30 1.00 1,905 Lignite 11.25 28.95 0.98 1,170
Gas Stations Natural Gas 34.12 15.30 1.00 1,905 HSD 42.71 20.20 0.99 3,131 Naphtha 46.89 20.00 0.99 3,404
Diesel Stations LSHS 44.06 20.20 0.99 3,231 Diesel 40.86 20.20 0.99 2,996

PROJECT DESIGN DOCUMENT FORM (CDM PDD) - Version 03.1. CDM – Executive Board page 38
Operating Margin for Southern Grid
Fuel Units 2004-05 2003-04 2002-03
Fuel Cons Emissions (tCO2) Fuel Cons Emissions
(tCO2) Fuel Cons Emissions (tCO2)
Steam stations Coal 000MT 53,144 78,448,259 52,985 79,567,449 65,997 108,214,016Furnace oil KL 45,848 142,654 56,498 174,645 115,914 370,790 Light oil KL 24,330 62,811 33,031 84,577 8,407 20,626 LSHS/HHS/HSD KL 2,612 6,912 5,310 13,889 6,093 16,280 GAS KL - - - Lignite 000MT 22,121 26,244,612 20,755 24,741,489 17,738 20,750,996
Gas Stations Natural Gas M Cu M 2,203 4,196,046 2,010 3,828,440 3,130 5,961,700 HSD KL 81,254 210,422 226,981 587,808 275,122 712,478 Naphtha KL 289,451 748,903 719,694 1,862,080 485,496 1,256,134
Diesel Stations LSHS KL 465,220 1,231,110 647,451 1,693,457 - - Diesel KL 63,039 164,371 14,903 38,541 865,938 2,145,766
Grid imports Units Electricity
import Emissions
(tCO2) Electricity
import Emissions
(tCO2) Electricity
import Emissions
(tCO2) From region
Western Region GWh 2 2,215 116 138,328 Eastern Region GWh 292 324,360 77 97,983 Northern Region GWh 13 9,620.71 North-eastern Region GWh
Total emissions 295 111,782,675 112,601,994 139,685,097
Net electricity generation Units 2004-05 2003-04 2002-03 Steam stations GWh 90,726 90,104 84,255 Gas stations GWh 12,007 13,811 13,637 Diesel stations GWh 2,363 3,205 4,283
Grid imports GWh 295 13 194 Total GWh 105,391 107,133 102,368 Units 2004-05 2003-04 2002-03 Operating Margin tCO2/GWh 1,060.65 1,051.05 1,364.54
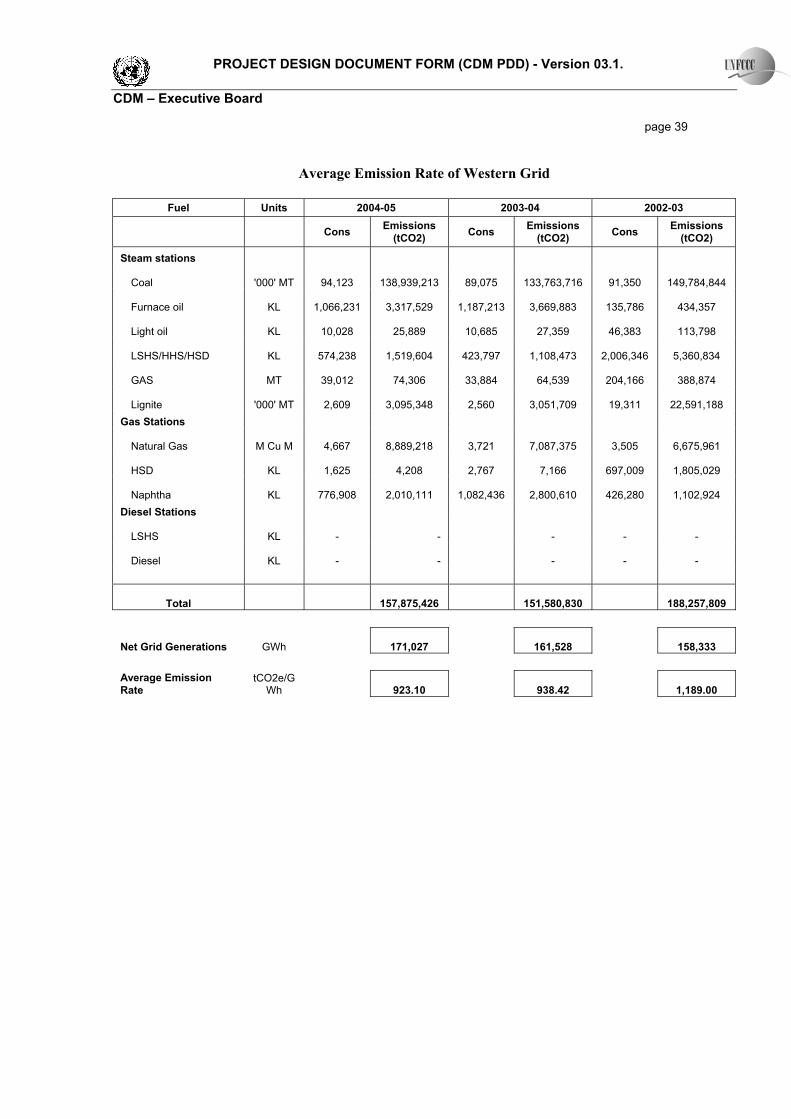
PROJECT DESIGN DOCUMENT FORM (CDM PDD) - Version 03.1. CDM – Executive Board page 39
Average Emission Rate of Western Grid
Fuel Units 2004-05 2003-04 2002-03
Cons Emissions
(tCO2) Cons Emissions (tCO2) Cons Emissions
(tCO2)
Steam stations
Coal '000' MT
94,123
138,939,213
89,075
133,763,716
91,350
149,784,844
Furnace oil KL
1,066,231
3,317,529
1,187,213
3,669,883
135,786
434,357
Light oil KL
10,028
25,889
10,685
27,359
46,383
113,798
LSHS/HHS/HSD KL
574,238
1,519,604
423,797
1,108,473
2,006,346
5,360,834
GAS MT
39,012
74,306
33,884
64,539
204,166
388,874
Lignite '000' MT
2,609
3,095,348
2,560
3,051,709
19,311
22,591,188 Gas Stations
Natural Gas M Cu M
4,667
8,889,218
3,721
7,087,375
3,505
6,675,961
HSD KL
1,625
4,208
2,767
7,166
697,009
1,805,029
Naphtha KL
776,908
2,010,111
1,082,436
2,800,610
426,280
1,102,924 Diesel Stations
LSHS KL
- -
- -
-
Diesel KL
- -
- -
-
Total
157,875,426
151,580,830
188,257,809
Net Grid Generations GWh
171,027
161,528
158,333 Average Emission Rate
tCO2e/GWh
923.10
938.42
1,189.00
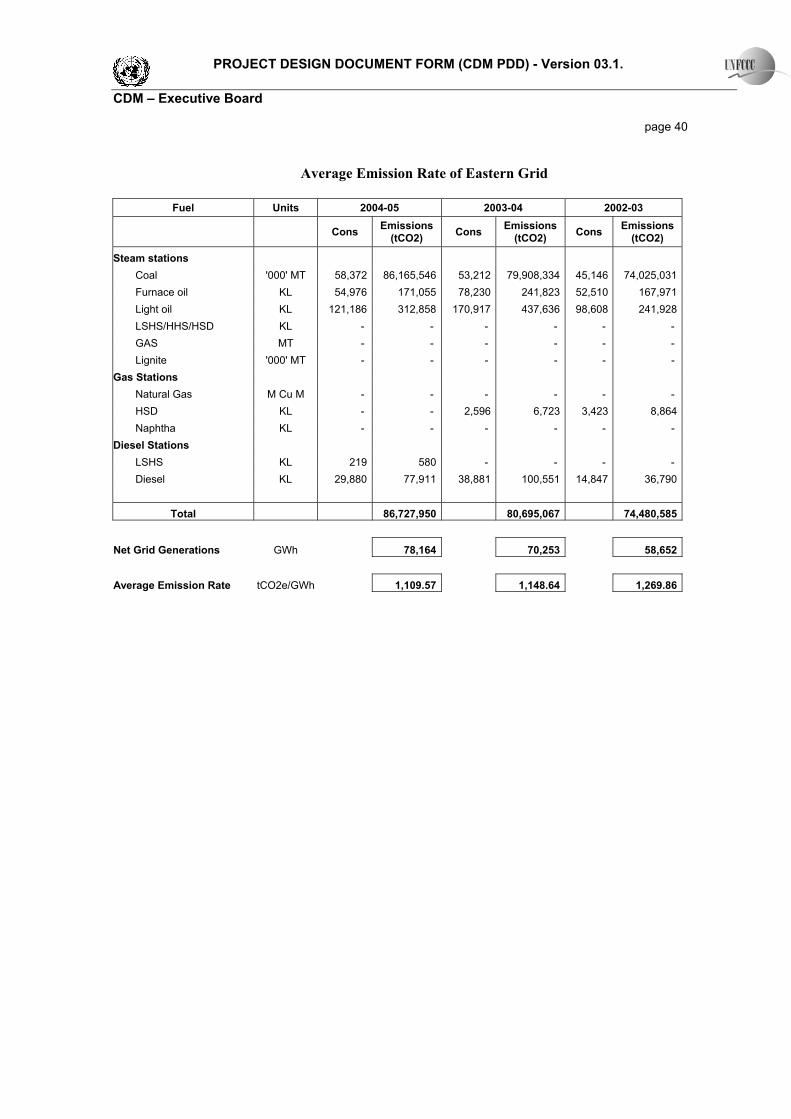
PROJECT DESIGN DOCUMENT FORM (CDM PDD) - Version 03.1. CDM – Executive Board page 40
Average Emission Rate of Eastern Grid
Fuel Units 2004-05 2003-04 2002-03
Cons Emissions (tCO2) Cons Emissions
(tCO2) Cons Emissions (tCO2)
Steam stations Coal '000' MT 58,372 86,165,546 53,212 79,908,334 45,146 74,025,031 Furnace oil KL 54,976 171,055 78,230 241,823 52,510 167,971 Light oil KL 121,186 312,858 170,917 437,636 98,608 241,928 LSHS/HHS/HSD KL - - - - - - GAS MT - - - - - - Lignite '000' MT - - - - - -
Gas Stations Natural Gas M Cu M - - - - - - HSD KL - - 2,596 6,723 3,423 8,864 Naphtha KL - - - - - -
Diesel Stations LSHS KL 219 580 - - - - Diesel KL 29,880 77,911 38,881 100,551 14,847 36,790
Total 86,727,950 80,695,067 74,480,585
Net Grid Generations GWh 78,164 70,253 58,652 Average Emission Rate tCO2e/GWh 1,109.57 1,148.64 1,269.86

PROJECT DESIGN DOCUMENT FORM (CDM PDD) - Version 03.1. CDM – Executive Board page 41
Average Emission Rate of North – Eastern Grid
Fuel Units 2004-05 2003-04 2002-03
Cons Emissions
(tCO2) Cons Emissions (tCO2) Cons Emissions
(tCO2)
Steam stations Coal '000' MT Furnace oil KL Light oil KL LSHS/HHS/HSD KL GAS MT Lignite '000' MT
Gas Stations
Natural Gas M Cu M
1,309
2,493,248
1,246
2,373,252
930
1,771,368 HSD KL Naphtha KL
Diesel Stations LSHS KL
Diesel KL
353
920
3,431
8,873
4,948
12,261
Total
2,494,168
2,382,125
1,783,629
Net Grid Generations GWh
7,814
6,569
5,308
Average Emission Rate tCO2e/GWh
319.20
362.63
336.05
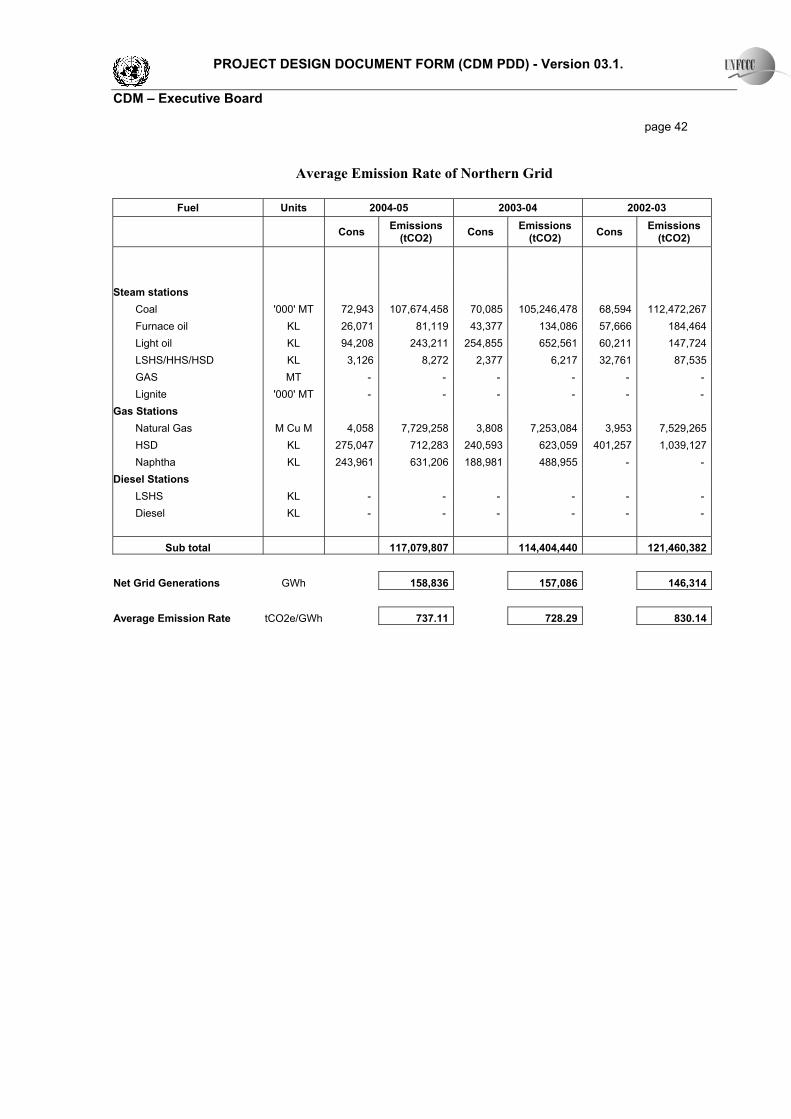
PROJECT DESIGN DOCUMENT FORM (CDM PDD) - Version 03.1. CDM – Executive Board page 42
Average Emission Rate of Northern Grid
Fuel Units 2004-05 2003-04 2002-03
Cons Emissions (tCO2) Cons Emissions
(tCO2) Cons Emissions (tCO2)
Steam stations
Coal '000' MT 72,943 107,674,458 70,085 105,246,478 68,594 112,472,267 Furnace oil KL 26,071 81,119 43,377 134,086 57,666 184,464 Light oil KL 94,208 243,211 254,855 652,561 60,211 147,724 LSHS/HHS/HSD KL 3,126 8,272 2,377 6,217 32,761 87,535 GAS MT - - - - - - Lignite '000' MT - - - - - -
Gas Stations Natural Gas M Cu M 4,058 7,729,258 3,808 7,253,084 3,953 7,529,265 HSD KL 275,047 712,283 240,593 623,059 401,257 1,039,127 Naphtha KL 243,961 631,206 188,981 488,955 - -
Diesel Stations LSHS KL - - - - - - Diesel KL - - - - - -
Sub total 117,079,807 114,404,440 121,460,382
Net Grid Generations GWh 158,836 157,086 146,314 Average Emission Rate tCO2e/GWh 737.11 728.29 830.14
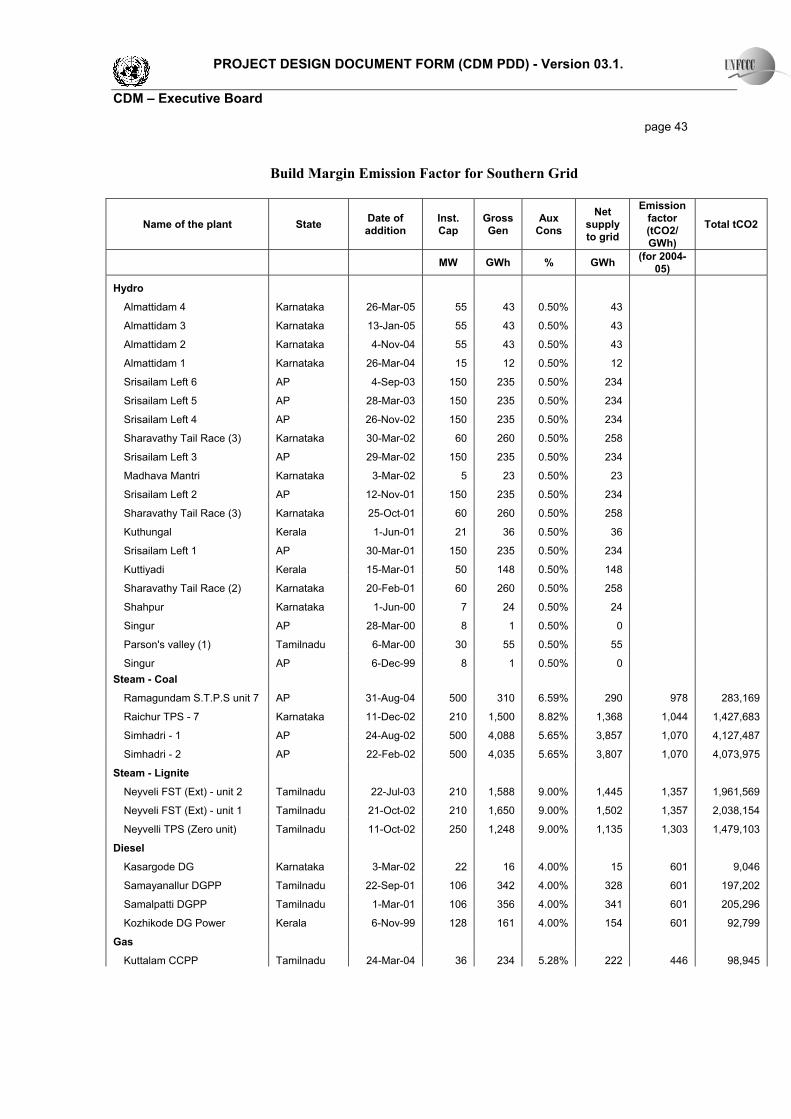
PROJECT DESIGN DOCUMENT FORM (CDM PDD) - Version 03.1. CDM – Executive Board page 43
Build Margin Emission Factor for Southern Grid
Name of the plant State Date of addition
Inst. Cap
Gross Gen
Aux Cons
Net supply to grid
Emission factor (tCO2/ GWh)
Total tCO2
MW GWh % GWh (for 2004-05)
Hydro
Almattidam 4 Karnataka 26-Mar-05 55 43 0.50% 43
Almattidam 3 Karnataka 13-Jan-05 55 43 0.50% 43
Almattidam 2 Karnataka 4-Nov-04 55 43 0.50% 43
Almattidam 1 Karnataka 26-Mar-04 15 12 0.50% 12
Srisailam Left 6 AP 4-Sep-03 150 235 0.50% 234
Srisailam Left 5 AP 28-Mar-03 150 235 0.50% 234
Srisailam Left 4 AP 26-Nov-02 150 235 0.50% 234
Sharavathy Tail Race (3) Karnataka 30-Mar-02 60 260 0.50% 258
Srisailam Left 3 AP 29-Mar-02 150 235 0.50% 234
Madhava Mantri Karnataka 3-Mar-02 5 23 0.50% 23
Srisailam Left 2 AP 12-Nov-01 150 235 0.50% 234
Sharavathy Tail Race (3) Karnataka 25-Oct-01 60 260 0.50% 258
Kuthungal Kerala 1-Jun-01 21 36 0.50% 36
Srisailam Left 1 AP 30-Mar-01 150 235 0.50% 234
Kuttiyadi Kerala 15-Mar-01 50 148 0.50% 148
Sharavathy Tail Race (2) Karnataka 20-Feb-01 60 260 0.50% 258
Shahpur Karnataka 1-Jun-00 7 24 0.50% 24
Singur AP 28-Mar-00 8 1 0.50% 0
Parson's valley (1) Tamilnadu 6-Mar-00 30 55 0.50% 55
Singur AP 6-Dec-99 8 1 0.50% 0 Steam - Coal
Ramagundam S.T.P.S unit 7 AP 31-Aug-04 500 310 6.59% 290 978 283,169
Raichur TPS - 7 Karnataka 11-Dec-02 210 1,500 8.82% 1,368 1,044 1,427,683
Simhadri - 1 AP 24-Aug-02 500 4,088 5.65% 3,857 1,070 4,127,487
Simhadri - 2 AP 22-Feb-02 500 4,035 5.65% 3,807 1,070 4,073,975
Steam - Lignite
Neyveli FST (Ext) - unit 2 Tamilnadu 22-Jul-03 210 1,588 9.00% 1,445 1,357 1,961,569
Neyveli FST (Ext) - unit 1 Tamilnadu 21-Oct-02 210 1,650 9.00% 1,502 1,357 2,038,154
Neyvelli TPS (Zero unit) Tamilnadu 11-Oct-02 250 1,248 9.00% 1,135 1,303 1,479,103
Diesel
Kasargode DG Karnataka 3-Mar-02 22 16 4.00% 15 601 9,046
Samayanallur DGPP Tamilnadu 22-Sep-01 106 342 4.00% 328 601 197,202
Samalpatti DGPP Tamilnadu 1-Mar-01 106 356 4.00% 341 601 205,296
Kozhikode DG Power Kerala 6-Nov-99 128 161 4.00% 154 601 92,799
Gas
Kuttalam CCPP Tamilnadu 24-Mar-04 36 234 5.28% 222 446 98,945

PROJECT DESIGN DOCUMENT FORM (CDM PDD) - Version 03.1. CDM – Executive Board page 44
Name of the plant State Date of addition
Inst. Cap
Gross Gen
Aux Cons
Net supply to grid
Emission factor (tCO2/ GWh)
Total tCO2
MW GWh % GWh (for 2004-05)
Kuttalam CCPP Tamilnadu 30-Nov-03 64 417 5.28% 395 446 175,902
Valthur GTPP (ST) Tamilnadu 13-Mar-03 34 202 5.28% 191 446 85,135
Valthur GTPP Tamilnadu 24-Dec-02 60 356 5.28% 337 446 150,237
Peddapuram CCGT AP 12-Sep-02 78 413 2.57% 402 446 179,294
Peddapuram CCGT AP 26-Jan-02 142 752 2.57% 732 446 326,406
Pillaiperumalnallur GTPP (1) Tamilnadu 5-Apr-01 106 148 5.28% 140 446 62,572
Kovilkalapai GT Tamilnadu 30-Mar-01 38 271 5.28% 257 446 114,450
Pillaiperumalnallur GTPP (1) Tamilnadu 22-Feb-01 225 316 5.28% 299 446 133,447
Kovilkalapal GT Tamilnadu 5-Feb-01 69 492 5.28% 466 446 207,817
Lanco Kondapalli AP 18-Oct-00 126 810 2.57% 789 446 351,825
Lanco Kondapalli AP 19-Sep-00 224 1,440 2.57% 1,403 446 625,467
Kayamkulam CCGT Kerala 30-Oct-99 119 212 5.21% 201 446 89,435
Wind Wind projects from 1999 to
2005 Southern region 31-Mar-05 1,248 2,187 0.00% 2,187
Nuclear
Kaiga (1) Karnataka 10-Sep-00 220 1,515 11.34% 1,343
Kaiga (2) Karnataka 2-Dec-99 220 1,411 11.34% 1,251
Total 30-Oct-99 5,751 29,085 27,462 18,496,416 Test of Build Margin Sampling Net Generation from five most recent plants in GWh: 429 Total Net Electricity Generation for SR grid (2004-05) in GWh: 137,025 Total Net Electricity Generation from power plants added to the system in GWh: 27,462 of Grid Generation : 20.04% Therefore the power plants as per table above have been considered in Build Margin calculations BUILD MARGIN 673.52 tCO2/GWh

PROJECT DESIGN DOCUMENT FORM (CDM PDD) - Version 03.1. CDM – Executive Board page 45
Combined Margin for Southern Grid
Southern Grid (tCO2e/GWh)
Operating Margin - 2002-03 1,365
Operating Margin - 2003-04 1,051
Operating Margin - 2004-05 1,061
Average Operating Margin of last three years 1,159
Build Margin tCO2e/GWh 673.52
Combined Margin for Wind Power Plants Southern Grid (tCO2e/GWh)
Weights
Operating Margin 0.75
1,159
Build Margin 0.25
674
Combined Margin 1,037.438

PROJECT DESIGN DOCUMENT FORM (CDM PDD) - Version 03.1. CDM – Executive Board page 46
Annex 4
MONITORING INFORMATION • Metering: Electricity supplied to the grid is metered by the Parties (KPTCL, Enercon and the
Project) at the high voltage side of the step up transformer installed at the Project Site. • Metering Equipment: Metering equipment is electronic trivector meters of accuracy class 0.2%
required for the Project (both main and check meters). The main meter is installed and owned by the Project, whereas check meters are owned by KPTCL. The metering equipment is maintained in accordance with electricity standards prevalent in Karnataka. The meters installed are capable of recording and storing half hourly readings of all the electrical parameters for a minimum period of 35 days with digital output.
• Meter Readings: The monthly meter readings (both main and check meters) is taken jointly by the
parties on the first day of the following month at 12 Noon. At the conclusion of each meter reading an appointed representative of KPTCL and Enercon sign a document indicating the number of Kilowatt-hours indicated by the main meter.
• Inspection of Energy Meters: All the main and check energy meters (export and import) and all
associated instruments, transformers installed at the Project are of 0.2% accuracy class. Each meter is jointly inspected and sealed on behalf of the Parties and is not to be interfered with by either Party except in the presence of the other Party or its accredited representatives.
• Meter Test Checking: All the main and check meters are tested for accuracy with reference to a
portable standard meter. The portable standard meter is owned by KPTCL. The main and check meters shall be deemed to be working satisfactorily if the errors are within specifications for meters of 0.2 accuracy class. The consumption registered by the main meters alone will hold good for the purpose of metering electricity supplied to the grid as long as the error in the main meters is within the permissible limits.
If during the meter test checking, • the main meter is found to be within the permissible limit of error and the corresponding check
meter is beyond the permissible limits, then the meter reading will be as per the main meter as usual. The check meter shall, however, be calibrated immediately.
• the main meter is found to be beyond permissible limits of error, but the corresponding check meter is found to be within permissible of error, then the meter reading for the month up to the date and time of such test shall be as per the check meter. There will be a revision in the meter reading for the period from the previous calibration test up to the current test based on the readings of the check meter. The main meter shall be calibrated immediately and meter reading for the period thereafter till the next monthly meter reading shall be as per the calibrated main meter.
• both the main meters and the corresponding check meters are found to be beyond the permissible limits of error, both the main meters shall be immediately calibrated and the correction applied to the reading registered by the main meter to arrive the correct reading of energy supplied for metering electricity supplied to the grid for the period from the last month’s meter reading up to

PROJECT DESIGN DOCUMENT FORM (CDM PDD) - Version 03.1. CDM – Executive Board page 47
the current test. Meter reading for the period thereafter till the next monthly reading shall be as per the calibrated main meter.
• If during any of the monthly meter readings, the variation between the main meter and the check meter is more than the permissible limit for meters of 0.2% accuracy class, all the meters shall be re-tested and calibrated immediately.
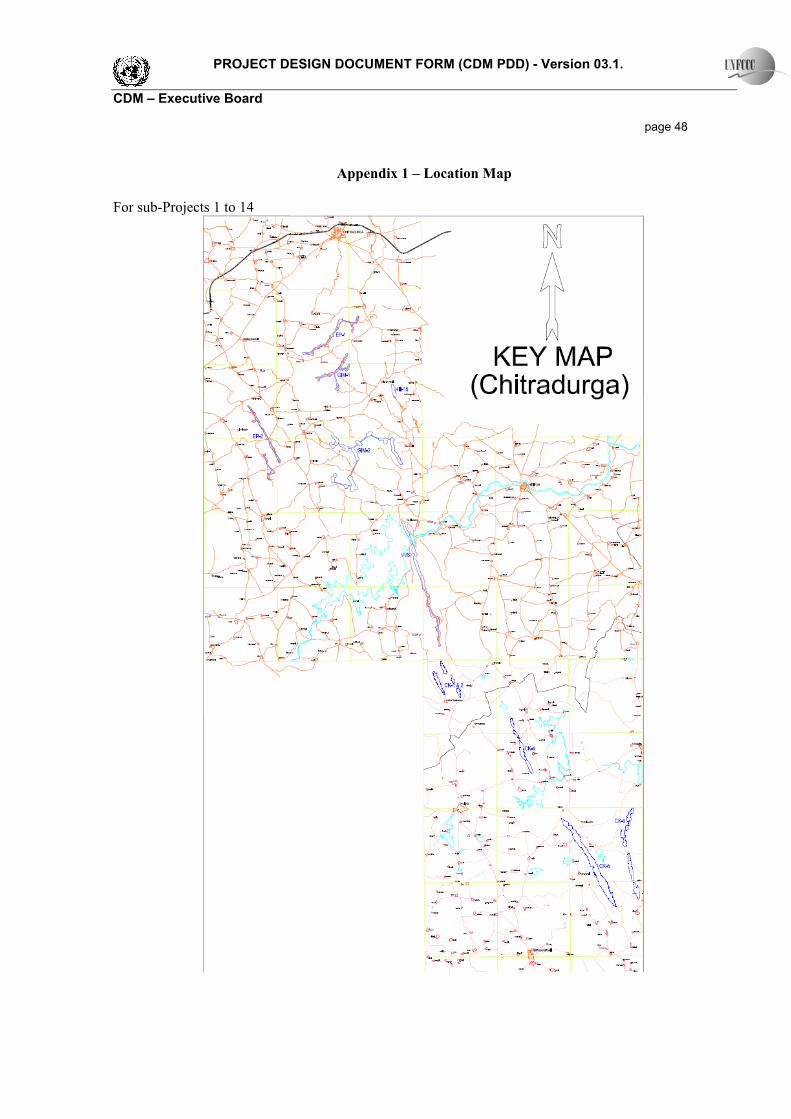
PROJECT DESIGN DOCUMENT FORM (CDM PDD) - Version 03.1. CDM – Executive Board page 48
Appendix 1 – Location Map
For sub-Projects 1 to 14
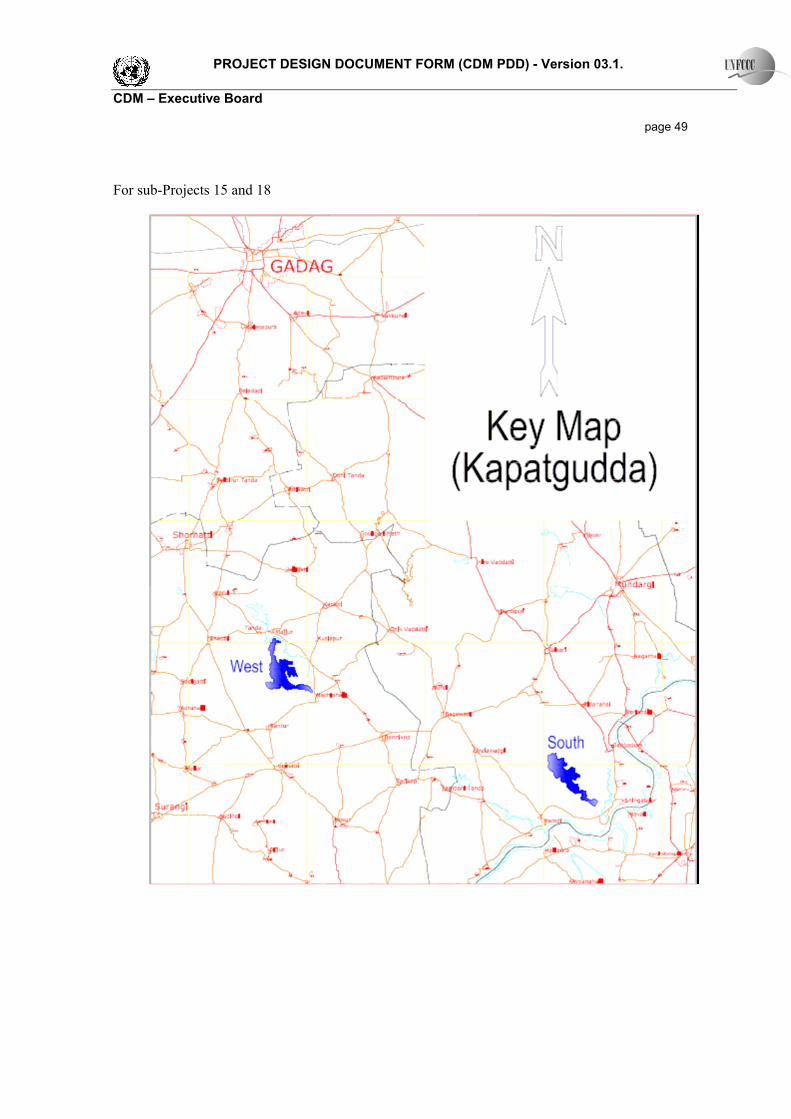
PROJECT DESIGN DOCUMENT FORM (CDM PDD) - Version 03.1. CDM – Executive Board page 49
For sub-Projects 15 and 18

PROJECT DESIGN DOCUMENT FORM (CDM PDD) - Version 03.1. CDM – Executive Board page 50
Appendix 2 – Minutes of stakeholder consultation meeting Public Consultation Meeting for Wind Farm Projects as Clean Development Mechanism Projects at sites – CK 1&2, Gim Sites and VVS, Chitradurga District, Karnataka State. Venue: Enercon (India) Limited, CK 1 & 2 Site, Arashinagundi Village, Hiriyur, Chitradurga Dist. Date: 02nd September 2006, 10 am – 12 pm Members from the Villages:
1. Sri. Thimmanna 2. Sri. Kanumappa 3. Sri. Rajappa
And 19 participants from the village. Members from Enercon (India) Ltd., Chitradurga
1. Mr. C.B.Poonacha 2. Mr. Sajith 3. Mr. Fathahulla 4. Mr. Naveen Kumar 5. Mr. Ravidhara
Members from Enercon(India) Ltd., Mumbai
1. Mr. Vivek Sen 2. Mr. Neeraj Gupta
Members from Aditya Environmental Services Pvt. Ltd.
1. Mr. Gurmeet Singh Agenda of the Meeting:
1. Welcome Address and Introduction 2. Project Profile, CDM, Environmental and social issues 3. Description about Wind Energy Conversion. 4. Suggestions and Opinions 5. Queries and Responses from the Stakeholders and Co. Authorities respectively. 6. Vote of Thanks.
1. Welcome Address: In the Welcome Address, Mr. C.B.Poonacha has briefed about the purpose of
this Public Meeting, how Wind Mills and Wind Energy are occupied major role in generating power thereby rural population is benefited. Further he was pointing out how the benefits of employment opportunities, economical growth taken place in the areas. And also he has quoted examples of various social and religious activities taken up in the villages, for ex. construction of temples, roads through villages etc.
Then Mr. C.B.Poonacha invited Mr. Thimmanna, Village Panchayat leader to preside over the meeting and conducts the further proceedings. And also he has invited village leaders viz. Mr. Kanumappa and Mr. Rajappa on the dias.

PROJECT DESIGN DOCUMENT FORM (CDM PDD) - Version 03.1. CDM – Executive Board page 51
2. Project Profile:
Mr. Md. Fathahulla: Mr. Md. Fathahulla has described about the Wind Mills and how the Wind Power is generated, why it is called Green Energy and our project is emission free and it is pollution free energy when compared with Thermal power. He reiterated that in Thermal Power, carbon would be emitted into the air, which causes air pollution. He said that the public would not have any bad impact by the Wind Mills. When asked by the villagers about the clouds running away due to running of Wind Mills and thereby causing deficiency in rainfall, Mr. Fathahulla has cleared the doubts of the stakeholders by convincing them about the height of the clouds and the height of the Wind Mill Erector. He said we are conducting aforestation and drainage work to eradicate the soil erosion from the hills. He also informed that the co-operation by the villagers required for successful completion and service of Wind Mills. Mr. Ravidhara: Mr. Ravidhara has described to the villagers how the power is converted from Wind to Electricity and how the generators are running and generate electricity power. And also he has specified where the generated power will be transmitted and at what rate. He has told about the safety measures taken in our Wind Erectors and automatic stoppage of m/c with more rpm in order to avoid any untoward incidence.
3. President’s Address:
a) Sri. Thimmanna who has presided over the meeting has informed the villagers about how Wind Mills are helped our Villagers and Farmers, benefits to the unemployed one. And we have benefited more from wind mills rather loss of any kind. He also strongly quoted that “The economic and social life has changed due to wind mills in and around Chitradurga Villages. He extended fullest cooperation for development of such activities and also stated that lack of rainfall in the region is not due to Wind Mills. Since last two years we had plenty of rainfall. He also pledged that the cooperation from our villagers is there in future also and sought the same from Enercon.
b) Sri. Kanumappa has accepted that the temple work is been completed by Enercon only and praised about the social and religious activities by Enercon. Eco friendly project like wind power should come up in all villages which will not harm any environmental balancing, he specified.
c) Sri. Rajappa, who has told that there was no rainfall shortage due to Wind Mills. Questionnaire: a) By the Stakeholders:
i) Are you conducting afforestation work in the hills where the plants are removed? Ans: Yes, We are doing afforestation work in all the hills where M/cs are installed. ii) Are there any chances of drying up Ground Water? Ans: No, Wind Mills do not use any ground water for its process. iii) What is the generation capacity of the Machine? Ans: 800 KW per hour. iv) Is there any scope of purchasing machine by the public? Ans: Yes, In Maharashtra farmers association has purchased one machine. v) There is a rumour that revenue land is used wherever the electrical line passes
through? Is it true? Ans: No, Only line inspection will be done.

PROJECT DESIGN DOCUMENT FORM (CDM PDD) - Version 03.1. CDM – Executive Board page 52 b) By the Company:
i) Is there any Noise Pollution by running the Wind Mills? Ans: So far no idea. But as it is in hilltops and away from villages such nuisance may not happen. ii) Is there any water draining, soil erosion due to Wind Mills? Ans: No, such incidence not occurred. iii) Is there any problem for animals grazing in the hills? Ans: No, Cattle are grazing in hill areas as usual. iv) How Wind Mills helped in improvement of Crops? Ans: By increase in voltage capacity and less load shedding results in increase in food grain production. v) Have you observed any deforestation problem? Ans: No, Except while forming the roads and installing the machines, there found no deforestation is taken place. vi) During construction or erection any damages or accidents occurred? Ans: Absolutely not. The Project work is taken up very smoothly and run with more safety standards.
For further queries the representatives from ENERCON put forward to the participants that they could raise any queries within a week and the same can be submitted at ENERCON Office, Bangalore as the address mentioned in the Paper Notification on 19th Aug. 2006.
Vote of Thanks: Mr. Naveen Kumar thanked the village leaders and villagers who have set aside their work and shown interest and eagerness to know about the Wind Mills. He also sought cooperation from all the corners for successful operation of windmills thereby achieving the National Target of self-sufficiency in Power Sector.

PROJECT DESIGN DOCUMENT FORM (CDM PDD) - Version 03.1. CDM – Executive Board page 53
MINUTES OF THE PUBLIC CONSULTATION STAKEHOLDERS MEETING HELD AT GADAG, KARNATAKA ON 15/06/06
Venue: The meeting is held at Panchayat office, Dhoni, Mundaragi, GADAG, which is about Nine Km. From the project site. The meeting has begun at 3:30pm. There are more than forty people attending the meeting. The participants are the people from the villages surrounding the project site- Dambal, Dhoni-Thanda, Kadampura, Katkol, HireVaddatti. Other participants are the panchayat officials- President and Vice President, Representatives from ENERCON, and CARE SUSTAINABLILTY The language of meeting is Kannada. In between Hindi was also used. The meeting began with the appointment of chairman for the meeting Mr. K.S. Narayanpur. The agenda for the meeting has been as follows:
• Welcome to the participants (by representatives from ENERCON) • Brief to the participants about the project and CLEAN DEVELOPMENT MECHANISM (CDM) • Questions and answers: concerns/issues/comments/ about the project and related matters by the
participants • Response from ENERCON • Announcement by the representatives of ENERCON • Vote of thanks
The list of the participants with their names and signature are in attached sheet. The meeting proceeded as per agenda Table below gives the concerns/issues/comments from the participants and response from ENERCON Sr. No
Questions/concerns/issues/comments relating to the CDM activity
Details of concerns/issues/comments expressed by the participants
Response from ENERCON
1 How does the project impact the general quality of the people
All participants expressed that the establishment of the wind units do not adversely affect them (villagers around the project). In brief the projects neither adversely nor bring significant benefits to them. All of them expressed they are happy with the project activity
-
2 Any impact on the livelihood of the villagers
Villagers expressed that their livelihood have not been impacted adversely by the establishment of the wind units. The hill tops or slopes have not been used by them for grazing the cattle.
-
3 Does the project increase the employment opportunities
The following facts have been given by the villagers. During the construction stage, most of the
For locals with ITL(technical
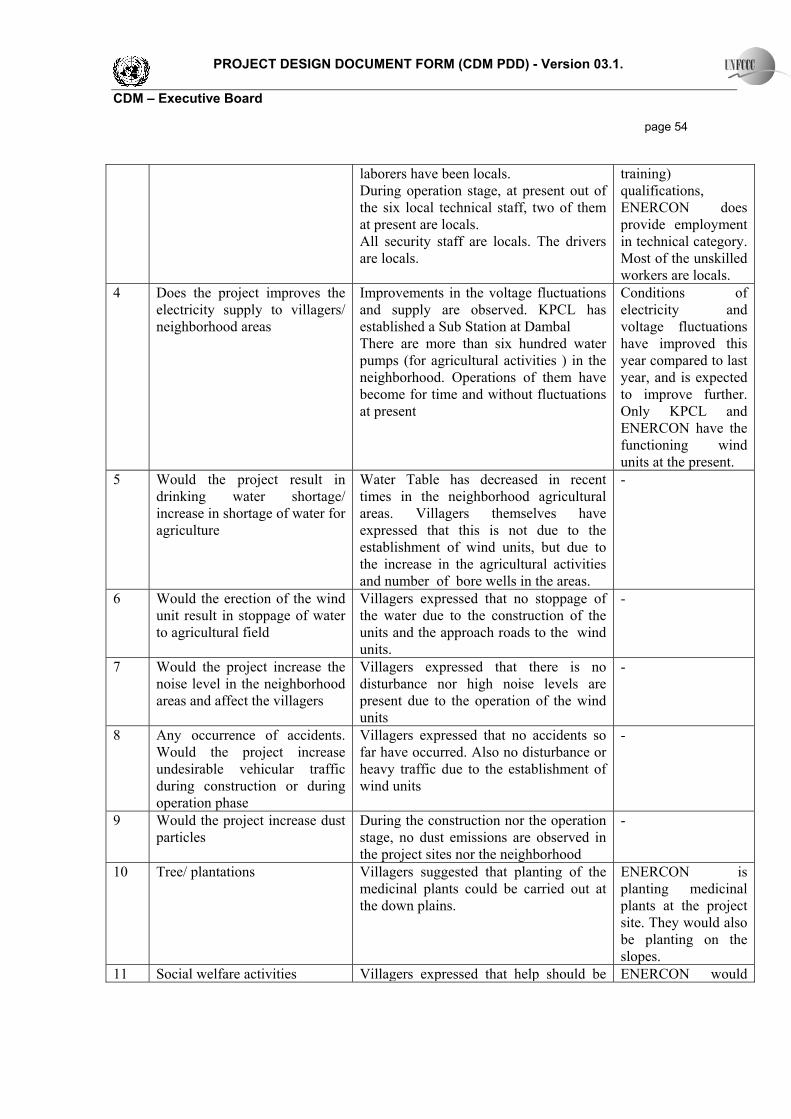
PROJECT DESIGN DOCUMENT FORM (CDM PDD) - Version 03.1. CDM – Executive Board page 54
laborers have been locals. During operation stage, at present out of the six local technical staff, two of them at present are locals. All security staff are locals. The drivers are locals.
training) qualifications, ENERCON does provide employment in technical category. Most of the unskilled workers are locals.
4 Does the project improves the electricity supply to villagers/ neighborhood areas
Improvements in the voltage fluctuations and supply are observed. KPCL has established a Sub Station at Dambal There are more than six hundred water pumps (for agricultural activities ) in the neighborhood. Operations of them have become for time and without fluctuations at present
Conditions of electricity and voltage fluctuations have improved this year compared to last year, and is expected to improve further. Only KPCL and ENERCON have the functioning wind units at the present.
5 Would the project result in drinking water shortage/ increase in shortage of water for agriculture
Water Table has decreased in recent times in the neighborhood agricultural areas. Villagers themselves have expressed that this is not due to the establishment of wind units, but due to the increase in the agricultural activities and number of bore wells in the areas.
-
6 Would the erection of the wind unit result in stoppage of water to agricultural field
Villagers expressed that no stoppage of the water due to the construction of the units and the approach roads to the wind units.
-
7 Would the project increase the noise level in the neighborhood areas and affect the villagers
Villagers expressed that there is no disturbance nor high noise levels are present due to the operation of the wind units
-
8 Any occurrence of accidents. Would the project increase undesirable vehicular traffic during construction or during operation phase
Villagers expressed that no accidents so far have occurred. Also no disturbance or heavy traffic due to the establishment of wind units
-
9 Would the project increase dust particles
During the construction nor the operation stage, no dust emissions are observed in the project sites nor the neighborhood
-
10 Tree/ plantations Villagers suggested that planting of the medicinal plants could be carried out at the down plains.
ENERCON is planting medicinal plants at the project site. They would also be planting on the slopes.
11 Social welfare activities Villagers expressed that help should be ENERCON would

PROJECT DESIGN DOCUMENT FORM (CDM PDD) - Version 03.1. CDM – Executive Board page 55
extended to villagers by providing “lifts”/transportation, when they request during cases like “deliveries” cases etc.
do their best ot provide help to the villagers in the emergency cases.
12 Forest fire Villagers expressed fear about the occurrence of forest fire on the hills. (last year there was heavy forest fire on the hill tops). “Kalpatamallaiah” temple which is worshipped by the villagers is located on the hill. There should be additional watchmen to be deployed by ENERCON for warning the villagers in the event of forest fire.
ENERCON told about the efforts being made by them. They would be constructing a three feet trench on the slopes and around the project site. Also watchmen and security guards have been instructed to be vigilant and provide warning in the cases of occurrences of forest fires
13 Does any disturbance to Avi fauna occur due to the wind units?
Villagers expressed that due to the increased usage of pesticide in the agricultural areas in the neighbourhood there is a decrease in the birds due to the lack of insects/worms etc. There is no bird’s migratory path in the areas
-
The representative of ENERCON announced that if the villagers or the participants stiil wish to bring to notice of ENERCON any further issues/concerns/comments about the wind farms owned by ENERCON, they may approach and convey to their respective representative Mr. Mahesh Arali located at the project site. The response could be made during the next one month starting from the sate of 15/06/06 The meeting closed with giving thanks to all the participants and the chairman of the meeting.