clean development mechanism project design document … switching project... · clean development...
TRANSCRIPT

PROJECT DESIGN DOCUMENT FORM (CDM PDD) - Version 03.1. CDM – Executive Board page 1
CLEAN DEVELOPMENT MECHANISM PROJECT DESIGN DOCUMENT FORM (CDM-PDD)
Version 03 - in effect as of: 28 July 2006
CONTENTS A. General description of project activity B. Application of a baseline and monitoring methodology C. Duration of the project activity / crediting period D. Environmental impacts E. Stakeholders’ comments
Annexes Annex 1: Contact information on participants in the project activity Annex 2: Information regarding public funding Annex 3: Baseline information
Annex 4: Monitoring plan Annex 5: Stakeholder Consultation Annex 6: Capacity tests Annex 7: Request for clarification modification Annex 8: Fuel price comparison and NPV calculations Annex 9: Environmental Impact Assessment

PROJECT DESIGN DOCUMENT FORM (CDM PDD) - Version 03.1. CDM – Executive Board page 2 SECTION A. General description of project activity A.1 Title of the project activity: Fuel Switching Project of the Aqaba Thermal Power Station (ATPS) PDD Version Number 1 29 October 2007 A.2. Description of the project activity: The Fuel Switching Project of the Aqaba Thermal Power Station (hereafter, the “Project”) developed by Central Electricity Generating Company, CEGCO (hereafter referred to as the “Project Developer”) is a project to switch from oil to gas at the Aqaba Thermal Power Station (ATPS) in Aqaba, Jordan, hereafter referred to as the “Host Country”. CEGCO was created in 1998, following the governmental decision to restructure the power sector towards privatization by unbundling of the National Electric Power Company (NEPCO) into 3 companies for the generation, transmission, and distribution of electricity in Jordan. ATPS is a 650 MW power station comprised of five 130 MW units (each unit is made up of 1 boiler, 1 turbine, and 1 generator). ATPS is the largest power plant in Jordan. The fuel switch is from Heavy Fuel Oil (HFO) to Natural Gas (NG), and the capacity of the plant is unchanged as a result of the fuel switch. The modifications necessitated by the fuel switch are to boiler components, control systems, and the fuel delivery system only. The modified units were synchronised with the national grid between August 03 and April 04. The project activity reduces CO2 emissions by switching from a more carbon-intensive baseline fuel (HFO) to a less carbon-intensive project fuel (NG). As per the ACM0011, the annual emission reductions are calculated as the amount of net electricity produced annually in the project, capped at the historic level (4,695,800MWh/yr) and multiplied by the difference in emission factors of electricity production in the project compared to historically. The Project is estimated to reduce an average annual amount of 354,015 tCO2e/year over a 10 year crediting period. ATPS initiated this fuel switch because of the plant’s negative environmental impacts, which are mostly gaseous and a result of HFO combustion for electrical power generation, and because of the Jordan’s ratification of the Kyoto Protocol and potential CDM benefits, which have been considered from the beginning of the project to make it financially viable despite unfavourable relative fuel prices. The fact that ATPS has converted to a cleaner-burning fuel, from HFO to NG, has resulted in significantly reduced pollution, which is particularly important in this region due to the proximity to a populated tourist destination (the city of Aqaba to the north), and the Saudi Arabian border to the south. The fuel switch will benefit the environment and contribute to sustainable development as follows:
• Reduces CO2, SO2, NOx, and suspended particulate matter with associated aromas; • Reduces odor nuisance from H2S, since high sulphur content HFO is substituted by NG;

PROJECT DESIGN DOCUMENT FORM (CDM PDD) - Version 03.1. CDM – Executive Board page 3
• Support the local economy, which is dominated by tourism and therefore benefits greatly from reduced pollution;
• Eliminates visual pollution as smokestack output is no longer coloured; • Acts as a clean technology demonstration project; • Reduces shipping/trucking of HFO, with reduced related traffic and pollution (natural gas will be
imported from Egypt via a submarine pipeline in the Gulf of Aqaba); • Reduces GHG emissions and diversifies Jordan’s electricity production with a leaning towards
“cleaner” power. A.3. Project participants: Table 1 - Project participants
Name of party involved (*) ((host) indicates a host party)
Private and/or public entity(ies)
Project participants (*) (as applicable)
Kindly indicate if the party involved wishes to be considered as project
participant (Yes/No)
The Hashemite Kingdom of Jordan (host)
Central Electricity Generation Company (CEGCO)
No
United Kingdom of Great Britain and Northern Ireland
EcoSecurities Group Plc No
(*) In accordance with the CDM modalities and procedures, at the time of making the CDM-PDD public at the stage of validation, a Party involved may or may not have provided its approval. At the time requesting registration, the approval by the Party(ies) involved is required. A.4. Technical description of the project activity: A.4.1. Location of the project activity: Aqaba Thermal Power Station (ATPS), Aqaba, The Hashemite Kingdom of Jordan. A.4.1.1. Host Party(ies): The Hashemite Kingdom of Jordan. (the “Host Country”) A.4.1.2. Region/State/Province etc.: Aqaba Special Economic Zone Authority (ASEZA) A.4.1.3. City/Town/Community etc: Approximately 16 kms south of the resort/port city of Aqaba, in an unpopulated zone, though within the administrative jurisdiction of the City of Aqaba.

PROJECT DESIGN DOCUMENT FORM (CDM PDD) - Version 03.1. CDM – Executive Board page 4 A.4.1.4. Detail of physical location, including information allowing the unique identification of this project activity (maximum one page): Aqaba Thermal Power Station (ATPS):
GPS coordinates 29o 22’ 42.59’’ North & 34o 58’ 30.10’’ East; Approximately 35m above sea level; 16 kms South of the town of Aqaba, Jordan; and 2.5 kms North of the Jordan-Saudi Arabia border (on the Gulf of Aqaba).
A.4.2. Category(ies) of project activity: According to Annex A of the Kyoto Protocol, this project fits in Sectoral Category 1, Energy industries (renewable - / non-renewable sources)
A.4.3. Technology to be employed by the project activity: ATPS is a thermal type power station with a total capacity of 650 MW consisting of 5 discrete units (5 boilers, 5 turbines, and 5 generators) each with a capacity of 130 MW. Units 1 and 2 have been in service since 1986, and Units 3, 4, and 5 have been in service since 1998. There is a small hydro component, whereby cooling water is pumped up from the Gulf of Aqaba, used to condense boiler steam, and allowed to return to the Gulf while turning 2 turbines (the power generated is approximately 60% of that consumed in the pumps, the balance coming from the plant itself). The project involves the conversion of the five ATPS boiler units from HFO firing to dual NG/HFO firing. Following the fuel switch, NG is the primary fuel, and HFO is the standby fuel, used in the event of NG supply shortages. Prior to conversion to dual firing, the 5 units ran on HFO Type #6 (with sulphur content of approximately 3.6%). All 5 units implement tandem compound 2-cylinder steam-condensing turbines, cooled by seawater. The boilers are tangentially fired, with sliding pressure operation. Since conversion, the five units have been operating predominantly on NG (the base fuel)1 – see “Table 1” compiled from CEGCO Annual Reports ’03 – ’05). HFO is the standby fuel and strategic reserve.
2003 2004 2005 HFO (t) NG (mmBTU) HFO (t) NG (mmBTU) HFO (t) NG (mmBTU)
708,997 8,698,571
135,478
38,843,331
33,621
47,822,176
Table 1: HFO and NG consumption at ATPS post fuel switch – note the move toward NG as the primary fuel. Prior to the fuel switch, the heat within the boilers was generated by the combustion of HFO. Following the fuel switch, NG is combusted to generate the heat that is used to create the steam. Therefore, the only
1 2005 CEGCO Annual Report, Power Plant Fuel Consumption Table, p.21

PROJECT DESIGN DOCUMENT FORM (CDM PDD) - Version 03.1. CDM – Executive Board page 5 modifications to the plant are modifications within the fuel delivery system, control systems and the burners. The fuel switch technology adopted and installed at ATPS is proven and tested, though not in Jordan. It is essentially a small modification in a complex fossil fuel burning power plant. The synchronisation of the boilers once converted to NG firing was done progressively between August 2003 and April 2004, according to the following schedule2:
• Unit 3 – 14/08/03 • Unit 4 – 15/09/03 • Unit 5 – 16/10/03 • Unit 1 – 16/02/04 • Unit 2 – 22/04/04
The conversion to dual firing includes:
• The design, supply, installation, commissioning, and testing of NG pipelines from the station boundary to the burners of the 5 boilers, including pressure reduction stations for the pipeline-supplied NG, gas temperature adjustment stations, gas quality analysers, and control units.
• Testing of boilers’ maximum continuous capacity at design operating ratings (pressure and temperature), and efficiency.
• Since the boilers themselves were initially designed to accept HFO only, the fuel delivery stage within the boilers had to be modified. This means that the burners and their auxiliary hardware (pipes/valves) were changed to accommodate both types of fuels.
The fuel switch did not require any modifications to:
• Boilers (except burners and their auxiliaries) • Turbines • Generators • Electricity distribution systems
The fuel switch does not affect the total capacity or the maximum electricity generation capacity of ATPS. Power output (theoretical and actual) of the plant remains unchanged at 650 MW, however there has been a slight reduction in efficiency with NG use as specified in B.4. The technical set-up of ATPS is illustrated on figure A.4.3.1 below (all 5 units are of the same general arrangement):
Figure A.4.3.1 ATPS Schematic Cycle Diagram
2 CEGCO ATPS Summarized Description of the Aqaba Thermal Power Station - 2005 brochure

PROJECT DESIGN DOCUMENT FORM (CDM PDD) - Version 03.1. CDM – Executive Board page 6
Table 2: Main technical parameters of ATPS
Before Fuel Switch After Fuel Switch Capacity (MW) 5 x 130 = 650 Same Type of Turbines Unit I-II
Franco Tosi TVW 2OR/2 130MW
Same
Type of Turbines Unit III-V
ABB PGL DKY2-2063 130MW
Same
Type of Generator Turbines Unit I-II
Ercole Marelli SGTHC-244402 160MVA/15KV
Same
Type of Generator Turbines Unit III-V
ABB PGL WX212-092LLT 160MVA/15KV
Same
Type and numbers of burners
20 HFO burners 20 HFO burners + 20 NG burners
HFO fuel tank capacity 7 x 37,000 tons 2 x 37,000 tons (strategic reserve)

PROJECT DESIGN DOCUMENT FORM (CDM PDD) - Version 03.1. CDM – Executive Board page 7
A.4.4 Estimated amount of emission reductions over the chosen crediting period:
The project activity reduces CO2 emissions by switching from a more carbon-intensive baseline fuel (HFO) to a less carbon-intensive project fuel (NG). The estimated emission reductions during the 10 year crediting period are shown in the table below: Table 3 - Estimated emissions reductions from the project
Years Annual estimation of emission reductions (tCO2e)
2008 384,799 2009 384,799 2010 384,799 2011 384,799 2012 384,799 2013 384,799 2014 384,799 2015 384,799 2016 230,880 2017 230,880
Total estimated reductions (tCO2e)
3,540,154
Total number of crediting years 10 Annual average over the crediting period of estimated reductions (tCO2e)
354,015
A.4.5. Public funding of the project activity: The project did not and does not receive any public funding from Parties included in Annex I of the UNFCCC.

PROJECT DESIGN DOCUMENT FORM (CDM PDD) - Version 03.1. CDM – Executive Board page 8 SECTION B. Application of a baseline and monitoring methodology B.1. Title and reference of the approved baseline and monitoring methodology applied to the project activity: The project uses approved methodology ACM0011 (“Consolidated baseline methodology for fuel switching from coal and/or petroleum fuels to natural gas in existing power plants for electricity generation”), Version 01, approved at EB 32. For determination of a baseline scenario and additionality, ACM0011 refers to the “Combined tool to identify the baseline scenario and demonstrate additionality”, Version 02.1, approved at EB 28.
For further demonstration of additionality, ACM0011 refers to the “Tool for the demonstration and assessment of additionality”, Version 03, approved at EB 29. B.2 Justification of the choice of the methodology and why it is applicable to the project activity: ACM0011 is applicable to project activities that switch fuel from petroleum fuels to NG in an existing power plant for electricity generation, and this project meets all the applicability criteria as stated in the methodology:
• The PAPP either supplies electricity to the electricity grid or to a captive consumer3; ATPS supplies electricity to the national Jordanian power grid. All power plants in the
system are dispatched by a dispatch centre. • Prior to the implementation of the project activity, only petroleum fuels (but not NG) were used
in the PAPP to generate electricity; Before the fuel switch, no NG was used in the PAPP. In addition, before the fuel switch,
no NG equipment and no gas supply infrastructure was in place at ATPS to utilize NG for electricity production.
• Petroleum fuel is available in the country/region for electricity generation; Though Jordan does not have any natural oil resources, HFO is available in the country.
HFO can either be imported via the port of Aqaba, but more importantly Jordan produces HFO in its Zarqa Refinery (350 kms to the North) from imported crude oil. Crude oil is available abundantly in the region.
• Regulations/laws and programs do not restrain the facility from using the fossil fuels used prior to implementing the project activity, neither require the use of natural gas or a specified fuel to generate electricity;
There are no laws or regulations in place which would restrict ATPS from using HFO for electricity production, nor are there any laws/regulations which force them to use NG in Jordan.
3 The electricity grid is an electricity supply system to which many consumers and many power plants are connected, as defined in ACM0002. The power plants connected to the electricity grid are dispatched by a dispatch center.

PROJECT DESIGN DOCUMENT FORM (CDM PDD) - Version 03.1. CDM – Executive Board page 9
• The electricity grid to which the electricity generated by the PAPP is sold, is not restrained by regulations/law to purchase of electricity generated from different type of fuels, i.e., it is not prohibited to purchase electricity generated using a higher GHG intensity fuel during the crediting period of the project activity.
There are no regulations/laws in place which would restrain the grid from buying electricity produced from HFO at ATPS in Jordan.
• The project activity does not involve major retrofits/modifications of the power plant other than the fuel switch, for instance, the removal of existing technology and installation of new technology, such as new gas turbines, new combined cycle gas power generation etc.;
All major installations for electricity production (boilers, turbines, generators etc.) have not been changed, removed, nor modified due to the fuel switch. Only small modifications directly necessary for the fuel switch (burners, gas supply infrastructure etc.) have been made (see section A.4.3).
• The project activity does not result in a significant change in the capacity, i.e., not more than +/-5% of the installed capacity before the implementation of the project activity;
The installed capacity of ATPS does not change due to the fuel switch. The turbines and generators are not affected by the fuel switch. The designed capacity of the each unit therefore remains at 130 MW and the total capacity is still 650 MW. The fuel switch only has effects on the steam generation capacity of the boiler which is determining the theoretical capacity of the plant. The capacity of the boilers has been tested before and after the modifications for the fuel switch had been implemented. The tests were performed by Alstom in 2003 and 2004. The results as demonstrated in the table below show that the average superheater steam flow at maximum continuous running for all 5 units change by a maximum of 2.01%
Steam flow 5 Units before boiler modifications running on HFO (t/h)
416.358
Source: Alstom Boiler Tests results for Unit 1-5 of ATPS 2003-2004 Steam flow 5 Units after boiler modifications
running on NG (t/h) 424.746
Change in maximum steam output -2.01% It is therefore clearly demonstrated that the implementation of the fuel switch does not result in a significant change of the installed capacity of the ATPS Please see Annex 6 for the test results for each unit.
• The project activity does not result in an increase of the lifetime of the PAPP during the crediting period. If the lifetime of the PAPP is increased due to the project activity, the crediting period shall be limited to the estimated remaining lifetime of the power plant, i.e. the time when the existing power plant would have needed to be replaced in the absence of the project activity;
Seeing as the plant lifetime is determined by the boiler lifetime, and the boilers remain unchanged, the plant lifetime remains unchanged. The designed lifetime of the boiler is 30 year and therefore the lifetime of units 1 and 2 is until 2016, and for units 3, 4, and 5, until 2028 4.
4 See: Merz and McClellan Consulting Engineers: Aqaba Thermal Power Station Stage II Units 3 and 4 Environmental Impact Assessment, Volume I, October 1995, Section 6, p.1

PROJECT DESIGN DOCUMENT FORM (CDM PDD) - Version 03.1. CDM – Executive Board page 10
Units Start of operation Designed lifetime End of designed lifetime
1 & 2 (Stage 1)
March and July 1986
30 yrs 2016
3, 4, & 5 (Stage 2) April, July, December 1998
30 yrs 2028
The 10 year crediting period starts in 2008 and therefore ends in 2018. For units 1 and 2 emission reductions will only be claimed until the end of the designed lifetime of the boilers. The emission reduction estimates in the PDD are adapted accordingly. For simplification, the total amount of emission reductions estimations in the PDD are done by dividing the total emission reductions by 5 and then multiplying by 3 (the remaining 3 units) after 2016, as all units have the same capacity.
• This methodology is only applicable if the most plausible baseline scenario is the continuation of the use of high carbon intensive fuels like coal and/or petroleum fuels for electricity generation in the PAPP.
The most plausible baseline scenario as demonstrated in B.4 is the continuation of HFO use as fuel.
The project is not a greenfield power plant, does not involve cogeneration, and is not an energy efficiency project. Therefore the project meets all the applicability criteria as set out in the methodology.

PROJECT DESIGN DOCUMENT FORM (CDM PDD) - Version 03.1. CDM – Executive Board page 11 B.3. Description of the sources and gases included in the project boundary According to ACM0011 the project boundary encompasses the PAPP. Emissions sources and gases are listed in Table B.3.1 and the project boundary is described in Figure B.3.2. Table B.3.1: Emissions sources included in or excluded from the project boundary Source Gas Included? Justification/Explanation
Bas
elin
e
Emissions due to combustion of the baseline fuel (petroleum fuels) for electricity production in the PAPP
CO2 Yes Main emission source
CH4 No Minor source
N2O No Minor source
Proj
ect A
ctiv
ity
Emissions due to combustion of natural gas for electricity production in the PAPP
CO2 Yes Main emission source
CH4 No Minor source
N2O No Minor source
Emissions due to use of energy (auxiliary fuel, purchased electricity etc.) for the operation of the PAPP
CO2 Yes Main emission source
CH4 No Minor source
N2O No Minor source
Figure B.3.2: Project boundary
B.4. Description of how the baseline scenario is identified and description of the identified baseline scenario:

PROJECT DESIGN DOCUMENT FORM (CDM PDD) - Version 03.1. CDM – Executive Board page 12 According to the latest version of ACM0011 the most plausible baseline scenario is identified through the application of the following steps: STEP 1: Identification of alternative scenarios Step 1 a. Identify all realistic and credible alternatives to the project activity: Alternative 1: The proposed project activity undertaken without being registered as a CDM project
activity Alternative 2: Power generation using HFO, but technology measures other than what were used at
ATPS before the fuel switch that could reduce the emissions intensity of electricity generation
Alternative 3: Power generation using energy sources other than that used in the project activity Alternative 4: Power generation using HFO at ATPS i.e. the current practice before the fuel switch Alternative 5: The “proposed project activity undertaken without being registered as a CDM project
activity” undertaken at a later point in time For the purpose of identifying relevant alternative scenarios, technologies and practices used for power generation in Jordan have been analysed. For an overview of all electricity production practices, please refer to the common practice analysis in section B.5. Step 1b. Consistency with applicable laws and regulations: All alternatives are in line with all mandatory applicable legal and regulatory requirements of Jordan. In particular, no laws or regulations are in place which would restrict ATPS from using HFO for electricity production, nor are there any laws/regulations which force them to use NG in Jordan. STEP 2: Eliminate alternatives that face prohibitive barriers: In order to eliminate alternatives that face prohibitive barriers “Step 2 – Barrier analysis” of the “Combined tool for identification of baseline scenario and demonstration of additionality Version 02.1” is applied: Sub-step 2a. Identify barriers that would prevent the implementation of alternative scenarios: Investment barriers:
1. Barriers to investment in efficiency improvement measures at ATPS: The efficiency of ATPS before the fuel switch was 37.44%5 which is comparable to the efficiencies of similar plants in industrialized countries6. Investments in technology which would increase efficiency,
5 Yearly average of “sent out” power efficiencies, from 2002 Technical Planning Department/Power Plant Directorate CEGCO Annual Report, ATPS section, table p.88
PROJECT DESIGN DOCUMENT FORM (CDM PDD) - Version 03.1. CDM – Executive Board page 13 and thus reduce the emission intensity of electricity generation are expensive to implement, and would have only a limited effect on greenhouse gas emission intensity, given the already high plant efficiency.
2. Barriers due to fuel prices: Jordan has no significant oil resources of its own, and must rely on imported oil for all of its needs (around 3.8 million tonnes in 2001 were imported from Iraq7). Prior to the 3rd Gulf War in 2003, Jordan was receiving supplies of crude oil from Iraq - $300,000,000 worth per year for free, and the balance at half of the world market price8. This made power stations running on HFO highly competitive, and there was therefore no economic incentive to switch to gas. Due to the war these preferential terms were no longer available and Jordan was forced to import oil at world market prices. From then on, Kuwait and Saudi Arabia have been the main suppliers to Jordan, and as refinery products are still being supplied to the end consumers at subsidised prices, this is a heavy burden for Jordan’s national budget.9 Jordan has one refinery, at Zarqa, with an approximate capacity of 100,000 bbl/d. The facility is in need of major upgrades, and its owner, the Jordan Petroleum Refining Corporation (JPRC) is studying its options. The facility was designed to create a product mix skewed toward black (or “heavy”) products, such as High Sulphur content HFO and asphalt, to make best use of the cheap Iraqi oil10. At the time of undertaking the project (2003), HFO prices were lower than gas and this was projected to continue. The “Master Plan for the Energy Sector of Jordan”, Interim Report, which was written in May 2001, and presented to the “Arab Bank Centre for Scientific Research” shortly thereafter by Transborder and Nexant, predicted fuel prices, including those for HS (high sulphur content) Fuel Oil for Jordan. These price predictions were determined using 2 different methods (“Mediterranean Export Pricing” and “European Netback Pricing”) to yield results for HS HFO delivered to Aqaba. Though the numbers vary slightly from one method to the next (European Netback Prices are approximately $20/t less throughout the projection), the trend of HS HFO prices is clear – they decline steadily into the future, through 2020, and this can be seen in the tables below:
6 http://www.abb.co.uk/cawp/seitp202/f95b7920b6f64682c1256f8d0055b672.aspx or http://www.e8.org/index.jsp?numPage=138 7 Master Plan for the Energy Sector in Jordan, Executive Summary, Transborder & Nexant, Feb. 2002, p.5 8 http://arabic.peopledaily.com.cn/31659/2561697.html 9 GTZ: Energy - Policy Framework Conditions for Electricity Markets and Renewable Energies: 23 Country Analyses, Eschborn, September 2007 (http://www.gtz.de/en/themen/umwelt-infrastruktur/energie/20726.htm) 10 Master Plan for the Energy Sector in Jordan, Executive Summary, Transborder and Nexant, Feb. 2002, p.6

PROJECT DESIGN DOCUMENT FORM (CDM PDD) - Version 03.1. CDM – Executive Board page 14 Table B.4.1 Aqaba Crude and Product Prices (Med Export Pricing) from “Appendix D” of “Master Plan for the Energy Sector of Jordan”, by Transborder and Nexant, as presented to the “Arab Centre for Scientific
Research”, in May 2001.
Table B.4.2 Aqaba Crude and Product Prices (Europe Netback Pricing) from “Appendix D” of “Master Plan
for the Energy Sector of Jordan”, by Transborder and Nexant, as presented to the “Arab Centre for Scientific Research”, in May 2001.
The table below shows the average predicted HFO prices calculated from table B.4.1 and B.4.2 above
Table B.4.3 Average11 predicted price of High Sulphur content Heavy Fuel Oil for Jordan12 (US $/Tonne)
2001
2002
2003
2004
2005
2006
2007
2008
2009
2010
2011
2012
2013
2014
2015
2016
2017
2018
135.5
110.5
95.5
87.5
80.5
76.5
74.5
72.5
71.5
70.5
69.5
69.5
68.5
67.5
66.5
65.5
64.5
63.5
The arrival of the Iraq Invasion of March 2003 caused major disruptions to Jordan’s energy supply situation and rendered these price predictions obsolete. The export of free and subsidized HFO from Iraq to Jordan was drastically reduced, and eventually cut off. The country had to seek alternative sources of supply, with Kuwait and Saudi Arabia emerging as Jordan's main oil suppliers. Press reports13 indicate that at least some of this oil was sold at discounted prices through the end of 2004, and that Jordan paid
11 The calculated average is that of “European Netback Pricing” and “Mediterranean Export Pricing” 12 Appendix D of “Master Plan for the Energy sector of Jordan” Interim Report, by Transborder and Nexant, May 2001, as presented to the “Arab Bank Centre for Scientific Research” 13 http://www.aljazeera.net/NR/exeres/19015F66-A5F7-414E-AC69-CA2FC1F7B85A.htm & http://arabic.peopledaily.com.cn/31659/2561697.html

PROJECT DESIGN DOCUMENT FORM (CDM PDD) - Version 03.1. CDM – Executive Board page 15 full market prices in 200514. In effect, and due to global happenings which were beyond any Jordanian influence, the reality was that HFO prices increased (contrary to pre-2003 predictions). This in no way discounts the fact that CEGCO was committed to paying more for NG as a fuel for ATPS and decided to go ahead with the project in 2001 and 2002, when none of these future events could be foreseen. The decision was motivated by the expected environmental and social benefits of the project (reduced local air pollution from burning gas rather than HFO and reduction of GHG emissions), and the potential of CDM revenues (see end of section B.5, paragraph “CDM consideration”). Today, the second largest power plant in Jordan still runs on HFO (see step 4 of section B.5). Other barriers:
3. Non availability of other fuels: ATPS has an installed capacity of 650 MW, and the electricity produced is crucial to a reliable electricity supply in Jordan. Therefore large quantities of fuel must be available and the supply must be dependable. Only HFO and NG are available in sufficient quantities at Aqaba, and these are the only fuels which can be utilised in the plant. As such, HFO and NG are the only feasible fuels for ATPS. (Coal may also be available but cannot be burned at ATPS without major technical modifications). In the medium term the main renewable energy resources (Hydro, Wind, Biomass, Solar) are also not available in sufficient quantities to replace 650 MW generation capacity. Sub-step 2b: Eliminate alternative scenarios which are prevented by the indentified barriers Alternative 1: The proposed project activity undertaken without being registered as a CDM project activity
Hindered by barrier 2 (barrier due to fuel prices). Nevertheless kept for further analysis to exclude it
definitively.
Alternative 2: Power generation using HFO, but technological measures other than those used at ATPS before the fuel switch that could reduce the emissions intensity of electricity generation
Prevented by barrier 1 (Barriers to investment in efficiency improvement measures at ATPS). This alternative is prevented by the disproportionate investment necessary to further increase the energy efficiency of the plant. Even if efficiency could be further increased it could only result in a limited amount of emission reductions compared to a fuel switch to NG. The installation of filters, and/or the use of fuel additives to reduce sulphur content, would reduce pollutants but would not reduce the greenhouse gas emission intensity of the plant.
Excluded from further analysis Alternative 3: Power generation using energy sources other than that used in the project activity
This alternative is prevented by the non-availability of other fuels (barrier 3).
Excluded from further analysis
14 Alexander’s Oil & Gas Connections - News & Trends: Middle East, volume 10, issue #18, 28/09/’05 (http://www.gasandoil.com/goc/news/ntm53959.htm)

PROJECT DESIGN DOCUMENT FORM (CDM PDD) - Version 03.1. CDM – Executive Board page 16 Alternative 4: Power generation using HFO i.e. the current practice before the fuel switch
Not prevented by any of identified barriers. Kept for further analysis
Alternative 5: The “proposed project activity undertaken without being registered as a CDM project activity” undertaken at a later point in time
The decision to perform the fuel switch of ATPS was made in 2002, and was implemented in 2003. As demonstrated in section B.4. the fuel price predictions at this time clearly show that HFO was the most economically attractive fuel and that HFO would be the most attractive fuel for the foreseeable future. In Step 3 below it is demonstrated that the implementation of the proposed project without CDM is not economically attractive. The basic economic parameters do not differ substantially over time: -The analysis of the fuel costs for electricity production (US$/MWh) for HFO and NG show that NG is at no time cheaper than HFO in the analysis period (2003-2025) (see Table 1in Annex 8) Consequently there would be no incentive to delay the fuel switch (i.e. implement the proposed project without CDM at a later point of time). -There is no reason to believe that the investment costs to perform the fuels switch at ATPS would decrease over time. Therefore barrier 2 hinders alternative 5 in the same way it prevents alternative 1 .
Hindered by barrier 2. The further analysis of alternative 1 does also exclude alternative 5 as the basic economic parameters do not change over time.
Therefore only Alternative 1 (The proposed project activity undertaken without being registered as a CDM project activity), and Alternative 4 (Power generation using HFO, i.e. the current practice before the fuel switch) remain. These will be further analysed in Step 3, Investment Analysis. STEP 3: Investment analysis According to ACM0011, Step 3, of the “Combined tool to identify the baseline scenario and demonstrate additionality” should be applied to compare the economic attractiveness without revenues from CERs for the remaining alternatives. The economic investment analysis shall use the net present value (NPV) analysis and include the parameters listed in Table B.4.4 below:

PROJECT DESIGN DOCUMENT FORM (CDM PDD) - Version 03.1. CDM – Executive Board page 17
Table B.4.4: Economic parameters
Parameter Unit Value applied (Alternative 1, stay
on HFO)
Source Value applied (Alternative 2, switch to NG)
Source
Investment requirements
US $
0
n/a
Unit 1: 3,215,598 Unit 2: 3,200,107 Unit 3: 3,127,544 Unit 4: 3,141,404 Unit 5: 3,169,940 NG Purif. Plant: 4,966,815 Other Sp. Parts: 693,177 Press. Red. St.: 305,852 P.R.S. Sp. Parts: 8,552 TOTAL: US$ 21,828,990
Cost breakdown of fuel switch at ATPS, CEGCO 09/10/2005 (see Annex 8 for a
detailed cost breakdown)
A discount rate appropriate to the country and sector (use government bond rates, increased by a suitable risk premium to reflect private investment in fuel switching projects, as substantiated by an independent (financial) expert);
%
N/A
N/A
4.5% discount rate 2002 +
3.5% risk premium =
8%
Jordinvest Jordan Capital Markets Day
Report 01/02/’07, Jordan Macro
economic Indicators table, p.16
& http://www.ssiu.gov.jo/Investment/InvestmentStrategy/InvestmentStrategy2/tabid/89/locale
/en-US/Default.aspx Current price and expected future price (variable costs) of each fuel. Estimates of the future prices have to be substantiated by a public and official publication from a governmental body or an intergovernmental institution). If
US
Appendix D of the “Master Plan for the Energy Sector
CEGCO Annual

PROJECT DESIGN DOCUMENT FORM (CDM PDD) - Version 03.1. CDM – Executive Board page 18
such publications are not available, highlight the key logical assumptions and quantitative factors for determining the development of costs of each fuel (e.g. international market price, transport costs, level of taxes/subsidies, local price). State clearly which assumptions and factors have significant uncertainty associated with them, and include these uncertainties in the sensitivity analysis in "Step 3 – investment analysis";
$/MWh
Variable of Jordan”, Interim Report, May 2001, by Transborder and Nexant. Note that an average of the 2 HS HFO price predictions methods is used (as per table B.4.3).
2.15 - 2.4 $/MMBTU = $19.44 – 21.70/MWh
Report 06 p.27
Operating costs for each fuel (especially handling/treatment costs for coal);
US
$/MWh
0
Included in fuel costs/MWh
0
Included in fuel costs/MWh
Lifetime of the project, equal to the remaining lifetime of the existing electricity generation facility;
Years
30
Merz and McLellan Consulting Engineers Aqaba Thermal Power Station Environmental Impact Assessment, Volume 1, Section 6, p.1, October 1995.
30
According to
ACM0011 lifetime of the power plant before
fuel switch is used.
Other operation and maintenance costs, e.g. slag and ash disposal, environmental pollution fees etc.
US $
0
N/A
0
N/A

PROJECT DESIGN DOCUMENT FORM (CDM PDD) - Version 03.1. CDM – Executive Board page 19
Residual value of the new equipment at the end of the lifetime of the project activity
US $
N/A
N/A
0
Assumption (see below)

PROJECT DESIGN DOCUMENT FORM (CDM PDD) - Version 03.1. CDM – Executive Board page 20 Some further assumptions for NPV calculation are explained below: -Residual value of the new equipment at the end of the lifetime of the project activity = 0:
Due to the long term time horizon for the NPV calculations (24 years), it is assumed that the residual value in 2027 is 0. The new equipment is mainly gas pipelines and gas treatment plants. The value of the equipment will only have scrap value which will be minor, but the exact amount is difficult to quantify. Therefore it is assumed to be 0. The impact of the assumption on the outcome of the NPV is negligible. This is demonstrated by sensitivity analysis Nr. 11.below (10% of the total investment was added to the total revenue in the last year of the NPV analysis).
-Expected future prices for NG: Gas price is fixed. In 2006, CEGCO paid $2.15/MMBTU. The price is dependent on a confidential long term
agreement between the governments of Jordan and Egypt. Given the trends on the world market, this price is likely to rise over time. As an increase in prices could not be substantiated by public and official documentation, a fixed price is assumed, taking the lowest gas price CEGCO has paid between 2004 and 2006 (i.e. $2.15/MMBTU). This is conservative as it increases the economic attractiveness of NG.
-Efficiency of each element process for HFO and NG = Included in fuel costs per produced MWh. Due to the fuel switch, the efficiency of ATPS decreased by approximately 3.04%15. For the NPV
calculations fuel costs are included as cost per produced MWh. Efficiency losses are therefore factored into the NPV calculations since efficiency losses mean that more fuel is necessary to produce the same amount of electricity.
Outcome of Step 3: The results of the NPV analysis for Alternative 1 (The proposed project activity undertaken without being registered as a CDM project activity) [called NG scenario], and Alternative 4 (Power generation using HFO, i.e. the current practice before the fuel switch) [called HFO scenario] are shown below:
Net Present Value ($)
Until end of designed lifetime
(01/01/2028)
NG scenario 563,124,122
HFO scenario 737,698,942 The NPV analysis clearly shows that Alternative 1 (the NG scenario) is less economically attractive (i.e. has a lower NPV) compared with Alternative 4 (the HFO scenario). A sensitivity analysis was performed to confirm these results. The table below summarises the parameters that were changed and the impact it has on the relative NPVs of the two scenarios. Sensitivity Analysis (at end of plant lifetime 01/01/2028) Net Present Value ($) with % change compared to standard
15 CEGCO Technical Planning Department Power Plant Directorate Annual Reports 2002 and 2005: Efficiency 2002 37.44% and efficiency 2005 34.40%.

PROJECT DESIGN DOCUMENT FORM (CDM PDD) - Version 03.1. CDM – Executive Board page 21
scenario
1 Investment costs -10%
NG scenario 565,145,325 0.359% HFO scenario 737,698,942 0.000%
2 Investment costs +10%
NG scenario 561,102,920 -0.359% HFO scenario 737,698,942 0.000%
3 Fuel Costs/MWh increase 10% (NG and HFO)
NG scenario 482,905,831 -14.245% HFO scenario 672,916,930 -8.782%
4 Fuel Costs/MWh decrease 10% (NG and HFO)
NG scenario 643,342,414 14.245% HFO scenario 802,480,954 8.782%
5 Fuel Costs/MWh increase 10% (NG only)
NG scenario 482,905,831 -14.245% HFO scenario 737,698,942 0.000%
6 Fuel Costs/MWh decrease 10% (NG only)
NG scenario 643,342,414 14.245% HFO scenario 737,698,942 0.000%
7 Fuel Costs/MWh increase 10% (HFO only)
NG scenario 563,124,122 0.000% HFO scenario 672,916,930 -8.782%
8 Fuel Costs/MWh decrease 10% (HFO only)
NG scenario 563,124,122 0.000% HFO scenario 802,480,954 8.782%

PROJECT DESIGN DOCUMENT FORM (CDM PDD) - Version 03.1. CDM – Executive Board page 22
9 Fuel Cost/MWh decrease 10% NG and increase 10% HFO
NG scenario 643,342,414 14.245% HFO scenario 672,916,930 -8.782%
10 Fuel Cost/MWh increase 10% NG and decrease 10% HFO
NG scenario 482,905,831 -14.245% HFO scenario 802,480,954 8.782%
11 Residual Value 10% of total investment in 2027
NG scenario 563,442,865 0.057%
HFO scenario 737,698,942 0.000% The results of the sensitivity analysis show that the NPV for the NG scenario is always lower than the HFO scenario even at the most favourable scenario for the proposed project activity (scenario 9: decrease of NG fuel costs of 10% and increase of HFO fuel of 10%). The sensitivity analysis is therefore conclusive and confirms the result of the investment comparison analysis. According to ACM0011 version 1 the most economically or financially attractive alternative scenario is considered as baseline scenario. I.e. Alternative 4 (Power generation using HFO, i.e. the current practice before the fuel switch) is the baseline scenario for the proposed CDM project activity. This baseline scenario will be valid for the whole 10-year crediting period for units 3, 4, and 5. For units 1 and 2, it will be valid until 2016, which is the end of their designed lifetime, after which date no more emission reductions will be claimed for these units (see section B.2).

PROJECT DESIGN DOCUMENT FORM (CDM PDD) - Version 03.1. CDM – Executive Board page 23 B.5. Description of how the anthropogenic emissions of GHG by sources are reduced below those that would have occurred in the absence of the registered CDM project activity (assessment and demonstration of additionality): The additionality of the project is assessed according to the latest version of the “Tool for the demonstration and assessment of additionality”, Version 03, approved at EB 29. STEP 1: Identification of alternatives to the project activity consistent with current laws and regulations – please refer to section B.4 where this has already been done. Five alternatives were identified which are all in consistence with mandatory laws and regulations.
STEP 2: Investment Analysis – please refer to section B.4 where the following steps were followed:
• Sub-step 2a. Determine appropriate analysis method. An investment comparison analysis (option II) is used, according to ACM0011 procedure for
baseline selection • Sub-step 2b. Option II. Apply investment comparison analysis.
The financial indicator most suitable for the project is the Net Present Value (NPV), as required by ACM0011
• Sub-step 2c. Calculation and comparison of financial indicators (only applicable to options II and III)
The NPVs (without revenues from CERs) of both alternative scenarios have been calculated, with all the sources and assumptions clearly explained
• Sub-step 2d. Sensitivity Analysis (only applicable to options II and III) A sensitivity analysis has been performed by varying by 10% the key financial parameters of
the project.
As a result of this 4-step investment analysis, it could be demonstrated that Alternative 4 (Power generation using HFO i.e. the current practice before the fuel switch) is the most economic attractive alternative.
STEP 3: Barrier Analysis – please refer to section B.4 where this was done. Three barriers were identified and prevented the implementation of all alternatives except one (alternative 4 – continuation of the current practice). However, in order to illustrate quantitatively the impact of these barriers on the project activity, two alternatives were kept for investment analysis: Alternative 1: The proposed project activity undertaken without being registered as a CDM project
activity Alternative 4: Power generation using HFO at ATPS i.e. the current practice before the fuel switch STEP 4: Common Practice Analysis. Sub-step 4a - Analyze other activities similar to the proposed project activity. As per ACM0011 requirements (step 1a of baseline selection procedure), the relevant geographical area considered for similar activities to the proposed project activity is the Host Country, Jordan. A region within Jordan is not selected because framework conditions are similar throughout the country. Furthermore, Jordan contains the required minimum of ten power generation facilities, none of which are registered under the CDM. The Fuel Switching Project of the Aqaba Thermal Power Station (ATPS) is
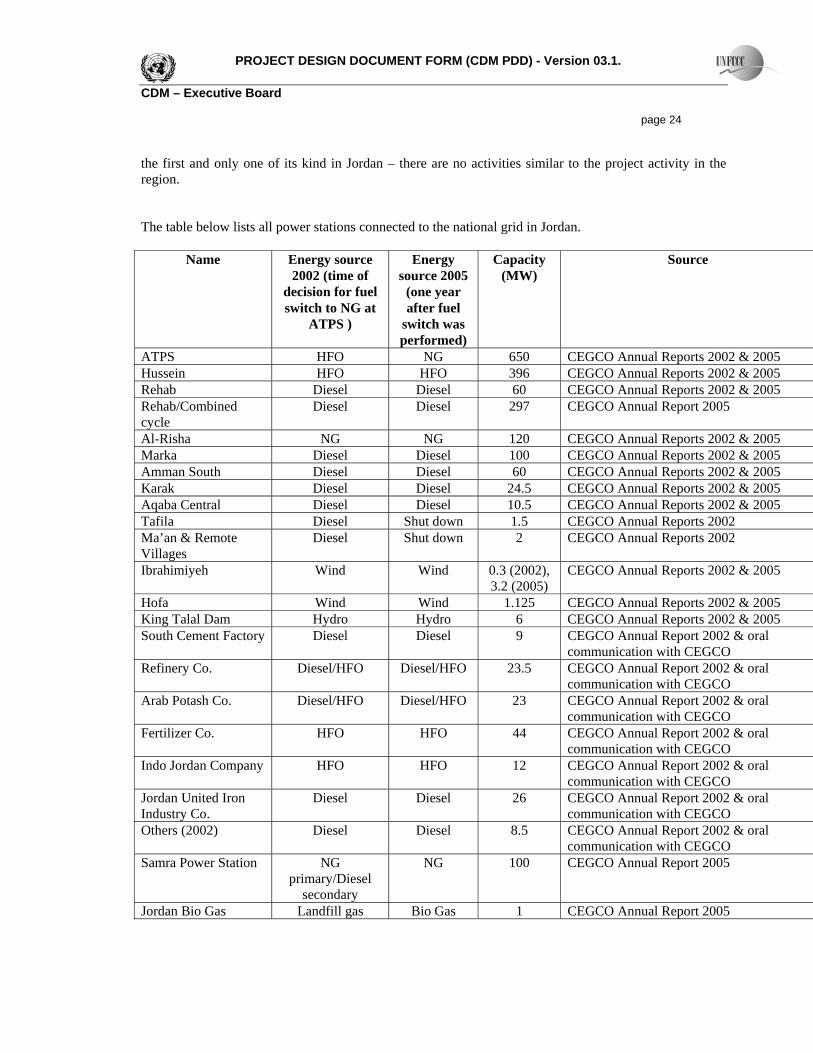
PROJECT DESIGN DOCUMENT FORM (CDM PDD) - Version 03.1. CDM – Executive Board page 24 the first and only one of its kind in Jordan – there are no activities similar to the project activity in the region. The table below lists all power stations connected to the national grid in Jordan.
Name Energy source 2002 (time of
decision for fuel switch to NG at
ATPS )
Energy source 2005
(one year after fuel
switch was performed)
Capacity (MW)
Source
ATPS HFO NG 650 CEGCO Annual Reports 2002 & 2005 Hussein HFO HFO 396 CEGCO Annual Reports 2002 & 2005 Rehab Diesel Diesel 60 CEGCO Annual Reports 2002 & 2005 Rehab/Combined cycle
Diesel Diesel 297
CEGCO Annual Report 2005
Al-Risha NG NG 120 CEGCO Annual Reports 2002 & 2005 Marka Diesel Diesel 100 CEGCO Annual Reports 2002 & 2005 Amman South Diesel Diesel 60 CEGCO Annual Reports 2002 & 2005 Karak Diesel Diesel 24.5 CEGCO Annual Reports 2002 & 2005 Aqaba Central Diesel Diesel 10.5 CEGCO Annual Reports 2002 & 2005 Tafila Diesel Shut down 1.5 CEGCO Annual Reports 2002 Ma’an & Remote Villages
Diesel Shut down 2 CEGCO Annual Reports 2002
Ibrahimiyeh Wind Wind 0.3 (2002), 3.2 (2005)
CEGCO Annual Reports 2002 & 2005
Hofa Wind Wind 1.125 CEGCO Annual Reports 2002 & 2005 King Talal Dam Hydro Hydro 6 CEGCO Annual Reports 2002 & 2005 South Cement Factory Diesel Diesel 9 CEGCO Annual Report 2002 & oral
communication with CEGCO Refinery Co. Diesel/HFO Diesel/HFO 23.5 CEGCO Annual Report 2002 & oral
communication with CEGCO Arab Potash Co. Diesel/HFO Diesel/HFO 23 CEGCO Annual Report 2002 & oral
communication with CEGCO Fertilizer Co. HFO HFO 44 CEGCO Annual Report 2002 & oral
communication with CEGCO Indo Jordan Company HFO HFO 12 CEGCO Annual Report 2002 & oral
communication with CEGCO Jordan United Iron Industry Co.
Diesel Diesel 26 CEGCO Annual Report 2002 & oral communication with CEGCO
Others (2002) Diesel Diesel 8.5 CEGCO Annual Report 2002 & oral communication with CEGCO
Samra Power Station NG primary/Diesel
secondary
NG 100 CEGCO Annual Report 2005
Jordan Bio Gas Landfill gas Bio Gas 1 CEGCO Annual Report 2005

PROJECT DESIGN DOCUMENT FORM (CDM PDD) - Version 03.1. CDM – Executive Board page 25 Company Others (2005) Diesel Diesel 44 CEGCO Annual Report 2005 Sub-step 4b - Discuss any similar options that are occurring. ATPS is the only power station in Jordan which has performed a fuel switch from HFO to NG, which shows that such switch was not common practice in the region in 2002-2005. Even today, with higher oil prices, the second biggest power station in Jordan, the Hussein Thermal Power Station (HTPS), still runs on HFO. Furthermore, only three other power stations run on natural gas in Jordan, including two (the Rehab CCGT and the Samra power stations) that were built after the fuel switch of ATPS. This suggests that:
- even for new plants, oil was the fuel of choice prior to 2002 - even today, natural gas is used almost exclusively in new plants (i.e. built after the change in fuel
prices) In conclusion, no other similar options were and are occurring in the region and the project cannot be considered common practice. CDM consideration The CO2 reduction potential by switching from HFO to NG, and the possible benefits due to CDM, were taken into consideration from the very beginning of the decision-making process for a potential fuel switch at ATPS. The decision making process for the fuel switch and the CDM consideration are as follows:
• 1995: CEGCO reached an agreement with the e7 group to assess and improve the efficiency of the existing ATPS running on HFO, within the E7 Project 82, “an initiative to reduce greenhouse gases”16. When the opportunity arose to perform a fuel switch to improve the air quality of the Aqaba region, e7 assessed the GHG reduction potentials of a fuel switch, and quantified the potential benefits from carbon revenue for CEGCO.
• 2001: CEGCO commissioned a Feasibility Study to assess the financial viability of a possible
fuel switch. The results of this Feasibility Study showed that a fuel switch under current 2001 market conditions was not financially attractive17.
• At the end of 2001, Ontario Power Generation, on behalf of the e7 group, provided a study to CEGCO demonstrating the winning conditions under the CDM for a fuel switch at ATPS18. As a follow up, members of senior management of CECGO attended a closed workshop organised by
16 See http://www.e8.org/upload/File/E7_Project_efficiencyemprovment_Report.pdf (page 2) and http://www.e8.org/index.jsp?numPage=132&numFiche=144#Jordan_AIJ_Project 17 Arthur D. Little: Cost Benefit Analysis of Converting Aqaba Power Plant to Gas, November 2001. 18 Ontario Power Generation: Winning Conditions for Electricity Projects under the Clean Development Mechanism – Recommendations by the e7 (November 2001), and communication between Ontario Power Generation and CEGCO about the CDM potential of a fuel switch at ATPS (27th December, 2001).

PROJECT DESIGN DOCUMENT FORM (CDM PDD) - Version 03.1. CDM – Executive Board page 26
e7 on the CDM in Paris (in December 2001), following a long-term relationship between CECGO and the e7 with the purpose of improving the efficiency of power plants and reducing environmental impacts (including the reduction of GHG emissions).
• As a result, e7 started developing a first draft PDD which was delivered to CEGCO in May 2002.
• January 2002: CEGCO’s management board made the decision to perform the fuel switch at ATPS, and awarded the contract to perform the technical modifications at ATPS to the executing company.
• February 2002: CEGCO informed the Environmental Protection Agency of their intention to perform a fuel switch at ATPS, highlighting not only the potential for the reduction of obvious pollutants (particularly SO2 and H2S emissions), but also the large CO2 reduction potential of the fuel switch.
• Possible benefits from emission reductions due to a fuel switch are also mentioned in the “Master Plan for the Energy Sector of Jordan”, published February 200219.
CEGCO proceeded to include the CDM in the conversion of ATPS from HFO to NG, but the CDM process was delayed until 2007 for several reasons:
• Jordan only ratified the Kyoto Protocol in 2003 • Even after ratification, non Annex I countries under the Kyoto Protocol have to fulfil certain
responsibilities to be able to successfully host CDM projects. Most important is the formal set-up of a Designated National Authority (DNA), which is responsible for assessing the sustainable integrity of CDM projects in the host country. Only the DNA is authorised to issue the host country approval for CDM projects. The Jordanian DNA was established in 2004 as part of the Ministry of Environment. In September 2005, the DNA issued the first provisional approvals for CDM projects in Jordan, including the ATPS fuel switch project20.
• Further delays in the development of the CDM project were a result of the non-availability of an applicable methodology (until EB32), and a lack of internal CDM capacity at CEGCO to develop a new methodology. In June 2007, at EB32, an applicable methodology (ACM0011) was approved by the EB21 and the completion of the final PDD started immediately.
In the conclusion of section B.5, the project has successfully passed all the steps of the “Tool for the demonstration and assessment of additionality” and is therefore additional.
19 Transborder and Nexant: Master Plan for the Energy Sector of Jordan, Executive Summary, February 2002, p.10 20 Letter from Ministry of Environment to Minister of Planning regarding the approval of several projects as CDM, 13/09/2005, Amman, Jordan. 21 See EB 32, Annex 5: http://cdm.unfccc.int/EB/032/eb32_repan05.pdf. 22 June 07

PROJECT DESIGN DOCUMENT FORM (CDM PDD) - Version 03.1. CDM – Executive Board page 27 B.6 Emission reductions
B.6.1. Explanation of methodological choices: According to the ACM0011 Baseline emissions, Project Emissions and Leakage are calculated as follows: Baseline emissions are calculated as:
BLelecBL,yy EFELBE ,⋅= (1) BEelec,y Baseline emissions due to the generation of electricity supplied to electricity grid in year
y of the crediting period (tCO2). EL,BL,y Electricity supplied to the electricity grid in year y of the crediting period, not exceeding
the supply in absence of the project activity (MWh). EFelec,BL Emission factor for the baseline source of electricity supplied to the captive
consumer/electricity (tCO2/MWh).
⎩⎨⎧
≥=
hisyPRhis
hisyPRyPRBL,y ELELifEL
ELELifELEL
,
,, < (2)
ELPR,y Total electricity supplied to the electricity grid by PAPP in the project case
in year y of the crediting period (MWh). ELhis The maximum historic annual amount of electricity over three most recent years prior to
implementation of project activity
BLBLFF
BLFFNCV
EFBLelec
EF η∗⋅⋅=,
,1000
6.31244
, (3)
EFFF,BL CO2 emission factor for the petroleum fuel used in the PAPP prior to implementation of
the project activity (tC/t). NCVFF,BL Net calorific value of fossil fuel used in the PAPP prior to implementation of the project
activity (TJ/t). ηBL Efficiency of the PAPP prior to implementation of the project activity. The baseline fuel is determined to be HFO, as Diesel was only used for maintenance/cleaning but not for regular electricity production22. 22 See: In 2002 only 909.5 cubic meters of Diesel was used at ATPS, compared to over 1 million tonnes of HFO (see Annual Report 2002 p.23)

PROJECT DESIGN DOCUMENT FORM (CDM PDD) - Version 03.1. CDM – Executive Board page 28 The energy efficiency (ηBL) was measured by the project participant during operation. To set the baseline emission level, the 2002 figure was used. Efficiency was measured for all 5 units separately and for the whole plant in total. According to ACM0011, ηBL shall be fixed throughout the crediting period. Project emissions are calculated as follows:
yauxyNGy PEPEPE ,, += (4) PENG,y Emissions due to the combustion of NG for the production of electricity in year y of the
crediting period (in tCO2). PEaux, y Emission due to the use of energy (not NG or electricity) in year y of the crediting period (in
tCO2). Emissions due to the combustion of natural gas for the production of electricity are calculated as:
yNGyyNG EFNGPE ,1244
, ⋅⋅= NGy Total amount of NG used in the project power plant in year y of the crediting period (in t). EFNG,y CO2 emission factor of natural gas (tC/t). Small amounts of other fossil fuels (ATPS may use small amounts of HFO and Diesel) and/or grid electricity may be used in the project activity to serve auxiliary and back-up loads
( )∑ ⋅+⋅⋅=i
yelecygridauxiyiauxyaux EFELEFFFPE ,,,,,1244
, (6)
FFaux,i,y Total amount of fossil fuel i used in the project power plant to serve auxiliary and back-up
loads in year y of the crediting period (mass or volume units). EFi CO2 emission factor of fossil fuel i (tC/mass or volume unit) ELaux, grid,y Electricity used in the project power plant to serve auxiliary and back-loads that is obtained
from the grid, in any year y (MWh). EFelec,y A conservative default value of 1.3 tCO2/MWh is used. Leakage: Leakage may result from fuel extraction, processing, transportation and distribution of NG outside the project boundary (there is no liquefaction/re-gasification step as the natural gas comes directly from the field in gaseous form). According to ACM0011, the following leakage emission sources shall be considered:
• Fugitive CH4 emissions associated with fuel extraction, processing, transportation and distribution of NG used in the project plant, and fossil fuels used in the grid in the absence of the project activity.

PROJECT DESIGN DOCUMENT FORM (CDM PDD) - Version 03.1. CDM – Executive Board page 29
• No LNG is used in the project power plant. Thus, leakage emissions are calculated as follows: LEy = LECH4, y (7) LEy Leakage emission during the year y (tCO2). LECH4,y Leakage emissions due to fugitive upstream CH4 emissions in the year y (tCO2). Gas is supplied directly from Egypt to Jordan by pipeline. Therefore no Annex I countries are involved. For the purpose of determining fugitive methane emissions associated with the production, transportation and distribution of the fuels, the quantity of natural gas consumed in the project power plant should be multiplied by a methane emission factor for these upstream emissions, and subtract for all fuel types i which would be used in the absence of the project activity, the fuel quantities multiplied with respective methane emission factors, as follows:
[ ] 44,,,4,,,,4,
CHCHupstreamFFyFFEL
CHupstreamNGyNGyyCH GWPEFNCVEFNCVNGLEBL
yBL ⋅⋅−⋅⋅= η (8) LCH4,y Leakage emissions due to upstream fugitive CH4 emissions in the year y (tCO2). NGy Total amount of NG used in the PAPP in year y of the crediting period (t) NCVNG,y Net calorific value of NG, referred to under the same physical conditions (pressure and
temperature) as NGy (TJ/t). EFNG,upstream,CH4 Emission factor for upstream fugitive methane emissions from production, transportation and
distribution of NG (tCH4/TJ). ELelec,BL,y Electricity supplied to the electricity grid in year y of the crediting period, up to the level of
baseline supply (MWh). ηBL,y Efficiency of the power plant in the baseline, as function of the load factor of the PAPP
in year y of the crediting period. NCVi,y Net calorific value of fossil fuel I (TJ/t). EFi,upstream, CH4 Emission factor for upstream fugitive methane, valid for the relevant commitment period GWPCH4 Global warming potential of methane valid for the relevant commitment period. As no reliable and accurate national data on fugitive CH4 emissions23 (associated with the production, transportation, and distribution of the fuels is available) is available, the default values provided in table 2 of ACM0011 version 1 are used. As the gas production, processing, and transmission system is of recent vintage, and built and operated to international standards, the US/Canada default value (160 tCH4/PJ) is used. The fuel that would be used in absence of the project activity is HFO and the emission factor of fugitive CH4 upstream emissions from oil (4.1 tCH4/PJ) will be used. Emission reductions are therefore calculated as follows:
23 In particular, Jordan first and last communication to UNFCCC from 1997 did not include any information on pipelines as there were none at this time.

PROJECT DESIGN DOCUMENT FORM (CDM PDD) - Version 03.1. CDM – Executive Board page 30 ERy = BEy - PEy - LEy (10) ERy Emission reduction during the year y (tCO2/yr) BEy Baseline emission during the year y (tCO2/yr) PEy Project emission during the year y (tCO2/yr) LEy Leakage emission during the year y (tCO2/yr)
B.6.2. Data and parameters that are available at validation: Data / Parameter: ELhis Data unit: MWh
Description: Electricity supplied to the electricity grid in the absence of the project activity.
Source of data used: Electricity meters at the project site.
Value applied: 4,695,800 Justification of the choice of data or description of measurement methods and procedures actually applied:
Electricity meters at the project site.
Year 2000 2001 2002
ATPS (GWh sold)
3,933.2
4,022.6
4,695.8
CECGO Annual Report 2005, p. 20
Any comment: Defined as the maximum historic annual electricity supplied to the grid over the three most recent years prior to implementation of project activity.
Data / Parameter: ηBL
Data unit: % Description: Efficiency of the PAPP prior to the implementation of the project activity.
Source of data used: Based on option I as specified in ACM0011:
(i) Measurement of efficiency of the PAPP; Value applied: 37.44 Justification of the choice of data or description of measurement methods and procedures actually applied:
The energy efficiency (ηBL) was measured by the project participant during operation. To determine the baseline emission level, 2002 measurements are used. The efficiency was measured for all 5 units separately, and for the whole plant in total. The values for the whole plant are used to establish the baseline efficiency.
Any comment: Source: Report # PE1R04_RP01, CEGCO Technical Planning Department, Annual Report 2002, Power Plant Directorate.

PROJECT DESIGN DOCUMENT FORM (CDM PDD) - Version 03.1. CDM – Executive Board page 31 Data / Parameter: EFHFO,BL Data unit: tC/t
Description: CO2 emission factor of the HFO used in the PAPP prior to the implementation
of the project activity.
Source of data used: As option a) (values provided by the fuel supplier in invoices) is not available, option d) as outlined in ACM0011 is used: IPCC default values at the upper limit of the uncertainty at a 95% confidence interval as provided in table 1.4 of Chapter 1 of IPCC 2006 Guidelines on National GHG Inventories
Value applied: 0.865
Justification of the choice of data, or description of measurement methods and procedures actually applied:
EF in tC/t is calculated with the help of the IPCC default values: NCV HFO (parameter not monitored in GJ/t ) * CO2 emission factor (IPCC default values at the upper limit of the uncertainty at a 95% confidence interval as provided in table 1.4 of Chapter 1 of IPCC 2006 Guidelines on National GHG Inventories) / (44/12)
Any comment: See calculation spread sheet for detailed calculations Data / Parameter: NCVHFO, BL
Data unit: GJ/t
Description: Net calorific value of HFO used in the PAPP prior to implementation of the
project activity.
Source of data used: As option a) (values provided by the fuel supplier in invoices) is not available, option b) as outlined in ACM0011 is used: Measurements by the project participant.
Value applied: 0.040 Justification of the choice of data or description of measurement methods and procedures actually applied:
Measurements are undertaken in line with international standard ASTMD-2382 A full year (2002) of monthly data analysis is used to calculate the average value. The samples were taken from the HFO storage tanks at ATPS.
Any comment: For the above value , 12 consecutive monthly HFO Lab Analysis reports from 2002, from CEGCO’s ATPS Chemical Laboratory, were used.
Data / Parameter: EFHFO,upstream,CH4 Data unit: tCH4/TJ Description: Emission factor for upstream fugitive methane emissions from production of the

PROJECT DESIGN DOCUMENT FORM (CDM PDD) - Version 03.1. CDM – Executive Board page 32
HFO used in PAPP prior to project implementation. Source of data used: As no reliable and accurate national data on fugitive CH4 emissions associated
with the production is available, default value as provided in Table 2 of ACM0011 is used
Value applied: 4.1 Justification of the choice of data, or description of measurement methods and procedures actually applied :
According to ACM0011.
Any comment: Data / Parameter: EFNG,upstream,CH4
Data unit: tCH4/TJ
Description: Emission factor for upstream fugitive methane emissions from production,
transportation and distribution of NG.
Source of data used: As no reliable and accurate national data on fugitive CH4 emissions associated with the production is available, the default value as provided in Table 2 of ACM0011 is used
Value applied: 160 Justification of the choice of data, or description of measurement methods and procedures actually applied :
As the gas production, processing and transmission system is of recent vintage and built and operated to international standards the US/Canada default values are used.
Any comment: See: AL FAJR pipeline documentation Data / Parameter: GWPCH4
Data unit: tCO2e/tCH4 Description: Global warming potential of methane valid for the relevant commitment period.
Source of data used: IPCC Value applied: 21 (for the first commitment period of the Kyoto protocol). Justification of the choice of data or description of measurement methods and procedures actually
According to ACM0011.

PROJECT DESIGN DOCUMENT FORM (CDM PDD) - Version 03.1. CDM – Executive Board page 33 applied: Any comment:
B.6.3 Ex-ante calculation of emission reductions:
ERy = BEy - PEy - LEy (10) ERy Emission reduction during the year y (tCO2/yr) BEy Baseline emission during the year y (tCO2/yr) PEy Project emission during the year y (tCO2/yr) LEy Leakage emission during the year y (tCO2/yr) Therefore: Baseline Emissions (tCO2/yr) 3,557,972 Project Emissions (tCO2/yr) 3,048,320 Leakage Emissions (tCO2/yr) 124,852 Emission Reductions (tCO2/yr) =384,799 In the last two years (2016 and 2017), emission reductions are not claimed for units 1 and 2 because they will have reached the end of their lifetime.

PROJECT DESIGN DOCUMENT FORM (CDM PDD) - Version 03.1. CDM – Executive Board page 34
B.6.4 Summary of the ex-ante estimation of emission reductions:
Year Estimation of project
activity emissions (tonnes of CO2
equivalent, tCO2e)
Estimation of baseline emissions
(tCO2e)
Estimation of leakage (tCO2e)
Estimation of overall emission
reductions (tCO2e)
2008 3,048,320 3,557,972 124,852 384,799 2009 3,048,320 3,557,972 124,852 384,799 2010 3,048,320 3,557,972 124,852 384,799 2011 3,048,320 3,557,972 124,852 384,799 2012 3,048,320 3,557,972 124,852 384,799 2013 3,048,320 3,557,972 124,852 384,799 2014 3,048,320 3,557,972 124,852 384,799 2015 3,048,320 3,557,972 124,852 384,799 2016 1,828,992 2,134,783 74,911 230,880 2017 1,828,992 2,134,783 74,911 230,880
Total (tCO2e) 28,044,548 32,733,338 1,148,636 3,540,154
B.7 Application of the monitoring methodology and description of the monitoring plan: B.7.1. Data and parameters monitored: Data / Parameter: Installed capacity24 Data unit: MW Description: Installed capacity
Source of data to be used:
Project site
Value of data applied for the purpose of calculating expected emission reductions in section B.5
650
Description of measurement methods and procedures to be
The installed capacity of the power plant before and after the fuel switch activity is tested using internationally approved standard methods available with the help of reputed players or manufacturers in the market. The test report before fuel switch will be submitted to the validating DOE and the annual test
24 This table has been adapted to cover installed capacity only, following guidance from the Methodology Panel on request for clarification AM_CLA_0058 (see Annex 7)
PROJECT DESIGN DOCUMENT FORM (CDM PDD) - Version 03.1. CDM – Executive Board page 35 applied: reports after the fuel switch to the verifying DOE. Changes must remain within
+/-5% of the capacity before the implementation of the project activity, as per the applicability conditions.
QA/QC procedures to be applied:
-
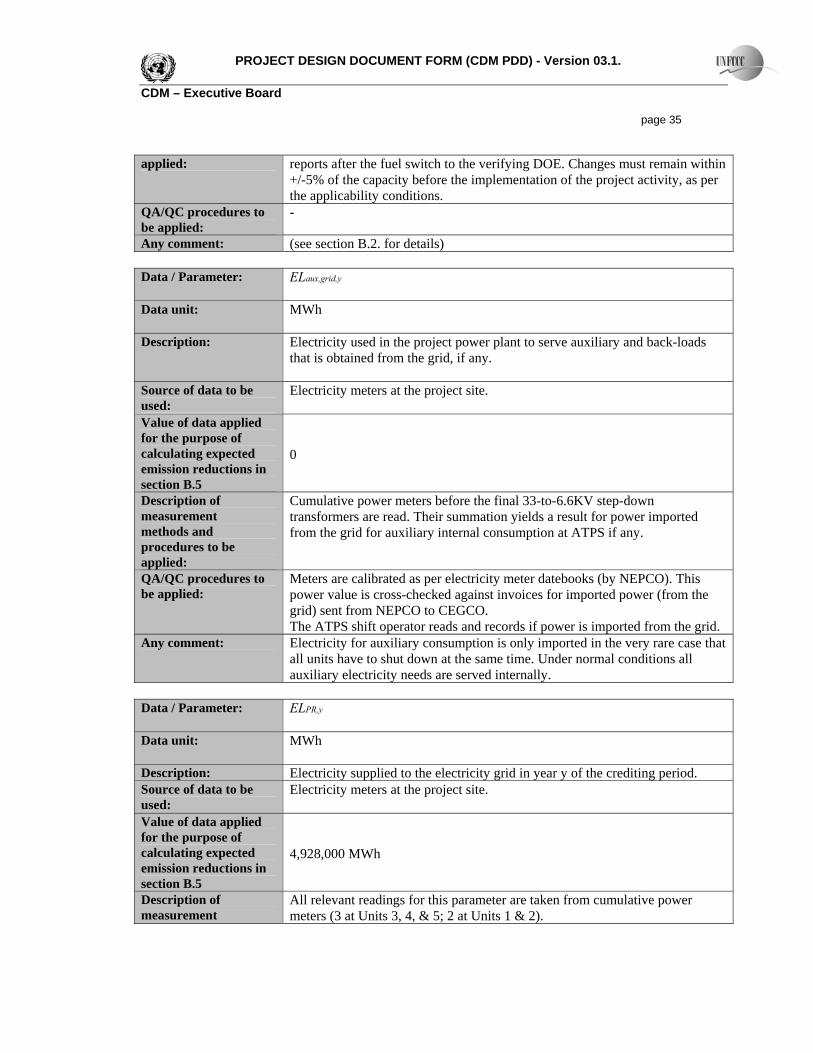
Any comment: (see section B.2. for details) Data / Parameter: ELaux,grid,y
Data unit: MWh
Description: Electricity used in the project power plant to serve auxiliary and back-loads
that is obtained from the grid, if any.
Source of data to be used:
Electricity meters at the project site.
Value of data applied for the purpose of calculating expected emission reductions in section B.5
0
Description of measurement methods and procedures to be applied:
Cumulative power meters before the final 33-to-6.6KV step-down transformers are read. Their summation yields a result for power imported from the grid for auxiliary internal consumption at ATPS if any.
QA/QC procedures to be applied:
Meters are calibrated as per electricity meter datebooks (by NEPCO). This power value is cross-checked against invoices for imported power (from the grid) sent from NEPCO to CEGCO. The ATPS shift operator reads and records if power is imported from the grid.
Any comment: Electricity for auxiliary consumption is only imported in the very rare case that all units have to shut down at the same time. Under normal conditions all auxiliary electricity needs are served internally.
Data / Parameter: ELPR,y
Data unit: MWh
Description: Electricity supplied to the electricity grid in year y of the crediting period. Source of data to be used:
Electricity meters at the project site.
Value of data applied for the purpose of calculating expected emission reductions in section B.5
4,928,000 MWh
Description of measurement
All relevant readings for this parameter are taken from cumulative power meters (3 at Units 3, 4, & 5; 2 at Units 1 & 2).

PROJECT DESIGN DOCUMENT FORM (CDM PDD) - Version 03.1. CDM – Executive Board page 36 methods and procedures to be applied:
(over the lifetime of ATPS meters may be changed or replaced by other types of meters or the metering methods may change)
QA/QC procedures to be applied:
Meters are calibrated as per individual meter handbooks. The shift operator reads and records the power generated and exported from ATPS daily. Additionally, each month a CEGCO/NEPCO 3rd party reading by Acomette Company is taken.
Any comment: The above value used for estimation is taken from CEGCO’s 2005 Annual Report, Table 4, p.20, and is the value for sold electrical energy from ATPS in 2005. See Annex 4, Documents 1 & 3.
Data / Parameter: FFaux,diesel,y
Data unit: litre
Description: Total amount of diesel i used in the project power plant to serve auxiliary and
back-up loads in year y of the crediting period.
Source of data to be used:
ATPS Monthly Fuel Reports.
Value of data applied for the purpose of calculating expected emission reductions in section B.5
16,800
Description of measurement methods and procedures to be applied:
The Monthly Diesel Fuel Reports keep track of the 2 diesel holding tanks’ contents, that is how much diesel was used for individual boiler start-up (via diesel meter readings from the boilers), and how much was delivered to the plant’s gas station. Additionally, diesel used at the individual boilers is measured at each boiler via 2 meters, an ignitor diesel meter, and a burner diesel level meter.
QA/QC procedures to be applied:
These values can be cross checked against monthly diesel purchase invoices for accuracy.
Any comment: The above amount used for estimation is taken from the 2005 CEGCO Annual Report, Table 5, p.21. Diesel at ATPS is used for several purposes. These include the plant’s gas station (for plant vehicles), fire-extinguisher pumps, as a solvent/cleaner for parts, for emergency back-up power generation (inside the facility only), and for boiler cold start-up.
Data / Parameter: FFaux, HFO, y
Data unit: Tons
Description: Total amount of HFO i used in the project power plant to serve auxiliary and

PROJECT DESIGN DOCUMENT FORM (CDM PDD) - Version 03.1. CDM – Executive Board page 37
back-up loads in year y of the crediting period.
Source of data to be used:
The quantity of HFO used is measured directly before each individual boiler, then cross-checked against the levels in the 2 HFO storage tanks. It is further cross-checked against HFO invoices (in the event of a discrepancy).
Value of data applied for the purpose of calculating expected emission reductions in section B.5
33,621
Description of measurement methods and procedures to be applied:
Post fuel switch, very little, if any HFO is used. ATPS’s HFO (for power generation and back-up) is stored in 2 large storage tanks, each having 37,000 ton capacity. HFO Stage 1 tank supplies Units 1 & 2 (when necessary), whereas HFO Stage 2 tank supplies Units 3, 4, & 5 (when necessary). The quantity of HFO (for auxiliary and back-up) used is determined by referencing the in-line flowmeters’ integrator installed at each boiler daily, and cross-checking this with level meters at each of the 2 storage tanks. As a third check, these values may be compared with monthly HFO invoices. At the end of each month Acomette Company (a 3rd party) tallies the values. (over the lifetime of ATPS meters may be changed or replaced by other types of meters or the metering methods may change)
QA/QC procedures to be applied:
These meters are calibrated in-house by accredited technicians to international standards, as per individual meter instructions.
Any comment: The above value used for estimation purposes is taken from the 2005 CEGCO Annual Report, Table 5, p.21.
Data / Parameter: EFelec, y
Data unit: tCO2/MWh
Description: Emission factor for the grid in year y
Source of data to be used:
A conservative default value of 1.3 tCO2/MWh is used according to ACM0011.
Value of data applied for the purpose of calculating expected emission reductions in section B.5
1.3
Description of measurement methods and procedures to be applied:
Not applicable
QA/QC procedures to

PROJECT DESIGN DOCUMENT FORM (CDM PDD) - Version 03.1. CDM – Executive Board page 38 be applied:
Not applicable
Any comment: Data / Parameter: EFNG,y
Data unit: tC/m3
Description: CO2 emission factor of the NG used in the PAPP in year y
Source of data to be used:
The Methodology gives 4 options for source of this value. The first option “e)” cannot be used because the NG invoices do not include an EF value. Therefore, option, “h)” as outlined in ACM0011 is used: IPCC default values at the upper limit of the uncertainty at a 95% confidence interval as provided in table 1.4 of Chapter 1 of IPCC 2006 Guidelines on National GHG Inventories
Value of data applied for the purpose of calculating expected emission reductions in section B.5
0.000629
Description of measurement methods and procedures to be applied:
EF in tC/t is calculated with the help of the IPCC default values: NCV NG (parameter monitored in GJ/t ) * CO2 emission factor (IPCC default values at the upper limit of the uncertainty at a 95% confidence interval as provided in table 1.4 of Chapter 1 of IPCC 2006 Guidelines on National GHG Inventories) / (44/12)
QA/QC procedures to be applied:
IPCC default values at a 95% confidence interval
Any comment: See calculation spread sheet for detailed calculations Data / Parameter: EFdiesel,y
Data unit: TC/tdiesel
Description: CO2 emission factor of diesel used in the PAPP to serve auxiliary and back-up
loads in year y.
Source of data to be used:
The Methodology gives 4 options for source of this value. The first option “e)” cannot be used because the NG invoices do not include an EF value. Therefore, option, “h)” as outlined in ACM0011 is used: IPCC default values at the upper limit of the uncertainty at a 95% confidence interval as provided in table 1.4 of Chapter 1 of IPCC 2006 Guidelines on National GHG Inventories
Value of data applied for the purpose of

PROJECT DESIGN DOCUMENT FORM (CDM PDD) - Version 03.1. CDM – Executive Board page 39 calculating expected emission reductions in section B.5
0.865
Description of measurement methods and procedures to be applied:
EF in tC/t is calculated with the help of the IPCC default values: NCV NG (parameter monitored in GJ/t ) * CO2 emission factor (IPCC default values at the upper limit of the uncertainty at a 95% confidence interval as provided in table 1.4 of Chapter 1 of IPCC 2006 Guidelines on National GHG Inventories) / (44/12)
QA/QC procedures to be applied:
IPCC default values at a 95% confidence interval
Any comment: See calculation spread sheet for detailed calculations
Data / Parameter: EFHFO,y
Data unit: tC/tHFO
Description: CO2 emission factor of HFO used in the PAPP to
serve auxiliary and back-up loads in year y.
Source of data to be used:
The Methodology gives 4 options for source of this value. The first option “e)” cannot be used because the NG invoices do not include an EF value. Therefore, option, “h)” as outlined in ACM0011 is used: IPCC default values at the upper limit of the uncertainty at a 95% confidence interval as provided in table 1.4 of Chapter 1 of IPCC 2006 Guidelines on National GHG Inventories
Value of data applied for the purpose of calculating expected emission reductions in section B.5
0.865
Description of measurement methods and procedures to be applied:
EF in tC/t is calculated with the help of the IPCC default values: NCV NG (parameter monitored in GJ/t ) * CO2 emission factor (IPCC default values at the upper limit of the uncertainty at a 95% confidence interval as provided in table 1.4 of Chapter 1 of IPCC 2006 Guidelines on National GHG Inventories) / (44/12)
QA/QC procedures to be applied:
IPCC default values at a 95% confidence interval
Any comment: See calculation spread sheet for detailed calculations Data / Parameter: NCVNG,y
Data unit: GJ/m3
Description: Weighted average of net calorific value of Natural Gas in year y
Source of data to be used:
The Methodology gives 4 options for source of this value.. The first source (called “e)” (sic)) (Provided by supplier), is used.

PROJECT DESIGN DOCUMENT FORM (CDM PDD) - Version 03.1. CDM – Executive Board page 40 Value of data applied for the purpose of calculating expected emission reductions in section B.5
3.9584*10-2
Description of measurement methods and procedures to be applied:
The net calorific value is provided by Fajir in BTU/SCF. This value is converted directly in GJ/m3. A gas analysis is done automatically by a gas chromatograph owned by Al Fajr. For cross checking a low pressure impulse gas line is extended from the Al Fajr’s ultrasonic flow meter to ATPS’s own Gas Chromatograph. The gas flow measurement is done as described for parameter NGy below. (Over the lifetime of ATPS the installed equipment may be exchanged or replaced which may affect the metering method)
QA/QC procedures to be applied:
Meters and analysers are calibrated as per their individual handbooks to international standards.
Any comment: Source for estimated value: Gas delivery report from Fajr, average value September 07
Data / Parameter: NGy
Data unit: m3
Description: Total amount of NG used in the project power plant in year y of the crediting period. The flow is measured continuously by the Al Fajr’s ultrasonic flow meter in Standard Cubic Meters (SCM). The gas quantity delivered by Al Fajr to ATPS is recorded daily (Over the lifetime of ATPS the installed equipment may be exchanged or replaced which may affect the metering method. )
Source of data to be used:
Data logs at the project site from ultrasonic on-line flow meter.
Value of data applied for the purpose of calculating expected emission reductions in section B.5
932,054 t
Description of measurement methods and procedures to be applied:
NGy is the sum of daily report values of the NG used in the plant, for a year. A monthly summary report is provided to CEGCO by Al Fajr. The daily values are read from the ultrasonic flow meter by 2 personnel (1 representative of Al Fajr Company pipeline company, the NG provider, and 1 representative from CEGCO). The above value (NG2005) is used for estimation purposes of future emission reductions.
QA/QC procedures to be applied:
Meters and analysers are calibrated as per their individual handbooks to international standards.
Any comment: Source for estimated value: CEGCO Annual Report 2005, table p.21.

PROJECT DESIGN DOCUMENT FORM (CDM PDD) - Version 03.1. CDM – Executive Board page 41
B.7.2 Description of the monitoring plan: The monitoring plan gives the actions necessary to record all the variables and factors required by methodology ACM0011, Version 01, 22/07/2007. No monitoring is required for the grid emission factor (EFelec. y) calculation according to ACM0011, since the default value is used. The plan is based on detailed information contained in section B.7.1 above. Most of the monitoring requirements of the methodology are in line with the kind of information routinely collected by CEGCO at ATPS, so internalising the procedures is straightforward. CEGCO’s Management will ensure that quality procedures are in place. Data will either be archived electronically or transcribed to data logbooks manually, and backed-up or checked regularly. This data will be kept for the full crediting period, plus two years following the end of the crediting period, or the last issuance of CERs for this project activity (whichever occurs later). Project staff will be trained to satisfy their monitoring obligations before the start of the crediting period. The authority and responsibility for project management, monitoring, measurement and reporting will be agreed on between the project participants. Detailed procedures for calibration and maintenance of monitoring equipment and installations, and for record handling will be established (particularly if not included in the meter manuals). Specific procedures for CDM monitoring, GHG internal auditing, and reporting will be agreed on between CEGCO and EcoSecurities, and incorporated into the existing Quality Assurance system. The table below indicates the primary responsibilities of the persons involved in the monitoring:
Task CEGCO
EcoSecurities
On-site Technicians Laboratory QC
Manager CDM Programme
Manager Management

PROJECT DESIGN DOCUMENT FORM (CDM PDD) - Version 03.1. CDM – Executive Board page 42
Collect data and send samples to
lab E R I
Perform lab analyses E R I
Enter data into spreadsheet I E R
Prepare monitoring report R I E
Archive data & reports I E R
Calibration & Maintenance E R I
E = responsible for executing data collection R = responsible for overseeing and assuring quality I = to be informed B.8 Date of completion of the application of the baseline study and monitoring methodology and the name of the responsible person(s)/entity(ies) The baseline study and the monitoring methodology were concluded on 24/10/2007. The entity determining the baseline study and the monitoring methodology, and participating in the project as the Carbon Advisor is EcoSecurities, with Contacts: [email protected] or [email protected] SECTION C. Duration of the project activity / crediting period C.1 Duration of the project activity: C.1.1. Starting date of the project activity: 1/1/2002 (decision for fuel switch)

PROJECT DESIGN DOCUMENT FORM (CDM PDD) - Version 03.1. CDM – Executive Board page 43 C.1.2. Expected operational lifetime of the project activity: 21 years (see table with the design lifetime in section B.2: the last units should reach end of their lifetime in 2028) C.2 Choice of the crediting period and related information: C.2.1. Renewable crediting period C.2.1.1. Starting date of the first crediting period: ‘Not applicable’ C.2.1.2. Length of the first crediting period: ‘Not applicable’ C.2.2. Fixed crediting period: C.2.2.1. Starting date: 1/1/2008 or date of registration, whichever is later C.2.2.2. Length: 10 years
PROJECT DESIGN DOCUMENT FORM (CDM PDD) - Version 03.1. CDM – Executive Board page 44 SECTION D. Environmental impacts D.1. Documentation on the analysis of the environmental impacts, including transboundary impacts: The only negative environmental impact resulting from the Project is as a result of the construction of the NG supply pipeline from Egypt. This Arabian Gas Pipeline has been constructed, maintained, and operated to the highest American/Canadian standards and consequently has little/no negative environmental impact, both visually and in practice. Furthermore the pipeline is part of a network and is not built purely for providing NG to ATPS. Any impacts of the gas pipeline are therefore not a direct result of the fuel switch at ATPS. On the other hand, the environmental benefits gained are substantial and are relisted here:
• Reduced CO2, SO2, NOx emissions, and suspended particulate matter with associated aromas; • Reduced “rotten egg” aroma from H2S, since high sulphur content HFO is substituted by NG; • Smokestack output is no longer coloured, but transparent – no more visual pollution; • Reduced shipping/trucking of HFO, with reduced related traffic and pollution; • GHG reductions and diversification of Jordan’s electricity production with a leaning towards
“cleaner” power.
In summary:
Visual differences: Since the project involved predominantly internal boiler modifications, in addition to the fuel delivery and control systems, there are no noticeable differences at or near the plant except for the positive effects of reduced trucking and shipping of HFO, and the relative elimination of smokestack plumes.
Noise: There will be a marked reduction in noise at or near the site associated with reduced trucking of
HFO. The impacts are likely to be substantial given the quantity of HFO previously consumed. Air Quality: Following the fuel switch to NG, there are marked improvements in the air quality
surrounding ATPS. This is a result of reductions of, SO2, NOx, H2S, suspended particulate matter and the associated aromas of all these. H2S has a particularly pungent “rotten egg” aroma which was a result of the high sulphur content of the HFO previously used. Furthermore, under NG conditions, smokestack output is no longer coloured, but transparent. On a secondary level, the NG fuel delivery system by pipeline from Egypt has resulted in a drastic reduction of pollution from the HFO delivery vehicles previously necessary.
Safety: The practical safety-related ramifications of the fuel switch to NG are minor, the most noteworthy of which result from the gross reductions in trucking. As with any pressurised gas delivery system, safety is a priority. Given that the fuel switch is of recent vintage, safety measures and precautions are well in place. Furthermore, given that HFO is only used as a back-up fuel, the hazardous preheating technology necessitated by HFO’s high viscosity is also avoided.

PROJECT DESIGN DOCUMENT FORM (CDM PDD) - Version 03.1. CDM – Executive Board page 45 D.2. If environmental impacts are considered significant by the project participants or the host Party, please provide conclusions and all references to support documentation of an environmental impact assessment undertaken in accordance with the procedures as required by the host Party: Because of the nature of the relatively “minor” modifications required for the fuel switch project, and given that an Environmental Impact Assessment was performed for the addition of Units 3 & 4 in 199525, Jordanian authorities did not require an EIA for the fuel switch project. Along with mitigation controls that were planned as part of the project design, construction and operation, and the contribution made to sustainable development at the local and national scale, the project is expected to have an overall positive impact on the local and global environment. All negative environmental impacts are subject to mitigation measures as described above. An EIA was performed regarding the transmission of NG from the Aqaba shoreline to the plant26 SECTION E. Stakeholders’ comments E.1. Brief description how comments by local stakeholders have been invited and compiled: The stakeholder consultation for the Fuel Switching Project of the Aqaba Thermal Power Station is comprised of 2 parts:
1. The solicitation of stakeholder concerns and comments by advertising in a widely circulated Jordanian daily newspaper (called “Al Ghad”, meaning “tomorrow”) on 04/09/2007; and
2. The circulation by e-mail or fax of a similar letter to key Jordanian stakeholders, also on 04/09/2007.
The former was published in Arabic on the prominent third page of the newspaper whereas the latter was sent in English by e-mail or fax (receipts are available). Both documents summarised the project basic technical issues with a CDM perspective; they included:
o A brief description of the project o Climate change and how this project is mitigating climate change through the Clean Development
Mechanism of the Kyoto Protocol o Review of the country’s climate change and CDM activities by Host Country’s DNA o Presentation of technical details of the Project o Analysis of the CDM Project and carbon benefits
All stakeholders were invited to send comments and concerns by 19/09/2007 to EcoSecurities, JCCCC (EcoSecurities’ Jordanian partner), and to cc CEGCO. Participants to the consultation included:
o Local authority representatives o Local community associations o Non Governmental Organisations
25 Merz & McLellan Aqaba Thermal Power Station Stage II Uniots 3 and 4 Environmental Impact assessment, October 1995. 26 See Document 9.1 in Annex 9: Royal Scientific Society Summary of Phase 1 EIA

PROJECT DESIGN DOCUMENT FORM (CDM PDD) - Version 03.1. CDM – Executive Board page 46
o Academics o Government officials o Project staff and management, national o Environmental authorities o Industry association representatives
All participants were catalogued appropriately – see Annex 5.. Included in Annex 5 are:
• Scan of the Arabic “Al Ghad” newspaper stakeholder solicitation advertisement from 05/09/2007; • An English translation of the above; • A template of the English letter sent (via e-mail or fax) to key Jordanian stakeholders;
A table detailing the key stakeholder details (names, positions, entities, e-mail addresses or fax numbers) to which letters were sent is made available to the validating DOE. E.2. Summary of the comments received: 2 comments were received and addressed (one within the comment deadline of 19/09/2007, and one past the comment deadline). Both were addressed to the satisfaction of the enquirers, as documented below: Comment #1 (19/09/2007): Mr. Mohammad Nashwan 19 September 2007 Jordan Climate Change Consultancy Company Amman-Jordan Subject: Stakeholder Consultation for the Fuel Switching Project of the Aqaba Thermal Power Station Project Dear Sir, Reference is made to your letter dated 04 Sept. 07 with the above mentioned subject. The Aqaba Special Economic Zone Authority (ASEZA) here confirms that the fuel switch, for the power station boilers from heavy fuel oil to Natural Gas, have reduced the emissions load to the atmosphere at the industrial area and the environmental impacts of the facility. Furthermore, ASEZA supported the project from the early stages and is encouraging other industries in the Zone to convert to Natural gas and contribute to the protection of the environment and the improvement of the air quality. Should you need further information, please feel free to contact us. Regards, Aiman Soleiman ------------------------------------------------------------------------------------------------
PROJECT DESIGN DOCUMENT FORM (CDM PDD) - Version 03.1. CDM – Executive Board page 47 Aiman Soleiman, Ph.D. Head, Environmental Studies & Monitoring Division ASEZA Program Coordinator: The European Project
Aqaba Special Economic Zone Authority (ASEZA) Response to comment #1 (19/09/2007): Dear Mr. Soleiman, We thank you for your positive comments, and are happy the fuel switch has a positive effect on the area. It is also good to hear that you are making an effort to convert other facilities to cleaner burning Natural Gas in the interests of the environment. Should you or your colleagues and fellow stakeholders have further comments (either positive or negative) regarding the ATPS fuel switch, we welcome them, and ask that they be submitted by the specified deadline. Thanks and regards, Mark I. Ghorayeb Implementation Team - Middle East EcoSecurities Middle East DMCC Mob: +971 50 253 9571 Off.: +971 4 427 0309 Fax: +971 4 427 0308 mail: [email protected] www.EcoSecurities.com Skype: "Mr. Ghorayeb" Comment #2 (20/09/2007)):
From: lana Al - zu'bi [mailto:[email protected]]
Sent: Thursday, September 20, 2007 1:11 PM
Subject:

PROJECT DESIGN DOCUMENT FORM (CDM PDD) - Version 03.1. CDM – Executive Board page 48 Dear Mohammad,
Please find hereunder our comments and enquiries regarding the "Fuel switching project of the Aqaba thermal power station project". I know the deadline has passed but hopefully these comments will Be taken into account.
1. Coastal power stations generally use seawater as cooling water and thus release seawater with elevated temperature into near shore environments. In addition, anti fouling chemicals are injected into intake seawater to prevent the growth of fouling organisms on the surface of the cooling systems. Chlorination of seawater is mostly employed by coastal power stations and thereby causes formation of chlorination by-products which might potentially inhibit microbes. During the passage through cooling systems, intake seawater containing natural microbes is thus exposed to both high temperature (rarely exceeding 40°C) and anti fouling chemicals for a short time (e.g. about 10 to 30 min). At the outfalls, thermal effluents become mixed with receiving seawater, and elevated temperature and chlorination by-products are always observed near the discharge area. Therefore, thermal discharges from a coastal power station have 2 main components of pollution to coastal waters, i.e. high temperature and chemicals formed during anti fouling procedures. Micro-organisms are numerically abundant in coastal waters and carry out many ecologically important roles in coastal ecosystems. Changes in microbial activities caused by changes in environmental conditions will thus confer significant impacts on functions of coastal ecosystems. What is the temperature of the water discharged to the sea and is any chlorination applied? What are the mitigation measures to prevent this kind of pollution?
2. What are the alternatives if any deficit occurred in the quantity of the available natural gas? The elevated use of the natural gas could probably increase its prices, what is the strategy to cope with such an event?
3. What are the mitigation measures that have been done to reduce the impact of any accident that might happen to the submarine pipeline that comes from Egypt?
Lana Al-Zu'bi
Hala Nobani
Greater Amman Municipality
Environment and Health Monitoring Unit
Response to comment #2 (20/09/2007):

PROJECT DESIGN DOCUMENT FORM (CDM PDD) - Version 03.1. CDM – Executive Board page 49 Dear Lana,
Referring to our call this morning and your E mail about your comments about our project, Fuel Switch for ATPS I would like to thank you for your valuable comments.
As I mentioned in our phone call, the Ecosystem in Aqaba Gulf will not be affected because of fuel switch project.
And I hope that you are satisfied with my comments which I mentioned by phone.
For any further information, please don't hesitate to contact me
Best regards,
Mohammad Nashwan
Technical Director
Jordan Climate Change Consultancy Company
No further comments were received by Ms. Lana Al-Zu'bi E.3. Report on how due account was taken of any comments received: The questions and comments raised as a result of the stakeholder consultation were addressed to the satisfaction of the individual making the comment(s). With regard to the phone conversation between Ms. Lana Al-Zu'bi and Mohammad Nashwan, her concerns were addressed as such:
1. It was clarified that there were no major changes in the ATPS cooling system (involving water introduced from the Gulf of Aqaba) because of the fuel switch. There was a cooling system before the switch, and one after, so the fuel switch itself didn’t influence the cooling system. Ms. Al-Zu’bi was reassured that because of the fragile nature of the Gulf and its importance as an

PROJECT DESIGN DOCUMENT FORM (CDM PDD) - Version 03.1. CDM – Executive Board page 50
ecological, touristic, and marine destination, every effort was being made to keep the impact of ATPS as small as possible.
2. With regard to NG fuel shortages, Mr. Nashwan explained to Ms. Al-Zu’bi that there is a 15-year
agreement between the governments of Egypt and Jordan regarding NG supply and pricing. This is preferable to the HFO scenario which was disrupted with the ’03 Gulf War. With respect to short-term interruptions in NG supply, the plant continues to have HFO firing ability along with a strategic reserve of 2 x 37,000 tons to ensure uninterrupted power supply.
3. Mr. Nashwan explained to Ms. Al Zu’bi that the Arabian Gas Pipeline was recently built to very high standards (of operation and safety). In the rare event of a leak, sections of pipeline showing faults can be isolated and repaired with little/no effect on the Gulf above. A Scada (Supervisory Control & Data Acquisition) System is in place to handle any leaks, in addition to flare systems.
Ms. Al Zu’bi was satisfied with the responses/explanations given her by Mr. Nashwan.
.

PROJECT DESIGN DOCUMENT FORM (CDM PDD) - Version 03.1. CDM – Executive Board page 51
Annex 1
CONTACT INFORMATION ON PARTICIPANTS IN THE PROJECT ACTIVITY Organization: Central Electricity Generating Company (CEGCO) Street/P.O.Box: P. O. Box 2564 Building: CEGCO Headquarters City: Amman State/Region: Khalda Postfix/ZIP: 11953 Country: Jordan Telephone: +962 6 534 0008 FAX: +962 6 534 0800 E-Mail: [email protected] URL: http://www.cegco.com.jo/ Represented by: Omar Al Daour Title: Managing Director/Assistant Technical Salutation: Engineer Last Name: Al Daour Middle Name: Ahmad First Name: Omar Department: Technical Department Mobile: +962 795 528 576 Direct FAX: +962 6 535 6958 Direct tel: +962 6 534 7991 Personal E-Mail: [email protected] Project Annex 1 participant:
Organization: EcoSecurities Group Plc. Street/P.O.Box: 40 Dawson Street Building: City: Dublin State/Region: Postfix/ZIP: 02 Country: Ireland Telephone: +353 1613 9814 FAX: +353 1672 4716 E-Mail: [email protected] URL: www.ecosecurities.com Represented by: Title: COO & President Salutation: Dr. Last Name: Moura Costa Middle Name: First Name: Pedro Mobile:

PROJECT DESIGN DOCUMENT FORM (CDM PDD) - Version 03.1. CDM – Executive Board page 52 Direct FAX: Direct tel: +44 1865 202 635 Personal E-Mail: [email protected]
Annex 2
INFORMATION REGARDING PUBLIC FUNDING This project will not receive any public funding from Annex 1 parties.

PROJECT DESIGN DOCUMENT FORM (CDM PDD) - Version 03.1. CDM – Executive Board page 53
Annex 3
BASELINE INFORMATION Please see the detailed baseline calculations which are provided in addition to the PDD.
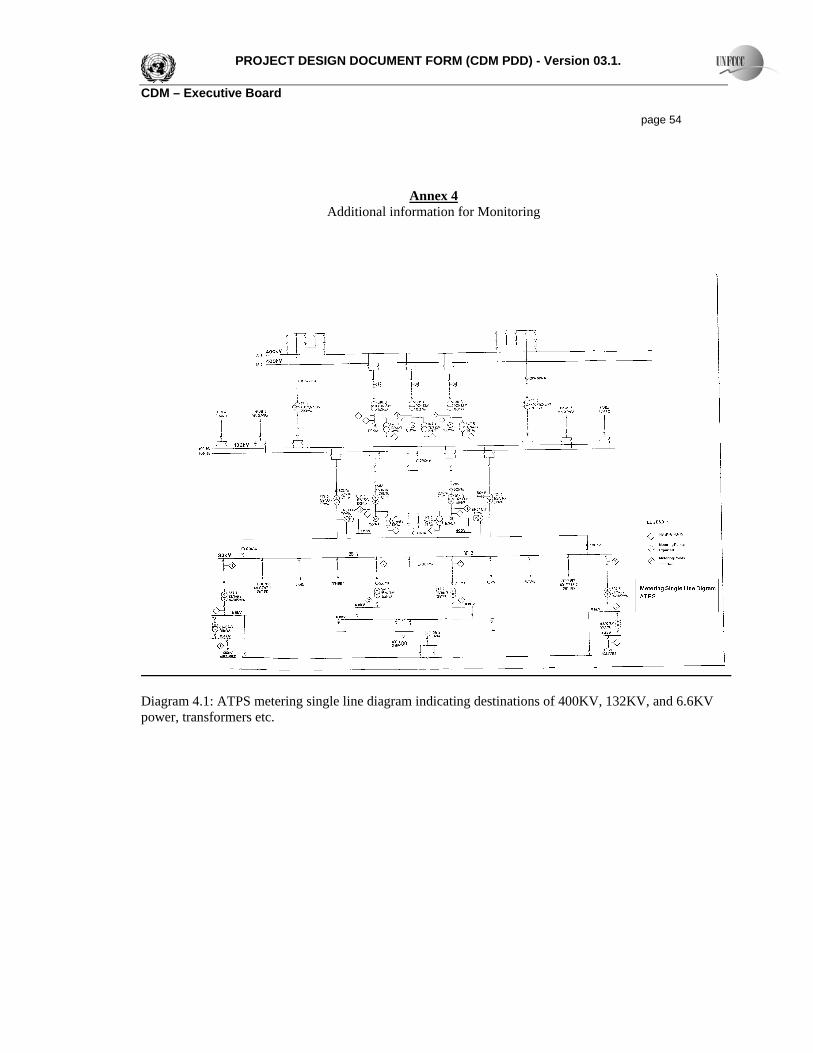
PROJECT DESIGN DOCUMENT FORM (CDM PDD) - Version 03.1. CDM – Executive Board page 54
Annex 4 Additional information for Monitoring
Diagram 4.1: ATPS metering single line diagram indicating destinations of 400KV, 132KV, and 6.6KV power, transformers etc.

PROJECT DESIGN DOCUMENT FORM (CDM PDD) - Version 03.1. CDM – Executive Board page 55
Annex 5 STAKEHOLDER CONSULTATION
Picture 5.1 “Al Ghad” newspaper stakeholder solicitation advertisement, published 04/09/2007

PROJECT DESIGN DOCUMENT FORM (CDM PDD) - Version 03.1. CDM – Executive Board page 56
Stakeholder Consultation for the Fuel Switching Project of the Aqaba Thermal Power Station
The Fuel Switching Project of the Aqaba Thermal Power Station Project, developed by Central Electricity Generating Company (CEGCO) is an energy industries (renewable/non-renewable sources under the Kyoto Protocol) project in Aqaba, the Hashemite Kingdom of Jordan. The project has been set up at Aqaba Thermal Power Station (ATPS), which is approximately 16 km south of Aqaba. The project has implemented a fuel switch for the power station boilers from Heavy Fuel Oil (HFO) to Natural Gas (NG). The fuel is burned to create steam that drives turbines that rotate magnets within generators, creating electrical energy. This is common technology throughout the world, but relatively new to Jordan. The fuel switch was completed in 2004, and ATPS has been running on NG imported via a submarine pipeline (under the Gulf of Aqaba) from Egypt. The primary reason for the fuel switch was to reduce pollution. Due to the high sulphur content of HFO, the “rotten egg” aroma common before the fuel switch has since been averted. The environmental benefits of the fuel switch project are:
• Reduced CO2, SO2, NOx, and suspended particulate matter with associated aromas; • Reduced “rotten egg” aroma (H2S), since high sulphur content (3.6%) HFO is only used as a
back-up fuel; • Smokestack output is no longer colored, but transparent – no more visual pollution; • Acts as a clean technology demonstration project; • Reduced impact on Gulf of Aqaba, since the Gulf’s water that is used for cooling is now cycled
back at a reduced temperature – ATPS runs cooler after the fuel switch; • Good publicity and setting of an example in the region; • Reduced shipping/trucking of HFO (with related traffic and pollution); • Mitigation of climate change due to the reduction of CO2.
A fundamental part of such a Clean Development Mechanism (CDM) project under the United Nations Framework Committee on Climate Change includes a Public Consultation. We invite you to e-mail comments regarding the Fuel Switching Project of the Aqaba Thermal Power Station to:
[email protected] OR [email protected] and ask that you cc CEGCO at:
[email protected] OR [email protected] Should you have any concerns or queries regarding this project, please e-mail them by 19/09/’07. We value your participation, as your opinions and comments will be taken into account to ensure that the Fuel Switching Project of the Aqaba Thermal Power Station achieves its sustainable development objectives. Box 5.1. Translation of “Al Ghad” newspaper advertisement (of 04/09/2007) for stakeholder comments/concerns

PROJECT DESIGN DOCUMENT FORM (CDM PDD) - Version 03.1. CDM – Executive Board page 57
Stakeholder name 04/09/2007 Stakeholder address Subject: Stakeholder Consultation for the Fuel Switching Project of the Aqaba Thermal Power Station Project Dear XXXX, The Fuel Switching Project of the Aqaba Thermal Power Station, developed by Central Electricity Generating Company, is an energy industries (renewable/non-renewable sources under the Kyoto Protocol) project in Aqaba, the Hashemite Kingdom of Jordan. The project has been set up at Aqaba Thermal Power Station, approximately 16 kilometers south of Aqaba. The project has implemented a fuel switch for the power station boilers from Heavy Fuel Oil (HFO) to Natural Gas (NG). The fuel is burned to create steam that drives turbines that rotate magnets within generators, creating electrical energy. This fuel switch technology is common throughout the world, but relatively new to Jordan. The fuel switch was completed in 2004, and ATPS has been running on NG imported via a submarine pipeline (under the Gulf of Aqaba) from Egypt. The primary reason for the fuel switch was to reduce pollution. Due to the high sulphur content of HFO, a “rotten egg” aroma was common before the fuel switch, and has since been averted. The environmental benefits of the fuel switch project are:
• Reduced CO2, SO2, NOx, and suspended particulate matter with associated aromas; • Reduced negative impact in the area since high sulphur content (3.6%) HFO is only used as a
back-up fuel; • Smokestack output is no longer coloured, but transparent – no more visual pollution; • Acts as a clean technology demonstration project; • Reduced impact on Gulf of Aqaba, since the Gulf’s water that is used for cooling is now cycled
back at a reduced temperature; • Good publicity and setting of an example in the region; • Reduced shipping/trucking of HFO (with related traffic and pollution); • Mitigation of climate change due to the reduction of CO2 emissions..
A fundamental part of such a Clean Development Mechanism (CDM) project under the United Nations Framework Committee on Climate Change (UNFCCC) consists of a Public Stakeholder Consultation. We extend to you an invitation to e-mail your comments and concerns regarding the Fuel Switching Project

PROJECT DESIGN DOCUMENT FORM (CDM PDD) - Version 03.1. CDM – Executive Board page 58 of the Aqaba Thermal Power Station to:
[email protected] OR [email protected] and to cc:
[email protected] OR [email protected] Please send your e-mails by 19/09/’07. We value your participation, as your opinions and comments will be taken into account to ensure that the Fuel Switching Project of the Aqaba Thermal Power Station achieves its sustainable development objectives. Our contact details are: Mark Ghorayeb [email protected] +971 4 427 0309 EcoSecurities Middle East DMCC Saba Tower 1 – Office 506 Jumeirah Lake Towers P.O.Box 346002 Dubai, United Arab Emirates, and Mohammad Nashwan [email protected] +962 6565 9432 Jordan Climate Change Consultancy Company P.O Box 4823 Amman 11953 Amman, Jordan Many thanks, Mark Ghorayeb Dubai, UAE, and Mohammad Nashwan Amman, Jordan Box 5.2. Stakeholder consultation letter (of 04/09/2007) for stakeholder comments/concerns e-mailed OR faxed to key Jordanian stakeholders

PROJECT DESIGN DOCUMENT FORM (CDM PDD) - Version 03.1. CDM – Executive Board page 59
Annex 6 CAPACITY TESTS
1 2 3 4 5 averageMCR t steam / h NG HFO NG HFO NG HFO NG HFO NG HFO NG HFObefore boiler modificaions 410 411.25 413.3 424.58 422.66 ‐2.01% 416.358after boiler modificaitons 408.2 413.7 417 418.75 433.29 433.52 427.79 426.96 437.45 429.99 424.746 424.584 ‐0.04%
0.89% 1.79% 4.66% 0.56% 1.70% 1.94%
MCR denotes “Maximum Continuous Rating”, and is a term used specifying that the boiler is operating at 105%. This is generally only done during testing.

PROJECT DESIGN DOCUMENT FORM (CDM PDD) - Version 03.1. CDM – Executive Board page 60
Annex 7 Request for clarification on ACM0011 Version1

PROJECT DESIGN DOCUMENT FORM (CDM PDD) - Version 03.1. CDM – Executive Board page 61
Annex 8 Fuel Price Comparison and NPV calculations
Table 8.1: Fuel Price comparison NG and HFO
NG: STARTParameters Unit Source 2002 2003 2004 2005 2006 2007 2008 2009 2010 2011 2012 2013
A. Fuel cost $/MMBTU 03-06 values CEGCO A.R. 05 & 06 p.16 N/A 2.4 2.4 2.274 2.15 2.15 2.15 2.15 2.15 2.15 2.15 2.15
B. Specific fuel consumption MMBTU/MWh Calculated from fuel consumption and electricity generation levels in 2005 9.04 9.04 9.04 9.04 9.04 9.04 9.04 9.04 9.04 9.04 9.04
C. Cost of fuel per MWh generated $/MWh Calculated (C=A*B) 21.70 21.70 20.56 19.44 19.44 19.44 19.44 19.44 19.44 19.44 19.4
HFO
Parameters Unit Fuel Costs (according to average of '01 "Nexant & Transborder" official fuel price predictions): 2003 2004 2005 2006 2007 2008 2009 2010 2011 2012 2013
A. Fuel cost $/t Average of '01 "Nexant & Transborder" official fuel price predictions 110.5 95.5 87.5 80.5 76.5 74.5 72.5 71.5 70.5 69.5 69.5 68.5
B. Specific fuel consumption t/MWh Calculated from historic fuel consumption and electricity generation levels in 2002 0.221 0.221 0.221 0.221 0.221 0.221 0.221 0.221 0.221 0.221 0.22
C. Cost of fuel per MWh generated $/MWh Calculated (C=A*B) 21.11 19.34 17.79 16.91 16.47 16.02 15.80 15.58 15.36 15.36 15.1
2016 2017 2018 2019 2020 2021 2022 2023 2024 2025 2026 20272.15 2.15 2.15 2.15 2.15 2.15 2.15 2.15 2.15 2.15 2.15 2.15
9.04 9.04 9.04 9.04 9.04 9.04 9.04 9.04 9.04 9.04 9.04 9.0419.44 19.44 19.44 19.44 19.44 19.44 19.44 19.44 19.44 19.44 19.44 19.44
2016 2017 2018 2019 2020 2021 2022 2023 2024 2025 2026 2027
65.5 64.5 63.5 63.5 62.5 62.5 62.5 62.5 62.5 62.5 62.5 62.5
0.221 0.221 0.221 0.221 0.221 0.221 0.221 0.221 0.221 0.221 0.221 0.221
14.48 14.26 14.03 14.03 13.81 13.81 13.81 13.81 13.81 13.81 13.81 13.81

PROJECT DESIGN DOCUMENT FORM (CDM PDD) - Version 03.1. CDM – Executive Board page 62 Input source: Appendix D of “Master Plan for the Energy sector of Jordan Interim Report”, by Transborder and Nexant, May 2001, as presented to the “Arab Bank Centre for Scientific Research”
Table 8.2: Cost Breakdown of boiler Fuel Switch to NG in Jordanian Dinars and US $ Description Installation Hardware (incl. delivery) Spare Parts Admin. Exp. Exch. Rate Losses Tech. Support Tech. Eval. Concrete Foundation Total Total US$
Unit 1 402,383 1,849,082 18,573 25,395 1,695 9,945 2,307,073 3,215,598.08 Unit 2 391,398 1,849,082 18,493 25,395 1,688 9,903 2,295,959 3,200,107.15 Unit 3 339,944 1,849,082 18,120 25,395 1,654 9,703 2,243,897 3,127,544.10 Unit 4 349,772 1,849,082 18,191 25,395 1,660 9,741 2,253,841 3,141,404.03 Unit 5 370,007 1,849,082 18,338 25,395 1,674 9,820 2,274,315 3,169,940.10 NG Purification Plant 1,606,607 1,886,064 27,621 25,903 2,521 14,791 3,563,507 4,966,815.48 Other Spare Parts 484,068 4,081 6,621 372 2,185 497,329 693,176.68 Pressure Reduction Station 205,190 1,485 136 795 11,832 219,438 305,852.35 Pressure Reduction Station Spare Parts 6,064 44 4 24 6,136 8,552.19
Total (JD) 3,460,111 11,336,664 490,133 124,946 159,499 11,403 66,907 11,832 15,661,494
Total ($) 4,822,702 15,801,043 683,147 174,150 222,309 15,893 93,255 16,491 21,828,990 Source: Cost breakdown fuel switch at Aqaba, CEGCO 09/10/2005

PROJECT DESIGN DOCUMENT FORM (CDM PDD) - Version 03.1. CDM – Executive Board page 63
Annex 9 Environmental Impact Assessment
Document 9.1: Royal Jordanian Society EIA Summary for Phase I

PROJECT DESIGN DOCUMENT FORM (CDM PDD) - Version 03.1. CDM – Executive Board page 64

PROJECT DESIGN DOCUMENT FORM (CDM PDD) - Version 03.1. CDM – Executive Board page 65

PROJECT DESIGN DOCUMENT FORM (CDM PDD) - Version 03.1. CDM – Executive Board page 66

PROJECT DESIGN DOCUMENT FORM (CDM PDD) - Version 03.1. CDM – Executive Board page 67

PROJECT DESIGN DOCUMENT FORM (CDM PDD) - Version 03.1. CDM – Executive Board page 68

PROJECT DESIGN DOCUMENT FORM (CDM PDD) - Version 03.1. CDM – Executive Board page 69

PROJECT DESIGN DOCUMENT FORM (CDM PDD) - Version 03.1. CDM – Executive Board page 70

PROJECT DESIGN DOCUMENT FORM (CDM PDD) - Version 03.1. CDM – Executive Board page 71

PROJECT DESIGN DOCUMENT FORM (CDM PDD) - Version 03.1. CDM – Executive Board page 72

PROJECT DESIGN DOCUMENT FORM (CDM PDD) - Version 03.1. CDM – Executive Board page 73

PROJECT DESIGN DOCUMENT FORM (CDM PDD) - Version 03.1. CDM – Executive Board page 74