clean development mechanism project design document form ... · project design document form (cdm...
TRANSCRIPT

PROJECT DESIGN DOCUMENT FORM (CDM PDD) - Version 02 CDM – Executive Board page 1
This template shall not be altered. It shall be completed without modifying/adding headings or logo, format or font.
CLEAN DEVELOPMENT MECHANISM PROJECT DESIGN DOCUMENT FORM (CDM-PDD)
Version 02 - in effect as of: 1 July 2004)
CONTENTS A. General description of project activity B. Application of a baseline methodology C. Duration of the project activity / Crediting period D. Application of a monitoring methodology and plan E. Estimation of GHG emissions by sources F. Environmental impacts G. Stakeholders’ comments
Annexes Annex 1: Contact information on participants in the project activity Annex 2: Information regarding public funding Annex 3: Baseline information
Annex 4: Monitoring plan

PROJECT DESIGN DOCUMENT FORM (CDM PDD) - Version 02 CDM – Executive Board page 2
This template shall not be altered. It shall be completed without modifying/adding headings or logo, format or font.
SECTION A. General description of project activity A.1 Title of the project activity: Catalytic N2O destruction project in the tail gas of three Nitric Acid Plants at Hu-Chems Fine Chemical Corp. Version: 1 Date of Completion: 15/03/2006 A.2. Description of the project activity:
Nitrous oxide (N2O) is an unwanted, invisible and previously neglected by-product of the manufacture of nitric acid. It is formed alongside the main, desired product nitric oxide (NO) during the catalytic oxidation of ammonia in air over noble metal gauzes. The production of nitric acid takes place in three main process steps as indicated by the following reactions:
1. Ammonia (NH3) combustion to form nitric oxide (NO)1:
4 NH3 + 5 O2 → 4 NO + 6 H2O (main reaction 1) (1)
Simultaneously nitrous oxide (N2O), nitrogen (N) and water (H2O) are formed as well, in accordance with the following equations:
4 NH3 + 3 O2 → 2 N2 + 6 H2O (side reaction 1) (2)
4 NH3 + 4 O2 → 2 N2O + 6 H2O (side reaction 2) (3)
NO yield depends mainly on pressure and temperature in the ammonia oxidation process and usually is in a range of 95% to 97%.
2. NO is oxidised to nitrogen dioxide (NO2):
2 NO + O2 → 2 NO2 (main reaction 2) (4)
3. (According to the technical process) Absorption of NO2 in water to form nitric acid (HNO3):
3 NO2 + H2O → 2 HNO3 + NO (main reaction 3) (5)
(NO is oxidised to NO2 according to main reaction 2)
1 Ammonia is reacted with air on noble metal catalyst in the oxidation section of nitric acid plants. Nitric oxide and water are formed in this process according to the above mentioned main equation.

PROJECT DESIGN DOCUMENT FORM (CDM PDD) - Version 02 CDM – Executive Board page 3
This template shall not be altered. It shall be completed without modifying/adding headings or logo, format or font.
Nitric acid plants are, in the vast majority of cases part of a chemical complex. They are built and operated to supply acid for consumption in downstream process units. The ammonia plant that feeds the nitric acid plant is also frequently a part of this chemical production facility. The most common use for nitric acid is for fertilisers, with smaller quantities going into the manufacture of organic compounds and mining explosives.
On leaving the ammonia oxidation reactor some of the N2O may be destroyed in the part of the plant upstream of the absorption tower by high temperature homogeneous gas phase decomposition and by catalytic decomposition on platinum deposits formed from metal lost from the ammonia oxidation catalyst. Since platinum dust carryover into the tail gas section of the plant is prevented by the absorption tower, which acts as a very efficient scrubber, and the temperatures encountered in the tail gas section of the plant are lower than those leading to homogeneous gas phase N2O decomposition there is no relevant loss of N2O in the tail gas section unless a N2O destruction facility is installed. N2O that has reached the tail gas section is thus discharged to atmosphere in the tail gas, and has no economic value.
Depending on technical parameters (e.g. tail gas temperature) the project applicant has to decide either to install a catalytic decomposition process or catalytic reduction process for the proposed project activity.
Description of catalytic decomposition process: Catalytic decomposition of N2O occurs when the N2O is split into its constituent elements by contact with a catalyst. A catalyst is a material which accelerates the speed of the reaction without itself being transformed or consumed by the reaction. Overall reaction:
2 N2O → 2 N2 + O2 (6)
The products of N2O decomposition are the substances that result from decomposition reaction (N2 and O2) Description of catalytic reduction process: Although the term catalytic reduction nowadays has a more general definition in terms of the transfer of electrons, the following definition is sufficient for present purposes: Catalytic reduction of N2O occurs when reactions take place between N2O and other substances in contact with a catalyst, such that the oxygen is removed from the N2O molecule and forms one or more compounds with other species. The substance or substances that react with N2O to remove oxygen are termed reducing agent. A general reaction equation for the catalytic reduction of N2O can be given as:
n N2O + x RA → n N2 + y1 P(1)OA+y2 P(2)OB + .....+ z1 Q(1) + z2 Q(2) + ….. (7) where RA is a molecule of the reducing agent, P(1)OA, P(2)OB are the compound formed by reaction with the oxygen of the N2O and Q(1), Q(2) represents further products of the oxidation reaction, n, x, y1, y2, z1, z2 are the appropriate stoichiometric coefficients. Equations reduction N2O with hydrocarbons: e.g. Reducing agent is methane:
CH4 + 3 N2O → CO + 2 H2O + 3 N2 (8)

PROJECT DESIGN DOCUMENT FORM (CDM PDD) - Version 02 CDM – Executive Board page 4
This template shall not be altered. It shall be completed without modifying/adding headings or logo, format or font.
CH4 + 4 N2O → CO2 + 2 H2O + 4 N2 (9)
e.g. Reducing agent is ethane, overall reaction is:
C2H6 + 5 N2O → 2 CO + 3 H2O + 5 N2 (10) or C2H6 + 7 N2O → 2 CO2 + 3 H2O + 7 N2 (11)
e.g.: Reducing agent is propane, overall reaction is:
C3H8 + 7 N2O → 3 CO + 4 H2O + 7 N2 (12) or C3H8 + 10 N2O → 3 CO2 + 4 H2O + 10 N2 (13)
e.g. Reducing agent is butane, overall reaction is:
C4H10 + 9 N2O → 4 CO + 5 H2O + 9 N2 (14) or C4H10 + 13 N2O → 4 CO2 + 5 H2O + 13 N2 (15)
The definition does not exclude the possibility of side reactions resulting in consumption of reducing agent without any reduction of N2O, for example with propane:
2 C3H8 + 7 O2 → 6 CO + 8 H2O (16) or C3H8 + 5 O2 → 3 CO2 + 4 H2O (17)
The world’s nitric acid plants represent the single greatest industrial process source of N2O emissions. Currently, approx. 700 nitric acid plants are operated globally with an estimated amount of N2O emissions of 400,000 t N2O p.a. (corresponding to 125 Mio t CO2e p.a.).
In response to this, UHDE GmbH (see section A.3.), a leading company in the field of nitric acid technology, has undertaken the task of developing processes for removing N2O from nitric acid plant tail gas streams based on the catalytic decomposition or catalytic reduction of N2O. Efforts have been concentrated on treating the tail gas, as this end-of-pipe approach offers the general advantage, compared with other possible measures (called primary and secondary measures, see section A.4.3.), that minimum interference with the nitric acid production process is caused. In particular, any possibility of nitric acid product contamination, or loss of NO that could otherwise influence nitric acid production, is eliminated.
CARBON CDM KOREA Ltd. (see section A.3.) will invest in the most efficient catalytic destruction technology for N2O emissions reduction in the tail gas of nitric acid plants (furthermore called “EnviNOx®-System”) provided by the technology provider UHDE GmbH (see section A.3.). CARBON will have three EnviNOx®-System installed at all three nitric acid plants of Hu-Chems (see section A.3.) that are in full commercial operation. Hu-Chems will operate the EnviNOx®-Systems at its three nitric acid plants (1) Hu-Chems II, (2) Hu-Chems III (3) Hu-Chems IV, which all of them were constructed by UHDE in (1) 1990, (2) 1999 and (3) 2003 respectively.
The project’s aim is to reduce (almost eliminate) N2O emissions at the nitric acid plants Hu-Chems II, III and IV, with potential additional environmental and secure social benefits. The project activity will not result in any revenues except the income from the sale of CERs. The catalytic N2O destruction project activity is expected to reduce 98% of the N2O emissions that would be emitted without the project activity. Under related project circumstances at the nitric acid of AMI in Austria, UHDE’s EnviNOx®-

PROJECT DESIGN DOCUMENT FORM (CDM PDD) - Version 02 CDM – Executive Board page 5
This template shall not be altered. It shall be completed without modifying/adding headings or logo, format or font.
System reduces more than 98% of all N2O emissions of the nitric acid plant. The project applicant and project operator will voluntarily invest a share of the income from the sale of the CERs in a “Social Fund” to support social projects in the area of Yeosu (additional social benefit). A.3. Project participants:
Name of Party involved (*)
((host) indicates a host Party)
Private and/or public entity(ies) project participants (*)
(as applicable)
Kindly indicate if the Party involved
wishes to be considered as
project participant (Yes/No)
Republic of Korea (Host) CARBON CDM KOREA Ltd. No
Republic of Austria KOMMUNALKREDIT PUBLIC CONSULTING GmbH
No
(*) In accordance with the CDM modalities and procedures, at the time of making the CDM-PDD public at the stage of validation, a Party involved may or may not have provided its approval. At the time of requesting registration, the approval by the Party(ies) involved is required.
Host Country is the Republic of Korea. The Republic of Korea ratified the Kyoto Protocol in November 2002. Project applicant, developer and sponsor is CARBON CDM KOREA Ltd. (furthermore called “CARBON”). CARBON CDM KOREA Ltd. is registered under the laws of the Republic of Korea. The company is a 100% daughter company of CARBON Projektentwicklung GmbH, Austria, and represents a foreign direct investment under the Foreign Investment Promotion Act (FIPA) of Korea. CARBON Projektentwicklung GmbH was founded as a limited liability company located and registered in Austria under Austrian law in order to develop, finance and operate high quality JI/CDM Projects. CARBON Projektentwicklung GmbH has experience with CDM-Project development in Africa, Latin America and Asia and is specialized on the catalytic N2O destruction in the tail gas of nitric acid plants. Project Operator is Hu-Chems Fine Chemical Corp. (furthermore called “HU-CHEMS”). HU-CHEMS was established by separating from Nam-Hae chemical corporation in 2002. HU-CHEMS operates 14 production units which produce fine chemical products in its Yeosu, Jeonnam, industrial complex and provides excellent job conditions to its 254 employees. The company’s headquarter is in Seoul. HU-CHEMS is active in two major business areas, which are fine chemicals and biotechnology. The products are provided to major-chemicals companies in Korea as well as to world-wide major-chemical companies like Dupont and BASF on long term offtake contract basis. Nitric Acid is sold mainly to BASF, Rhodia Polyamide, Keumho Mitsui, POSCO and Hanhwa. The company is listed on the Korean Stock Exchange, KOSPI200, item code 069260, since September 17, 2002, with an aggregate value of

PROJECT DESIGN DOCUMENT FORM (CDM PDD) - Version 02 CDM – Executive Board page 6
This template shall not be altered. It shall be completed without modifying/adding headings or logo, format or font.
stocks of KRW 85,377 million (end of 2005). Major shareholder is NACF with 56%. The rest of the shares are floating. HU-CHEMS is ISO 9002 and 14001 certified and received the Korean safety and health management system certificate (KGS18001 & OHSAS18001). The company has received the Grand Prize of Korea Valuable Management Award in 2005, the President of Korea’s medal in an Energy Saving Promote Contest as well as the Korean Marketing Best Award (KMAC) in 2004 as well as other awards. Project Technology Provider is UHDE GmbH (furthermore called “UHDE”), a 100% subsidiary of ThyssenKrupp. UHDE is world market leader in the field of fertilizer technology engineering and construction. Consequently, UHDE has constructed many modern fertilizer plants including nitric acid plants. Among these plants are the three Hum-Chems plants. In response to increasing concerns surrounding climate change and the destruction of the ozone layer, UHDE has developed catalyst-based processes for removing N2O from nitric acid tail gas streams. A.4. Technical description of the project activity: A.4.1. Location of the project activity: A.4.1.1. Host Party(ies): Republic of Korea A.4.1.2. Region/State/Province etc.: CHOLLA NAM-DO A.4.1.3. City/Town/Community etc: Yeosu

PROJECT DESIGN DOCUMENT FORM (CDM PDD) - Version 02 CDM – Executive Board page 7
This template shall not be altered. It shall be completed without modifying/adding headings or logo, format or font.
A.4.1.4. Detail of physical location, including information allowing the unique identification of this project activity (maximum one page): Figure: Map of the Republic of Korea
The Asian financial crisis of 1997-99 exposed longstanding weaknesses in South Korea's development model, including high debt/equity ratios, massive foreign borrowing, and an undisciplined financial sector. Growth plunged to a negative 6.9% in 1998, then strongly recovered to 9.5% in 1999, and 8.5% in 2000, growth fell back to 3.3% in 2001 because of the slowing global economy, falling exports, and the perception that much-needed corporate and financial reforms had stalled. Led by consumer spending and exports, growth in 2002 was an impressive 7.0%. Between 2003 and 2005, growth moderated to about 4%. A downturn in consumer spending was offset by rapid export growth. In 2005, the government proposed labour reform legislation and a corporate pension scheme to help make the labour market more flexible, and new real estate policies to cool property speculation. Moderate inflation, low unemployment, an export surplus, and fairly equal distribution of income characterize this solid economy.
Since the early 1960s, the Republic of Korea has achieved an incredible record of growth and integration into the high-tech modern world economy. Four decades ago, GDP per capita was comparable with levels in the poorer countries of Africa and Asia. In 2004, the Republic of Korea joined the trillion dollar club of world economies. Today its GDP per capita is equal to the lesser economies of the European Union. This success through the late 1980s was achieved by a system of close government & business ties, including directed credit, import restrictions, sponsorship of specific industries, and a strong labour effort. The government promoted the import of raw materials and technology at the expense of consumer goods and encouraged savings and investment over consumption.

PROJECT DESIGN DOCUMENT FORM (CDM PDD) - Version 02 CDM – Executive Board page 8
This template shall not be altered. It shall be completed without modifying/adding headings or logo, format or font.
Figure: Production site HU-Chems
A.4.2. Category(ies) of project activity: Sectoral scope: 5 Chemical Industry A.4.3. Technology to be employed by the project activity: The possible ways to destroy or reduce N2O emissions at nitric acid plants can be categorized into three groups:
• Primary: N2O is prevented from forming. This requires modifications to the precious metal ammonia oxidation gauzes to reduce N2O formation. Alternative materials can also be employed as the ammonia oxidation catalyst. Cobalt oxide, for example, does not generate any N2O by-product, but suffers from being less selective for the production of N2O.
• Secondary: N2O, once formed, is removed anywhere between the outlet of the ammonia oxidation gauzes and the inlet of the absorption tower. The preferred position of choice for secondary methods is directly after the gauzes.
• Tertiary: N2O is removed from the tail gas downstream of the absorption tower by catalytic destruction (either by catalytic decomposition or by catalytic reduction). In general the optimum position for a tertiary N2O destruction facility is at the hottest position in the tail gas stream. In tertiary catalytic N2O destruction processes a hydrocarbon input may be necessary to achieve the highest available N2O destruction rate. Thus hydrocarbons may be used to increase the tail gas
The production site of HU-CHEMS is located in Yeosu (southern coast of the republic of Korea) in the second biggest industrial complex of Korea consisting of oil, petrochemical, chemical and steel industry. HU-CHEMS is situated on the shores of the Yellow Sea. The company has road and rail access as well as a nearby ship loading terminal.

PROJECT DESIGN DOCUMENT FORM (CDM PDD) - Version 02 CDM – Executive Board page 9
This template shall not be altered. It shall be completed without modifying/adding headings or logo, format or font.
temperature for catalytic decomposition processes (considered as leakage emissions) or as a reducing agent in catalytic reduction processes of N2O (considered as project emissions).
A tertiary approach offers a number of advantages:
• The tertiary approach, as an end-of-pipe technology, is analogous to the various well-established catalytic NOx reduction processes. Acceptance of this technology by plant operators is therefore not expected to be seen as a problem.
• There is no interference with the nitric acid production process itself. The tertiary N2O destruction technology will not cause a nitric acid production increase and therefore no financial incentive for the implementation of the proposed project activity exists.
• A tertiary process incorporates a selective catalyst suitable for destroying N2O and possibly also NOx, which can lead to additional environmental benefit.
• No technical possibility that relevant N2O will be destroyed downstream the tertiary N2O destruction facility. Consequently, an overestimation of N2O baseline emissions is not possible whenever tertiary N2O destruction facility will be installed.
The project technology provider has developed a most efficient and low risk catalytic N2O destruction process for nitric acid plants called the EnviNOx®-System. Efforts have been concentrated on treating the tail gas, as this end-of-pipe approach offers the general advantage - compared with other possible measurements - that minimum interference with the nitric acid production process is caused. In particular, any possibility of nitric acid product contamination, or loss of the valuable intermediate product nitric oxide (NO) that could otherwise influence nitric acid production, is eliminated. The EnviNOx®-System is an example of a tertiary measure for the destruction of N2O from nitric acid plant tail gas streams based on the catalytic decomposition or catalytic reduction of N2O. Therefore the EnviNOx®-System is located between the tail gas heaters and the tail gas turbine of the nitric acid plant. The reactor in an EnviNOx®-System houses one or two catalyst beds through which the tail gas flows. Figure 1: Location of the EnviNOx-System as a tertiary measure
Heat exchanger
Ammonia
Nitric acid production
Abs
orpt
ion
tow
er
Process gas with N2O and NOx
DeNOx / DeN2Ocatalyst
DeNOx
catalyst
Tail gas turbine
To atmosphere
Destruction Facility
Hydrocarbon
Clean tail gas
Tail gas
Process Water
Cooling water
Cooling water
Ammonia oxidation reactor
Air
Ammonia Gas
PI
FI
TI
FI
AI
FI
FI
AI
FI
Heat exchanger
Boiler
N2O, NOx
CO2
ammonia oxidation catalyst

PROJECT DESIGN DOCUMENT FORM (CDM PDD) - Version 02 CDM – Executive Board page 10
This template shall not be altered. It shall be completed without modifying/adding headings or logo, format or font.
A hydrocarbon input may be necessary to achieve the best N2O destruction rate. Thus hydrocarbons may be used to increase the tail gas temperature for catalytic decomposition processes or hydrocarbons may be used as a reducing agent to increase the efficiency of the catalytic reduction process. Technology to be used at Hu-Chems II: A catalytic reduction process will be installed in Hu-Chems II Nitric Acid Plant. The new EnviNOx® reactor 322-R-202 will be located between the existing SCR DeNOx reactor 37-R-201 and the tail gas turbine 37-C-201 T2 which is the position with the highest tail gas temperature in the nitric acid production process at Hu-Chems II. The current tail gas temperature at this stage of the process is around 360°C and sufficient to permit very high rates of N2O removal by virtue of the use of propane and ammonia as reducing agents for N2O and NOX respectively. There is therefore no requirement to make modifications to the nitric acid plant to increase the tail gas temperature. The existing SCR (SCR= Selective Catalytic Reduction) DeNOx unit will stay in operation. The EnviNOx® reactor contains two catalyst beds, the first an iron zeolite, the second a cordierite monolith coated with a small quantity of platinum. For the efficient reduction of nitrous oxide, the NOx concentration (< 100 ppmv; NOX is a mixture of nitric oxide (NO) and nitrogen dioxide (NO2)) of the tail gas leaving the existing SCR-DeNOx reactor must be further lowered to effectively zero. This is achieved simultaneously to the reduction of nitrous oxide in the first catalyst bed. The reducing agents employed, ammonia and propane, are introduced into the tail gas upstream of the EnviNOx® reactor via the static mixer 322-MX-203 as superheated vapours at approximately 130°C. The second bed in the EnviNOx® reactor converts carbon monoxide arising from the use of propane in the first bed to carbon dioxide. The size of this greenhouse gas emission (CO2) is insignificant in comparison to the reduction in greenhouse gas emissions that the process achieves by destroying nitrous oxide but will be monitored by measuring the flow of propane to the EnviNOx® system. Emissions of propane itself will be effectively zero. All the reactions taking place in the EnviNOx® reactor are exothermic. The resulting higher temperature at the inlet of the tail gas turbine increases the amount of energy recovered and compensates for the slight reduction in energy recovery caused by the additional pressure drop of the new equipment. Technology to be used at Hu-Chems III: The technology to be used at Hu-Chems III is congruent the technology to be used at Hu-Chems II.
HU-CHEMS II HU-CHEMS III EnviNOx® reactor 322-R-202 323-R-302 static mixer 322-MX-203 323-MX-303
Technology to be used at Hu-Chems IV: A catalytic N2O decomposition process will be installed at Hu-Chems IV Nitric Acid Plant. The EnviNOx® reactor 324-R-402 will be located upstream of the tail gas turbine 324-C-401 T2 at the position with the highest tail gas temperature in the nitric acid production process at Hu-Chems IV. The current tail gas temperature here is about 387°C. By removing heat transfer surface from the process cooler and installing an internal bypass, the tail gas temperature will be increased to 435°C so that high rates of N2O decomposition can be achieved in the EnviNOx® reactor. The existing SCR DeNOx unit (SCR = Selective Catalytic Reduction) reduces NOx (a mixture of nitric oxide (NO) and nitrogen dioxide (NO2) to nitrogen and water vapour with ammonia over a vanadium pentoxide (V2O5) based catalyst. The implementation of the proposed project activity involves the removal of the existing SCR DeNOx
PROJECT DESIGN DOCUMENT FORM (CDM PDD) - Version 02 CDM – Executive Board page 11
This template shall not be altered. It shall be completed without modifying/adding headings or logo, format or font.
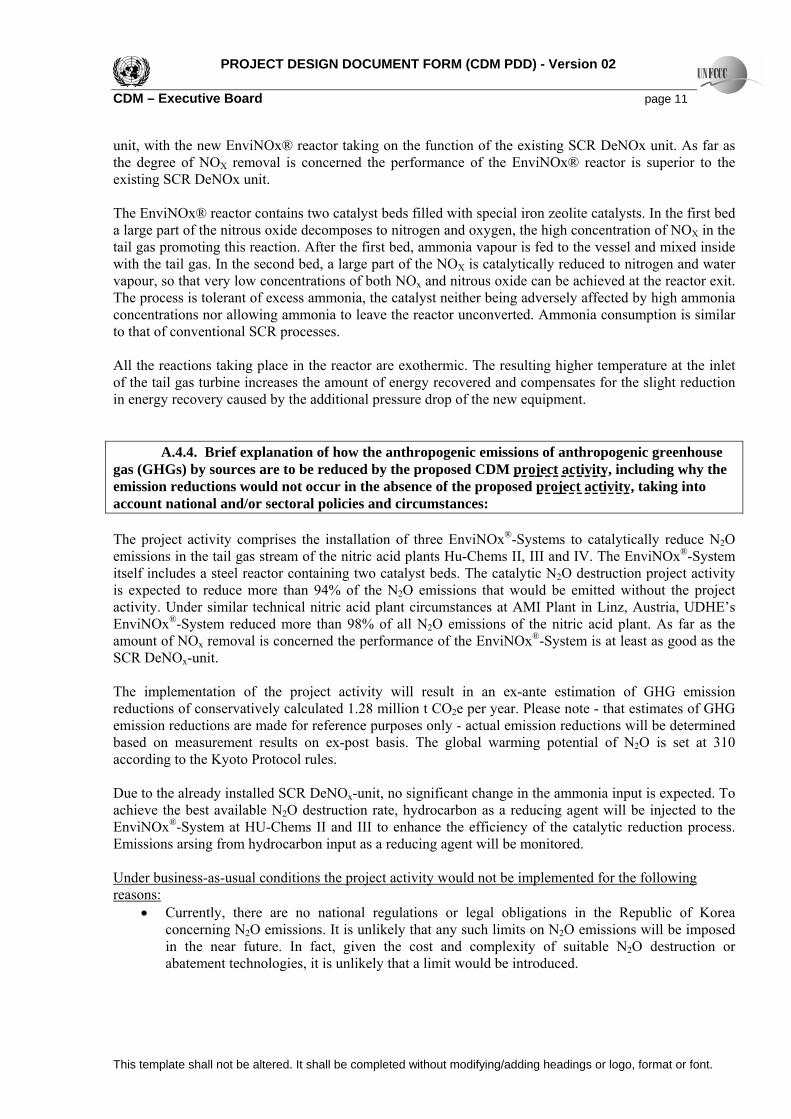
unit, with the new EnviNOx® reactor taking on the function of the existing SCR DeNOx unit. As far as the degree of NOX removal is concerned the performance of the EnviNOx® reactor is superior to the existing SCR DeNOx unit. The EnviNOx® reactor contains two catalyst beds filled with special iron zeolite catalysts. In the first bed a large part of the nitrous oxide decomposes to nitrogen and oxygen, the high concentration of NOX in the tail gas promoting this reaction. After the first bed, ammonia vapour is fed to the vessel and mixed inside with the tail gas. In the second bed, a large part of the NOX is catalytically reduced to nitrogen and water vapour, so that very low concentrations of both NOx and nitrous oxide can be achieved at the reactor exit. The process is tolerant of excess ammonia, the catalyst neither being adversely affected by high ammonia concentrations nor allowing ammonia to leave the reactor unconverted. Ammonia consumption is similar to that of conventional SCR processes. All the reactions taking place in the reactor are exothermic. The resulting higher temperature at the inlet of the tail gas turbine increases the amount of energy recovered and compensates for the slight reduction in energy recovery caused by the additional pressure drop of the new equipment. A.4.4. Brief explanation of how the anthropogenic emissions of anthropogenic greenhouse gas (GHGs) by sources are to be reduced by the proposed CDM project activity, including why the emission reductions would not occur in the absence of the proposed project activity, taking into account national and/or sectoral policies and circumstances: The project activity comprises the installation of three EnviNOx®-Systems to catalytically reduce N2O emissions in the tail gas stream of the nitric acid plants Hu-Chems II, III and IV. The EnviNOx®-System itself includes a steel reactor containing two catalyst beds. The catalytic N2O destruction project activity is expected to reduce more than 94% of the N2O emissions that would be emitted without the project activity. Under similar technical nitric acid plant circumstances at AMI Plant in Linz, Austria, UDHE’s EnviNOx®-System reduced more than 98% of all N2O emissions of the nitric acid plant. As far as the amount of NOx removal is concerned the performance of the EnviNOx®-System is at least as good as the SCR DeNOx-unit. The implementation of the project activity will result in an ex-ante estimation of GHG emission reductions of conservatively calculated 1.28 million t CO2e per year. Please note - that estimates of GHG emission reductions are made for reference purposes only - actual emission reductions will be determined based on measurement results on ex-post basis. The global warming potential of N2O is set at 310 according to the Kyoto Protocol rules. Due to the already installed SCR DeNOx-unit, no significant change in the ammonia input is expected. To achieve the best available N2O destruction rate, hydrocarbon as a reducing agent will be injected to the EnviNOx®-System at HU-Chems II and III to enhance the efficiency of the catalytic reduction process. Emissions arsing from hydrocarbon input as a reducing agent will be monitored. Under business-as-usual conditions the project activity would not be implemented for the following reasons:
• Currently, there are no national regulations or legal obligations in the Republic of Korea concerning N2O emissions. It is unlikely that any such limits on N2O emissions will be imposed in the near future. In fact, given the cost and complexity of suitable N2O destruction or abatement technologies, it is unlikely that a limit would be introduced.

PROJECT DESIGN DOCUMENT FORM (CDM PDD) - Version 02 CDM – Executive Board page 12
This template shall not be altered. It shall be completed without modifying/adding headings or logo, format or font.
• However, adjustments of legal regulations in the Republic of Korea on N2O emissions will be monitored. If legal regulations on N2O emissions are introduced or altered during the crediting period, the baseline emissions will be adjusted immediately at the time the legislation has to be implemented.
• The installation of N2O destruction facilities requires significant investment without any additional economic benefits. The project activity would not be commercially viable even taking into account the market value of any potential by-product of the N2O destruction technology without the revenues from the sales of the CERs. Although the production of nitric acid generates N2O as a by-product, N2O is typically released into the atmosphere as it does not have any economic value.
• National regulations on NOx emissions are more than fulfilled at the nitric acid plant of Hu-Chems.
A.4.4.1. Estimated amount of emission reductions over the chosen crediting period: The implementation of the project activity will result in an ex-ante estimation of GHG emission reductions conservatively calculated at 8.91 million t CO2e over the first seven-year crediting period. Please note - that estimates of GHG emission reductions are made for reference purposes only - actual emission reductions will be determined based on measurement results on ex-post basis. The global warming potential of N2O is set at 310 according to the Kyoto Protocol rules. Table: Summary Emission Reduction 2007-2013
Years (First Crediting Period)
Annual estimation of emission reductions in
tonnes of CO2 e 12/ 2006 51,803
2007 1,280,429 2008 1,280,429 2009 1,280,429 2010 1,280,429 2011 1,280,429 2012 1,280,429
01-11/ 2013 1,173,726 Total estimated reductions (tonnes of CO2 e)
8,908,101
Total number of crediting years
7 years2
Annual average over the crediting period of estimated reductions (tonnes of CO2 e)
1,272,586
A.4.5. Public funding of the project activity:
2 7 years of each period × 3 crediting periods = 21 crediting years

PROJECT DESIGN DOCUMENT FORM (CDM PDD) - Version 02 CDM – Executive Board page 13
This template shall not be altered. It shall be completed without modifying/adding headings or logo, format or font.
No public funds are available for the financing of the project activity. Therefore CARBON will finance the project investment and all running costs out of its own private corporate funds. SECTION B. Application of a baseline methodology B.1. Title and reference of the approved baseline methodology applied to the project activity: Approved baseline methodology AM0028: “Catalytic N2O destruction in the tail gas of Nitric Acid Plants”. B.1.1. Justification of the choice of the methodology and why it is applicable to the project activity: The proposed project activity destroys N2O from three nitric acid plant of Hu-Chems. The use of the methodology is justified because the following statements are true:
• The methodology will be applied to the existing production capacity installed no later than 31 December 2005.
• The HU-Chems nitric acid plants have currently not installed any N2O destruction or abatement technology. The project activity will not result in any shut down of an existing N2O destruction or abatement facility at HU-Chems nitric acid plants II, III and IV.
• The project activity will not cause a nitric acid production increase. • DeNOx-units are already installed at Hu-Chems II, III, IV. The project activity will result in NOx
emission reductions that are at least as effective as the existing DeNOx-units. • The DeNOx-units installed at Hu-Chems II, III, IV are SCR DeNOx-units. • The N2O concentrations will be measured in real time at the inlet and the outlet of the N2O
destruction facilities. B.2. Description of how the methodology is applied in the context of the project activity: The approved baseline methodology “Catalytic N2O destruction in the tail gas of Nitric Acid Plants “ is applied to the “Catalytic N2O destruction project in the tail gas of three Nitric Acid Plant at Hu-Chems Fine Chemical Corp.” in the following four steps: Step 1: Identify technically feasible baseline scenario alternatives to the project activity: The baseline scenario alternatives should include all technically feasible options which are realistic and credible. Step 1a: The baseline scenario alternatives should include all possible options that are technically feasible to handle N2O emissions. For HU-Chems these options are:
� Status quo: The continuation of the current situation, where there will be no installation of technology for the destruction or abatement of N2O
� Alternative use of N2O: o Recycling of N2O as a feedstock for the plant;

PROJECT DESIGN DOCUMENT FORM (CDM PDD) - Version 02 CDM – Executive Board page 14
This template shall not be altered. It shall be completed without modifying/adding headings or logo, format or font.
o The use of N2O for external purposes. � Installation of a Non-Selective Catalytic Reduction (NSCR) DeNOx unit3 � The installation of a N2O destruction or abatement technology
o Tertiary measure for N2O destruction (proposed project activity) o Primary or secondary measures for N2O destruction or abatement.
These options include the CDM project activity not implemented as a CDM project. Technologically not feasible options: The use of N2O for external purposes is technically not feasible at Hu-Chems nitric acid plants, as the quantity of gas to be treated is enormous compared to the amount of nitrous oxide that could be recovered. Note, the N2O concentrations in the tail gas at Hu-Chems nitric acid plants are expected to be in the range of 0.1% to 0.2%. The use of N2O for external purposes is neither in the region/country nor in any other nitric acid plant applied. The recycling of N2O as a feedstock for the plant is technically not practicable, as N2O is not a feedstock for nitric acid production. The recycling of N2O as a feedstock is neither in the region/country nor in any other nitric acid plant applied. Therefore the following alternatives are technically not feasible:
Recycling of N2O as a feedstock for the plant; The use of N2O for external purposes.
Step 1b: In addition to the baseline scenario alternatives of step 1a, all possible options that are technically feasible to handle NOx emissions should be considered. The installation of a NSCR DeNOx unit could also cause N2O emission reduction. Therefore NOx emission regulations have to be taken into account in determining the baseline scenario. The respective options are:
� The continuation of the current situation, where DeNOx units are installed; � Installation of new Selective Catalytic Reduction (SCR) DeNOx units; � Installation of new Non-Selective Catalytic Reduction (NSCR) DeNOx units; � Installation of new tertiary measures combining NOx and N2O emission reductions. (project
scenario). The Clean Air Conservation Act of the Republic of Korea (year 1990) limits NOx emissions at nitric acid plants to 200 ppmv. At HU-CHEMS’ nitric acid plants national legal regulations on NOx emissions are more than fulfilled. HU-CHEMS already operates SCR DeNOx-units at all three nitric acid plants with an average 70 ppmv, which is far below the legal limit of 200 ppmv NOx from exhaust for existing nitric acid plants. As there are already SCR DeNOx units installed at Hu-Chems nitric acid plants, the installation of an NSCR DeNOx unit, which is not state of the art4, is not conceivable as baseline alternative. Therefore it is obvious that HU-CHEMS will not install another DeNOx unit. Therefore the following alternatives are technically not feasible:
Installation of new Selective Catalytic Reduction (SCR) DeNOx units; 3 NSCR: As NSCR DeNOx unit will reduce N2O emissions as a side reaction to the NOx-reduction. Consequently, new NSCR installation can be seen as alternative N2O reduction technology.
4 See also: UBA 2001: Umweltbundesamt. State-of-the-art for production of Nitric Acid with regard to the IPPC Directive. Vienna 2001. EFMA 2000: European Fertilizer Manufactures’ Association, Production of Nitric Acid, Best Available Techniques for Pollution Prevention and Control in the European Fertilizer Industry, Brussels 2000.

PROJECT DESIGN DOCUMENT FORM (CDM PDD) - Version 02 CDM – Executive Board page 15
This template shall not be altered. It shall be completed without modifying/adding headings or logo, format or font.
Installation of new Non-Selective Catalytic Reduction (NSCR) DeNOx units; Step 2: Eliminate baseline alternatives that do not comply with legal or regulatory requirements: Currently, there are no national regulations or legal obligations in the Republic of Korea concerning N2O emissions. All named baseline alternatives are in compliance with all relevant legal and regulatory requirements on N2O and NOx emissions. Therefore no baseline alternative is eliminated at step 2. Step 3: Eliminate baseline alternatives that face prohibitive barriers (barrier analysis): Sub-Step 3a: On the basis of the alternatives that are technically feasible and in compliance with all legal and regulatory requirements, the project participant should establish a complete list of barriers that would prevent alternatives to occur in the absence of CDM. In the case of the “Catalytic N2O destruction project in the tail gas of three Nitric Acid Plants at Hu-Chems Fine Chemical Corp.” project the following barriers that would prevent baseline alternatives to occur in the absence of CDM are identified:
Investment barriers (economic/financial barriers): N2O destruction facilities generate no financial or economical benefits other than CDM related income. No income from any kind of potential product or by-product except CERs are able to pay back investment costs as well as running costs for the installation of a N2O destruction or abatement technology as no marketable product or by-product exists. As national regulations on NOx emissions are more than fulfilled at the nitric acid plant of Hu-Chems and no national regulations or legal obligations in the Republic of Korea concerning N2O emissions exists, investment barriers are clearly identified for all baseline options which require significant investments (primary, secondary and tertiary N2O destruction or abatement).
Technological barriers:
In addition to investment barriers identified above, technological barriers are identified as primary and secondary N2O emission reduction technologies interfere with the nitric acid production process. The implementation of primary or secondary measures could cause an intervention in the nitric acid production process, which is not in the mind of Hu-Chems. Besides, N2O destruction efficiency is considered significantly lower at primary or secondary measures.
Barriers due to prevailing practice:
No nitric acid plant in the Republic of Korea has installed any N2O destruction or abatement technologies. The proposed project activity is the “first of its kind”.
Therefore the following baseline alternatives are eliminated:
Primary or secondary measures for N2O destruction or abatement Tertiary measure for N2O destruction (proposed project activity)
Sub-Step 3b: Show that the identified barriers would not prevent the implementation of at least one of the alternatives (except the proposed CDM project activity): In conclusion, the single scenario that does not face barriers (see step 2) is:

PROJECT DESIGN DOCUMENT FORM (CDM PDD) - Version 02 CDM – Executive Board page 16
This template shall not be altered. It shall be completed without modifying/adding headings or logo, format or font.
The continuation of the current situation, where DeNOx units are installed at Hu-Chems nitric acid plants and national legal regulations on NOx emissions are more than fulfilled. No N2O destruction or abatement technology will be installed. As national regulations on NOx emissions are more than fulfilled at the nitric acid plants of Hu-Chems and no national regulations or legal obligations in the Republic of Korea concerning N2O emissions exists, investment barriers (and also technological barriers) are clearly identified for all baseline options except the continuation of the status quo.
Therefore the continuation of the status quo can be pre-selected as baseline scenario. As the outcome of the barrier analysis (step 3) is clear, Step 4 of the methodology is omitted. Step 4: Identify the most economically attractive baseline scenario alternative: Determine which of the remaining project alternatives that are not prevented by any barrier is the most economically of financially attractive, and then is a possible baseline scenario. Sub-step 4a: Determine appropriate analysis method Sub-step 4b: Option I: Apply simple cost analysis As the outcome of the barrier analysis (step 3) clearly identifies the baseline scenario, Step 4 of the methodology is omitted. The procedure to identify the baseline scenario clearly results in that the most likely baseline scenario is the continuation of the status quo and therefore the continuation of emitting N2O to the atmosphere, without the installation of N2O destruction or abatement technologies. Therefore the continuation of the current situation is clearly identified as the baseline scenario.

PROJECT DESIGN DOCUMENT FORM (CDM PDD) - Version 02 CDM – Executive Board page 17
This template shall not be altered. It shall be completed without modifying/adding headings or logo, format or font.
Step 5: Re-assessment of baseline scenario in course of proposed project activity’s lifetime:
At the start of a crediting period, a re-assessment of the baseline scenario due to new or modified NOx or N2O emission regulations should be executed as follows:
Sub Step 5a: New or modified NOx emission regulations: If new or modified NOx emission regulations are introduced after the project start, determination of the baseline scenario will be re-assessed at the start of a crediting period. Baseline scenario alternatives to be analysed should include, inter alia:
� Selective Catalytic Reduction (SCR); � Non-Selective Catalytic Reduction (NSCR); � Tertiary measures incorporating a selective catalyst for destroying N2O and NOx emissions; � Continuation of baseline scenario.
For the determination of the adjusted baseline scenario the project participant should re-assess the baseline scenario and shall apply baseline determination process as stipulated above (Step 1 – 5).
Potential outcomes of the re -assessment of the baseline scenario (to be in line with NOx regulation)
Consequence (adjusted baseline scenario)
SCR DeNOx installation Continuation of original (N2O) baseline scenario NSCR DeNOx installation The N2O emissions outlet of NSCR become
adjusted baseline N2O emissions, as NSCR may reduce N2O emissions as well as NOx.
Tertiary measure that combines NOx and N2O emission reduction
Adjusted baseline scenario results in zero N2O emissions reduction
Continuation of original baseline scenario
Continuation of original baseline scenario
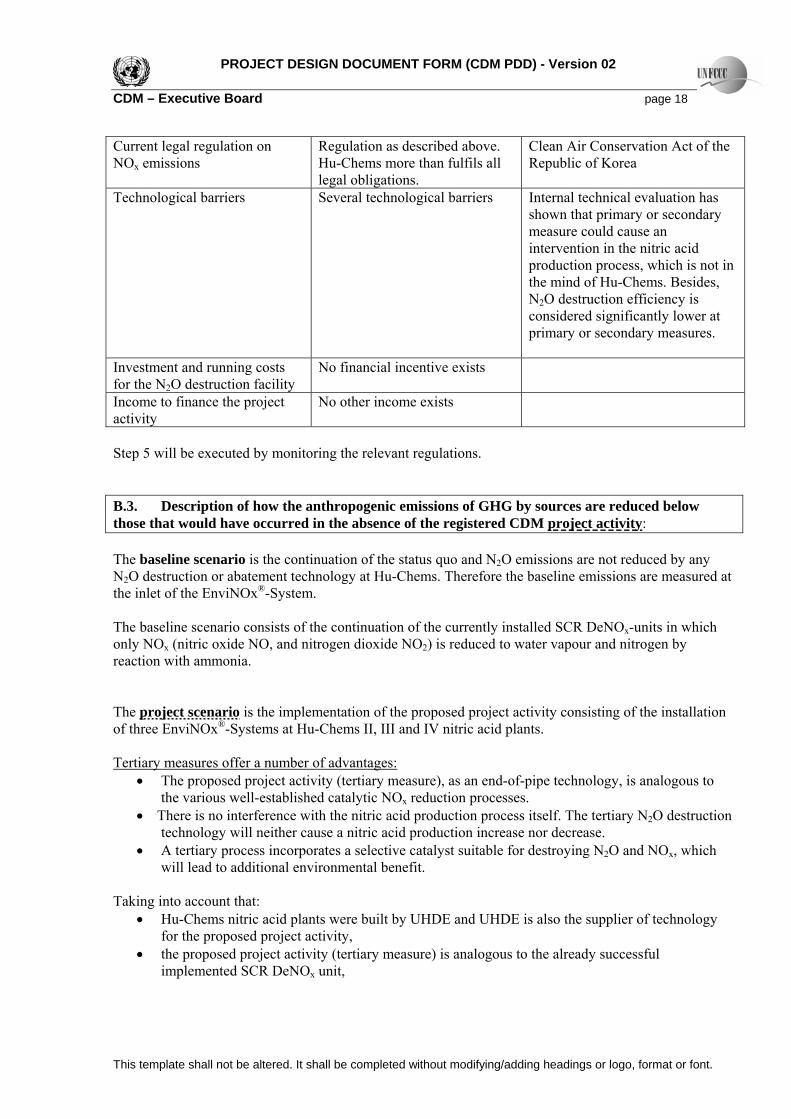
Note, Hu-Chems II, III, IV have already installed SCR DeNOx units. New or modified NOx emission regulations introduced after the project start will be taken into account for the next crediting period. Sub Step 5b: New or modified N2O-regulation: If legal regulations on N2O emissions are introduced or changed during the crediting period, the baseline emissions shall be adjusted at the time the legislation has to be legally implemented. Therefore the pre-selected baseline scenario can be adopted as the Baseline Scenario. Key parameters for the determination of the baseline scenario are: Key Parameters Detail Data Source Current legal regulation on N2O emissions
No regulation Clean Air Conservation Act of the Republic of Korea
PROJECT DESIGN DOCUMENT FORM (CDM PDD) - Version 02 CDM – Executive Board page 18
This template shall not be altered. It shall be completed without modifying/adding headings or logo, format or font.
Current legal regulation on NOx emissions
Regulation as described above. Hu-Chems more than fulfils all legal obligations.
Clean Air Conservation Act of the Republic of Korea
Technological barriers Several technological barriers Internal technical evaluation has shown that primary or secondary measure could cause an intervention in the nitric acid production process, which is not in the mind of Hu-Chems. Besides, N2O destruction efficiency is considered significantly lower at primary or secondary measures.
Investment and running costs for the N2O destruction facility
No financial incentive exists
Income to finance the project activity
No other income exists
Step 5 will be executed by monitoring the relevant regulations. B.3. Description of how the anthropogenic emissions of GHG by sources are reduced below those that would have occurred in the absence of the registered CDM project activity: The baseline scenario is the continuation of the status quo and N2O emissions are not reduced by any N2O destruction or abatement technology at Hu-Chems. Therefore the baseline emissions are measured at the inlet of the EnviNOx®-System. The baseline scenario consists of the continuation of the currently installed SCR DeNOx-units in which only NOx (nitric oxide NO, and nitrogen dioxide NO2) is reduced to water vapour and nitrogen by reaction with ammonia. The project scenario is the implementation of the proposed project activity consisting of the installation of three EnviNOx®-Systems at Hu-Chems II, III and IV nitric acid plants. Tertiary measures offer a number of advantages:
• The proposed project activity (tertiary measure), as an end-of-pipe technology, is analogous to the various well-established catalytic NOx reduction processes.
• There is no interference with the nitric acid production process itself. The tertiary N2O destruction technology will neither cause a nitric acid production increase nor decrease.
• A tertiary process incorporates a selective catalyst suitable for destroying N2O and NOx, which will lead to additional environmental benefit.
Taking into account that:
• Hu-Chems nitric acid plants were built by UHDE and UHDE is also the supplier of technology for the proposed project activity,
• the proposed project activity (tertiary measure) is analogous to the already successful implemented SCR DeNOx unit,

PROJECT DESIGN DOCUMENT FORM (CDM PDD) - Version 02 CDM – Executive Board page 19
This template shall not be altered. It shall be completed without modifying/adding headings or logo, format or font.
• the expected N2O reduction rate of tertiary measures up to 99%, • primary and secondary measures requires modifications to the ammonia oxidation reactor
(operational risks), • a tertiary measures will not influence the production process of Hu-Chems core business
Based on this line of arguments, Hu-Chems obviously and explicitly gives their technological preference to a tertiary technology. The EnviNOx®-System is a tertiary technology for destruction of N2O emissions in the tail gas of Hu-Chems II, III, IV nitric acid plants and is located between the tail gas heaters and the tail gas turbine. It is expected that the project activity reduces minimum 94% of the N2O emissions that would be emitted without the project activity (under related project circumstances at the nitric acid plant of AMI in Austria, the EnviNOx®-System reduces more than 98% of N2O emissions). Hu-Chems II and III: A catalytic reduction process will be installed in Hu-Chems II and III nitric acid plants. The current tail gas temperature at this stage of the process is sufficient to permit very high rates of N2O removal by virtue of the use of propane and ammonia as reducing agents for N2O and NOX respectively. There is therefore no requirement to make modifications to the nitric acid plant to increase the tail gas temperature. The existing SCR (SCR= Selective Catalytic Reduction) DeNOx unit will stay in operation. Hu-Chems IV: A catalytic N2O decomposition process will be installed at Hu-Chems IV nitric acid plant. The implementation of the proposed project activity involves the removal of the existing SCR DeNOx unit, with the new EnviNOx® reactor taking on the function of the existing SCR DeNOx unit as it too accomplishes the reduction of NOx with ammonia. As far as the degree of NOX removal is concerned the performance of the EnviNOx® reactor is superior to the existing SCR DeNOx unit. GHG emission reductions achieved by the project activity will only be claimed for the destruction of N2O emissions, taking national regulations on N2O emissions into account. If legal regulations on N2O emissions are introduced or altered during the crediting period, the baseline emissions will be adjusted immediately at the time the legislation has to be implemented. The additionality of the project activity is demonstrated and assessed using the “Tool for demonstration and assessment of additionality” agreed by the Executive Board. The project activity’s planned starting date is after 31 December 2005 and so no early credits are claimed, instead the start of the crediting period for the project activity is therefore at the date of registration and Step 0 is omitted. Because of the similarity of both approaches used to determine the baseline scenario and the additionality tool, step1 of the tool for demonstration and assessment of additionality can be ignored. Step 2. Investment analysis: Sub-step 2a. Determine appropriate analysis method:

PROJECT DESIGN DOCUMENT FORM (CDM PDD) - Version 02 CDM – Executive Board page 20
This template shall not be altered. It shall be completed without modifying/adding headings or logo, format or font.
As catalytic N2O destruction facilities generates no financial or economical benefits other than CDM related income, Option I as stated in the applied baseline methodology (simple cost analysis) has been chosen. Sub-step 2b. – Apply simple cost analysis Project scenario: No income from any kind of potential product or by-product except CERs are able to pay back investment costs as well as running costs for the installation of the EnviNOx®-System as no marketable product or by-product exists. The investment costs of several million Euros (excluding potential financing costs) consists of the engineering, construction, shipping, erection, installation and commissioning of the EnviNOx®-System and the measurement equipment. The running costs consist of the regular change of the catalysts, hydrocarbon and ammonia inputs as well as personnel costs for the supervision of the EnviNOx®-System and the measurement equipment. Confidential information on investment and operation costs will be provided to the validator. Baseline scenario: The baseline scenario “The continuation of the current situation” will neither cause any additional investments costs nor any additional running costs. Therefore, the proposed CDM project activity is, without the revenues from the sale of certified emission reductions, obviously less economically and financially attractive than the baseline scenario. Step 4. Common practice analysis Hu-Chems is the biggest nitric acid producer in the Republic of Korea. Hu-Chems is the market leader. The other nitric acid plants in Hanwha and Dong-Bu do not have any N2O destruction or abatement technologies. The proposed project activity is the “first of its kind” in the Republic of Korea and the whole region, no similar project activity of this kind is currently operational and therefore the proposed project activity is not common practice. Step 5. Impact of CDM registration The financial benefits of the revenues obtained by selling CERs from the project activity will lead to the implementation of the project activity. Based on the ex-ante estimation of N2O emission reductions over the first crediting period, it is expected that the income from selling of CERs of the registered CDM project activity is at least as high as the investment, financing and running costs. Therefore CARBON is willing to finance the project activity under the condition of the registration of the project activity. Conclusion: The proposed CDM project activity is undoubtedly additional, since it passes all the steps of the tool for the demonstration and assessment of additionality. No income from any kind of potential product or by-product except CERs are able to pay back investment costs as well as running costs for the installation of the proposed project activity as no marketable product or by-product exists. The registration of the project activity as a CDM Project and corresponding CER revenues are the single source of project revenues. CDM registration is therefore the decisive factor for the realization of the proposed project activity.

PROJECT DESIGN DOCUMENT FORM (CDM PDD) - Version 02 CDM – Executive Board page 21
This template shall not be altered. It shall be completed without modifying/adding headings or logo, format or font.
B.4. Description of how the definition of the project boundary related to the baseline methodology selected is applied to the project activity: N2O is a by-product of the manufacture of nitric acid. It is formed alongside the main, desired product nitric oxide during the catalytic oxidation of ammonia over platinum/rhodium gauzes. On leaving the gauzes some of the N2O may be destroyed in the part of the plant upstream of the absorption tower by high temperature homogeneous gas phase decomposition and by catalytic decomposition on platinum deposits formed from metal lost from the gauzes. Since platinum dust carryover into the tail gas section of the plant is prevented by the absorption tower, which acts as a very efficient scrubber, and the temperatures encountered in the tail gas section of the plant are lower than those leading to homogeneous gas phase N2O decomposition there is no loss of N2O in the tail gas section unless nitrous oxide destruction facility is installed. Nitrous oxide that has reached the tail gas section is thus discharged to atmosphere in the tail gas, and has no economic value. The project boundary encompasses all anthropogenic emissions by sources of greenhouse gases under the control of the project participants that are significant and reasonable attributable to the project activity. For the purpose of determining project activity emissions, project participants shall include:
N2O concentration in the flow stream of the tail gas; In case no SCR DeNOx unit has been installed prior to the start of the project activity, GHG emissions
related to the production of ammonia used for the NOx reduction will be considered as project emissions. In case a SCR DeNOx unit has been installed prior to the start of the project activity, GHG emissions related to the production of ammonia used for NOx reduction will not be considered as project emissions.
Hydrocarbons as a reducing agent to enhance the efficiency of a N2O catalytic reduction facility. For the purpose of determining baseline emissions, project participants shall include the following emission sources:
N2O concentration in the flow stream of the tail gas; In case no SCR DeNOx unit has been installed prior to the start of the project activity, GHG
emissions related to the production of ammonia used for NOx reduction will be considered zero in the baseline. In case SCR DeNOx unit has been installed prior to the start of the project activity, GHG emissions related to the production of ammonia used for NOx reduction will not be considered.
The following table illustrates which emissions sources are included and which are excluded from the project boundary for determination of both baseline and project emissions. Table: Overview on emission sources included or excluded from the project boundary Baseline Emissions
Source Gas Justification/Explanation

PROJECT DESIGN DOCUMENT FORM (CDM PDD) - Version 02 CDM – Executive Board page 22
This template shall not be altered. It shall be completed without modifying/adding headings or logo, format or font.
Emissions of N2O as a result of side reaction to the nitric acid production process
N2O Included Main emission source, taking national N2O emission regulations into account.
Emissions related to the production of ammonia used for NOx reduction (Attention: Ammonia used for NOx- reduction does not cause GHG emissions, only the production of ammonia causes GHG emissions)
CO2 CH4 N2O
Included In case SCR DeNOx unit is already installed prior to the project start: ammonia input for SCR is considered to be of the same magnitude to project related ammonia input for NOx reduction. Baseline emissions and project emissions are similar and therefore not considered for calculation. In case no SCR DeNOx unit is already installed prior to the project start: ammonia input for NOx reduction is considered 0 for baseline emissions.
N2O emissions from SCR DeNOx unit
N2O Excluded The presence of a SCR DeNOx unit tends to increase the N2O emissions. Therefore the ex-post measurement of the baseline emissions at the inlet of the N2O destruction facility represents a conservative determination of the baseline N2O emissions.
Project Emissions
Source Gas Justification/Explanation Emissions of N2O as a result of side reaction to the nitric acid production process
N2O Included Main emission source that remains in the tail gas after the N2O destruction facility
Emissions related to the production of ammonia input used for NOx reduction (Attention: Ammonia used for NOx-reduction doesn’t cause GHG emissions, only production causes GHG emissions)
CO2 CH4 N2O
Included In case SCR DeNOx unit is already installed prior to the project start: ammonia input for SCR is considered of the same order as project related ammonia input for NOx-reduction. Baseline emissions and project emissions are similar and therefore not considered for calculation. In case no SCR DeNOx unit is already installed prior to the project start: ammonia input for NOx reduction is monitored and considered for project emissions.
In case of N2O reduction process installed: Emissions at the project site resulting from hydrocarbons used as reducing agent
CH4 and/or CO2
Included Hydrocarbons are used as reducing agent to enhance the efficiency of a N2O catalytic reduction facility. In this case hydrocarbons are mainly converted to CO2, while some hydrocarbons may remain intact. Fractions of unconverted methane are either measured (monitored online) or all methane used as reducing

PROJECT DESIGN DOCUMENT FORM (CDM PDD) - Version 02 CDM – Executive Board page 23
This template shall not be altered. It shall be completed without modifying/adding headings or logo, format or font.
agent is assumed as completely intact. All other hydrocarbons are assumed to be completely converted to CO2.
Emissions from electricity demand
CO2 CH4 N2O
Excluded GHG emissions related to the electricity consumption are insignificant (< 0.005%) and are excluded as monitoring would lead to unreasonable costs.
Emissions related to the production of the hydrocarbons
CO2 CH4 N2O
Excluded GHG emissions related to the production of hydrocarbons used as reducing agent represent less than 0.001% of expected emission reductions and will not be taken into account due to unreasonable costs for monitoring.
As shown in Figure 1, the spatial extent of the project boundary comprises:
• The catalytic N2O destruction facility including auxiliary ammonia and/or hydrocarbon input, and • For monitoring purposes only, the nitric acid plant, to measure the nitric acid output and operating
parameters of the ammonia oxidation reactor.

PROJECT DESIGN DOCUMENT FORM (CDM PDD) - Version 02 CDM – Executive Board page 24
This template shall not be altered. It shall be completed without modifying/adding headings or logo, format or font.
Figure 2: Project boundary Hu-Chems II and Hu-Chems III
Heat exchanger
Analyser house
Ammonia
Nitric acid production
Abs
orpt
ion
tow
er
Process gas with N2O and NOx
DeNOx / DeN2Ocatalyst
DeNOx
catalyst
Tail gas turbine
To atmosphereDestruction Facility
Propane
Clean tail gas
N2O destruction facility installed in the tail gas of Hu-Chems II and Hu-Chems III nitric acid plants
Tail gas
Process Water
Cooling water
Cooling water
Ammonia oxidation reactor
Air
Ammonia Gas
PI
TI
FI
Project boundaryFI
Figure 3: Project boundary Hu-Chems IV
Heat exchanger
Analyser house
Ammonia
Nitric acid production
Abs
orpt
ion
tow
er
Process gas with N2O and NOx
DeNOx / DeN2Ocatalyst
DeNOx
catalyst
Tail gas turbine
To atmosphereDestruction Facility
Clean tail gas
N2O destruction facility installed in the tail gas of Hu-Chems IV nitric acid plant
Tail gas
Process Water
Cooling water
Cooling water
Ammonia oxidation reactor
Air
Ammonia Gas
PI
TI
FI
Project boundaryFI

PROJECT DESIGN DOCUMENT FORM (CDM PDD) - Version 02 CDM – Executive Board page 25
This template shall not be altered. It shall be completed without modifying/adding headings or logo, format or font.
At Hu-Chems nitric acid plants the EnviNOx®-Systems will be installed between the tail gas heaters and the tail gas turbines. The existing DeNOx-unit will be removed at Hu-Chems IV. The regular measurement equipment consists of the following components:
• Flow volume measurement equipment for tail gas flow rate; • Analyser for N2O and NOx concentration monitoring upstream and downstream of the N2O
destruction facilities; • Flow measurement equipment for auxiliary ammonia and hydrocarbon inputs to the N2O
destruction facilities; To avoid gambling (deliberate attempt to increase baseline N2O emissions) the following measuring devices will be or are already installed:
• Measuring device for temperature of the ammonia oxidation reactors, • Measuring device for pressure upstream of the ammonia oxidation reactors, • Measuring device for ammonia flow rate to the ammonia oxidation reactors, • Measuring device for nitric acid outputs;
Furthermore, composition of the ammonia oxidation catalysts at the start of each campaign will be recorded. B.5. Details of baseline information, including the date of completion of the baseline study and the name of person (s)/entity (ies) determining the baseline: Detailed baseline information is provided in Annex 3 to this PDD. This baseline study was completed 15/03/2006. The baseline study was prepared by: Name Project Participant Yes / No CARBON Projektentwicklung GmbH A-3485 Grunddorf 68 AUSTRIA Tel. +43 2735 77 135 Fax. +43 2735 20 531 Gerald Dunkel, Ferdinand Heilig Email: [email protected] Email: [email protected]
NO

PROJECT DESIGN DOCUMENT FORM (CDM PDD) - Version 02 CDM – Executive Board page 26
This template shall not be altered. It shall be completed without modifying/adding headings or logo, format or font.
SECTION C. Duration of the project activity / Crediting period C.1 Duration of the project activity: C.1.1. Starting date of the project activity: Starting date of the project activity: 22/12/2005 C.1.2. Expected operational lifetime of the project activity: 25 years C.2 Choice of the crediting period and related information: C.2.1. Renewable crediting period C.2.1.1. Starting date of the first crediting period: Expected starting date of first crediting period: 01/12/2006 C.2.1.2. Length of the first crediting period: 7 years, 0 months C.2.2. Fixed crediting period: C.2.2.1. Starting date: Not chosen C.2.2.2. Length: Not chosen

PROJECT DESIGN DOCUMENT FORM (CDM PDD) - Version 02 CDM – Executive Board page 27
This template shall not be altered. It shall be completed without modifying/adding headings or logo, format or font.
SECTION D. Application of a monitoring methodology and plan D.1. Name and reference of approved monitoring methodology applied to the project activity: Approved monitoring methodology AM0028 “Catalytic N2O destruction in the tail gas of Nitric Acid Plants” This monitoring methodology shall be used in conjunction with the approved baseline methodology AM0028 “Catalytic N2O destruction in the tail gas of Nitric Acid Plants”. D.2. Justification of the choice of the methodology and why it is applicable to the project activity: The proposed project activity will be implemented at three existing nitric acid plant of Hu-Chems. The project comprises the installation of three catalytic N2O destruction facilities in the tail gas of Hu-Chems nitric acid plants II, III and IV. There is no indication that legal regulations and obligations regarding N2O emissions will be implemented in the Republic of Korea. Nevertheless observation of the Korean regulations on N2O emissions will be part of the monitoring. The use of the methodology is justified because the following statements are true:
• The methodology will be applied to the existing production capacity installed no later than 31 December 2005.
• The Hu-Chems nitric acid plants II, III, IV have currently not installed any N2O destruction or abatement technology. The project activity will not result in any shut down of an existing N2O destruction or abatement facility at Hu-Chems nitric acid plants II, III, IV.
• The project activity will not cause a nitric acid production increase. • DeNOx-units are already installed at Hu-Chems II, III, IV. The project activity will result in NOx
emission reductions that are at least as effective as the existing DeNOx-units. • The DeNOx-units installed at Hu-Chems II, III, IV are SCR DeNOx-units. • The N2O concentrations will be measured in real time at the inlet and the outlet of the N2O
destruction facilities. The accuracy of the N2O emissions monitoring results will be ensured by installing a monitoring system that has been certified to meet (or exceeds) the requirements of the prevailing best industry practice or monitoring standards in terms of operation, maintenance and calibration.

PROJECT DESIGN DOCUMENT FORM (CDM PDD) - Version 02 CDM – Executive Board page 28
This template shall not be altered. It shall be completed without modifying/adding headings or logo, format or font.
D.2. 1. Option 1: Monitoring of the emissions in the project scenario and the baseline scenario The monitoring methodology follows Option 1. In order to calculate the baseline and project emissions the project applicant/operator will provide data on:
• Legal regulations on N2O and NOx; • The production capacities of the respective nitric acid plant measured in tonnes of nitric acid; • Composition of the ammonia oxidation catalyst of the respective nitric acid plant; • The ammonia flow rate to the ammonia oxidation reactor of the respective nitric acid plant; • The operating temperature and pressure range of the ammonia oxidation reactor of the respective nitric acid plant; • Concentration of N2O and NOx at EnviNOx®-Systems inlet and outlet of the respective nitric acid plant; • Tail gas Flow rates of the respective nitric acid plant;
Information and data mentioned above are integrated part of the monitoring reports. Data collected to monitor emissions of the project scenario and the baseline scenario are given below:

PROJECT DESIGN DOCUMENT FORM (CDM PDD) - Version 02 CDM – Executive Board page 29
This template shall not be altered. It shall be completed without modifying/adding headings or logo, format or font.
D.2.1.1. Data to be collected in order to monitor emissions from the project activity, and how this data will be archived: Overall: ID number
Data Variable Source of data Data unit
Measured (m), calculated (c) or estimated (e)
Recording frequency
Proportion of data to be monitored
How will the data be archived? (electronic/ paper)
For how long is achieved data to be kept
Comment
P1
PE_y Project emissions
Monitoring system
tCO2e Calculated Annual 100% Electronic Crediting period +2yrs
P2
PE_ND,y Project emissions from N2O not destroyed
Monitoring system
tCO2e Calculated Annual 100% Electronic Crediting period +2yrs
P3
PE_DF,y Project emissions from destruction facility
Monitoring system
tCO2e Calculated Annual 100% Electronic Crediting period +2yrs

PROJECT DESIGN DOCUMENT FORM (CDM PDD) - Version 02 CDM – Executive Board page 30
This template shall not be altered. It shall be completed without modifying/adding headings or logo, format or font.
Hu-Chems II: ID number
Data Variable Source of data Data unit
Measured (m), calculated (c) or estimated (e)
Recording frequency
Proportion of data to be monitored
How will the data be archived? (electronic/ paper)
For how long is achieved data to be kept
Comment
P4
PE_y,II Project emissions
Monitoring system
tCO2e Calculated Annual 100% Electronic Crediting period +2yrs
P5
PE_ND,y,II Project emissions from N2O not destroyed
Monitoring system
tCO2e Calculated Annual 100% Electronic Crediting period +2yrs
P6
PE_DF,y,II Project emissions from destruction facility
Monitoring system
tCO2e Calculated Annual 100% Electronic Crediting period +2yrs
P7
PE_N2O,y,II N2O not destroyed by facility
Monitoring system
tN2O Calculated Daily 100% Electronic Crediting period +2yrs
P8
F_TG,I,II Volume flow tail gas at N2O destruction facility
Flow meter m³/h Measured continuously
Daily 100% Electronic Crediting period +2yrs
Flow metering system will automatically record volume flow adjusted to standard

PROJECT DESIGN DOCUMENT FORM (CDM PDD) - Version 02 CDM – Executive Board page 31
This template shall not be altered. It shall be completed without modifying/adding headings or logo, format or font.
temperature and pressure.
P9
CO_N2O,i ,II N2O concentration at destruction facility outlet
Monitoring system, measuring device
tN2O/ m³ Measured continuously
Daily 100% Electronic Crediting period +2yrs
P10
M_i,II Measuring Interval
Measuring device, data management system
h Measured continuously
Daily 100% Electronic Crediting period +2yrs
P11
PE_HC,y,II Emissions from hydrocarbon use in destruction facility
Monitoring system
tCO2e Calculated Annual 100% Electronic Crediting period +2yrs
P12
HCE_C,y,II Converted hydrocarbon emissions
Monitoring system
tCO2e Calculated Annual 100% Electronic Crediting period +2yrs
P13
Q_HC,y,II Hydrocarbon input (reducing agent)
Measuring device
m³ Measured Daily 100% Electronic Crediting period +2yrs
P14
ρ_HC,II Hydrocarbon density
Certificate hydrocarbon supplier or default value
t/m³ Measured Yearly 100% Electronic Crediting period +2yrs

PROJECT DESIGN DOCUMENT FORM (CDM PDD) - Version 02 CDM – Executive Board page 32
This template shall not be altered. It shall be completed without modifying/adding headings or logo, format or font.
P15
EF_HC,II Hydrocarbon CO2 emission factor
IPCC
tCO2/t
Calculated Once 100% Electronic Crediting period +2yrs
Propane: 3 tCO2/tC3H8
P16
OXID_HC,II Hydrocarbon oxidation factor
Measuring device
% Measured continuously
Daily 100% Electronic Crediting period +2yrs
P17
Type_HC,II Type of hydrocarbon
Hydrocarbon supplier
- Once 100% Electronic Crediting period +2yrs
Note, in case of the catalytic N2O destruction project at the nitric acid plant Hu-Chems II a SCR DeNOx-unit is already installed prior to the starting date of the project activity. Propane will be used as reducing agent. Hu-Chems III: ID number
Data Variable Source of data Data unit
Measured (m), calculated (c) or estimated (e)
Recording frequency
Proportion of data to be monitored
How will the data be archived? (electronic/ paper)
For how long is achieved data to be kept
Comment
P18
PE_y,III Project emissions
Monitoring system
tCO2e Calculated Annual 100% Electronic Crediting period +2yrs

PROJECT DESIGN DOCUMENT FORM (CDM PDD) - Version 02 CDM – Executive Board page 33
This template shall not be altered. It shall be completed without modifying/adding headings or logo, format or font.
P19
PE_ND,y,III Project emissions from N2O not destroyed
Monitoring system
tCO2e Calculated Annual 100% Electronic Crediting period +2yrs
P20
PE_DF,y,III Project emissions from destruction facility
Monitoring system
tCO2e Calculated Annual 100% Electronic Crediting period +2yrs
P21
PE_N2O,y,III N2O not destroyed by facility
Monitoring system
tN2O Calculated Daily 100% Electronic Crediting period +2yrs
P22
F_TG,I,III Volume flow tail gas at N2O destruction facility
Flow meter m³/h Measured continuously
Daily 100% Electronic Crediting period +2yrs
Flow metering system will automatically record volume flow adjusted to standard temperature and pressure.
P23
CO_N2O,i ,IIII N2O concentration at destruction facility outlet
Monitoring system, measuring device
tN2O/ m³ Measured continuously
Daily 100% Electronic Crediting period +2yrs
P24
M_i,III Measuring Interval
Measuring device, data management system
h Measured continuously
Daily 100% Electronic Crediting period +2yrs

PROJECT DESIGN DOCUMENT FORM (CDM PDD) - Version 02 CDM – Executive Board page 34
This template shall not be altered. It shall be completed without modifying/adding headings or logo, format or font.
P25
PE_HC,y,III Emissions from hydrocarbon use in destruction facility
Monitoring system
tCO2e Calculated Annual 100% Electronic Crediting period +2yrs
P26
HCE_C,y,III Converted hydrocarbon emissions
Monitoring system
tCO2e Calculated Annual 100% Electronic Crediting period +2yrs
P27
Q_HC,y,III Hydrocarbon input (reducing agent)
Measuring device
m³ Measured Daily 100% Electronic Crediting period +2yrs
P28
ρ_HC,III Hydrocarbon density
Certificate hydrocarbon supplier or default value
t/m³ Measured Yearly 100% Electronic Crediting period +2yrs
P29
EF_HC,III Hydrocarbon CO2 emission factor
IPCC
tCO2/t
Calculated Once 100% Electronic Crediting period +2yrs
Propane: 3 tCO2/tC3H8
P30
OXID_HC,III Hydrocarbon oxidation factor
Measuring device
% Measured continuously
Daily 100% Electronic Crediting period +2yrs
P31
Type_HC,III Type of hydrocarbon
Hydrocarbon supplier
- Once 100% Electronic Crediting period +2yrs

PROJECT DESIGN DOCUMENT FORM (CDM PDD) - Version 02 CDM – Executive Board page 35
This template shall not be altered. It shall be completed without modifying/adding headings or logo, format or font.
Note, in case of the catalytic N2O destruction project at the nitric acid plant Hu-Chems III a SCR DeNOx-unit is already installed prior to the starting date of the project activity. Propane will be used as reducing agent. Hu-Chems IV: ID number
Data Variable Source of data Data unit
Measured (m), calculated (c) or estimated (e)
Recording frequency
Proportion of data to be monitored
How will the data be archived? (electronic/ paper)
For how long is achieved data to be kept
Comment
P32
PE_y,IV Project emissions
Monitoring system
tCO2e Calculated Annual 100% Electronic Crediting period +2yrs
P33
PE_ND,y,IV Project emissions from N2O not destroyed
Monitoring system
tCO2e Calculated Annual 100% Electronic Crediting period +2yrs
P34
PE_DF,y,IV Project emissions from destruction facility
Monitoring system
tCO2e Calculated Annual 100% Electronic Crediting period +2yrs
P35
PE_N2O,y,IV N2O not destroyed by facility
Monitoring system
tN2O Calculated Daily 100% Electronic Crediting period +2yrs

PROJECT DESIGN DOCUMENT FORM (CDM PDD) - Version 02 CDM – Executive Board page 36
This template shall not be altered. It shall be completed without modifying/adding headings or logo, format or font.
P36
F_TG,I,IV Volume flow tail gas at N2O destruction facility
Flow meter m³/h Measured continuously
Daily 100% Electronic Crediting period +2yrs
Flow metering system will automatically record volume flow adjusted to standard temperature and pressure.
P37
CO_N2O,i ,IV N2O concentration at destruction facility outlet
Monitoring system, measuring device
tN2O/ m³ Measured continuously
Daily 100% Electronic Crediting period +2yrs
P38
M_i,IV Measuring Interval
Measuring device, data management system
h Measured continuously
Daily 100% Electronic Crediting period +2yrs
Note, in case of the catalytic N2O destruction project at the nitric acid plant Hu-Chems IV a SCR DeNOx-unit is already installed prior to the starting date of the project activity. D.2.1.2. Description of formulae used to estimate project emissions (for each gas, source, formulae/algorithm, emissions units of CO2 equ.) The direct emissions from the project activity are equivalent to the N2O emissions not destroyed plus emissions related to the operation of the N2O destruction facility (emissions from additional ammonia and hydrocarbon input). Project Emissions

PROJECT DESIGN DOCUMENT FORM (CDM PDD) - Version 02 CDM – Executive Board page 37
This template shall not be altered. It shall be completed without modifying/adding headings or logo, format or font.
The emissions due to the project activity are composed of (a) the emissions of not destroyed N2O and (b) emissions from auxiliary ammonia and hydrocarbons input resulting from the operation of the N2O destruction facility. The procedure of determining the project N2O emissions is similar to that used for determining baseline emissions. Project emissions are defined by the following equation: PE_y = PE_y,II + PE_y,III + PE_y,IV = PE_ND,y + PE_DF,y (18) PE_ND,y = PE_ND,y,II + PE_ND,y,III + PE_ND,y,IV (19) PE_DF,y = PE_DF,y,II + PE_DF,y,III + PE_DF,y,IV (20) where: PE_y Project emissions in year y (tCO2e) PE_y,II Project emissions Hu-Chems II in year y (tCO2e) PE_y,III Project emissions Hu-Chems III in year y (tCO2e) PE_y,IV Project emissions Hu-Chems IV in year y (tCO2e) PE_ND,y Project emissions from N2O not destroyed in year y(tCO2e) PE_DF,y Project emissions related to the operation of the destruction facility in year y (tCO2e) PE_ND,y,II Project emissions in year y Hu-Chems II (tCO2e) PE_ND,y,III Project emissions in year y Hu-Chems III (tCO2e) PE_ND,y,IV Project emissions in year y Hu-Chems IV (tCO2e) PE_DF,y,II Project emissions related to the operation of the destruction facility in year y Hu-Chems II (tCO2e) PE_DF,y,III Project emissions related to the operation of the destruction facility in year y Hu-Chems III (tCO2e) PE_DF,y,IV Project emissions related to the operation of the destruction facility in year y Hu-Chems IV (tCO2e) The following equations have to be applied for Hu-Chems II, Hu-Chems III and Hu-Chems IV N2O emissions not destroyed by the project activity: N2O emissions not destroyed by the project activity are calculated based on the continuous measurement of the N2O concentration in the tail gas of the N2O destruction facility and the volume flow rate of the tail gas stream. The emissions of non destroyed N2O are given by: PE_ND,y = PE_N2O,y x GWP_N2O (21)

PROJECT DESIGN DOCUMENT FORM (CDM PDD) - Version 02 CDM – Executive Board page 38
This template shall not be altered. It shall be completed without modifying/adding headings or logo, format or font.
where: PE_ND,y Project emissions from N2O not destroyed in year y(tCO2e) PE_N2O,y Project emissions of N2O in year y (tN2O) GWP_N2O Global warming potential of N20 = 310 n PE_N2O,y = �F_TG,i x CO_N2O,i x M_i (22) i where: PE_N2O,y Project emissions of N2O in year y (tN2O) F_TG,i Volume flow rate tail gas at destruction facility during interval i (m3/h) CO_N2O,i N2O concentration in the tail gas of the N2O destruction facility during interval i (tN2O/m3) M_i Length of measuring interval i (h) i interval n number of intervals during the year Project emissions from the operation of the destruction facility: The operation of the N2O destruction facilities Hu-Chems II and Hu-Chems III require the use of hydrocarbon (propane) as input streams. The emissions related to the operation of the N2O destruction facility are given by on-site emissions due to the hydrocarbons used as input to the N2O destruction facility: PE_DF,y = PE_NH3,y + PE_HC,y (23) where: PE_DF,y Project emissions related to the operation of the destruction facility in year y (tCO2e) PE_NH3,y Project emissions related to ammonia input to destruction facility in year y (tCO2e) PE_HC,y Project emissions related to hydrocarbon input to destruction facility in year y (tCO2e) Ammonia input: In case of Hu-Chems II, III and IV, project emissions related to ammonia input to destruction facilities (PE_NH3,y) are zero. Hydrocarbon Input:

PROJECT DESIGN DOCUMENT FORM (CDM PDD) - Version 02 CDM – Executive Board page 39
This template shall not be altered. It shall be completed without modifying/adding headings or logo, format or font.
Hydrocarbons (propane) are used as reducing agent at Hu-Chems II and Hu-Chems III to enhance the catalytic N2O reduction efficiency. In this case hydrocarbons arecompletely converted to water, carbon monoxide and carbon dioxide. The fraction of the converted hydrocarbons is OXID_HC. PE_HC,y = HCE_C,y + HCE_NC,y (24) where: PE_HC,y Project emissions related to hydrocarbon input to destruction facility in year y (tCO2e) HCE_C,y Converted hydrocarbon emissions in year y (tCO2) HCE_NC,y Methane emissions in year y (tCO2e) For calculation of the GHG emissions related to the hydrocarbons converted, the following formulae are used: HCE_C,y = ��HC x Q_HC,y x EF_HC x OXID_HC/100 (25) where: HCE_C,y Converted hydrocarbon emissions in year y (tCO2e) ��HC Hydrocarbon density (t/m³) Q_HC,y Hydrocarbon input in year y (m³) OXID_HC Oxidation factor of hydrocarbon (%) EF_HC Carbon emission factor of hydrocarbon (tCO2/t HC) The hydrocarbon CO2 emission factor is given by the molecular weights and the chemical reaction when hydrocarbons are converted (carbon emission factor of propane is 3 tCO2/tC3H8). Project emissions are limited to the design capacity of the existing nitric acid plants Hu-Chems II, III and IV. If the actual production of nitric acid (PHNO3,y) exceeds the design capacity (PHNO3,max) then emissions related to the production above PHNO3,max will neither be claimed for the baseline nor for the project scenario.

PROJECT DESIGN DOCUMENT FORM (CDM PDD) - Version 02 CDM – Executive Board page 40
This template shall not be altered. It shall be completed without modifying/adding headings or logo, format or font.
D.2.1.3. Relevant data necessary for determining the baseline of anthropogenic emissions by sources of GHGs within the project boundary and how such data will be collected and archived : Hu-Chems II: ID number
Data Variable Source of data Data unit
Measured (m), calculated (c) or estimated (e)
Recording frequency
Proportion of data to be monitored
How will the data be archived? (electronic/ paper)
For how long is achieved data to be kept
Comment
B1 P_HNO3,y,II Plant output of HNO3
Production reports
tHNO3 Measured Daily 100 % Electronic Crediting period + 2 yrs
B2 QI_N2O,y,II Quantity of N2O at inlet of destruction facility
tN2O Calculated Daily 100 % Electronic Crediting period + 2 yrs
FTG,i and Mi from P5 and P7
B3 CI_N2O,I,II N2O concentration at N2O destruction facility inlet
Monitoring system, measuring device
tN2O/m3 Measured continuous
Daily 100 % Electronic Crediting period + 2 yrs
B4
QR_N2O,y Regulation I: annual quantity N2O limited
National legislation
tN2O
Calculated
Date of regulation
100 %
Electronic
Crediting period + 2 yrs

PROJECT DESIGN DOCUMENT FORM (CDM PDD) - Version 02 CDM – Executive Board page 41
This template shall not be altered. It shall be completed without modifying/adding headings or logo, format or font.
B5 RSE_N2O,y Regulation II: N2O emissions per unit of nitric acid
National legislation
tN2O/t HNO3
Calculated Date of regulation
100 % Electronic Crediting period + 2 yrs
B6 CR_N2O Regulation III: N2O concentration in tail gas limited
National legislation
tN2O/m3 Calculated Date of regulation
100 % Electronic Crediting period + 2 yrs
B7 P_HNO3,hist,II Design capacity
Manufacturer’s specifications
t Measured / calculated
Once 100 % Electronic Crediting period + 2 yrs
B8 T_g,hist,II Historical opera-ting temperature range of the ammonia oxidation reactor
Production reports / manufacturer’s specification
oC Measured / calculated
Once 100 % Electronic Crediting period + 2 yrs
B9 P_g,hist,II Historical operating pressure range of the ammonia oxidation reactor
Production reports / manufacturer’s specifications
Pa Measured / calculated
Once 100 % Electronic Crediting period + 2 yrs
B10 T_g,II Actual operating temperature ammonia oxidation reactor
Measuring device
oC Measured Continuous 100 % Electronic Crediting period + 2 yrs
B11 P_g,II Actual operating pressure ammonia oxidation reactor
Measuring device
Pa Measured Continuous 100 % Electronic Crediting period + 2 yrs

PROJECT DESIGN DOCUMENT FORM (CDM PDD) - Version 02 CDM – Executive Board page 42
This template shall not be altered. It shall be completed without modifying/adding headings or logo, format or font.
B12 Reg_NOx National regulation on NOx emissions
National regulations, Ministry of Environment
tNOx/m3 Calculated Date of regulation
100 % Electronic Crediting period + 2 yrs
B13 G_sup,II Supplier of the ammonia oxidation catalyst
Supplier’s information
- Crediting period + 2 yrs
B14 G_com,II Composition of the ammonia oxidation catalyst
Annual reports, supplier’s information
% Date of changing gauze composition
100 % Electronic Crediting period + 2 yrs
B15 G_sup,hist,II Historical supplier of ammonia oxidation catalyst
Annual reports, supplier’s information
- Once 100 % Electronic Crediting period + 2 yrs
B16 G_com,hist,II Historical composition of the ammonia oxidation catalyst
Supplier’s information
% Date of start of use of catalyst
100 % Electronic Crediting period + 2 yrs
B17 SE_N2O,II N2O emission rate per ton of nitric acid
Monitoring reports
tN2O/t HNO3
Calculated Yearly 100 % Electronic Crediting period + 2 yrs
B18 A_OR,hist,II Max. historical ammonia flow rate to the ammonia oxidation reactor
Production reports / manufacturer’s specifications / literature
tNH3/day Measured / calculated
Once 100 % Electronic Crediting period + 2 yrs

PROJECT DESIGN DOCUMENT FORM (CDM PDD) - Version 02 CDM – Executive Board page 43
This template shall not be altered. It shall be completed without modifying/adding headings or logo, format or font.
B19 A_OR,d,II Actual ammonia flow rate to the ammonia oxidation reactor
Measuring device
tNH3/day Measured Continuous 100 % Electronic Crediting period + 2 yrs
Hu-Chems III: ID number
Data Variable Source of data Data unit
Measured (m), calculated (c) or estimated (e)
Recording frequency
Proportion of data to be monitored
How will the data be archived? (electronic/ paper)
For how long is achieved data to be kept
Comment
B20 P_HNO3,y,III Plant output of HNO3
Production reports
tHNO3 Measured Daily 100 % Electronic Crediting period + 2 yrs
B21 QI_N2O,y,III Quantity of N2O at inlet of destruction facility
tN2O Calculated Daily 100 % Electronic Crediting period + 2 yrs
FTG,i and Mi from P5 and P7
B22 CI_N2O,I,III N2O concentration at N2O destruction facility inlet
Monitoring system, measuring device
tN2O/m3 Measured continuous
Daily 100 % Electronic Crediting period + 2 yrs

PROJECT DESIGN DOCUMENT FORM (CDM PDD) - Version 02 CDM – Executive Board page 44
This template shall not be altered. It shall be completed without modifying/adding headings or logo, format or font.
B23 T_g,hist,III Historical opera-ting temperature range of the ammonia oxidation reactor
Production reports / manufacturer’s specification
oC Measured / calculated
Once 100 % Electronic Crediting period + 2 yrs
B24 P_g,hist,III Historical operating pressure range of the ammonia oxidation reactor
Production reports / manufacturer’s specifications
Pa Measured / calculated
Once 100 % Electronic Crediting period + 2 yrs
B25 T_g,III Actual operating temperature ammonia oxidation reactor
Measuring device
oC Measured Continuous 100 % Electronic Crediting period + 2 yrs
B26 P_g,III Actual operating pressure ammonia oxidation reactor
Measuring device
Pa Measured Continuous 100 % Electronic Crediting period + 2 yrs
B27 G_sup,III Supplier of the ammonia oxidation catalyst
Supplier’s information
- Crediting period + 2 yrs
B28 G_com,III Composition of the ammonia oxidation catalyst
Annual reports, supplier’s information
% Date of changing gauze composition
100 % Electronic Crediting period + 2 yrs
B29 G_sup,hist,III Historical supplier of ammonia oxidation catalyst
Annual reports, supplier’s information
- Once 100 % Electronic Crediting period + 2 yrs

PROJECT DESIGN DOCUMENT FORM (CDM PDD) - Version 02 CDM – Executive Board page 45
This template shall not be altered. It shall be completed without modifying/adding headings or logo, format or font.
B30 G_com,hist,III Historical composition of the ammonia oxidation catalyst
Supplier’s information
% Date of start of use of catalyst
100 % Electronic Crediting period + 2 yrs
B31 SE_N2O,III N2O emission rate per ton of nitric acid
Monitoring reports
tN2O/t HNO3
Calculated Yearly 100 % Electronic Crediting period + 2 yrs
B32 A_OR,hist,III Max. historical ammonia flow rate to the ammonia oxidation reactor
Production reports / manufacturer’s specifications / literature
tNH3/day Measured / calculated
Once 100 % Electronic Crediting period + 2 yrs
B33 A_OR,d,III Actual ammonia flow rate to the ammonia oxidation reactor
Measuring device
tNH3/day Measured Continuous 100 % Electronic Crediting period + 2 yrs
Hu-Chems IV: ID number
Data Variable Source of data Data unit
Measured (m), calculated (c) or estimated (e)
Recording frequency
Proportion of data to be monitored
How will the data be archived? (electronic/ paper)
For how long is achieved data to be kept
Comment

PROJECT DESIGN DOCUMENT FORM (CDM PDD) - Version 02 CDM – Executive Board page 46
This template shall not be altered. It shall be completed without modifying/adding headings or logo, format or font.
B34 P_HNO3,y,IV Plant output of HNO3
Production reports
tHNO3 Measured Daily 100 % Electronic Crediting period + 2 yrs
B35 QI_N2O,y,IV Quantity of N2O at inlet of destruction facility
tN2O Calculated Daily 100 % Electronic Crediting period + 2 yrs
FTG,i and Mi from P5 and P7
B36 CI_N2O,I,IV N2O concentration at N2O destruction facility inlet
Monitoring system, measuring device
tN2O/m3 Measured continuous
Daily 100 % Electronic Crediting period + 2 yrs
B37 P_HNO3,hist,IV Design capacity
Manufacturer’s specifications
t Measured / calculated
Once 100 % Electronic Crediting period + 2 yrs
B38 T_g,hist,IV Historical opera-ting temperature range of the ammonia oxidation reactor
Production reports / manufacturer’s specification
oC Measured / calculated
Once 100 % Electronic Crediting period + 2 yrs
B39 P_g,hist,IV Historical operating pressure range of the ammonia oxidation reactor
Production reports / manufacturer’s specifications
Pa Measured / calculated
Once 100 % Electronic Crediting period + 2 yrs
B40 T_g,IV Actual operating temperature ammonia oxidation reactor
Measuring device
oC Measured Continuous 100 % Electronic Crediting period + 2 yrs

PROJECT DESIGN DOCUMENT FORM (CDM PDD) - Version 02 CDM – Executive Board page 47
This template shall not be altered. It shall be completed without modifying/adding headings or logo, format or font.
B41 P_g,IV Actual operating pressure ammonia oxidation reactor
Measuring device
Pa Measured Continuous 100 % Electronic Crediting period + 2 yrs
B42 G_sup,IV Supplier of the ammonia oxidation catalyst
Supplier’s information
- Crediting period + 2 yrs
B43 G_com,IV Composition of the ammonia oxidation catalyst
Annual reports, supplier’s information
% Date of changing gauze composition
100 % Electronic Crediting period + 2 yrs
B44 G_sup,hist,IV Historical supplier of ammonia oxidation catalyst
Annual reports, supplier’s information
- Once 100 % Electronic Crediting period + 2 yrs
B45 G_com,hist,IV Historical composition of the ammonia oxidation catalyst
Supplier’s information
% Date of start of use of catalyst
100 % Electronic Crediting period + 2 yrs
B46 SE_N2O,IV N2O emission rate per ton of nitric acid
Monitoring reports
tN2O/t HNO3
Calculated Yearly 100 % Electronic Crediting period + 2 yrs
B47 A_OR,hist,IV Max. historical ammonia flow rate to the ammonia oxidation reactor
Production reports / manufacturer’s specifications / literature
tNH3/day Measured / calculated
Once 100 % Electronic Crediting period + 2 yrs

PROJECT DESIGN DOCUMENT FORM (CDM PDD) - Version 02 CDM – Executive Board page 48
This template shall not be altered. It shall be completed without modifying/adding headings or logo, format or font.
B48 A_OR,d,IV Actual ammonia flow rate to the ammonia oxidation reactor
Measuring device
tNH3/day Measured Continuous 100 % Electronic Crediting period + 2 yrs
D.2.1.4. Description of formulae used to estimate baseline emissions (for each gas, source, formulae/algorithm, emissions units of CO2 equ.) Baseline emissions of the project activity are determined based on the quantity of N2O emitted in the baseline scenario, taking national regulations, production levels and operating conditions into consideration. The quantity of N2O is determined based on the measurement of the N2O at the inlet of the N2O destruction facility (EnviNOx®-System), which results in a conservative estimation of baseline emissions. The N2O baseline emissions monitoring equipment will measure (1) the tail gas volume flow rate (temperature and pressure are also measured and the volume flow rate is automatically adjusted to standard temperature and pressure), (2) the N2O concentration at the inlet of the EnviNOx®-System, (3) the output of nitric acid and (4) the operating conditions of the ammonia oxidation reactor (temperature, pressure, ammonia flow rate). The amount of N2O baseline emissions can then directly be calculated by multiplying the tail gas volume flow rate and the N2O concentration or if the actual operating parameters and pressure are outside the range of permitted operating parameters by applying conservative default values. The baseline emissions are limited to the historical production levels of the existing nitric acid plant. Baseline Emissions Baseline emissions are given by the following equation: BE_y = BE_y,II + BE_y,III + BE_y,IV = BE_N2O x GWP_N2O (26) BE_N2O = BE_N2O,II + BE_N2O,III + BE_N2O,IV (27) where: BE_y Baseline emissions in year y (tCO2e) BE_y,II Baseline emissions Hu-Chems II in year y (tCO2e) BE_y,III Baseline emissions Hu-Chems III in year y (tCO2e) BE_y,IV Baseline emissions Hu-Chems IV in year y (tCO2e) BE_N2O,y Baseline emissions of N2O in year y (tN2O)

PROJECT DESIGN DOCUMENT FORM (CDM PDD) - Version 02 CDM – Executive Board page 49
This template shall not be altered. It shall be completed without modifying/adding headings or logo, format or font.
GWP_N2O Global warming potential of N2O = 310 BE_N2O,II Baseline emissions of N2O in year y at Hu-Chems II (tN2O) BE_N2O,III Baseline emissions of N2O in year y at Hu-Chems III (tN2O) BE_N2O,IV Baseline emissions of N2O in year y at Hu-Chems IV (tN2O) The following equations have to be applied for Hu-Chems II, Hu-Chems III and Hu-Chems IV Depending on the implementation of regulations on N2O emissions and the character of the regulation, baseline N2O emissions (BEN2O,y) are calculated as shown below: Case 1: The most plausible baseline scenario is that no N2O would be abated in the absence of the project activity (i.e. no secondary or tertiary reductions measures and no NSCR DeNOx unit would be installed). BE_N2O,y = QI_N2O,y (28) where: BE_N2O,y Baseline emissions of N2O in year y (tN2O) QI_N2O,y Quantity of N2O supplied to the destruction facility in year y (tN2O) The quantity of N2O supplied to the N2O destruction facility (DF) is calculated based on continuous measurement of the tail gas volume flow rate and the N2O concentration at the inlet of the N2O destruction facility. Therefore the quantity of the N2O at the inlet is given by: n QI_N2O,y = �F_TG,i x CI_N2O,i x M_i (29) i where: QI_N2O,y Quantity of N2O emissions at the inlet of the destruction facility in year y (tN2O) F_TG,i Volume flow rate at the inlet of the destruction facility during interval i (m3/h) CI_N2O,i N2O concentration at destruction facility inlet during interval i (tN2O/m3) M_i Length of measuring interval i (h) i Interval n Number of intervals during the year

PROJECT DESIGN DOCUMENT FORM (CDM PDD) - Version 02 CDM – Executive Board page 50
This template shall not be altered. It shall be completed without modifying/adding headings or logo, format or font.
Baseline emissions are limited to the design capacity of the existing nitric acid plant. If the actual production of nitric acid (PHNO3,y) exceeds the design capacity (PHNO3,max) then emissions related to the production above PHNO3,max will neither be claimed for the baseline nor for the project scenario. If, P_HNO3,y > P_HNO3,max (30)
then
BE_N2O,y = SE_N2O,y x P_HNO3,max (31) where: BE_N2O,y Baseline emissions of N2O in year y (tN2O) SE_N2O,y Specific N2O emissions per output nitric acid in year y (tN2O/tHNO3) P_HNO3,max Design capacity (tHNO3) The specific N2O emissions per unit of output nitric acid is defined as: SE_N2O,y = QI_N2O,y / P_HNO3,y (32) where: SE_N2O,y Specific N2O emissions per output nitric acid in year y (tN2O/tHNO3) QI_N2O,y Quantity of N2O emissions at the inlet of the destruction facility in year y (tN2O) P_HNO3,y Production of nitric acid in year y (tHNO3) Case 2: Legal regulations for N2O are implemented: In case national regulations concerning N2O emissions are implemented during the crediting period, the impact on baseline N2O emissions is considered without any delay by adjusting the measured N2O emissions at the time the regulation has to be implemented. Depending on the character of the regulation the adjustment is done as shown below: Case 2.1: Regulation setting of a threshold for an absolute quantity of N2O emissions per nitric acid plant over a given time period: Baseline N2O emissions are limited by the absolute quantity of N2O emissions given by the regulation. If the measured baseline N2O emissions are exceeding the regulatory limit, then measured baseline N2O emissions are substituted by the regulatory limit. This leads to the following condition: If, QI_N2O,y > QR_N2O,y (33) then, BE_N2O,y = QR_N2O,y (34) else,

PROJECT DESIGN DOCUMENT FORM (CDM PDD) - Version 02 CDM – Executive Board page 51
This template shall not be altered. It shall be completed without modifying/adding headings or logo, format or font.
BE_N2O,y = min of [QI_N2O,y ,SE_N2O,y x P_HNO3,max] (35) where: QI_N2O,y Quantity of N2O emissions at the inlet of the destruction facility in year y (tN2O) QR_N2O,y Regulatory limit of N2O emissions in year y (tN2O) BE_N2O,y Baseline emissions of N2O in year y (tN2O) SE_N2O,y Specific N2O emissions per output nitric acid in year y (tN2O/tHNO3) P_HNO3,y Production of nitric acid in year y (tHNO3) The quantity of N2O emissions at the inlet of the N2O destruction facility (DF) is calculated based on continuous measurement of the tail gas volume flow rate and the N2O concentration at the inlet of the N2O destruction facility (see equation 11). Case 2.2: Regulation setting of a threshold for specific N2O emissions per unit of product: This leads to the following condition: If, SE_N2O,y > RSE_N2O (36) then, BE_N2O,y = min of [RSE_N2O x P_HNO3,y , SE_N2O,y x P_HNO3,max] (37) else, BE_N2O,y = min of [QI_N2O,y ,SE_N2O,y x P_HNO3,max] (38) where: SE_N2O,y Specific N2O emissions per output nitric acid in year y (tN2O/tHNO3) RSE_N2O Regulatory limit of N2O emissions per output nitric acid (tN2O/tHNO3) BE_N2O,y Baseline emissions of N2O in year y (tN2O) P_HNO3,y Production of nitric acid in year y (tHNO3) QI_N2O,y Quantity of N2O emissions at the inlet of the destruction facility in year y (tN2O) The specific N2O emissions per unit of output nitric acid are defined as: SE_N2O,y = QI_N2O,y / P_HNO3,y (39) where: SE_N2O,y Specific N2O emissions per output nitric acid in year y (tN2O/tHNO3) QI_N2O,y Quantity of N2O emissions at the inlet of the destruction facility in year y (tN2O)

PROJECT DESIGN DOCUMENT FORM (CDM PDD) - Version 02 CDM – Executive Board page 52
This template shall not be altered. It shall be completed without modifying/adding headings or logo, format or font.
P_HNO3,y Production of nitric acid in year y (tHNO3) The quantity of N2O emissions at the inlet of the N2O destruction facility is calculated based on continuous measurement of the tail gas volume flow rate and the N2O concentration at the inlet of the N2O destruction facility (see equation 11).

PROJECT DESIGN DOCUMENT FORM (CDM PDD) - Version 02 CDM – Executive Board page 53
This template shall not be altered. It shall be completed without modifying/adding headings or logo, format or font.
Case 2.3: Regulation setting of a threshold for N2O concentration in the tail gas This leads to the following condition: If, C_N2O,y > CR_N2O (40) then n BE_N2O,y = �C_N2O,i x [F_TG,i x M_i] (41) i where C_N2O,i is min [C_N2O,y, CR_N2O, and {(SE_N2O,y x P_HNO3,max)/(sum(F_TG,I*M_i)}] else, BE_N2O,y = QI_N2O,y (42) where: C_N2O,i N2O concentration at destruction facility inlet during interval i (tN2O/m3) CR_N2O,i Regulatory limit for specific N2O concentration during interval I (tN2O/m3) BE_N2O,y Baseline emissions of N2O in year y (tN2O) F_TG,i Volume flow rate of tail gas at destruction facility during interval i (m3/h) M_i Length of measuring interval i (h) i Interval n Number of intervals during the year QI_N2O,y Quantity of N2O emissions at the inlet of the destruction facility in year y (tN2O) The quantity of N2O emissions at the inlet of the N2O destruction facility is calculated based on continuous measurement of the tail gas volume flow rate and the N2O concentration at the inlet of the N2O destruction facility (see equation 11). Change in NOx or N2O regulations will automatically cause a re-assessment of the baseline scenario. Procedures used to determine the permitted operating conditions of the nitric acid plant s: In order to avoid that the operation of the nitric acid production plant is manipulated in a way to increase the N2O generation, thereby increasing the CERs, the following procedures relating to the operating temperature and pressure and the use of ammonia oxidation catalysts shall be applied. 1. Operating temperature and pressure of the ammonia oxidation reactor (AOR):

PROJECT DESIGN DOCUMENT FORM (CDM PDD) - Version 02 CDM – Executive Board page 54
This template shall not be altered. It shall be completed without modifying/adding headings or logo, format or font.
If the actual average daily operating temperature or pressure in the ammonia oxidation reactor (Tg and Pg) are outside a “permitted range” of operating temperatures and pressures (Tg,hist and Pg,hist), the baseline emissions are calculated for the respective time period based on lower value between (a) the conservative IPCC default values of 4.05 kg N2O/ton nitric acid, (b) SEN2O,y and (c) any related value as a result of legal regulations (e.g. RSEN2O,y). Required monitoring parameters: T_g,d Actual operating temperature AOR on day d (°C) P_g,d Actual operating pressure AOR on day d (Pa) T_g,hist Historical operating temperature range AOR (°C) P_g,hist Historical operating pressure range AOR (Pa) In order to determine the “permitted range” of the operating temperature and pressure in the ammonia oxidation reactor, the project applicant has the obligation to determine the operating temperature and pressure range by:
a) Firstly, data on historical temperature and pressure ranges; or, if no data on historical temperatures and pressures are available, then b) Secondly, by range of temperature and pressure stipulated in the operating manual for the existing equipment; or, if no operating manual is available or
the operating manual gives insufficient information, then c) Thirdly, by literature reference (e.g. from Ullmann’s Encyclopedia of Industrial Chemistry, Fifth, completely revised edition, Volume A 17, VCH, 1991,
P. 298, Table 3. or other standard reference work or literature source).
If historical data on daily operating temperatures and pressures are available (i.e. case a), statistical analysis shall be used for determining the permitted range of operating temperature and pressure. To exclude the possibility of manipulating the process, outliers of historical operating temperature and pressure shall be eliminated by statistical methods. Therefore, the time series data are interpreted as a sample from a stochastic variable. All data that are part of the 2.5% Quantile or that are part of the (100-2.5)% Quantile of the sample distribution are defined as outliers and shall be eliminated. The permitted range of operating temperature and pressure is then calculated based on the remaining historical minimum and maximum operating conditions. If a permissible operating limit is exceeded, the baseline N2O emissions for that period are capped at the conservative IPCC default value of 4.05 kg N2O/tHNO3. 2. Composition of ammonia oxidation catalyst: The plant operator is allowed to use compositions of ammonia oxidation catalysts that are common practice in the region or have been used in the nitric acid plant during the last three years without limitation of N2O baseline emissions. In case the nitric acid plant operator wishes to change to a composition not used during the last three years, but is common practice in the region and supplied by a reputable manufacturer, or if it corresponds to a composition that is reported as being in use in the relevant literature, the plant operator is allowed to use these ammonia oxidation catalysts without limitation of N2O baseline emissions.

PROJECT DESIGN DOCUMENT FORM (CDM PDD) - Version 02 CDM – Executive Board page 55
This template shall not be altered. It shall be completed without modifying/adding headings or logo, format or font.
In case the nitric acid plant operator changes the composition of ammonia oxidation catalysts and the composition is not common practice in the region and not reported as being in use in the relevant literature, the project applicant has to demonstrate (either by economic or other arguments) that the choice of the new composition was based on considerations other than an attempt to increase the rate of N2O production. If the project applicant can demonstrate appropriate and verifiable reasons, the plant operator is allowed to use new ammonia oxidation catalysts without limitation of N2O baseline emissions. The first composition of ammonia oxidation catalyst used during the crediting period shall be of the same kind of catalyst composition already in operation in the specific nitric acid plant. This is to avoid gaming at the beginning of the project activity. In case the nitric acid plant operator changes the composition of ammonia oxidation catalysts and the composition is not common practice in the region and not reported as being in use in the relevant literature, and the project applicant cannot demonstrate appropriate and verifiable reasons for this, baseline emissions are limited to the maximum specific N2O emissions of previous periods (tN2O/tHNO3), documented in the verified monitoring reports. Required monitoring parameters: G_sup Supplier of the ammonia oxidation catalyst G_sup,hist Historical supplier of the ammonia oxidation catalyst G_com Composition of the ammonia oxidation catalyst G_com,hist Historical composition of the ammonia oxidation catalyst SE_N2O,y Specific N2O emissions per ton HNO3 in year y (tN2O/tHNO3) 3. Ammonia flow rate to the ammonia oxidation reactor: If the actual daily ammonia flow rate exceeds the (upper) limit on maximum historical daily permitted ammonia flow rate, the baseline emissions for this operating day are calculated based on the conservative IPCC default values and are limited by the legal regulations. The upper limit on ammonia flow should be determined based on:
a) historical operating data on maximum daily average ammonia flow; or, if not existing, on b) calculation of the maximum ammonia flow rate allowed as specified by ammonia oxidation catalyst manufacturer or on typical catalyst loadings; or, if
not existing, c) based on the literature.
If the daily ammonia input to the oxidation reactor exceeds the limit on permissible ammonia input, baseline N2O emissions are capped at conservative IPCC default values. Required monitoring parameters on daily basis: A_OR,d Actual ammonia input to oxidation reactor (tNH3/day) A_OR,hist Maximum historical ammonia input to oxidation reactor (tNH3/day)

PROJECT DESIGN DOCUMENT FORM (CDM PDD) - Version 02 CDM – Executive Board page 56
This template shall not be altered. It shall be completed without modifying/adding headings or logo, format or font.
D. 2.2. Option 2: Direct monitoring of emission reductions from the project activity (values should be consistent with those in section E). Not applicable, Option 1 is chosen. D.2.2.1. Data to be collected in order to monitor emissions from the project activity, and how this data will be archived: ID number(Please use numbers to ease cross-referencing
to table D.3)
Data variable
Source of data
Data unit
Measured (m), calculated (c), estimated (e),
Recording frequency
Proportion of data to
be monitored
How will the data be archived? (electronic/
paper)
Comment
D.2.2.2. Description of formulae used to calculate project emissions (for each gas, source, formulae/algorithm, emissions units of CO2 equ.): Not applicable, Option 1 is chosen.

PROJECT DESIGN DOCUMENT FORM (CDM PDD) - Version 02 CDM – Executive Board page 57
This template shall not be altered. It shall be completed without modifying/adding headings or logo, format or font.
D.2.3. Treatment of leakage in the monitoring plan D.2.3.1. If applicable, please describe the data and information that will be collected in order to monitor leakage effects of the project activity ID number(Please use numbers to ease cross-referencing to table D.3)
Data variable
Source of data Data
unit
Measured (m), calculated (c) or estimated (e)
Recording frequency
Proportion of data to be monitored
How will the data be archived? (electronic/ paper)
Comment
D.2.3.2. Description of formulae used to estimate leakage (for each gas, source, formulae/algorithm, emissions units of CO2 equ.) At the nitric acid plants Hu-Chems II, III and IV energy converters (tail gas turbines) are installed at the end of the pipe. The installation of the N2O destruction facilities will therefore not result in significant additional energy consumption and no leakage is expected. Therefore no monitoring mechanism is being suggested. D.2.4. Description of formulae used to estimate emission reductions for the project activity (for each gas, source, formulae/algorithm, emissions units of CO2 equ.) The emission reduction (ER_y) by the project activity during a given year y is the difference between the baseline emissions (BE_y) and project emissions (PE_y), as follows: ER_y = BE_y – PE_y – LE_y (43) where: ER_y emissions reductions of the project activity during the year y (tCO2e) BE_y baseline emissions during the year y (tCO2e) PE_y project emissions during the year y (tCO2e) LE_y leakage emissions in year y (tCO2e)

PROJECT DESIGN DOCUMENT FORM (CDM PDD) - Version 02 CDM – Executive Board page 58
This template shall not be altered. It shall be completed without modifying/adding headings or logo, format or font.
D.3. Quality control (QC) and quality assurance (QA) procedures are being undertaken for data monitored Data (Indicate table and ID number e.g. 3.-1.; 3.2.)
Uncertainty level of data (High/Medium/Low)
Explain QA/QC procedures planned for these data, or why such procedures are not necessary.
B.1, B20, B34 Low Measurement devices will be subject to regular calibration, maintenance and testing regime to ensure accuracy (according to manufacturer instructions) Check at the beginning of the project, e.g.
• The product acid flow meter (and online density meter, if installed) has been calibrated at the manufacturer’s works; the calibration certificate shall be documented.
• The product acid flow meter (and online density meter, if installed) has been installed and is being operated in accordance with the manufacturer’s instruction.
Regular check during the project lifetime, e.g.
• Maintenance and checking are carried out as specified by the flow meter (and online density meter, if applicable) manufacturer. All work carried out is to be documented.
• The acid density and concentration is measured regularly and compared with any online measurements. If the acid density / concentration measurement is made by means of a portable device the portable device is to be compared with laboratory results, or calibrated at supplier-specified intervals. All observations are to be recorded. If deviations are found appropriate remedial action is to be taken.
• Plausibility checks may be made on a regular basis based on the ammonia nitrogen balance of the plant. (e.g. the input of ammonia nitrogen is the ammonia flow to the ammonia oxidation reactor. The outputs are N2O at the inlet of the N2O destruction facility and NOx at the inlet of the N2O destruction facility if no SCR is installed, otherwise an estimate can be made of the NOx at the inlet of the SCR. The major output is product acid. An assumption must be made about the amount of ammonia nitrogen converted to elemental nitrogen, N2. Before carrying out a plausibility check of this kind, the nitric acid plant should be operated at constant conditions for several hours or a day to minimise the effects of tower sump pumpout and time delays between the ammonia oxidation reactor and the product nitric acid.)
QA/QC shall be integrated in companies’ quality management systems (e.g. ISO, EMAS)
B.10, B25, B38 B11, B26, B41
Low Regular calibration, maintenance and testing regime according to manufacturer instruction

PROJECT DESIGN DOCUMENT FORM (CDM PDD) - Version 02 CDM – Executive Board page 59
This template shall not be altered. It shall be completed without modifying/adding headings or logo, format or font.
P.8, P22, P36 Low Flow meter will be subject to regular calibration, maintenance and testing regime to ensure accuracy (according to manufacturer instructions)
P9, P23, P37 B3, B22, B36
Low N2O concentration measurement devices will be subject to regular calibration, maintenance and testing regime to ensure accuracy.
P10, P24, P38 Low Meters for measuring intervals will be subject to regular calibration, maintenance and testing regime to ensure accuracy.
P13, P27 B17, B31, B46
Low Meters will be subject to regular calibration, maintenance and testing regime to ensure accuracy.
D.4 Please describe the operational and management structure that the project operator will implement in order to monitor emission reductions and any leakage effects, generated by the project activity Hu-Chems will operate the EnviNOx®-System and the measurement equipment. The company has been operating the nitric acid plants plant since the commissioning of the plant and has sufficient and well experienced staff to operate similar technologies (like the existing DeNOx.-unit). The company is ISO 9002 and ISO 14001 certified and received the Korean safety and health management system certificate (KGS18001 & OHSAS18001). The measurement equipment will be calibrated on regular intervals as recommended by the manufacturers. Additionally, selected staff of Hu-Chems will be trained to operate the EnviNOx®-System as well as the measurement equipment. CARBON will conclude a contract with UHDE as well as the providers of the measurement equipment for a continuously supervision and maintenance of the EnviNOx®-System as well as the measurement equipment. In case of any error the technology providers have the contractual obligations to set activities on site within 48 hours.

PROJECT DESIGN DOCUMENT FORM (CDM PDD) - Version 02 CDM – Executive Board page 60
This template shall not be altered. It shall be completed without modifying/adding headings or logo, format or font.
D.5 Name of person/entity determining the monitoring methodology:
(The following are not project participants) Name Project Participant Yes / No CARBON Projektentwicklung GmbH A-3485 Grunddorf 68 AUSTRIA Tel. +43 2735 77 135 Fax. +43 2735 20 531 Gerald Dunkel, Ferdinand Heilig Email: [email protected] Email: [email protected]
NO

PROJECT DESIGN DOCUMENT FORM (CDM PDD) - Version 02 CDM – Executive Board page 61
This template shall not be altered. It shall be completed without modifying/adding headings or logo, format or font.
SECTION E. Estimation of GHG emissions by sources E.1. Estimate of GHG emissions by sources: The anthropogenic emissions of the proposed project activity within the project boundary consist of the emissions of non destroyed N2O and emissions from hydrocarbon input related to the operation of the N2O destruction facility. Ex-ante estimation of project emissions is made by projecting nitric acid output, N2O formation, efficiency of the catalytic N2O destruction process as well as the demand of hydrocarbon. Estimation is for reference purposes only, actual project and baseline emissions will be determined on measurement results on an ex-post basis. In case of the Hu-Chems project SCR DeNOx-units are already installed prior to the starting date of the CDM project at the nitric acid plants Hu-Chems II, III, IV. Therefore the operation of the project activity does not require additional ammonia inputs. In case of Hu-Chems II and Hu-Chems III nitric acid plants additional hydrocarbon (propane) input will be required in order to enhance the catalytic N2O destruction efficiency. Therefore additional hydrocarbon input will be taken into account and monitored. Assuming a conservative 94% N2O destruction rate and a conservative specific N2O formation rate, ex-ante estimations will result in conservative estimation of project emissions (rather overestimation than underestimation). Given the projected nitric acid production, volume flow rate of the tail gas, N2O concentration in the tail gas at the outlet of the EnviNOx®-system, the efficiency of the EnviNOx®-System and the hydrocarbon input, total project emissions are estimated at about 84,000 tCO2e per year. E.2. Estimated leakage: In case of the project activity no leakage is expected. E.3. The sum of E.1 and E.2 representing the project activity emissions: With no leakage overall emission of the project are described in chapter E.1. E.4. Estimated anthropogenic emissions by sources of greenhouse gases of the baseline: Baseline emissions are estimated based on the quantity of N2O emitted in the baseline scenario, taking national regulations into account.

PROJECT DESIGN DOCUMENT FORM (CDM PDD) - Version 02 CDM – Executive Board page 62
This template shall not be altered. It shall be completed without modifying/adding headings or logo, format or font.
Ex-ante estimation of baseline emission is made by projecting the nitric acid output and the N2O formation. Estimations are for reference purposes only, actual baseline emissions will be determined on measurement results on an ex-post basis. At present there are no national regulations on N2O emissions in the Republic of Korea. Furthermore it is unlikely that any limits on N2O emissions will be imposed in the near future. However, national regulations will be monitored and taken into account. Given the projected nitric acid production, volume flow rate of the tail gas and the N2O concentration in the tail gas, the baseline emissions are estimated at about 1,365,000 tCO2e per year. E.5. Difference between E.4 and E.3 representing the emission reductions of the project activity: The GHG emission reduction achieved by the project activity during a given year is the difference between the total GHG emissions in the baseline and the project emissions. Please note, in case of the proposed project activity, leakage is zero. The implementation of the project activity will result in GHG emission reductions of about 1.28 million tCO2e per year. The global warming potential of N2O is set at 310 according to the Kyoto Protocol rules. These ex-ante emission reduction estimations are for reference purposes only, since emission reductions will be determined on an ex-post basis by monitoring the actual baseline and project emissions once the project activity is operational. Ex-post determination of baseline emissions generates the most accurate N2O emission data and the most reliable monitoring system. Table 1: Emission Reduction Summary Hu-Chems II:
Emission Summary Unit 2007% of BL GHG
Emissions
Baseline emissions BE_y,II tCO2e 351,646 100.00%
Project emissions related to the operation of the DF PE_DF_y,II tCO2e 1,150 0.33%
Project emissions from N2O not destroyed PE_ND_y,II tCO2e 21,099 6.00%
Project emissions PE_y,II tCO2e 22,249 6.33%
Total Leakage GHG Emissions LE_y,II tCO2e 0 0.00%
Total GHG Emissions Reduction ER_y,II tCO2e 329,397 93.67% Hu-Chems III:
Emission Summary Unit 2007% of BL GHG
Emissions
Baseline emissions BE_y,III tCO2e 351,646 100.00%
Project emissions related to the operation of the DF PE_DF_y,III tCO2e 1,150 0.33%
Project emissions from N2O not destroyed PE_ND_y,III tCO2e 21,099 6.00%
Project emissions PE_y,III tCO2e 22,249 6.33%
Total Leakage GHG Emissions LE_yIII tCO2e 0 0.00%
Total GHG Emissions Reduction ER_y,III tCO2e 329,397 93.67%

PROJECT DESIGN DOCUMENT FORM (CDM PDD) - Version 02 CDM – Executive Board page 63
This template shall not be altered. It shall be completed without modifying/adding headings or logo, format or font.
Hu-Chems IV:
Emissions Summary Unit 2007% of BL GHG
Emissions
Baseline emissions BE_y,IV tCO2e 661,313 100.00%
Project emissions related to the operation of the DF PE_DF_y,IV tCO2e 0 0.00%
Project emissions from N2O not destroyed PE_ND_y,IV tCO2e 39,679 6.00%
Project emissions PE_y,IV tCO2e 39,679 6.00%
Total Leakage GHG Emissions L_E_y,IV tCO2e 0 0.00%
Total GHG Emissions Reduction ER_y,IV tCO2e 621,634 94.00% E.6. Table providing values obtained when applying formulae above: Table: Ex-ante emission reduction estimation 2006 – 2013 Year Estimation of Project
Activity Emissions (tonnes of CO2e)
Estimation of Baseline Emissions (tonnes of CO2 e)
Estimation of Leakage (tonnes of CO2e)
Estimation of Emission Reductions (tonnes of CO2 e)
2006 3,307 55,109 0 51,803 2007 84,176 1,364,605 0 1,280,429 2008 84,176 1,364,605 0 1,280,429 2009 84,176 1,364,605 0 1,280,429 2010 84,176 1,364,605 0 1,280,429 2011 84,176 1,364,605 0 1,280,429 2012 84,176 1,364,605 0 1,280,429 2013 77,162 1,250,888 0 1,173,726 Total (tonnes of CO2 e) 585,526 9,493,627 0 8,908,101

PROJECT DESIGN DOCUMENT FORM (CDM PDD) - Version 02 CDM – Executive Board page 64
This template shall not be altered. It shall be completed without modifying/adding headings or logo, format or font.
SECTION F. Environmental impacts F.1. Documentation on the analysis of the environmental impacts, including transboundary impacts: The catalytic N2O destruction project in the tail gas of the Nitric Acid Plants Hu-Chems II, Hu-Chems III and Hu-Chems IV is a sustainable project that contributes to the environmental, economic and social benefits in the Republic of Korea. Environmental Impacts: The ex-ante GHG emission reduction is estimated to be about 8.91 million tons of CO2e. Additionally, the EnviNOx®-System takes over the function of the DeNOx-unit at Hu-Chems IV as it too accomplishes the reduction of NOx with ammonia. As far as the amount of NOx removal is concerned the performance of the EnviNOx®-System is at least as good as the existing DeNOx-System (additional environmental benefit in expected). NOx emissions at Hu-Chems II and Hu-Chems III will also be reduced. No further environmental impacts are expected. No transboundary impacts are expected. F.2. If environmental impacts are considered significant by the project participants or the host Party, please provide conclusions and all references to support documentation of an environmental impact assessment undertaken in accordance with the procedures as required by the host Party: Not applicable, as no environmental impact assessment is required.

PROJECT DESIGN DOCUMENT FORM (CDM PDD) - Version 02 CDM – Executive Board page 65
This template shall not be altered. It shall be completed without modifying/adding headings or logo, format or font.
SECTION G. Stakeholders’ comments G.1. Brief description how comments by local stakeholders have been invited and compiled: CARBON has carried out investigation on the local stakeholder comments on the proposed project activity in the formats of issuing questionnaires to introduce the aims and characteristics of the project and addressing in particular its potential environmental impacts. A local stakeholder conference has been held by CARBON and HU-CHEMS for the residents living near the proposed project at the City-Hall of Yeosu on 17th of February 2006. 103 participants attended the stakeholder conference, questionnaires were distributed and 59 had been returned. Local public stakeholders were invited to the stakeholder meeting via announcement in local newspaper and personal invitation to the neighbours and companies around the area of Hu-Chems. Furthermore local organizations and the Korean DNA were invited. Stakeholder Meeting: City-Hall Yeosu – 17/02/2005

PROJECT DESIGN DOCUMENT FORM (CDM PDD) - Version 02 CDM – Executive Board page 66
This template shall not be altered. It shall be completed without modifying/adding headings or logo, format or font.
G.2. Summary of the comments received: Translation of Environmental Stakeholder Consultation Meeting Minutes:
Statistics of Stakeholder's Conference for CDM Project
1. Date : February 17, 2006.
2. Location : At a conference room of Yeosu city hall
3. Number of Attendants.
Classification Number
Local Governmental Organisations 15
Local Non-Governmental Organisations 8
Newspapers 9
Broadcasting companies 10
Neighbouring companies 35
Huchems 20
Itochu 2
Carbon GmbH 2
KIECO 2
Total 103
4. Content of conference
- Welcoming address to the stakeholoders by Mr. S. H. Kim (Executive Vice President of Huchems)
- Welcoming address to the stakeholders by Mr. Ferdinand Heilig (Managing Director of Carbon)
- Introduction of Huchems and CDM project by Mr. K. S. Hwang (General Manager of Huchems)
- Presentation of Carbon including the Methodology of Carbon and the EnviNOx system of Uhde
by Mr. S. H. Kim (Managing Director of KIECO)
- Questionnaires and Answers
- A survey of the stakeholders
5. Statistics of a survey of the stakeholders for the CDM project of Huchems
- 59 stakeholders (out of 103 ones) filled out the questionnaires
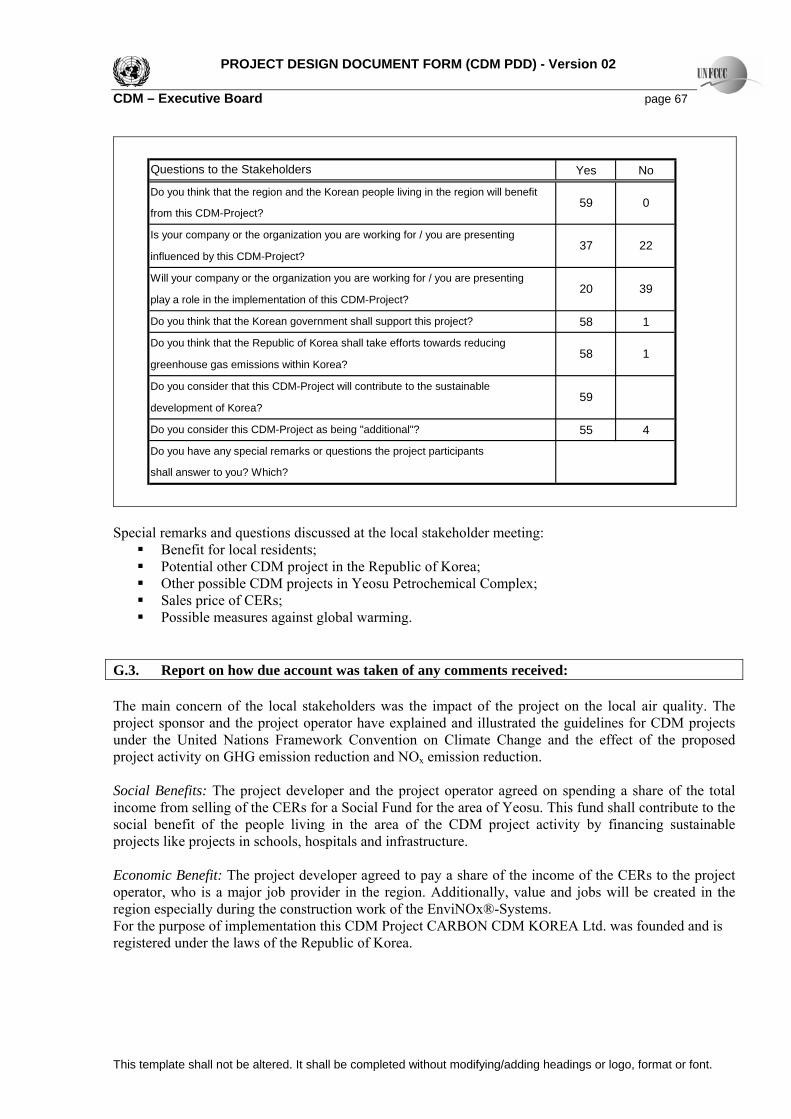
PROJECT DESIGN DOCUMENT FORM (CDM PDD) - Version 02 CDM – Executive Board page 67
This template shall not be altered. It shall be completed without modifying/adding headings or logo, format or font.
Yes No
58 1
55 4
Questions to the Stakeholders
0
play a role in the implementation of this CDM-Project?
greenhouse gas emissions within Korea?
development of Korea?
Is your company or the organization you are working for / you are presenting
Will your company or the organization you are working for / you are presenting
influenced by this CDM-Project?
Do you think that the Korean government shall support this project?
Do you have any special remarks or questions the project participants
shall answer to you? Which?
59Do you think that the region and the Korean people living in the region will benefit
from this CDM-Project?
37
59
Do you think that the Republic of Korea shall take efforts towards reducing
Do you consider that this CDM-Project will contribute to the sustainable
Do you consider this CDM-Project as being "additional"?
22
20 39
58 1
Special remarks and questions discussed at the local stakeholder meeting:
Benefit for local residents; Potential other CDM project in the Republic of Korea; Other possible CDM projects in Yeosu Petrochemical Complex; Sales price of CERs; Possible measures against global warming.
G.3. Report on how due account was taken of any comments received: The main concern of the local stakeholders was the impact of the project on the local air quality. The project sponsor and the project operator have explained and illustrated the guidelines for CDM projects under the United Nations Framework Convention on Climate Change and the effect of the proposed project activity on GHG emission reduction and NOx emission reduction. Social Benefits: The project developer and the project operator agreed on spending a share of the total income from selling of the CERs for a Social Fund for the area of Yeosu. This fund shall contribute to the social benefit of the people living in the area of the CDM project activity by financing sustainable projects like projects in schools, hospitals and infrastructure. Economic Benefit: The project developer agreed to pay a share of the income of the CERs to the project operator, who is a major job provider in the region. Additionally, value and jobs will be created in the region especially during the construction work of the EnviNOx®-Systems. For the purpose of implementation this CDM Project CARBON CDM KOREA Ltd. was founded and is registered under the laws of the Republic of Korea.

PROJECT DESIGN DOCUMENT FORM (CDM PDD) - Version 02 CDM – Executive Board page 68
This template shall not be altered. It shall be completed without modifying/adding headings or logo, format or font.
All remarks and questions were discussed at great length. No further comments were received during the stakeholder consultation process. The project owner will pay attention to the comments and questions of stakeholders and will make all conceivable effort to achieve environmental benefits, social benefits and economic benefits.

PROJECT DESIGN DOCUMENT FORM (CDM PDD) - Version 02 CDM – Executive Board page 69
This template shall not be altered. It shall be completed without modifying/adding headings or logo, format or font.
Annex 1
CONTACT INFORMATION ON PARTICIPANTS IN THE PROJECT ACTIVITY Organization: CARBON Projektentwicklung GmbH Street/P.O.Box: Hauptstrasse 68 Building: City: Grunddorf State/Region: Postfix/ZIP: A-3485 Country: AUSTRIA Telephone: +43 2735 77 135 FAX: +43 2735 77 135 E-Mail: [email protected] URL: www.asamer.at / www.carbon-austria.com Represented by: Mr. Ferdinand HEILIG Title: Mag. Salutation: Managing Director Last Name: HEILIG Middle Name: First Name: Ferdinand Department: Mobile: +43 676 572 1792 Direct FAX: Direct Tel: Personal E-Mail: [email protected] Organization: CARBON CDM KOREA Ltd. Street/P.O.Box: 8th Floor Bongwoo Bldg.,
31-7, 1Ga, Jangchung-Dong, Jung-Gu
Building: City:
Seoul State/Region: Postfix/ZIP: Country: Republic of Korea Telephone: Tel. +82 (2) 2276 0501 FAX: Fax. +82 (2) 2276 9288 E-Mail: [email protected] URL: Represented by: Michael Hennig Title: Dr. Salutation: Managing Director Last Name: HENNIG Middle Name: First Name: Michael

PROJECT DESIGN DOCUMENT FORM (CDM PDD) - Version 02 CDM – Executive Board page 70
This template shall not be altered. It shall be completed without modifying/adding headings or logo, format or font.
Department: Mobile: Direct FAX: Direct Tel: Personal E-Mail: Organization: HU-CHEMS FINE CHEMICALS Corp. Street/P.O.Box: 7-6 Wollae-dong, Yeosu-si
Jeollanam-do, 555-260 Building: City: State/Region: Postfix/ZIP: Country: Korea Telephone: Tel.: +82 61 680 4643 FAX: Fax.: +82 61 680 4650 E-Mail: [email protected] URL: www.huchems.com Represented by: Mr. S. H. Kim Title: Salutation: Executive Vice President Last Name: KIM Middle Name: First Name: S. H. Department: Mobile: Direct FAX: Direct Tel: Personal E-Mail: Organization: KOMMUNALKREDIT PUBLIC CONSULTING GmbH Street/P.O.Box: Türkenstrasse 9 Building: City: Vienna State/Region: Postfix/ZIP: A-1092 Country: Austria Telephone: +43 1 31631-0, FAX: +43 1 31631-104 E-Mail: [email protected] URL: www.klimaschutzprojekte.at Represented by: Mrs. Alexandra AMERSTORFER Title: Dipl.-Ing. Salutation: Last Name: AMERSTORFER Middle Name:

PROJECT DESIGN DOCUMENT FORM (CDM PDD) - Version 02 CDM – Executive Board page 71
This template shall not be altered. It shall be completed without modifying/adding headings or logo, format or font.
First Name: Alexandra Department: JI/CDM Program Manager Mobile: Direct FAX: +43 1 31 631 104 Direct Tel: +43 1 31 631 240 Personal E-Mail: [email protected]

PROJECT DESIGN DOCUMENT FORM (CDM PDD) - Version 02 CDM – Executive Board page 72
This template shall not be altered. It shall be completed without modifying/adding headings or logo, format or font.
Annex 2
INFORMATION REGARDING PUBLIC FUNDING
No public funds are available for the financing of the project activity. Therefore CARBON will finance the project investment and running out of its own private corporate funds and will bear all financial risks of the CDM Project activity.

PROJECT DESIGN DOCUMENT FORM (CDM PDD) - Version 02 CDM – Executive Board page 73
This template shall not be altered. It shall be completed without modifying/adding headings or logo, format or font.
Annex 3
BASELINE INFORMATION
Tables: Baseline data for ex-ante estimations Hu-Chems II: Data
Tail gas volume m³/h 41,000
Min. average Production days d 330
EnviNOx® add. ammonia demand tHNO3 -
N2O concentration in the tail gas of the N2O DF during inter tN2O/m³ 2.09597E-07
Efficiency DF % 94%
Hydrocarbon: Propane
Propan Input kg/h 48.4
Carbon emission factor of hydrocarbon tCO2/tHC 3.0
Oxidation factor of hydrocarbon % 100 Hu-Chems III: Data
Tail gas volume m³/h 41,000
Min. average Production days d 330
EnviNOx® add. ammonia demand tHNO3 -
N2O concentration in the tail gas of the N2O DF during inter tN2O/m³ 2.09597E-07
Efficiency DF % 94%
Hydrocarbon: Propane
Propan Input kg/h 48.4
Carbon emission factor of hydrocarbon tCO2/tHC 3.0
Oxidation factor of hydrocarbon % 100 Hu-Chems IV: Data
Tail gas volume m³/h 149,675
Min. average Production days d 345
EnviNOx® add. ammonia demand tHNO3 -
N2O concentration in the tail gas of the N2O DF during inter tN2O/m³ 1.0328E-07
Efficiency DF % 94%
Hydrocarbon: Propane
Propan Input kg/h 0
Carbon emission factor of hydrocarbon tCO2/tHC 3.0
Oxidation factor of hydrocarbon % 100

PROJECT DESIGN DOCUMENT FORM (CDM PDD) - Version 02 CDM – Executive Board page 74
This template shall not be altered. It shall be completed without modifying/adding headings or logo, format or font.
Annex 4
MONITORING PLAN
The “Catalytic N2O destruction project in the tail gas of three Nitric Acid Plants at Hu-Chems Fine Chemical Corp.” employs the latest state of the art monitoring and control equipment that measures, records and reports all key parameters to determine the GHG emission reductions. The monitoring will involve the volume flow rate of the tail gas and the N2O concentration in the tail gas upstream and downstream of the EnviNOx®-System. The volume flow rate will be measured by using an international standard method (e.g. venture tube according to ISO 5167-4:2003; ISO 5267-4:2003). The monitoring system will automatically record volume under conditions of standard temperature and pressure. Also part of the volume flow rate monitoring system is the measurement of the tail gas temperature and tail gas pressure. The flow rate and the N2O concentration, monitored upstream and downstream of the EnviNOx®-System are recorded on the emission monitoring computer. Data is automatically stored and can be recorded and displayed in trends and charts.
It is the responsibility of the Project Developer and Project Operator to ensure that required and experienced capacity is available and that their operational staffs participate in training to be enable to operate the monitoring system properly. Initial training must be provided to the staff before the project activity starts operation. It is also the responsibility of the Project Developer and Project Operator to organize and implement a quality management system that ensures the integrity of the data. The monitoring procedures will be fully integrated in Hu-Chems quality and environmental management system. Please note, Hu-Chems is already ISO 9002 and ISO 14001 certificated. All monitoring equipment will be serviced, calibrated and maintained according to the manufacturers’ instructions and international standards. Monitoring principles such as monitoring frequencies and reporting will be implemented in accordance with international standards. Parameters to be monitored are described in section D.
- - - - -