classification of indian meteorological data using data ... · classification of indian...
TRANSCRIPT
2225 | P a g e
Classification of Indian Meteorological Data Using Data
Mining Functionalities
Dr. Ramachandra Reddy Avula1, Mr. K. Praveen Kumar
2
1Professor, Department of Computer Science & Engineering, Sphoorthy Engineering College,
Nadargul, Hyderabad. (India)
2Associate Professor, Department of Computer Science & Engineering, VignanInstitute of Technology
& Science, Deshmukhi, Hyderabad. (India)
ABSTRACT
Meteorology is a branch of the atmospheric scienceswhich includes atmospheric chemistry and Meteorological
fact atmospheric physics, with a major focus on forecasting’spertaining to the atmosphere,
such as wind, temperature, airdensity,and other phenomena that affect militaryoperations, Agriculture crop
yield, Human health, and other Animals.
Weather and climate: There is often confusion between weather and climate. Weather is the condition of the
atmosphere at a particular place over a short period of time, whereas climate refers to the weather pattern
(statistics) of a place over a long period, long enough to yield meaningful averages. Meteorology studies
weather, while climatology studies climate; both are atmospheric sciences.
Classification of the future values by analyzing meteorological data is one of the important parts which can be
helpful to the Agriculture, society as well as to the economy. Estimates of these values at a specific time of day,
from daytime and daily profiles, are needed for a number of environmental, ecological, agricultural and
technical applications, ranging from natural hazards assessments, crop growth forecasting to design of solar
energy systems. Work has been done in this constrain since years. This paper is discussing the application of
different data mining techniques applied in various ways to predict or to associate or to classify or to cluster the
pattern of meteorologicaldata.
Keywords-Meteorology, Classification, Clustering, Association Rule, Data Mining, Meteorological
data.
I. INTRODUCTION
Data mining, also called Knowledge Discovery in Databases (KDD), is the field of discovering novel and
potentially useful information from large amounts of data s[1]. In contrast to standard statistical methods, data
mining techniques search for interesting information without demanding a priori hypotheses, the kind of patterns
that can be discovered depend upon the data mining task employed. There are two types [1] of data mining tasks:
descriptive data mining tasks that describe the general properties of the existing data and predictive data mining
tasks that attempt to do Classifications based on inference on availabledata.We were looking for some
challenging dataset area from which we can mine useful knowledge. So, we have selected
2226 | P a g e
meteorological data which can be huge in size with the time information.
II. METEOROLOGICAL DATA
Meteorology is a branch of the atmospheric scienceswhich includes atmospheric chemistry and Meteorological
fact atmospheric physics, with a major focus on forecasting’spertaining to the atmosphere,
such as wind, temperature, airdensity,and other phenomena that affect militaryoperations, Agriculture crop yield,
Human health, and other Animals.
Types of Meteorological Data
1. Rainfall (Hourly**, Daily, Monthly, Annual, Sub-divisional, Heavy Spells in 24Hrs, Extreme values Etc.)
2. Temperature (Hourly**, Daily, Monthly, Maximum & Minimum, Extreme Values Etc.)
3. Relative Humidity (Hourly**, Daily, Monthly) Surface Wind speed and directions
4. Station Level/Mean Sea Level Pressure(Hourly**, Daily, Monthly)
5. Amount and types of clouds observed (**Twice daily / 8 times daily)
6. Various Weather phenomenon such as, visibility, occurrence of Thunderstorm etc.
7. Climate Normals based on 1981-2010 data.
8. Weather Reports on specific weather phenomenon such as heavy rainfall, storm etc.
9. Windrose diagrams for selected stations.
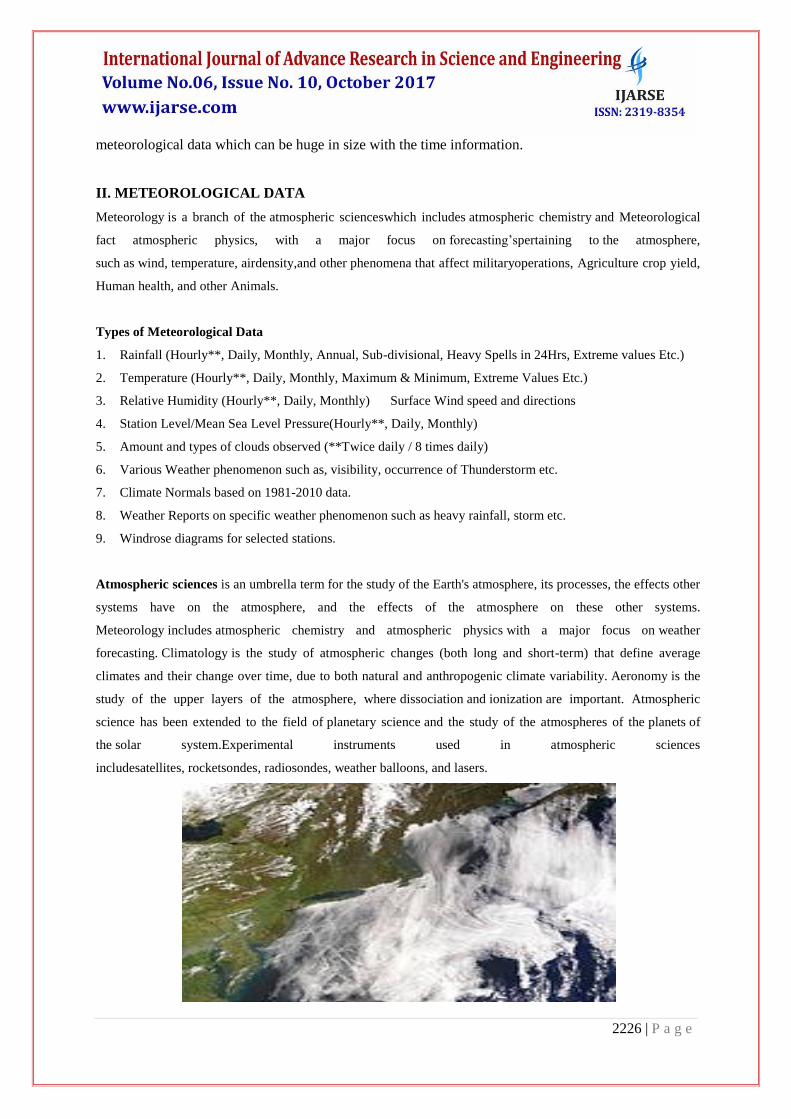
Atmospheric sciences is an umbrella term for the study of the Earth's atmosphere, its processes, the effects other
systems have on the atmosphere, and the effects of the atmosphere on these other systems.
Meteorology includes atmospheric chemistry and atmospheric physics with a major focus on weather
forecasting. Climatology is the study of atmospheric changes (both long and short-term) that define average
climates and their change over time, due to both natural and anthropogenic climate variability. Aeronomy is the
study of the upper layers of the atmosphere, where dissociation and ionization are important. Atmospheric
science has been extended to the field of planetary science and the study of the atmospheres of the planets of
the solar system.Experimental instruments used in atmospheric sciences
includesatellites, rocketsondes, radiosondes, weather balloons, and lasers.

2227 | P a g e
III.CLIMATOLOGY
In contrast to meteorology, which studies short term weather systems lasting up to a few weeks, climatology
studies the frequency and trends of those systems. It studies the periodicity of weather events over years to
millennia, as well as changes in long-term average weather patterns, in relation to atmospheric
conditions. Climatologists, those who practice climatology, study both the nature of climates – local, regional or
global – and the natural or human-induced factors that cause climates to change. Climatology considers the past
and can help predict future climate change.
Phenomena of climatological interest include the atmospheric boundary layer, circulation patterns,heat
transfer (radiative, convectiveand latent),interactions between the atmosphere and the oceans and land surface
(particularly vegetation, land use and topography), and the chemical and physical composition of the atmosphere.
Related disciplines include astrophysics, atmospheric physics, chemistry, ecology, physical geography,
geology, geophysics, glaciology, hydrology, oceanography, and volcanology.
Fig: Regional impacts of warm ENSO episodes

2228 | P a g e
All of the Solar System's planets have atmospheres. This is because their gravity is strong enough to keep
gaseous particles close to the surface. Larger gas giants are massive enough to keep large amounts of the light
gases hydrogen and helium close by, while the smaller planets lose these gases into space.[3]
The composition of
the Earth's atmosphere is different from the other planets because the various life processes that have transpired
on the planet have introduced free molecular oxygen.Much of Mercury's atmosphere has been blasted away by
the solar wind.[5]
The only moon that has retained a dense atmosphere is Titan. There is a thin atmosphere
on Triton, and a trace of an atmosphere on the Moon.
Fig: Earth's atmosphere
Knowledge of meteorological data in a site is essential for number of applications like Rainfall analysis and
Classification, temperature Classification, pollution and energy application studies and development. For
example, in advanced energy system designs the profile of any meteorological parameter is a prerequisite for
systems operating management on daily and/or hourly basis and simulations of long-term performance of energy
plants require detailed and accurate meteorological data as input. Especially temperature data is used to
determine the number of application parameter estimation. An element of weather and the proportion of these
elements increases or decreases due to change in climate temperature [2],[3].
Meteorologists and weather forecasters make Classifications for weather mainly on numerical and statistical
models. The simulation conducted often requires intensive computations, involving complex differential
equations and computational algorithms. The accuracy is bound by constraints, such as the adoption of
incomplete boundary conditions, model assumptions and numerical instabilities, etc. [2].
Since the data of everyday weather condition are so huge the weather parameter relations cannot be found easily
only by directly observation which can be found by data mining techniques. There are number of data mining
techniques and methods are available and they are applied to many application areas [2]. Some applications
which use a dynamic Classification based approach include ophthalmic oncology, vehicle fault diagnosis, pre-
fetching, fault Classification models, fault restoration Classification models, financial distress Classification
models, chemical reactivity Classifications, real time vehicle tracking, forecasting, anomaly detection, churn
Classification, clinical Classifications, etc.[4]. Thus, here we focused on survey of different data mining
techniques utilized to find the hidden relationship between various dataset variables values and to identify
correlations between meteorological data.
The organization of rest of this paper is as follow: In Section 2 we are presenting the brief overview of the data
mining techniques. In Section 3 we are discussing the literature survey on meteorological data Classification.
Section 4 is concluding the research work and showing the futureworks.
III.DATA MINING FUNCTIONALITIES
Data mining techniques are used to specify the kind of patterns to be found in data mining tasks that characterize
the general properties of the data in the database or perform inference on the current data to make Classifications.
As in some cases, users may have no idea regarding what kinds of patterns in their data may be interesting and
hence may like to search for several different kinds of patterns in parallel. A data mining system can mine
multiple kinds of patterns and also at various abstraction levels to accommodate different user expectations or
2229 | P a g e
applications. Also, data mining systems should allow users to specify hints to guide or focus the search for
interesting patterns. Because some patterns may not hold for all of the data in the database, a measure of
certainty or trustworthiness is usually associated with each discovered pattern [5].
IV. CLASSIFICATION
Classification is the method to map each item of the selected data into one of a predefined set of classes [1], [6].
Given the set of predefined classes, a number of attributes and a “learning (or training) set”, the classification
methods can automatically predict the class of other unclassified data of the learning set. The accuracy of the
classified data is first evaluated on the training data first, and then it will be applied to the real worlddataset.
The application of classification is to classify a car loan applicant as a good or a poor credit risk. To solve, this
type of problem there is a need of car loan application model to determine whether an applicant is a good credit
risk at this time rather than in some future time period. The classification technique is the suitable technique here,
as it will be modeled on history data of the loan persons.
V. CLUSTERING
Clustering is the unsupervised classification of data into natural groups (called clusters) so that data points within
a cluster are more similar to each other than to data points in other clusters [1], [7]. The term unsupervised stands
for the fact that there is no a priori knowledge about the partition of the data. Clustering algorithms are based on
some distance function that evaluates in which cluster an object should be assigned. There is also an evaluation
function that evaluates how good the achieved clustering is. For example, minimizing the distance of each data
point from the mean of the cluster to which it isassigned.
The application of clustering is to analyze e- commerce customer data to identify homogeneous subpopulations
of customers. The clusters may represent individual target groups for marketing. A 2- D plot of customers can be
used to locate customer in a city. Three clusters of data points are generated for the three cities.
VI. ASSOCIATIONRULES
Association rules are used to predict the relationship of a particular item in a data transaction on other items in
the same transaction [1], [8]. An association rule is representing the relation in “X implies Y, with the confidence
and the support factor provided by the user given limit”, where X is called antecedent and Y is called
consequent.
The main application of association rule mining is the market basket analysis which helps the retailer for the rack
arrangement, cross-marketing, sale campaign analysis, etc. The Fig. 1 shows the association rule “Milk
Clothes” for Support= 2% and Confidence=60%. Here, a support of 2% means that 2% of all transactions under
analysis show that Milk and Clothes are purchased together. A confidence of 60% means that 60% of the
customers who purchased milk also bought the clothes. Association rules are considered interesting if they
satisfy both a minimum support factor and a minimum confidence threshold.
Though, most of the available data-analysis methods are based on classification or clustering algorithms that try
to categorize the data to the specific group or to establish groups of correlated data respectively.

2230 | P a g e
Although such algorithms have been quite successful, they have some drawbacks like a data record has to be
grouped in one and only one group and no relationship can be inferred between the different members of agroup.
To overcome such problems, the potential impact of the association rule discovery technique is investigated. This
is an unsupervised data mining technique that seeks descriptive rules in potentially very large datasets. This
method should resolve the above drawbacks of existing grouping approaches for the following reasons. First, any
data item can be assigned to any number of rules as long as its expression fulfills the assignment criteria, without
limitation. Second, rules are orientated (If … then …) and thus to a certain extent describe the direction of a
relationship. Last but not least, by focusing on strong rules, the knowledge extractor does not have to browse and
study a huge number of redundant rules.
The next section is discussing, how these various data mining techniques are applied to various fielded
applications of meteorological data to derive the knowledge and to discover the relationships between the data.
VII. METEOROLOGICAL DATA IN CLASSIFICATION
Some of the work in the area of Classification based on meteorological data is as follow:
In 2005, Liang et. al [9] derived the sequence of ecological events using temporal association rule mining. Red
tide phenomena occurred during 1991 and 1992 in Dapeng bay, South China Sea was taken as an example to
validate T-Apriori algorithm which generated frequent itemsets and corresponding temporal association rules and
K-means clustering analysis used to map the quantitative association rule problem into the boolean association
rules. Their experiment shows that T-Apriori algorithm can successfully extract temporal association rules that
described the close relationship between environmental factors and ecological events.
In 2007, Huang et. al [10] analyzed historic salinity- temperature data to make Classifications about future
variations in the ocean salinity and temperature relations in the waters surrounding Taiwan. Traditional statistical
models that assume data independence are not applicable as ocean data are often inter-related. Association rules
mining can be used to find interesting salinity and temperature patterns. However, the traditional method ignores
spatial and temporal information in the data. They proposed to use inter-dimensional association rules mining
with fuzzy inference to discover salinity- temperature patterns with spatial-temporal relationships. They
concluded their Classification of when, where and what event will occur with accuracy of 79%.
In 2007, the other authors S. Kotsiantiset. al [3] proposed a hybrid data mining technique that can be used to
predict the mean daily temperature values. A number of experiments have been conducted with well-known
regression algorithms using temperature data from the city of Patras in Greece. The performance of these
algorithms has been evaluated using standard statistical indicators, such as Correlation Coefficient, Root Mean
Squared Error. It was found that the regression algorithms could enable experts to predict the temperature values
with satisfying accuracy using as input the temperatures of the previous years. The methods used in this work,
2231 | P a g e
has to be still validated by including temperature data with other meteorological parameters as well.
In 2011, N. Kohailet. al [11] tried to extract useful knowledge from weather daily historical data collected locally
at Gaza Strip city. The data include nine years period [1977-1985]. After data preprocessing, they apply basic
algorithms of clustering, classification and association rules mining techniques. For each mining technique, they
presented the extracted knowledge and describe its importance in meteorological field which can be used to
obtain useful Classification and support the decision making for differentsectors.
In 2011, Sivaramakrishnanet. al [12] presented the method for Classification of daily rainfall. Meteorological
data from 1961-2010 were used for analysis. For the atmospheric parameters temperature, dew point, wind
speed, visibility and precipitation (rainfall) were considered for analysis. They filtered and discretized the raw
data based on the best fit ranges and applied association mining on dataset using Apriori algorithm to find the
hidden relationship between various atmospheric parameters to predict the rainfall. Finally the data has been
validated using classifier approach where correctly classified instances and incorrectly classified instances were
found out to justify the accuracy of the data Classification model.
In 2011, AlRoby et al. [13] analyzed wind speed behaviour for the data recorded between 2004 to
November 2006 at Gaza with different data mining techniques. But, they found the classification using neural
networks as the appropriate one with accuracy upto 68% which is higher than all the othertechniques.
In 2012, Badhiyeet. al [14] described how to use a data mining technique, “k-Nearest Neighbor (KNN)”, to
develop a system that uses numeric historical data to forecast the climate of a specific region or city. They
proposed design of Temperature and Humidity Data Analysis System. The main aim of their research is to
acquire temperature and humidity data and use k-Nearest Neighbor algorithm to find hidden patterns inside a
large data so as to transfer the retrieved information into usable knowledge for classification and Classification of
temperature and humidity.
In 2012, K. Pabreja [15] used K-means clustering technique on real life case of cloudburst of Dhaka, Bangladesh
to discover the formation of cloudburst. And achievement of this concluded the early signal to forecast the
cloudburst for future time.
In 2012, Dadaser-Celik et al. [16] analyzed the usage of association rule for discovering the relationships
between stream flow and climatic variables in the Kizilirmak River Basin in Turkey.
From the literature survey it is found that that most of the meteorological data based Classification techniques
and methods are based on the statistical or widely used data mining techniques like Clustering, Classification,
Regression analysis, Decision Tree etc. and upto some extent the Temporal Association Rule Mining which are
shown and analyzedin Table
1. Nowadays, research is considering time as one of the important constraints. Most of the meteorological
variables are related to each other and also vary with each other with respect to time. So if we use the previous
historical data for Classification then we can predict the most accurate value for any weather parameters.
VIII. CONCLUSION AND FUTURE WORK
Data mining techniques are now the important techniques utilized in all application area related to
meteorological data for the Classification and decision making by discovering interesting rules or patterns or
2232 | P a g e
groups that indicate the relation between variables which are discussed in brief here. To understand the
application of data mining techniques, different research works are discussed here, that summarizes that the
meteorological data are so specific than the traditional data.
The future area of research is so wide in various ways: As the meteorological data are huge and time stamped
base data, there is a need to modify the traditional data mining technique as per the specific application need to
discover the useful knowledge with integration of temporalconcept.
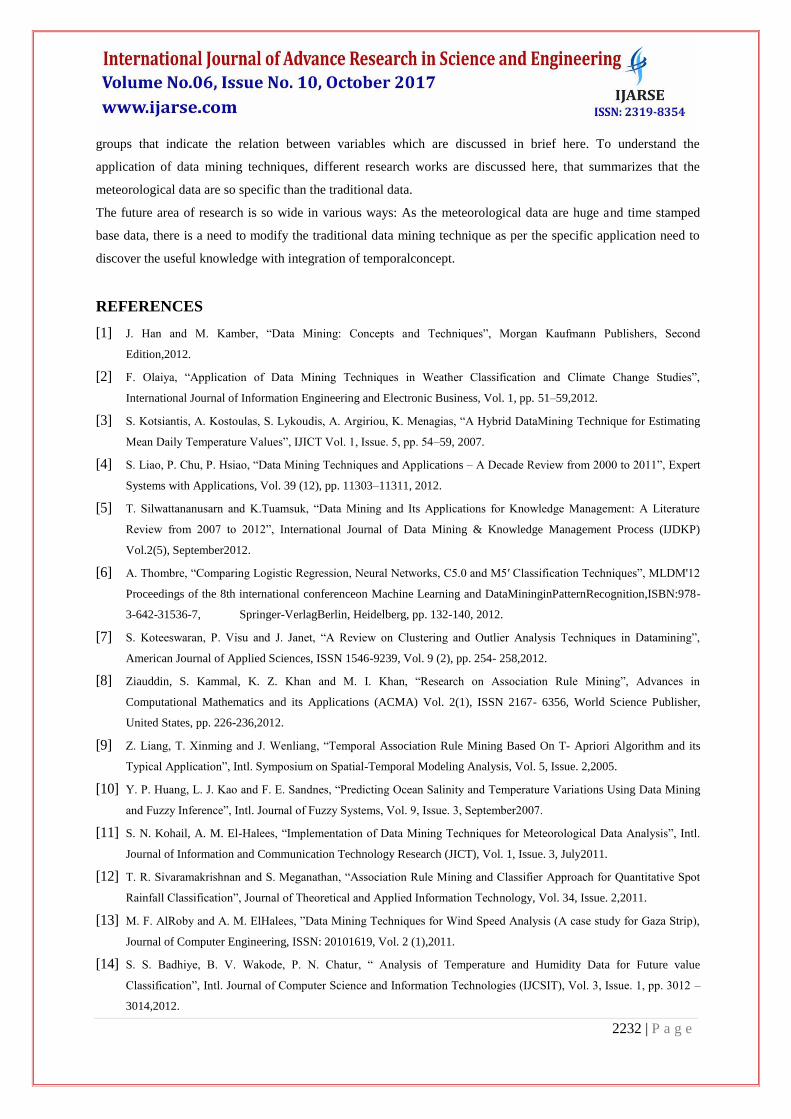
REFERENCES
[1] J. Han and M. Kamber, “Data Mining: Concepts and Techniques”, Morgan Kaufmann Publishers, Second
Edition,2012.
[2] F. Olaiya, “Application of Data Mining Techniques in Weather Classification and Climate Change Studies”,
International Journal of Information Engineering and Electronic Business, Vol. 1, pp. 51–59,2012.
[3] S. Kotsiantis, A. Kostoulas, S. Lykoudis, A. Argiriou, K. Menagias, “A Hybrid DataMining Technique for Estimating
Mean Daily Temperature Values”, IJICT Vol. 1, Issue. 5, pp. 54–59, 2007.
[4] S. Liao, P. Chu, P. Hsiao, “Data Mining Techniques and Applications – A Decade Review from 2000 to 2011”, Expert
Systems with Applications, Vol. 39 (12), pp. 11303–11311, 2012.
[5] T. Silwattananusarn and K.Tuamsuk, “Data Mining and Its Applications for Knowledge Management: A Literature
Review from 2007 to 2012”, International Journal of Data Mining & Knowledge Management Process (IJDKP)
Vol.2(5), September2012.
[6] A. Thombre, “Comparing Logistic Regression, Neural Networks, C5.0 and M5′ Classification Techniques”, MLDM'12
Proceedings of the 8th international conferenceon Machine Learning and DataMininginPatternRecognition,ISBN:978-
3-642-31536-7, Springer-VerlagBerlin, Heidelberg, pp. 132-140, 2012.
[7] S. Koteeswaran, P. Visu and J. Janet, “A Review on Clustering and Outlier Analysis Techniques in Datamining”,
American Journal of Applied Sciences, ISSN 1546-9239, Vol. 9 (2), pp. 254- 258,2012.
[8] Ziauddin, S. Kammal, K. Z. Khan and M. I. Khan, “Research on Association Rule Mining”, Advances in
Computational Mathematics and its Applications (ACMA) Vol. 2(1), ISSN 2167- 6356, World Science Publisher,
United States, pp. 226-236,2012.
[9] Z. Liang, T. Xinming and J. Wenliang, “Temporal Association Rule Mining Based On T- Apriori Algorithm and its
Typical Application”, Intl. Symposium on Spatial-Temporal Modeling Analysis, Vol. 5, Issue. 2,2005.
[10] Y. P. Huang, L. J. Kao and F. E. Sandnes, “Predicting Ocean Salinity and Temperature Variations Using Data Mining
and Fuzzy Inference”, Intl. Journal of Fuzzy Systems, Vol. 9, Issue. 3, September2007.
[11] S. N. Kohail, A. M. El-Halees, “Implementation of Data Mining Techniques for Meteorological Data Analysis”, Intl.
Journal of Information and Communication Technology Research (JICT), Vol. 1, Issue. 3, July2011.
[12] T. R. Sivaramakrishnan and S. Meganathan, “Association Rule Mining and Classifier Approach for Quantitative Spot
Rainfall Classification”, Journal of Theoretical and Applied Information Technology, Vol. 34, Issue. 2,2011.
[13] M. F. AlRoby and A. M. ElHalees, ”Data Mining Techniques for Wind Speed Analysis (A case study for Gaza Strip),
Journal of Computer Engineering, ISSN: 20101619, Vol. 2 (1),2011.
[14] S. S. Badhiye, B. V. Wakode, P. N. Chatur, “ Analysis of Temperature and Humidity Data for Future value
Classification”, Intl. Journal of Computer Science and Information Technologies (IJCSIT), Vol. 3, Issue. 1, pp. 3012 –
3014,2012.
2233 | P a g e
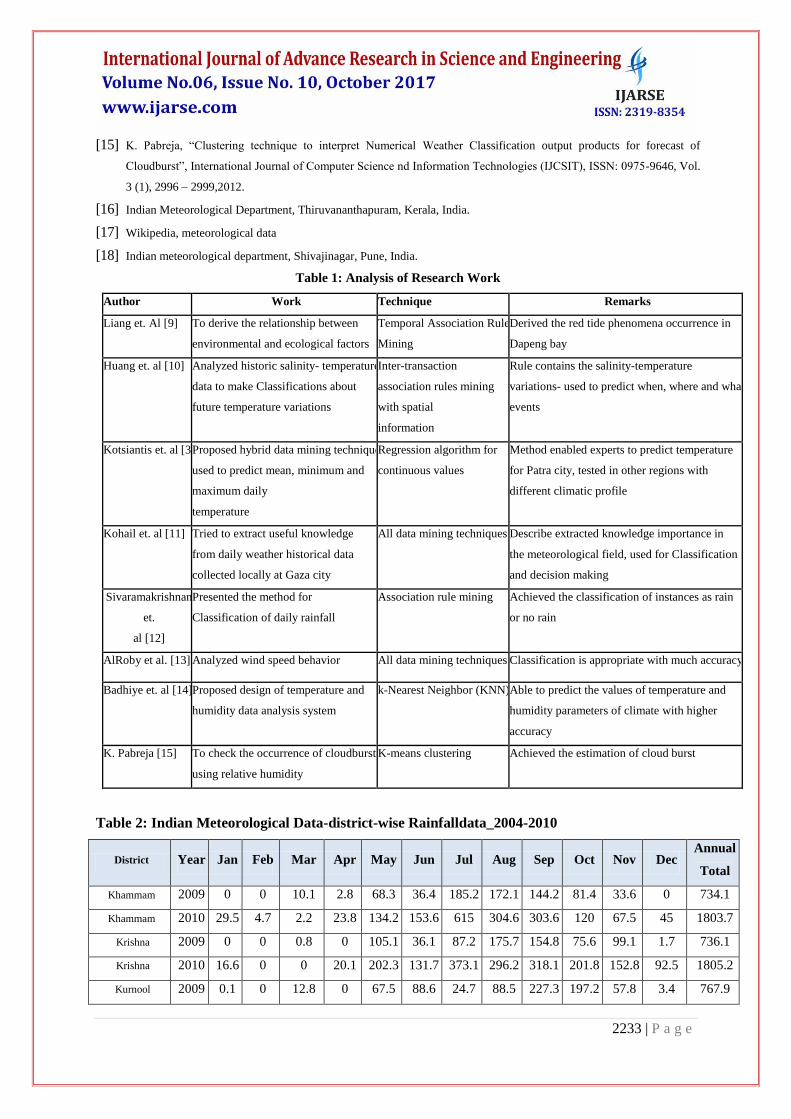
[15] K. Pabreja, “Clustering technique to interpret Numerical Weather Classification output products for forecast of
Cloudburst”, International Journal of Computer Science nd Information Technologies (IJCSIT), ISSN: 0975-9646, Vol.
3 (1), 2996 – 2999,2012.
[16] Indian Meteorological Department, Thiruvananthapuram, Kerala, India.
[17] Wikipedia, meteorological data
[18] Indian meteorological department, Shivajinagar, Pune, India.
Table 1: Analysis of Research Work
Author Work Technique Remarks
Liang et. Al [9] To derive the relationship between
environmental and ecological factors
Temporal Association Rule
Mining
Derived the red tide phenomena occurrence in
Dapeng bay
Huang et. al [10] Analyzed historic salinity- temperature
data to make Classifications about
future temperature variations
Inter-transaction
association rules mining
with spatial
information
Rule contains the salinity-temperature
variations- used to predict when, where and what
events
Kotsiantis et. al [3] Proposed hybrid data mining technique
used to predict mean, minimum and
maximum daily
temperature
Regression algorithm for
continuous values
Method enabled experts to predict temperature
for Patra city, tested in other regions with
different climatic profile
Kohail et. al [11] Tried to extract useful knowledge
from daily weather historical data
collected locally at Gaza city
All data mining techniques Describe extracted knowledge importance in
the meteorological field, used for Classification
and decision making
Sivaramakrishnan
et.
al [12]
Presented the method for
Classification of daily rainfall
Association rule mining Achieved the classification of instances as rain
or no rain
AlRoby et al. [13] Analyzed wind speed behavior All data mining techniques Classification is appropriate with much accuracy
Badhiye et. al [14] Proposed design of temperature and
humidity data analysis system
k-Nearest Neighbor (KNN) Able to predict the values of temperature and
humidity parameters of climate with higher
accuracy
K. Pabreja [15] To check the occurrence of cloudburst
using relative humidity
K-means clustering Achieved the estimation of cloud burst
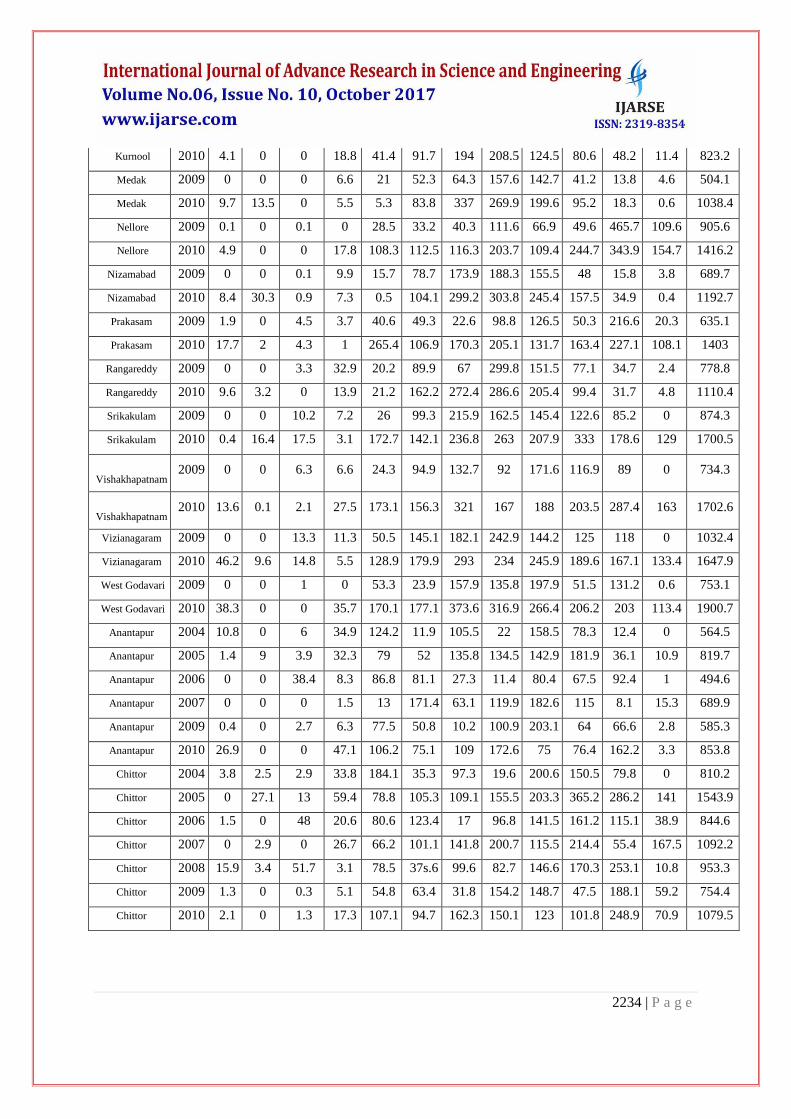
Table 2: Indian Meteorological Data-district-wise Rainfalldata_2004-2010
District Year Jan Feb Mar Apr May Jun Jul Aug Sep Oct Nov Dec Annual
Total
Khammam 2009 0 0 10.1 2.8 68.3 36.4 185.2 172.1 144.2 81.4 33.6 0 734.1
Khammam 2010 29.5 4.7 2.2 23.8 134.2 153.6 615 304.6 303.6 120 67.5 45 1803.7
Krishna 2009 0 0 0.8 0 105.1 36.1 87.2 175.7 154.8 75.6 99.1 1.7 736.1
Krishna 2010 16.6 0 0 20.1 202.3 131.7 373.1 296.2 318.1 201.8 152.8 92.5 1805.2
Kurnool 2009 0.1 0 12.8 0 67.5 88.6 24.7 88.5 227.3 197.2 57.8 3.4 767.9
2234 | P a g e
Kurnool 2010 4.1 0 0 18.8 41.4 91.7 194 208.5 124.5 80.6 48.2 11.4 823.2
Medak 2009 0 0 0 6.6 21 52.3 64.3 157.6 142.7 41.2 13.8 4.6 504.1
Medak 2010 9.7 13.5 0 5.5 5.3 83.8 337 269.9 199.6 95.2 18.3 0.6 1038.4
Nellore 2009 0.1 0 0.1 0 28.5 33.2 40.3 111.6 66.9 49.6 465.7 109.6 905.6
Nellore 2010 4.9 0 0 17.8 108.3 112.5 116.3 203.7 109.4 244.7 343.9 154.7 1416.2
Nizamabad 2009 0 0 0.1 9.9 15.7 78.7 173.9 188.3 155.5 48 15.8 3.8 689.7
Nizamabad 2010 8.4 30.3 0.9 7.3 0.5 104.1 299.2 303.8 245.4 157.5 34.9 0.4 1192.7
Prakasam 2009 1.9 0 4.5 3.7 40.6 49.3 22.6 98.8 126.5 50.3 216.6 20.3 635.1
Prakasam 2010 17.7 2 4.3 1 265.4 106.9 170.3 205.1 131.7 163.4 227.1 108.1 1403
Rangareddy 2009 0 0 3.3 32.9 20.2 89.9 67 299.8 151.5 77.1 34.7 2.4 778.8
Rangareddy 2010 9.6 3.2 0 13.9 21.2 162.2 272.4 286.6 205.4 99.4 31.7 4.8 1110.4
Srikakulam 2009 0 0 10.2 7.2 26 99.3 215.9 162.5 145.4 122.6 85.2 0 874.3
Srikakulam 2010 0.4 16.4 17.5 3.1 172.7 142.1 236.8 263 207.9 333 178.6 129 1700.5
Vishakhapatnam 2009 0 0 6.3 6.6 24.3 94.9 132.7 92 171.6 116.9 89 0 734.3
Vishakhapatnam 2010 13.6 0.1 2.1 27.5 173.1 156.3 321 167 188 203.5 287.4 163 1702.6
Vizianagaram 2009 0 0 13.3 11.3 50.5 145.1 182.1 242.9 144.2 125 118 0 1032.4
Vizianagaram 2010 46.2 9.6 14.8 5.5 128.9 179.9 293 234 245.9 189.6 167.1 133.4 1647.9
West Godavari 2009 0 0 1 0 53.3 23.9 157.9 135.8 197.9 51.5 131.2 0.6 753.1
West Godavari 2010 38.3 0 0 35.7 170.1 177.1 373.6 316.9 266.4 206.2 203 113.4 1900.7
Anantapur 2004 10.8 0 6 34.9 124.2 11.9 105.5 22 158.5 78.3 12.4 0 564.5
Anantapur 2005 1.4 9 3.9 32.3 79 52 135.8 134.5 142.9 181.9 36.1 10.9 819.7
Anantapur 2006 0 0 38.4 8.3 86.8 81.1 27.3 11.4 80.4 67.5 92.4 1 494.6
Anantapur 2007 0 0 0 1.5 13 171.4 63.1 119.9 182.6 115 8.1 15.3 689.9
Anantapur 2009 0.4 0 2.7 6.3 77.5 50.8 10.2 100.9 203.1 64 66.6 2.8 585.3
Anantapur 2010 26.9 0 0 47.1 106.2 75.1 109 172.6 75 76.4 162.2 3.3 853.8
Chittor 2004 3.8 2.5 2.9 33.8 184.1 35.3 97.3 19.6 200.6 150.5 79.8 0 810.2
Chittor 2005 0 27.1 13 59.4 78.8 105.3 109.1 155.5 203.3 365.2 286.2 141 1543.9
Chittor 2006 1.5 0 48 20.6 80.6 123.4 17 96.8 141.5 161.2 115.1 38.9 844.6
Chittor 2007 0 2.9 0 26.7 66.2 101.1 141.8 200.7 115.5 214.4 55.4 167.5 1092.2
Chittor 2008 15.9 3.4 51.7 3.1 78.5 37s.6 99.6 82.7 146.6 170.3 253.1 10.8 953.3
Chittor 2009 1.3 0 0.3 5.1 54.8 63.4 31.8 154.2 148.7 47.5 188.1 59.2 754.4
Chittor 2010 2.1 0 1.3 17.3 107.1 94.7 162.3 150.1 123 101.8 248.9 70.9 1079.5