classification of australian native forest species using hyperspectral remote sensing and...
TRANSCRIPT
IEEE JOURNAL OF SELECTED TOPICS IN APPLIED EARTH OBSERVATIONS AND REMOTE SENSING 2481
Classification of Australian Native Forest SpeciesUsing Hyperspectral Remote Sensing andMachine-Learning Classification Algorithms
Xiao Shang and Laurie A. Chisholm
Abstract—Mapping forest species is highly relevant for manyecological and forestry applications. In Australia, the classifica-tion of native forest species using remote sensing data remainsa particular challenge since there are many eucalyptus speciesthat belong to the same genus and, thus, exhibit similar bio-physical characteristics. This study assessed the potential ofusing hyperspectral remote sensing data and state-of-the-artmachine-learning classification algorithms to classify Australianforest species at the leaf, canopy and community levels in BeecroftPeninsula, NSW, Australia. Spectral reflectance was acquiredfrom an ASD spectrometer and airborne Hymap imagery forseven native forest species over an Australian eucalyptus forest.Three machine-learning classification algorithms: Support VectorMachine (SVM), AdaBoost and Random Forest (RF) were appliedto classify the species. A comparative study was carried outbetween machine-learning classification algorithms and LinearDiscriminant Analysis (LDA). The classification results show thatall machine-leaning classification algorithms significantly improvethe results produced by LDA. At the leaf level, RF achieved thebest classification accuracy (94.7%), and SVM outperformed theother algorithms at both the canopy (84.5%) and communitylevels (75.5%). This study demonstrates that hyperspectral re-mote sensing and machine-learning classification has substantialpotential for the classification of Australian native forest species.
Index Terms—Forestry, remote sensing.
I. INTRODUCTION
M APPING forest species is important to effectivelymanage forests as a natural resource [1], monitor
physiological stress [2]–[7], and investigate changes in speciesrichness and diversity due to ecological disturbances suchas bush fires and cyclones [8], [9]. Remote sensing is com-plementary to traditional field surveys for obtaining speciesinformation, particularly within large and inaccessible areas.Hyperspectral remote sensing facilitates the mapping of forestspecies due to finer spectral resolution and a more continuousspectrum than conventional multispectral remote sensing. Such
Manuscript received October 05, 2012; revised January 04, 2013, April 04,2013, and July 11, 2013; accepted September 09, 2013. Date of publicationOctober 09, 2013; date of current version August 01, 2014. (Correspondingauthor: Xiao Shang.)X. Shang is with the Institute for Conservation Biology and Environmental
Management (ICBEM), School of Earth and Environmental Sciences, Univer-sity of Wollongong, NSW 2522, Australia (e-mail: [email protected]).L. A. Chisholm is with the Conservation Biology and Environmental Man-
agement (ICBEM), School of Earth and Environmental Sciences, University ofWollongong, NSW 2522, Australia (e-mail: [email protected]).Color versions of one or more of the figures in this paper are available online
at http://ieeexplore.ieee.org.Digital Object Identifier 10.1109/JSTARS.2013.2282166
characteristics have been demonstrated to detect subtle differ-ences in chlorophyll, pigments and leaf structure, leading to anincreased possibility of determining the characteristic spectralfeatures for the analysis, classification and monitoring of forestspecies [10]–[12].In Australia, the classification of native forest species using
hyperspectral remote sensing data remains a challenge. Studiesthat have attempted to classify native forest species have notbeen entirely successful, nor have results been consistent. Theability to identify different kinds of eucalyptus species whichbelong to the same genus remains a difficult task [13]–[16].Kumar and Skidmore [17] and Datt [18] have demonstratedthat using spectrometers under laboratory conditions can effec-tively detect differences in spectral reflectance for several eu-calyptus species. However, they also point out that not everyspecies can be successfully differentiated from each other ina classification scheme, due to strong similarity in their spec-tral reflectance. Many researchers have used a number of clas-sification algorithms, such as Maximum Likelihood Classifica-tion (MLC), Multiple Stepwise Discriminate Analysis (MDA)and Linear Discriminant Analysis (LDA) [10], [14], [19], toclassify the spectral reflectance of different eucalyptus species.Limited success achieved, largely attributed to similarities instructural and chemical properties. Eucalyptus leaves are pen-dulous, forming an open canopy structure. Thus, the spectralreflectance obtained from remote sensing imagery is stronglyaffected by the background resulting in the high variation inspectral reflectance measured for the same species [10]. Fur-thermore, the spectral reflectance of different eucalyptus speciesbelonging to the same genus has stronger similarities than thoseof species from different genera due to their similar biochemicalcomponents [14]. Overall, the result is that the classification al-gorithms utilized to date have not reliably detected such subtledifferences.In order to improve upon classification results, it has been
recently suggested that the use of state-of-the-art classifica-tion algorithms and object-oriented classification techniquesshould be considered [20]–[23] as a means to overcomethese limitations. Support Vector Machine (SVM), AdaBoostand Random Forest (RF) are three commonly used ma-chine-learning classification algorithms which often providehigher classification accuracies for land-cover classificationthan previously achieved [24]–[26], yet their application tovegetation-related studies using hyperspectral remote sensingdata is a relatively recent trend [27]. Increasing classification
1939-1404 © 2013 IEEE. Personal use is permitted, but republication/redistribution requires IEEE permission.See http://www.ieee.org/publications_standards/publications/rights/index.html for more information.
2482 IEEE JOURNAL OF SELECTED TOPICS IN APPLIED EARTH OBSERVATIONS AND REMOTE SENSING
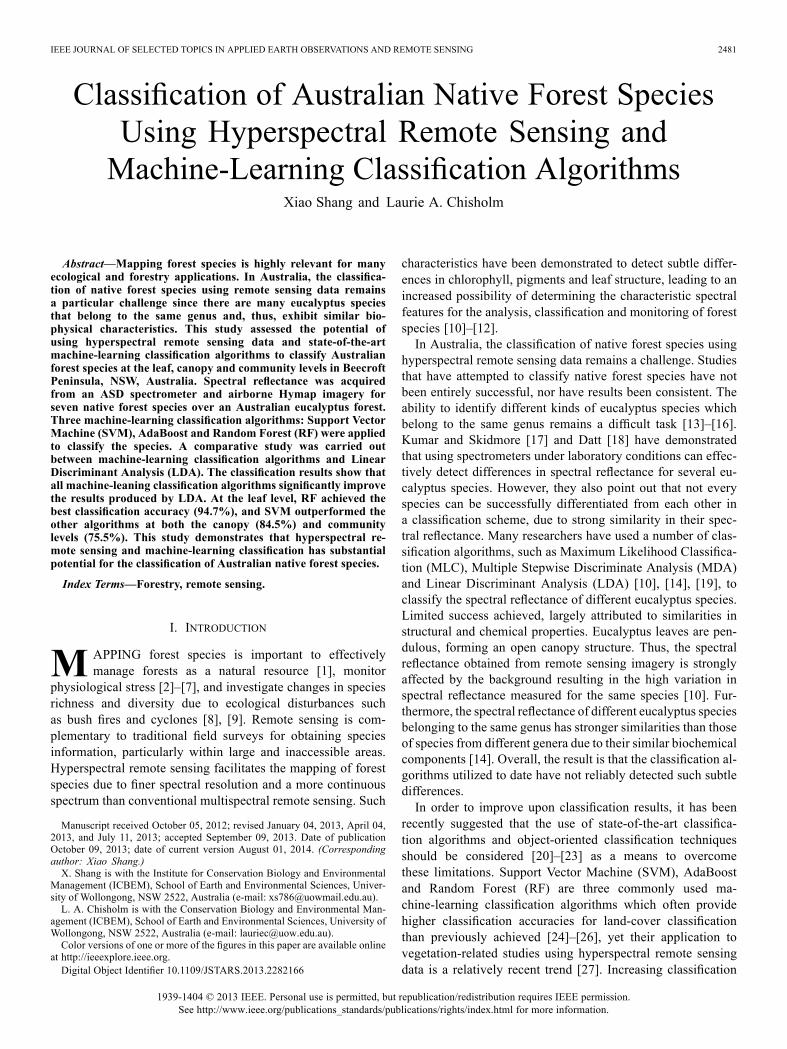
Fig. 1. (a) Study area of Beecroft Peninsula in southeastern Australia; (b) the HyMap imagery shown as the bands combination of band 79, 28, 14; (c) exampleof delineation (purple dash line) and segmentation (red solid line) of canopies; (d) example of delineation (black solid line) and segmentation (pink solid line) ofvegetation communities.
accuracies with these algorithms suggest they may performsignificantly better than conventional classification algorithms[24], [28]–[30] for vegetation studies. To date, these algorithmshave not been widely applied to the mapping of forest species[31], [32].The objective of this study was to investigate the poten-
tial of using machine-learning algorithms to classify severaleucalyptus species at the leaf, canopy and community levelswithin a eucalyptus-dominated forest on the south coast ofNew South Wales. A leaf-level study was conducted usingfield spectroscopy based on the spectral reflectance of leafsamples collected from the field. In conjunction, canopy- andcommunity-level studies were conducted based on airbornehyperspectral imagery where spectral reflectance was derivedbased on image objects representing the entire (or partial)canopy of individual tree or vegetation community patches inthe imagery. This study focused on two specific aims: 1) toinvestigate which wavelengths indicate statistically significantdifferences between species at the leaf level, and 2) to evaluatethree machine-learning algorithms—SVM, AdaBoost, andRF—at the leaf, canopy and vegetation community levels,compared with LDA classification, to assess whether thesealgorithms can effectively classify specific Australian nativeforest species.
II. METHODOLOGY
A. Study Area
The Beecroft Peninsula ( , ), islocated on the south coast of NSW in southeastern Australia(Fig. 1) and is owned by the Department of Defence (DoD).
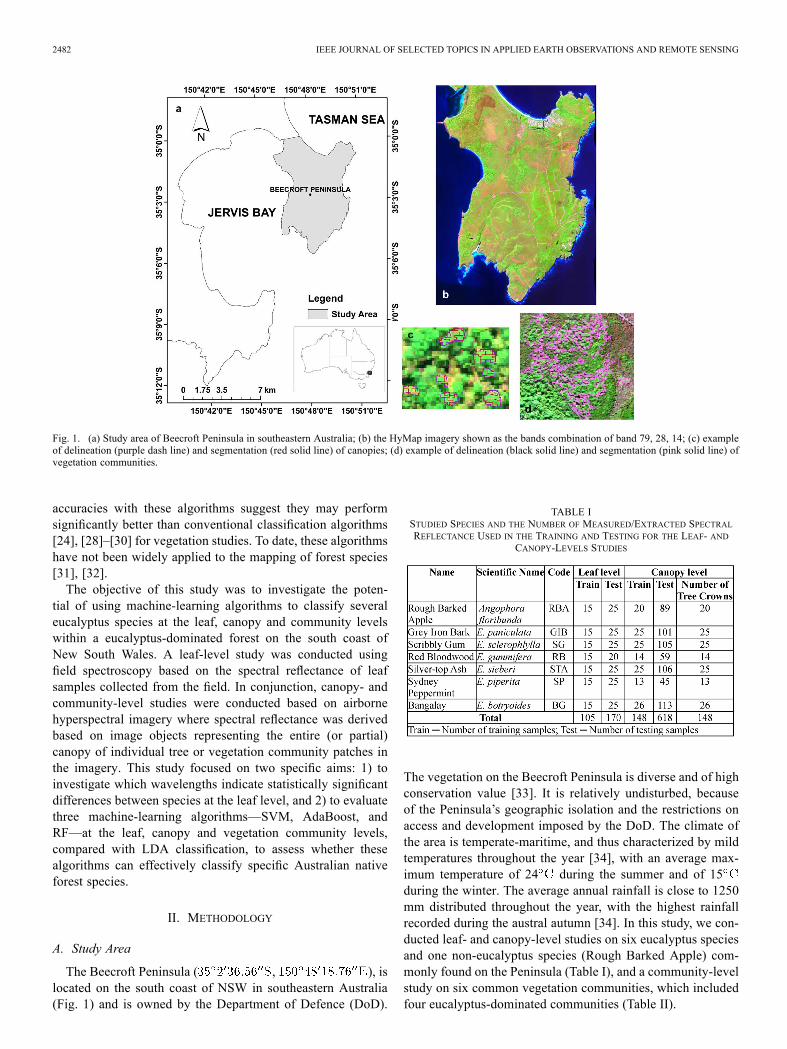
TABLE ISTUDIED SPECIES AND THE NUMBER OF MEASURED/EXTRACTED SPECTRALREFLECTANCE USED IN THE TRAINING AND TESTING FOR THE LEAF- AND
CANOPY-LEVELS STUDIES
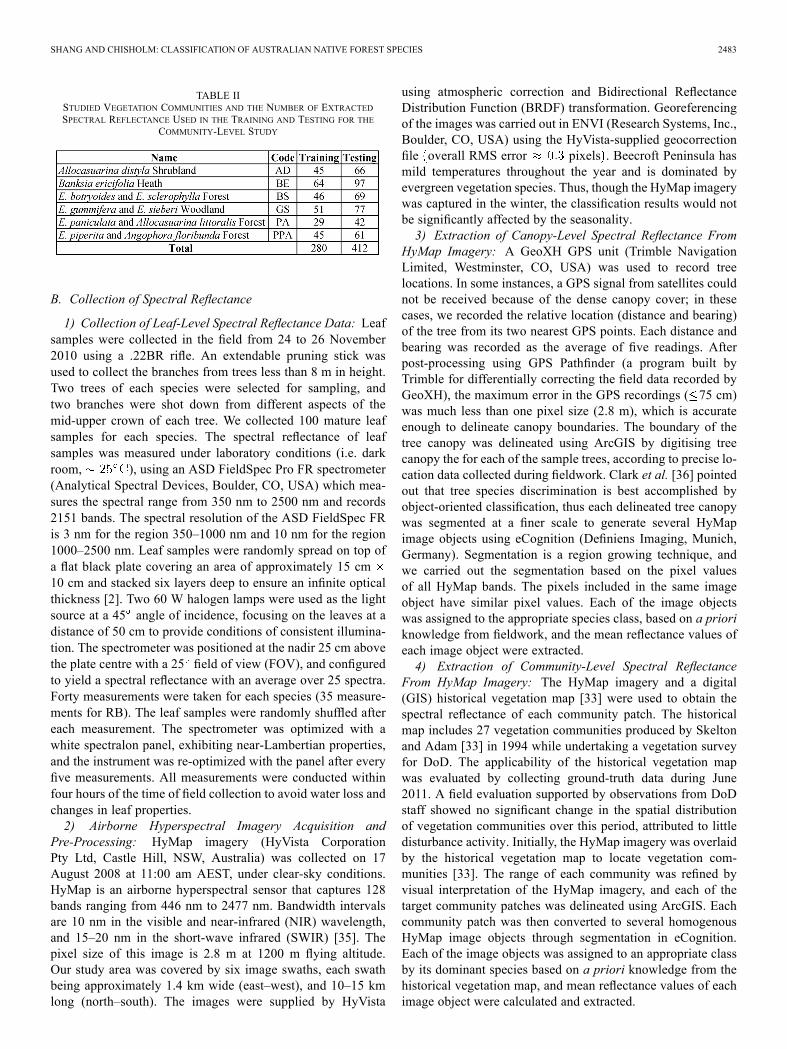
The vegetation on the Beecroft Peninsula is diverse and of highconservation value [33]. It is relatively undisturbed, becauseof the Peninsula’s geographic isolation and the restrictions onaccess and development imposed by the DoD. The climate ofthe area is temperate-maritime, and thus characterized by mildtemperatures throughout the year [34], with an average max-imum temperature of 24 during the summer and of 15during the winter. The average annual rainfall is close to 1250mm distributed throughout the year, with the highest rainfallrecorded during the austral autumn [34]. In this study, we con-ducted leaf- and canopy-level studies on six eucalyptus speciesand one non-eucalyptus species (Rough Barked Apple) com-monly found on the Peninsula (Table I), and a community-levelstudy on six common vegetation communities, which includedfour eucalyptus-dominated communities (Table II).
SHANG AND CHISHOLM: CLASSIFICATION OF AUSTRALIAN NATIVE FOREST SPECIES 2483
TABLE IISTUDIED VEGETATION COMMUNITIES AND THE NUMBER OF EXTRACTEDSPECTRAL REFLECTANCE USED IN THE TRAINING AND TESTING FOR THE
COMMUNITY-LEVEL STUDY
B. Collection of Spectral Reflectance
1) Collection of Leaf-Level Spectral Reflectance Data: Leafsamples were collected in the field from 24 to 26 November2010 using a .22BR rifle. An extendable pruning stick wasused to collect the branches from trees less than 8 m in height.Two trees of each species were selected for sampling, andtwo branches were shot down from different aspects of themid-upper crown of each tree. We collected 100 mature leafsamples for each species. The spectral reflectance of leafsamples was measured under laboratory conditions (i.e. darkroom, ), using an ASD FieldSpec Pro FR spectrometer(Analytical Spectral Devices, Boulder, CO, USA) which mea-sures the spectral range from 350 nm to 2500 nm and records2151 bands. The spectral resolution of the ASD FieldSpec FRis 3 nm for the region 350–1000 nm and 10 nm for the region1000–2500 nm. Leaf samples were randomly spread on top ofa flat black plate covering an area of approximately 15 cm10 cm and stacked six layers deep to ensure an infinite opticalthickness [2]. Two 60 W halogen lamps were used as the lightsource at a 45 angle of incidence, focusing on the leaves at adistance of 50 cm to provide conditions of consistent illumina-tion. The spectrometer was positioned at the nadir 25 cm abovethe plate centre with a 25 field of view (FOV), and configuredto yield a spectral reflectance with an average over 25 spectra.Forty measurements were taken for each species (35 measure-ments for RB). The leaf samples were randomly shuffled aftereach measurement. The spectrometer was optimized with awhite spectralon panel, exhibiting near-Lambertian properties,and the instrument was re-optimized with the panel after everyfive measurements. All measurements were conducted withinfour hours of the time of field collection to avoid water loss andchanges in leaf properties.2) Airborne Hyperspectral Imagery Acquisition and
Pre-Processing: HyMap imagery (HyVista CorporationPty Ltd, Castle Hill, NSW, Australia) was collected on 17August 2008 at 11:00 am AEST, under clear-sky conditions.HyMap is an airborne hyperspectral sensor that captures 128bands ranging from 446 nm to 2477 nm. Bandwidth intervalsare 10 nm in the visible and near-infrared (NIR) wavelength,and 15–20 nm in the short-wave infrared (SWIR) [35]. Thepixel size of this image is 2.8 m at 1200 m flying altitude.Our study area was covered by six image swaths, each swathbeing approximately 1.4 km wide (east–west), and 10–15 kmlong (north–south). The images were supplied by HyVista
using atmospheric correction and Bidirectional ReflectanceDistribution Function (BRDF) transformation. Georeferencingof the images was carried out in ENVI (Research Systems, Inc.,Boulder, CO, USA) using the HyVista-supplied geocorrectionfile overall RMS error pixels . Beecroft Peninsula hasmild temperatures throughout the year and is dominated byevergreen vegetation species. Thus, though the HyMap imagerywas captured in the winter, the classification results would notbe significantly affected by the seasonality.3) Extraction of Canopy-Level Spectral Reflectance From
HyMap Imagery: A GeoXH GPS unit (Trimble NavigationLimited, Westminster, CO, USA) was used to record treelocations. In some instances, a GPS signal from satellites couldnot be received because of the dense canopy cover; in thesecases, we recorded the relative location (distance and bearing)of the tree from its two nearest GPS points. Each distance andbearing was recorded as the average of five readings. Afterpost-processing using GPS Pathfinder (a program built byTrimble for differentially correcting the field data recorded byGeoXH), the maximum error in the GPS recordings ( 75 cm)was much less than one pixel size (2.8 m), which is accurateenough to delineate canopy boundaries. The boundary of thetree canopy was delineated using ArcGIS by digitising treecanopy the for each of the sample trees, according to precise lo-cation data collected during fieldwork. Clark et al. [36] pointedout that tree species discrimination is best accomplished byobject-oriented classification, thus each delineated tree canopywas segmented at a finer scale to generate several HyMapimage objects using eCognition (Definiens Imaging, Munich,Germany). Segmentation is a region growing technique, andwe carried out the segmentation based on the pixel valuesof all HyMap bands. The pixels included in the same imageobject have similar pixel values. Each of the image objectswas assigned to the appropriate species class, based on a prioriknowledge from fieldwork, and the mean reflectance values ofeach image object were extracted.4) Extraction of Community-Level Spectral Reflectance
From HyMap Imagery: The HyMap imagery and a digital(GIS) historical vegetation map [33] were used to obtain thespectral reflectance of each community patch. The historicalmap includes 27 vegetation communities produced by Skeltonand Adam [33] in 1994 while undertaking a vegetation surveyfor DoD. The applicability of the historical vegetation mapwas evaluated by collecting ground-truth data during June2011. A field evaluation supported by observations from DoDstaff showed no significant change in the spatial distributionof vegetation communities over this period, attributed to littledisturbance activity. Initially, the HyMap imagery was overlaidby the historical vegetation map to locate vegetation com-munities [33]. The range of each community was refined byvisual interpretation of the HyMap imagery, and each of thetarget community patches was delineated using ArcGIS. Eachcommunity patch was then converted to several homogenousHyMap image objects through segmentation in eCognition.Each of the image objects was assigned to an appropriate classby its dominant species based on a priori knowledge from thehistorical vegetation map, and mean reflectance values of eachimage object were calculated and extracted.
2484 IEEE JOURNAL OF SELECTED TOPICS IN APPLIED EARTH OBSERVATIONS AND REMOTE SENSING
C. Machine-Learning Algorithms
Three machine-learning algorithms, Support Vector Machine(SVM), AdaBoost and Random Forest (RF), commonly usedin remote sensing land-cover classification, were assessed inthis study for classification of certain Australian native forestspecies. The machine-learning classification results were com-pared with LDA classification which has been extensively usedin vegetation studies [36].The supervised machine-learning method, SVM, based on
statistical learning theory, was originally developed to solve thebinary classification problem [37]. The SVM classification sep-arates the classes with a decision surface (or a set of decisionsurfaces). This decision surface, called hyperplane, maximizesthe functional margin between classes, while minimizing thetraining error [38]. For multiclass problems, SVM is to convertthe single multiclass problem into multiple binary classificationproblems [39]. In addition, kernel functions are commonly usedto construct a nonlinear hyperplane. Here, we used radial basisfunction (RBF) kernel selected using 10-fold cross-validationtest (see Section II-E).AdaBoost [40] is a supervised machine-learning method. It
determines classification rules from samples by constructing a“strong” classifier through the combination of many “weak”classifiers [41]. Initially, all of the samples are equallyweighted, but for the following iteration, the weights whichindicate the importance of samples in the classification areindividually modified [42]. The weights of the training ob-servations misclassified by the classifier in previous roundsare increased. Conversely, the weights will be decreasedfor samples that were correctly classified [42]. Therefore,AdaBoost improves classifier performance by focusing onthe data that was misclassified in the previous classificationiteration rounds [41].RF [43] is a tree-based machine-learning classification al-
gorithm [44]. RF classification uses an ensemble classificationmethod which consists of a set of decision tree classifiers, andthe improved bootstrap method [45]. The input vectors are ran-domly sampled for each of the tree classifiers independently,and each tree casts a unit vote for the most popular class toclassify the input vector. Specifically, for each of Ntrees iter-ations (Ntrees is the number of trees to build), a new boot-strap sample from the training set will be selected to build anun-pruned tree onto the bootstrap. At each internal node, mtrypredictors (number of predictors sampled for splitting at node)are randomly selected, and used to determine the best split. Afterall of the iteration steps, RF outputs the majority vote from allindividually trained trees.Linear Discriminant Analysis (LDA), developed in 1936 by
Fisher, is an effective technique for data classification. LDA hasbeen extensively used in statistics, pattern recognition, and ma-chine-learning to find a linear combination of features that char-acterizes or separates two or more classes of objects [41]. LDAmaximizes the ratio of variance between the classes, to the vari-ance within the classes, to guarantee the maximum separation,and it subsequently generates a decision surface between theclasses [46].
D. Spectral Discriminative Analysis
Analysis of variance (ANOVA) is a statistical method to as-sess statistically significant differences between two or moresample groups. It has beenwidely used in species discriminationstudies to identify the wavelengths that show statistically signif-icant differences between species [16], [47]–[49]. For studiesof species discrimination, a Tukey-Kramer test [50] is com-monly used after an ANOVA test to determine which speciespairs are responsible for a significant result. In order to iden-tify statistically different spectral wavelengths for species sep-aration, a one-way ANOVA and a post-hoc Tukey-Kramer testwere carried out at the leaf level in present study. There were21 combinations based on our seven tree species. Therefore,if a wavelength can be effectively used to distinguish betweenall the species, its frequency (the number of the combinationsshowing significant spectral differences at certain wavelengthfor pair-wise comparisons) would be 21.
E. Classification
The three machine-learning classification algorithms, SVM,AdaBoost and RF, were applied at the leaf, canopy and commu-nity levels. In order to assess their performance in the classifi-cation of forest species, the comparison were carried out amongthese algorithms at each level. Their classification results werealso compared with the LDA classification method commonlyused in the classification of forest species [12], [19], [36], [51]to assess whether these machine-learning algorithms can pro-duce a better results than a traditional classification method. Ateach level, approximately 40% of measured/extracted spectralreflectance data were randomly selected for each species as atraining set and the other spectral reflectance data were retainedas the testing set. The sizes of training and testing sets in theleaf-, canopy-, and community-level studies were summarizedin the Table I and Table II.Parameter tuning for machine-learning algorithms used a
10-fold cross-validation, implemented with the range of param-eter values from 100 to 1500 interval for parametersC (the parameter C controls the trade-off between errors ofthe SVM on training data and margin maximization) in SVM,Ntrees in RF and iterations in AdaBoost; and range from 0.1 to2 interval for parameter (parameter controls theshape of the separating hyperplane) in SVM. The SVM wascarried out using an RBF kernel in an open source packageLIBSVM [52], with two user-defined parameters: Cand . AdaBoost and RF were carried out using the Rpackages ‘adabag’ and ‘randomForest’, respectively. AdaBoostwas conducted using 500 iterations. RF has two user-definedparameters: Ntrees and mtry [43]. The algorithm is not sensitiveto mtry and typically number of bandsperforms reasonably well [45]. We set , andNtrees from 10-fold cross-validation test.As the studied algorithms require training and testing sam-
ples for classification, the samples were split into a training setand a testing set. At each level, approximately 40 per cent ofmeasured/extracted spectral reflectance was randomly selectedfor each species as a training set, with the remaining spectralreflectance retained as the testing set.
SHANG AND CHISHOLM: CLASSIFICATION OF AUSTRALIAN NATIVE FOREST SPECIES 2485
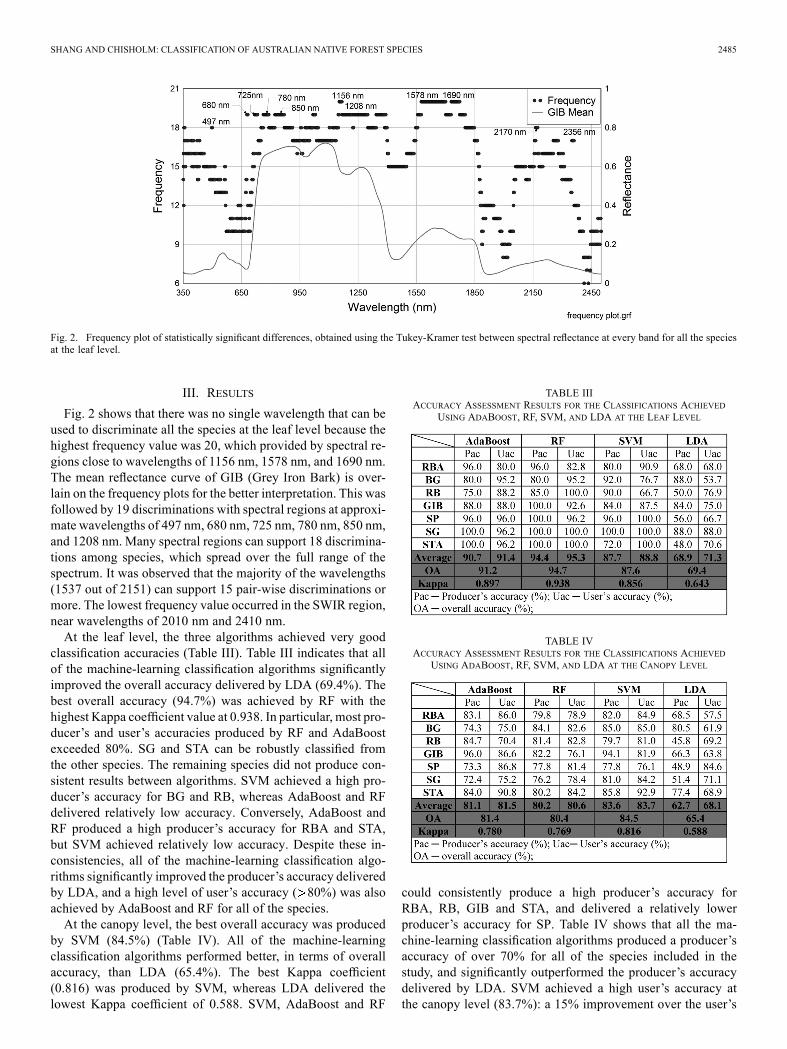
Fig. 2. Frequency plot of statistically significant differences, obtained using the Tukey-Kramer test between spectral reflectance at every band for all the speciesat the leaf level.
III. RESULTS
Fig. 2 shows that there was no single wavelength that can beused to discriminate all the species at the leaf level because thehighest frequency value was 20, which provided by spectral re-gions close to wavelengths of 1156 nm, 1578 nm, and 1690 nm.The mean reflectance curve of GIB (Grey Iron Bark) is over-lain on the frequency plots for the better interpretation. This wasfollowed by 19 discriminations with spectral regions at approxi-mate wavelengths of 497 nm, 680 nm, 725 nm, 780 nm, 850 nm,and 1208 nm. Many spectral regions can support 18 discrimina-tions among species, which spread over the full range of thespectrum. It was observed that the majority of the wavelengths(1537 out of 2151) can support 15 pair-wise discriminations ormore. The lowest frequency value occurred in the SWIR region,near wavelengths of 2010 nm and 2410 nm.At the leaf level, the three algorithms achieved very good
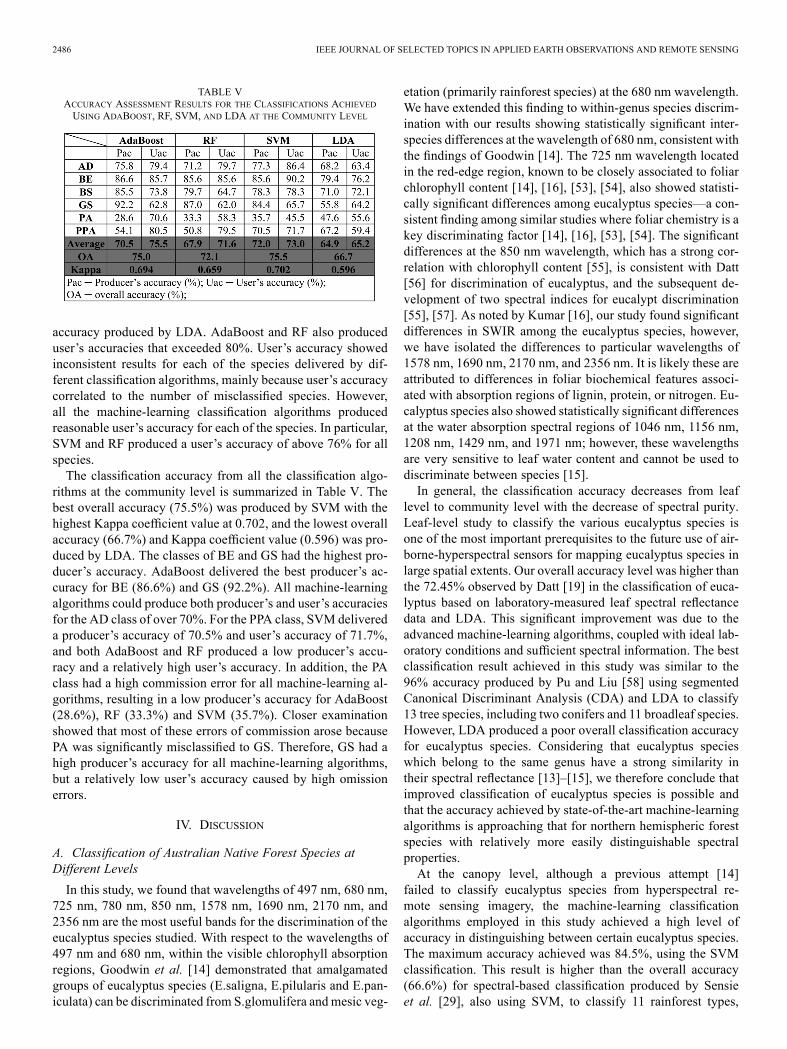
classification accuracies (Table III). Table III indicates that allof the machine-learning classification algorithms significantlyimproved the overall accuracy delivered by LDA (69.4%). Thebest overall accuracy (94.7%) was achieved by RF with thehighest Kappa coefficient value at 0.938. In particular, most pro-ducer’s and user’s accuracies produced by RF and AdaBoostexceeded 80%. SG and STA can be robustly classified fromthe other species. The remaining species did not produce con-sistent results between algorithms. SVM achieved a high pro-ducer’s accuracy for BG and RB, whereas AdaBoost and RFdelivered relatively low accuracy. Conversely, AdaBoost andRF produced a high producer’s accuracy for RBA and STA,but SVM achieved relatively low accuracy. Despite these in-consistencies, all of the machine-learning classification algo-rithms significantly improved the producer’s accuracy deliveredby LDA, and a high level of user’s accuracy ( 80%) was alsoachieved by AdaBoost and RF for all of the species.At the canopy level, the best overall accuracy was produced
by SVM (84.5%) (Table IV). All of the machine-learningclassification algorithms performed better, in terms of overallaccuracy, than LDA (65.4%). The best Kappa coefficient(0.816) was produced by SVM, whereas LDA delivered thelowest Kappa coefficient of 0.588. SVM, AdaBoost and RF
TABLE IIIACCURACY ASSESSMENT RESULTS FOR THE CLASSIFICATIONS ACHIEVED
USING ADABOOST, RF, SVM, AND LDA AT THE LEAF LEVEL
TABLE IVACCURACY ASSESSMENT RESULTS FOR THE CLASSIFICATIONS ACHIEVED
USING ADABOOST, RF, SVM, AND LDA AT THE CANOPY LEVEL
could consistently produce a high producer’s accuracy forRBA, RB, GIB and STA, and delivered a relatively lowerproducer’s accuracy for SP. Table IV shows that all the ma-chine-learning classification algorithms produced a producer’saccuracy of over 70% for all of the species included in thestudy, and significantly outperformed the producer’s accuracydelivered by LDA. SVM achieved a high user’s accuracy atthe canopy level (83.7%): a 15% improvement over the user’s
2486 IEEE JOURNAL OF SELECTED TOPICS IN APPLIED EARTH OBSERVATIONS AND REMOTE SENSING
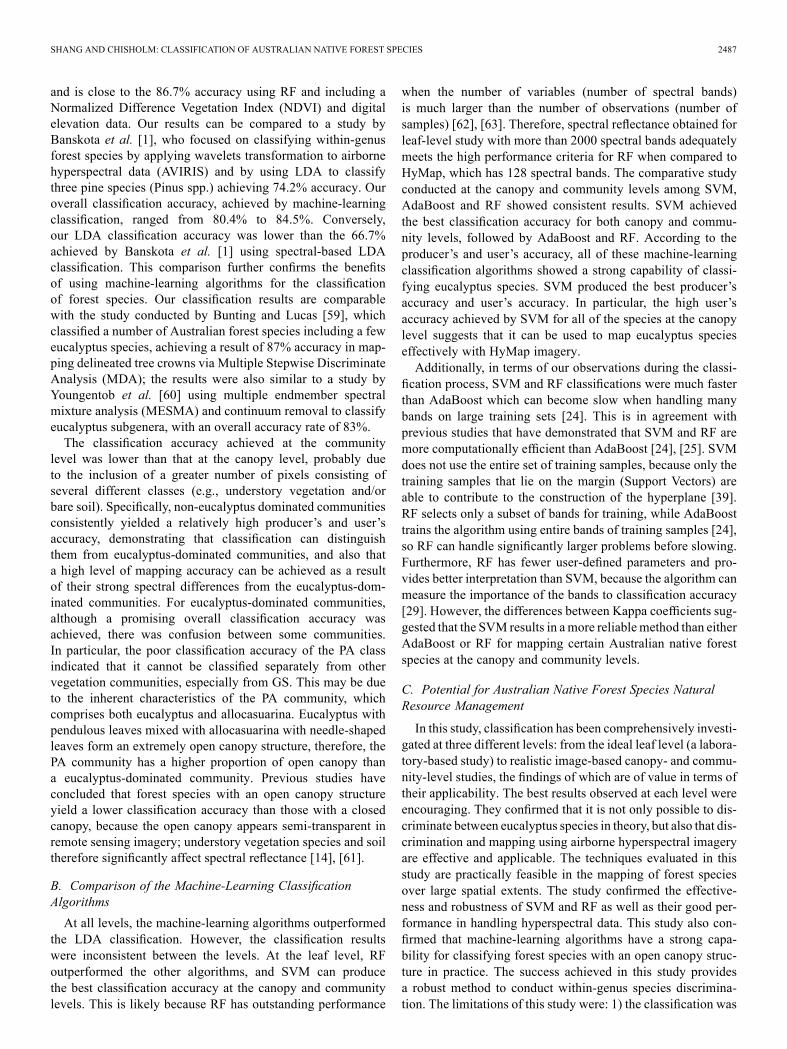
TABLE VACCURACY ASSESSMENT RESULTS FOR THE CLASSIFICATIONS ACHIEVEDUSING ADABOOST, RF, SVM, AND LDA AT THE COMMUNITY LEVEL
accuracy produced by LDA. AdaBoost and RF also produceduser’s accuracies that exceeded 80%. User’s accuracy showedinconsistent results for each of the species delivered by dif-ferent classification algorithms, mainly because user’s accuracycorrelated to the number of misclassified species. However,all the machine-learning classification algorithms producedreasonable user’s accuracy for each of the species. In particular,SVM and RF produced a user’s accuracy of above 76% for allspecies.The classification accuracy from all the classification algo-
rithms at the community level is summarized in Table V. Thebest overall accuracy (75.5%) was produced by SVM with thehighest Kappa coefficient value at 0.702, and the lowest overallaccuracy (66.7%) and Kappa coefficient value (0.596) was pro-duced by LDA. The classes of BE and GS had the highest pro-ducer’s accuracy. AdaBoost delivered the best producer’s ac-curacy for BE (86.6%) and GS (92.2%). All machine-learningalgorithms could produce both producer’s and user’s accuraciesfor the AD class of over 70%. For the PPA class, SVM delivereda producer’s accuracy of 70.5% and user’s accuracy of 71.7%,and both AdaBoost and RF produced a low producer’s accu-racy and a relatively high user’s accuracy. In addition, the PAclass had a high commission error for all machine-learning al-gorithms, resulting in a low producer’s accuracy for AdaBoost(28.6%), RF (33.3%) and SVM (35.7%). Closer examinationshowed that most of these errors of commission arose becausePA was significantly misclassified to GS. Therefore, GS had ahigh producer’s accuracy for all machine-learning algorithms,but a relatively low user’s accuracy caused by high omissionerrors.
IV. DISCUSSION
A. Classification of Australian Native Forest Species atDifferent Levels
In this study, we found that wavelengths of 497 nm, 680 nm,725 nm, 780 nm, 850 nm, 1578 nm, 1690 nm, 2170 nm, and2356 nm are the most useful bands for the discrimination of theeucalyptus species studied. With respect to the wavelengths of497 nm and 680 nm, within the visible chlorophyll absorptionregions, Goodwin et al. [14] demonstrated that amalgamatedgroups of eucalyptus species (E.saligna, E.pilularis and E.pan-iculata) can be discriminated from S.glomulifera and mesic veg-
etation (primarily rainforest species) at the 680 nm wavelength.We have extended this finding to within-genus species discrim-ination with our results showing statistically significant inter-species differences at the wavelength of 680 nm, consistent withthe findings of Goodwin [14]. The 725 nm wavelength locatedin the red-edge region, known to be closely associated to foliarchlorophyll content [14], [16], [53], [54], also showed statisti-cally significant differences among eucalyptus species—a con-sistent finding among similar studies where foliar chemistry is akey discriminating factor [14], [16], [53], [54]. The significantdifferences at the 850 nm wavelength, which has a strong cor-relation with chlorophyll content [55], is consistent with Datt[56] for discrimination of eucalyptus, and the subsequent de-velopment of two spectral indices for eucalypt discrimination[55], [57]. As noted by Kumar [16], our study found significantdifferences in SWIR among the eucalyptus species, however,we have isolated the differences to particular wavelengths of1578 nm, 1690 nm, 2170 nm, and 2356 nm. It is likely these areattributed to differences in foliar biochemical features associ-ated with absorption regions of lignin, protein, or nitrogen. Eu-calyptus species also showed statistically significant differencesat the water absorption spectral regions of 1046 nm, 1156 nm,1208 nm, 1429 nm, and 1971 nm; however, these wavelengthsare very sensitive to leaf water content and cannot be used todiscriminate between species [15].In general, the classification accuracy decreases from leaf
level to community level with the decrease of spectral purity.Leaf-level study to classify the various eucalyptus species isone of the most important prerequisites to the future use of air-borne-hyperspectral sensors for mapping eucalyptus species inlarge spatial extents. Our overall accuracy level was higher thanthe 72.45% observed by Datt [19] in the classification of euca-lyptus based on laboratory-measured leaf spectral reflectancedata and LDA. This significant improvement was due to theadvanced machine-learning algorithms, coupled with ideal lab-oratory conditions and sufficient spectral information. The bestclassification result achieved in this study was similar to the96% accuracy produced by Pu and Liu [58] using segmentedCanonical Discriminant Analysis (CDA) and LDA to classify13 tree species, including two conifers and 11 broadleaf species.However, LDA produced a poor overall classification accuracyfor eucalyptus species. Considering that eucalyptus specieswhich belong to the same genus have a strong similarity intheir spectral reflectance [13]–[15], we therefore conclude thatimproved classification of eucalyptus species is possible andthat the accuracy achieved by state-of-the-art machine-learningalgorithms is approaching that for northern hemispheric forestspecies with relatively more easily distinguishable spectralproperties.At the canopy level, although a previous attempt [14]
failed to classify eucalyptus species from hyperspectral re-mote sensing imagery, the machine-learning classificationalgorithms employed in this study achieved a high level ofaccuracy in distinguishing between certain eucalyptus species.The maximum accuracy achieved was 84.5%, using the SVMclassification. This result is higher than the overall accuracy(66.6%) for spectral-based classification produced by Sensieet al. [29], also using SVM, to classify 11 rainforest types,
SHANG AND CHISHOLM: CLASSIFICATION OF AUSTRALIAN NATIVE FOREST SPECIES 2487
and is close to the 86.7% accuracy using RF and including aNormalized Difference Vegetation Index (NDVI) and digitalelevation data. Our results can be compared to a study byBanskota et al. [1], who focused on classifying within-genusforest species by applying wavelets transformation to airbornehyperspectral data (AVIRIS) and by using LDA to classifythree pine species (Pinus spp.) achieving 74.2% accuracy. Ouroverall classification accuracy, achieved by machine-learningclassification, ranged from 80.4% to 84.5%. Conversely,our LDA classification accuracy was lower than the 66.7%achieved by Banskota et al. [1] using spectral-based LDAclassification. This comparison further confirms the benefitsof using machine-learning algorithms for the classificationof forest species. Our classification results are comparablewith the study conducted by Bunting and Lucas [59], whichclassified a number of Australian forest species including a feweucalyptus species, achieving a result of 87% accuracy in map-ping delineated tree crowns via Multiple Stepwise DiscriminateAnalysis (MDA); the results were also similar to a study byYoungentob et al. [60] using multiple endmember spectralmixture analysis (MESMA) and continuum removal to classifyeucalyptus subgenera, with an overall accuracy rate of 83%.The classification accuracy achieved at the community
level was lower than that at the canopy level, probably dueto the inclusion of a greater number of pixels consisting ofseveral different classes (e.g., understory vegetation and/orbare soil). Specifically, non-eucalyptus dominated communitiesconsistently yielded a relatively high producer’s and user’saccuracy, demonstrating that classification can distinguishthem from eucalyptus-dominated communities, and also thata high level of mapping accuracy can be achieved as a resultof their strong spectral differences from the eucalyptus-dom-inated communities. For eucalyptus-dominated communities,although a promising overall classification accuracy wasachieved, there was confusion between some communities.In particular, the poor classification accuracy of the PA classindicated that it cannot be classified separately from othervegetation communities, especially from GS. This may be dueto the inherent characteristics of the PA community, whichcomprises both eucalyptus and allocasuarina. Eucalyptus withpendulous leaves mixed with allocasuarina with needle-shapedleaves form an extremely open canopy structure, therefore, thePA community has a higher proportion of open canopy thana eucalyptus-dominated community. Previous studies haveconcluded that forest species with an open canopy structureyield a lower classification accuracy than those with a closedcanopy, because the open canopy appears semi-transparent inremote sensing imagery; understory vegetation species and soiltherefore significantly affect spectral reflectance [14], [61].
B. Comparison of the Machine-Learning ClassificationAlgorithms
At all levels, the machine-learning algorithms outperformedthe LDA classification. However, the classification resultswere inconsistent between the levels. At the leaf level, RFoutperformed the other algorithms, and SVM can producethe best classification accuracy at the canopy and communitylevels. This is likely because RF has outstanding performance
when the number of variables (number of spectral bands)is much larger than the number of observations (number ofsamples) [62], [63]. Therefore, spectral reflectance obtained forleaf-level study with more than 2000 spectral bands adequatelymeets the high performance criteria for RF when compared toHyMap, which has 128 spectral bands. The comparative studyconducted at the canopy and community levels among SVM,AdaBoost and RF showed consistent results. SVM achievedthe best classification accuracy for both canopy and commu-nity levels, followed by AdaBoost and RF. According to theproducer’s and user’s accuracy, all of these machine-learningclassification algorithms showed a strong capability of classi-fying eucalyptus species. SVM produced the best producer’saccuracy and user’s accuracy. In particular, the high user’saccuracy achieved by SVM for all of the species at the canopylevel suggests that it can be used to map eucalyptus specieseffectively with HyMap imagery.Additionally, in terms of our observations during the classi-
fication process, SVM and RF classifications were much fasterthan AdaBoost which can become slow when handling manybands on large training sets [24]. This is in agreement withprevious studies that have demonstrated that SVM and RF aremore computationally efficient than AdaBoost [24], [25]. SVMdoes not use the entire set of training samples, because only thetraining samples that lie on the margin (Support Vectors) areable to contribute to the construction of the hyperplane [39].RF selects only a subset of bands for training, while AdaBoosttrains the algorithm using entire bands of training samples [24],so RF can handle significantly larger problems before slowing.Furthermore, RF has fewer user-defined parameters and pro-vides better interpretation than SVM, because the algorithm canmeasure the importance of the bands to classification accuracy[29]. However, the differences between Kappa coefficients sug-gested that the SVM results in amore reliablemethod than eitherAdaBoost or RF for mapping certain Australian native forestspecies at the canopy and community levels.
C. Potential for Australian Native Forest Species NaturalResource Management
In this study, classification has been comprehensively investi-gated at three different levels: from the ideal leaf level (a labora-tory-based study) to realistic image-based canopy- and commu-nity-level studies, the findings of which are of value in terms oftheir applicability. The best results observed at each level wereencouraging. They confirmed that it is not only possible to dis-criminate between eucalyptus species in theory, but also that dis-crimination and mapping using airborne hyperspectral imageryare effective and applicable. The techniques evaluated in thisstudy are practically feasible in the mapping of forest speciesover large spatial extents. The study confirmed the effective-ness and robustness of SVM and RF as well as their good per-formance in handling hyperspectral data. This study also con-firmed that machine-learning algorithms have a strong capa-bility for classifying forest species with an open canopy struc-ture in practice. The success achieved in this study providesa robust method to conduct within-genus species discrimina-tion. The limitations of this study were: 1) the classification was
2488 IEEE JOURNAL OF SELECTED TOPICS IN APPLIED EARTH OBSERVATIONS AND REMOTE SENSING
based on the spectral information only; and 2) airborne-basedhyperspectral imagery is relatively expensive. In order to over-come the first limitations, further studies are currently being un-dertaken to improve the current classification results by: 1) in-creasing the ability to discriminate of the species by using com-plementary texture measures; and 2) reducing the spectral vari-ation within a species by applying data transformation methods.In addition, with the advances in technology, hyperspectral im-agery may become more affordable in the near future. The out-comes from this study therefore, have major implications for themapping, assessment and conservation of forests and the diver-sity of forest species.
V. CONCLUSION
This study has demonstrated that the application of advancedmachine-learning classification algorithms to hyperspectralremote sensing data can effectively classify between spe-cific Australian native forest species at the leaf, canopy, andcommunity levels. Previous studies [13], [14] suggested thateucalyptus species are difficult to classify from each other usinghyperspectral remote sensing imagery. This study howeverdelivered encouraging results for the use of hyperspectralimagery to classify some eucalyptus species at each level(Leaf level 94.7%; Canopy level 84.5%; Community level75.5%). Three machine-learning classification algorithms,SVM, AdaBoost, and RF, were evaluated and compared withthe LDA classification algorithm. All of these classificationalgorithms significantly improved the LDA classification re-sult; RF produced the best classification result for the leaf-levelstudy, and SVM achieved the best classification result at bothcanopy and community levels. Therefore, RF and SVM werefound to be the optimal algorithms for classification of certaineucalyptus species. In summary, the use of hyperspectral dataand machine-learning algorithms has a great potential to mapcertain eucalyptus species. This study highlighted the poten-tial for adoption of these methods by industry with respectof Australian native forest species, particularly eucalyptusspecies. This could lead to improvements in environmentalsustainability through better management and protection ofnative vegetation communities.
ACKNOWLEDGMENT
This research was undertaken as part of a Ph.D. at the Uni-versity of Wollongong (UoW), with the benefit of a UniversityPostgraduate Award scholarship. Resources and facilities forthis study were supported by the Spatial Analysis Laboratoriesof the School of Earth and Environmental Sciences, UoW.Funding from the Institute for Conservation Biology and En-vironmental Management Research Centre (ICBEM) of UoWis acknowledged. The authors would like to thank BeecroftWeapons Range of the Australian Government’s Departmentof Defence for providing permission, facility and assistanceto carry out the fieldwork, and Brent Petersen (UoW) for hisassistance in the field. The authors also thank HyVista for sup-plying Hymap imagery, and GIS Environmental Consultantsfor providing spatial data for this study.
REFERENCES
[1] A. Banskota et al., “Improving within-genus tree species discrimina-tion using the discrete wavelet transform applied to airborne hyper-spectral data,” Int. J. Remote Sens., vol. 32, pp. 3551–3563, 2011.
[2] K. Barry et al., “Characterizing eucalypt leaf phenology and stress withspectral analysis,” in Innovations in Remote Sensing and Photogram-metry. Berlin, Heidelberg: Springer, 2009, pt. 3, pp. 193–209.
[3] N. C. Coops et al., “Prediction of eucalypt foliage nitrogen contentfrom satellite-derived hyperspectral data,” IEEE Trans. Geosci. Re-mote Sens., vol. 41, pp. 1338–1346, Jun. 2003.
[4] S. Delalieux et al., “Detection of biotic stress (Venturia inaequalis)in apple trees using hyperspectral data: Non-parametric statistical ap-proaches and physiological implications,” Eur. J. Agron., vol. 27, pp.130–143, 2007.
[5] S. M. Kochubey and T. A. Kazantsev, “Changes in the first derivativesof leaf reflectance spectra of various plants induced by variations ofchlorophyll content,” J. Plant Physiol., vol. 164, pp. 1648–1655, Dec.2007.
[6] I. Moorthy et al., “Estimating chlorophyll concentration in conifer nee-dles with hyperspectral data: An assessment at the needle and canopylevel,” Remote Sens. Environ., vol. 112, pp. 2824–2838, 2008.
[7] C. Wu et al., “Estimating chlorophyll content from hyperspectral veg-etation indices: Modeling and validation,” Agricult. Forest Meteorol.,vol. 148, pp. 1230–1241, 2008.
[8] I. Keramitsoglou et al., “Reliable, accurate and timely forest map-ping for wildfire management using ASTER and Hyperion satelliteimagery,” Forest Ecol. Manag., vol. 255, pp. 3556–3562, 2008.
[9] G. G. Wang, “Fire severity in relation to canopy composition withinburned boreal mixedwood stands,” Forest Ecol. Manag., vol. 163, pp.85–92, 2002.
[10] R. Lucas et al., “Classification of Australian forest communities usingaerial photography, CASI and HyMap data,” Remote Sens. Environ.,vol. 112, pp. 2088–2103, 2008.
[11] M. Kalacska et al., “Hyperspectral discrimination of tropical dryforest lianas and trees: Comparative data reduction approaches atthe leaf and canopy levels,” Remote Sens. Environ., vol. 109, pp.406–415, 2007.
[12] L. Wang and W. P. Sousa, “Distinguishing mangrove species with lab-oratory measurements of hyperspectral leaf reflectance,” Int. J. RemoteSens., vol. 30, pp. 1267–1281, 2009.
[13] N. Coops et al., “Assessment of crown condition in eucalypt vegetationby remotely sensed optical indices,” J. Environm. Quality, vol. 33, pp.956–964, 2004.
[14] N. Goodwin et al., “Classifying eucalyptus forests with high spatialand spectral resolution imagery: An investigation of individual speciesand vegetation communities,” Austr. J. Botany, vol. 53, pp. 337–345,2005.
[15] L. Kumar, “A comparison of reflectance characteristics of some Aus-tralian eucalyptus species based on high spectral resolution data—Dis-criminating using the visible and NIR regions,” J. Spatial Sci., vol. 52,pp. 51–64, Dec. 2007.
[16] L. Kumar et al., “Leaf level experiments to discriminate between eu-calyptus species using high spectral resolution reflectance data: Useof derivatives, ratios and vegetation indices,” Geocarto Int., pp. 1–18,2010.
[17] L. Kumar and A. K. Skidmore, “Use of derivative spectroscopy to iden-tify regions of difference between some Australian eucalypt species,”presented at the 9th Australasian Remote Sensing and PhotogrammetryConf., Sydney, Australia, 1998.
[18] B. Datt, “Remote sensing of foliar biochemistry and biophysical prop-erties in eucalyptus species: Application of high spectral resolutionreflectance measurement,” Ph.D. dissertation, Sch. Geography, Univ.New South Wales, Sydney, Australia, 1999.
[19] B. Datt, “Recognition of eucalyptus forest species using hyperspectralreflectance data,” in Proc. IEEE IGARSS, 2000, pp. 1405–1407.
[20] E. Adam et al., “Multispectral and hyperspectral remote sensing foridentification and mapping of wetland vegetation: A review,”WetlandsEcol. Manag., vol. 18, pp. 281–296, 2010.
[21] G. Mountrakis et al., “Support vector machines in remote sensing: Areview,” ISPRS J. Photogramm. Remote Sens., vol. 66, pp. 247–259,2011.
[22] B.W. Heumann, “Satellite remote sensing of mangrove forests: Recentadvances and future opportunities,” Progr. Phys. Geogr., vol. 35, pp.87–108, Feb. 1, 2011.
[23] J.Wu andD. L. Peng, “Advances in researches on hyperspectral remotesensing forestry information-extracting technology,” Spectroscopy andSpectral Analysis, vol. 31, pp. 2305–2312, Sep. 2011.
SHANG AND CHISHOLM: CLASSIFICATION OF AUSTRALIAN NATIVE FOREST SPECIES 2489
[24] J. C.-W. Chan and D. Paelinckx, “Evaluation of Random Forest andAdaboost tree-based ensemble classification and spectral band selec-tion for ecotope mapping using airborne hyperspectral imagery,” Re-mote Sens. Environ., vol. 112, pp. 2999–3011, 2008.
[25] M. Pal, “Random forest classifier for remote sensing classification,”Int. J. Remote Sens., vol. 26, pp. 217–222, 2005.
[26] M. Pal and P. M. Mather, “Support vector machines for classificationin remote sensing,” Int. J. Remote Sens., vol. 26, pp. 1007–1011, 2005.
[27] V. Heikkinen et al., “Simulated multispectral imagery for tree speciesclassification using support vector machines,” IEEE Trans. Geosci. Re-mote Sens., vol. 48, pp. 1355–1364, 2010.
[28] L. Su et al., “Support vector machines for recognition of semi-aridvegetation types using MISR multi-angle imagery,” Remote Sens. En-viron., vol. 107, pp. 299–311, 2007.
[29] S. E. Sesnie et al., “The multispectral separability of Costa Rican rain-forest types with support vector machines and Random Forest decisiontrees,” Int. J. Remote Sens., vol. 31, pp. 2885–2909, 2010.
[30] A. C. Braun et al., “Support vector machines for vegetation classifica-tion—A revision,” Photogrammetrie Fernerkundung Geoinformation,pp. 273–281, 2010.
[31] M. D. Wilson et al., “Classification of contamination in salt marshplants using hyperspectral reflectance,” IEEE Trans. Geosci. RemoteSens., vol. 42, pp. 1088–1095, 2004.
[32] E. M. Adam et al., “Discriminating the papyrus vegetation (Cyperuspapyrus L.) and its co-existent species using random forest and hyper-spectral data resampled to HYMAP,” Int. J. Remote Sens., vol. 33, pp.552–569, 2012.
[33] N. Skelton and P. Adam, Beecroft Peninsula Vegetation Survey, ForANCA/ERIN and the Department of Defence, GIS EnvironmentalConsultants, 1994.
[34] Government of New South Wales, Plan of Management: Jervis BayNational Park andWoollamia Nature Reserve, Dept. Environment, Cli-mate Change and Water. Sydney, Australia, 2011.
[35] T. Cocks et al., “The Hymap(tm) airborne hyperspectral sensor: Thesystem, calibration and performance,” in Proc. 1st EARSEL Workshopon Imaging Spectroscopy, Zurich, Switzerland, 1998, pp. 37–42.
[36] M. L. Clark et al., “Hyperspectral discrimination of tropical rain foresttree species at leaf to crown scales,” Remote Sens. Environ., vol. 96,pp. 375–398, 2005.
[37] Vapnik and V. Naumovich, The Nature of Statistical LearningTheory. New York, NY, USA: Springer, 1995.
[38] Q. Ge et al., “High efficient classification on remote sensing imagesbased on SVM,” International Archives of the Photogrammetry,Remote Sensing and Spatial Information Sciences, vol. XXXVII, pp.1011–1014, 2008.
[39] C. Huang et al., “An assessment of support vector machines for landcover classification,” Int. J. Remote Sens., vol. 23, pp. 725–749, 2002.
[40] Y. Freund and R. E. Schapire, “A decision-theoretic generalization ofon-line learning and an application to boosting,” J. Comput. Syst. Sci.,vol. 55, pp. 119–139, 1997.
[41] T. Hastie et al., The Elements of Statistical Learning: Data Mining,Inference, and Prediction. New York, NY, USA: Springer, 2001.
[42] Y. Freund and R. E. Schapire, “A short introduction to boosting,” J.Jpn. Soc. Artificial Intell., vol. 14, pp. 771–780, Sep. 1999.
[43] L. Breiman, “Random forests,” Machine Learning, vol. 45, pp. 5–32,2001.
[44] R. Genuer et al., “Variable selection using random forests,” PatternRecognit. Lett., vol. 31, pp. 2225–2236, 2010.
[45] P. O. Gislason et al., “Random forests for land cover classification,”Pattern Recognit. Lett., vol. 27, pp. 294–300, 2006.
[46] T. V. Bandos et al., “Classification of hyperspectral images with reg-ularized linear discriminant analysis,” IEEE Trans. Geosci. RemoteSens., vol. 47, pp. 862–873, 2009.
[47] C. Vaiphasa et al., “Tropical mangrove species discrimination usinghyperspectral data: A laboratory study,” Estuarine, Coastal and ShelfScience, vol. 65, pp. 371–379, 2005.
[48] M. J. Santos et al., “Using hyperspectral remote sensing to detect andquantify southeastern pine senescence effects in red-cockaded wood-pecker (Picoides borealis) habitat,” Remote Sens. Environ., vol. 114,pp. 1242–1250, 2010.
[49] R. L. Pu, “Broadleaf species recognition with in situ hyperspectraldata,” Int. J. Remote Sens., vol. 30, pp. 2759–2779, 2009.
[50] W. C. Driscoll, “Robustness of the ANOVA and Tukey-Kramer statis-tical tests,” Comput. Ind. Eng., vol. 31, pp. 265–268, 1996.
[51] R. Pu et al., “Invasive species change detection using artificial neuralnetworks and CASI hyperspectral imagery,”Environ. Monitor. Assess.,vol. 140, pp. 15–32, 2008.
[52] C.-C. Chang and C.-J. Lin, “LIBSVM: A library for support vector ma-chines,” 2001 [Online]. Available: http://www.csie.ntu.edu.tw/~cjlin/papers/libsvm.pdf
[53] H. Z. M. Shafri et al., “Hyperspectral remote sensing of vegetationusing red edge position techniques,” Amer. J. Appl. Sci., vol. 3, pp.1864–1871, 2006.
[54] M. A. Cho and A. K. Skidmore, “A new technique for extracting thered edge position from hyperspectral data: The linear extrapolationmethod,” Remote Sens. Environ., vol. 101, pp. 181–193, Mar. 2006.
[55] N. C. Coops et al., “Chlorophyll content in eucalypt vegetation at theleaf and canopy scales as derived from high resolution spectral data,”Tree Physiol., vol. 23, pp. 23–31, Jan. 2003.
[56] B. Datt, “Remote sensing of chlorophyll a, chlorophyll b, chlorophylla+b, and total carotenoid content in Eucalyptus leaves,” Remote Sens.Environ., vol. 66, pp. 111–121, 1998.
[57] B. Datt, “A new reflectance index for remote sensing of chlorophyllcontent in higher plants: Tests using Eucalyptus leaves,” J. PlantPhysiol., vol. 154, pp. 30–36, 1999.
[58] R. Pu andD. Liu, “Segmented canonical discriminant analysis of in situhyperspectral data for identifying 13 urban tree species,” Int. J. RemoteSens., vol. 32, pp. 2207–2226, 2011, 2012/02/21.
[59] P. Bunting and R. Lucas, “Landscape classification of Australianforest communities using hyperspectral HyMap and CASI data,”University of Bari, Bari, Italy, IUFRO 8.01.03 Landscape Ecology,2006, pp. 457–469.
[60] K. N. Youngentob et al., “Mapping two eucalyptus subgenera usingmultiple endmember spectral mixture analysis and continuum-re-moved imaging spectrometry data,” Remote Sens. Environ., vol. 115,pp. 1115–1128, 2011.
[61] R. A. Chastain, “Isolating and characterizing woodland and savannacommunities on Fort Lewis, Washington, USA,” presented at theASPRS 2008 Annual Conf., Portland, OR, USA, 2008.
[62] C. Dahinden, “An improved Random Forests approach with applica-tion to the performance prediction challenge datasets,” in Hands-OnPattern Recognition, I. Guyon, Ed. Brookline,MA,USA:MicrotomePublishing, 2009, vol. 1.
[63] Q. Zhou et al., “Gene selection using random forest and proximitydifferences criterion on DNA microarray data,” J. Converg. Inform.Technol., vol. 5, pp. 161–170, 2010.
Xiao Shang received the M.Sc. degree in geoinfor-matics from the Institute for Geo-Information Sci-ence and Earth Observation (ITC), The Netherlands,in 2008. He is currently working toward the Ph.D. de-gree at the University of Wollongong, Australia.His research interests include the application of re-
mote sensing andGIS techniques to investigate distri-bution and conservation of vegetation species, spec-tral discrimination of vegetation species using hyper-spectral remote sensing, and mapping of vegetationspecies using advanced classification techniques.
Laurie A. Chisholm received the B.Sc. degree ingeology, the M.A. degree in geography from theUniversity of Oklahoma, Norman, OK, USA, andthe Ph.D. degree in remote sensing from the Uni-versity of New South Wales, NSW, Australia. Forher Ph.D., she used hyperspectral data to investigatethe spectral behavior of a floodplain forest species,E. camaldulensis (river red gum), to changes inmoisture stress, including predictive modeling forstress detection at the airborne level.She wasAssociate Director of the Centre for Image
Analysis at Charles Sturt University,WaggaWagga, NSW, Australia, from 1997to 1998, and a consultant to the UN FAO from 1994 to 1997. Currently, she is anAssociate Professor in the School of Earth and Environmental Sciences at theUniversity of Wollongong, Australia, where she is a member of the Institute forConservation Biology and Environmental Management. Her research interestsfocus on the application of advanced spatial science techniques to investigatethe impacts of natural and anthropogenic disturbances on the dynamics of eco-logical systems at a range of scales.