clarity on swiss taxes - kpmg | us · individual income tax rates of 130 countries and all 26 ......
TRANSCRIPT

Clarity onSwiss TaxesStaying on course when the tide turns

Tax Technology
Tax Risk Management
Tax Function Transformation
TheClarity Palace
Big Data
Supply Chain Management
[OECD]
[SMEs]
[Financial Industry]
[Corporate Industry]
[Regulator & Tax Authorities]
protaxationequality
abolishmentof
priviligedtax REgimes
MNCs
[G20]
ST_Map_170324_v13_Inhalt-2.pdf 1 24.03.2017 11:07:26
20
6
4

e d ito r i a l
Peter UebelhartHead of tax, KPMG Switzerland
Switzerland remains a strong competitor on the global tax stage, according to data analyzed in KPMG’s “Swiss tax report 2017” . the study compares the corporate and individual income tax rates of 130 countries and all 26 Swiss cantons.
this year’s findings cannot yet reflect the impact of recent turbulence on the Swiss tax landscape but they do send
an encouraging signal for Switzerland’s future as a business location.
although the rejection of the Corporate tax reform iii is a setback, it’s not an unsurmountable one. Some cantons have already introduced immediate measures to safeguard their tax appeal. on a national scale, the Swiss government cannot and will not leave companies and investors stranded in uncertainty. at the same time, the regulatory wave rolls on, with BePS and automatic exchange of information bringing increased international pressure. a new package to maintain competitiveness without capsizing stability is surely on the horizon.
KPMG’s tax professionals are keenly observing the developments in Switzerland as well as in the eU, oeCd and G20. Please contact us for more insights and advice on any tax matters.
Peter Uebelhart
Welcome
Clarity on Swiss Taxes
3

4

5

Corporate taxation
S w i S S Ta x R e P o RT 2 017
Corporate income tax
Switzerland remains competitive on the international tax stage, especially in europe. a cluster of cantons in central and eastern Switzerland retain their status as lower-tax locations. in line with the global trend, Swiss corporate income tax rates have dropped on average over the past decade and continue to creep down. it remains to be seen whether the cantons will honor the cuts they had announced in anticipation of Ctr iii.
6

7
Clarity on Swiss Taxes

100 - 1000
Pa rt i C o R P o R aT e Ta x aT i o n : C o R P o R aT e i n C o m e Ta x
Contribution of businesses to tax revenues from direct federal taxes
(by profit levels)
67.01%
13.73%
5.59%
9.59%10.73%
87.86%
0.17% 1.11% 1.27%2.96%
0 - 10 10 - 50 50 - 100 1000+
taxpayers
Contribution to direct federal taxes
taxable profit in CHF 1,000/year
1 according to the Fta Note: latest available data for the tax period 2013. Source: Federal tax administration Fta, 2017 https://www.estv.admin.ch/estv/de/home/allgemein/steuerstatistiken/fachinformationen/steuerstatistiken/direkte-bundessteuer/dbst-jp-kantone-2013.html
a small minority of businesses contribute the majority of direct federal taxes, with 2.96% of corporations carrying almost 90% of the tax burden. at the same time, over two thirds of taxpaying corporations pay close to no taxes at all. around 48.4% of total contributions (CHF 4.3 billion1) stem from privileged companies.
Which businesses are shouldering the tax burden?
8

20.6620.66Jura
16.6816.12Grisons
15.0114.92Uri
12.3212.43
12.6612.66
12.6612.66
13.0413.04
14.1614.16
14.6014.60
15.2715.27
15.6115.61
15.7015.70
16.0415.97
16.4316.43
17.4017.40
18.6118.61
19.8619.86
20.6720.67
20.7020.70
21.1521.15
21.8521.49
21.6421.64
21.7421.74
22.0922.09
22.1822.18
24.1624.16
2016
2017
Corporate income tax rates in the cantons – 2016 and 2017 the cantons of central Switzerland continue to lead the tax league. the majority of cantons did not make any changes to their ordinary tax rates. While lucerne raised tax rates slightly, Schaffhausen, Grisons and Solothurn reduced their corporate income tax rates. only Uri reduced its tax rate repeatedly. a further reduction is to be expected among cantons with high taxation in the coming years.
Note: max. effective rate on pre-tax profits for federal/cantonal/municipal taxes in the respective cantonal capital. Corporate income tax figures for Ge, JU, Ne, SG, tG and ZH for 2016. Source: KPMG Switzerland
Nidwalden
lucerne
obwalden
appenzell a.
appenzell i.
Zug
Schwyz
Glarus
Neuchâtel
Schaffhausen
thurgau
St. Gallen
aargau
Fribourg
ticino
Basel-landschaft
Zurich
Solothurn
Bern
Valais
Vaud
Basel-Stadt
Geneva
Figures in percent
Clarity on Swiss Taxes
9

22.76 21.49Solothurn - 1.27
21.12 20.66Jura - 0.46
16.98 16.43thurgau
Corporate income tax rates in the cantons – trend in 2007 and 2017 Besides the cantons of central Switzerland, appenzell a., Glarus, Schaffhausen, Neuchâtel, and in particular Grisons, have also significantly reduced their tax rates for corporations over the past ten years. in the Mittelland region, western Switzerland and the city cantons, changes to ordinary corporate income tax rates have been significantly smaller. only the canton of Valais has increased its tax rates slightly over the last decade.
- 0.55
18.90 12.43 13.12 12.66 17.27 12.66 18.04 13.04 15.47 14.16 16.10 14.60 16.32 14.92 19.76 15.27 22.18 15.61 19.98 15.70 22.84 15.97 29.06 16.12
19.08 17.40 22.32 18.61 21.95 19.86
22.00 20.67 25.65 20.70 21.32 21.15
23.40 21.64 21.57 21.74 23.53 22.09 24.81 22.18 24.24 24.16
lucerne
obwalden
Nidwalden
appenzell a.
appenzell i.
Zug
Uri
Schwyz
Neuchâtel
Glarus
Schaffhausen
Grisons
St. Gallen
aargau
Fribourg
ticino
Basel-landschaft
Zurich
Bern
Valais
Vaud
Basel-Stadt
Geneva
- 6.47
- 0.46
- 4.61
- 5.00
- 1.31
- 1.50
- 1.40
- 4.49
- 6.57
- 4.28
- 6.87
- 1.68
- 3.71
- 2.09
- 1.33
- 4.95
- 0.17
-1.76
0.17
- 1.44
- 2.63
- 0.08
Note: max. effective rate on pre-tax profits for federal/cantonal/municipal taxes in the respective cantonal capital. Corporate income tax figures for Ge, JU, Ne, SG, tG and ZH for 2016. Source: KPMG Switzerland
- 12.94
2007
2017
Figures in percent
Pa rt i C o R P o R aT e Ta x aT i o n : C o R P o R aT e i n C o m e Ta x
10

Genf
Basel-Stadt
Waadt
Bern
Zürich
Aargau
CH Durchschnitt
St. Gallen
Graubünden
Schaffhausen
Neuenburg
Schwyz
Zug
Nidwalden
Obwalden
Luzern
19.44%20.76%
18.70%18.96%18.06%18.31% 17.90%18.01% 17.80%17.89%
2007
Note: max. effective rate on pre-tax profits for federal/cantonal/municipal taxes in the respective cantonal capital. Corporate income tax figures for Ge, JU, Ne, SG, tG and ZH for 2016. Source: KPMG Switzerland
2008 2009 2010 2011 2012 2013 2014 2015 2016
- 2.99%
Corporate income tax rates in the cantons – trend from 2007 to 2017 the corporate income tax rates continue to drop slightly on average.
Corporate income tax rates in the cantons – trend from 2007 to 2017 after smaller reductions in 2016, corporate tax rates look set to remain stable in 2017. only Schaffhausen and Grisons saw renewed reductions, while lucerne increased its tax rates.
30%
28%
26%
24%
22%
20%
18%
16%
14%
12%
Geneva
VaudBasel-Stadt
BernZurich
aargau
CH-averageSt. Gallen
GrisonsSchaffhausen
SchwyzZug
Nid-/obwaldenlucerne
2007 2008 2009 2010 2011 2012 2013 2014 2015 2016
Note: max. effective rate on pre-tax profits for federal/cantonal/municipal taxes in the respective cantonal capital. Corporate income tax figures for Ge, JU, Ne, SG, tG and ZH for 2016. Source: KPMG Switzerland
Neuchâtel
17.77%
2017
2017
Clarity on Swiss Taxes
11

Corporate income tax rates in the cantons in 2017
20.7Jura
19.9Fribourg
21.7Valais
21.6Bern
21.5Solothurn
22.1Vaud
20.7Basel-Landschaft
18.6Aargau
22.2Basel-Stadt
12.4Lucerne
12.7Obwalden
15.6Neuchâtel
24.2Geneva
Cantons with a corporate income tax rate below the Swiss average (17.77%)
Figures in percent
Cantons with a corporate income tax rate above the Swiss average (17.77%)
Note: max. effective rate on pre-tax profits for federal/cantonal/municipal taxes in the respective cantonal capital. Corporate income tax figures for Ge, Ne, SG, tG, ZH for 2016. Source: KPMG Switzerland
Pa rt i C o R P o R aT e Ta x aT i o n : C o R P o R aT e i n C o m e Ta x
12

18.6Aargau 21.2
Zurich
16.0Schaffhausen
16.4Thurgau
13.0Appenzell A.
14.2Appenzell I.
12.4Lucerne
12.7Nidwalden
14.9Uri 16.1
Grisons
17.4St. Gallen
15.7Glarus
15.3Schwyz
14.6Zug
20.7Ticino
Clarity on Swiss Taxes
13

* 13.79% in the first 5 years Note: max. effective rate on pre-tax profits for federal/cantonal/municipal taxes in the respective cantonal capital. Corporate income tax figures for Ge, Ne, SG, tG, ZH for 2016. Source: KPMG Switzerland.
Which tax rates had been announced for CTR III?
the majority of cantons had announced their corporate income tax rates as of 2019 assuming Ctr iii was approved. Since this was not the case it is questionable whether the cantons will stick to the announced rates.
BS
22.1
813
.04
BL
20.7
014
.00
So
21.4
912
.90
ne
15.6
115
.61
LU
Be21
.64
16.3
7FR
19.8
613
.72
VD
22.0
913
.79
Ge
24.1
613
.49*
announced corporate tax rate reduction
Pa rt i C o R P o R aT e Ta x aT i o n : C o R P o R aT e i n C o m e Ta x
14
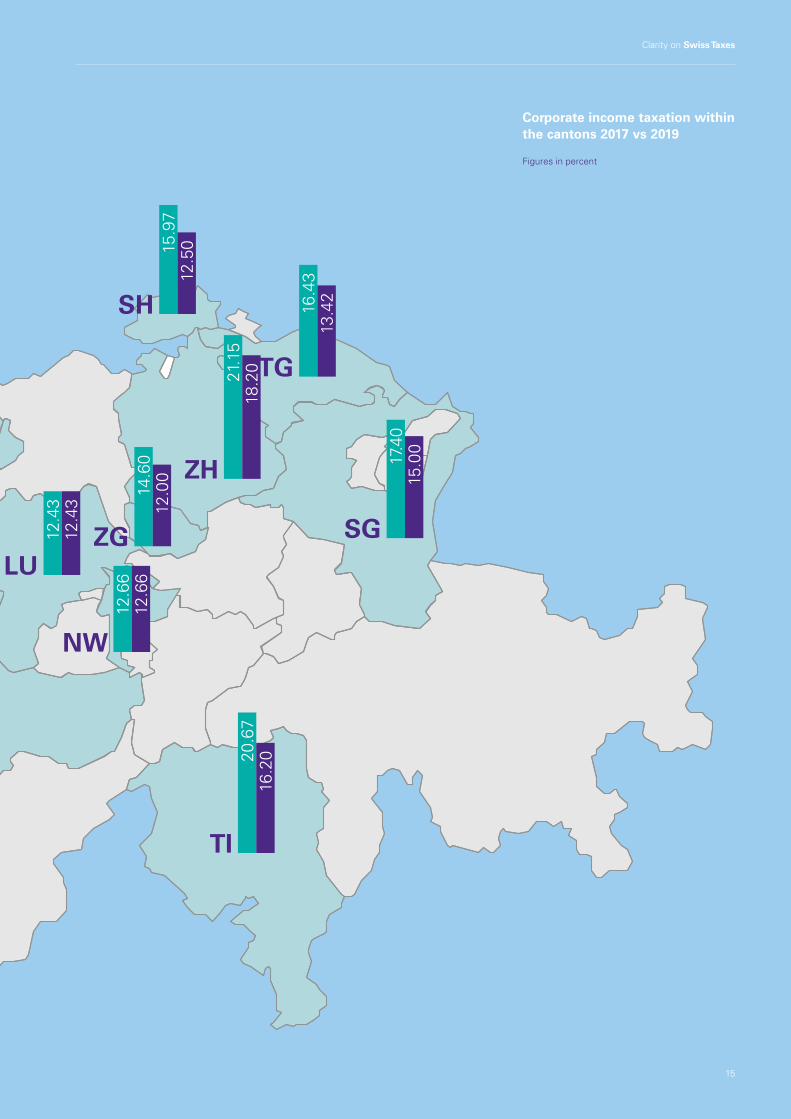
Corporate income taxation within the cantons 2017 vs 2019
Figures in percent
14.0
0
SH
15.9
712
.50
TG
16.4
313
.42
ZH
21.1
518
.20
LU
12.4
312
.43
ZG
14.6
012
.00
SG
17.4
015
.00
Ti
20.6
716
.20
nw
12.6
612
.66
Clarity on Swiss Taxes
15

15.27
- 0.07
16.68 | 16.12
16.43
16.00
16.04 | 15.97
15.70
15.01 | 14.92
15.00
15.00
15.00
18.61
15.61
18.00
The cantons and european countries compared overall, the european tax landscape shows quite a few changes that mix up the ranking in 2017. led by the huge ten-percentage-point drop from Hungary, the upper half also includes a two percentage-point drop from Croatia. Nevertheless, the cantons of central Switzerland are not lacking in attractiveness. lower income tax rates in the international sphere are applied in particular by the Channel islands and the countries of Southeast europe. ireland remains the most significant competitor for Switzerland.
17.40
14.60
14.16
12.66
12.50
12.50
12.50
12.32 | 12.43
20.00 | 18.00
10.00
19.00 | 9.00
12.66
+/– 0
Maximum corporate income tax rates, CH: max. effective rate on pre-tax profits for federal/cantonal/municipal taxes in the respective cantonal capital. Corporate income tax figures for albania, Ne, SG and tG for 2016. Sources: KPMG Switzerland, KPMG international: https://home.kpmg.com/xx/en/home/services/tax/tax-tools-and-resources/tax-rates-online/corporate-tax-rates-table.html
Pa rt i C o R P o R aT e Ta x aT i o n : C o R P o R aT e i n C o m e Ta x
13.04
- 0.09
Schaffhausen
romania
Glarus
thurgau
Grisons
albania
Serbia
lithuania
Uri
Ukraine
Neuchâtel
Guernsey
Montenegro
Hungary
Bulgaria
Croatia
lucerne
ireland
liechtenstein
Cyprus
Nidwalden
obwalden
appenzell i.
Schwyz
Zug
St. Gallen
aargau
appenzell a.
Jura
9.00
- 10.00
+ 0.11
- 0.56
- 2.00
19.00Poland
16

22.09
29.00
25.00 | 24.00
22.18
21.64
20.70
20.67
20.00
22.00 | 21.00
24.16
19.86
35.00
33.33
31.40 | 24.00
25.00
29.72 | 29.79
29.22 | 27.08
25.00
25.00
22.00
22.00
21.85 | 21.49
21.74
21.15
20.66
20.00 | 19.00
20.00
Maximum corporate income tax rates, CH: max. effective rate on pre-tax profits for federal/cantonal/municipal taxes in the respective cantonal capital. Corporate income tax figures for the Netherlands, Spain, Ge, JU and ZH for 2016. Sources: KPMG Switzerland, KPMG international: https://home.kpmg.com/xx/en/home/services/tax/tax-tools-and-resources/tax-rates-online/corporate-tax-rates-table.html
Greece
Norway
Basel-Stadt
Bern
Geneva
Fribourg
UK
Basel-landschaft
Slovakia
turkey
ticino
Zurich
Valais
Solothurn
Sweden
Vaud
Jura
estonia
denmark
the Netherlands
austria
luxembourg
Germany
Spain
italy
France
Malta
- 1.00
- 1.00
- 0.36
- 1.00
- 7.40
- 2.14
+ 0.07
17.00 | 19.00Slovenia + 2.00 2017
+/- compared with previous year
Figures in percent
Countries in the lower half of the ranking also amended tax rates in 2017. While the UK, Slovakia, Norway, luxembourg and especially italy reduced tax by between one and seven-point-four percentage points, Slovenia was the only one to increase the rate.
Clarity on Swiss Taxes
17

17.00 25.50+ 8.50
30.86
34.61
Maximum corporate income tax rates, CH: max. effective rate on pre-tax profits for federal/cantonal/municipal taxes in the respective cantonal capital. Corporate income tax figures for russia for 2016. Sources: KPMG Switzerland, KPMG international: https://home.kpmg.com/xx/en/home/services/tax/tax-tools-and-resources/tax-rates-online/corporate-tax-rates-table.html
Global comparison – selected countries Hong Kong and Singapore are considered attractive tax locations, comparable to known offshore domains such as Bermuda or dubai. internationally, Switzerland falls within the middle range with its tax rates.
40.00
34.00
30.00
28.00
26.50
25.00
25.00
24.00
20.00
17.80 | 17.77
17.00
16.50
10.00
25.00
0.00
0.00
0.00
0.00
0.00
- 0.03
Trends: countries 2007 – 2017Few countries have increased their corporate tax rates in recent years. Hungary, which until now had raised its taxes, cut its corporate tax rates by 7% this year.
28.00 30.00 18.00 20.00
25.00 29.00
19.00 21.00
+ 2.00
+ 2.00
+ 4.00
+ 2.00
Maximum corporate income tax rates, CH: max. effective rate on pre-tax profits for federal/cantonal/municipal taxes in the respective cantonal capital. Sources: KPMG Switzerland, KPMG international: https://home.kpmg.com/xx/en/home/services/tax/tax-tools-and-resources/tax-rates-online/corporate-tax-rates-table.html
2007
2017
Figures in percent
Pa rt i C o R P o R aT e Ta x aT i o n : C o R P o R aT e i n C o m e Ta x
Chile
Japan
india
Bahamas
Bahrain
Bermuda
Cayman islands
dubai
Qatar
Hong Kong
Singapore
Swiss average
russia
Malaysia
China
indonesia
Panama
Canada
South africa
australia
Brazil
USa
Mexico
iceland
Greece
Slovakia
2017
+/- compared with previous year
Figures in percent
18

17.50 16.50
29.63 27.08
- 1.00
- 2.55
33.00 25.00- 8.00
- 6.00
38.36 29.79- 8.57
24.00 20.00- 4.00
16.00 9.00- 7.00
40.69 30.86- 9.83
25.00 20.00- 5.00
Trends: countries 2007 – 2017the states in the Middle east have made the most impressive cuts in taxation over the past ten years, with the largest drop seen in Kuwait (40%). the UK has announced its intention to cut the corporate income tax rate to 17% by 2020 and Hungary has already enacted a decrease to 9% this year.
55.00 15.00 35.00 10.00 35.00 10.00 37.25 24.00
28.00 22.00
25.50 25.00
20.76 17.77
27.50 22.00
27.00 24.00 20.00 17.00
- 40.00
- 25.00
- 25.00
- 13.25
30.00 19.00- 11.00
- 0.50
- 2.99
- 5.50
- 3.00
- 3.00
2007
2017
Figures in percent
Hong Kong
luxembourg
China
Sweden
Germany
russia
Hungary
Japan
Jordan
Kuwait
Gibraltar
Qatar
italy
the Netherlands
Swiss average
South Korea
Malaysia
Singapore
UK
Maximum corporate income tax rates, CH: max. effective rate on pre-tax profits for federal/cantonal/municipal taxes in the respective cantonal capital. Corporate income tax figures for the Netherlands, Gibraltar and russia for 2016. Sources: KPMG Switzerland, KPMG international: https://home.kpmg.com/xx/en/home/services/tax/tax-tools-and-resources/tax-rates-online/corporate-tax-rates-table.html
Clarity on Swiss Taxes
19

Individualtaxationincome tax
on a global scale the Swiss cantons are rated among the most attractive in terms of tax rates for high-income individuals. the moderate downward trend of the Swiss average individual tax rates looks to be leveling off in 2017. Nevertheless, the tax burden is still borne by the wealthiest 1% of the Swiss population.
Pa rt i i S w i S S Ta x R e P o RT 2 017
20

Clarity on Swiss Taxes
21

52.54%
Pa rt i i i n D i V i D Ua L Ta x aT i o n : i n C o m e Ta x
2.68%
35.39%
7.09%
26.21%
8.36%
15.64%16.52%
14.98%
12.81%
4.23%
0 - 50 50 - 75
taxpayers
Contribution to direct federal taxes
taxable income in CHF 1,000 / year
Note: latest available data for the tax period 2013. Source: Federal tax administration Fta, 2017: https://www.estv.admin.ch/estv/de/home/allgemein/steuerstatistiken/fachinformationen/steuerstatistiken/direkte-bundessteuer/np_kanton_dbs_2013.html
3.55%
75 - 100 100 - 150 150 - 200 200+
Contribution of individuals to tax revenues from direct federal taxes
(by income bracket)
approximately 3.55% of taxpayers – i.e. the highest-income individuals – account for more than 50% of the direct individual tax.
Who shoulders the tax burden in Switzerland?
22

41.30
5.00
6.95
Contribution of individuals to tax revenues from direct federal taxes
(by income bracket)
0.00
78.70
Percentage share of taxpayers in direct federal taxes
Note: latest available data for the tax period 2013, including persons taxed on a lump-sum basis and taxpayers where income taken into account in determining the tax rate is different from the taxable income. Source: Federal tax administration Fta, 2017: https://www.estv.admin.ch/estv/de/home/allgemein/steuerstatistiken/fachinformationen/steuerstatistiken/direkte-bundessteuer/np_kanton_dbs_2013.html
0.18 0.38 0.67 1.05 1.782.81
4.65
9.69
10.50
3.70
7.00
10 200 30 40 50 60 70 80 90
99 - 100
98 - 99
97 - 98
96 - 97
95 - 96
90 - 95
11.30
100
Figures in percent
the 10% with the highest income account for almost 80% of the direct individual tax burden. the 1% with the highest income bear 41.3% (prior year 41%) of the tax burden.
Clarity on Swiss Taxes
23

40.4640.46
25.5525.55
25.0225.02
22.8622.86
24.3024.30
25.4925.35
28.2128.21
30.4830.48
31.5631.56
31.1731.74
32.4032.18
32.4832.48
32.4932.29
33.5233.52
34.0534.05
34.5034.18
36.0236.02
36.5036.50
37.4337.43
39.0439.33
39.7639.76
40.7240.72
41.2741.27
41.5041.50
42.1742.17
44.7544.75
2016
2017
income tax rates in the cantons – 2016 and 2017the cantons of central Switzerland continue to have the lowest tax rates. Uri, Grisons andSchaffhausen have lowered their individual tax rates. as with the corporate tax rate, lucerne was the only canton to raise the tax rate for individuals. the highest individual tax rates are seen in cantons that also have the highest corporate tax rates.
Note: max. income tax rates for single taxpayers with no children and no religious denomination living in the respective cantonal capital. income tax rates for ai and SG are for 2016. Source: KPMG Switzerland
Figures in percent
Pa rt i i i n D i V i D Ua L Ta x aT i o n : i n C o m e Ta x
Jura
obwalden
Zug
appenzell i.
Nidwalden
Uri
Schwyz
appenzell a.
Glarus
Grisons
lucerne
thurgau
Schaffhausen
St. Gallen
aargau
Solothurn
Fribourg
Valais
Basel-Stadt
Zurich
Neuchâtel
ticino
Bern
Vaud
Basel-landschaft
Geneva
24
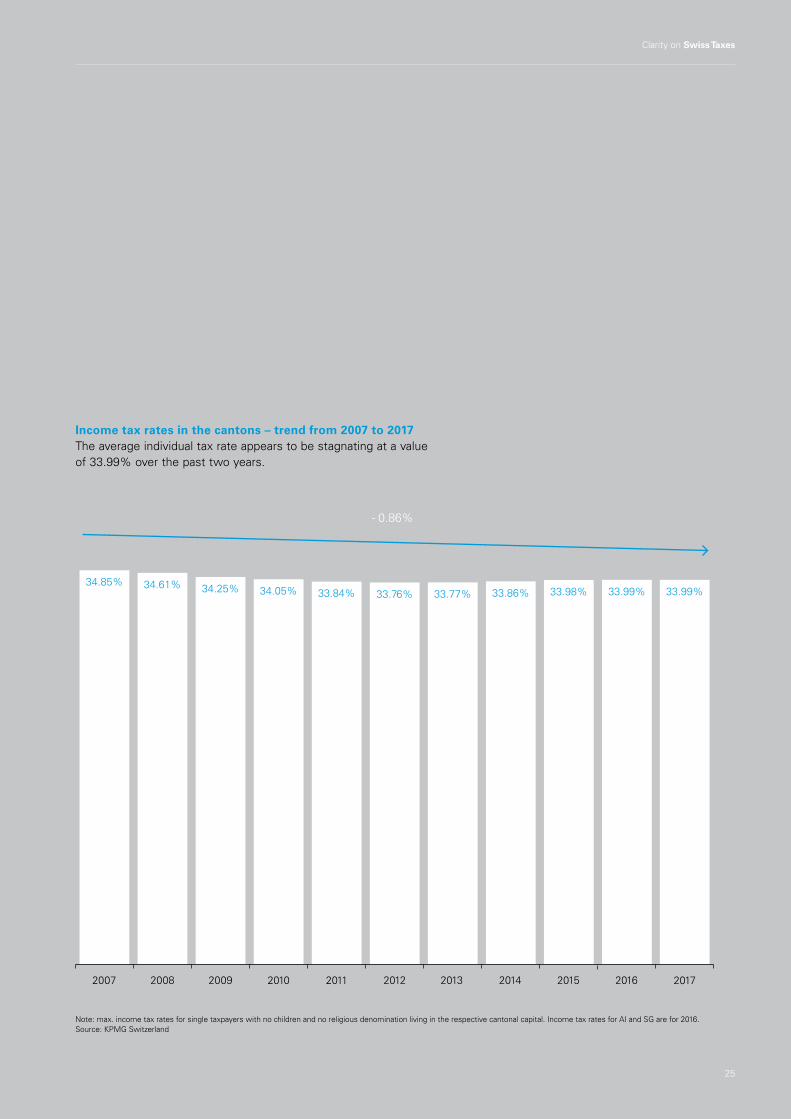
33.99%34.61%34.85%
34.05%34.25% 33.76%33.84% 33.86%33.77% 33.99%33.98%
2007
Note: max. income tax rates for single taxpayers with no children and no religious denomination living in the respective cantonal capital. income tax rates for ai and SG are for 2016. Source: KPMG Switzerland
2008 2009 2010 2011 2012 2013 2014 2015 2016
- 0.86%
income tax rates in the cantons – trend from 2007 to 2017the average individual tax rate appears to be stagnating at a value of 33.99% over the past two years.
2017
Clarity on Swiss Taxes
25
25.2032.29Schaffhausen
32.5531.74lucerne
41.0240.72
26.1425.02
23.1022.86
24.0124.30
26.7425.55
33.0025.35
25.1928.21
31.2630.48
34.4931.56
32.9532.18
35.6332.48
36.1633.52
36.8434.05
36.4734.18
36.3336.02
37.0036.50
38.9137.43
39.3439.33
40.1639.76
43.5440.46
41.2841.27
41.5041.50
42.5542.17
44.7644.75
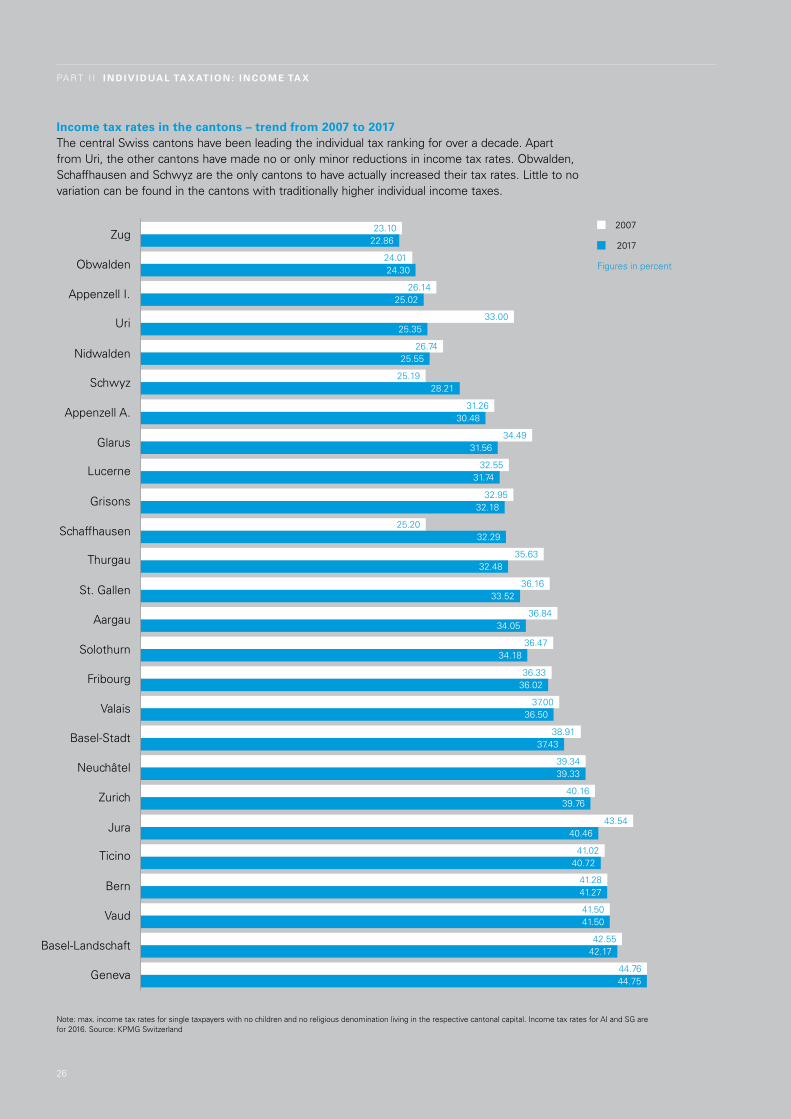
Note: max. income tax rates for single taxpayers with no children and no religious denomination living in the respective cantonal capital. income tax rates for ai and SG are for 2016. Source: KPMG Switzerland
Pa rt i i i n D i V i D Ua L Ta x aT i o n : i n C o m e Ta x
2007
2017
Figures in percent
income tax rates in the cantons – trend from 2007 to 2017the central Swiss cantons have been leading the individual tax ranking for over a decade. apart from Uri, the other cantons have made no or only minor reductions in income tax rates. obwalden, Schaffhausen and Schwyz are the only cantons to have actually increased their tax rates. little to no variation can be found in the cantons with traditionally higher individual income taxes.
ticino
appenzell i.
obwalden
Zug
Nidwalden
Uri
Schwyz
appenzell a.
Grisons
Glarus
thurgau
St. Gallen
aargau
Solothurn
Fribourg
Valais
Basel-Stadt
Zurich
Neuchâtel
Jura
Bern
Vaud
Basel-landschaft
Geneva
26

income tax rates in the cantons – trend from 2007 to 2017With the exception of a distinguishable upward trend in the individual income tax rates of Schaffhausen and Schwyz, and a downward trend in aargau, thurgau and St. Gallen, the tax rates have remained fairly consistent in the Swiss cantons.
45%
40%
35%
30%
25%
20%
Note: max. income tax rates for single taxpayers with no children and no religious denomination living in the respective cantonal capital. income tax rates for ai and SG are for 2016. Source: KPMG Switzerland
2007 2008 2009 2010 2011 2012 2013 2014 2015 2016 2017
Geneva
Vaud
Basel-Stadt
Bern
Zurich
aargauSwiss averageSt. Gallen
Schwyz
Zug
obwalden
thurgau
Nidwalden
Neuchâtel
lucerneSchaffhausen
Clarity on Swiss Taxes
27

individual income tax rates in the cantons in 2017
40.5Jura
36.5Valais
41.3Bern
34.2Solothurn
41.5Vaud
42.2Basel-Landschaft
34.0 Aargau
37.4Basel-Stadt
31.7 Lucerne
24.3Obwalden
44.8 Geneva
Cantons with an individual income tax rate below the Swiss average (33.99%)
Figures in percent
Cantons with an individual income tax rate above the Swiss average (33.99%)
Note: max. income tax rates for single taxpayers with no children and no religious denomination living in the respective cantonal capital. income tax rates for ai and SG are for 2016. Source: KPMG Switzerland
Pa rt i i i n D i V i D Ua L Ta x aT i o n : i n C o m e Ta x
39.3Neuchâtel
36.0Fribourg
28

34.0 Aargau
31.7 Lucerne
39.8Zurich
32.3 Schaffhausen
32.5 Thurgau
30.5 Appenzell A.
25.0 Appenzell I.
25.6 Nidwalden
25.4 Uri 32.2
Grisons
33.5St. Gallen
31.6 Glarus
28.2 Schwyz
22.9 Zug
40.7Ticino
Clarity on Swiss Taxes
29

22.86
35.00
35.00
34.50 | 34.18
34.05
33.52
32.48
32.49 | 32.29
32.40 | 32.18
32.00
31.17 | 31.74
31.56
30.48
25.02
20.00
The cantons and european countries compared the individual income tax rates continue to be particularly low in the countries of Southeast europe. as with corporate taxation, most of the Swiss cantons lie in the middle in terms of individual income tax rates. Western european and Scandinavian countries levy income tax at relatively high rates. although already ranking among the countries with the top rates, luxembourg and Sweden increased their tax rates in 2017. the annual tax adjustments in Finland and denmark resulted in a reduction this time.
28.21
25.49 | 25.35
25.55
24.30
23.00
22.00
20.00
18.00
15.00
15.00
10.00
+ 0.57
Max. income tax rates for single taxpayers with no children and no religious denomination living in the respective cantonal capital. appenzell i., St. Gallen: income tax rates for 2016. Sources: KPMG Switzerland, KPMG international: https://home.kpmg.com/xx/en/home/services/tax/tax-tools-and-resources/tax-rates-online/individual-income-tax-rates-table.html
Pa rt i i i n D i V i D Ua L Ta x aT i o n : i n C o m e Ta x
- 0.14
luxembourg
the Netherlands
Finland
Cyprus
appenzell a.
Glarus
lucerne
Poland
Grisons
Schaffhausen
thurgau
aargau
Solothurn
turkey
St. Gallen
appenzell i.
Jersey
Bulgaria
Hungary
lithuania
Ukraine
estonia
Czech republic
Zug
latvia
obwalden
Nidwalden
Uri
Schwyz
- 0.22
- 0.20
- 0.32
36.02Fribourg
30

54.25 | 54.00
52.00
50.00
50.00
44.00 | 48.78
48.00
46.90 | 46.72
46.25 | 46.24
40.72
57.10 | 61.85
55.00
45.00
45.00
45.00
44.75
43.00
42.17
41.50
41.27
40.46
39.76
39.04 | 39.33
37.43
36.50 2017
+/- compared with previous year
Figures in percent
45.00
56.40 | 55.79
Max. income tax rates for single taxpayers with no children and no religious denomination living in the respective cantonal capital. Portugal, Slovenia: income tax rates for 2016. Sources: KPMG Switzerland, KPMG international: https://home.kpmg.com/xx/en/home/services/tax/tax-tools-and-resources/tax-rates-online/individual-income-tax-rates-table.html
- 0.01
- 0.18
- 0.61
iceland
Norway
ireland
luxembourg
Slovenia
Belgium
the Netherlands
Finland
ticino
Valais
Basel-Stadt
Neuchâtel
Zurich
Jura
Bern
Vaud
Basel-landschaft
italy
Geneva
Germany
UK
Greece
austria
denmark
Sweden
Spain
+ 0.29
48.00Portugal
+ 4.78
- 0.25
+ 4.75
Clarity on Swiss Taxes
31

45.00 45.00China
28.00 28.00
15.00 15.00
Global comparison (selected countries)While the well-known offshore domains continue to reject the idea of introducing individual income taxes, countries such as Japan or South africa show very high income taxes in a global comparison.
0.00
13.00 13.00
20.00 20.00
27.50 27.50
30.00 30.00 33.00 33.00 33.99 33.99 35.54 35.54 39.60 39.60
41.00 45.00
45.00 45.00
55.95 55.95
Max. income tax rates for single taxpayers with no children and no religious denomination living in the respective capital. australia, Bahamas, Bahrain, Hong Kong, Japan, oman, Qatar, Uae: income tax rates for 2016. Sources: KPMG Switzerland, KPMG international: https://home.kpmg.com/xx/en/home/services/tax/tax-tools-and-resources/tax-rates-online/individual-income-tax-rates-table.html
22.00 22.00
2016
2017
Figures in percent 0.00
0.00
0.00
0.00
0.00
0.00
Pa rt i i i n D i V i D Ua L Ta x aT i o n : i n C o m e Ta x
Malaysia
Hong Kong
Bahamas
Bahrain
Bermuda
Cayman islands
oman
Qatar
Uae
russia
Jordan
Brazil
indonesia
New Zealand
Swiss average
india
USa
South africa
australia
Japan
Singapore
32

16.00 15.00-1.00Hong Kong
24.00 10.00- 14.00Bulgaria
40.00 45.00
39.00 48.78
+ 5.00
40.00 45.00
18.00 20.00
45.00 45.00
35.00 39.60
30.00 35.00 41.00 48.00
+ 5.00
+ 2.00
0.00
+ 4.60
+ 9.78
+ 5.00
+ 7.00
- 0.86
25.00 23.00
34.85 33.99
- 2.00
25.00 20.00- 5.00
Trends: countries 2007 – 2017the introduction of a flat rate tax affected eastern european countries most, with a significant decline in the tax rates of Bulgaria, Hungary, lithuania and the Czech republic. especially in Western europe, income taxes have risen.
36.00 15.00
27.00 15.00 32.00 22.00 40.00 32.00
45.00 40.00 59.00 55.79
28.00 28.00
43.00 45.00
35.70 46.24
- 21.00
- 12.00
- 10.00
- 8.00
- 5.00
- 3.21
0.00
+ 2.00
+ 10.54
Max. income tax rates for single taxpayers with no children and no religious denomination living in the respective capital. Croatia, Hong Kong: income tax rates for 2016. Sources: KPMG Switzerland, KPMG international: https://home.kpmg.com/xx/en/home/services/tax/tax-tools-and-resources/tax-rates-online/individual-income-tax-rates-table.html
2007
2017
Figures in percent
UK
luxembourg
Greece
isle of Man
Germany
USa
Cyprus
ireland
latvia
Swiss average
Jordan
Hungary
lithuania
Czech republic
Poland
Croatia
denmark
Malaysia
Spain
iceland
Clarity on Swiss Taxes
33

Clarity on mergers & acquisitions
Clarity on Transformation in Private Banking
annual report KPmG Switzerland 2016
Clarity on Compliance
Clarity on Business Location CH
Clarity on kpmg.ch/clarity-on
KPmG appskpmg.ch/apps
KPmG Knowledge app
Get instant access to our experts’ knowledge with our KPMG Knowledge app for iPad, iPhone and android phone.
“Clarity on” publications this series of publications from KPMG Switzerland provides insights, analyses and studies on a range of topics. all publications are available as hard copies as well as online. For more information, please contact [email protected].
Latest issues
P i N B oa r d
34
Clarity on Tax Cyber Security
May 2016
12Key Findings Main results of KPMG`s survey 2016
14Interviews Markus Braendle, ABB Michael Schoch, FINMA Max Klaus, MELANI Florian Widmer, Zurich Insurance Group
38Upcoming Issues The next wave of challenges in Cyber Security
Clarity onCyber SecurityNever a dull moment
Now or never Swiss Ceo outlook 2016
Clarity on Tax Function Transformation

PublisherKPMG aGBadenerstrasse 172Po BoxCH-8036 Zurich
orderstax Marketing+41 58 249 29 [email protected]
Concept and editingeva Häfliger, KPMG aG
Designdany Studerus, KPMG aG
illustrations[Page 4-5] van Beusekom design & brand solution
PrintSchmaeh offset & repro aG, ehrendingen
PicturesShutterstock
neutralprinted matter
No. 01-14-569853 – www.myclimate.org© myclimate – The Climate Protection Partnership
PERFORMANCE
For further information on Clarity on Swiss Taxes
Please contact:
Peter Uebelhart Head of tax and Member of the executive Committee+41 58 249 42 [email protected]
Your local contacts for tax matters:
Zurich / ticino Stefan KuhnPartner+41 58 249 54 [email protected]
Mittelland Hans Jürg SteinerPartner+41 58 249 20 [email protected]
Western Switzerland Vincent ThalmannPartner+41 58 249 64 [email protected]
Central Switzerland Dr. Frank LampertPartner+41 58 249 49 [email protected]
eastern Switzerland Dr. Peter michaelPartner+41 58 249 25 [email protected]
BaselReiner DennerPartner+41 58 249 42 [email protected]
Clarity on Swiss Taxes
C o N taC t S & i M P r i N t
articles may only be republished by written permission of the publisher and quotingthe source “KPmG’s Clarity on Swiss Taxes”.
the information contained herein is of a general nature and is not intended to address the circumstances of any particular individual or entity. although we endeavor to provide accurate and timely information, there can be no guarantee that such information is accurate as of the date it is received, or that it will continue to be accurate in the future. No one should act on such information without appropriate professional advice after a thorough examination of the particular situation. the scope of any potential collaboration with audit clients is defined by regulatory requirements governing auditor independence.
© 2017 KPMG aG is a subsidiary of KPMG Holding aG, which is a member of the KPMG network of independent firms affiliated with KPMG international Cooperative (“KPMG international”), a Swiss legal entity. all rights reserved.
Clarity on Swiss Taxeskpmg.ch/swisstaxes
Clarity on Swiss Taxeskpmg.ch/swisstaxes