city sanitation plan nellore - cdma.ap.gov.in city sanitation... · and transportation of waste to...
TRANSCRIPT

City Sanitation Plan Nellore
Page i of 128
TABLE OF CONTENTS
1 INTRODUCTION & BACKGROUND ................................................................................................. 1
1.1 Steps towards preparation of CSP .............................................................................................. 2
2 CITY SANITATION TASK FORCE ...................................................................................................... 5
2.1 Responsibilities of the CSTF: ....................................................................................................... 5 2.2 Members of the CSTF: ................................................................................................................ 6
3 CITY PROFILE ................................................................................................................................. 7
3.1 Location ...................................................................................................................................... 7 3.2 Economy ..................................................................................................................................... 7 3.3 Transportation ............................................................................................................................ 7 3.4 Topography ................................................................................................................................ 8 3.5 Climate ....................................................................................................................................... 8 3.6 Demography ............................................................................................................................... 9 3.7 Ward wise population and area details of Nellore City (2011) ................................................ 10 3.8 Population projections: ............................................................................................................ 13 The following chapters are worked based on the projected population of 686850 for 2015. ......... 15
4 WATER SUPPLY ........................................................................................................................... 16
4.1 Water Source ............................................................................................................................ 16 4.2 Water Generation ..................................................................................................................... 18 4.3 Water Supply and Distribution ................................................................................................. 18
4.3.1 Water Supply ................................................................................................................. 18 4.3.2 Water Distribution ........................................................................................................ 19
4.4 Water Supply Connections ....................................................................................................... 21 4.5 Water Supply in Slums .............................................................................................................. 22 4.6 Non-Revenue Water ................................................................................................................. 22 4.7 Operation and Maintenance .................................................................................................... 22
4.7.1 Water Supply Charges ................................................................................................... 22 4.7.2 Water Supply revenue and O&M costs and cost recovery – April 2014 to March 201523 4.7.3 Departments Responsible ............................................................................................. 23
4.8 Water Demand ......................................................................................................................... 23 4.9 Water Quality ........................................................................................................................... 25 4.10 Identified Issues for Water Supply Sector: ............................................................................... 29 4.11 Proposed/Sanctioned Water Supply Schemes: ........................................................................ 29 4.12 Proposed Strategies for developing Water Supply:.................................................................. 30
5 SANITATION & SEWERAGE MANAGEMENT ................................................................................. 34
5.1 Sanitation ................................................................................................................................. 34 5.1.1 Individual Toilet Connections ........................................................................................ 34 5.1.2 Public and Community Toilets ....................................................................................... 35 5.1.3 Open Defecation Areas ................................................................................................. 36 5.1.4 School Sanitation ........................................................................................................... 37 5.1.5 Demand Assessment: Future Scenario .......................................................................... 39
5.2 Sewerage Management ........................................................................................................... 39 5.2.1 Present Situation ........................................................................................................... 39 5.2.2 Sewerage Network ........................................................................................................ 40 5.2.3 Sewage Treatment ........................................................................................................ 40 5.2.4 Human Resources.......................................................................................................... 40 5.2.5 Sewerage Generation .................................................................................................... 40 5.2.6 Demand Assessment: Future Scenario .......................................................................... 41
Sanitation scenario in Nellore City: ................................................................................................... 42 5.3 Identified Issues for Sanitation and Sewerage System ............................................................. 42 5.4 Ongoing/Proposed projects ..................................................................................................... 43 5.5 Proposed strategies for improving sanitation facilities in Nellore City: ................................... 43
City Sanitation Plan Nellore
Page ii of 128
6 STORM WATER MANAGEMENT .................................................................................................. 45
6.1 Flood prone areas ..................................................................................................................... 45 6.2 Analysis of Current and Future Scenario for Storm Water Drains ............................................ 46
6.2.1 Gap Assessment – Current Scenario ............................................................................. 46 6.2.2 Demand Assessment ..................................................................................................... 47
6.3 Identified issues for Storm Water Drainage System................................................................. 47 6.4 Recommendations .................................................................................................................... 47
7 SOLID WASTE MANAGEMENT ..................................................................................................... 48
7.1 Existing Municipal Solid Waste Management System in Nellore ............................................. 48 7.2 Institutional Capacity ................................................................................................................ 48 7.3 Sources of waste generation .................................................................................................... 52 7.4 Waste generation from different sectors ................................................................................. 55 7.5 Waste generation quantity and composition ........................................................................... 56 7.6 Existing MSWM Practices Prevailing in Nellore City ................................................................. 59
7.6.1 Storage of Domestic waste at source ............................................................................ 59 7.6.2 Storage of market & trade waste at source .................................................................. 59 7.6.3 Segregation of recyclable wastes .................................................................................. 60 7.6.4 Primary collection of domestic waste ........................................................................... 60 7.6.5 Street sweeping and drain cleaning .............................................................................. 61
7.7 Waste storage depots............................................................................................................... 61 7.7.1 Secondary collection and transportation of waste ....................................................... 62 7.7.2 Processing and disposal of waste: ................................................................................. 64
7.8 Gap Analysis ............................................................................................................................. 64 7.8.1 Manpower & Vehicle requirement for DTD Collection, Street Sweeping, Drain cleaning and Transportation of waste to Transfer Station and to Final Dump Site: ............................... 64 7.8.2 Sufficiency of secondary collection bins: ...................................................................... 66 7.8.3 Sufficiency in treatment, processing & disposal facilities ............................................. 67
7.9 SWM scenario in Nellore City: .................................................................................................. 67 7.10 Identified Issues for Solid Waste Sector: .................................................................................. 68 7.11 Proposed strategies: ................................................................................................................. 68
8 IMPLEMENTATION PLAN ............................................................................................................. 69
8.1 Implementation Plan: Hardware Component .......................................................................... 70 8.2 Implementation Plan: Software Component.......................................................................... 107
8.2.1 Capacity building for ULB staff .................................................................................... 107 8.2.2 Formation of monitoring and supervision cell ............................................................ 108 8.2.3 Awareness generation activities focusing different stakeholders .............................. 110 8.2.4 Awareness generation implementation plan .............................................................. 113
9 FINANCING OPTIONS AND BLOCK ESTIMATES ........................................................................... 114
9.1 Financial Options .................................................................................................................... 114 9.1.1 14
th Finance Commission: ........................................................................................... 114
9.1.2 State Finance Commission: ......................................................................................... 115 9.1.3 Swachh Bharat Mission ............................................................................................... 115 9.1.4 Jawaharlal Nehru National Urban Renewal Missoin, GoI, JnNURM ............................ 115 9.1.5 Atal Mission for Rejuvenation and Urban Transformation (AMRUT).......................... 115 9.1.6 Ministry of Housing and Urban Poverty Alleviation (MoHUPA), GoI .......................... 115 9.1.7 Rajiv Awas Yojana (RAY) .............................................................................................. 116 9.1.8 ULBs Finance ............................................................................................................... 116 9.1.9 Ministry of Social Justice and Empowerment, GoI ...................................................... 116 9.1.10 Sarva Shiksha Abhiyan (MoHRD), GoI ......................................................................... 116 9.1.11 Ministry of Tourism ..................................................................................................... 116 9.1.12 International Agencies ................................................................................................ 116 9.1.13 Public Private Partnership ........................................................................................... 117 9.1.14 NGOs ........................................................................................................................... 117

City Sanitation Plan Nellore
Page iii of 128
9.2 Block Estimates ....................................................................................................................... 117 9.2.1 Goal 1: Water Supply .................................................................................................. 117 9.2.2 Goal 2: Access to Sanitation ........................................................................................ 118 9.2.3 Goal 3: UGD and wastewater treatment system ........................................................ 119 9.2.4 Goal 4: Storm water management .............................................................................. 119 9.2.5 Goal 5: Solid Waste Management ............................................................................... 120
LIST OF FIGURES
Figure 1: Generic elements of planning, implementation and M&E of city sanitation ............................... 1 Figure 2: Steps towards preparation of CSP ................................................................................................ 2 Figure 3: CSP focus area .............................................................................................................................. 4 Figure 4: Nellore Wards Map .................................................................................................................... 12 Figure 5: Newly added 15 Gram Panchayats ............................................................................................. 13 Figure 6: Map depicting existing ELSRs in Nellore City .............................................................................. 21 Figure 7: Water supply scenario in Nellore City ........................................................................................ 27 Figure 8: Proposed Water Supply Scheme with ELSR Locations ............................................................... 32 Figure 9: Details of toilet connections in Slums ........................................................................................ 35 Figure 10: Open defecation areas in Nellore ............................................................................................. 36 Figure 11: Sanitation scenario in Nellore City ........................................................................................... 42 Figure 12: Flood prone areas in Nellore .................................................................................................... 46 Figure 13: Institutional Capacity of Sanitation Department, NMC ............................................................ 49 Figure 14: Sources of waste generation in Nellore City ............................................................................ 56 Figure 15: Physical characterization of MSW in Nellore ........................................................................... 58 Figure 16: Door to Door collection of waste in Nellore ............................................................................. 60 Figure 17: Street sweeping in Nellore city ................................................................................................. 61 Figure 18: Secondary bins in Nellore ......................................................................................................... 62 Figure 19: Waste disposal and collection at transfer station to transport to dump site. ......................... 64 Figure 20: Dump site at Dhontali ............................................................................................................... 64 Figure 21: SWM scenario in Nellore City ................................................................................................... 67 Figure 22: Categorisation of Zones ............................................................................................................ 69 Figure 23: Water supply scenario in Nellore City ...................................................................................... 82 Figure 24: Sanitation scenario in Nellore city ............................................................................................ 89 Figure 25: On-site sanitation systems failure and downstream impacts .................................................. 94 Figure 26: Integrated Solid Waste Management Hierarchy .................................................................... 102 Figure 27: Proposed initiatives for improving sanitation facilities in Nellore City. ................................. 107 Figure 28: Flowchart for framework of sanitation cell ............................................................................ 110
LIST OF TABLES
Table 1: Gram Panchayats added in the corporation limits ........................................................................ 9 Table 2: Decadal wise population ............................................................................................................... 9 Table 3: Ward wise population and area details ....................................................................................... 10 Table 4: Population projections ................................................................................................................ 13 Table 5: Population projections ................................................................................................................ 14 Table 6: Infiltration wells details at HWW ................................................................................................. 17 Table 7: Different sources of Water Supply .............................................................................................. 17 Table 8: Water generation as per NMC as on 2015 .................................................................................. 18 Table 9: Water generation comparison ..................................................................................................... 18 Table 10: Details of GLSRs in Nellore city .................................................................................................. 19 Table 11: Existing ELSRs in Nellore city ..................................................................................................... 20 Table 12: Diameter wise length of distribution system in Nellore ............................................................ 21 Table 13: Status of WS in slums ................................................................................................................ 22 Table 14: Water Supply Charges ............................................................................................................... 22 Table 15: WS revenue and O&M costs and cost recovery ........................................................................ 23
City Sanitation Plan Nellore
Page iv of 128
Table 16: Water Supply, Demand and Gap Analysis ................................................................................. 24 Table 17: Microbiological Analysis of Water in Nellore City ..................................................................... 25 Table 18: Physio Chemical Analysis ........................................................................................................... 28 Table 19: Sources of funding for implementation of Comprehensive WS Scheme .................................. 30 Table 20: Capacities and Locations of the proposed 32 ELSRs in Nellore City .......................................... 33 Table 21: Details of toilet connections in Slums for 38962 and 40980 HHs. ............................................. 35 Table 22: Toilets distribution in Primary and Upper Primary Schools ....................................................... 37 Table 23: Toilets distribution in High Schools ........................................................................................... 38 Table 24: Waste water production estimation for Nellore ....................................................................... 41 Table 25: Flood prone areas in Nellore ..................................................................................................... 45 Table 26: Service indicators for storm water drainage system ................................................................. 47 Table 27: SWM Municipal Staff and their responsibilities ........................................................................ 50 Table 28: Allocation of SWM workers in each Sanitary Division involved in door to door collection, street sweeping, drain cleaning and transporting ............................................................................................... 51 Table 29: Waste generation analysis from residential sector based on field study .................................. 52 Table 30: Waste generation from commercial sector as per field study .................................................. 54 Table 31: Waste transported from veg. market at Nehru Statue to Transfer Station .............................. 54 Table 32: Waste generation in Nellore city ............................................................................................... 55 Table 33: Population and waste projected till 2055 .................................................................................. 56 Table 34: Composition of waste from residential HHs in Nellore ............................................................. 58 Table 35: Chemical composition of waste ................................................................................................. 59 Table 36: Secondary bins location and its capacity ................................................................................... 62 Table 37: Waste transported to transfer station....................................................................................... 63 Table 38: Existing and proposed man power and vehicle requirements .................................................. 66 Table 39: CPHEEO norms for secondary bins ............................................................................................ 67 Table 40: Overall goals for services ........................................................................................................... 70 Table 41: List of identified problems for different sectors ........................................................................ 70 Table 42: Water supply parameters .......................................................................................................... 75 Table 43: Proposed strategies for Water Supply ....................................................................................... 75 Table 44: Parameters for sanitation services ............................................................................................ 82 Table 45: Proposed strategies for sanitation facilities .............................................................................. 83 Table 46: Parameters for Sewerage System and Wastewater Management ........................................... 89 Table 47: Proposed strategies for Sewerage Management ...................................................................... 90 Table 48: Sewerage zones ......................................................................................................................... 91 Table 49: Pollutants in the Effluent of On-site treatment systems ........................................................... 94 Table 50: Parameters for SWM ................................................................................................................. 99 Table 51: Proposed strategies for SWM .................................................................................................. 101 Table 52: Goals and actions recommended for SWM ............................................................................. 106 Table 53: Awareness activities for different stakeholders ...................................................................... 110 Table 54: Awareness generation implementation plan .......................................................................... 113 Table 55: Cost estimation for Water Supply ........................................................................................... 118 Table 56: Cost estimation for access to sanitation facilities ................................................................... 118 Table 57: Cost estimation for sewerage management ........................................................................... 119 Table 58: Cost estimation for storm water management ....................................................................... 119 Table 59: Cost estimation for SWM......................................................................................................... 120
City Sanitation Plan Nellore
Page v of 128
ABBREVIATIONS:
AMRUT Atal Mission for Rejuvenation and Urban Transport
APMDP Andhra Pradesh Municipal Development Project
APSRTC Andhra Pradesh State Road Transport Corporation
ASP Activated Sludge Process
BOST Build Operate Share Transfer
BOT Build Operate Transfer
CBO Community Based Organisation
CBSE Central Board of Secondary Education
CLTS Community Led Total Sanitation
CPHEEO Central Public Health and Environmental Engineering Organisation
CSP City Sanitation Plan
CSR Corporate Social Responsibility
CSTF City Sanitation Task Force
DeWATS Decentralized Wastewater Treatment System
DPR Detailed Project Report
DTD Door to Door
ELSR Elevated Level Service Reservoir
FAB Fluidized Aerobic Bioreactor
GoI Government of India
GLSR Ground Level Service Reservoir
HH Household
HUDCO Housing & Urban Development Corporation Limited
HWW Head Water Works
ICDS Integrated Child Development Services
IEC Information, Education and Communication
IHHL Individual Household Latrine
IHSDP Integrated Housing and Slum Development Programmes
JnNURM Jawaharlal Nehru National Urban Renewal Mission
KPCL Krishnapatnam Port Company Limited
KSRTC Karnataka State Road Transport Corporation
LPCD Litres Per Capita per Day
M&E Monitoring and Evaluating
MA&UD Municipal Administration & Urban Development
MBBR Moving Bed Bio Reactor
MBR Membrane Bio Reactor
MDG Millennium Development Goals
MLD Million Litres per Day
MoHRD Ministry of Human Resource Development
MoHUPA Ministry of Housing and Urban Poverty Alleviation
MoUD Ministry of Urban Development
MPN Most Probable Number
MSW Municipal Solid Waste
NBA Nirmal Bharat Abhiyan
City Sanitation Plan Nellore
Page vi of 128
NGO Non-Governmental Organization
NH Nation Highway
NMC Nellore Municipal Corporation
NTS Nellore Tank Supply
NTU Nephelometric Turbidity Unit
NUSP National Urban Sanitation Policy
O&M Operation & Maintenance
OD Open Defecation
OHT Overhead Tank
PHED Public Health Engineering Department
PMU Project Monitoring Unit
RAY Rajiv Awas Yojana
RWH Rain Water Harvest
SBR Sequential Batch Reactor
SFC State Finance Commission
SMP Septage Management Plan
SWM Solid Waste Management
TSC Total Sanitation Campaign
TNSTC Tamil Nadu State Transport Corporation
TPD Tonnes per Day
UASB Up-flow Anaerobic Sludge Blanket
UDDT Urine Diversion Dehydration Toilet
UFW Unaccounted for Water
UGD Underground Drainage
UIDSSMT Urban Infrastructure Development Scheme for Small & Medium Towns
ULB Urban Local Body
USHA Urban Statistics for HR and Assessments
WHO World Health Organisation
WSP Waste Stabilisation Pond
WTP Water Treatment Plant
City Sanitation Plan Nellore
Page 1 of 128
1 INTRODUCTION & BACKGROUND
The City Sanitation Plan (CSP) for Nellore provides an integrated action plan to achieve universal
sanitation access as envisioned in Government of India’s National Urban Sanitation Policy (NUSP)
and in the framework of Swachh Bharat Mission. The CSP identifies the issues related to governance,
technical, financial, capacity enhancement, awareness raising and pro-poor interventions and
proposes short, medium and long term measures to achieve the goals of National Urban Sanitation
Policy (NUSP) to create community driven, totally sanitized, healthy and liveable cities and towns.
The Nellore Municipal Corporation is formulating its City Sanitation Plan (CSP) with the support of
ICLEI Local Governments for Sustainability, South Asia.
The CSP’s main purpose is to support urban local bodies and NGOs, CBOs, citizens and private sector
agencies to take concrete steps to achieve 100% sanitation in their respective cities that includes
Water Supply, Waste Water and Sewerage, Storm Water, Sanitation, and Solid Waste Management.
The mentioned sectors are considered under CSP as these are directly and indirectly linked to the
other sectors that ultimately affect the hygiene of the city. Thus considering the influence of all
these sectors on the city sanitation, the Nellore Municipal Corporation in consultation and
considering the recommendations from citizen groups, elected representatives, government
departments and City Sanitation Task Force is developing the CSP. The main aim of the CSTF is to
achieve 100% sanitation in the city by involving the suggestions from public, private institutions,
NGOs and Aided Organizations in coordination with Town Planning Wing.
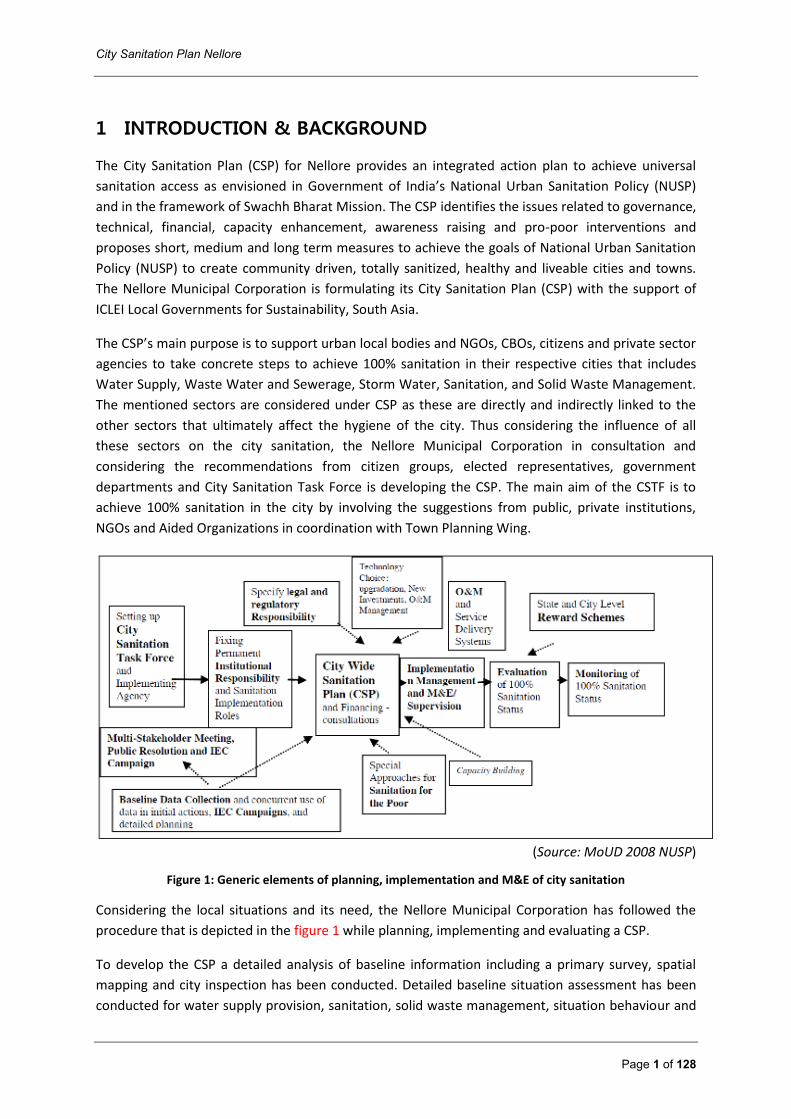
(Source: MoUD 2008 NUSP)
Figure 1: Generic elements of planning, implementation and M&E of city sanitation
Considering the local situations and its need, the Nellore Municipal Corporation has followed the
procedure that is depicted in the figure 1 while planning, implementing and evaluating a CSP.
To develop the CSP a detailed analysis of baseline information including a primary survey, spatial
mapping and city inspection has been conducted. Detailed baseline situation assessment has been
conducted for water supply provision, sanitation, solid waste management, situation behaviour and
City Sanitation Plan Nellore
Page 2 of 128
awareness levels on sustainable sanitation practices within the community. This information coupled
with information from previous, on-going and future proposals has been used to assess the demand
and needs for sanitation and allied services within the city.
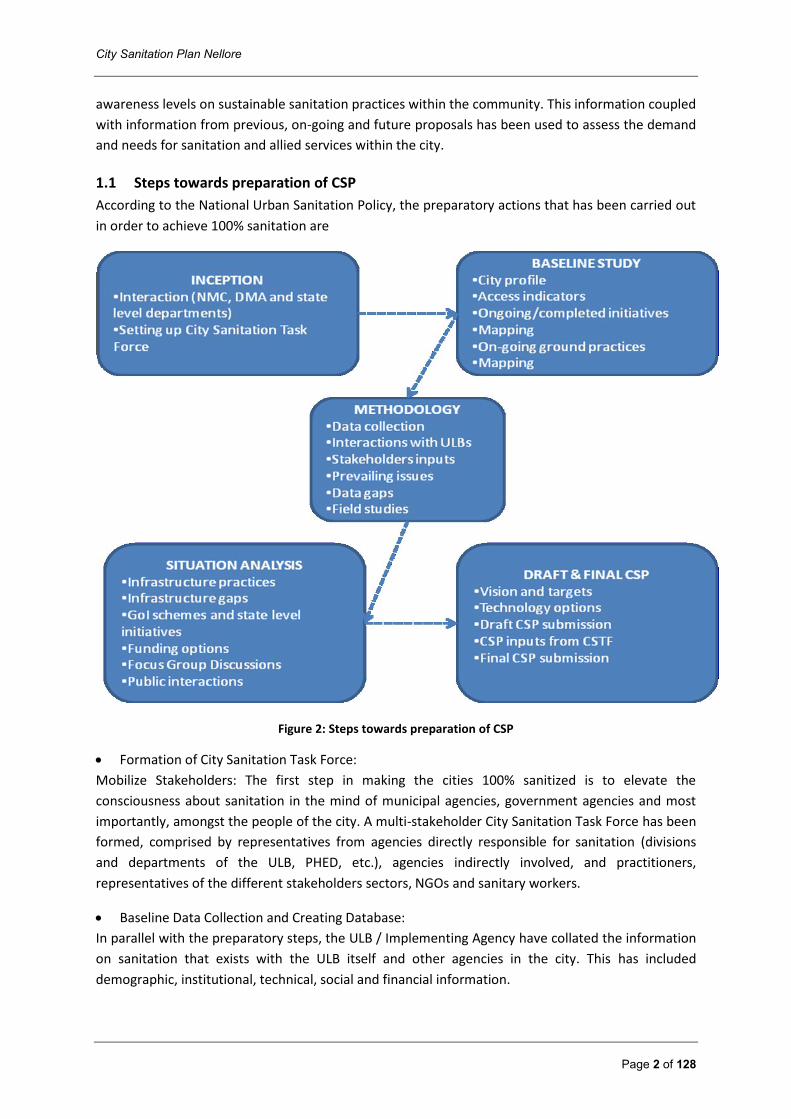
1.1 Steps towards preparation of CSP
According to the National Urban Sanitation Policy, the preparatory actions that has been carried out
in order to achieve 100% sanitation are
Figure 2: Steps towards preparation of CSP
Formation of City Sanitation Task Force:
Mobilize Stakeholders: The first step in making the cities 100% sanitized is to elevate the
consciousness about sanitation in the mind of municipal agencies, government agencies and most
importantly, amongst the people of the city. A multi-stakeholder City Sanitation Task Force has been
formed, comprised by representatives from agencies directly responsible for sanitation (divisions
and departments of the ULB, PHED, etc.), agencies indirectly involved, and practitioners,
representatives of the different stakeholders sectors, NGOs and sanitary workers.
Baseline Data Collection and Creating Database:
In parallel with the preparatory steps, the ULB / Implementing Agency have collated the information
on sanitation that exists with the ULB itself and other agencies in the city. This has included
demographic, institutional, technical, social and financial information.
City Sanitation Plan Nellore
Page 3 of 128
Awareness Generation and Launch of 100% Sanitation Campaign:
After a reasonable amount of data has been collated from secondary and primary sources, and the
Task Force is in place, the first task will be of launching a citywide 100% Sanitation Campaign.
Specifying Legal and Regulatory Institutional Responsibilities:
Even though many of the municipal laws refer to sanitation responsibilities of households and ULB,
etc. these are not clearly laid out or comprehensive. The Implementing Agency will examine the law
and rules in this regard and make recommendations for the Task Force to make the rules explicit
regarding total sanitation services.
Planning and Financing:
The task of planning and finding sources of funding will be under the oversight of the Task Force but
carried out by the Implementing Agency. The Agency has developed plans for the city for different
aspects including institutional, social, technical, financial, etc with the help of different departments
involved in city sanitation.
Technical Options:
Technology choice poses a major problem in Indian cities not only because of lack of information on
what exists at present, but also because of the constraints of land, tenure, and low budgetary
priority accorded to sanitation historically. Considering the current practices and obstacles that are
stopping for the development of sanitation sector in the city, certain technologies that suit best for
the city has been recommended.
Reaching the Un-served Population and the Urban Poor:
Experiences from many Indian cities show that a differentiated approach is necessary to extend
good quality sanitation services to the poor – the group that suffers the most in terms of adverse
impacts on health and lost earnings.
Operation & Maintenance and Service Delivery Systems:
Institutional systems for O&M are at the heart of any successful set of systems and procedures to
achieve and sustain 100% sanitation.
Capacity Building & Training:
The role of capacity building and training is crucial in achieving and sustaining 100 % sanitation.
Implementation Plan and Monitoring and Evaluation
While the Implementation Agency will be responsible for overall implementation, it is useful to think about plan implementation and delivery mechanisms for each of the components of the Plan. The City Sanitation Task Force and the Implementing Agency need to think about M&E of the implementation as an integral part of the City Sanitation Plan.
City Sanitation Plan Nellore
Page 4 of 128
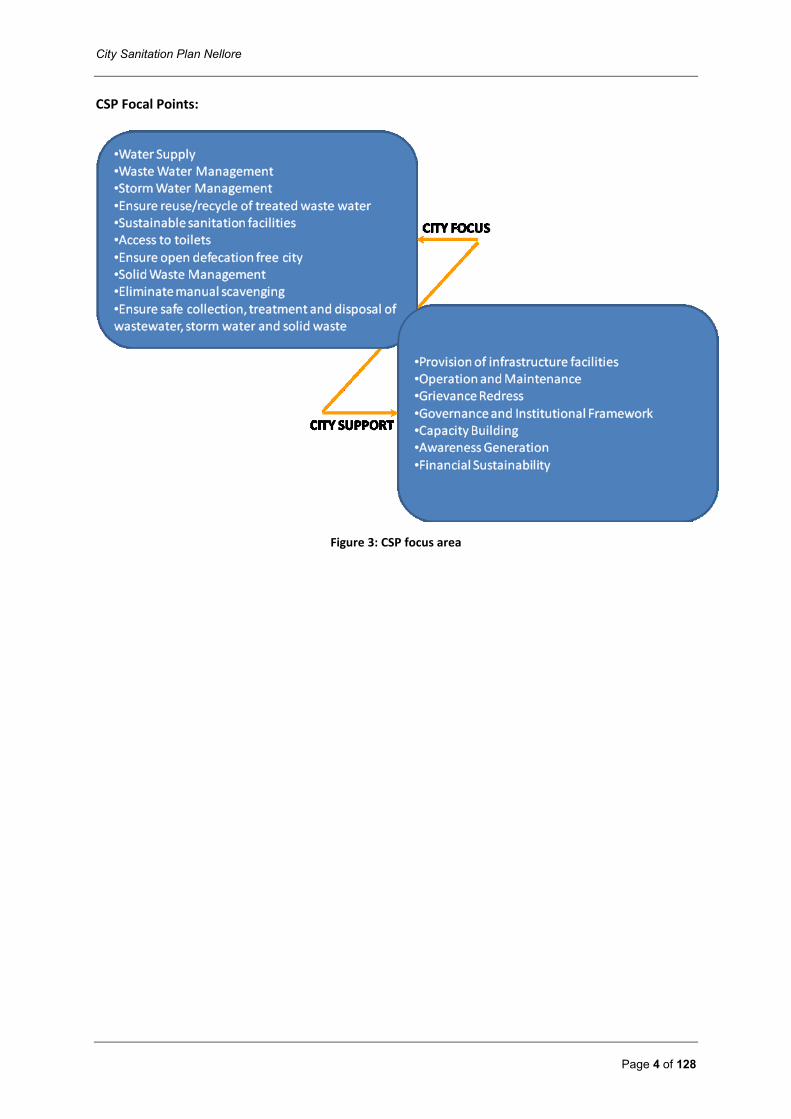
CSP Focal Points:
Figure 3: CSP focus area
City Sanitation Plan Nellore
Page 5 of 128
2 CITY SANITATION TASK FORCE
A city wide sanitation plan includes the vision, mission and goals of sanitation development as well
as strategies to meet these goals. Therefore, for the implementation of the certain strategies,
considering that a team with the representatives from the city and corporation would play a
responsible role towards launching 100% sanitation campaign, coordinating the activities for
awareness raising, revising and approving the CSP and implementing the plan defined in the CSP
developed by the consultancy, Nellore Municipal Corporation has constituted a City Sanitation Task
Force as per the NUSP guidelines.
Each strategy can be found translated into indicative programs (and projects). The CSP shall contain
an assessment of the current situation and an immediate, short, medium and long term plan for
implementation of the following services and aspects:
Technical aspects including strategies and programs for the development of
Domestic waste water services
Solid waste management services
Storm water drainage services
Non-technical aspects, including strategies for the development of non-physical aspects such as
Community awareness and participation
Policy and regulation
Institutional capacity
Private sector engagement
NGO engagement
Financing and tariffs
Monitoring and evaluation
2.1 Responsibilities of the CSTF:
The City Sanitation Task Force is responsible for
Launching the City 100% Sanitation Campaign
Generating awareness amongst the city’s citizens and stakeholders
Approving materials and progress reports provided by the implementing agency, other public agencies, as well as NGOs and private parties contracted by the Implementing Agency, for different aspects of implementation (see below)
Approving the CSP for the city prepared
Undertaking field visits from time to time to supervise progress
Issue briefings to the press / media and state government about progress
Providing overall guidance to the Implementation Agency
Recommend to the ULB fixing of responsibilities for city-wide sanitation on a permanent basis
The CSTF shall also responsible to monitor and guide the planning process and implementation at
the initial stages of the project and shall conduct meetings and field visits at a later stage on an as-
needed basis to ensure quality implementation of the project.
City Sanitation Plan Nellore
Page 6 of 128
The CSTF shall responsibly recommend and assign below listed aspects to the ULB for the citywide
sanitation.
The ULB to have final overall responsibility for citywide sanitation, including devolving power, functions, functionaries and funds to them
Planning and financing including State Government and Government of India schemes
Asset creation including improvement and augmentation
Operations and Management (O&M) arrangements for all networks, on-site, individual, community and public sanitation facilities and systems (including transportation up to final treatment and disposal of wastes)
Fixing tariffs and revenue collections in order to make O&M sustainable
Improving access and instituting special O&M arrangements for the urban poor and un-served populations in slum areas and in mixed areas
Adopting standards
Infrastructure (e.g. design standards) (PHEDs/Parastatals), and
Service delivery standards (e.g. by urban development departments)
Adoption of regulatory roles including environmental standards (e.g. state pollution control boards), health outcomes (e.g. health departments)
Measures in case specific stakeholders do not discharge their responsibilities properly
Training and capacity building of implementing agency and related personnel
Monitoring of 100% sanitation involving multiple stakeholders
2.2 Members of the CSTF:
As per the NUSP guidelines, considering that CSTF shall comprise of representative/agencies from
some of the elected members of ULB, social volunteers, institutions involved in law, health, water
supply, sanitation, town planning, slum development, eminent persons and practitioners in civil
affairs, health, urban poverty, NGOs working on environmental components and representatives of
unions of Safai Karmachari’s etc, following members were elected as the members of the CSTF for
Nellore city.
Honorable Mayor (Executive Head)
5 Standing Committee Members
Municipal Commissioner (Convener)
Superintending Engineer
3 Executive Engineers – One from Water Works, one from UGD Works and one from SWM)
Municipal Health Officer
Sanitation Supervisor (I & II)
Deputy City Planner
Examiner of Accounts
Non-Governmental Organization
Community Organizer
Town Level Federation
Principal (DKW College)
Project Director (ICDS)
City Sanitation Plan Nellore
Page 7 of 128
3 CITY PROFILE
3.1 Location
Nellore also known as Vikrama Simhapuri existed from the times of the Mouryan Empire and was
ruled by Ashoka in the 3rd century. Nellore was known by the name of Vikrama Simhapuri till the 13th
century. Nellore is the head quarter of recently named Sri. Potti Sriramulu Nellore District, previously
known as Nellore District, in the coastal region of Andhra Pradesh.
It lies between latitudes 14o 24’ and 14o 30’ North, and between longitudes 79o 55’ and 80o 0’ East. It
is situated about 279 kilometers south of the state capital Andhra Pradesh Capital City and 168
kilometers north of Chennai on the Chennai-Kolkata Highway. Nellore City is spread in a north
easterly direction off National Highway No. 5 connecting Jharpokharia in Orissa and Chennai in Tamil
Nadu. The Balasore-Chennai stretch of NH-5, on which Nellore is an exit point, forms an arm of the
Golden Quadrilateral – a four lane divided carriageway, built as per International Standards. The
Broad Gauge railway line of South Central Railway from Vijayawada to Gudur runs through the city,
with Nellore being an important station on the main line. Convenient rail connections exist from
Nellore to Secunderabad/Hyderabad, Howrah and New Delhi to the north and with Chennai, Tirupati
and Thiruvananthapuram towards the south. It is located on the banks of Penna River and is well
known for its agriculture and aquaculture.
3.2 Economy
Proximity to the sea and fertile land towards the east has led to agriculture and aquaculture being
the backbone of the economy. The district has a cultivable area equal to 41.3% and the crops which
are most commonly grown in the district are paddy, jowar, bajra along with tobacco, chillies,
groundnut and sugarcane. Handloom, mica mines, thermal power generation and handmade
jewellery are other industries that contribute to the economic development. Also salt production is
the most popular in Nellore District mostly in Gogulapalli, Iskapalli and Ramathirdam villages. For the
salt production Krishnapatnam port takes the top position in Andhra Pradesh which is located
around 20 km from the city serving major economic activities to the city and district as whole.
3.3 Transportation
Road: Nellore is well connected by road with National Highway 5 from Chennai to Kolkata, part of
the Golden Quadrilateral expressway project, and passing through it. Nellore is connected by
APSRTC (Andhra Pradesh State Road Transport Corporation) to major parts of Andhra Pradesh, Tamil
Nadu and Karnataka, TNSTC from Chennai and KSRTC from Bangalore. Nellore is zonal headquarters
of APSRTC, comprising Nellore, Prakasam and Chittoor Districts.
Rail: Nellore railway station lies on Vijayawada – Chennai section of Howrah-Chennai main line and
hence well connected by rail to most parts of category station. It is recognized as an Andhra Station
in the Vijayawada railway division of South Central Railway Zone. It is also one amongst the top
hundred booking stations of Indian Railway.
Sea: Krishnapatnam Port Company in the sea is where Nellore lives. KPCL was formed by
government of Andhra Pradesh to develop the existing minor port into modern, deep water and high
City Sanitation Plan Nellore
Page 8 of 128
productivity port, on BOST (Build–Operate-Share-Transfer) concession basis for 50 years. It was
opened on July 17, 2008. On May 9, 2013, Government of India decided to set up a second major
port at Duga Rajapatnam in Nellore District. It will be the second major port in Andhra Pradesh.
Air: The nearest airport is at Tirupati (Renigunta), which is 130 km from the city which has limited
services to certain domestic destinations like Vijayawada, Hyderabad, Visakhapatnam, Mumbai and
Delhi. The nearest major airport is the Chennai International Airport, about 189 km from the city,
which is an international airport providing connectivity to major parts of India and the world. The
Government of Czech Republc has evinced interest in building a domestic airport in Nellore.
However, so far no concrete work has been done on this front as the process of land acquisition for
the airport is posing a problem.
3.4 Topography
The ground level of Nellore varies from 12m to 30m GTS, with the general slope being towards the
east. River Penna (or Pennar), also called Pinakini, rises in the Chennakesava Hills, also known as
Nandi Hills in the Kolar district of Karnataka. It flows for about 600 km and discharges into the Bay of
Bengal. It enters Andhra Pradesh near Chowlur, south of Hindupur in Ananthapur district. It is
impounded by the Somasila Dam in the Eastern Ghats at the border between Kadapa and Nellore
districts, after which the entire flow is through Nellore district. The dam is about 100 km upstream of
Nellore city. Two Anicuts, one at Sangam, 28 km upstream of Nellore, and the other in Nellore itself
were constructed by Sir Arthur Cotton in the 19th century. At Nellore Anicut, a Head Regulator was
constructed on the southern (or right) bank of the river and a canal, namely ‘Jaffer Saheb Canal’, was
excavated. After about 1.5 km., the said canal branches off within the city itself into three canals
namely – Maipadu and Koduru canals towards the east and Sarvepalli Canal initially to the south and
later towards south-east. Sarvepalli Canal flowing south east has an offshoot in Krishnapatnam
Canal. Sarvepalli Canal flows for a length of 32 km. and discharges into Sarvepalli Cheruvu feeding
agricultural fields enroute. The Kotha Koduru or Koduru Canal flows east besides Kotha Koduru road
for a length of 8 km. and joins the Buckingham Canal near Bay of Bengal, feeding small cheruvus and
canals enroute for irrigation and aquaculture purposes.
A large water body, namely Nellore Cheruvu, is located on the western side of the city. This is fed by
Nellore Tank Supply Canal or NTS Canal, which takes off from Sangam Anicut. The cheruvu has
recently been divided by an earthen bund and the eastern part, in the adjoining village of Kothuru,
has been converted into a Summer Storage Tank (SS Tank) for water supply.
3.5 Climate
The climate of Nellore city is generally dry with maximum temperature being of the order of 45oC in
April and May and lasting till June, and20oC in December – January. As the Bay of Bengal is only at a
distance of 26 km from the town, the sea breeze renders the climate of the city moderate both in
winter and in summer.
Annual rainfall is between 900 to 1200mm of which the Southwest Monsoon from June to
September contributes about 30% while the remainder takes place during the Northeast monsoon in
the months of October to December. The average number of rainy days is 51. The town is
City Sanitation Plan Nellore
Page 9 of 128
susceptible to cyclones which occur once or twice in a decade. The recent cyclones took place were
in 2015 and 2009.
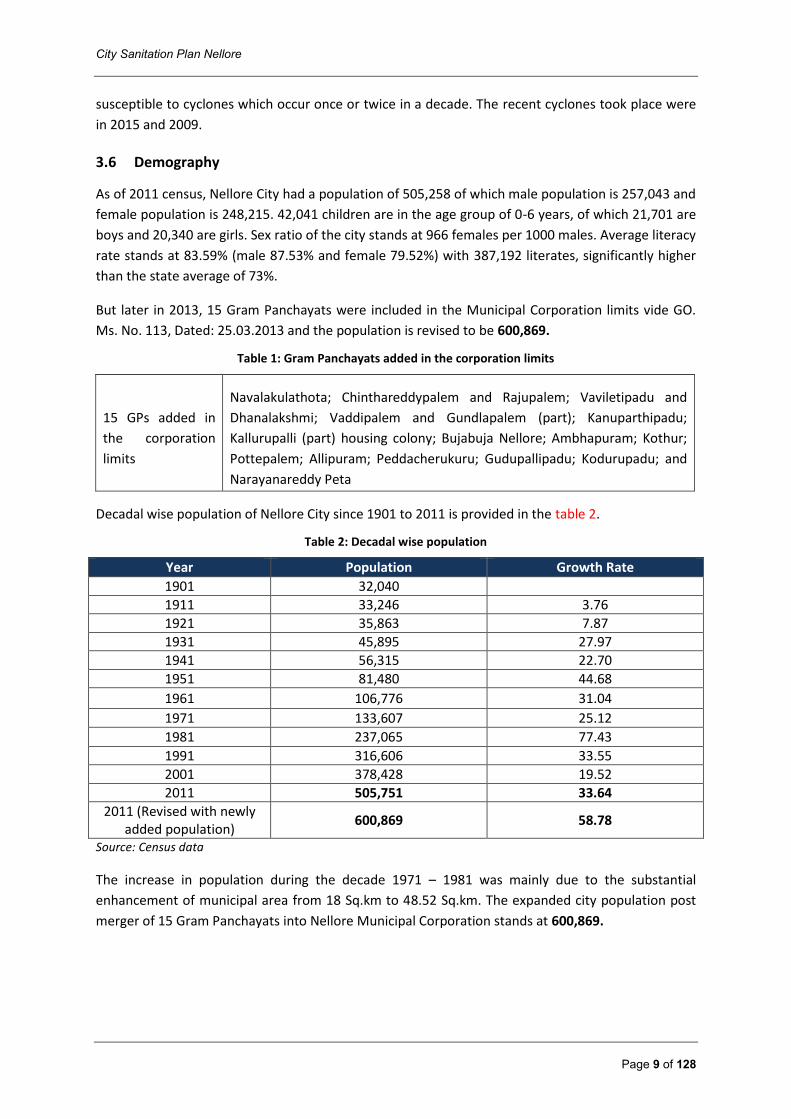
3.6 Demography
As of 2011 census, Nellore City had a population of 505,258 of which male population is 257,043 and
female population is 248,215. 42,041 children are in the age group of 0-6 years, of which 21,701 are
boys and 20,340 are girls. Sex ratio of the city stands at 966 females per 1000 males. Average literacy
rate stands at 83.59% (male 87.53% and female 79.52%) with 387,192 literates, significantly higher
than the state average of 73%.
But later in 2013, 15 Gram Panchayats were included in the Municipal Corporation limits vide GO.
Ms. No. 113, Dated: 25.03.2013 and the population is revised to be 600,869.
Table 1: Gram Panchayats added in the corporation limits
15 GPs added in
the corporation
limits
Navalakulathota; Chinthareddypalem and Rajupalem; Vaviletipadu and
Dhanalakshmi; Vaddipalem and Gundlapalem (part); Kanuparthipadu;
Kallurupalli (part) housing colony; Bujabuja Nellore; Ambhapuram; Kothur;
Pottepalem; Allipuram; Peddacherukuru; Gudupallipadu; Kodurupadu; and
Narayanareddy Peta
Decadal wise population of Nellore City since 1901 to 2011 is provided in the table 2.
Table 2: Decadal wise population
Year Population Growth Rate
1901 32,040
1911 33,246 3.76
1921 35,863 7.87
1931 45,895 27.97
1941 56,315 22.70
1951 81,480 44.68
1961 106,776 31.04
1971 133,607 25.12
1981 237,065 77.43
1991 316,606 33.55
2001 378,428 19.52
2011 505,751 33.64
2011 (Revised with newly added population)
600,869 58.78
Source: Census data
The increase in population during the decade 1971 – 1981 was mainly due to the substantial
enhancement of municipal area from 18 Sq.km to 48.52 Sq.km. The expanded city population post
merger of 15 Gram Panchayats into Nellore Municipal Corporation stands at 600,869.
City Sanitation Plan Nellore
Page 10 of 128
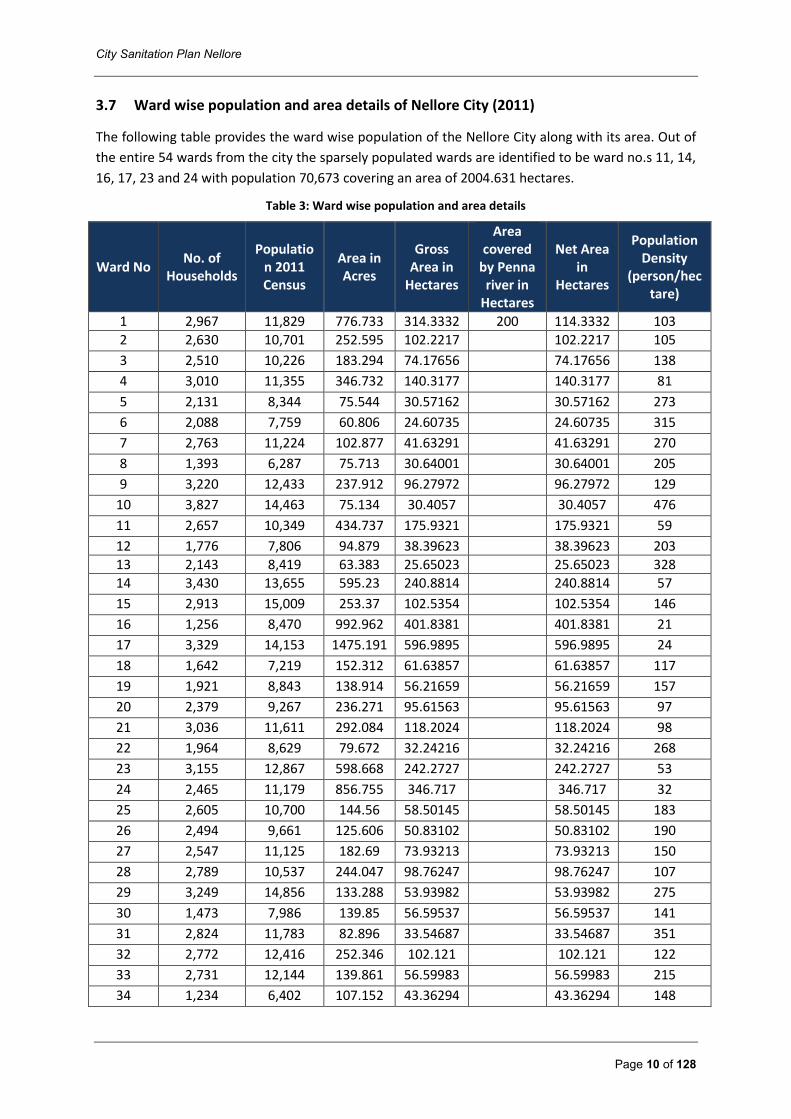
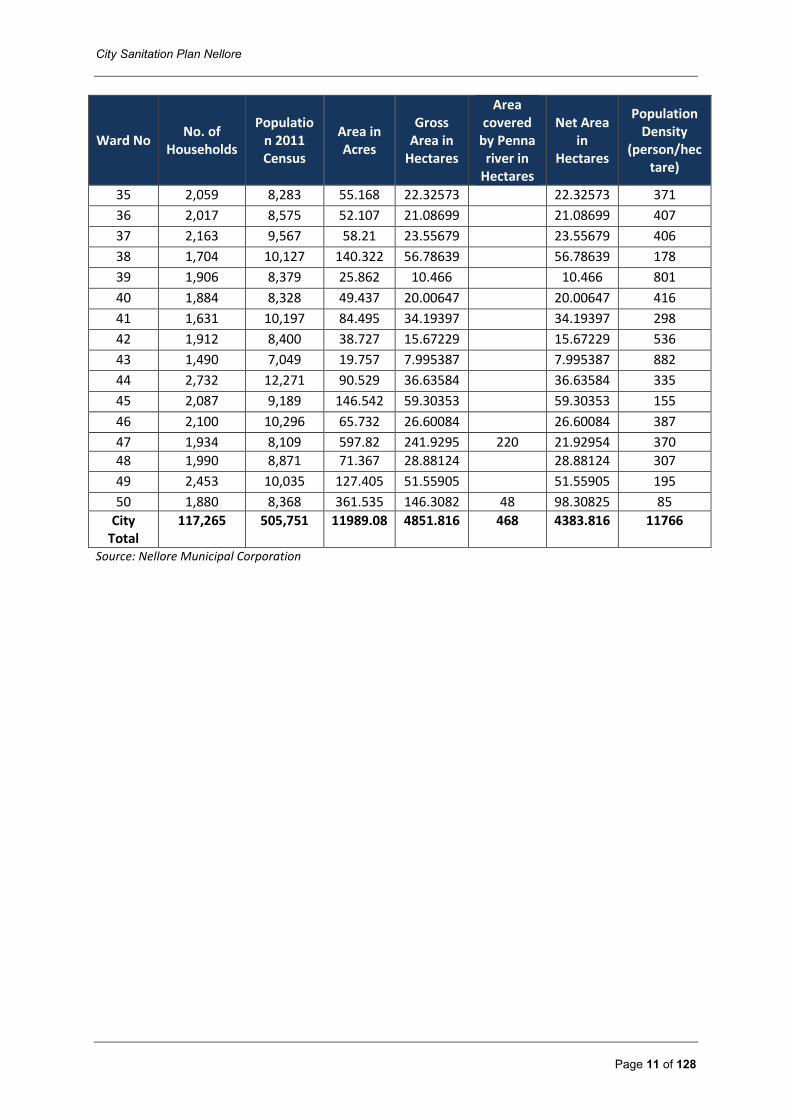
3.7 Ward wise population and area details of Nellore City (2011)
The following table provides the ward wise population of the Nellore City along with its area. Out of
the entire 54 wards from the city the sparsely populated wards are identified to be ward no.s 11, 14,
16, 17, 23 and 24 with population 70,673 covering an area of 2004.631 hectares.
Table 3: Ward wise population and area details
Ward No No. of
Households
Population 2011 Census
Area in Acres
Gross Area in
Hectares
Area covered
by Penna river in
Hectares
Net Area in
Hectares
Population Density
(person/hectare)
1 2,967 11,829 776.733 314.3332 200 114.3332 103
2 2,630 10,701 252.595 102.2217 102.2217 105
3 2,510 10,226 183.294 74.17656 74.17656 138
4 3,010 11,355 346.732 140.3177 140.3177 81
5 2,131 8,344 75.544 30.57162 30.57162 273
6 2,088 7,759 60.806 24.60735 24.60735 315
7 2,763 11,224 102.877 41.63291 41.63291 270
8 1,393 6,287 75.713 30.64001 30.64001 205
9 3,220 12,433 237.912 96.27972 96.27972 129
10 3,827 14,463 75.134 30.4057 30.4057 476
11 2,657 10,349 434.737 175.9321 175.9321 59
12 1,776 7,806 94.879 38.39623 38.39623 203
13 2,143 8,419 63.383 25.65023 25.65023 328
14 3,430 13,655 595.23 240.8814 240.8814 57
15 2,913 15,009 253.37 102.5354 102.5354 146
16 1,256 8,470 992.962 401.8381 401.8381 21
17 3,329 14,153 1475.191 596.9895 596.9895 24
18 1,642 7,219 152.312 61.63857 61.63857 117
19 1,921 8,843 138.914 56.21659 56.21659 157
20 2,379 9,267 236.271 95.61563 95.61563 97
21 3,036 11,611 292.084 118.2024 118.2024 98
22 1,964 8,629 79.672 32.24216 32.24216 268
23 3,155 12,867 598.668 242.2727 242.2727 53
24 2,465 11,179 856.755 346.717 346.717 32
25 2,605 10,700 144.56 58.50145 58.50145 183
26 2,494 9,661 125.606 50.83102 50.83102 190
27 2,547 11,125 182.69 73.93213 73.93213 150
28 2,789 10,537 244.047 98.76247 98.76247 107
29 3,249 14,856 133.288 53.93982 53.93982 275
30 1,473 7,986 139.85 56.59537 56.59537 141
31 2,824 11,783 82.896 33.54687 33.54687 351
32 2,772 12,416 252.346 102.121 102.121 122
33 2,731 12,144 139.861 56.59983 56.59983 215
34 1,234 6,402 107.152 43.36294 43.36294 148
City Sanitation Plan Nellore
Page 11 of 128
Ward No No. of
Households
Population 2011 Census
Area in Acres
Gross Area in
Hectares
Area covered
by Penna river in
Hectares
Net Area in
Hectares
Population Density
(person/hectare)
35 2,059 8,283 55.168 22.32573 22.32573 371
36 2,017 8,575 52.107 21.08699 21.08699 407
37 2,163 9,567 58.21 23.55679 23.55679 406
38 1,704 10,127 140.322 56.78639 56.78639 178
39 1,906 8,379 25.862 10.466 10.466 801
40 1,884 8,328 49.437 20.00647 20.00647 416
41 1,631 10,197 84.495 34.19397 34.19397 298
42 1,912 8,400 38.727 15.67229 15.67229 536
43 1,490 7,049 19.757 7.995387 7.995387 882
44 2,732 12,271 90.529 36.63584 36.63584 335
45 2,087 9,189 146.542 59.30353 59.30353 155
46 2,100 10,296 65.732 26.60084 26.60084 387
47 1,934 8,109 597.82 241.9295 220 21.92954 370
48 1,990 8,871 71.367 28.88124 28.88124 307
49 2,453 10,035 127.405 51.55905 51.55905 195
50 1,880 8,368 361.535 146.3082 48 98.30825 85
City Total
117,265 505,751 11989.08 4851.816 468 4383.816 11766
Source: Nellore Municipal Corporation
City Sanitation Plan Nellore
Page 12 of 128
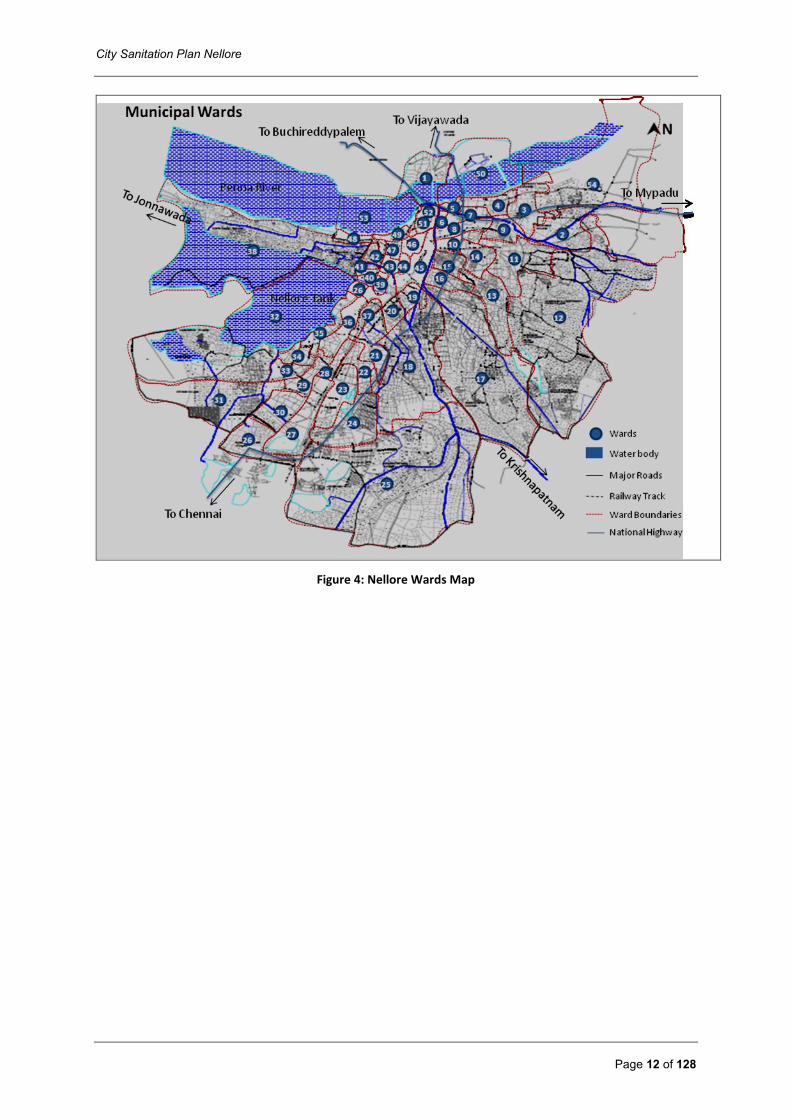
Figure 4: Nellore Wards Map
City Sanitation Plan Nellore
Page 13 of 128
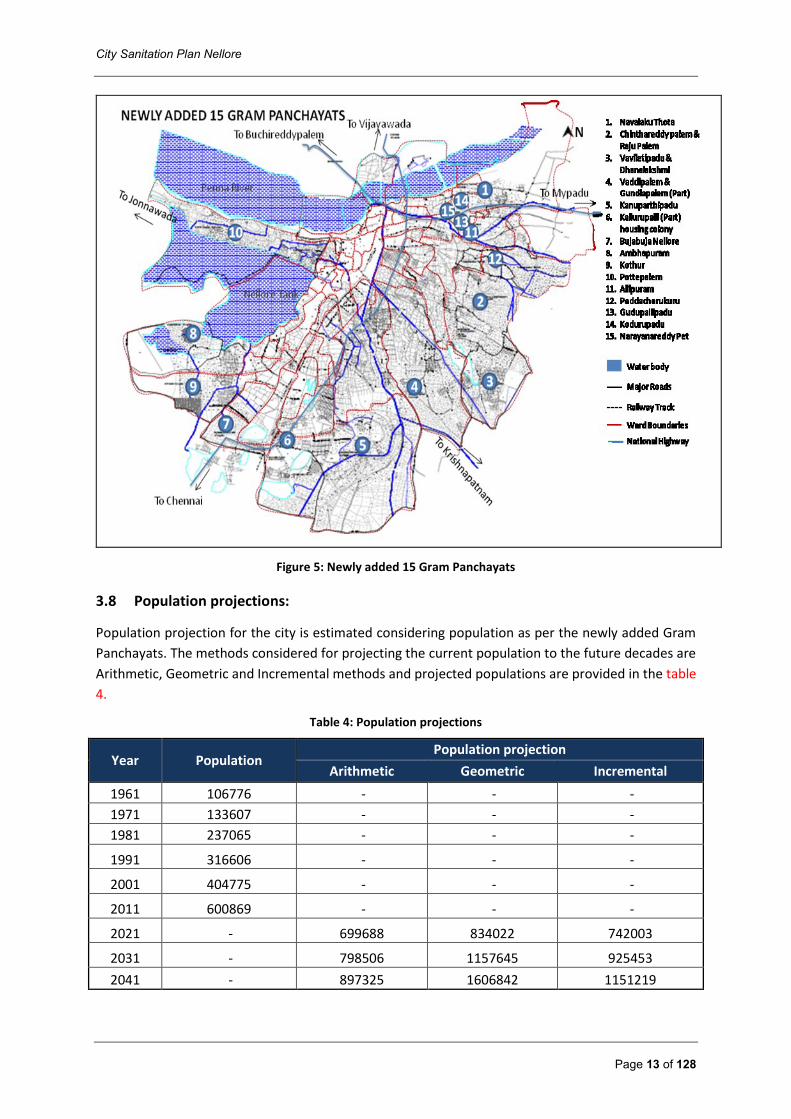
Figure 5: Newly added 15 Gram Panchayats
3.8 Population projections:
Population projection for the city is estimated considering population as per the newly added Gram
Panchayats. The methods considered for projecting the current population to the future decades are
Arithmetic, Geometric and Incremental methods and projected populations are provided in the table
4.
Table 4: Population projections
Year Population Population projection
Arithmetic Geometric Incremental
1961 106776 - - -
1971 133607 - - -
1981 237065 - - -
1991 316606 - - -
2001 404775 - - -
2011 600869 - - -
2021 - 699688 834022 742003
2031 - 798506 1157645 925453
2041 - 897325 1606842 1151219
City Sanitation Plan Nellore
Page 14 of 128
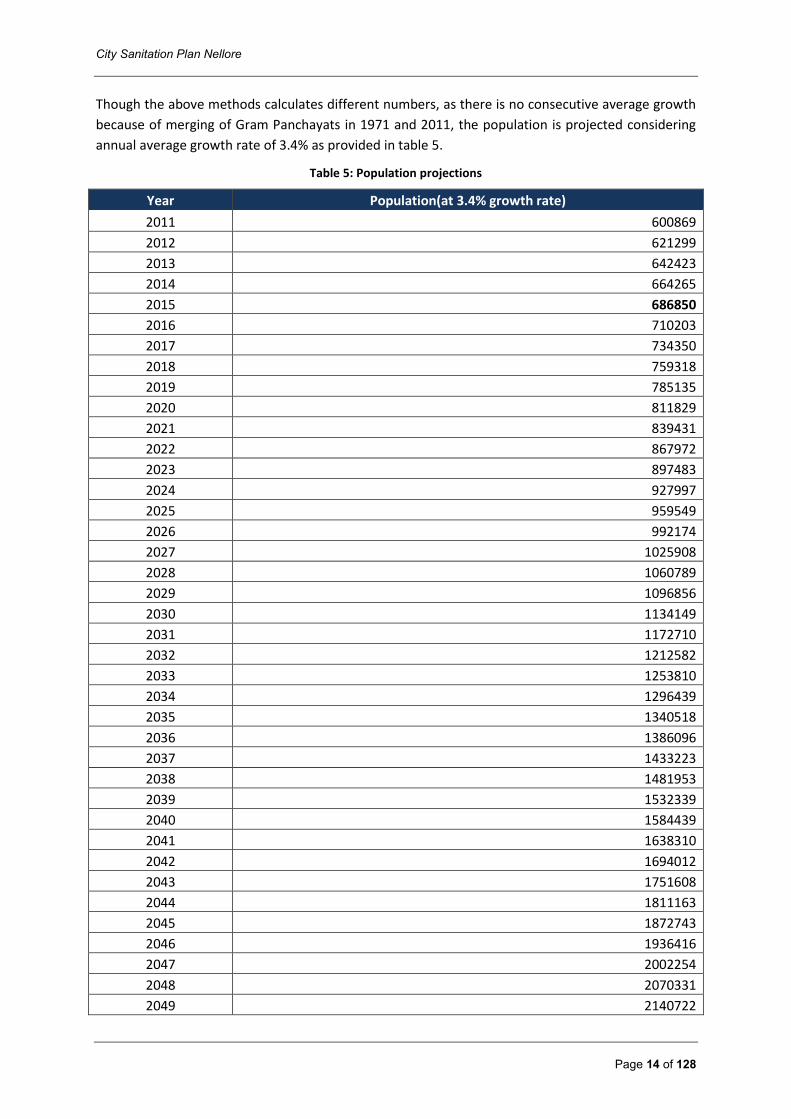
Though the above methods calculates different numbers, as there is no consecutive average growth
because of merging of Gram Panchayats in 1971 and 2011, the population is projected considering
annual average growth rate of 3.4% as provided in table 5.
Table 5: Population projections
Year Population(at 3.4% growth rate)
2011 600869
2012 621299
2013 642423
2014 664265
2015 686850
2016 710203
2017 734350
2018 759318
2019 785135
2020 811829
2021 839431
2022 867972
2023 897483
2024 927997
2025 959549
2026 992174
2027 1025908
2028 1060789
2029 1096856
2030 1134149
2031 1172710
2032 1212582
2033 1253810
2034 1296439
2035 1340518
2036 1386096
2037 1433223
2038 1481953
2039 1532339
2040 1584439
2041 1638310
2042 1694012
2043 1751608
2044 1811163
2045 1872743
2046 1936416
2047 2002254
2048 2070331
2049 2140722
City Sanitation Plan Nellore
Page 15 of 128
Year Population(at 3.4% growth rate)
2050 2213507
2051 2288766
The following chapters are worked based on the projected population of 686850 for 2015.
City Sanitation Plan Nellore
Page 16 of 128
4 WATER SUPPLY
Nellore is said to be the first town in India to have metered water supply, with 407 house
connections metered among 892 house connections in 1935. Nellore has commissioned its water
supply distribution in 1908 with an infiltration gallery and connecting well on the bank of the River
Penna. During its initial phase, pumping was done by oil engines till June, 1935, and is replaced by
electric motors.
Nellore city is geographically located on either sides of the River Penna, where 5% of the total city
area is on the northern part of the river and 95% is on the southern part of the river passing through
the city. The city area and population is recently increased with additional 15 Gram Panchayats
merged in the Nellore Municipal Corporation. As per 2011 census the population of the city including
newly merged Gram Panchayats is 600,869 with 139320 HHs. Considering an annual average growth
rate is at 3.4% the population of the Nellore city is estimated to be 686850 as on 2015 with 159362
HHs at 4.3 persons per HH. The following report is developed considering current population at
686850.
The city is divided into 54 wards including newly added Gram Panchayats. Of the entire 54 wards,
only two wards (ward 1 and ward 50) are located on the northern side of the River Penna and the
rest 52 wards are located on the southern side of the River Penna. Since, these two parts are
separated by the river of 750 m wide and cannot be brought under one source; water is supplied in
these regions by:
An infiltration gallery of 5MLD capacity and the Clear Water Rising Main in the northern side.
Existing 20 infiltration wells at HWW connected to galleries from sub-surface water of River
Penna supplies adequate quantity of water in the southern region.
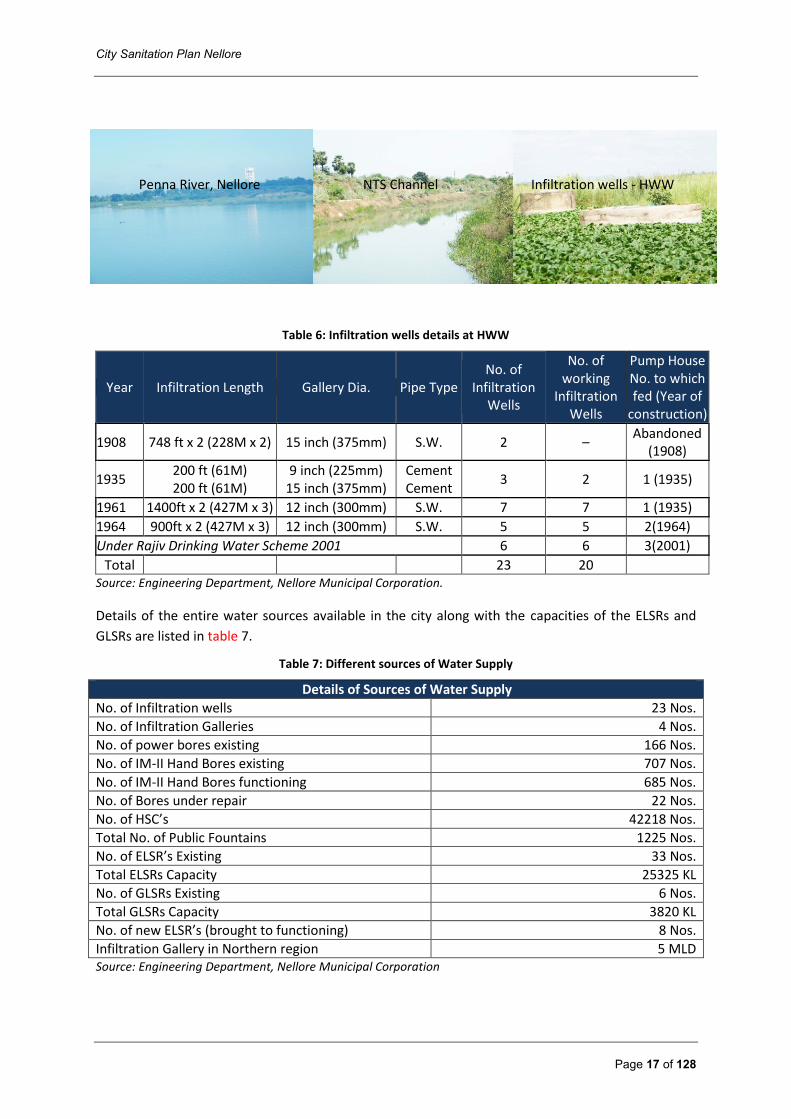
4.1 Water Source
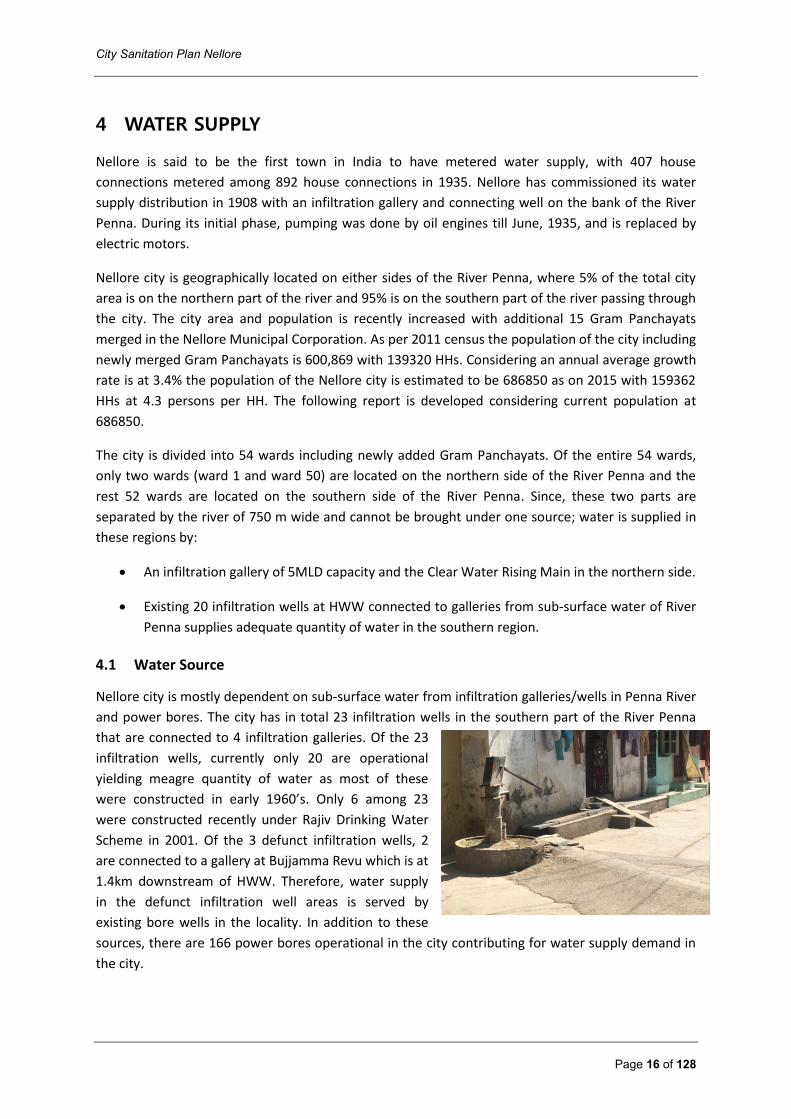
Nellore city is mostly dependent on sub-surface water from infiltration galleries/wells in Penna River
and power bores. The city has in total 23 infiltration wells in the southern part of the River Penna
that are connected to 4 infiltration galleries. Of the 23
infiltration wells, currently only 20 are operational
yielding meagre quantity of water as most of these
were constructed in early 1960’s. Only 6 among 23
were constructed recently under Rajiv Drinking Water
Scheme in 2001. Of the 3 defunct infiltration wells, 2
are connected to a gallery at Bujjamma Revu which is at
1.4km downstream of HWW. Therefore, water supply
in the defunct infiltration well areas is served by
existing bore wells in the locality. In addition to these
sources, there are 166 power bores operational in the city contributing for water supply demand in
the city.
City Sanitation Plan Nellore
Page 17 of 128
Table 6: Infiltration wells details at HWW
Year Infiltration Length Gallery Dia. Pipe Type No. of
Infiltration Wells
No. of working
Infiltration Wells
Pump House No. to which fed (Year of
construction)
1908 748 ft x 2 (228M x 2) 15 inch (375mm) S.W. 2 – Abandoned
(1908)
1935 200 ft (61M) 200 ft (61M)
9 inch (225mm) 15 inch (375mm)
Cement Cement
3 2 1 (1935)
1961 1400ft x 2 (427M x 3) 12 inch (300mm) S.W. 7 7 1 (1935)
1964 900ft x 2 (427M x 3) 12 inch (300mm) S.W. 5 5 2(1964)
Under Rajiv Drinking Water Scheme 2001 6 6 3(2001)
Total 23 20 Source: Engineering Department, Nellore Municipal Corporation.
Details of the entire water sources available in the city along with the capacities of the ELSRs and
GLSRs are listed in table 7.
Table 7: Different sources of Water Supply
Details of Sources of Water Supply
No. of Infiltration wells 23 Nos.
No. of Infiltration Galleries 4 Nos.
No. of power bores existing 166 Nos.
No. of IM-II Hand Bores existing 707 Nos.
No. of IM-II Hand Bores functioning 685 Nos.
No. of Bores under repair 22 Nos.
No. of HSC’s 42218 Nos.
Total No. of Public Fountains 1225 Nos.
No. of ELSR’s Existing 33 Nos.
Total ELSRs Capacity 25325 KL
No. of GLSRs Existing 6 Nos.
Total GLSRs Capacity 3820 KL
No. of new ELSR’s (brought to functioning) 8 Nos.
Infiltration Gallery in Northern region 5 MLD Source: Engineering Department, Nellore Municipal Corporation
NTS Channel Infiltration wells - HWW Penna River, Nellore
City Sanitation Plan Nellore
Page 18 of 128
In addition to the above listed sources, existing 18 MLD Conventional Water Treatment Plant
commissioned in 2010 at Kothuru also serves to some extent of the city covering Indiramma Colony,
Bujabuja Nellore, Ambapuram and Kothuru zones. The source of the plant is surface water of River
Penna conveyed through Nellore Tank Supply Channel (NTS) originating at Sangam Anicut. The Canal
is about 36 km long and feeds the Nellore Cheruvu (Summer Storage Tank), a large water body with
a water spread area of 14.56 sq.km abutting Nellore to its West. The water from the canal is tapped
at Kondlapudi and is pumped to the Summer Storage Tank of 8000 ML capacity carved out of Nellore
Cheruvu with a bypass line leading to the aforesaid 18 MLD plant.
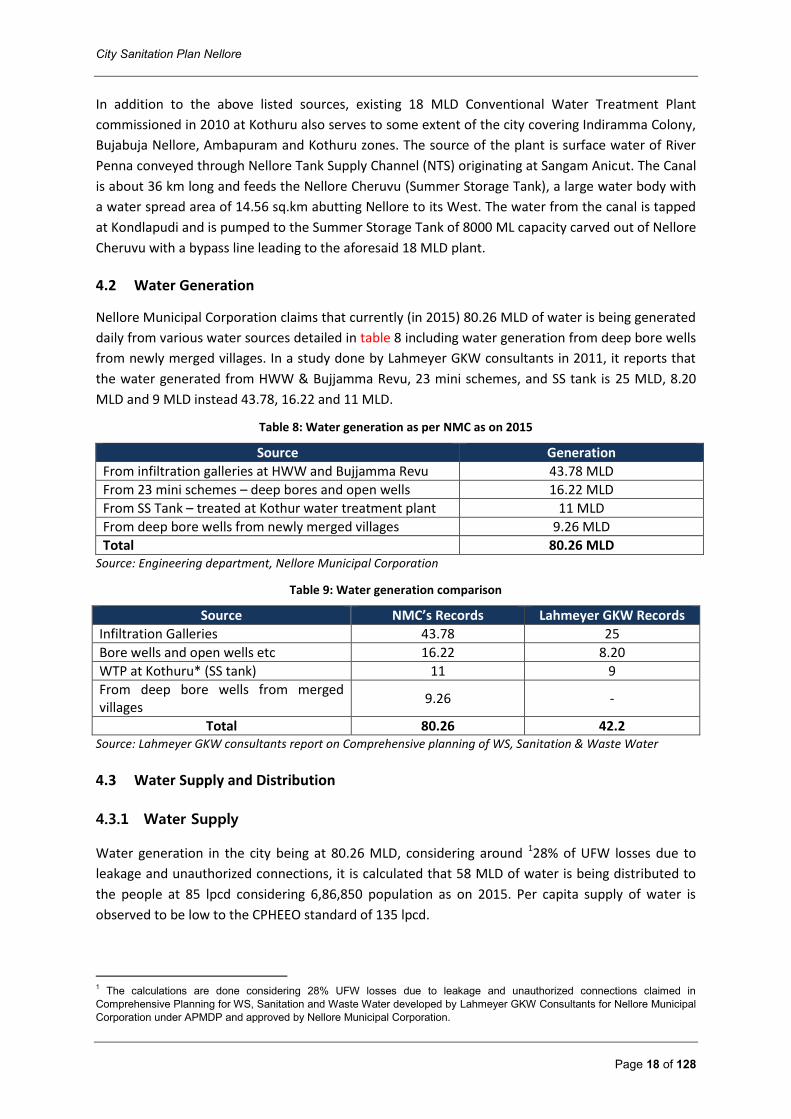
4.2 Water Generation
Nellore Municipal Corporation claims that currently (in 2015) 80.26 MLD of water is being generated
daily from various water sources detailed in table 8 including water generation from deep bore wells
from newly merged villages. In a study done by Lahmeyer GKW consultants in 2011, it reports that
the water generated from HWW & Bujjamma Revu, 23 mini schemes, and SS tank is 25 MLD, 8.20
MLD and 9 MLD instead 43.78, 16.22 and 11 MLD.
Table 8: Water generation as per NMC as on 2015
Source Generation
From infiltration galleries at HWW and Bujjamma Revu 43.78 MLD
From 23 mini schemes – deep bores and open wells 16.22 MLD
From SS Tank – treated at Kothur water treatment plant 11 MLD
From deep bore wells from newly merged villages 9.26 MLD
Total 80.26 MLD Source: Engineering department, Nellore Municipal Corporation
Table 9: Water generation comparison
Source NMC’s Records Lahmeyer GKW Records
Infiltration Galleries 43.78 25
Bore wells and open wells etc 16.22 8.20
WTP at Kothuru* (SS tank) 11 9
From deep bore wells from merged villages
9.26 -
Total 80.26 42.2 Source: Lahmeyer GKW consultants report on Comprehensive planning of WS, Sanitation & Waste Water
4.3 Water Supply and Distribution
4.3.1 Water Supply
Water generation in the city being at 80.26 MLD, considering around 128% of UFW losses due to
leakage and unauthorized connections, it is calculated that 58 MLD of water is being distributed to
the people at 85 lpcd considering 6,86,850 population as on 2015. Per capita supply of water is
observed to be low to the CPHEEO standard of 135 lpcd.
1 The calculations are done considering 28% UFW losses due to leakage and unauthorized connections claimed in
Comprehensive Planning for WS, Sanitation and Waste Water developed by Lahmeyer GKW Consultants for Nellore Municipal
Corporation under APMDP and approved by Nellore Municipal Corporation.
City Sanitation Plan Nellore
Page 19 of 128
Water supply in the Nellore city varies from area to area depending on their location and proximity
to the pumping station. At the present situation water is supplied in two shifts for 2 hours each to
almost 49 wards among 54 wards, and is supplied once in a day to the remaining 5 wards namely 26,
31, 32, 53 partly and 54 partly.
4.3.2 Water Distribution
Water collected at the infiltration galleries and wells is chlorinated by direct pipe feed from tonner
cylinders and is distributed to the consumers through the existing 33 elevated reservoirs and 6
ground level reservoirs. Further 22 numbers of tankers supplies (each tanker of capacity 3000 litres)
water at the rate of 5 trips per day in Shivaji Nagar, Samatha Nagar, Bhagath Singh Colony,
Nagamma Colony, BujaBuja Nellore, YadavaPalem, RTC colony, Talpagiri colony, Vikalangula colony,
KothuruChoutamitta, KothuruShivaji Colony, Chandra Babu Nagar, Sramika Nagar, Valluramma
Colony, YSR Nagar, Ram Nagar, Nethaji Nagar and Janardhan Reddy colony.
Out of the 33 elevated reservoirs, 31 are on the south bank of the river and 2 are on the north bank
of the river. The 2 reservoirs on the north banks are at the dilapidated conditions and still serving the
requirement and are under use. 10 from the 31 reservoirs serving on the south bank are damaged
and witnessed no distribution. Another 2 reservoirs one at Podalakuru road (1000KL capacity) and
another at BV Nagar (450KL capacity) which are at the dilapidated condition are proposed to
undergo improvements as these are currently under use. Out of the 6 ground level service
reservoirs, 5 are in working condition and 1 is discarded. All the GLSRs are located on the south bank
of the river.
In addition to the existing elevated reservoirs another 17 ELSRs for serving entire Nellore core area
and another 15 ELSRs for serving areas recently added have been proposed for construction by PHED
under HUDCO plan.
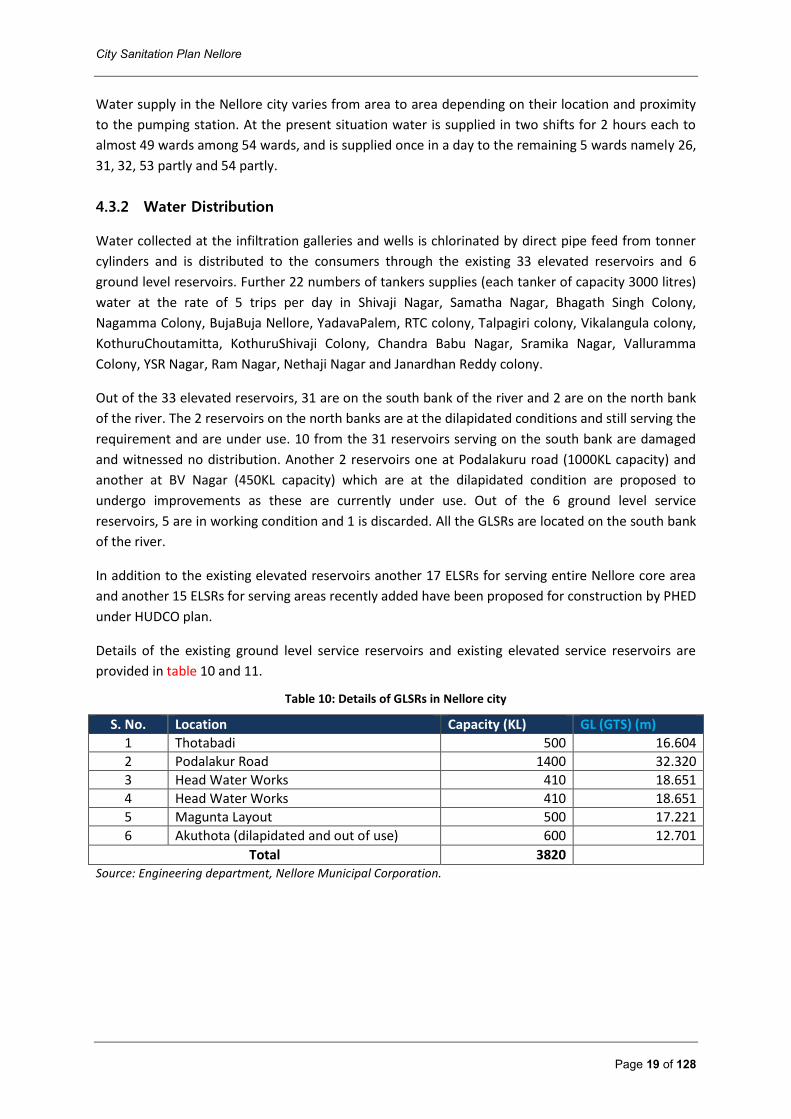
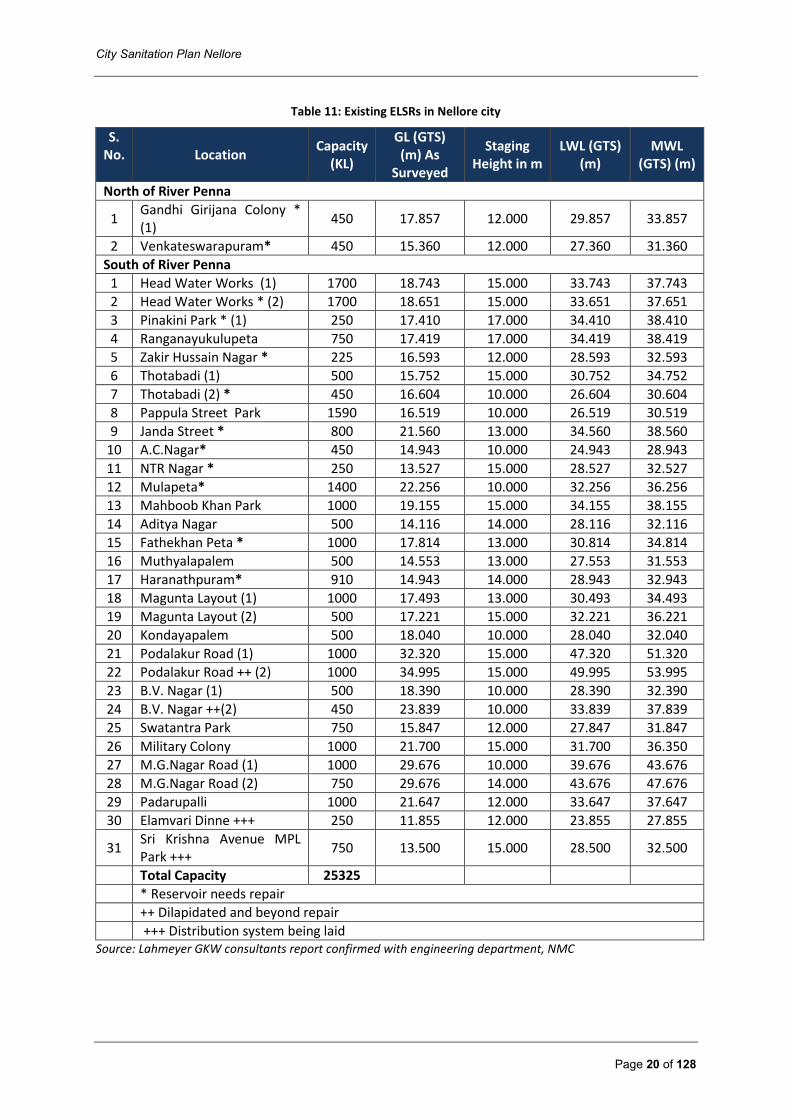
Details of the existing ground level service reservoirs and existing elevated service reservoirs are
provided in table 10 and 11.
Table 10: Details of GLSRs in Nellore city
S. No. Location Capacity (KL) GL (GTS) (m)
1 Thotabadi 500 16.604
2 Podalakur Road 1400 32.320
3 Head Water Works 410 18.651
4 Head Water Works 410 18.651
5 Magunta Layout 500 17.221
6 Akuthota (dilapidated and out of use) 600 12.701
Total 3820 Source: Engineering department, Nellore Municipal Corporation.
City Sanitation Plan Nellore
Page 20 of 128
Table 11: Existing ELSRs in Nellore city
S. No. Location
Capacity (KL)
GL (GTS) (m) As
Surveyed
Staging Height in m
LWL (GTS) (m)
MWL (GTS) (m)
North of River Penna
1 Gandhi Girijana Colony * (1)
450 17.857 12.000 29.857 33.857
2 Venkateswarapuram* 450 15.360 12.000 27.360 31.360
South of River Penna
1 Head Water Works (1) 1700 18.743 15.000 33.743 37.743
2 Head Water Works * (2) 1700 18.651 15.000 33.651 37.651
3 Pinakini Park * (1) 250 17.410 17.000 34.410 38.410
4 Ranganayukulupeta 750 17.419 17.000 34.419 38.419
5 Zakir Hussain Nagar * 225 16.593 12.000 28.593 32.593
6 Thotabadi (1) 500 15.752 15.000 30.752 34.752
7 Thotabadi (2) * 450 16.604 10.000 26.604 30.604
8 Pappula Street Park 1590 16.519 10.000 26.519 30.519
9 Janda Street * 800 21.560 13.000 34.560 38.560
10 A.C.Nagar* 450 14.943 10.000 24.943 28.943
11 NTR Nagar * 250 13.527 15.000 28.527 32.527
12 Mulapeta* 1400 22.256 10.000 32.256 36.256
13 Mahboob Khan Park 1000 19.155 15.000 34.155 38.155
14 Aditya Nagar 500 14.116 14.000 28.116 32.116
15 Fathekhan Peta * 1000 17.814 13.000 30.814 34.814
16 Muthyalapalem 500 14.553 13.000 27.553 31.553
17 Haranathpuram* 910 14.943 14.000 28.943 32.943
18 Magunta Layout (1) 1000 17.493 13.000 30.493 34.493
19 Magunta Layout (2) 500 17.221 15.000 32.221 36.221
20 Kondayapalem 500 18.040 10.000 28.040 32.040
21 Podalakur Road (1) 1000 32.320 15.000 47.320 51.320
22 Podalakur Road ++ (2) 1000 34.995 15.000 49.995 53.995
23 B.V. Nagar (1) 500 18.390 10.000 28.390 32.390
24 B.V. Nagar ++(2) 450 23.839 10.000 33.839 37.839
25 Swatantra Park 750 15.847 12.000 27.847 31.847
26 Military Colony 1000 21.700 15.000 31.700 36.350
27 M.G.Nagar Road (1) 1000 29.676 10.000 39.676 43.676
28 M.G.Nagar Road (2) 750 29.676 14.000 43.676 47.676
29 Padarupalli 1000 21.647 12.000 33.647 37.647
30 Elamvari Dinne +++ 250 11.855 12.000 23.855 27.855
31 Sri Krishna Avenue MPL Park +++
750 13.500 15.000 28.500 32.500
Total Capacity 25325
* Reservoir needs repair
++ Dilapidated and beyond repair
+++ Distribution system being laid Source: Lahmeyer GKW consultants report confirmed with engineering department, NMC
City Sanitation Plan Nellore
Page 21 of 128
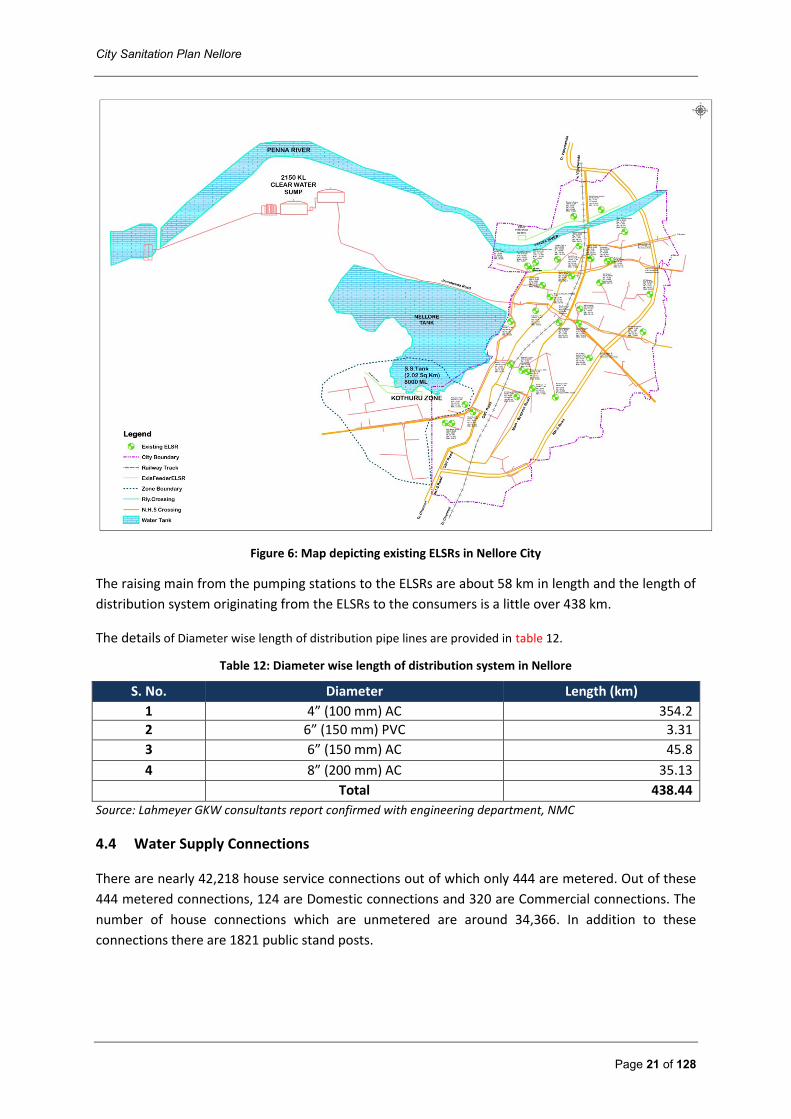
Figure 6: Map depicting existing ELSRs in Nellore City
The raising main from the pumping stations to the ELSRs are about 58 km in length and the length of
distribution system originating from the ELSRs to the consumers is a little over 438 km.
The details of Diameter wise length of distribution pipe lines are provided in table 12.
Table 12: Diameter wise length of distribution system in Nellore
S. No. Diameter Length (km)
1 4” (100 mm) AC 354.2
2 6” (150 mm) PVC 3.31
3 6” (150 mm) AC 45.8
4 8” (200 mm) AC 35.13
Total 438.44
Source: Lahmeyer GKW consultants report confirmed with engineering department, NMC
4.4 Water Supply Connections
There are nearly 42,218 house service connections out of which only 444 are metered. Out of these
444 metered connections, 124 are Domestic connections and 320 are Commercial connections. The
number of house connections which are unmetered are around 34,366. In addition to these
connections there are 1821 public stand posts.

City Sanitation Plan Nellore
Page 22 of 128
4.5 Water Supply in Slums
Slums in the city receives water from these 1821 public stand posts which supply potable water for 4
hours daily. 2Out of the 138 slums in the city, 75 slums are fully connected with municipal water
supply network, 62 are partially connected and one is not connected at all. 4More than 42% of the
slum HHs is dependent on tube wells and hand pumps for drinking purposes, 40% HHs have direct
water supply connections within their premises, 7% depends on community taps, and more than 5%
collects water from open wells and 0.3% HHs depends on surface water for drinking purposes.
Table 13: Status of WS in slums
Status of WS in Slums
Fully connected 75
Partially connected 62
Not connected 1
Total no. of slums 138 Source: Socio-economic survey conducted in slums under RAY
4.6 Non-Revenue Water
As per the surveys conducted by the Lahmeyer GKW consultants for preparation of DPR on
Comprehensive Planning for Water supply identified that there are about 28% of losses due to
leaking and unauthorized connections which do not generate the revenue. Recently in 2015, 5250
unauthorized house service connections have been detected and regulated after penalizing them.
4.7 Operation and Maintenance
4.7.1 Water Supply Charges
Table 14: Water Supply Charges
Type of Charges Cost Frequency of collection
Tap connection Rs. 8265 Collected one time
Monthly charges
Metered Connections: Varies; Unmetered Connections: Rs. 100/month
Metered Collected monthly Unmetered Collected once for 6 months
Source: Accounts department, Nellore Municipal Corporation as on 2015.
2 Analysis developed based on the Socio-Economic Survey conducted under RAY program.
City Sanitation Plan Nellore
Page 23 of 128
Current supply – 85lpcd
Supply gap – 50lpcd
Current water generation demand – 118.72 MLD
Current water generation gap – 38.42 MLD
Estimated generation demand – 324 MLD by 2045.
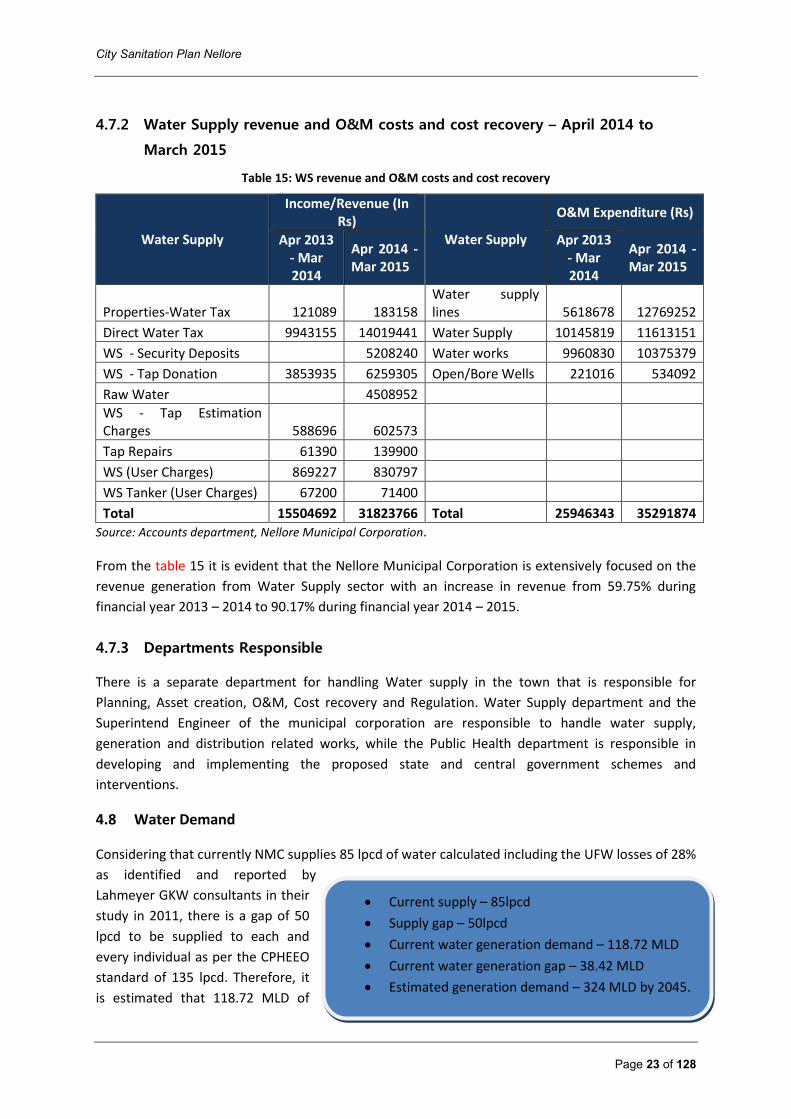
4.7.2 Water Supply revenue and O&M costs and cost recovery – April 2014 to
March 2015
Table 15: WS revenue and O&M costs and cost recovery
Water Supply
Income/Revenue (In Rs)
Water Supply
O&M Expenditure (Rs)
Apr 2013 - Mar 2014
Apr 2014 - Mar 2015
Apr 2013 - Mar 2014
Apr 2014 - Mar 2015
Properties-Water Tax 121089 183158 Water supply lines 5618678 12769252
Direct Water Tax 9943155 14019441 Water Supply 10145819 11613151
WS - Security Deposits 5208240 Water works 9960830 10375379
WS - Tap Donation 3853935 6259305 Open/Bore Wells 221016 534092
Raw Water 4508952
WS - Tap Estimation Charges 588696 602573
Tap Repairs 61390 139900
WS (User Charges) 869227 830797
WS Tanker (User Charges) 67200 71400
Total 15504692 31823766 Total 25946343 35291874
Source: Accounts department, Nellore Municipal Corporation.
From the table 15 it is evident that the Nellore Municipal Corporation is extensively focused on the
revenue generation from Water Supply sector with an increase in revenue from 59.75% during
financial year 2013 – 2014 to 90.17% during financial year 2014 – 2015.
4.7.3 Departments Responsible
There is a separate department for handling Water supply in the town that is responsible for
Planning, Asset creation, O&M, Cost recovery and Regulation. Water Supply department and the
Superintend Engineer of the municipal corporation are responsible to handle water supply,
generation and distribution related works, while the Public Health department is responsible in
developing and implementing the proposed state and central government schemes and
interventions.
4.8 Water Demand
Considering that currently NMC supplies 85 lpcd of water calculated including the UFW losses of 28%
as identified and reported by
Lahmeyer GKW consultants in their
study in 2011, there is a gap of 50
lpcd to be supplied to each and
every individual as per the CPHEEO
standard of 135 lpcd. Therefore, it
is estimated that 118.72 MLD of
City Sanitation Plan Nellore
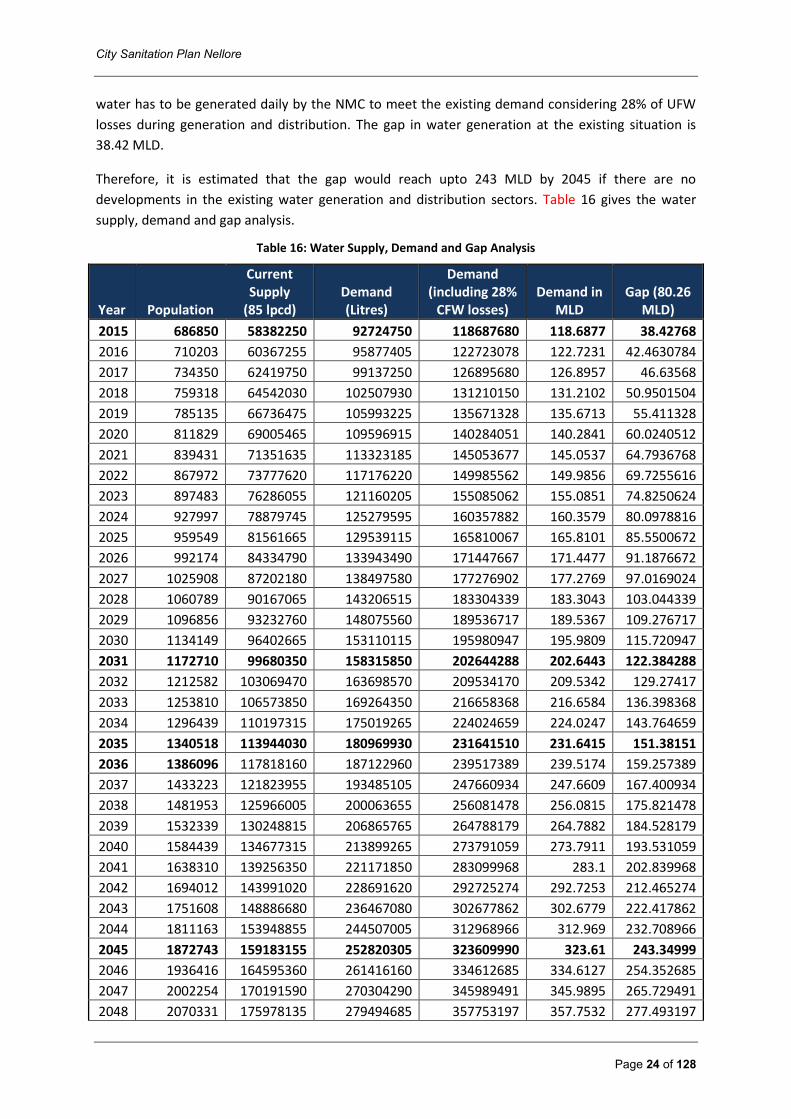
Page 24 of 128
water has to be generated daily by the NMC to meet the existing demand considering 28% of UFW
losses during generation and distribution. The gap in water generation at the existing situation is
38.42 MLD.
Therefore, it is estimated that the gap would reach upto 243 MLD by 2045 if there are no
developments in the existing water generation and distribution sectors. Table 16 gives the water
supply, demand and gap analysis.
Table 16: Water Supply, Demand and Gap Analysis
Year Population
Current Supply
(85 lpcd) Demand (Litres)
Demand (including 28%
CFW losses) Demand in
MLD Gap (80.26
MLD)
2015 686850 58382250 92724750 118687680 118.6877 38.42768
2016 710203 60367255 95877405 122723078 122.7231 42.4630784
2017 734350 62419750 99137250 126895680 126.8957 46.63568
2018 759318 64542030 102507930 131210150 131.2102 50.9501504
2019 785135 66736475 105993225 135671328 135.6713 55.411328
2020 811829 69005465 109596915 140284051 140.2841 60.0240512
2021 839431 71351635 113323185 145053677 145.0537 64.7936768
2022 867972 73777620 117176220 149985562 149.9856 69.7255616
2023 897483 76286055 121160205 155085062 155.0851 74.8250624
2024 927997 78879745 125279595 160357882 160.3579 80.0978816
2025 959549 81561665 129539115 165810067 165.8101 85.5500672
2026 992174 84334790 133943490 171447667 171.4477 91.1876672
2027 1025908 87202180 138497580 177276902 177.2769 97.0169024
2028 1060789 90167065 143206515 183304339 183.3043 103.044339
2029 1096856 93232760 148075560 189536717 189.5367 109.276717
2030 1134149 96402665 153110115 195980947 195.9809 115.720947
2031 1172710 99680350 158315850 202644288 202.6443 122.384288
2032 1212582 103069470 163698570 209534170 209.5342 129.27417
2033 1253810 106573850 169264350 216658368 216.6584 136.398368
2034 1296439 110197315 175019265 224024659 224.0247 143.764659
2035 1340518 113944030 180969930 231641510 231.6415 151.38151
2036 1386096 117818160 187122960 239517389 239.5174 159.257389
2037 1433223 121823955 193485105 247660934 247.6609 167.400934
2038 1481953 125966005 200063655 256081478 256.0815 175.821478
2039 1532339 130248815 206865765 264788179 264.7882 184.528179
2040 1584439 134677315 213899265 273791059 273.7911 193.531059
2041 1638310 139256350 221171850 283099968 283.1 202.839968
2042 1694012 143991020 228691620 292725274 292.7253 212.465274
2043 1751608 148886680 236467080 302677862 302.6779 222.417862
2044 1811163 153948855 244507005 312968966 312.969 232.708966
2045 1872743 159183155 252820305 323609990 323.61 243.34999
2046 1936416 164595360 261416160 334612685 334.6127 254.352685
2047 2002254 170191590 270304290 345989491 345.9895 265.729491
2048 2070331 175978135 279494685 357753197 357.7532 277.493197
City Sanitation Plan Nellore
Page 25 of 128
Year Population
Current Supply
(85 lpcd) Demand (Litres)
Demand (including 28%
CFW losses) Demand in
MLD Gap (80.26
MLD)
2049 2140722 181961370 288997470 369916762 369.9168 289.656762
2050 2213507 188148095 298823445 382494010 382.494 302.23401
2051 2288766 194545110 308983410 395498765 395.4988 315.238765
2052 2366584 201159640 319488840 408945715 408.9457 328.685715
2053 2447048 207999080 330351480 422849894 422.8499 342.589894
2054 2530247 215070995 341583345 437226682 437.2267 356.966682
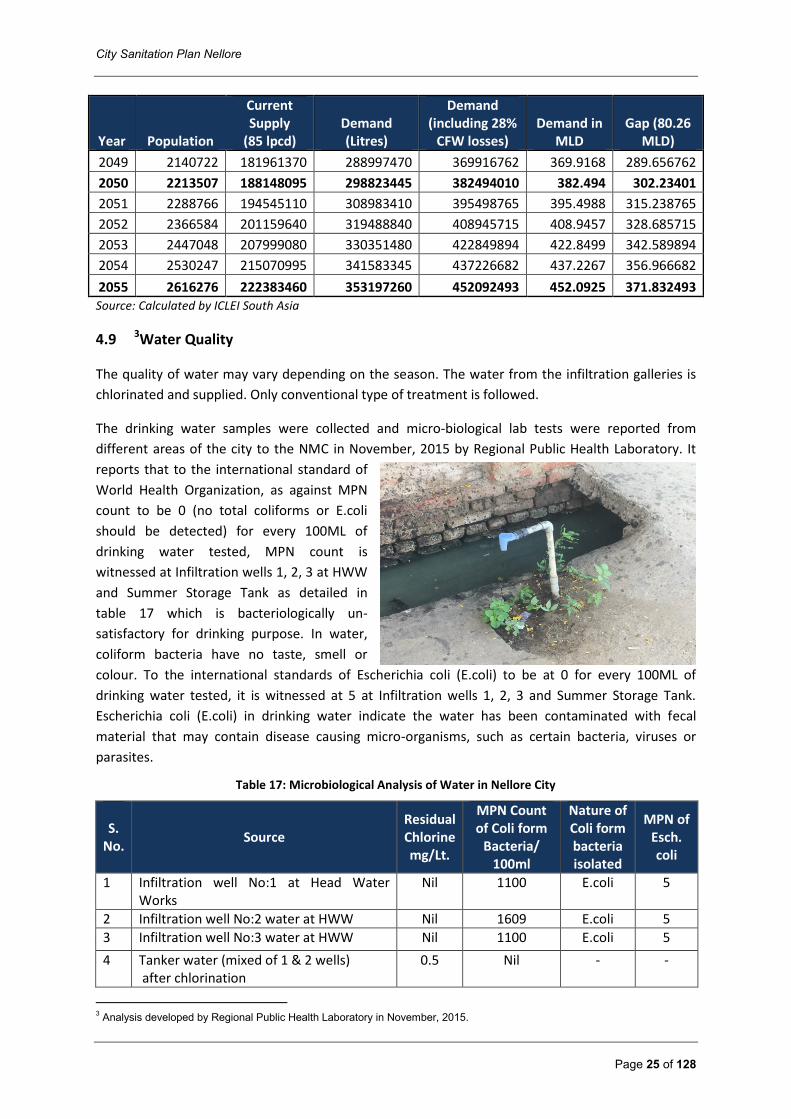
2055 2616276 222383460 353197260 452092493 452.0925 371.832493 Source: Calculated by ICLEI South Asia
4.9 3Water Quality
The quality of water may vary depending on the season. The water from the infiltration galleries is
chlorinated and supplied. Only conventional type of treatment is followed.
The drinking water samples were collected and micro-biological lab tests were reported from
different areas of the city to the NMC in November, 2015 by Regional Public Health Laboratory. It
reports that to the international standard of
World Health Organization, as against MPN
count to be 0 (no total coliforms or E.coli
should be detected) for every 100ML of
drinking water tested, MPN count is
witnessed at Infiltration wells 1, 2, 3 at HWW
and Summer Storage Tank as detailed in
table 17 which is bacteriologically un-
satisfactory for drinking purpose. In water,
coliform bacteria have no taste, smell or
colour. To the international standards of Escherichia coli (E.coli) to be at 0 for every 100ML of
drinking water tested, it is witnessed at 5 at Infiltration wells 1, 2, 3 and Summer Storage Tank.
Escherichia coli (E.coli) in drinking water indicate the water has been contaminated with fecal
material that may contain disease causing micro-organisms, such as certain bacteria, viruses or
parasites.
Table 17: Microbiological Analysis of Water in Nellore City
S.
No.
Source Residual Chlorine mg/Lt.
MPN Count of Coli form
Bacteria/ 100ml
Nature of Coli form bacteria isolated
MPN of Esch. coli
1 Infiltration well No:1 at Head Water Works
Nil 1100 E.coli 5
2 Infiltration well No:2 water at HWW Nil 1609 E.coli 5
3 Infiltration well No:3 water at HWW Nil 1100 E.coli 5
4 Tanker water (mixed of 1 & 2 wells) after chlorination
0.5 Nil - -
3 Analysis developed by Regional Public Health Laboratory in November, 2015.
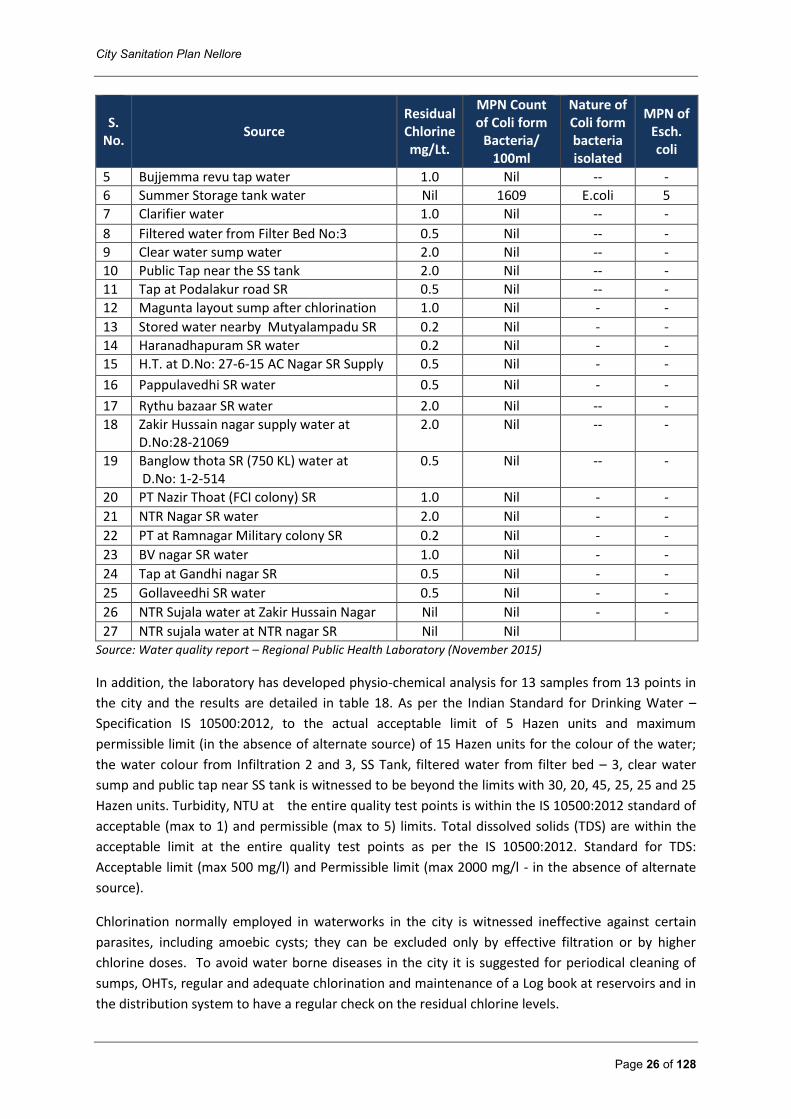
City Sanitation Plan Nellore
Page 26 of 128
S.
No.
Source Residual Chlorine mg/Lt.
MPN Count of Coli form
Bacteria/ 100ml
Nature of Coli form bacteria isolated
MPN of Esch. coli
5 Bujjemma revu tap water 1.0 Nil -- -
6 Summer Storage tank water Nil 1609 E.coli 5
7 Clarifier water 1.0 Nil -- -
8 Filtered water from Filter Bed No:3 0.5 Nil -- -
9 Clear water sump water 2.0 Nil -- -
10 Public Tap near the SS tank 2.0 Nil -- -
11 Tap at Podalakur road SR 0.5 Nil -- -
12 Magunta layout sump after chlorination 1.0 Nil - -
13 Stored water nearby Mutyalampadu SR 0.2 Nil - -
14 Haranadhapuram SR water 0.2 Nil - -
15 H.T. at D.No: 27-6-15 AC Nagar SR Supply 0.5 Nil - -
16 Pappulavedhi SR water 0.5 Nil - -
17 Rythu bazaar SR water 2.0 Nil -- -
18 Zakir Hussain nagar supply water at D.No:28-21069
2.0 Nil -- -
19 Banglow thota SR (750 KL) water at D.No: 1-2-514
0.5 Nil -- -
20 PT Nazir Thoat (FCI colony) SR 1.0 Nil - -
21 NTR Nagar SR water 2.0 Nil - -
22 PT at Ramnagar Military colony SR 0.2 Nil - -
23 BV nagar SR water 1.0 Nil - -
24 Tap at Gandhi nagar SR 0.5 Nil - -
25 Gollaveedhi SR water 0.5 Nil - -
26 NTR Sujala water at Zakir Hussain Nagar Nil Nil - -
27 NTR sujala water at NTR nagar SR Nil Nil Source: Water quality report – Regional Public Health Laboratory (November 2015)
In addition, the laboratory has developed physio-chemical analysis for 13 samples from 13 points in
the city and the results are detailed in table 18. As per the Indian Standard for Drinking Water –
Specification IS 10500:2012, to the actual acceptable limit of 5 Hazen units and maximum
permissible limit (in the absence of alternate source) of 15 Hazen units for the colour of the water;
the water colour from Infiltration 2 and 3, SS Tank, filtered water from filter bed – 3, clear water
sump and public tap near SS tank is witnessed to be beyond the limits with 30, 20, 45, 25, 25 and 25
Hazen units. Turbidity, NTU at the entire quality test points is within the IS 10500:2012 standard of
acceptable (max to 1) and permissible (max to 5) limits. Total dissolved solids (TDS) are within the
acceptable limit at the entire quality test points as per the IS 10500:2012. Standard for TDS:
Acceptable limit (max 500 mg/l) and Permissible limit (max 2000 mg/l - in the absence of alternate
source).
Chlorination normally employed in waterworks in the city is witnessed ineffective against certain
parasites, including amoebic cysts; they can be excluded only by effective filtration or by higher
chlorine doses. To avoid water borne diseases in the city it is suggested for periodical cleaning of
sumps, OHTs, regular and adequate chlorination and maintenance of a Log book at reservoirs and in
the distribution system to have a regular check on the residual chlorine levels.
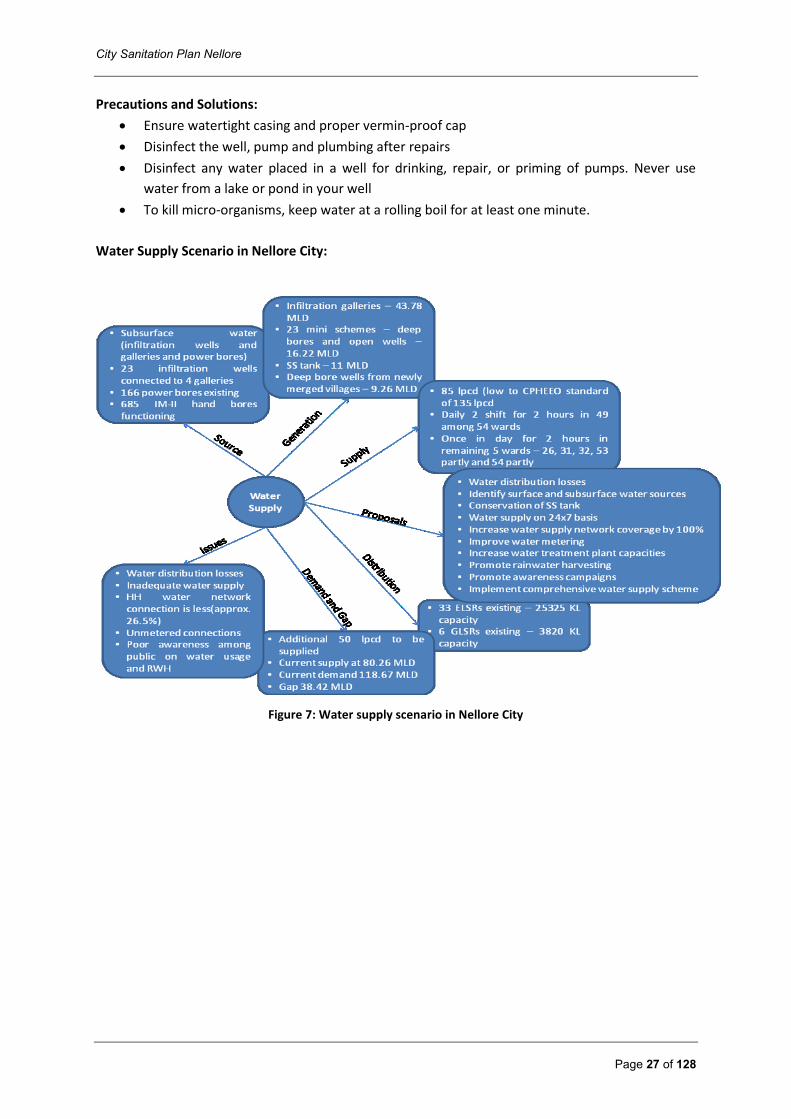
City Sanitation Plan Nellore
Page 27 of 128
Precautions and Solutions:
Ensure watertight casing and proper vermin-proof cap
Disinfect the well, pump and plumbing after repairs
Disinfect any water placed in a well for drinking, repair, or priming of pumps. Never use
water from a lake or pond in your well
To kill micro-organisms, keep water at a rolling boil for at least one minute.
Water Supply Scenario in Nellore City:
Figure 7: Water supply scenario in Nellore City
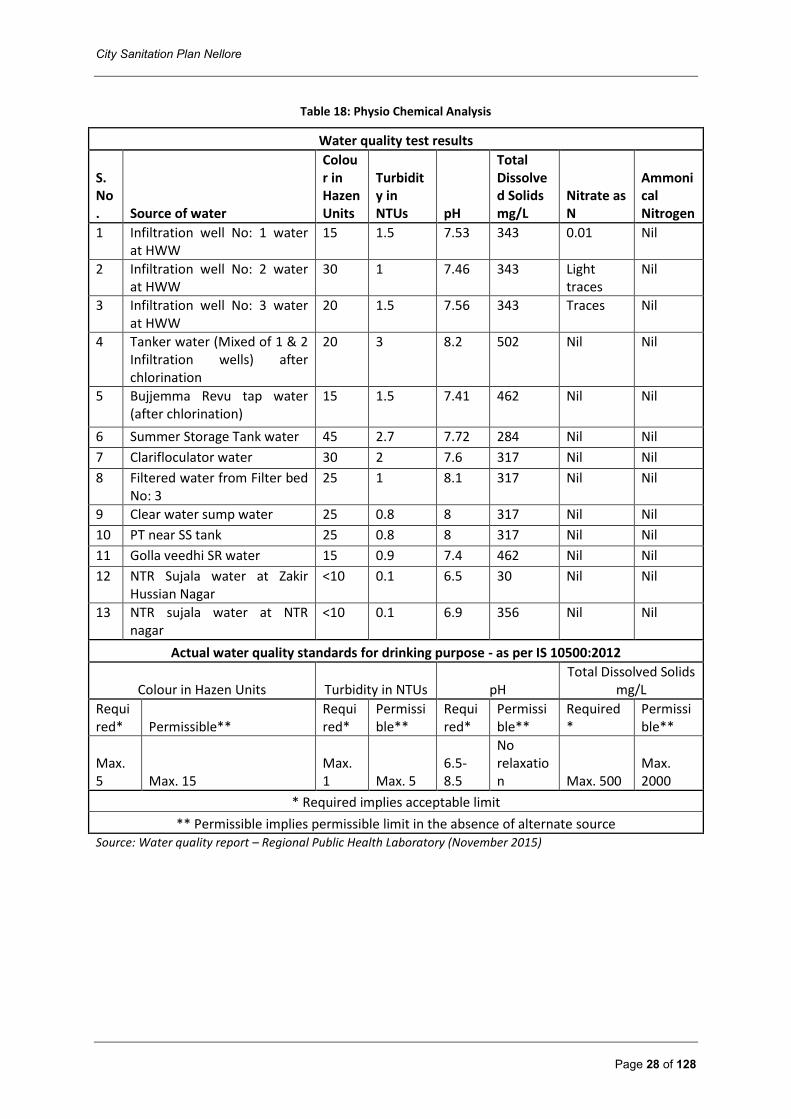
City Sanitation Plan Nellore
Page 28 of 128
Table 18: Physio Chemical Analysis
Water quality test results
S. No. Source of water
Colour in Hazen Units
Turbidity in NTUs pH
Total Dissolved Solids mg/L
Nitrate as N
Ammonical Nitrogen
1 Infiltration well No: 1 water at HWW
15 1.5 7.53 343 0.01 Nil
2 Infiltration well No: 2 water at HWW
30 1 7.46 343 Light traces
Nil
3 Infiltration well No: 3 water at HWW
20 1.5 7.56 343 Traces Nil
4 Tanker water (Mixed of 1 & 2 Infiltration wells) after chlorination
20 3 8.2 502 Nil Nil
5 Bujjemma Revu tap water (after chlorination)
15 1.5 7.41 462 Nil Nil
6 Summer Storage Tank water 45 2.7 7.72 284 Nil Nil
7 Clarifloculator water 30 2 7.6 317 Nil Nil
8 Filtered water from Filter bed No: 3
25 1 8.1 317 Nil Nil
9 Clear water sump water 25 0.8 8 317 Nil Nil
10 PT near SS tank 25 0.8 8 317 Nil Nil
11 Golla veedhi SR water 15 0.9 7.4 462 Nil Nil
12 NTR Sujala water at Zakir Hussian Nagar
<10 0.1 6.5 30 Nil Nil
13 NTR sujala water at NTR nagar
<10 0.1 6.9 356 Nil Nil
Actual water quality standards for drinking purpose - as per IS 10500:2012
Colour in Hazen Units Turbidity in NTUs pH Total Dissolved Solids
mg/L
Required* Permissible**
Required*
Permissible**
Required*
Permissible**
Required*
Permissible**
Max. 5 Max. 15
Max. 1 Max. 5
6.5-8.5
No relaxation Max. 500
Max. 2000
* Required implies acceptable limit
** Permissible implies permissible limit in the absence of alternate source Source: Water quality report – Regional Public Health Laboratory (November 2015)
City Sanitation Plan Nellore
Page 29 of 128
4.10 Identified Issues for Water Supply Sector:
While conducting field studies in Nellore in September, 2015, following issues were identified in
discussion with the public and the officials from the corporation and public health towards water
supply in the Nellore City.
The current water supply is very less as against present demand with a gap at 38.42 MLD.
Inadequate supply i.e. water is supplied in two shifts for 2 hours each to almost 49 wards among
54 wards, and is supplied once in a day to the remaining 5 wards namely 26, 31, 32, 53 partly
and 54 partly.
Household water network coverage is less (approx. 26.5%).
Unmetered connections (just 0.3% is the current metering system covered in the city).
Quality of water is un-satisfactory for the purpose of drinking. Physio-chemical and
Bacteriological parameters are being checked once in every 6 months and the NMC shall
monitor periodically and consider water quality improvement activities based on the same.
Energy audit is not conducted for water supply sector.
Many hand bores and power bores are defunct due to very low or no ground water table.
Water distribution system in the newly added Gram Panchayats has to be properly channelized.
Poor awareness among the public on water usage, conservation and harvesting.
Lack of awareness on practicing Rain Water Harvesting (RWH) systems in the city.
4.11 4Proposed/Sanctioned Water Supply Schemes:
The Government of Andhra Pradesh has recently accorded Administrative Sanction vide
G.O.Ms.No. 272, MA&UD Department, dated 18-12-2015, for the implementation of Nellore
Comprehensive Water Supply Scheme with Sangam Anicut on River Penna as source with
HUDCO assistance including construction of Intake Well at Sangam Anicut, Raw Water and Clear
Water Transmission Main, construction of 122MLD WTP including Electro Mechanical and allied
works, providing transmission mains, construction of various ELSRs in the Nellore city, and
distribution network, etc.
For the implementation of the above mentioned Comprehensive Water Supply Scheme the project
cost is estimated to be Rs. 556.77 Crores and the sources of funding for the same is provided in the
table 19.
4 The proposed interventions are obtained from Public Health and Engineering Department, NMC and are accordingly
compared to the future population projected by ICLEI South Asia.
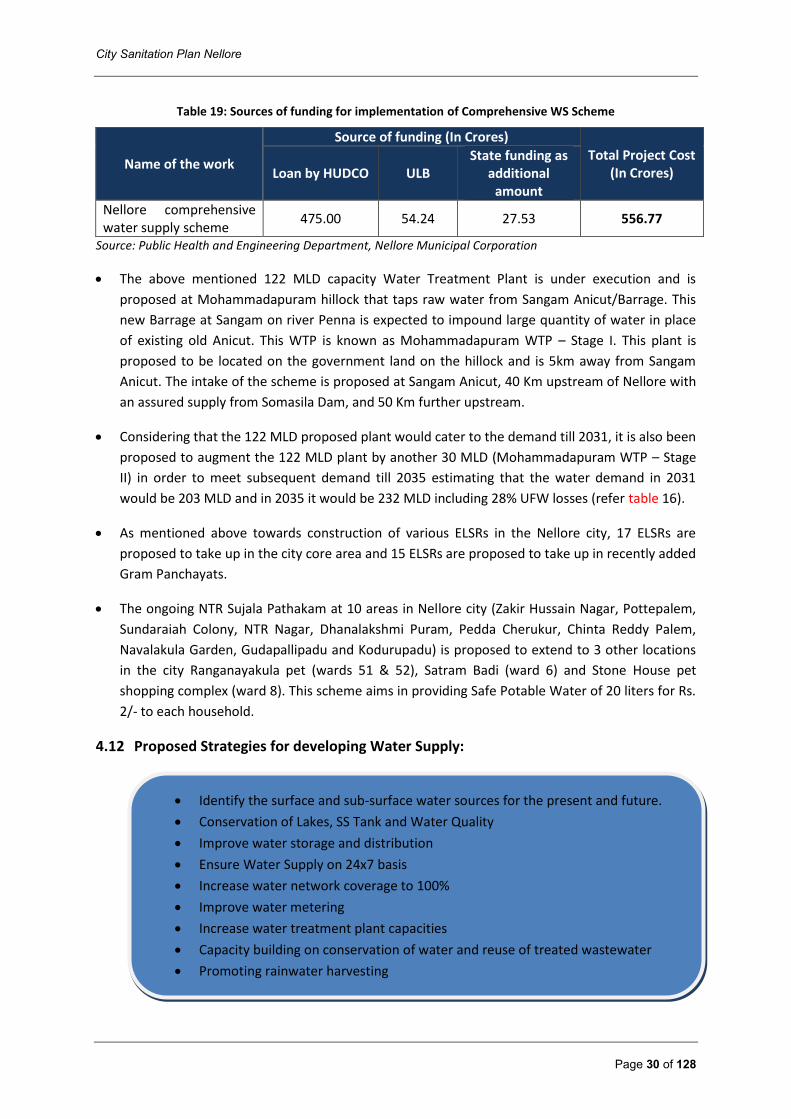
City Sanitation Plan Nellore
Page 30 of 128
Table 19: Sources of funding for implementation of Comprehensive WS Scheme
Name of the work
Source of funding (In Crores) Total Project Cost
(In Crores) Loan by HUDCO ULB State funding as
additional amount
Nellore comprehensive water supply scheme
475.00 54.24 27.53 556.77
Source: Public Health and Engineering Department, Nellore Municipal Corporation
The above mentioned 122 MLD capacity Water Treatment Plant is under execution and is
proposed at Mohammadapuram hillock that taps raw water from Sangam Anicut/Barrage. This
new Barrage at Sangam on river Penna is expected to impound large quantity of water in place
of existing old Anicut. This WTP is known as Mohammadapuram WTP – Stage I. This plant is
proposed to be located on the government land on the hillock and is 5km away from Sangam
Anicut. The intake of the scheme is proposed at Sangam Anicut, 40 Km upstream of Nellore with
an assured supply from Somasila Dam, and 50 Km further upstream.
Considering that the 122 MLD proposed plant would cater to the demand till 2031, it is also been
proposed to augment the 122 MLD plant by another 30 MLD (Mohammadapuram WTP – Stage
II) in order to meet subsequent demand till 2035 estimating that the water demand in 2031
would be 203 MLD and in 2035 it would be 232 MLD including 28% UFW losses (refer table 16).
As mentioned above towards construction of various ELSRs in the Nellore city, 17 ELSRs are
proposed to take up in the city core area and 15 ELSRs are proposed to take up in recently added
Gram Panchayats.
The ongoing NTR Sujala Pathakam at 10 areas in Nellore city (Zakir Hussain Nagar, Pottepalem,
Sundaraiah Colony, NTR Nagar, Dhanalakshmi Puram, Pedda Cherukur, Chinta Reddy Palem,
Navalakula Garden, Gudapallipadu and Kodurupadu) is proposed to extend to 3 other locations
in the city Ranganayakula pet (wards 51 & 52), Satram Badi (ward 6) and Stone House pet
shopping complex (ward 8). This scheme aims in providing Safe Potable Water of 20 liters for Rs.
2/- to each household.
4.12 Proposed Strategies for developing Water Supply:
Identify the surface and sub-surface water sources for the present and future.
Conservation of Lakes, SS Tank and Water Quality
Improve water storage and distribution
Ensure Water Supply on 24x7 basis
Increase water network coverage to 100%
Improve water metering
Increase water treatment plant capacities
Capacity building on conservation of water and reuse of treated wastewater
Promoting rainwater harvesting
City Sanitation Plan Nellore
Page 31 of 128
Proposed strategies for developing Water Supply sector in Nellore City is detailed under Goal 1 in
Section 8.1: Implementation Plan.
Capacities and locations of the proposed ELSRs are detailed in the table 20.
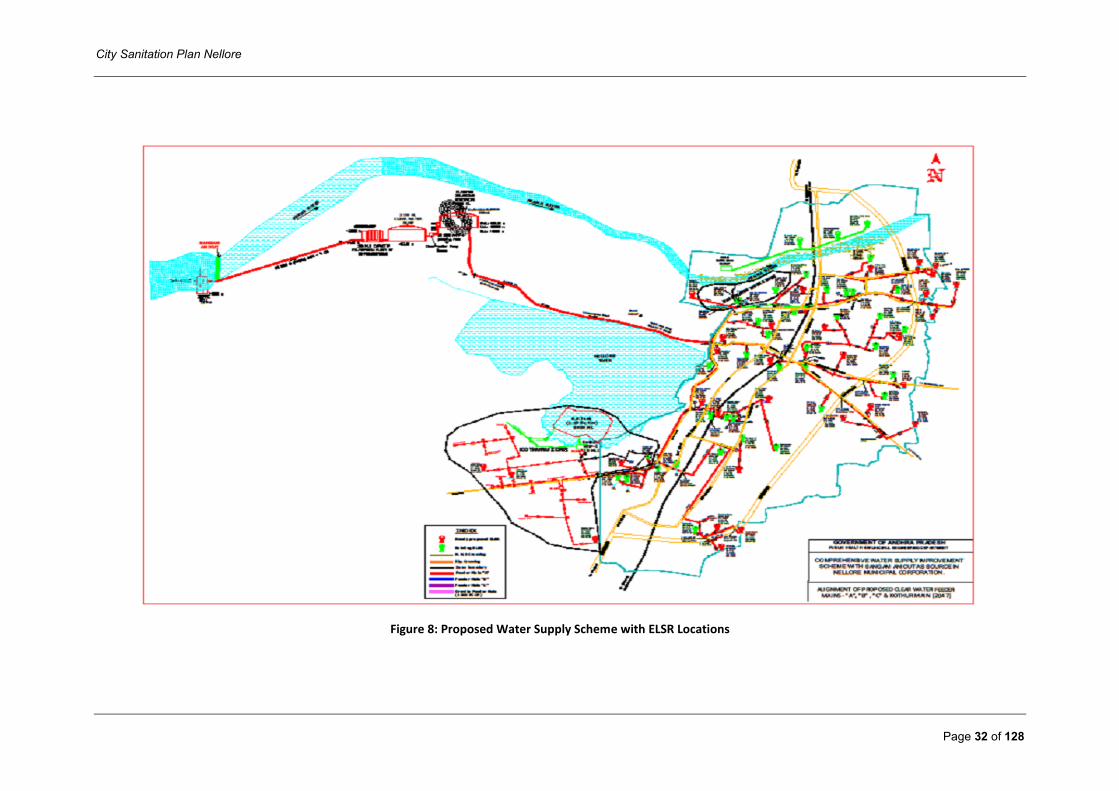
City Sanitation Plan Nellore
Page 32 of 128
Figure 8: Proposed Water Supply Scheme with ELSR Locations

City Sanitation Plan Nellore
Page 33 of 128
Table 20: Capacities and Locations of the proposed 32 ELSRs in Nellore City
No. of ELSRs proposed in Core area – 17
S. No Location Capacity (In KL)
1 Sri Ram Nagar 1200
2 NTR Nagar 1100
3 AC Nagar 700
4 Devi Paradse 600
5 Korivivari Kandiriga 500
6 Gomathi Nagar 700
7 CCS Nagar 1000
8 ESRM High School 800
9 Mahaboob Kahn Park 1200
10 Isukadonka 700
11 DPR Layout 700
12 Sujathamma Colony (Old area 32nd division) 1000
13 Mulapet Park 500
14 Sundharaiah Colony (Old area 24th division) 600
15 Vengal Rao Nagar 1000
16 SCCOMCH School 800
17 Janardhan Reddy Colony (Old area 1st division) 1000
No. of ELSRs proposed in added areas
S. No Location Capacity (In KL)
1 Navalakula Thota 700
2 Kodurupadu 250
3 Narayana Reddy Pet 350
4 Allipuram 250
5 Peddha Cherukuru 200
6 Gudipallipadu 150
7 Chinta Reddy Palem 350
8 Vaviletipadu 250
9 Gundla Palem 250
10 Kanuparthi Padu 600
11 Kalluru Palle Housing Board Colony 300
12 Buja Buja Nellore 600
13 Kothuru 1200
14 Ambapuram 200
15 Pottepalem 600 Source: Public Health and Engineering Department, Nellore Municipal Corporation
City Sanitation Plan Nellore
Page 34 of 128
In Slums
31948 HHs (78%) have own
individual toilets
2422 HHs (6%) depend on public
and community toilets
6609 HHs (16%) practice open
defecation.
5 SANITATION & SEWERAGE MANAGEMENT
5.1 Sanitation
The Swachhta Status report finds huge increase in the construction of individual toilets in the country at 39.96% in 2014-15 to 58.14% in 2016-2017 with construction of around 1,15,75,997 individual toilets in the financial year 2016-2017 as on Dec, 2016. Nellore city has also seen huge increase in facilitating individual toilets in the city during the last two financial years from 15.33% in financial year 2014-2015 to 35.66% in 2016-2017. Andhra Pradesh is driving to attain Open Defecation Free state status under the Swachh Bharat Mission by 2019, as like Himachal Pradesh, Sikkim and Kerala states which were recently declared as Open Defecation Free states in India by Ministry of Drinking Water and Sanitation, GoI. The Open Defecation Free cities scale has been increased from 2.03% to 10.76% in Andhra Pradesh state as per the Swachhta Status report as on Dec, 2016 that indicates access to toilets has improved both in rural and urban India, particularly in slums.
For the cities adequate availability of water for toilets is also a concern. In rural India, 42.5% of households were found to have access to water for use in the toilet compared to 88% in urban India, as per Swachhta status report. Therefore, provision of 24/7 water supply in cites including slums along with citizen’s behavioural change is believed to lead in Open Defecation Free cities. Behaviour change is a key priority of the Swachh Bharat Abhiyan as sanitation is a behavioural issue, central government says. “It involves a change of mindset amongst people to stop open defecation and to adopt safe sanitation practices.”
The safe disposal of human waste not only involves building toilets but also demands proper conveyance (sewerage system) and treatment of the waste (sewage). In the following section the existing sanitary practices at Nellore is assessed including access to private toilet facilities, availability of public toilets, open defecation and community toilets in slums and schools.
5.1.1 Individual Toilet Connections
Out of 138 slums in Nellore, 66 are notified and 72 are non-notified. Out of the entire 138 slums, 124
are situated in the core area of the city and remaining 14
are located in the fringe areas of the city. 57 slums
among 124 slums in the core area of the city and 10
slums among 14 spread in the fringe areas are notified
while the remaining are non-notified slums. As per 2011
census, the total number of households in slums was
38962 and was increased to 40980 after merging the 15
Gram Panchayats in the corporation limits. As per the
survey conducted under Rajiv Awas Yojana (RAY)
program in 2011 for 38962 HHs (without newly merged
Gram Panchayats), it was found that
78% of the HHs (30375 HHs) have their own individual toilets connected to septic tanks and dry latrines,
6% (2303 HHs) depend on public and community toilets, while
16% (6284HHs) practice open defecation.
Applied the above ratio, the status of individual toilet connections in Nellore city for 40980 HHs is
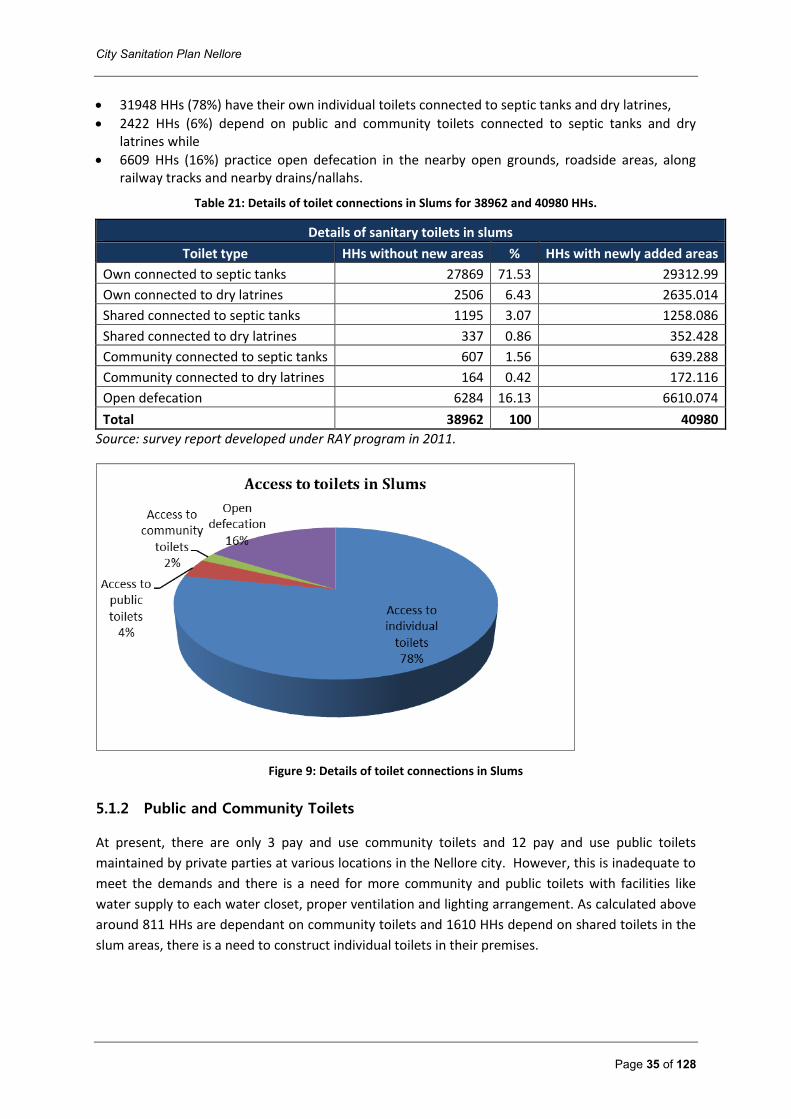
City Sanitation Plan Nellore
Page 35 of 128
31948 HHs (78%) have their own individual toilets connected to septic tanks and dry latrines,
2422 HHs (6%) depend on public and community toilets connected to septic tanks and dry latrines while
6609 HHs (16%) practice open defecation in the nearby open grounds, roadside areas, along railway tracks and nearby drains/nallahs.
Table 21: Details of toilet connections in Slums for 38962 and 40980 HHs.
Details of sanitary toilets in slums
Toilet type HHs without new areas % HHs with newly added areas
Own connected to septic tanks 27869 71.53 29312.99
Own connected to dry latrines 2506 6.43 2635.014
Shared connected to septic tanks 1195 3.07 1258.086
Shared connected to dry latrines 337 0.86 352.428
Community connected to septic tanks 607 1.56 639.288
Community connected to dry latrines 164 0.42 172.116
Open defecation 6284 16.13 6610.074
Total 38962 100 40980
Source: survey report developed under RAY program in 2011.
Figure 9: Details of toilet connections in Slums
5.1.2 Public and Community Toilets
At present, there are only 3 pay and use community toilets and 12 pay and use public toilets
maintained by private parties at various locations in the Nellore city. However, this is inadequate to
meet the demands and there is a need for more community and public toilets with facilities like
water supply to each water closet, proper ventilation and lighting arrangement. As calculated above
around 811 HHs are dependant on community toilets and 1610 HHs depend on shared toilets in the
slum areas, there is a need to construct individual toilets in their premises.
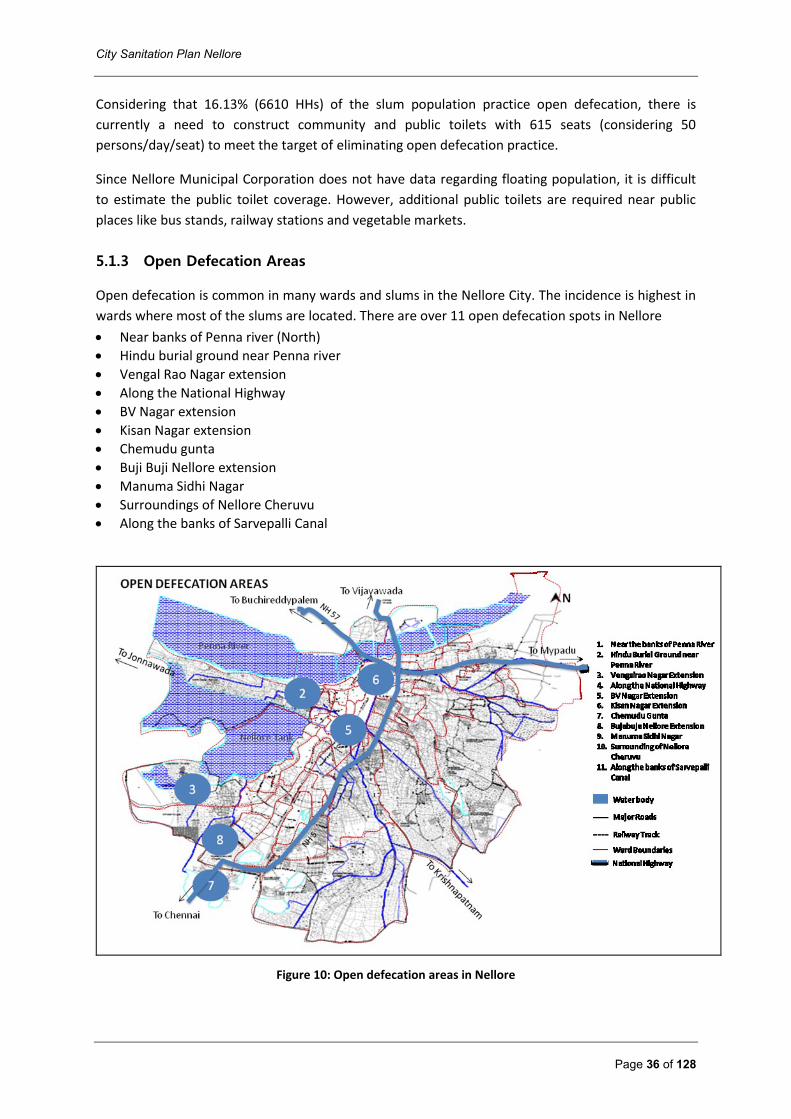
City Sanitation Plan Nellore
Page 36 of 128
Considering that 16.13% (6610 HHs) of the slum population practice open defecation, there is
currently a need to construct community and public toilets with 615 seats (considering 50
persons/day/seat) to meet the target of eliminating open defecation practice.
Since Nellore Municipal Corporation does not have data regarding floating population, it is difficult
to estimate the public toilet coverage. However, additional public toilets are required near public
places like bus stands, railway stations and vegetable markets.
5.1.3 Open Defecation Areas
Open defecation is common in many wards and slums in the Nellore City. The incidence is highest in
wards where most of the slums are located. There are over 11 open defecation spots in Nellore
Near banks of Penna river (North)
Hindu burial ground near Penna river
Vengal Rao Nagar extension
Along the National Highway
BV Nagar extension
Kisan Nagar extension
Chemudu gunta
Buji Buji Nellore extension
Manuma Sidhi Nagar
Surroundings of Nellore Cheruvu
Along the banks of Sarvepalli Canal
Figure 10: Open defecation areas in Nellore
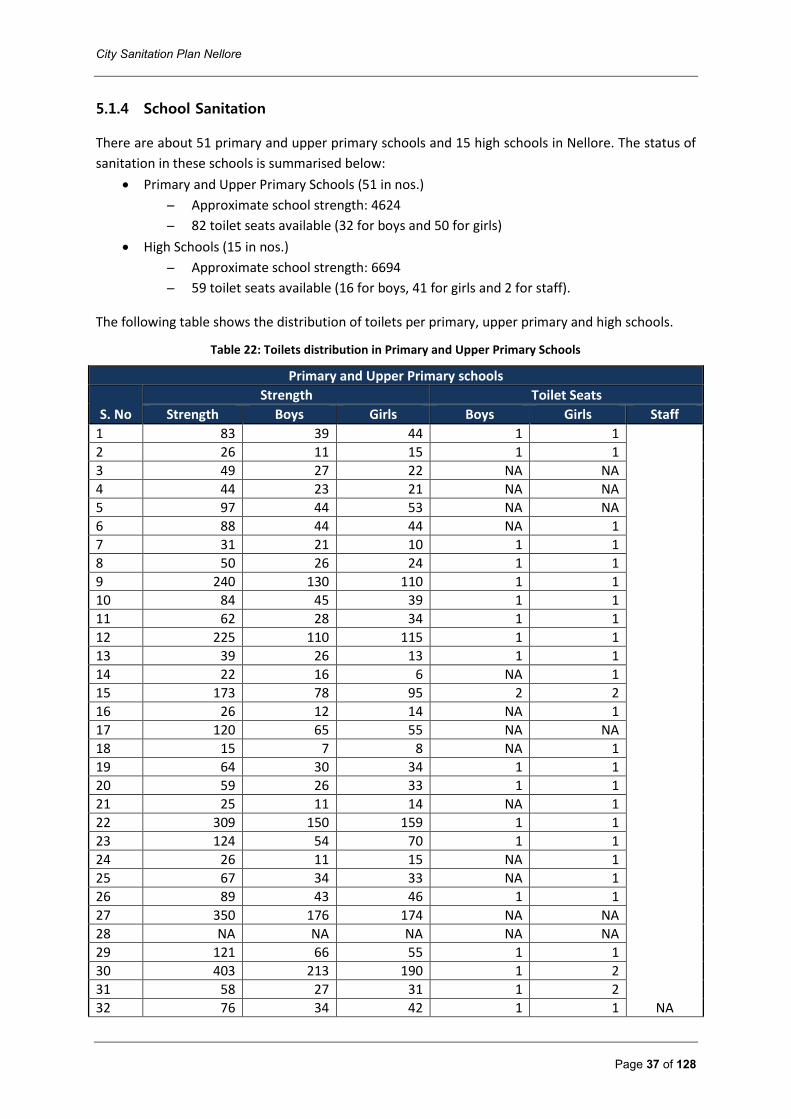
City Sanitation Plan Nellore
Page 37 of 128
5.1.4 School Sanitation
There are about 51 primary and upper primary schools and 15 high schools in Nellore. The status of
sanitation in these schools is summarised below:
Primary and Upper Primary Schools (51 in nos.)
Approximate school strength: 4624
82 toilet seats available (32 for boys and 50 for girls)
High Schools (15 in nos.)
Approximate school strength: 6694
59 toilet seats available (16 for boys, 41 for girls and 2 for staff).
The following table shows the distribution of toilets per primary, upper primary and high schools.
Table 22: Toilets distribution in Primary and Upper Primary Schools
Primary and Upper Primary schools
S. No
Strength Toilet Seats
Strength Boys Girls Boys Girls Staff
1 83 39 44 1 1
NA
2 26 11 15 1 1
3 49 27 22 NA NA
4 44 23 21 NA NA
5 97 44 53 NA NA
6 88 44 44 NA 1
7 31 21 10 1 1
8 50 26 24 1 1
9 240 130 110 1 1
10 84 45 39 1 1
11 62 28 34 1 1
12 225 110 115 1 1
13 39 26 13 1 1
14 22 16 6 NA 1
15 173 78 95 2 2
16 26 12 14 NA 1
17 120 65 55 NA NA
18 15 7 8 NA 1
19 64 30 34 1 1
20 59 26 33 1 1
21 25 11 14 NA 1
22 309 150 159 1 1
23 124 54 70 1 1
24 26 11 15 NA 1
25 67 34 33 NA 1
26 89 43 46 1 1
27 350 176 174 NA NA
28 NA NA NA NA NA
29 121 66 55 1 1
30 403 213 190 1 2
31 58 27 31 1 2
32 76 34 42 1 1
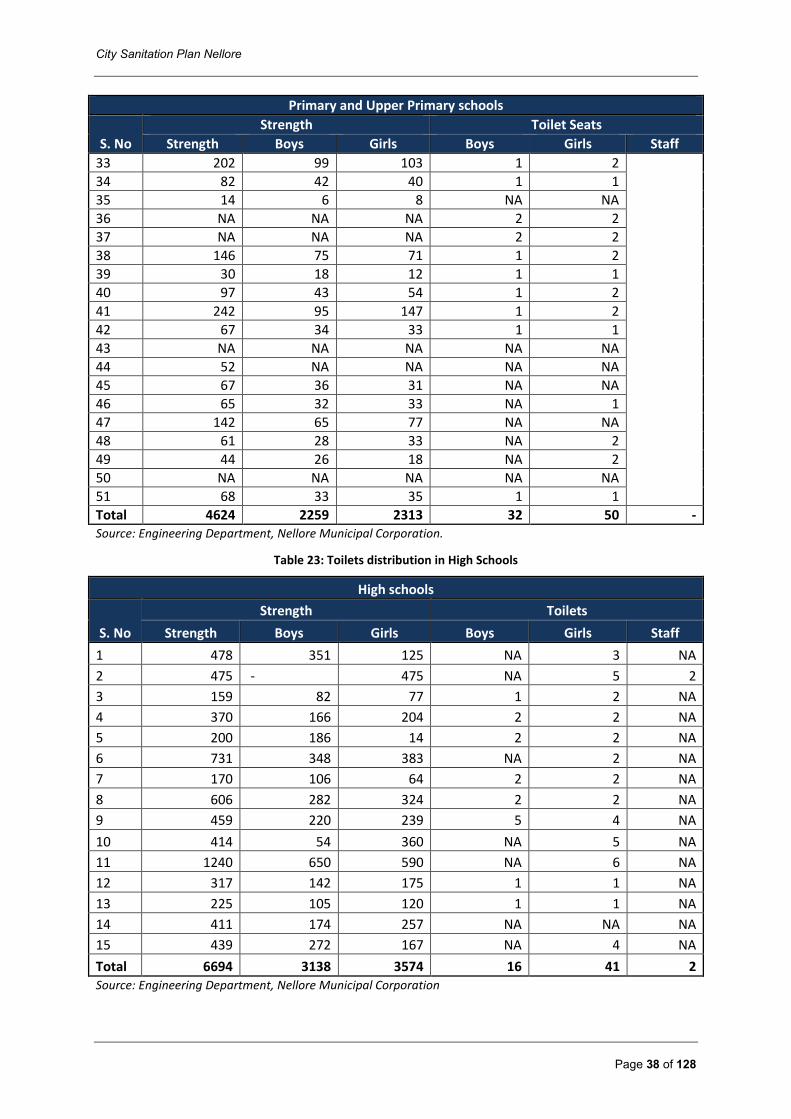
City Sanitation Plan Nellore
Page 38 of 128
Primary and Upper Primary schools
S. No
Strength Toilet Seats
Strength Boys Girls Boys Girls Staff
33 202 99 103 1 2
34 82 42 40 1 1
35 14 6 8 NA NA
36 NA NA NA 2 2
37 NA NA NA 2 2
38 146 75 71 1 2
39 30 18 12 1 1
40 97 43 54 1 2
41 242 95 147 1 2
42 67 34 33 1 1
43 NA NA NA NA NA
44 52 NA NA NA NA
45 67 36 31 NA NA
46 65 32 33 NA 1
47 142 65 77 NA NA
48 61 28 33 NA 2
49 44 26 18 NA 2
50 NA NA NA NA NA
51 68 33 35 1 1
Total 4624 2259 2313 32 50 - Source: Engineering Department, Nellore Municipal Corporation.
Table 23: Toilets distribution in High Schools
High schools
S. No
Strength Toilets
Strength Boys Girls Boys Girls Staff
1 478 351 125 NA 3 NA
2 475 - 475 NA 5 2
3 159 82 77 1 2 NA
4 370 166 204 2 2 NA
5 200 186 14 2 2 NA
6 731 348 383 NA 2 NA
7 170 106 64 2 2 NA
8 606 282 324 2 2 NA
9 459 220 239 5 4 NA
10 414 54 360 NA 5 NA
11 1240 650 590 NA 6 NA
12 317 142 175 1 1 NA
13 225 105 120 1 1 NA
14 411 174 257 NA NA NA
15 439 272 167 NA 4 NA
Total 6694 3138 3574 16 41 2 Source: Engineering Department, Nellore Municipal Corporation
City Sanitation Plan Nellore
Page 39 of 128
In Schools
Immediate need to construct 59
toilet seats and 54 urinals for
boys and 105 toilets seats for girls
in primary, upper primary schools
and high schools in addition to
the available facilities..
It is evident from the above tables that in the primary, upper primary and high schools the sanitation
facilities are very low and hence seeks immediate attention to increase the number of toilet seats
and urinals for maintaining hygiene and health of students.
5.1.5 Demand Assessment: Future Scenario
5.1.5.1 Slum Sanitation
The Nellore Municipal Corporation under Swachh Andhra Mission has initiated to construct around
9269 individual toilets in slums that are currently under execution. With the implementation of this
project it is believed that the residential sectors in the slum areas will have 100% access to toilet
facilities. However, to avoid open defecation and urination, public toilets and urinals in transit areas
such as bus stands and commercial areas need to be constructed.
5.1.5.2 School Sanitation
In the 51 primary and upper primary schools in Nellore, for
school strength of 4572 students among which boys are 2259
and girls are 2313 there are currently 32 toilet seats for boys
and 50 toilet seats for girls. Therefore, considering that 1 toilet
seat is required for 50 boys, 1 urinal is required for 100 boys
and 1 toilet seat is required for 30 girls, there is an immediate
need to construct 13 toilet seats and 23 urinals for boys and 27
toilet seats for girls in addition to the available facilities.
In the 15 high schools in Nellore, there is an immediate need to
construct another 46 toilet seats for boys, 31 urinals for boys and 78 toilet seats for girls in addition
to the available 16 toilets for boys and 41 toilets for girls.
5.2 Sewerage Management
5.2.1 Present Situation
The underground drainage system in the city was laid during 1972-1973 and was first inaugurated on
3rd June, 1975 by the then Chief Minister of Andhra Pradesh – Hon’ble J. Vengal Rao. The city is
presently covered with 1415 km length of drains, out of which 895 kms is pucca drain and 520 kms is
kutcha drain. Out of the entire 54 wards, only 11 wards (Ward No’s – 18, 19, 38, 39, 40, 41, 42, 46,
47, 48 and 49) serving a population of nearly 60,000 is covered with the underground drainage
system in the city.
Major canals passing through the city are Mypadu Canal that takes off from Jaffar Saheb canal and
flows east to the Bay of Bengal and Kotha Koduru Canal that branches off from Mypadu Canal and
flows east, terminating at Buckingham Canal which finally discharges into Bay of Bengal.
City Sanitation Plan Nellore
Page 40 of 128
5.2.2 Sewerage Network
Wastewater treatment and disposal is a major problem in most of the Indian cities. Discharging
untreated wastewater into low-lying areas and various water bodies has resulted in severe water
and land pollution problems. Presently, the city do not have a complete sewerage system while the
open drains constructed along the road side ends up carrying the storm water and the waste water
(black & grey) together.
Though 11 out of 54 wards in the city are provided with underground drainage facilities, these are
designed without any proper disposal and treatment facilities. Therefore, there is a need to design a
comprehensive sewerage system for the entire city. The length of the sewer lines in the city is 27.48
km comprising of pipes of diameters 3” to 36”.
The different available diameters of sewer lines can be characterized as following:
Trunk sewers
o The largest sewer viz. 914 mm leading to Harnathapuram sewage pumping station
along Krishnapatnam road flowing from west to east
o The 610 mm line connecting 914 mm line sloping from north to south along Mini
Bye-pass road
Branch sewers
o 229 mm diameter sewer is laid for about 9.5 km with large portion on the NSC Bose
road
o 203 mm dia is laid on GNT road and Justice Ansari road.
There are several other smaller lines of dia 152mm and 76mm in the city.
5.2.3 Sewage Treatment
Initially it was proposed to drain off entire sewage from the city to the 3 oxidation ponds at
Allipuram through 8m sump at Harinathapuram pumping station. But as the sewage treatment plant
did not take off, the entire untreated sewage is diverted to the Krishnapattanam Canal towards
South-East through the same Haranathapuram pumping station by a 60 HP Vertical Turbine Pump.
The entire untreated sewage is ultimately disposed into the Bay of Bengal near Krishnapattanam
port. The originally envisaged Allipuram site is at present partly covered with shrubs and partly
occupied illegally by cultivators.
Nellore Municipal Corporation has only one Vacuum Sewer Cleaner to clean the existing sewers.
5.2.4 Human Resources
There are no separate staffs recruited for sewerage and sanitation management. The staffs
responsible for solid waste management are also responsible for sewerage and sanitation in the city.
5.2.5 Sewerage Generation
Currently Nellore city generates 46.4 MLD of sewage taking into account that approximately 58 MLD
of water is supplied daily. Once 100% water supply i.e., 135 lpcd is provided to each and every
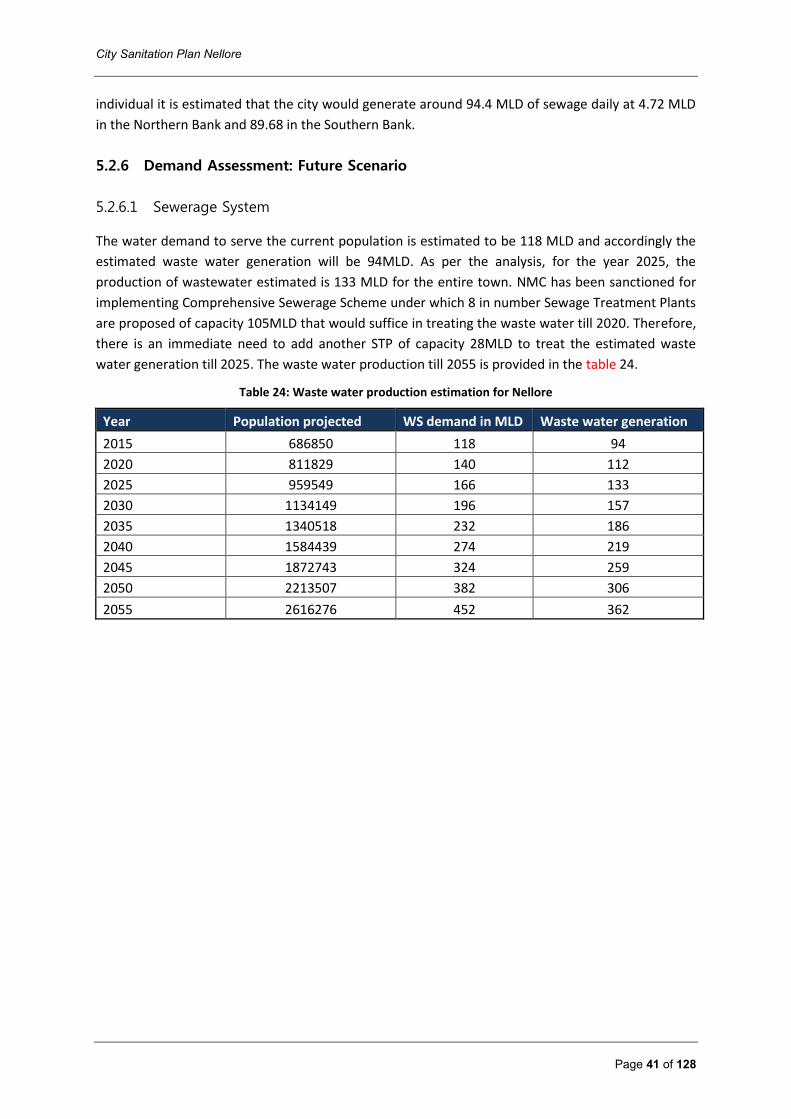
City Sanitation Plan Nellore
Page 41 of 128
individual it is estimated that the city would generate around 94.4 MLD of sewage daily at 4.72 MLD
in the Northern Bank and 89.68 in the Southern Bank.
5.2.6 Demand Assessment: Future Scenario
5.2.6.1 Sewerage System
The water demand to serve the current population is estimated to be 118 MLD and accordingly the
estimated waste water generation will be 94MLD. As per the analysis, for the year 2025, the
production of wastewater estimated is 133 MLD for the entire town. NMC has been sanctioned for
implementing Comprehensive Sewerage Scheme under which 8 in number Sewage Treatment Plants
are proposed of capacity 105MLD that would suffice in treating the waste water till 2020. Therefore,
there is an immediate need to add another STP of capacity 28MLD to treat the estimated waste
water generation till 2025. The waste water production till 2055 is provided in the table 24.
Table 24: Waste water production estimation for Nellore
Year Population projected WS demand in MLD Waste water generation
2015 686850 118 94
2020 811829 140 112
2025 959549 166 133
2030 1134149 196 157
2035 1340518 232 186
2040 1584439 274 219
2045 1872743 324 259
2050 2213507 382 306
2055 2616276 452 362
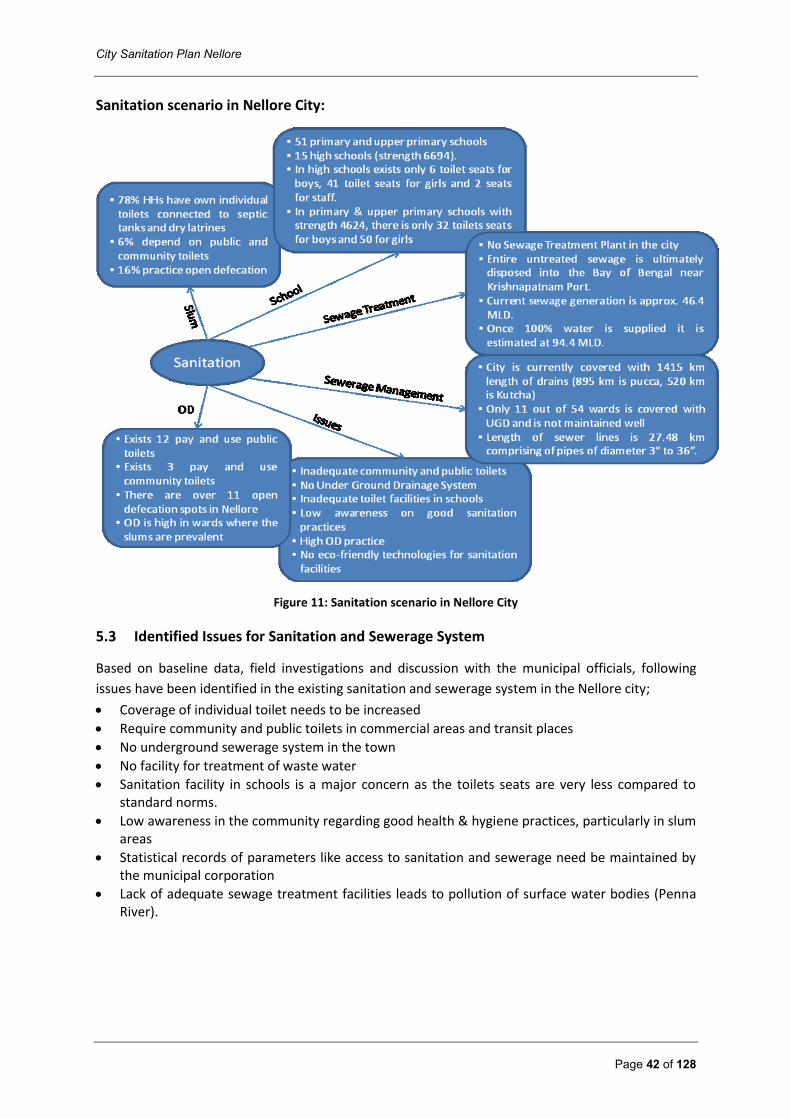
City Sanitation Plan Nellore
Page 42 of 128
Sanitation scenario in Nellore City:
Figure 11: Sanitation scenario in Nellore City
5.3 Identified Issues for Sanitation and Sewerage System
Based on baseline data, field investigations and discussion with the municipal officials, following
issues have been identified in the existing sanitation and sewerage system in the Nellore city;
Coverage of individual toilet needs to be increased
Require community and public toilets in commercial areas and transit places
No underground sewerage system in the town
No facility for treatment of waste water
Sanitation facility in schools is a major concern as the toilets seats are very less compared to standard norms.
Low awareness in the community regarding good health & hygiene practices, particularly in slum areas
Statistical records of parameters like access to sanitation and sewerage need be maintained by the municipal corporation
Lack of adequate sewage treatment facilities leads to pollution of surface water bodies (Penna River).
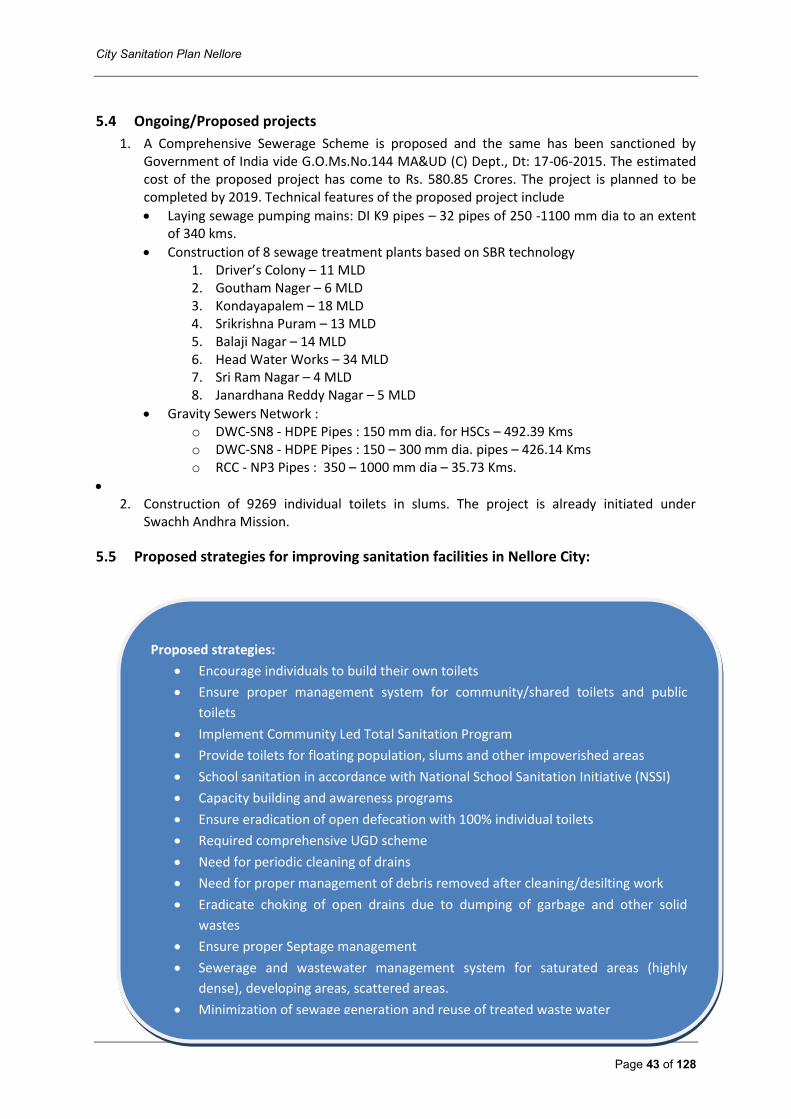
City Sanitation Plan Nellore
Page 43 of 128
5.4 Ongoing/Proposed projects
1. A Comprehensive Sewerage Scheme is proposed and the same has been sanctioned by Government of India vide G.O.Ms.No.144 MA&UD (C) Dept., Dt: 17-06-2015. The estimated cost of the proposed project has come to Rs. 580.85 Crores. The project is planned to be completed by 2019. Technical features of the proposed project include
Laying sewage pumping mains: DI K9 pipes – 32 pipes of 250 -1100 mm dia to an extent of 340 kms.
Construction of 8 sewage treatment plants based on SBR technology 1. Driver’s Colony – 11 MLD 2. Goutham Nager – 6 MLD 3. Kondayapalem – 18 MLD 4. Srikrishna Puram – 13 MLD 5. Balaji Nagar – 14 MLD 6. Head Water Works – 34 MLD 7. Sri Ram Nagar – 4 MLD 8. Janardhana Reddy Nagar – 5 MLD
Gravity Sewers Network : o DWC-SN8 - HDPE Pipes : 150 mm dia. for HSCs – 492.39 Kms o DWC-SN8 - HDPE Pipes : 150 – 300 mm dia. pipes – 426.14 Kms o RCC - NP3 Pipes : 350 – 1000 mm dia – 35.73 Kms.
2. Construction of 9269 individual toilets in slums. The project is already initiated under
Swachh Andhra Mission.
5.5 Proposed strategies for improving sanitation facilities in Nellore City:
Proposed strategies:
Encourage individuals to build their own toilets
Ensure proper management system for community/shared toilets and public
toilets
Implement Community Led Total Sanitation Program
Provide toilets for floating population, slums and other impoverished areas
School sanitation in accordance with National School Sanitation Initiative (NSSI)
Capacity building and awareness programs
Ensure eradication of open defecation with 100% individual toilets
Required comprehensive UGD scheme
Need for periodic cleaning of drains
Need for proper management of debris removed after cleaning/desilting work
Eradicate choking of open drains due to dumping of garbage and other solid
wastes
Ensure proper Septage management
Sewerage and wastewater management system for saturated areas (highly
dense), developing areas, scattered areas.
Minimization of sewage generation and reuse of treated waste water
City Sanitation Plan Nellore
Page 44 of 128
Proposed strategies for developing sanitation facilities in Nellore City is detailed under Goal 2 and 3
in Section 8.1: Implementation Plan.
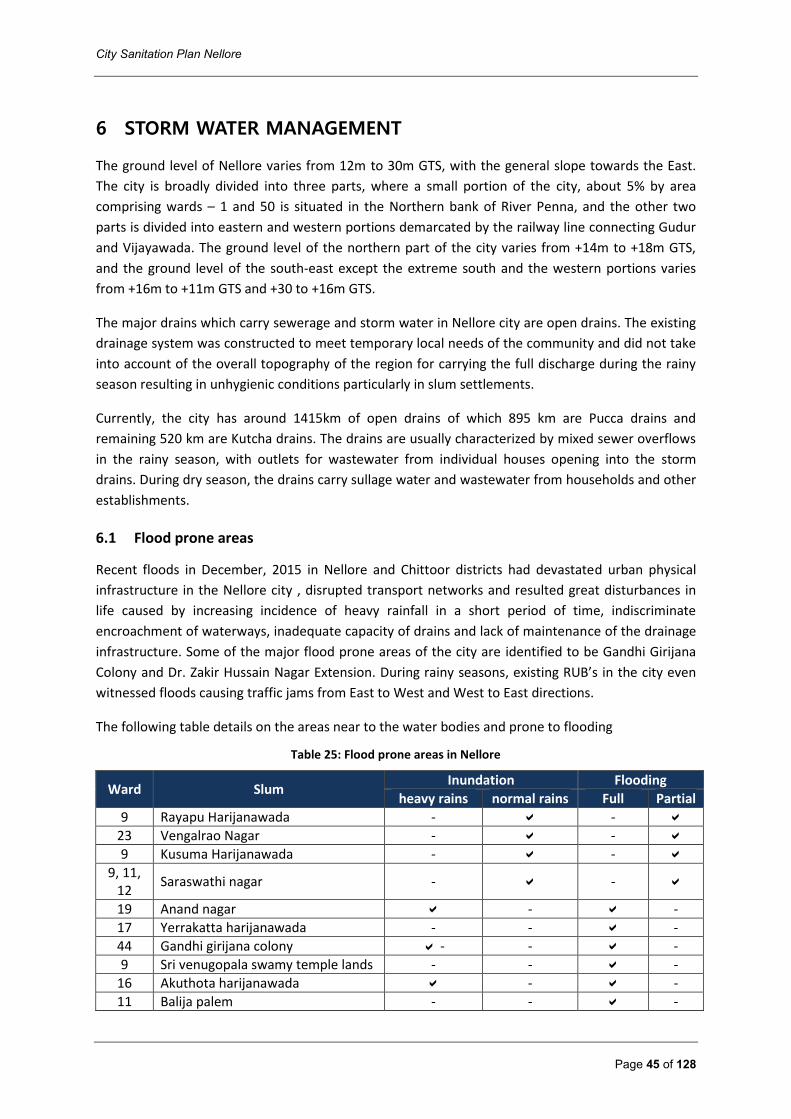
City Sanitation Plan Nellore
Page 45 of 128
6 STORM WATER MANAGEMENT
The ground level of Nellore varies from 12m to 30m GTS, with the general slope towards the East.
The city is broadly divided into three parts, where a small portion of the city, about 5% by area
comprising wards – 1 and 50 is situated in the Northern bank of River Penna, and the other two
parts is divided into eastern and western portions demarcated by the railway line connecting Gudur
and Vijayawada. The ground level of the northern part of the city varies from +14m to +18m GTS,
and the ground level of the south-east except the extreme south and the western portions varies
from +16m to +11m GTS and +30 to +16m GTS.
The major drains which carry sewerage and storm water in Nellore city are open drains. The existing
drainage system was constructed to meet temporary local needs of the community and did not take
into account of the overall topography of the region for carrying the full discharge during the rainy
season resulting in unhygienic conditions particularly in slum settlements.
Currently, the city has around 1415km of open drains of which 895 km are Pucca drains and
remaining 520 km are Kutcha drains. The drains are usually characterized by mixed sewer overflows
in the rainy season, with outlets for wastewater from individual houses opening into the storm
drains. During dry season, the drains carry sullage water and wastewater from households and other
establishments.
6.1 Flood prone areas
Recent floods in December, 2015 in Nellore and Chittoor districts had devastated urban physical
infrastructure in the Nellore city , disrupted transport networks and resulted great disturbances in
life caused by increasing incidence of heavy rainfall in a short period of time, indiscriminate
encroachment of waterways, inadequate capacity of drains and lack of maintenance of the drainage
infrastructure. Some of the major flood prone areas of the city are identified to be Gandhi Girijana
Colony and Dr. Zakir Hussain Nagar Extension. During rainy seasons, existing RUB’s in the city even
witnessed floods causing traffic jams from East to West and West to East directions.
The following table details on the areas near to the water bodies and prone to flooding
Table 25: Flood prone areas in Nellore
Ward Slum Inundation Flooding
heavy rains normal rains Full Partial
9 Rayapu Harijanawada - -
23 Vengalrao Nagar - -
9 Kusuma Harijanawada - -
9, 11, 12
Saraswathi nagar - -
19 Anand nagar - -
17 Yerrakatta harijanawada - - -
44 Gandhi girijana colony - - -
9 Sri venugopala swamy temple lands - - -
16 Akuthota harijanawada - -
11 Balija palem - - -
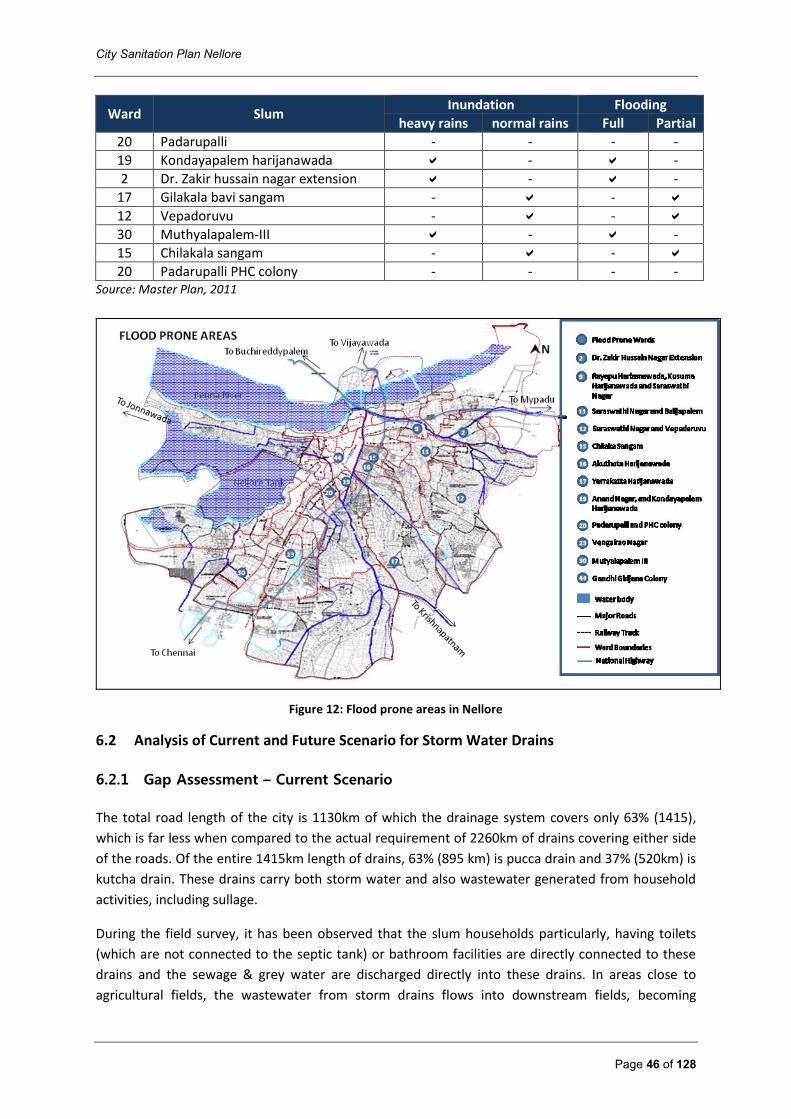
City Sanitation Plan Nellore
Page 46 of 128
Ward Slum Inundation Flooding
heavy rains normal rains Full Partial
20 Padarupalli - - - -
19 Kondayapalem harijanawada - -
2 Dr. Zakir hussain nagar extension - -
17 Gilakala bavi sangam - -
12 Vepadoruvu - -
30 Muthyalapalem-III - -
15 Chilakala sangam - -
20 Padarupalli PHC colony - - - - Source: Master Plan, 2011
Figure 12: Flood prone areas in Nellore
6.2 Analysis of Current and Future Scenario for Storm Water Drains
6.2.1 Gap Assessment – Current Scenario
The total road length of the city is 1130km of which the drainage system covers only 63% (1415),
which is far less when compared to the actual requirement of 2260km of drains covering either side
of the roads. Of the entire 1415km length of drains, 63% (895 km) is pucca drain and 37% (520km) is
kutcha drain. These drains carry both storm water and also wastewater generated from household
activities, including sullage.
During the field survey, it has been observed that the slum households particularly, having toilets
(which are not connected to the septic tank) or bathroom facilities are directly connected to these
drains and the sewage & grey water are discharged directly into these drains. In areas close to
agricultural fields, the wastewater from storm drains flows into downstream fields, becoming
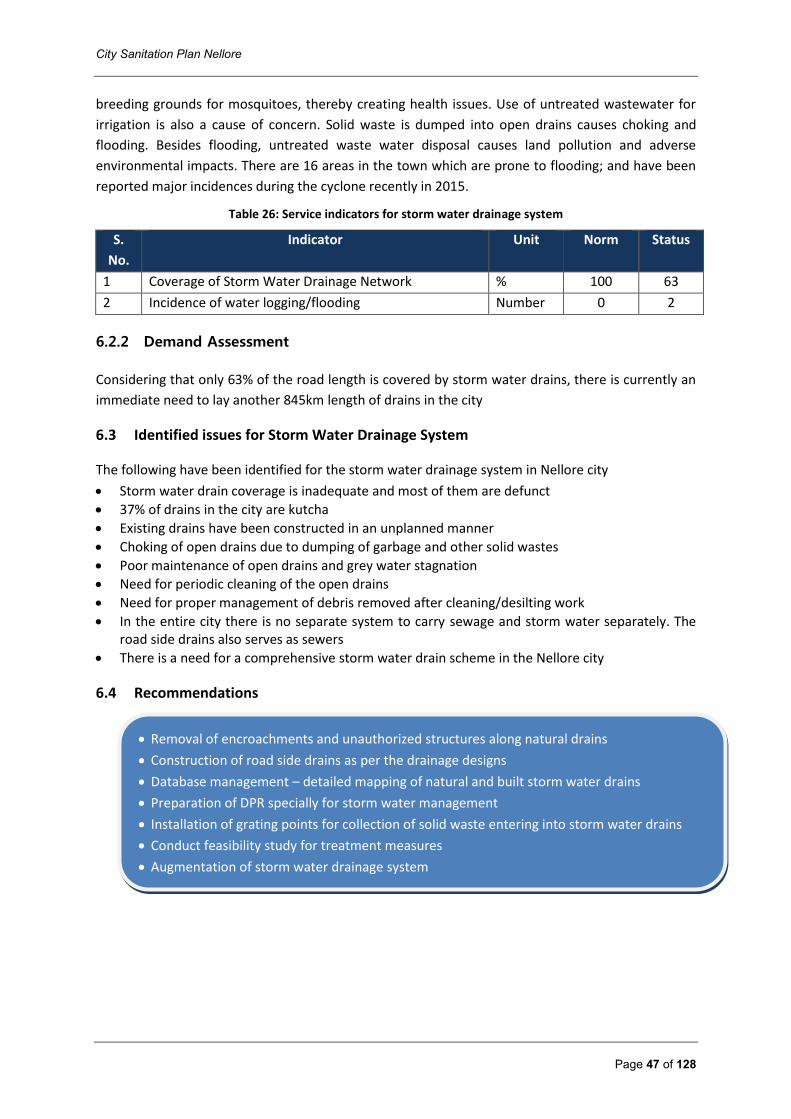
City Sanitation Plan Nellore
Page 47 of 128
breeding grounds for mosquitoes, thereby creating health issues. Use of untreated wastewater for
irrigation is also a cause of concern. Solid waste is dumped into open drains causes choking and
flooding. Besides flooding, untreated waste water disposal causes land pollution and adverse
environmental impacts. There are 16 areas in the town which are prone to flooding; and have been
reported major incidences during the cyclone recently in 2015.
Table 26: Service indicators for storm water drainage system
S.
No.
Indicator Unit Norm Status
1 Coverage of Storm Water Drainage Network % 100 63
2 Incidence of water logging/flooding Number 0 2
6.2.2 Demand Assessment
Considering that only 63% of the road length is covered by storm water drains, there is currently an
immediate need to lay another 845km length of drains in the city
6.3 Identified issues for Storm Water Drainage System
The following have been identified for the storm water drainage system in Nellore city
Storm water drain coverage is inadequate and most of them are defunct
37% of drains in the city are kutcha
Existing drains have been constructed in an unplanned manner
Choking of open drains due to dumping of garbage and other solid wastes
Poor maintenance of open drains and grey water stagnation
Need for periodic cleaning of the open drains
Need for proper management of debris removed after cleaning/desilting work
In the entire city there is no separate system to carry sewage and storm water separately. The road side drains also serves as sewers
There is a need for a comprehensive storm water drain scheme in the Nellore city
6.4 Recommendations
Removal of encroachments and unauthorized structures along natural drains
Construction of road side drains as per the drainage designs
Database management – detailed mapping of natural and built storm water drains
Preparation of DPR specially for storm water management
Installation of grating points for collection of solid waste entering into storm water drains
Conduct feasibility study for treatment measures
Augmentation of storm water drainage system
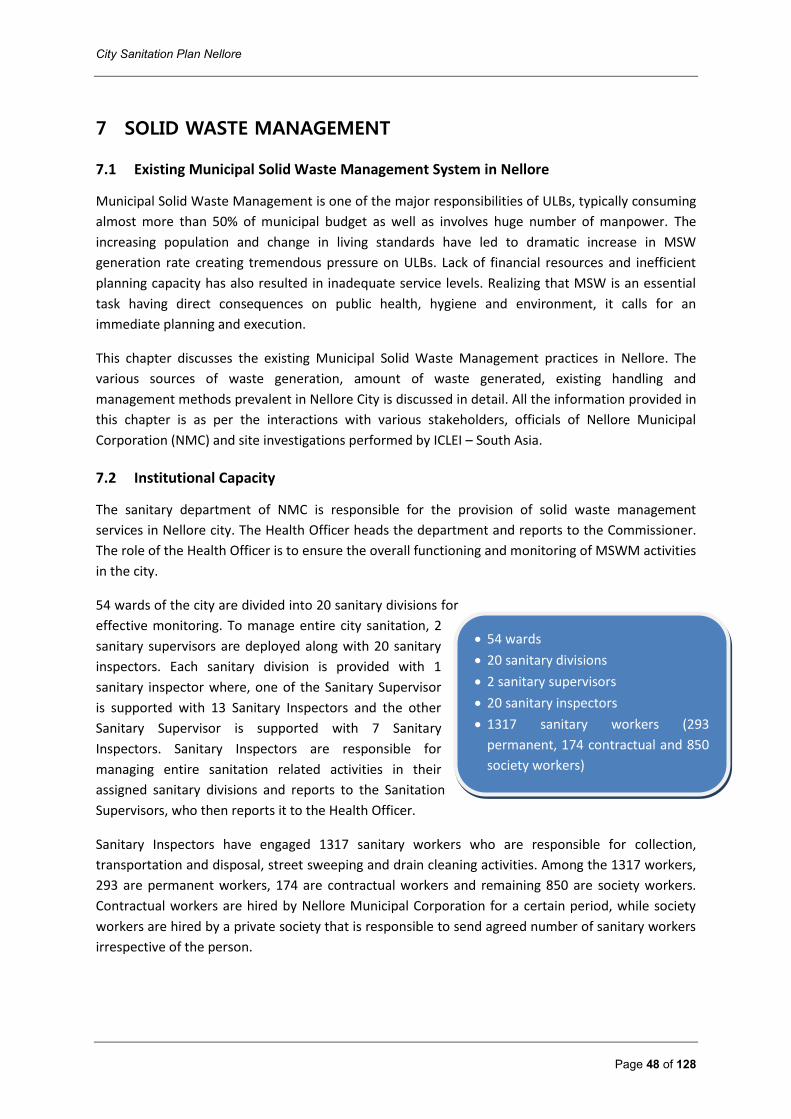
City Sanitation Plan Nellore
Page 48 of 128
54 wards
20 sanitary divisions
2 sanitary supervisors
20 sanitary inspectors
1317 sanitary workers (293
permanent, 174 contractual and 850
society workers)
7 SOLID WASTE MANAGEMENT
7.1 Existing Municipal Solid Waste Management System in Nellore
Municipal Solid Waste Management is one of the major responsibilities of ULBs, typically consuming
almost more than 50% of municipal budget as well as involves huge number of manpower. The
increasing population and change in living standards have led to dramatic increase in MSW
generation rate creating tremendous pressure on ULBs. Lack of financial resources and inefficient
planning capacity has also resulted in inadequate service levels. Realizing that MSW is an essential
task having direct consequences on public health, hygiene and environment, it calls for an
immediate planning and execution.
This chapter discusses the existing Municipal Solid Waste Management practices in Nellore. The
various sources of waste generation, amount of waste generated, existing handling and
management methods prevalent in Nellore City is discussed in detail. All the information provided in
this chapter is as per the interactions with various stakeholders, officials of Nellore Municipal
Corporation (NMC) and site investigations performed by ICLEI – South Asia.
7.2 Institutional Capacity
The sanitary department of NMC is responsible for the provision of solid waste management
services in Nellore city. The Health Officer heads the department and reports to the Commissioner.
The role of the Health Officer is to ensure the overall functioning and monitoring of MSWM activities
in the city.
54 wards of the city are divided into 20 sanitary divisions for
effective monitoring. To manage entire city sanitation, 2
sanitary supervisors are deployed along with 20 sanitary
inspectors. Each sanitary division is provided with 1
sanitary inspector where, one of the Sanitary Supervisor
is supported with 13 Sanitary Inspectors and the other
Sanitary Supervisor is supported with 7 Sanitary
Inspectors. Sanitary Inspectors are responsible for
managing entire sanitation related activities in their
assigned sanitary divisions and reports to the Sanitation
Supervisors, who then reports it to the Health Officer.
Sanitary Inspectors have engaged 1317 sanitary workers who are responsible for collection,
transportation and disposal, street sweeping and drain cleaning activities. Among the 1317 workers,
293 are permanent workers, 174 are contractual workers and remaining 850 are society workers.
Contractual workers are hired by Nellore Municipal Corporation for a certain period, while society
workers are hired by a private society that is responsible to send agreed number of sanitary workers
irrespective of the person.
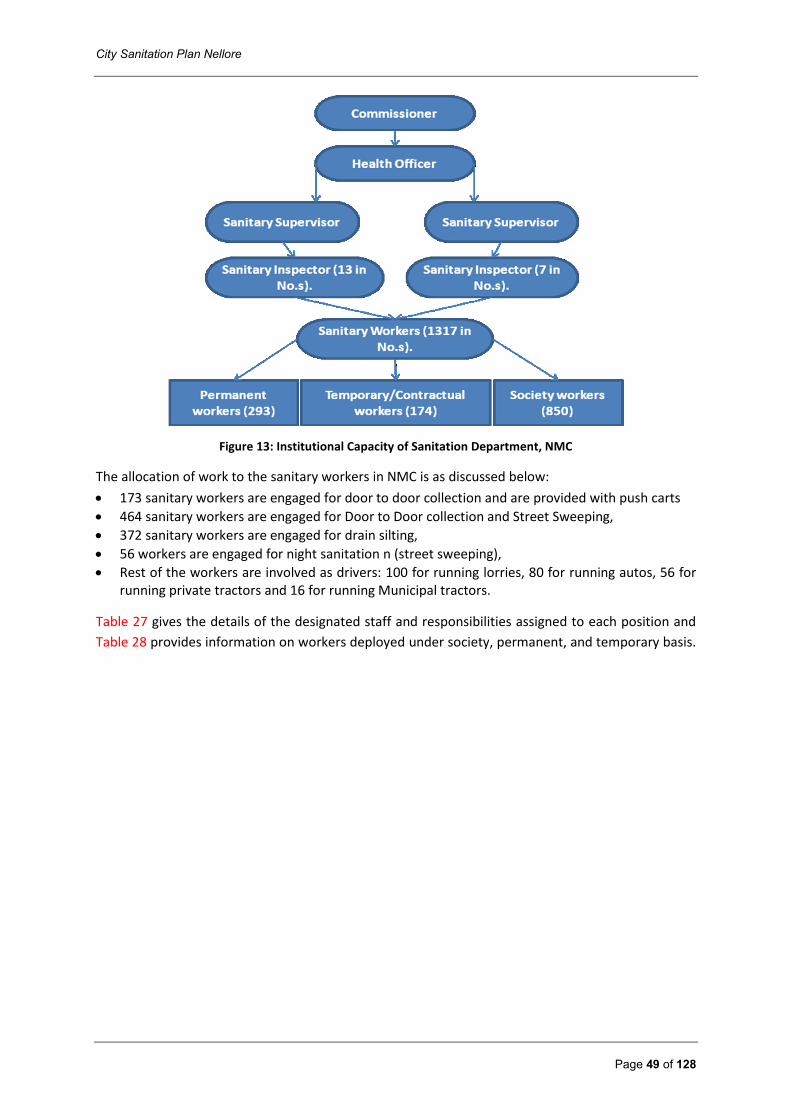
City Sanitation Plan Nellore
Page 49 of 128
Figure 13: Institutional Capacity of Sanitation Department, NMC
The allocation of work to the sanitary workers in NMC is as discussed below:
173 sanitary workers are engaged for door to door collection and are provided with push carts
464 sanitary workers are engaged for Door to Door collection and Street Sweeping,
372 sanitary workers are engaged for drain silting,
56 workers are engaged for night sanitation n (street sweeping),
Rest of the workers are involved as drivers: 100 for running lorries, 80 for running autos, 56 for running private tractors and 16 for running Municipal tractors.
Table 27 gives the details of the designated staff and responsibilities assigned to each position and
Table 28 provides information on workers deployed under society, permanent, and temporary basis.
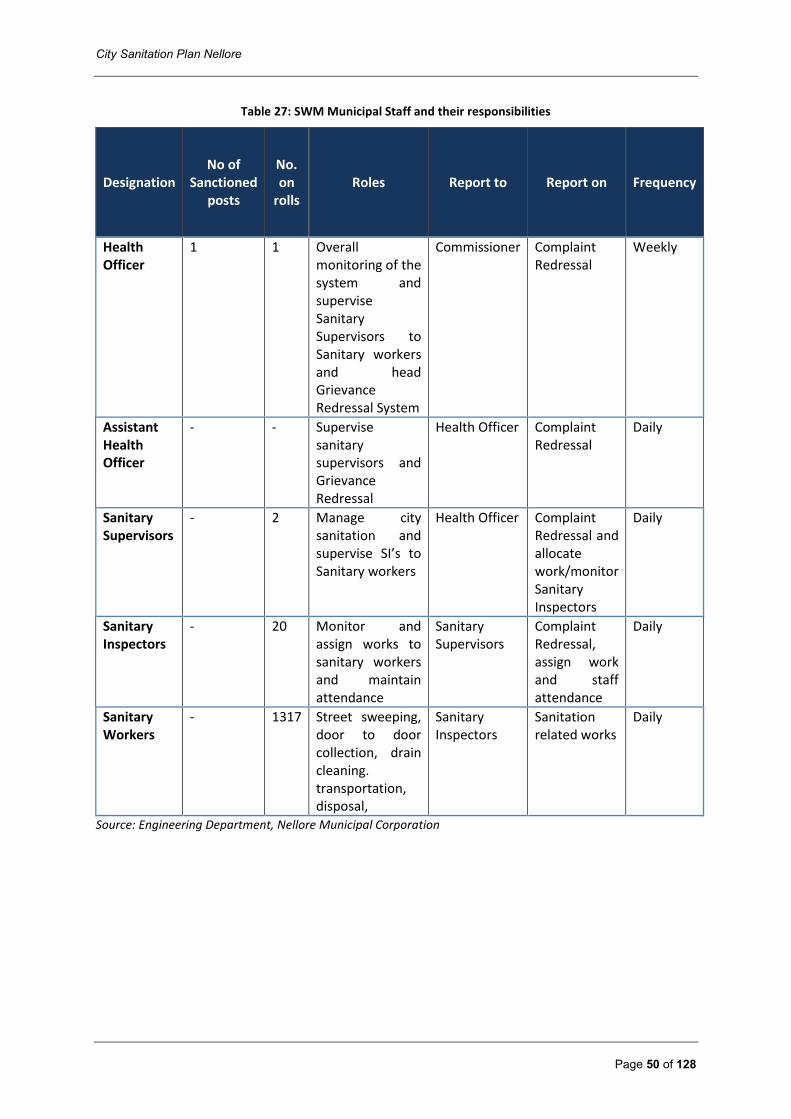
City Sanitation Plan Nellore
Page 50 of 128
Table 27: SWM Municipal Staff and their responsibilities
Designation No of
Sanctioned posts
No. on
rolls Roles Report to Report on Frequency
Health Officer
1 1 Overall monitoring of the system and supervise Sanitary Supervisors to Sanitary workers and head Grievance Redressal System
Commissioner Complaint Redressal
Weekly
Assistant Health Officer
- - Supervise sanitary supervisors and Grievance Redressal
Health Officer Complaint Redressal
Daily
Sanitary Supervisors
- 2 Manage city sanitation and supervise SI’s to Sanitary workers
Health Officer Complaint Redressal and allocate work/monitor Sanitary Inspectors
Daily
Sanitary Inspectors
- 20 Monitor and assign works to sanitary workers and maintain attendance
Sanitary Supervisors
Complaint Redressal, assign work and staff attendance
Daily
Sanitary Workers
- 1317 Street sweeping, door to door collection, drain cleaning. transportation, disposal,
Sanitary Inspectors
Sanitation related works
Daily
Source: Engineering Department, Nellore Municipal Corporation
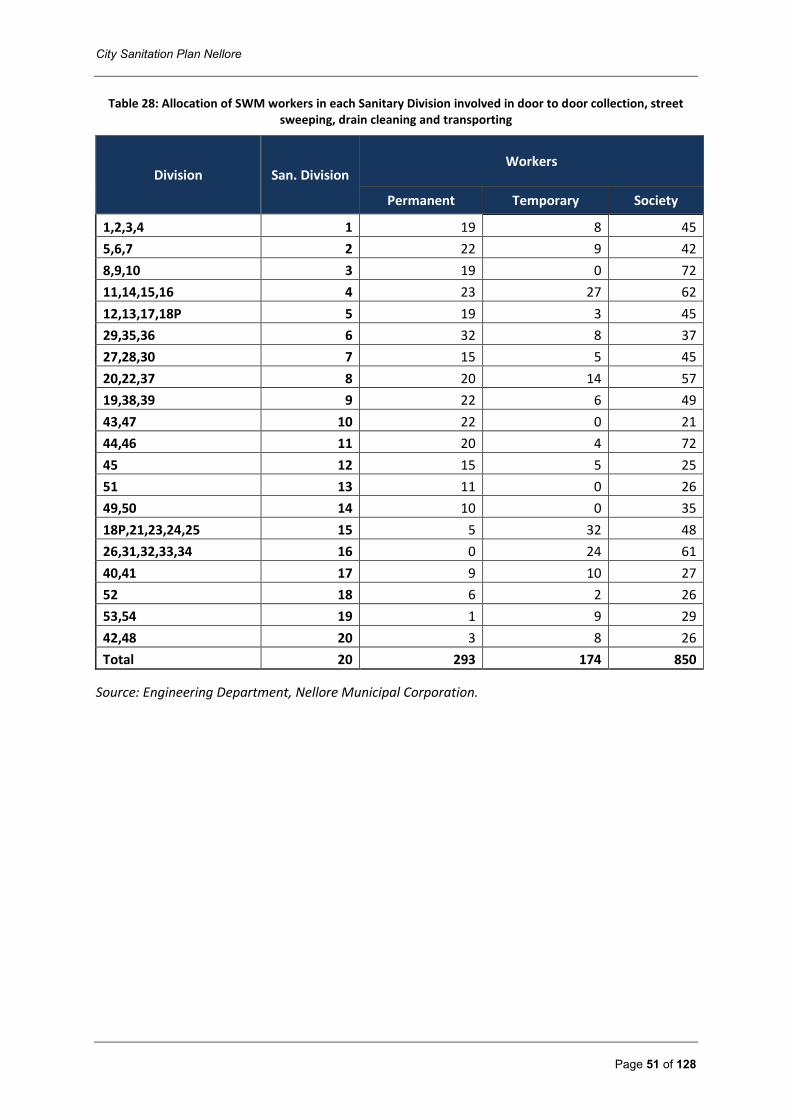
City Sanitation Plan Nellore
Page 51 of 128
Table 28: Allocation of SWM workers in each Sanitary Division involved in door to door collection, street sweeping, drain cleaning and transporting
Division San. Division Workers
Permanent Temporary Society
1,2,3,4 1 19 8 45
5,6,7 2 22 9 42
8,9,10 3 19 0 72
11,14,15,16 4 23 27 62
12,13,17,18P 5 19 3 45
29,35,36 6 32 8 37
27,28,30 7 15 5 45
20,22,37 8 20 14 57
19,38,39 9 22 6 49
43,47 10 22 0 21
44,46 11 20 4 72
45 12 15 5 25
51 13 11 0 26
49,50 14 10 0 35
18P,21,23,24,25 15 5 32 48
26,31,32,33,34 16 0 24 61
40,41 17 9 10 27
52 18 6 2 26
53,54 19 1 9 29
42,48 20 3 8 26
Total 20 293 174 850
Source: Engineering Department, Nellore Municipal Corporation.
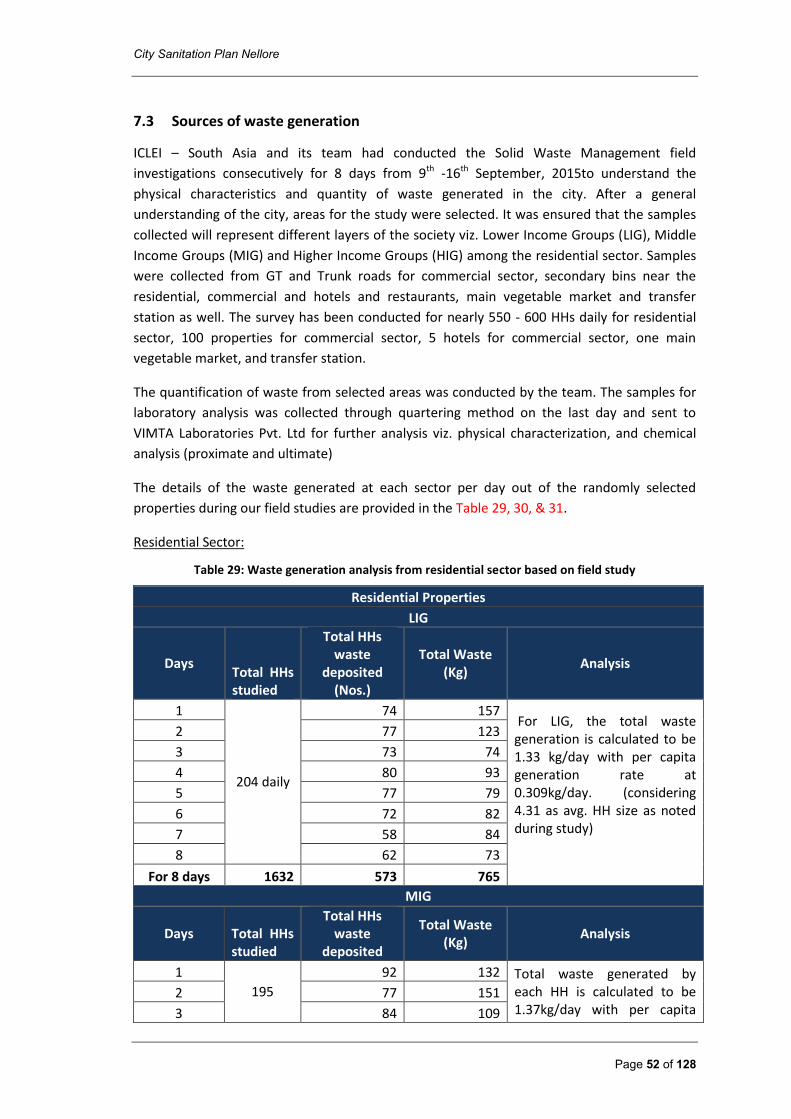
City Sanitation Plan Nellore
Page 52 of 128
7.3 Sources of waste generation
ICLEI – South Asia and its team had conducted the Solid Waste Management field
investigations consecutively for 8 days from 9th -16th September, 2015to understand the
physical characteristics and quantity of waste generated in the city. After a general
understanding of the city, areas for the study were selected. It was ensured that the samples
collected will represent different layers of the society viz. Lower Income Groups (LIG), Middle
Income Groups (MIG) and Higher Income Groups (HIG) among the residential sector. Samples
were collected from GT and Trunk roads for commercial sector, secondary bins near the
residential, commercial and hotels and restaurants, main vegetable market and transfer
station as well. The survey has been conducted for nearly 550 - 600 HHs daily for residential
sector, 100 properties for commercial sector, 5 hotels for commercial sector, one main
vegetable market, and transfer station.
The quantification of waste from selected areas was conducted by the team. The samples for
laboratory analysis was collected through quartering method on the last day and sent to
VIMTA Laboratories Pvt. Ltd for further analysis viz. physical characterization, and chemical
analysis (proximate and ultimate)
The details of the waste generated at each sector per day out of the randomly selected
properties during our field studies are provided in the Table 29, 30, & 31.
Residential Sector:
Table 29: Waste generation analysis from residential sector based on field study
Residential Properties
LIG
Days Total HHs studied
Total HHs waste
deposited (Nos.)
Total Waste (Kg)
Analysis
1
204 daily
74 157 For LIG, the total waste generation is calculated to be 1.33 kg/day with per capita generation rate at 0.309kg/day. (considering 4.31 as avg. HH size as noted during study)
2 77 123
3 73 74
4 80 93
5 77 79
6 72 82
7 58 84
8 62 73
For 8 days 1632 573 765
MIG
Days Total HHs studied
Total HHs waste
deposited
Total Waste (Kg)
Analysis
1
195
92 132 Total waste generated by each HH is calculated to be 1.37kg/day with per capita
2 77 151
3 84 109
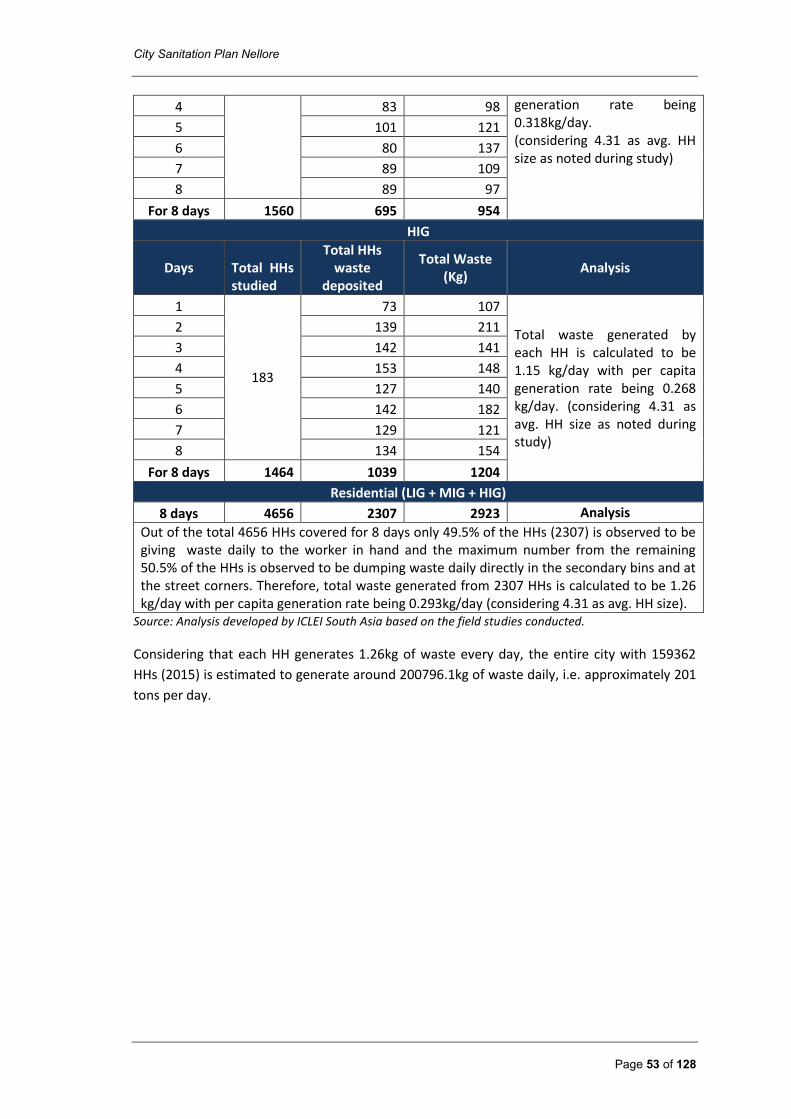
City Sanitation Plan Nellore
Page 53 of 128
4 83 98 generation rate being 0.318kg/day. (considering 4.31 as avg. HH size as noted during study)
5 101 121
6 80 137
7 89 109
8 89 97
For 8 days 1560 695 954
HIG
Days Total HHs studied
Total HHs waste
deposited
Total Waste (Kg)
Analysis
1
183
73 107
Total waste generated by each HH is calculated to be 1.15 kg/day with per capita generation rate being 0.268 kg/day. (considering 4.31 as avg. HH size as noted during study)
2 139 211
3 142 141
4 153 148
5 127 140
6 142 182
7 129 121
8 134 154
For 8 days 1464 1039 1204
Residential (LIG + MIG + HIG)
8 days 4656 2307 2923 Analysis
Out of the total 4656 HHs covered for 8 days only 49.5% of the HHs (2307) is observed to be giving waste daily to the worker in hand and the maximum number from the remaining 50.5% of the HHs is observed to be dumping waste daily directly in the secondary bins and at the street corners. Therefore, total waste generated from 2307 HHs is calculated to be 1.26 kg/day with per capita generation rate being 0.293kg/day (considering 4.31 as avg. HH size).
Source: Analysis developed by ICLEI South Asia based on the field studies conducted.
Considering that each HH generates 1.26kg of waste every day, the entire city with 159362
HHs (2015) is estimated to generate around 200796.1kg of waste daily, i.e. approximately 201
tons per day.
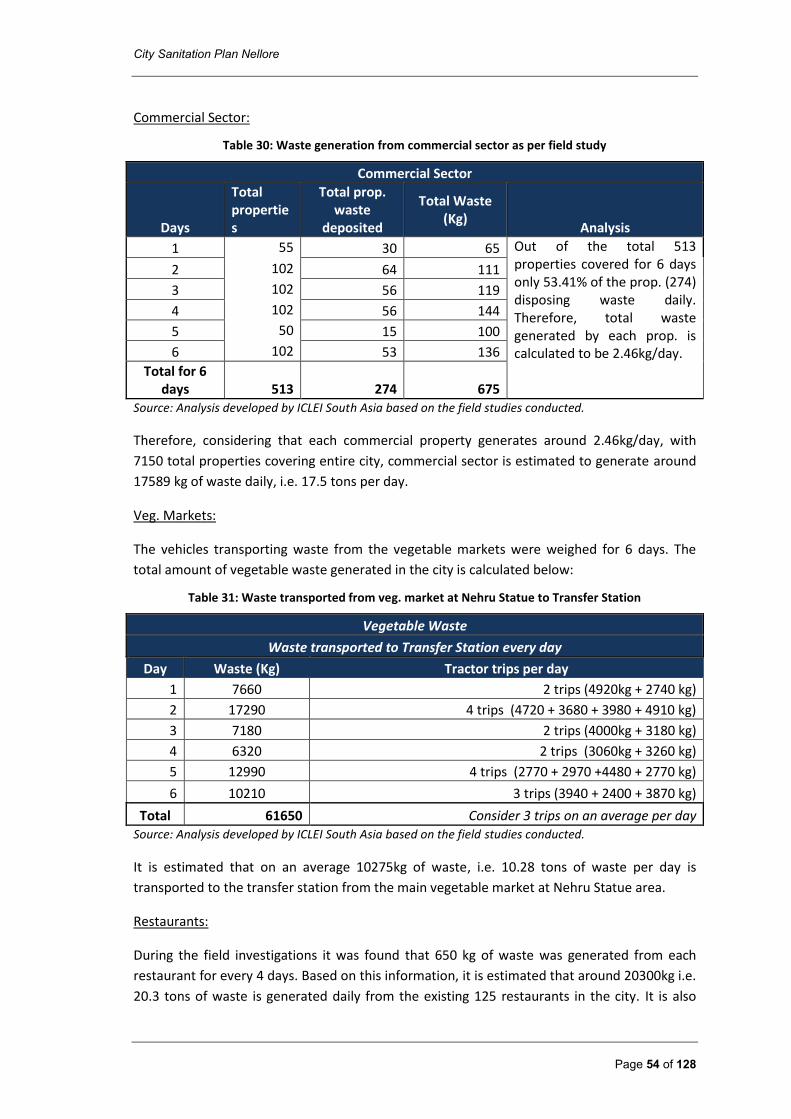
City Sanitation Plan Nellore
Page 54 of 128
Commercial Sector:
Table 30: Waste generation from commercial sector as per field study
Commercial Sector
Days
Total properties
Total prop. waste
deposited
Total Waste (Kg)
Analysis
1 55 30 65 Out of the total 513 properties covered for 6 days only 53.41% of the prop. (274) disposing waste daily. Therefore, total waste generated by each prop. is calculated to be 2.46kg/day.
2 102 64 111
3 102 56 119
4 102 56 144
5 50 15 100
6 102 53 136
Total for 6 days 513 274 675
Source: Analysis developed by ICLEI South Asia based on the field studies conducted.
Therefore, considering that each commercial property generates around 2.46kg/day, with
7150 total properties covering entire city, commercial sector is estimated to generate around
17589 kg of waste daily, i.e. 17.5 tons per day.
Veg. Markets:
The vehicles transporting waste from the vegetable markets were weighed for 6 days. The
total amount of vegetable waste generated in the city is calculated below:
Table 31: Waste transported from veg. market at Nehru Statue to Transfer Station
Vegetable Waste
Waste transported to Transfer Station every day
Day Waste (Kg) Tractor trips per day
1 7660 2 trips (4920kg + 2740 kg)
2 17290 4 trips (4720 + 3680 + 3980 + 4910 kg)
3 7180 2 trips (4000kg + 3180 kg)
4 6320 2 trips (3060kg + 3260 kg)
5 12990 4 trips (2770 + 2970 +4480 + 2770 kg)
6 10210 3 trips (3940 + 2400 + 3870 kg)
Total 61650 Consider 3 trips on an average per day Source: Analysis developed by ICLEI South Asia based on the field studies conducted.
It is estimated that on an average 10275kg of waste, i.e. 10.28 tons of waste per day is
transported to the transfer station from the main vegetable market at Nehru Statue area.
Restaurants:
During the field investigations it was found that 650 kg of waste was generated from each
restaurant for every 4 days. Based on this information, it is estimated that around 20300kg i.e.
20.3 tons of waste is generated daily from the existing 125 restaurants in the city. It is also
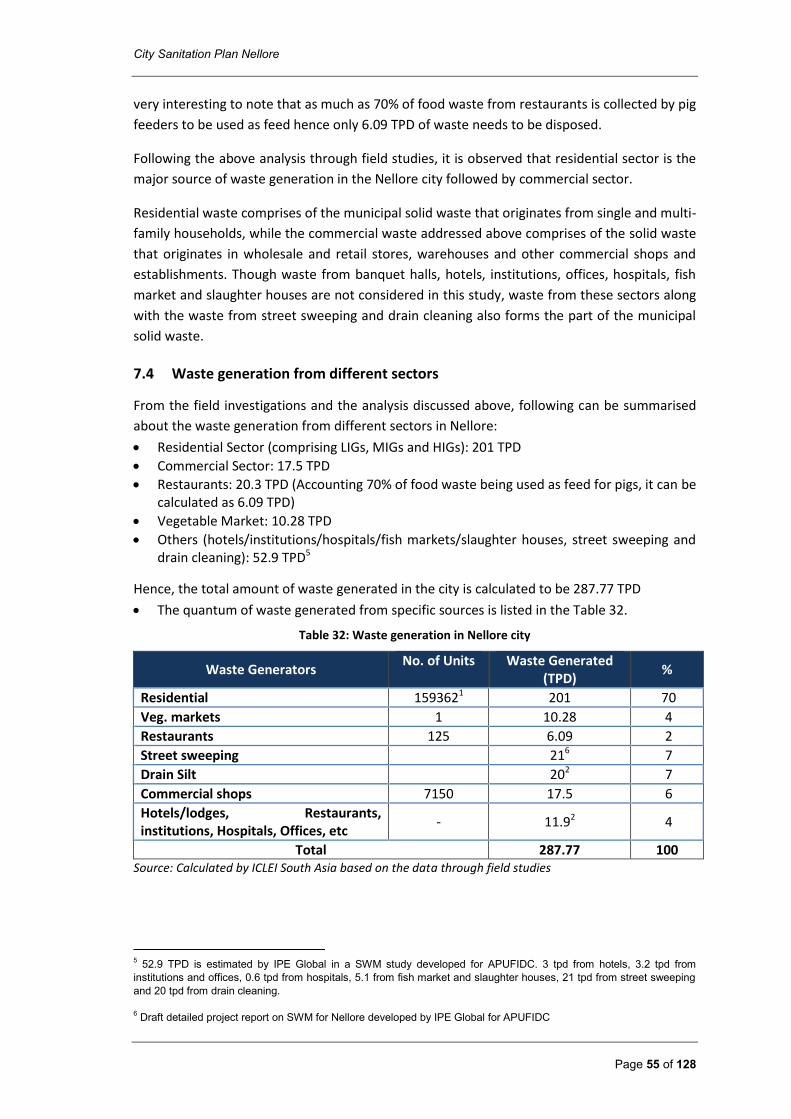
City Sanitation Plan Nellore
Page 55 of 128
very interesting to note that as much as 70% of food waste from restaurants is collected by pig
feeders to be used as feed hence only 6.09 TPD of waste needs to be disposed.
Following the above analysis through field studies, it is observed that residential sector is the
major source of waste generation in the Nellore city followed by commercial sector.
Residential waste comprises of the municipal solid waste that originates from single and multi-
family households, while the commercial waste addressed above comprises of the solid waste
that originates in wholesale and retail stores, warehouses and other commercial shops and
establishments. Though waste from banquet halls, hotels, institutions, offices, hospitals, fish
market and slaughter houses are not considered in this study, waste from these sectors along
with the waste from street sweeping and drain cleaning also forms the part of the municipal
solid waste.
7.4 Waste generation from different sectors
From the field investigations and the analysis discussed above, following can be summarised
about the waste generation from different sectors in Nellore:
Residential Sector (comprising LIGs, MIGs and HIGs): 201 TPD
Commercial Sector: 17.5 TPD
Restaurants: 20.3 TPD (Accounting 70% of food waste being used as feed for pigs, it can be calculated as 6.09 TPD)
Vegetable Market: 10.28 TPD
Others (hotels/institutions/hospitals/fish markets/slaughter houses, street sweeping and drain cleaning): 52.9 TPD5
Hence, the total amount of waste generated in the city is calculated to be 287.77 TPD
The quantum of waste generated from specific sources is listed in the Table 32.
Table 32: Waste generation in Nellore city
Waste Generators No. of Units Waste Generated
(TPD) %
Residential 1593621 201 70
Veg. markets 1 10.28 4
Restaurants 125 6.09 2
Street sweeping 216 7
Drain Silt 202 7
Commercial shops 7150 17.5 6
Hotels/lodges, Restaurants, institutions, Hospitals, Offices, etc
- 11.92 4
Total 287.77 100 Source: Calculated by ICLEI South Asia based on the data through field studies
5 52.9 TPD is estimated by IPE Global in a SWM study developed for APUFIDC. 3 tpd from hotels, 3.2 tpd from
institutions and offices, 0.6 tpd from hospitals, 5.1 from fish market and slaughter houses, 21 tpd from street sweeping
and 20 tpd from drain cleaning.
6 Draft detailed project report on SWM for Nellore developed by IPE Global for APUFIDC
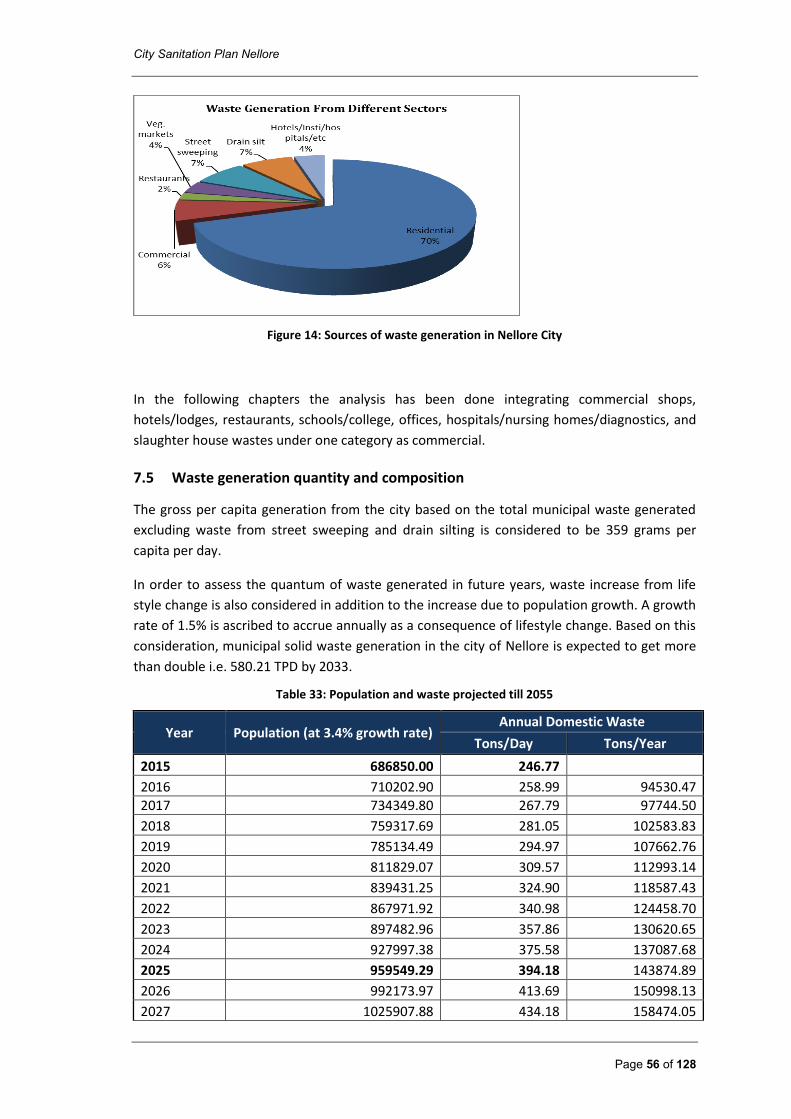
City Sanitation Plan Nellore
Page 56 of 128
Figure 14: Sources of waste generation in Nellore City
In the following chapters the analysis has been done integrating commercial shops,
hotels/lodges, restaurants, schools/college, offices, hospitals/nursing homes/diagnostics, and
slaughter house wastes under one category as commercial.
7.5 Waste generation quantity and composition
The gross per capita generation from the city based on the total municipal waste generated
excluding waste from street sweeping and drain silting is considered to be 359 grams per
capita per day.
In order to assess the quantum of waste generated in future years, waste increase from life
style change is also considered in addition to the increase due to population growth. A growth
rate of 1.5% is ascribed to accrue annually as a consequence of lifestyle change. Based on this
consideration, municipal solid waste generation in the city of Nellore is expected to get more
than double i.e. 580.21 TPD by 2033.
Table 33: Population and waste projected till 2055
Year Population (at 3.4% growth rate) Annual Domestic Waste
Tons/Day Tons/Year
2015 686850.00 246.77
2016 710202.90 258.99 94530.47
2017 734349.80 267.79 97744.50
2018 759317.69 281.05 102583.83
2019 785134.49 294.97 107662.76
2020 811829.07 309.57 112993.14
2021 839431.25 324.90 118587.43
2022 867971.92 340.98 124458.70
2023 897482.96 357.86 130620.65
2024 927997.38 375.58 137087.68
2025 959549.29 394.18 143874.89
2026 992173.97 413.69 150998.13
2027 1025907.88 434.18 158474.05
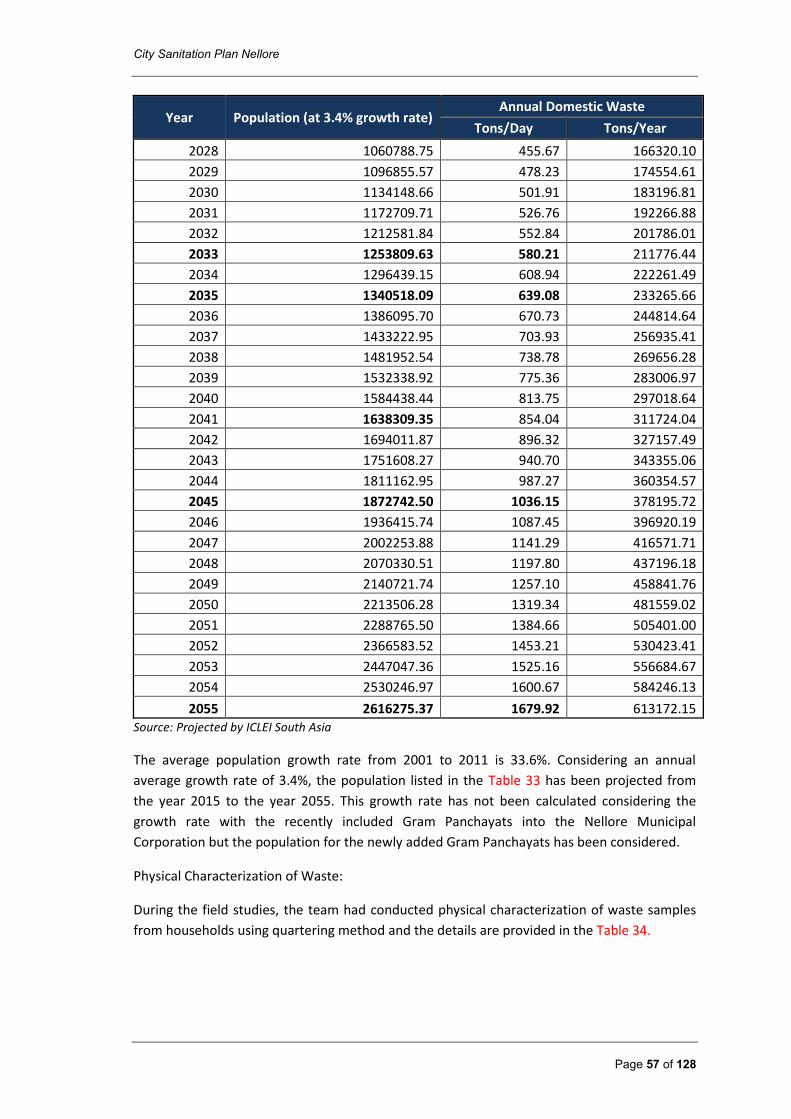
City Sanitation Plan Nellore
Page 57 of 128
Year Population (at 3.4% growth rate) Annual Domestic Waste
Tons/Day Tons/Year
2028 1060788.75 455.67 166320.10
2029 1096855.57 478.23 174554.61
2030 1134148.66 501.91 183196.81
2031 1172709.71 526.76 192266.88
2032 1212581.84 552.84 201786.01
2033 1253809.63 580.21 211776.44
2034 1296439.15 608.94 222261.49
2035 1340518.09 639.08 233265.66
2036 1386095.70 670.73 244814.64
2037 1433222.95 703.93 256935.41
2038 1481952.54 738.78 269656.28
2039 1532338.92 775.36 283006.97
2040 1584438.44 813.75 297018.64
2041 1638309.35 854.04 311724.04
2042 1694011.87 896.32 327157.49
2043 1751608.27 940.70 343355.06
2044 1811162.95 987.27 360354.57
2045 1872742.50 1036.15 378195.72
2046 1936415.74 1087.45 396920.19
2047 2002253.88 1141.29 416571.71
2048 2070330.51 1197.80 437196.18
2049 2140721.74 1257.10 458841.76
2050 2213506.28 1319.34 481559.02
2051 2288765.50 1384.66 505401.00
2052 2366583.52 1453.21 530423.41
2053 2447047.36 1525.16 556684.67
2054 2530246.97 1600.67 584246.13
2055 2616275.37 1679.92 613172.15 Source: Projected by ICLEI South Asia
The average population growth rate from 2001 to 2011 is 33.6%. Considering an annual
average growth rate of 3.4%, the population listed in the Table 33 has been projected from
the year 2015 to the year 2055. This growth rate has not been calculated considering the
growth rate with the recently included Gram Panchayats into the Nellore Municipal
Corporation but the population for the newly added Gram Panchayats has been considered.
Physical Characterization of Waste:
During the field studies, the team had conducted physical characterization of waste samples
from households using quartering method and the details are provided in the Table 34.
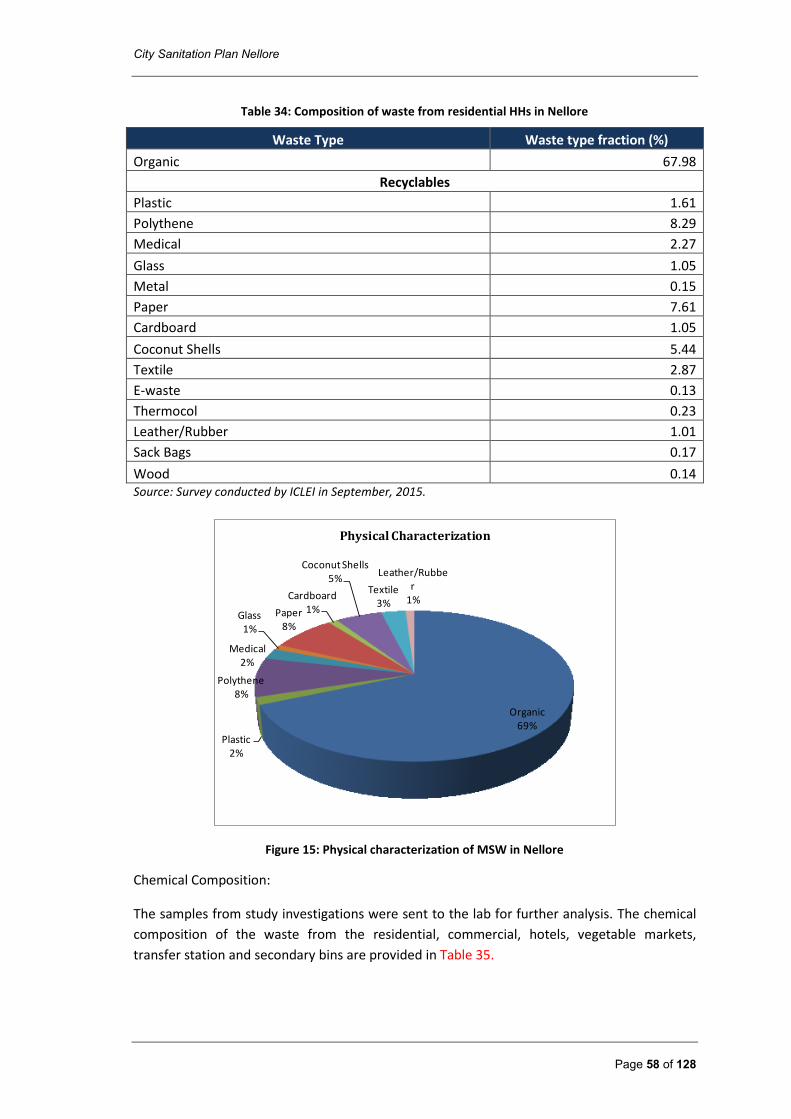
City Sanitation Plan Nellore
Page 58 of 128
Table 34: Composition of waste from residential HHs in Nellore
Waste Type Waste type fraction (%)
Organic 67.98
Recyclables
Plastic 1.61
Polythene 8.29
Medical 2.27
Glass 1.05
Metal 0.15
Paper 7.61
Cardboard 1.05
Coconut Shells 5.44
Textile 2.87
E-waste 0.13
Thermocol 0.23
Leather/Rubber 1.01
Sack Bags 0.17
Wood 0.14 Source: Survey conducted by ICLEI in September, 2015.
Organic69%
Plastic2%
Polythene8%
Medical2%
Glass1%
Paper8%
Cardboard1%
Coconut Shells5%
Textile3%
Leather/Rubber
1%
Physical Characterization
Figure 15: Physical characterization of MSW in Nellore
Chemical Composition:
The samples from study investigations were sent to the lab for further analysis. The chemical
composition of the waste from the residential, commercial, hotels, vegetable markets,
transfer station and secondary bins are provided in Table 35.
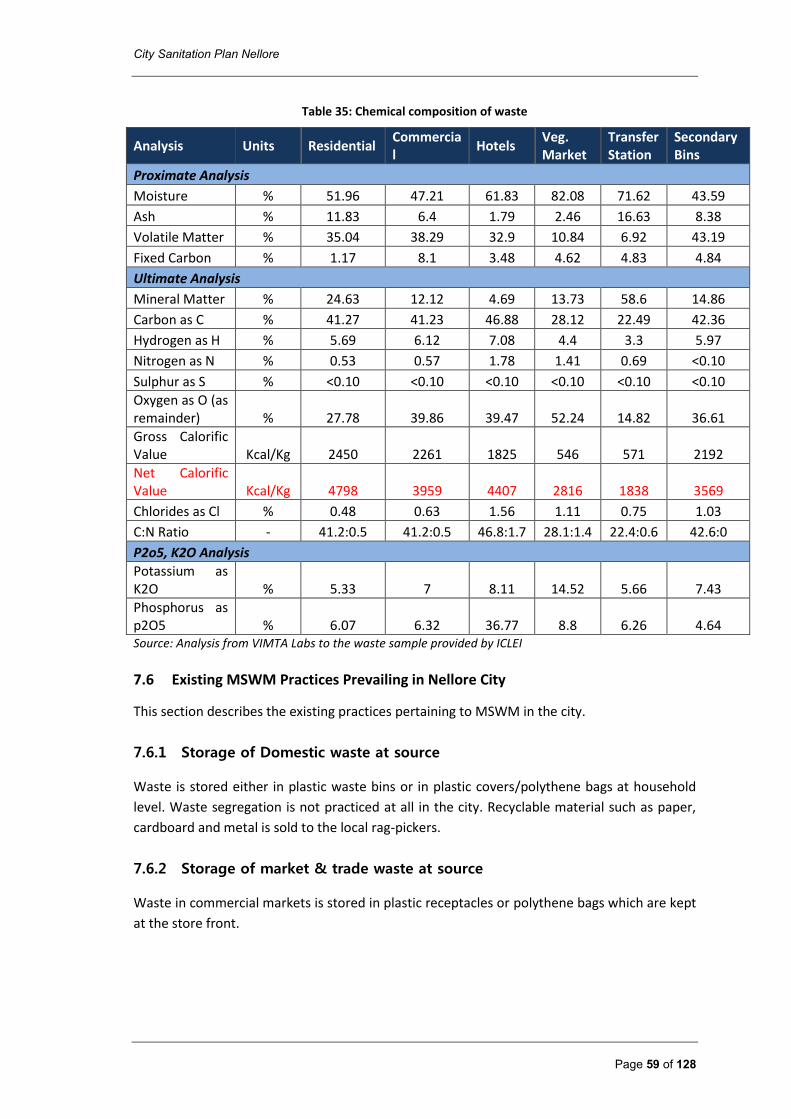
City Sanitation Plan Nellore
Page 59 of 128
Table 35: Chemical composition of waste
Analysis Units Residential Commercial
Hotels Veg. Market
Transfer Station
Secondary Bins
Proximate Analysis
Moisture % 51.96 47.21 61.83 82.08 71.62 43.59
Ash % 11.83 6.4 1.79 2.46 16.63 8.38
Volatile Matter % 35.04 38.29 32.9 10.84 6.92 43.19
Fixed Carbon % 1.17 8.1 3.48 4.62 4.83 4.84
Ultimate Analysis
Mineral Matter % 24.63 12.12 4.69 13.73 58.6 14.86
Carbon as C % 41.27 41.23 46.88 28.12 22.49 42.36
Hydrogen as H % 5.69 6.12 7.08 4.4 3.3 5.97
Nitrogen as N % 0.53 0.57 1.78 1.41 0.69 <0.10
Sulphur as S % <0.10 <0.10 <0.10 <0.10 <0.10 <0.10
Oxygen as O (as remainder) % 27.78 39.86 39.47 52.24 14.82 36.61
Gross Calorific Value Kcal/Kg 2450 2261 1825 546 571 2192
Net Calorific Value Kcal/Kg 4798 3959 4407 2816 1838 3569
Chlorides as Cl % 0.48 0.63 1.56 1.11 0.75 1.03
C:N Ratio - 41.2:0.5 41.2:0.5 46.8:1.7 28.1:1.4 22.4:0.6 42.6:0
P2o5, K2O Analysis
Potassium as K2O % 5.33 7 8.11 14.52 5.66 7.43
Phosphorus as p2O5 % 6.07 6.32 36.77 8.8 6.26 4.64 Source: Analysis from VIMTA Labs to the waste sample provided by ICLEI
7.6 Existing MSWM Practices Prevailing in Nellore City
This section describes the existing practices pertaining to MSWM in the city.
7.6.1 Storage of Domestic waste at source
Waste is stored either in plastic waste bins or in plastic covers/polythene bags at household
level. Waste segregation is not practiced at all in the city. Recyclable material such as paper,
cardboard and metal is sold to the local rag-pickers.
7.6.2 Storage of market & trade waste at source
Waste in commercial markets is stored in plastic receptacles or polythene bags which are kept
at the store front.
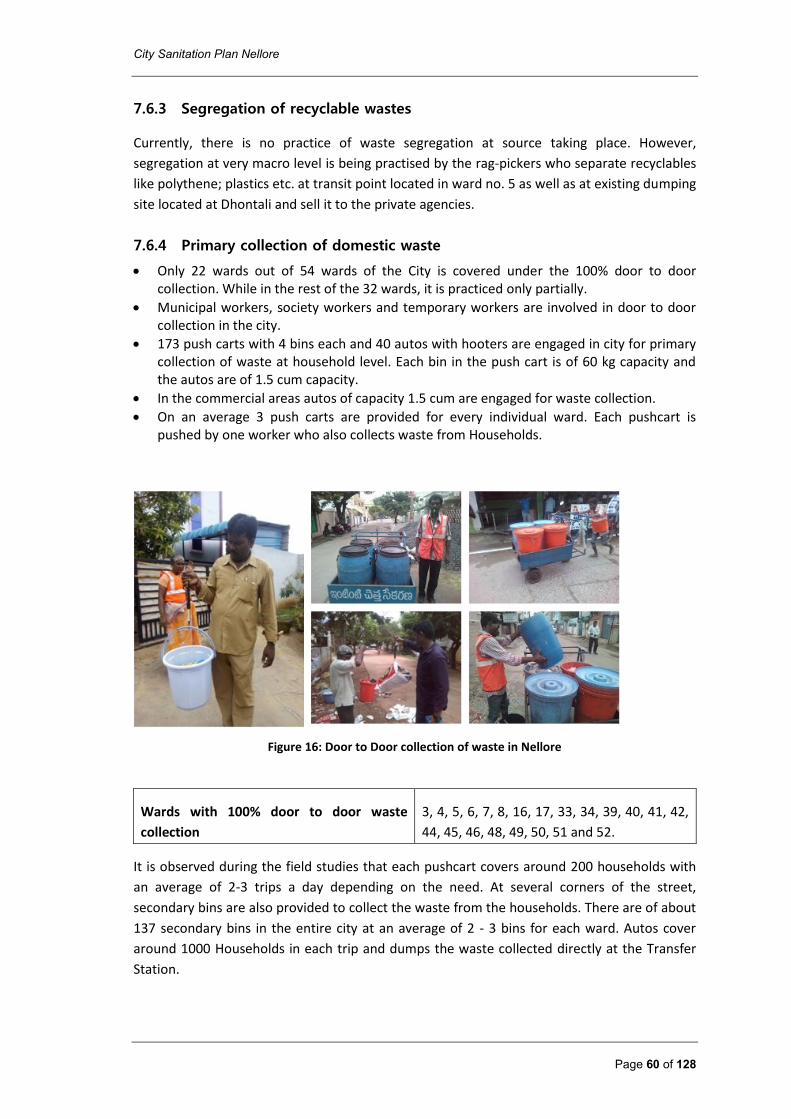
City Sanitation Plan Nellore
Page 60 of 128
7.6.3 Segregation of recyclable wastes
Currently, there is no practice of waste segregation at source taking place. However,
segregation at very macro level is being practised by the rag-pickers who separate recyclables
like polythene; plastics etc. at transit point located in ward no. 5 as well as at existing dumping
site located at Dhontali and sell it to the private agencies.
7.6.4 Primary collection of domestic waste
Only 22 wards out of 54 wards of the City is covered under the 100% door to door collection. While in the rest of the 32 wards, it is practiced only partially.
Municipal workers, society workers and temporary workers are involved in door to door collection in the city.
173 push carts with 4 bins each and 40 autos with hooters are engaged in city for primary collection of waste at household level. Each bin in the push cart is of 60 kg capacity and the autos are of 1.5 cum capacity.
In the commercial areas autos of capacity 1.5 cum are engaged for waste collection.
On an average 3 push carts are provided for every individual ward. Each pushcart is pushed by one worker who also collects waste from Households.
Figure 16: Door to Door collection of waste in Nellore
Wards with 100% door to door waste
collection
3, 4, 5, 6, 7, 8, 16, 17, 33, 34, 39, 40, 41, 42,
44, 45, 46, 48, 49, 50, 51 and 52.
It is observed during the field studies that each pushcart covers around 200 households with
an average of 2-3 trips a day depending on the need. At several corners of the street,
secondary bins are also provided to collect the waste from the households. There are of about
137 secondary bins in the entire city at an average of 2 - 3 bins for each ward. Autos cover
around 1000 Households in each trip and dumps the waste collected directly at the Transfer
Station.
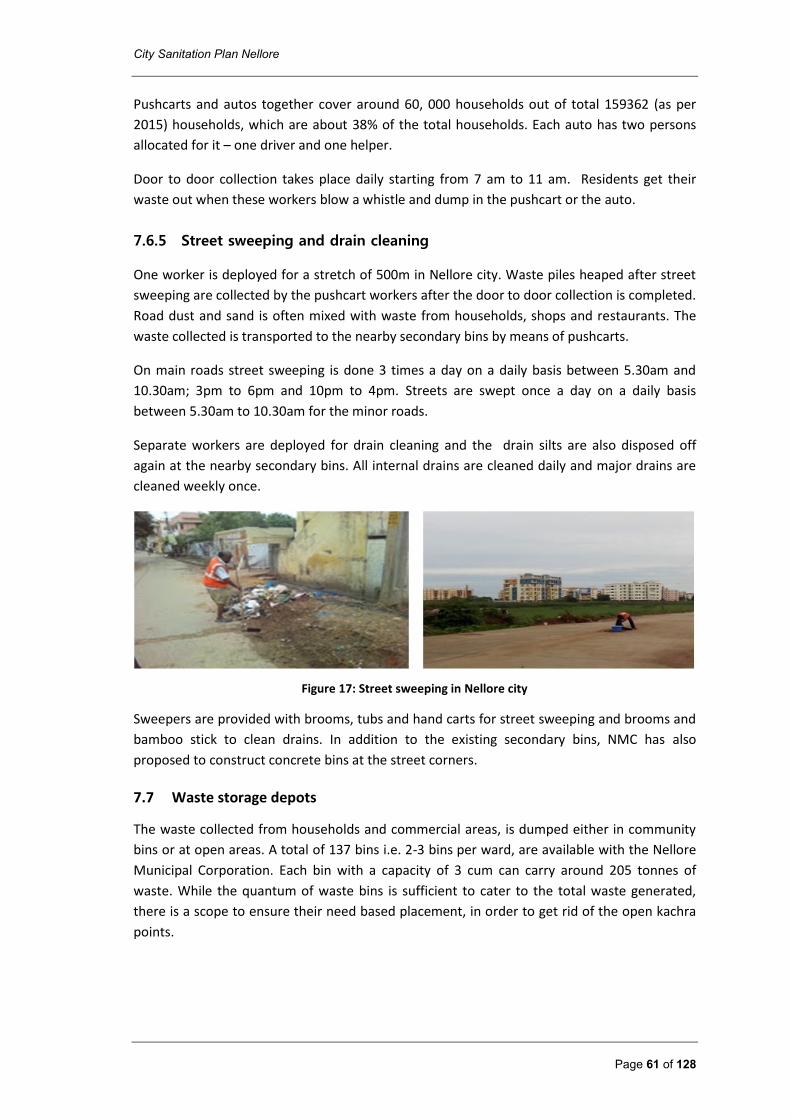
City Sanitation Plan Nellore
Page 61 of 128
Pushcarts and autos together cover around 60, 000 households out of total 159362 (as per
2015) households, which are about 38% of the total households. Each auto has two persons
allocated for it – one driver and one helper.
Door to door collection takes place daily starting from 7 am to 11 am. Residents get their
waste out when these workers blow a whistle and dump in the pushcart or the auto.
7.6.5 Street sweeping and drain cleaning
One worker is deployed for a stretch of 500m in Nellore city. Waste piles heaped after street
sweeping are collected by the pushcart workers after the door to door collection is completed.
Road dust and sand is often mixed with waste from households, shops and restaurants. The
waste collected is transported to the nearby secondary bins by means of pushcarts.
On main roads street sweeping is done 3 times a day on a daily basis between 5.30am and
10.30am; 3pm to 6pm and 10pm to 4pm. Streets are swept once a day on a daily basis
between 5.30am to 10.30am for the minor roads.
Separate workers are deployed for drain cleaning and the drain silts are also disposed off
again at the nearby secondary bins. All internal drains are cleaned daily and major drains are
cleaned weekly once.
Figure 17: Street sweeping in Nellore city
Sweepers are provided with brooms, tubs and hand carts for street sweeping and brooms and
bamboo stick to clean drains. In addition to the existing secondary bins, NMC has also
proposed to construct concrete bins at the street corners.
7.7 Waste storage depots
The waste collected from households and commercial areas, is dumped either in community
bins or at open areas. A total of 137 bins i.e. 2-3 bins per ward, are available with the Nellore
Municipal Corporation. Each bin with a capacity of 3 cum can carry around 205 tonnes of
waste. While the quantum of waste bins is sufficient to cater to the total waste generated,
there is a scope to ensure their need based placement, in order to get rid of the open kachra
points.
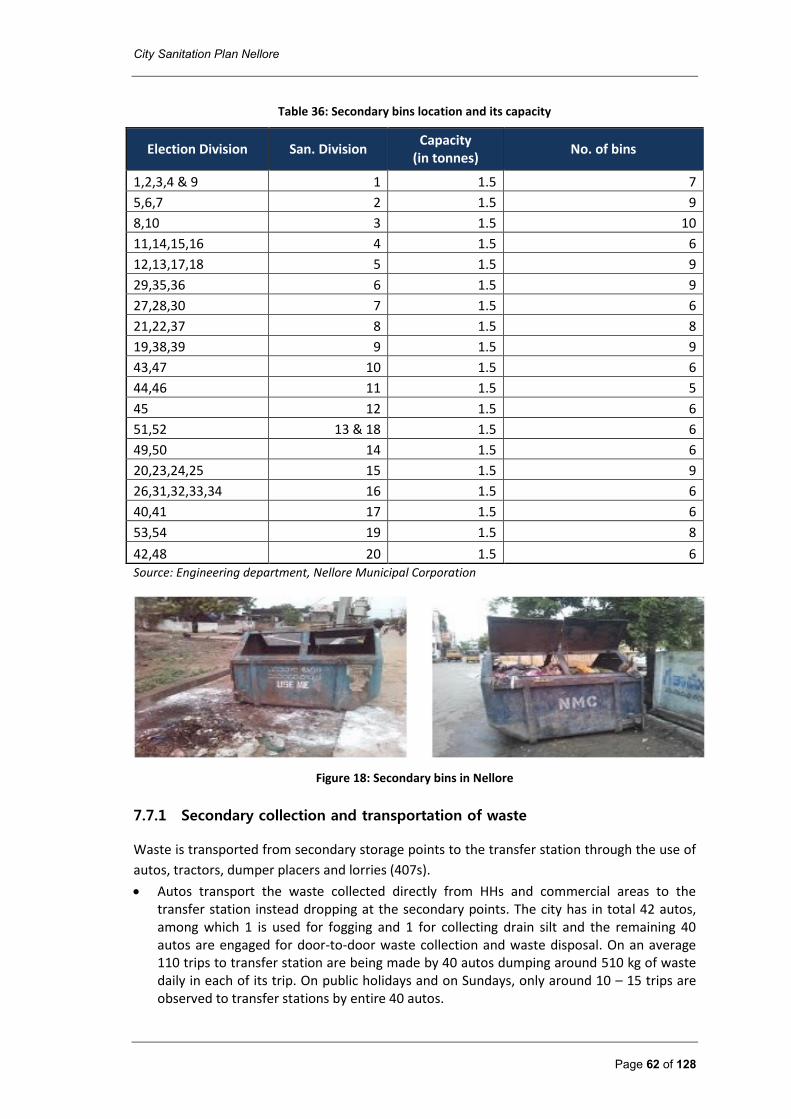
City Sanitation Plan Nellore
Page 62 of 128
Table 36: Secondary bins location and its capacity
Election Division San. Division Capacity
(in tonnes) No. of bins
1,2,3,4 & 9 1 1.5 7
5,6,7 2 1.5 9
8,10 3 1.5 10
11,14,15,16 4 1.5 6
12,13,17,18 5 1.5 9
29,35,36 6 1.5 9
27,28,30 7 1.5 6
21,22,37 8 1.5 8
19,38,39 9 1.5 9
43,47 10 1.5 6
44,46 11 1.5 5
45 12 1.5 6
51,52 13 & 18 1.5 6
49,50 14 1.5 6
20,23,24,25 15 1.5 9
26,31,32,33,34 16 1.5 6
40,41 17 1.5 6
53,54 19 1.5 8
42,48 20 1.5 6 Source: Engineering department, Nellore Municipal Corporation
Figure 18: Secondary bins in Nellore
7.7.1 Secondary collection and transportation of waste
Waste is transported from secondary storage points to the transfer station through the use of
autos, tractors, dumper placers and lorries (407s).
Autos transport the waste collected directly from HHs and commercial areas to the transfer station instead dropping at the secondary points. The city has in total 42 autos, among which 1 is used for fogging and 1 for collecting drain silt and the remaining 40 autos are engaged for door-to-door waste collection and waste disposal. On an average 110 trips to transfer station are being made by 40 autos dumping around 510 kg of waste daily in each of its trip. On public holidays and on Sundays, only around 10 – 15 trips are observed to transfer stations by entire 40 autos.
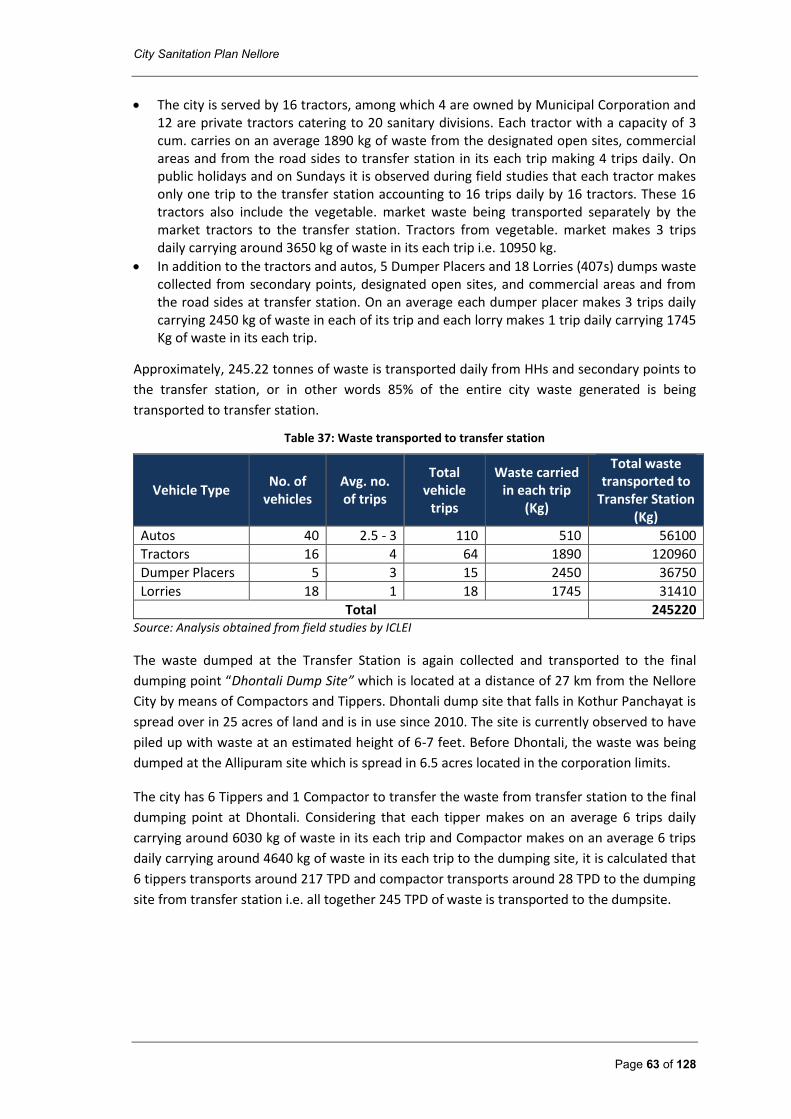
City Sanitation Plan Nellore
Page 63 of 128
The city is served by 16 tractors, among which 4 are owned by Municipal Corporation and 12 are private tractors catering to 20 sanitary divisions. Each tractor with a capacity of 3 cum. carries on an average 1890 kg of waste from the designated open sites, commercial areas and from the road sides to transfer station in its each trip making 4 trips daily. On public holidays and on Sundays it is observed during field studies that each tractor makes only one trip to the transfer station accounting to 16 trips daily by 16 tractors. These 16 tractors also include the vegetable. market waste being transported separately by the market tractors to the transfer station. Tractors from vegetable. market makes 3 trips daily carrying around 3650 kg of waste in its each trip i.e. 10950 kg.
In addition to the tractors and autos, 5 Dumper Placers and 18 Lorries (407s) dumps waste collected from secondary points, designated open sites, and commercial areas and from the road sides at transfer station. On an average each dumper placer makes 3 trips daily carrying 2450 kg of waste in each of its trip and each lorry makes 1 trip daily carrying 1745 Kg of waste in its each trip.
Approximately, 245.22 tonnes of waste is transported daily from HHs and secondary points to
the transfer station, or in other words 85% of the entire city waste generated is being
transported to transfer station.
Table 37: Waste transported to transfer station
Vehicle Type No. of
vehicles Avg. no. of trips
Total vehicle
trips
Waste carried in each trip
(Kg)
Total waste transported to
Transfer Station (Kg)
Autos 40 2.5 - 3 110 510 56100
Tractors 16 4 64 1890 120960
Dumper Placers 5 3 15 2450 36750
Lorries 18 1 18 1745 31410
Total 245220 Source: Analysis obtained from field studies by ICLEI
The waste dumped at the Transfer Station is again collected and transported to the final
dumping point “Dhontali Dump Site” which is located at a distance of 27 km from the Nellore
City by means of Compactors and Tippers. Dhontali dump site that falls in Kothur Panchayat is
spread over in 25 acres of land and is in use since 2010. The site is currently observed to have
piled up with waste at an estimated height of 6-7 feet. Before Dhontali, the waste was being
dumped at the Allipuram site which is spread in 6.5 acres located in the corporation limits.
The city has 6 Tippers and 1 Compactor to transfer the waste from transfer station to the final
dumping point at Dhontali. Considering that each tipper makes on an average 6 trips daily
carrying around 6030 kg of waste in its each trip and Compactor makes on an average 6 trips
daily carrying around 4640 kg of waste in its each trip to the dumping site, it is calculated that
6 tippers transports around 217 TPD and compactor transports around 28 TPD to the dumping
site from transfer station i.e. all together 245 TPD of waste is transported to the dumpsite.
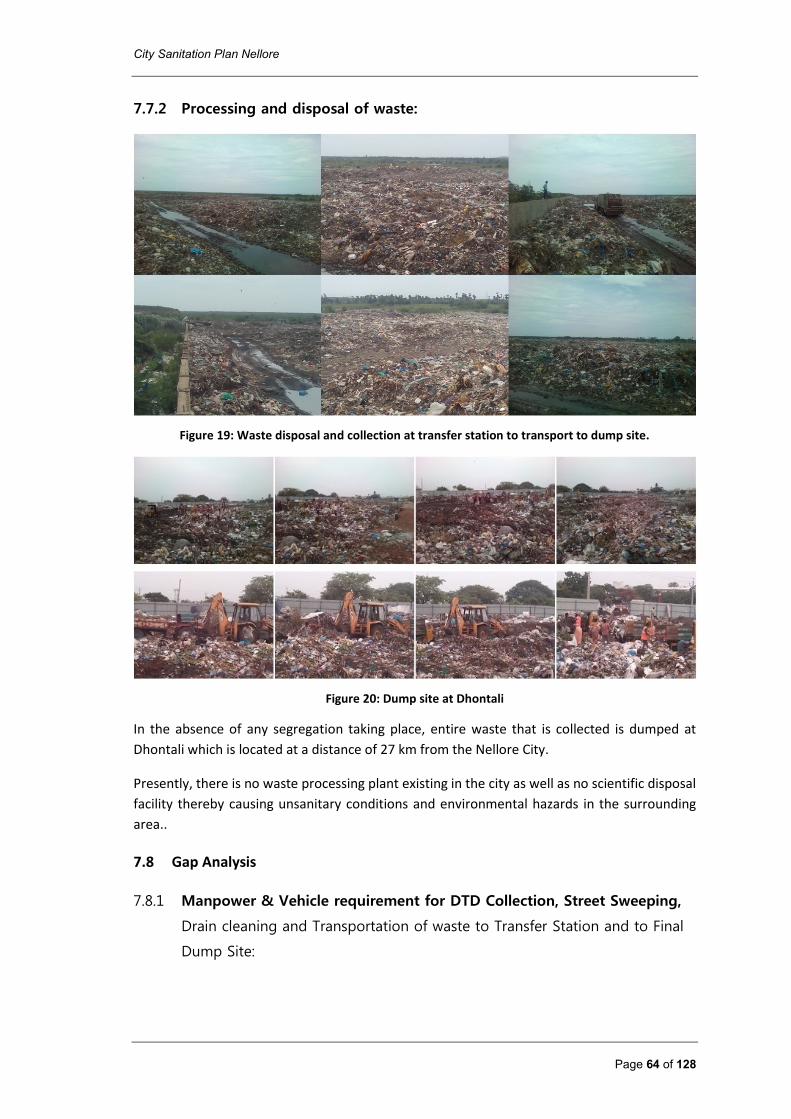
City Sanitation Plan Nellore
Page 64 of 128
7.7.2 Processing and disposal of waste:
Figure 19: Waste disposal and collection at transfer station to transport to dump site.
Figure 20: Dump site at Dhontali
In the absence of any segregation taking place, entire waste that is collected is dumped at
Dhontali which is located at a distance of 27 km from the Nellore City.
Presently, there is no waste processing plant existing in the city as well as no scientific disposal
facility thereby causing unsanitary conditions and environmental hazards in the surrounding
area..
7.8 Gap Analysis
7.8.1 Manpower & Vehicle requirement for DTD Collection, Street Sweeping,
Drain cleaning and Transportation of waste to Transfer Station and to Final
Dump Site:
City Sanitation Plan Nellore
Page 65 of 128
Primary Collection:
Nellore Municipal Corporation has permanent staff for executing and monitoring all the
activities related to sanitation in the city. In addition, the corporation has also hired temporary
staff and society staff on contract basis to support solid waste management activities in the
city. At present, door to door collection is being practiced in 22 wards by both the permanent
and temporary staff. In order to increase efficiency of collection and ensure regular
continuous service, it is proposed to engage more municipal permanent workers for the
purpose of door to door collection and street sweeping.
As informed by the municipal officials, approximately 30% of the HHs in the city is scattered
wide giving way only for the autos to collect the waste while the remaining areas can be
covered by pushcarts. , Considering that 1 auto covers around 1000 HHs and 1 pushcart covers
around 200 HHs, it is proposed to procure another additional 8 autos and 385 pushcarts to
supplement the existing 40 autos and 173 pushcarts.
Also to cover commercial sector with nearly 7150 properties, it is proposed to procure 7 more
autos to the aforementioned 8 autos.
Therefore, to run the proposed number of pushcarts and autos for residential and commercial
sectors, the corporation shall engage additional 385 pushcart workers and 30 auto workers.
Street Sweeping:
The length of roads in the city being at 1130 km stretch (Asphalt – 60 km and Concrete – 240
km), considering that one worker shall cover 500m it is proposed to engage 2260 workers
specifically to carryout street sweeping and drain cleaning. Workers engaged in street
sweeping shall also be engaged in drain cleaning along the same beat.
Secondary collection and transportation to transfer station:
Autos dump waste directly from the HHs at the transfer stations without dumping at the
secondary bins. The waste disposed at the secondary bins from domestic, street sweeping and
drain silting is collected and transported to the transfer station by means of tractors, dumper
placers and lorries. As mentioned under subsection 1.12 that only 245.22 TPD of waste is
being transported to the transfer station out of the total 287.77 TPD of waste generated in the
city, it is recommended to procure 6 new Dumper Placers or increase the number of trips by
the vehicles to transport balance 42.55 TPD of waste to the transfer station instead procuring
additional vehicles.
Waste transportation from Transfer Station to final Dump site:
As mentioned in subsection 7.13 that of the entire daily waste dumped at the transfer station
only 245 TPD is being transported to the final dump site with the available tippers and
compactors, considering that balance 42.77 TPD is to be transported to the dump site, it is
recommended to procure 1 compactor and 1 tipper or increase one trip by each tipper and
compactor to transfer the waste disposed at the transfer station.

City Sanitation Plan Nellore
Page 66 of 128
Man Power and vehicle requirements:
With the above analysis to collect 100% waste from HHs, and transfer 100% waste from
secondary bins to the transfer station and to the dump site there is a requirement to procure
385 pushcarts and 15 autos. In addition to this there is also a need to hire another 1769
workers for collection and transportation of waste in the city.
Table 38: Existing and proposed man power and vehicle requirements
Activities Residential Commercial
Door to Door Collection
Total HHs 159362 7150
Total Pushcarts available 173 -
Total Autos available 40 (including residential and commercial)
Total Pushcarts required 558
Total Autos required 55
Pushcarts gap 385
Autos gap 15
Street Sweeping
Length of streets 1130 Km
Manpower Availability
DTD and street sweeping manpower 464
Sweeping (Night) 56
Drain Silting 372
Auto Workers 80
DTD 173
Tractor workers 72
Lorry + Dumper placer + Compactors workers
100
Total Manpower Available 1317
Manpower requirement
DTD (residential) 558
Street sweeping and drain silt 2260 (one person for 500m)
For running autos 110
Night sweeping 56
For Tippers 12
For Tractors 42
For Dumper Placers 10
For Compactors 2
For Lorries 36
Total Manpower required 3086
Total Manpower Gap 1769 Source: Analyzed by ICLEI South Asia
7.8.2 Sufficiency of secondary collection bins:
Total of 137 bins with each bin at capacity 3 Cu.m that carry around 205 tonnes of waste are
available in the city. As per the CPHEEO norms, ULBs should provide for the storage capacity
which is 20% more than the expected daily in flow of waste. There is a need to provide storage
capacity for at least 344 TPD of waste. With the capacity to store 205 TPD of waste already in
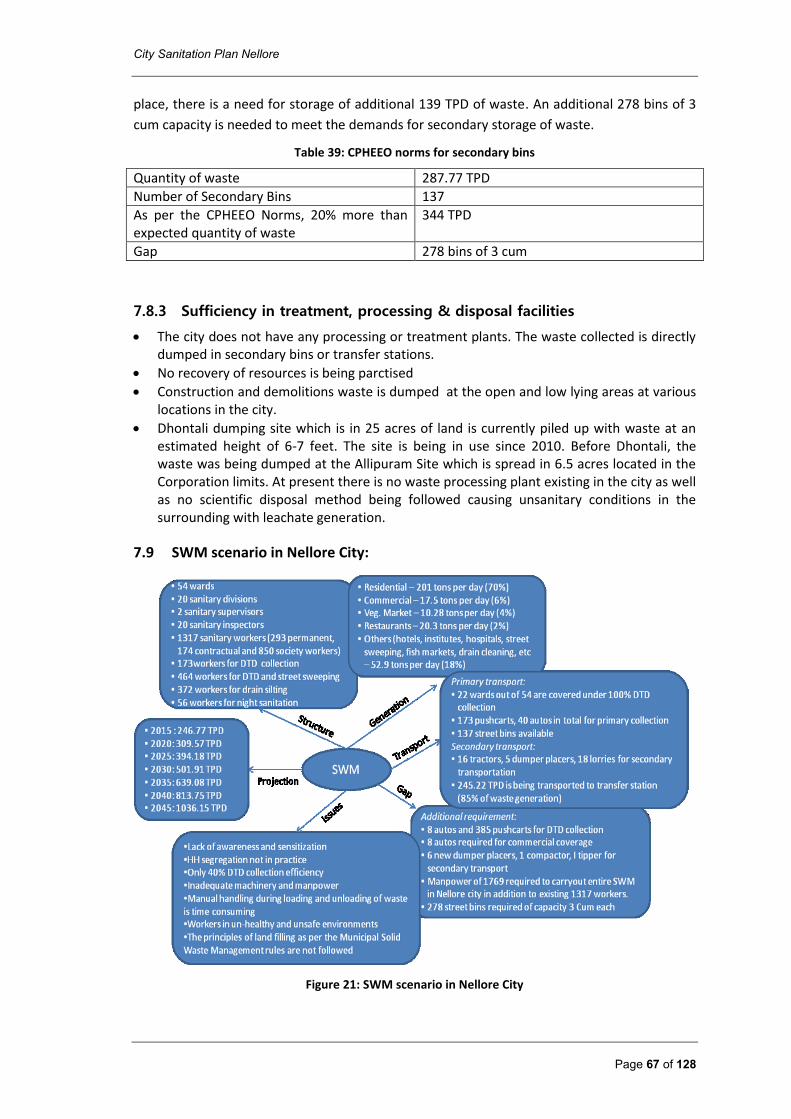
City Sanitation Plan Nellore
Page 67 of 128
place, there is a need for storage of additional 139 TPD of waste. An additional 278 bins of 3
cum capacity is needed to meet the demands for secondary storage of waste.
Table 39: CPHEEO norms for secondary bins
Quantity of waste 287.77 TPD
Number of Secondary Bins 137
As per the CPHEEO Norms, 20% more than expected quantity of waste
344 TPD
Gap 278 bins of 3 cum
7.8.3 Sufficiency in treatment, processing & disposal facilities
The city does not have any processing or treatment plants. The waste collected is directly dumped in secondary bins or transfer stations.
No recovery of resources is being parctised
Construction and demolitions waste is dumped at the open and low lying areas at various locations in the city.
Dhontali dumping site which is in 25 acres of land is currently piled up with waste at an estimated height of 6-7 feet. The site is being in use since 2010. Before Dhontali, the waste was being dumped at the Allipuram Site which is spread in 6.5 acres located in the Corporation limits. At present there is no waste processing plant existing in the city as well as no scientific disposal method being followed causing unsanitary conditions in the surrounding with leachate generation.
7.9 SWM scenario in Nellore City:
Figure 21: SWM scenario in Nellore City
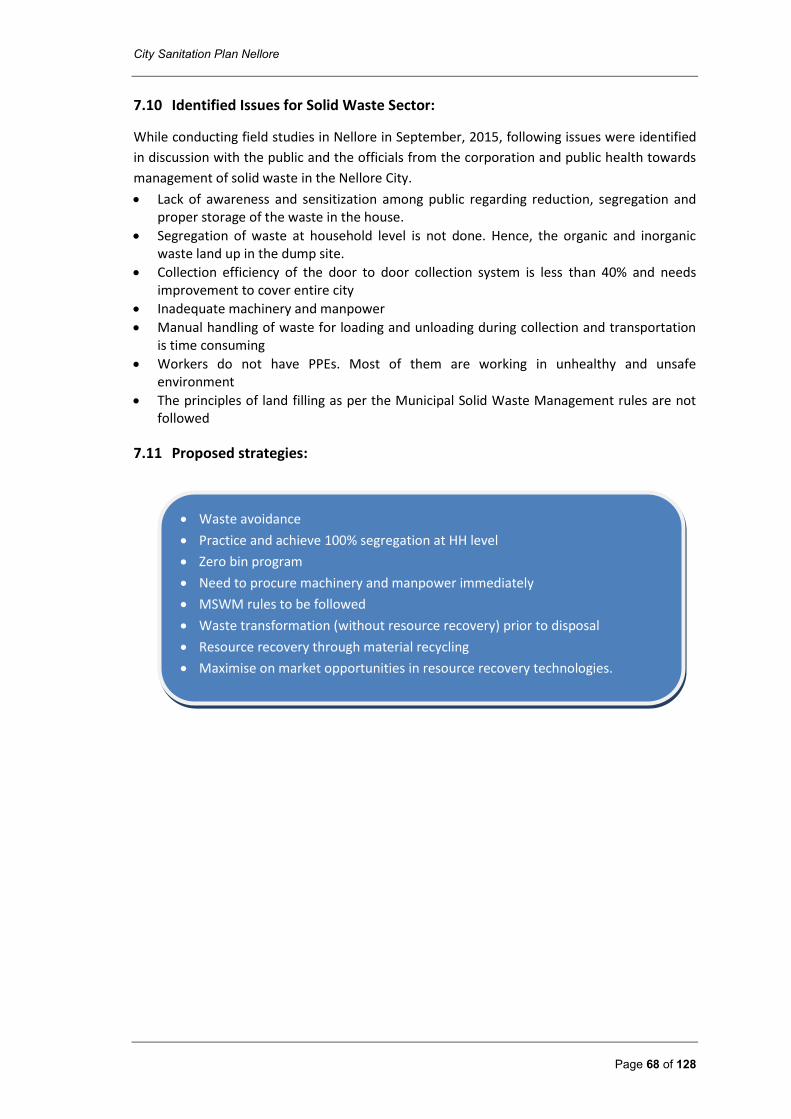
City Sanitation Plan Nellore
Page 68 of 128
Waste avoidance
Practice and achieve 100% segregation at HH level
Zero bin program
Need to procure machinery and manpower immediately
MSWM rules to be followed
Waste transformation (without resource recovery) prior to disposal
Resource recovery through material recycling
Maximise on market opportunities in resource recovery technologies.
7.10 Identified Issues for Solid Waste Sector:
While conducting field studies in Nellore in September, 2015, following issues were identified
in discussion with the public and the officials from the corporation and public health towards
management of solid waste in the Nellore City.
Lack of awareness and sensitization among public regarding reduction, segregation and proper storage of the waste in the house.
Segregation of waste at household level is not done. Hence, the organic and inorganic waste land up in the dump site.
Collection efficiency of the door to door collection system is less than 40% and needs improvement to cover entire city
Inadequate machinery and manpower
Manual handling of waste for loading and unloading during collection and transportation is time consuming
Workers do not have PPEs. Most of them are working in unhealthy and unsafe environment
The principles of land filling as per the Municipal Solid Waste Management rules are not followed
7.11 Proposed strategies:

City Sanitation Plan Nellore
Page 69 of 128
8 IMPLEMENTATION PLAN
During the project period, the current issues that affect the growth of Water Supply,
Sanitation, Storm Water Drainage and Solid Waste Management sectors along with the
existing situations, practices and ongoing central and state schemes for the improvement of
the same were studied and analyzed considering future demand till 2045. Based on the
analysis developed on the current sanitation situations/practices, certain strategies for the
development of the said sectors that suit for Nellore city are recommended.
This chapter summarizes the recommendations and strategies that have been addressed for
the development of sanitation situation in the Nellore City optimally. To recommend the best
suitable measures for each and every sector, the city has been categorized into 4 zones -
North bank of River Penna; Saturated Zone (South bank of River Penna); Developing Zone
(South bank of River Penna) and Agricultural Zone (South bank of River Penna) as depicted in
the figure below.
Figure 22: Categorisation of Zones
Considering that CSP’s mandate is to understand and develop all aspects of safe and
sustainable sanitation, that includes strategic, technical and managerial interventions, the
main concerns were classified into Hardware and Software components while planning a
sanitation strategy for Nellore city. Software component address institutional roles and
responsibilities, awareness generation and capacity building, while Hardware component
address the technologies, designs and the implementation strategies keeping in mind
sustained improvements, which reaches the un-served and poor in a city-wide approach.
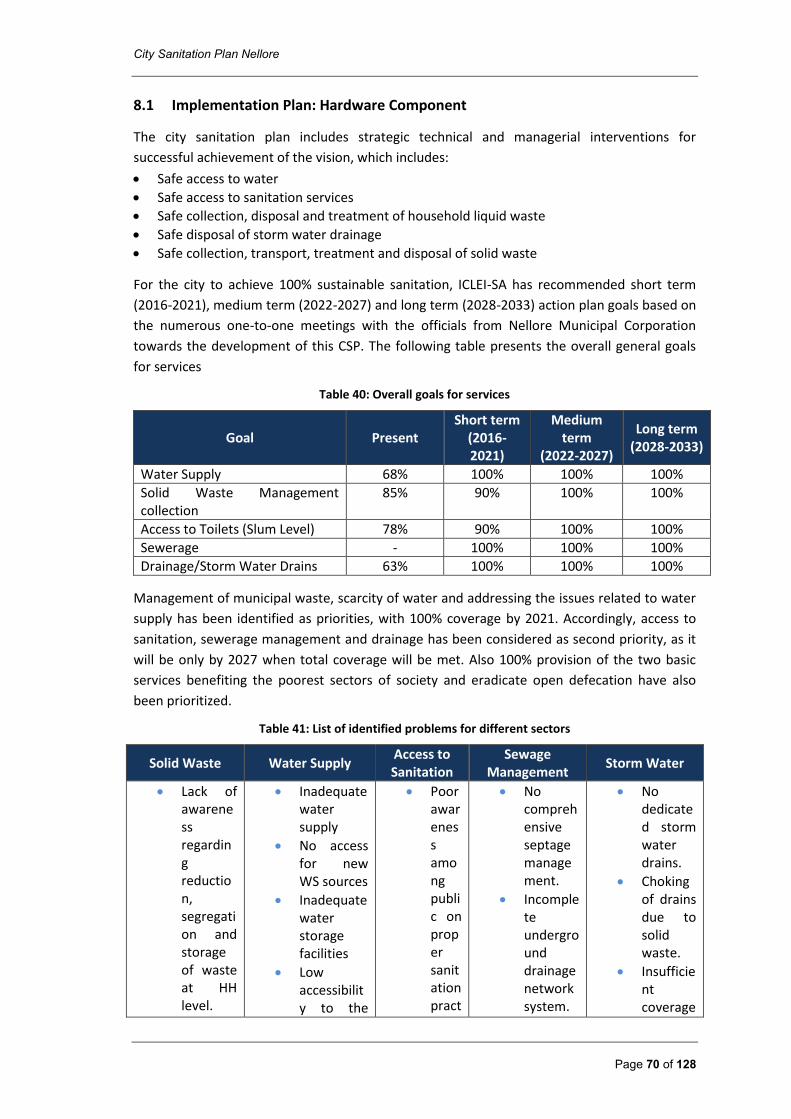
City Sanitation Plan Nellore
Page 70 of 128
8.1 Implementation Plan: Hardware Component
The city sanitation plan includes strategic technical and managerial interventions for
successful achievement of the vision, which includes:
Safe access to water
Safe access to sanitation services
Safe collection, disposal and treatment of household liquid waste
Safe disposal of storm water drainage
Safe collection, transport, treatment and disposal of solid waste
For the city to achieve 100% sustainable sanitation, ICLEI-SA has recommended short term
(2016-2021), medium term (2022-2027) and long term (2028-2033) action plan goals based on
the numerous one-to-one meetings with the officials from Nellore Municipal Corporation
towards the development of this CSP. The following table presents the overall general goals
for services
Table 40: Overall goals for services
Goal Present Short term
(2016-2021)
Medium term
(2022-2027)
Long term (2028-2033)
Water Supply 68% 100% 100% 100%
Solid Waste Management collection
85% 90% 100% 100%
Access to Toilets (Slum Level) 78% 90% 100% 100%
Sewerage - 100% 100% 100%
Drainage/Storm Water Drains 63% 100% 100% 100%
Management of municipal waste, scarcity of water and addressing the issues related to water
supply has been identified as priorities, with 100% coverage by 2021. Accordingly, access to
sanitation, sewerage management and drainage has been considered as second priority, as it
will be only by 2027 when total coverage will be met. Also 100% provision of the two basic
services benefiting the poorest sectors of society and eradicate open defecation have also
been prioritized.
Table 41: List of identified problems for different sectors
Solid Waste Water Supply Access to Sanitation
Sewage Management
Storm Water
Lack of awareness regarding reduction, segregation and storage of waste at HH level.
Inadequate water supply
No access for new WS sources
Inadequate water storage facilities
Low accessibility to the
Poor awareness among public on proper sanitation pract
No comprehensive septage management.
Incomplete underground drainage network system.
No dedicated storm water drains.
Choking of drains due to solid waste.
Insufficient coverage
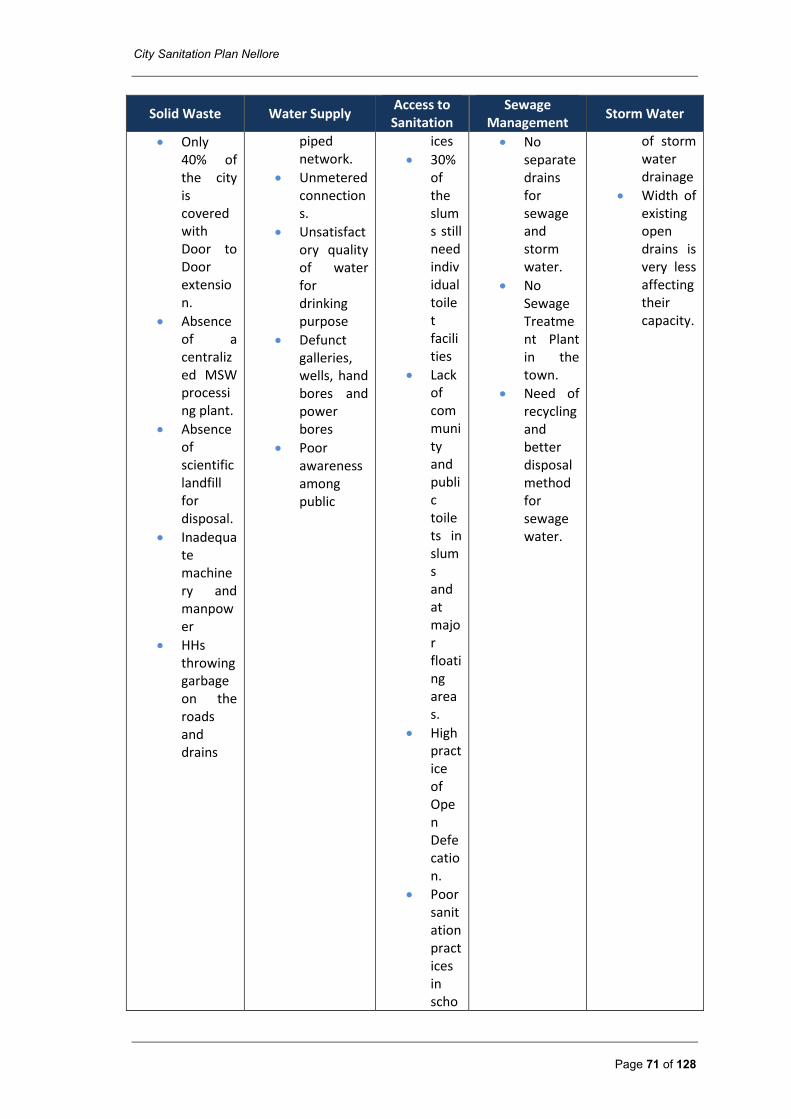
City Sanitation Plan Nellore
Page 71 of 128
Solid Waste Water Supply Access to Sanitation
Sewage Management
Storm Water
Only 40% of the city is covered with Door to Door extension.
Absence of a centralized MSW processing plant.
Absence of scientific landfill for disposal.
Inadequate machinery and manpower
HHs throwing garbage on the roads and drains
piped network.
Unmetered connections.
Unsatisfactory quality of water for drinking purpose
Defunct galleries, wells, hand bores and power bores
Poor awareness among public
ices
30% of the slums still need individual toilet facilities
Lack of community and public toilets in slums and at major floating areas.
High practice of Open Defecation.
Poor sanitation practices in scho
No separate drains for sewage and storm water.
No Sewage Treatment Plant in the town.
Need of recycling and better disposal method for sewage water.
of storm water drainage
Width of existing open drains is very less affecting their capacity.
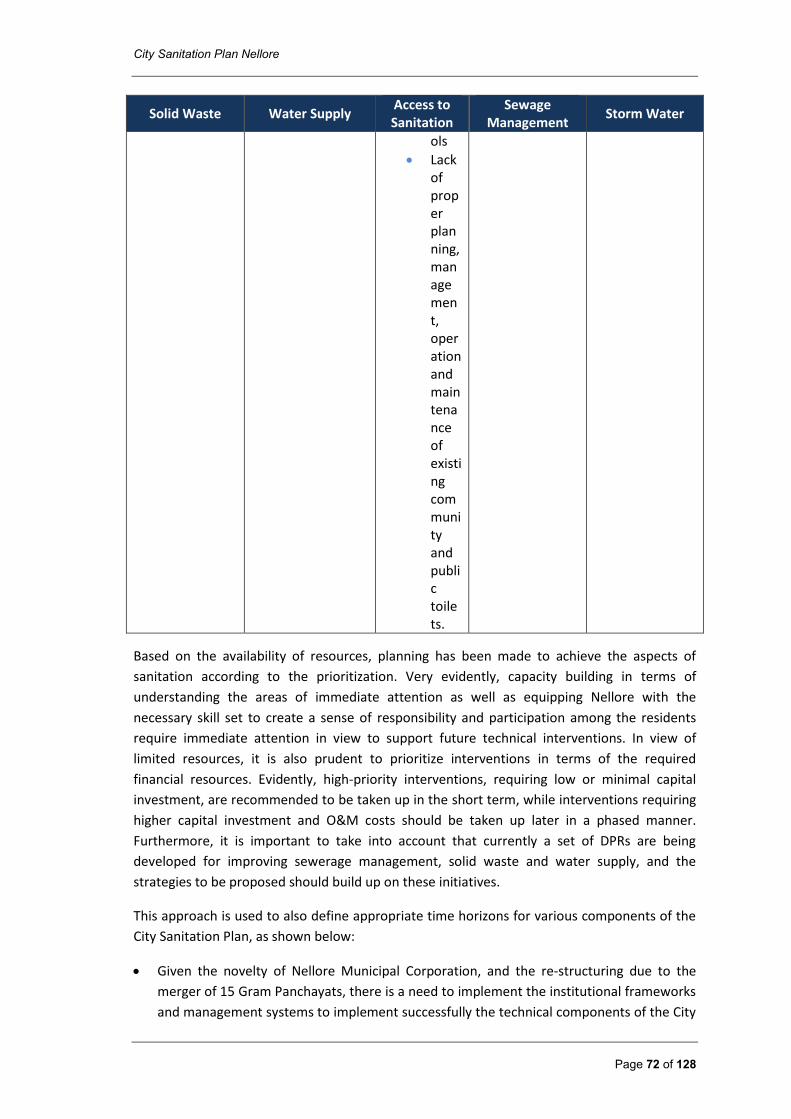
City Sanitation Plan Nellore
Page 72 of 128
Solid Waste Water Supply Access to Sanitation
Sewage Management
Storm Water
ols
Lack of proper planning, management, operation and maintenance of existing community and public toilets.
Based on the availability of resources, planning has been made to achieve the aspects of
sanitation according to the prioritization. Very evidently, capacity building in terms of
understanding the areas of immediate attention as well as equipping Nellore with the
necessary skill set to create a sense of responsibility and participation among the residents
require immediate attention in view to support future technical interventions. In view of
limited resources, it is also prudent to prioritize interventions in terms of the required
financial resources. Evidently, high-priority interventions, requiring low or minimal capital
investment, are recommended to be taken up in the short term, while interventions requiring
higher capital investment and O&M costs should be taken up later in a phased manner.
Furthermore, it is important to take into account that currently a set of DPRs are being
developed for improving sewerage management, solid waste and water supply, and the
strategies to be proposed should build up on these initiatives.
This approach is used to also define appropriate time horizons for various components of the
City Sanitation Plan, as shown below:
Given the novelty of Nellore Municipal Corporation, and the re-structuring due to the
merger of 15 Gram Panchayats, there is a need to implement the institutional frameworks
and management systems to implement successfully the technical components of the City
City Sanitation Plan Nellore
Page 73 of 128
Sanitation Plan. Without a proper monitoring and O&M system it is not possible to ensure
the sustainability of the actions. The managerial systems and institutional set up should be
first priority, and should be completed in a matter of year.
The current sewerage system in the city is defunct and only 8.7% of the city is provided
with sewerage network. While implementing the approved “Comprehensive UGD
Scheme”, the sewerage network needs to be designed and sized for a long time horizon.
The main sewers and intercepting sewers may be designed and constructed to
accommodate even the future flows from areas which are developed in stages during the
25 year horizon period as the periodic duplication of the works is not possible at short
intervals. However, the network of branch sewers and laterals to be designed during the
initial stage will cover only the existing road network and as and when new roads develop,
this network will have to be extended in stages.
Facilities like individual toilets, public toilets, community toilets and roadside drains
should be designed considering the present population and incremental population while
planning the need at the early stages of requirement and construction. While some
components like sewerage treatment plants and pumping stations can be developed in
modular fashion in stages as the demand develops.
While developing initiatives in improving Solid Waste Management services, it is
necessary to consider future demand for another 25 years from the current year. A zero
bin city concept would bring in environmental, economical and financial benefits to the
city, which can be implemented in stages started at one ward and expand it to the entire
city.
Activities towards eradicating open defecation have to be started immediately.
The specific goal, timeframe to achieve the goal and strategies are proposed in the following
section based on the baseline status of each of the service sector:
Goal 1: Proposed strategies for Water Supply
Drinking water supply is a very important parameter for upkeep of sanitation facilities and
environment/health status. Poor quality of water as well as insufficient quality of potable
water can pose serious public health hazardous water borne diseases that are quite common
in the cities, particularly among the urban poor. Hence it is considered to include a
performance indicator for drinking water sector. Hence drinking water supply is also taken
into consideration as one of the element of CSP.
Given the demand-supply gap of nearly 38.42 MLD at present within NMC, there is a need to
explore and implement options to generate water. Per capita supply is at 85 lpcd, as against
service level norm of 135 lpcd. Supply frequency is for 4 hours daily and household service
connections account for only 26.5%.
With the absence of bulk flow metering, in the network, reported network losses cannot be
validated. There is no regular monitoring of ground water status. Power cost for operating
bore-wells based network is observed to be significantly higher relative. These issues in
City Sanitation Plan Nellore
Page 74 of 128
service delivery reflect in low Cost recovery and poor Collection efficiency levels. The table
below summarizes the issues presently posing serious threat in Nellore.
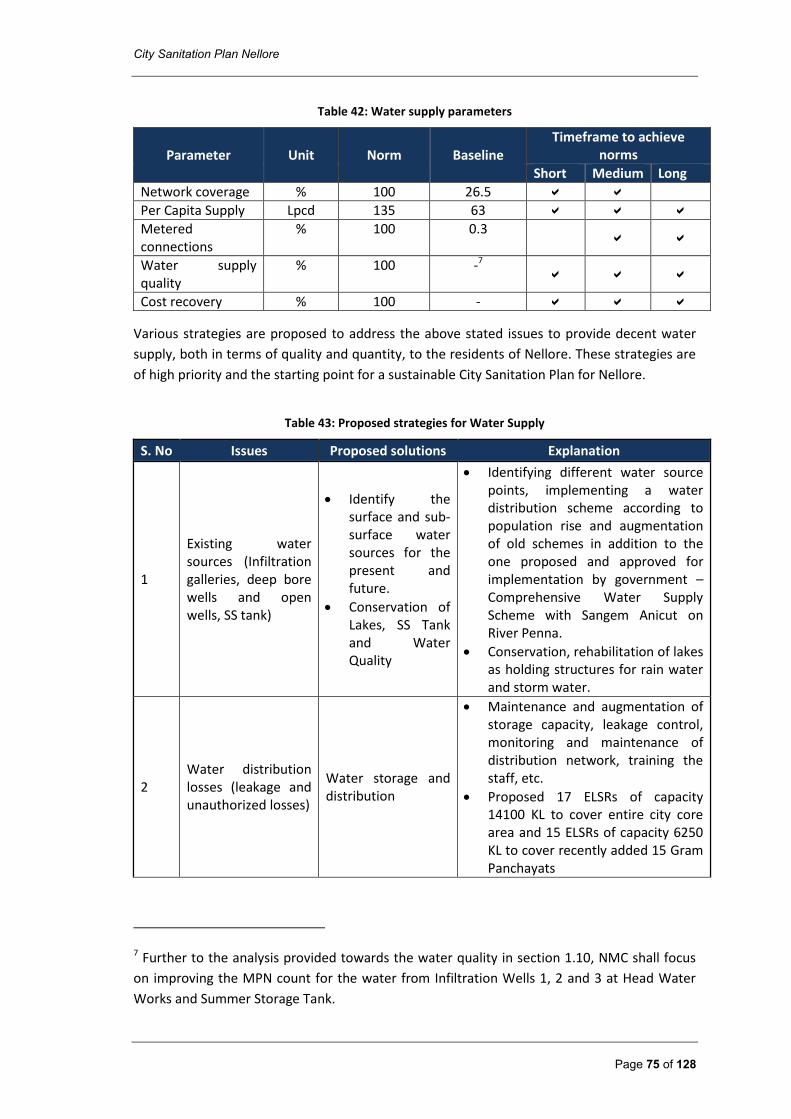
City Sanitation Plan Nellore
Page 75 of 128
Table 42: Water supply parameters
Parameter Unit Norm Baseline Timeframe to achieve
norms
Short Medium Long
Network coverage % 100 26.5
Per Capita Supply Lpcd 135 63
Metered connections
% 100 0.3
Water supply quality
% 100 -7
Cost recovery % 100 -
Various strategies are proposed to address the above stated issues to provide decent water
supply, both in terms of quality and quantity, to the residents of Nellore. These strategies are
of high priority and the starting point for a sustainable City Sanitation Plan for Nellore.
Table 43: Proposed strategies for Water Supply
S. No Issues Proposed solutions Explanation
1
Existing water sources (Infiltration galleries, deep bore wells and open wells, SS tank)
Identify the surface and sub-surface water sources for the present and future.
Conservation of Lakes, SS Tank and Water Quality
Identifying different water source points, implementing a water distribution scheme according to population rise and augmentation of old schemes in addition to the one proposed and approved for implementation by government – Comprehensive Water Supply Scheme with Sangem Anicut on River Penna.
Conservation, rehabilitation of lakes as holding structures for rain water and storm water.
2 Water distribution losses (leakage and unauthorized losses)
Water storage and distribution
Maintenance and augmentation of storage capacity, leakage control, monitoring and maintenance of distribution network, training the staff, etc.
Proposed 17 ELSRs of capacity 14100 KL to cover entire city core area and 15 ELSRs of capacity 6250 KL to cover recently added 15 Gram Panchayats
7 Further to the analysis provided towards the water quality in section 1.10, NMC shall focus
on improving the MPN count for the water from Infiltration Wells 1, 2 and 3 at Head Water
Works and Summer Storage Tank.
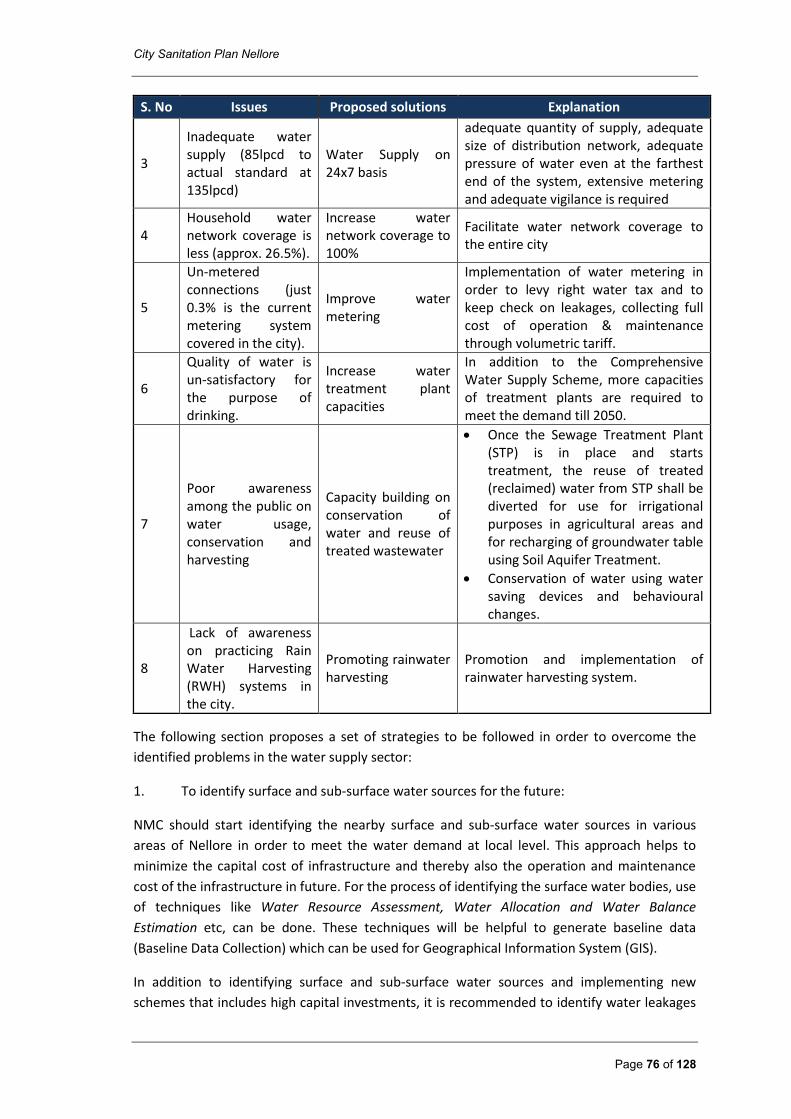
City Sanitation Plan Nellore
Page 76 of 128
S. No Issues Proposed solutions Explanation
3
Inadequate water supply (85lpcd to actual standard at 135lpcd)
Water Supply on 24x7 basis
adequate quantity of supply, adequate size of distribution network, adequate pressure of water even at the farthest end of the system, extensive metering and adequate vigilance is required
4 Household water network coverage is less (approx. 26.5%).
Increase water network coverage to 100%
Facilitate water network coverage to the entire city
5
Un-metered connections (just 0.3% is the current metering system covered in the city).
Improve water metering
Implementation of water metering in order to levy right water tax and to keep check on leakages, collecting full cost of operation & maintenance through volumetric tariff.
6
Quality of water is un-satisfactory for the purpose of drinking.
Increase water treatment plant capacities
In addition to the Comprehensive Water Supply Scheme, more capacities of treatment plants are required to meet the demand till 2050.
7
Poor awareness among the public on water usage, conservation and harvesting
Capacity building on conservation of water and reuse of treated wastewater
Once the Sewage Treatment Plant (STP) is in place and starts treatment, the reuse of treated (reclaimed) water from STP shall be diverted for use for irrigational purposes in agricultural areas and for recharging of groundwater table using Soil Aquifer Treatment.
Conservation of water using water saving devices and behavioural changes.
8
Lack of awareness on practicing Rain Water Harvesting (RWH) systems in the city.
Promoting rainwater harvesting
Promotion and implementation of rainwater harvesting system.
The following section proposes a set of strategies to be followed in order to overcome the
identified problems in the water supply sector:
1. To identify surface and sub-surface water sources for the future:
NMC should start identifying the nearby surface and sub-surface water sources in various
areas of Nellore in order to meet the water demand at local level. This approach helps to
minimize the capital cost of infrastructure and thereby also the operation and maintenance
cost of the infrastructure in future. For the process of identifying the surface water bodies, use
of techniques like Water Resource Assessment, Water Allocation and Water Balance
Estimation etc, can be done. These techniques will be helpful to generate baseline data
(Baseline Data Collection) which can be used for Geographical Information System (GIS).
In addition to identifying surface and sub-surface water sources and implementing new
schemes that includes high capital investments, it is recommended to identify water leakages
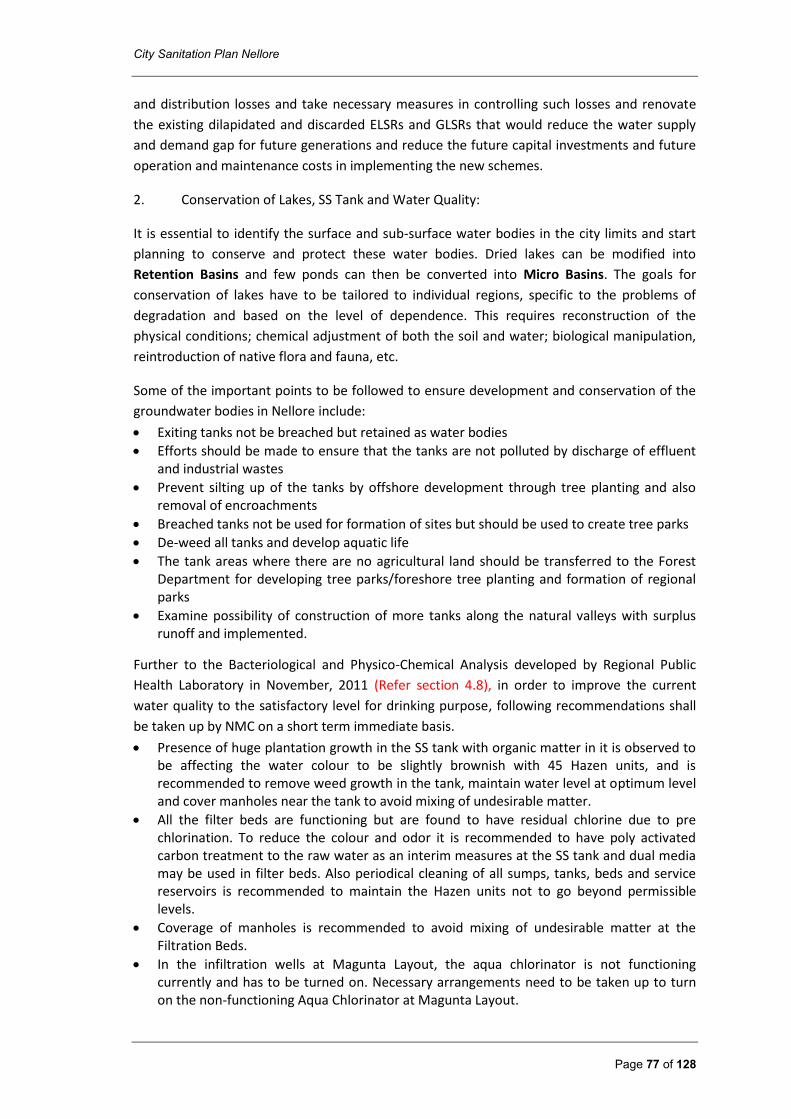
City Sanitation Plan Nellore
Page 77 of 128
and distribution losses and take necessary measures in controlling such losses and renovate
the existing dilapidated and discarded ELSRs and GLSRs that would reduce the water supply
and demand gap for future generations and reduce the future capital investments and future
operation and maintenance costs in implementing the new schemes.
2. Conservation of Lakes, SS Tank and Water Quality:
It is essential to identify the surface and sub-surface water bodies in the city limits and start
planning to conserve and protect these water bodies. Dried lakes can be modified into
Retention Basins and few ponds can then be converted into Micro Basins. The goals for
conservation of lakes have to be tailored to individual regions, specific to the problems of
degradation and based on the level of dependence. This requires reconstruction of the
physical conditions; chemical adjustment of both the soil and water; biological manipulation,
reintroduction of native flora and fauna, etc.
Some of the important points to be followed to ensure development and conservation of the
groundwater bodies in Nellore include:
Exiting tanks not be breached but retained as water bodies
Efforts should be made to ensure that the tanks are not polluted by discharge of effluent and industrial wastes
Prevent silting up of the tanks by offshore development through tree planting and also removal of encroachments
Breached tanks not be used for formation of sites but should be used to create tree parks
De-weed all tanks and develop aquatic life
The tank areas where there are no agricultural land should be transferred to the Forest Department for developing tree parks/foreshore tree planting and formation of regional parks
Examine possibility of construction of more tanks along the natural valleys with surplus runoff and implemented.
Further to the Bacteriological and Physico-Chemical Analysis developed by Regional Public
Health Laboratory in November, 2011 (Refer section 4.8), in order to improve the current
water quality to the satisfactory level for drinking purpose, following recommendations shall
be taken up by NMC on a short term immediate basis.
Presence of huge plantation growth in the SS tank with organic matter in it is observed to be affecting the water colour to be slightly brownish with 45 Hazen units, and is recommended to remove weed growth in the tank, maintain water level at optimum level and cover manholes near the tank to avoid mixing of undesirable matter.
All the filter beds are functioning but are found to have residual chlorine due to pre chlorination. To reduce the colour and odor it is recommended to have poly activated carbon treatment to the raw water as an interim measures at the SS tank and dual media may be used in filter beds. Also periodical cleaning of all sumps, tanks, beds and service reservoirs is recommended to maintain the Hazen units not to go beyond permissible levels.
Coverage of manholes is recommended to avoid mixing of undesirable matter at the Filtration Beds.
In the infiltration wells at Magunta Layout, the aqua chlorinator is not functioning currently and has to be turned on. Necessary arrangements need to be taken up to turn on the non-functioning Aqua Chlorinator at Magunta Layout.
City Sanitation Plan Nellore
Page 78 of 128
Periodic cleaning of sumps, OHTs, regular and adequate chlorination and maintenance of a log book at reservoirs and in the distribution system to have a regular check on the residual chlorine levels.
Maintain residual chlorine at 1.0 to 2.0 PPM in view of recent floods to avoid water borne diseases.
3. Rainwater harvesting (Water Reuse & Ground Water Recharging):
Rain water harvesting can also provide with an alternative source of water. Nellore receives an
annual rainfall of 900 to 1200 mm, which means minimum of 630 Cu.m of rain water can be
harvested per square meter of area at roof catchments, and 450 liters at ground surface
coverings.
Calculation: Water harvesting potential = Rainfall (mm) x Area of catchment x Runoff
Coefficient. Runoff coefficient for roof catchments varies from 0.7 to 0.9 and for ground
surface coverings it varies from 0.5 to 0.8.
With minimal amount of treatment this harvested rain water can be used for various non
potable domestic purposes. With some extra treatment like filtration, UV/Ozonation, etc, it
can be used for potable purposes too. Thus water can be harvested and put to use locally with
minimal amount of investment.
To spread the awareness about the rain water harvesting, NMC can take up awareness
campaigns on mass scale. Also incentives can be given to the citizens and colonies who
implement rain water harvesting. Incentives can be in the form of rebate over property tax or
water tax. Rain water harvesting should be made mandatory in institutional set-up like
apartments, public buildings, institutions, hospitals, schools and colleges, industrial and
commercial properties, etc. immediately as these kind of properties generally have huge roof
area and also paved surface which are helpful for rain water harvesting. Another way of
promoting rain water harvesting is creating entrepreneur opportunities for the young people.
As per the guidelines provided in G.O.Ms. No. 350 MA, 10% rebate on the tax can be provided
to the owners of the buildings who have adopted both recycling of waste water and rain water
harvesting structures. As stated in the G.O.Ms.No. 350 MA, rainwater harvesting shall be
made mandatory to take up in all the new and existing buildings in Nellore with an area of 300
Sqm or above in their premises, and household level or community level rain water harvesting
shall be immediately taken up in areas where the water is supplied through tankers - Shivaji
Nagar, Samatha Nagar, Bhagath Singh Colony, Nagamma Colony, BujaBuja Nellore, Yadava
Palem, RTC colony, Talpagiri colony, Vikalangula colony, Kothuru Choutamitta, Kothuru Shivaji
Colony, Chandra Babu Nagar, Sramika Nagar, Valluramma Colony, YSR Nagar, Ram Nagar,
Nethaji Nagar and Janardhan Reddy colony and in wards where the water is supplied just for 2
hours in a day – 26, 31, 32, 53 and 54.
It is estimated that for constructing 5000-10000 litres capacity of rain water harvesting unit at
household level with family size of 4 using around 15000 litres per month, the unit would cost
between 13,000 – 16,000/-, and at the community level for 1000 HHs to harvest 170 million
litres annually would cost around Rs. 4.5 lakhs.
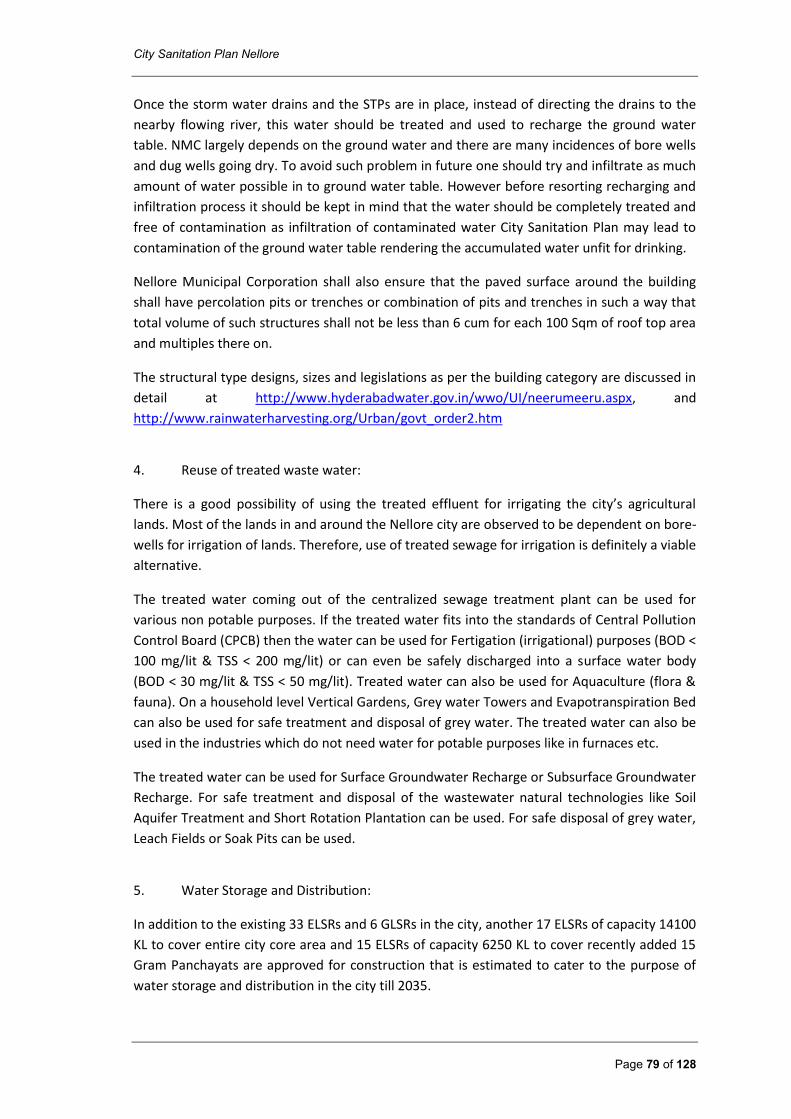
City Sanitation Plan Nellore
Page 79 of 128
Once the storm water drains and the STPs are in place, instead of directing the drains to the
nearby flowing river, this water should be treated and used to recharge the ground water
table. NMC largely depends on the ground water and there are many incidences of bore wells
and dug wells going dry. To avoid such problem in future one should try and infiltrate as much
amount of water possible in to ground water table. However before resorting recharging and
infiltration process it should be kept in mind that the water should be completely treated and
free of contamination as infiltration of contaminated water City Sanitation Plan may lead to
contamination of the ground water table rendering the accumulated water unfit for drinking.
Nellore Municipal Corporation shall also ensure that the paved surface around the building
shall have percolation pits or trenches or combination of pits and trenches in such a way that
total volume of such structures shall not be less than 6 cum for each 100 Sqm of roof top area
and multiples there on.
The structural type designs, sizes and legislations as per the building category are discussed in
detail at http://www.hyderabadwater.gov.in/wwo/UI/neerumeeru.aspx, and
http://www.rainwaterharvesting.org/Urban/govt_order2.htm
4. Reuse of treated waste water:
There is a good possibility of using the treated effluent for irrigating the city’s agricultural
lands. Most of the lands in and around the Nellore city are observed to be dependent on bore-
wells for irrigation of lands. Therefore, use of treated sewage for irrigation is definitely a viable
alternative.
The treated water coming out of the centralized sewage treatment plant can be used for
various non potable purposes. If the treated water fits into the standards of Central Pollution
Control Board (CPCB) then the water can be used for Fertigation (irrigational) purposes (BOD <
100 mg/lit & TSS < 200 mg/lit) or can even be safely discharged into a surface water body
(BOD < 30 mg/lit & TSS < 50 mg/lit). Treated water can also be used for Aquaculture (flora &
fauna). On a household level Vertical Gardens, Grey water Towers and Evapotranspiration Bed
can also be used for safe treatment and disposal of grey water. The treated water can also be
used in the industries which do not need water for potable purposes like in furnaces etc.
The treated water can be used for Surface Groundwater Recharge or Subsurface Groundwater
Recharge. For safe treatment and disposal of the wastewater natural technologies like Soil
Aquifer Treatment and Short Rotation Plantation can be used. For safe disposal of grey water,
Leach Fields or Soak Pits can be used.
5. Water Storage and Distribution:
In addition to the existing 33 ELSRs and 6 GLSRs in the city, another 17 ELSRs of capacity 14100
KL to cover entire city core area and 15 ELSRs of capacity 6250 KL to cover recently added 15
Gram Panchayats are approved for construction that is estimated to cater to the purpose of
water storage and distribution in the city till 2035.

City Sanitation Plan Nellore
Page 80 of 128
The connection to the Saturated zone of Nellore city should be increased on priority. Later the
connections to the Growth zones can be increased as after identification of the water sources.
In the Growth zone, infrastructural work related to distribution of water should be done
keeping in mind the future increase in the population.
6. Supply of water on 24x7 basis:
To ensure continuous water supply without break for 24 hours a day, 7 days in a week and for
365 days in a year, adequate quantity of supply, adequate size of distribution network,
adequate pressure of water even at the farthest end of the system, extensive metering and
adequate vigilance is very important. Therefore, to achieve continuous supply of water
without break following recommendations are put for immediate implementation
Provide adequate number of bulk meters at strategic locations to ensure regular monitoring of water flow
Withdraw the system of free supply of water through street and public stand posts
Initiate metering system towards all the services like industrial, institutional, commercial, domestic, public and semi-public, etc
Minimize leakage losses at all levels
Create consumer redresser cell
Disconnect all illegal connections
Set up efficient O&M
Awareness to the public and the officials on water scarcity and its value
7. Increase water treatment plant capacities
North of River Penna comprising of 5% of the total Nellore population was earlier served
through an infiltration gallery but later through ground water sources as dried up. The
recently commissioned 5 MLD infiltration well and rising main is expected to take care of the
demand till another decade.
The South of River Penna which is currently served by HWW and Kothuru Phase I is sanctioned
with a 122 MLD WTP that is expected to serve the city water demand till 2031. This project is
currently under execution and is expected to be ready by end 2019. In addition to this it is also
proposed to augment 122 MLD WTP with another 30 MLD WTP under Phase II to serve the
city water demand till 2035. Public Health Engineering Department has also sanctioned 32
ELSRs in the city for the water storage and distribution.
Considering the aforementioned 2 water treatment plants would serve till 2035, it is also
recommended to initiate below listed projects proposed by Lahmeyer GKW consultants in
their study in 2011 that would add another 148 MLD to serve the city water supply demand till
2050 (demand in 2050 is estimated to be 383 MLD).
Construction of 18 MLD WTP near Kothuru - Phase II
Construction of 65 MLD WTP near Kondlapudi – Phase I
Construction of another 65 MLD WTP (Phase II) near Kondlapudi as augmentation to the Phase I
City Sanitation Plan Nellore
Page 81 of 128
8. Water Metering
100% water metering has to be initiated in the city. The existing unmetered connections and
the new connections should be fitted with meters and metering of water should be done.
Once the connections are installed with water meters, water pricing on volumetric bases can
play vital role in effective implementation of water meters and will also lead to increase in the
cost recovery.
Water audits should be conducted for various colonies and zones to keep a check on illegal or
unmetered tapping of water and leakages. Leakage control can play a vital role to reduce
transmission and distribution losses, which are usually high in a centralized water distribution
system.
Metering alone can ensure 20% reduction in water consumption. This has been proved in
practice where metering system has been introduced. Flow meters may also be installed at all
un-metered supply points to provide complete monitoring of flows into each supply zone and
district metered area. Consideration will be given to the type of meter, duly comparing their
effectiveness, installation cost and maintenance cost. Domestic meters are covered by IS 779
and bulk meters are covered by IS 2373. The ULBs must have a dedicated staff who will take
immediate action on repair/replacement of defective meters.
Collecting Full Cost of Operation & Maintenance through Volumetric Tariff: Water and
wastewater tariffs determine the level of revenues that service providers receives from users
in centralized or semi-centralized systems. Water pricing is seen as an important economic
instrument for improving water use efficiency, enhancing social equity and securing financial
sustainability of water utilities and operators. In a uniform volumetric charge, or constant
volumetric tariff, all water units are priced the same independent of the use, and consumers
pay proportionally to their water consumption. With this type of tariff, all consumers
(domestic, industrial and commercial) pay the same unit rate, and their water bill corresponds
directly to the quantity of water consumed. The constant volumetric tariff can be designed as
a single tariff or as a two part tariff combined with a fixed charge. Volumetric price schemes
present several advantages: first of all is easy to understand for consumers - because it is how
most other commodities are priced – furthermore it sends a clear signal to the consumers
about the cost of supplying them with additional water. Moreover, the tariff incorporates the
concept of water conservation as the water bill increases with consumption.
9. Conservation of Water (Awareness programmes for Citizens)
In addition towards the steps in improving municipal water supply system, NMC should also develop a comprehensive awareness drive in collaboration with local NGO’s, CBOs, schools and other institutions for promoting water conservation in the city. The community needs to realize that water is an important limited commodity and hence needs to be conserved. There are various ways by which water can be conserved at household level by using water efficient devices/products or by adopting minor changes in the behavioural practices for efficient water usage. Programmes for farmers may also be conducted for promoting sustainable agricultural practices such as drip irrigation, reuse of treated wastewater for irrigation etc.
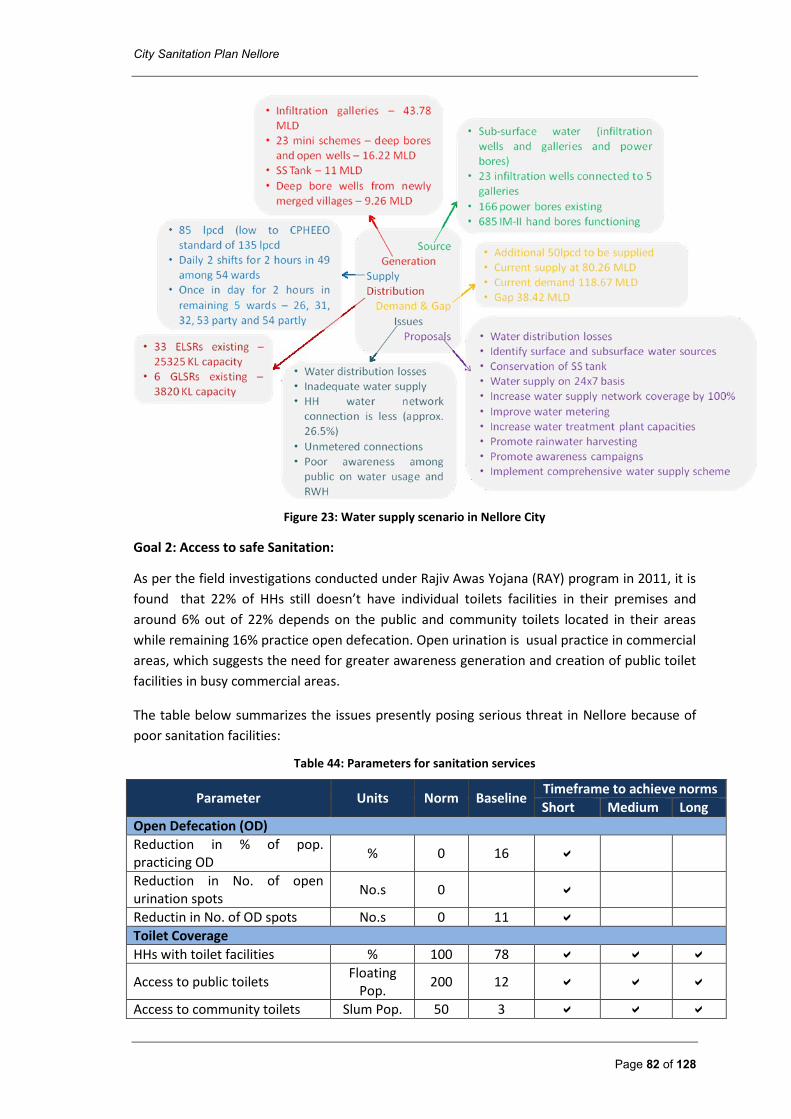
City Sanitation Plan Nellore
Page 82 of 128
Figure 23: Water supply scenario in Nellore City
Goal 2: Access to safe Sanitation:
As per the field investigations conducted under Rajiv Awas Yojana (RAY) program in 2011, it is
found that 22% of HHs still doesn’t have individual toilets facilities in their premises and
around 6% out of 22% depends on the public and community toilets located in their areas
while remaining 16% practice open defecation. Open urination is usual practice in commercial
areas, which suggests the need for greater awareness generation and creation of public toilet
facilities in busy commercial areas.
The table below summarizes the issues presently posing serious threat in Nellore because of
poor sanitation facilities:
Table 44: Parameters for sanitation services
Parameter Units Norm Baseline Timeframe to achieve norms
Short Medium Long
Open Defecation (OD)
Reduction in % of pop. practicing OD
% 0 16
Reduction in No. of open urination spots
No.s 0
Reductin in No. of OD spots No.s 0 11
Toilet Coverage
HHs with toilet facilities % 100 78
Access to public toilets Floating
Pop. 200 12
Access to community toilets Slum Pop. 50 3
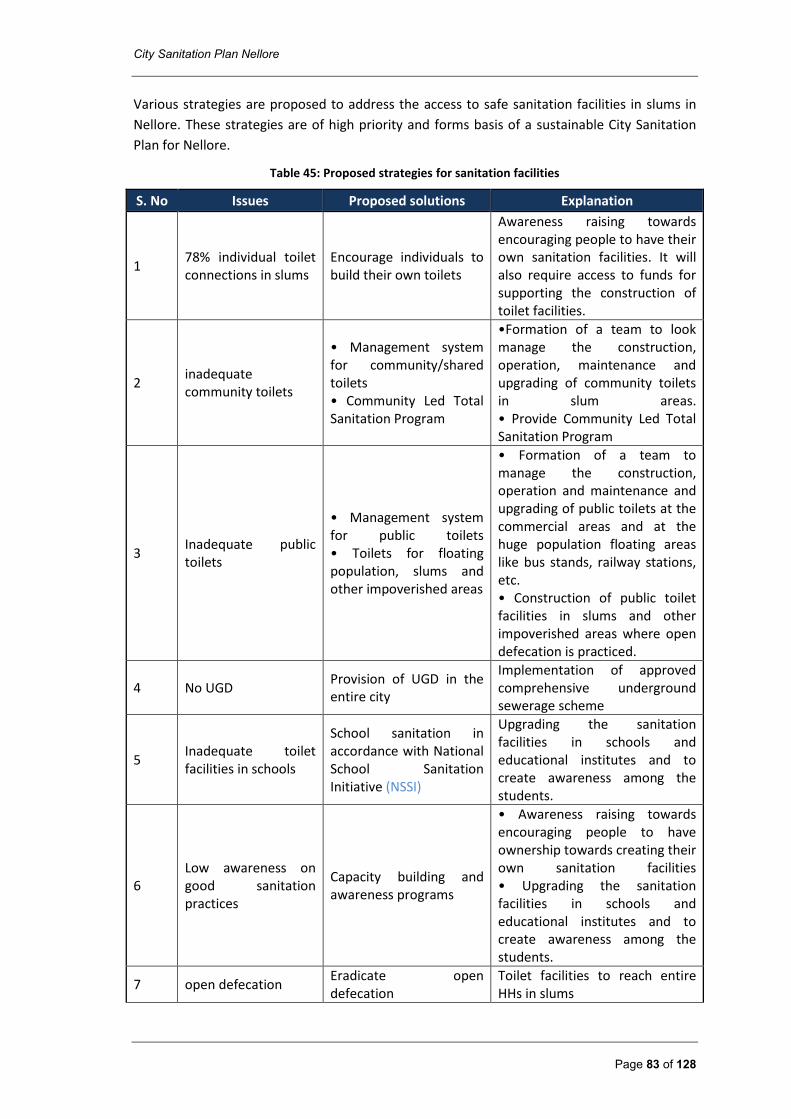
City Sanitation Plan Nellore
Page 83 of 128
Various strategies are proposed to address the access to safe sanitation facilities in slums in
Nellore. These strategies are of high priority and forms basis of a sustainable City Sanitation
Plan for Nellore.
Table 45: Proposed strategies for sanitation facilities
S. No Issues Proposed solutions Explanation
1 78% individual toilet connections in slums
Encourage individuals to build their own toilets
Awareness raising towards encouraging people to have their own sanitation facilities. It will also require access to funds for supporting the construction of toilet facilities.
2 inadequate community toilets
• Management system for community/shared toilets • Community Led Total Sanitation Program
•Formation of a team to look manage the construction, operation, maintenance and upgrading of community toilets in slum areas. • Provide Community Led Total Sanitation Program
3 Inadequate public toilets
• Management system for public toilets • Toilets for floating population, slums and other impoverished areas
• Formation of a team to manage the construction, operation and maintenance and upgrading of public toilets at the commercial areas and at the huge population floating areas like bus stands, railway stations, etc. • Construction of public toilet facilities in slums and other impoverished areas where open defecation is practiced.
4 No UGD Provision of UGD in the entire city
Implementation of approved comprehensive underground sewerage scheme
5 Inadequate toilet facilities in schools
School sanitation in accordance with National School Sanitation Initiative (NSSI)
Upgrading the sanitation facilities in schools and educational institutes and to create awareness among the students.
6 Low awareness on good sanitation practices
Capacity building and awareness programs
• Awareness raising towards encouraging people to have ownership towards creating their own sanitation facilities • Upgrading the sanitation facilities in schools and educational institutes and to create awareness among the students.
7 open defecation Eradicate open defecation
Toilet facilities to reach entire HHs in slums
City Sanitation Plan Nellore
Page 84 of 128
S. No Issues Proposed solutions Explanation
8 No eco-friendly technologies for sanitation facilities
Eco friendly technologies consist of Urine Diversion Dehydration Toilets and Biogas Linked Pour Flush Toilets.
Eco friendly technologies consist of Urine Diversion Dehydration Toilets and Biogas Linked Pour Flush Toilets.
1. Access to Individual Toilets:
In general, individual household toilets are preferable to community/public toilets, particularly
because this option promotes ownership and secure maintenance and proper operation.
However, given the conditions of slums in Nellore, the construction of individual toilets is
difficult because of lack of space in their premises. In areas with space availability one of the
most favourable and viable option to improve sanitation is to encourage the slum dwellers to
construct their own private toilets. Providing funds, incentives or technical assistance for
construction of toilets will motivate community to take up such initiatives. The appropriate
toilet design for meeting the needs of slums can be selected based on the following criteria:
Suitability and preference of the beneficiary population
Availability of space within the household for a private toilet
Affordability of the user households
Ease of operation and maintenance
Sustainability of the system
Considering the high density and space constraint in the slum in Nellore, shared communal or
public toilets are considered to be the most appropriate solution. Communal/public toilets
may be of various types, including the following:
Pit latrines (several compartments over one toilet pit)
Pour-flush toilets discharging to a septic tank with infiltration drainage
Pour-flush toilets discharging to some sort of sealed holding tank
Pour-flush toilets with septic tank discharging liquids only to a sewer network
Pour-flush toilets with discharge of solids and liquids to a sewer network
Urine-diverting toilets with separate collection of faeces in raised vaults
Moreover, for the high density areas of the city, access to toilet facilities should be increased
as per the immediate implementation plan. Considering that the sewerage construction is
going to be implemented in the city soon, conventional Pour Flush Toilets or Low Flush Toilets
shall be promoted. The municipal corporation should provide incentives to people who are
building and using toilets for proper sanitation. NMC can avail various schemes for providing
the incentives.
In the agricultural zones, ecological sanitation practices like Bio digester (Bio-Toilets), Urine
Diversion Dehydration Toilets (UDDT), compost toilets, etc can also be promoted. These toilets
not only help to convert the human waste into soil conditioner (manure) but are also cheap
and easy to operate and maintain.
Bio-Toilets: Bio toilets also called as bio digesters degrades night soil and produces colourless,
odourless, and inflammable biogas containing 50% - 70% methane. The bio-digester tank in
every toilet is filled with inoculums containing four types of bacteria. The water trap system in
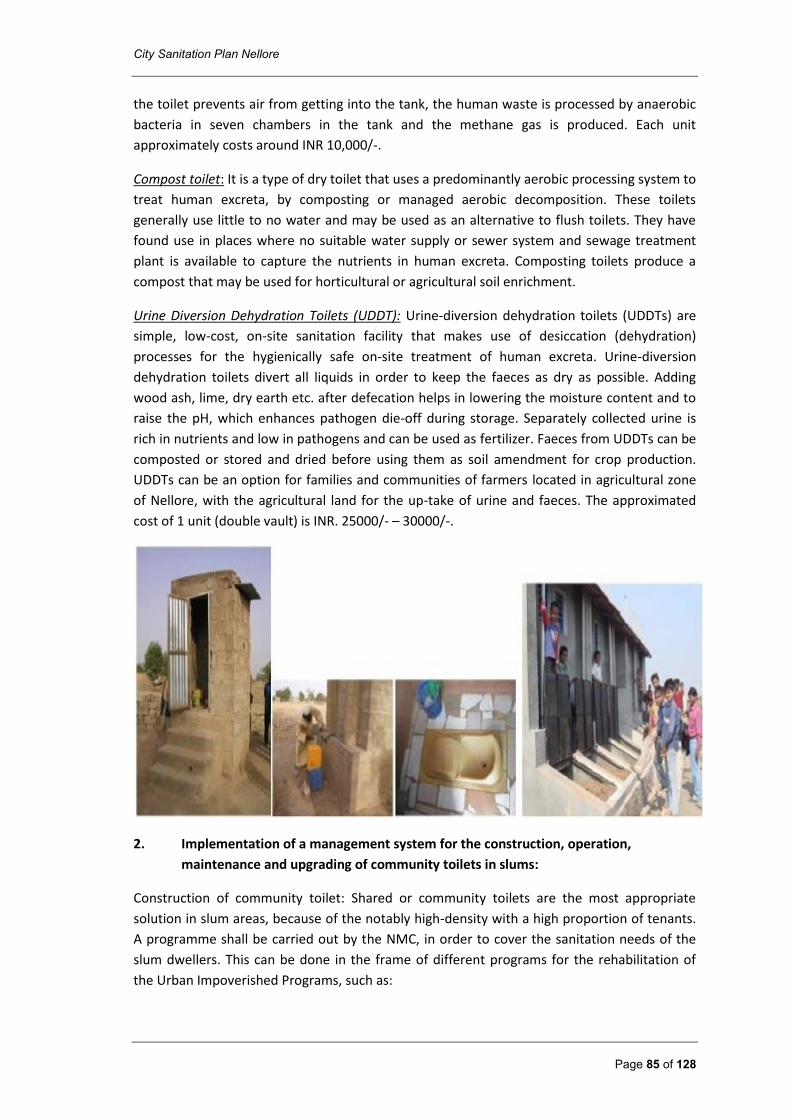
City Sanitation Plan Nellore
Page 85 of 128
the toilet prevents air from getting into the tank, the human waste is processed by anaerobic
bacteria in seven chambers in the tank and the methane gas is produced. Each unit
approximately costs around INR 10,000/-.
Compost toilet: It is a type of dry toilet that uses a predominantly aerobic processing system to
treat human excreta, by composting or managed aerobic decomposition. These toilets
generally use little to no water and may be used as an alternative to flush toilets. They have
found use in places where no suitable water supply or sewer system and sewage treatment
plant is available to capture the nutrients in human excreta. Composting toilets produce a
compost that may be used for horticultural or agricultural soil enrichment.
Urine Diversion Dehydration Toilets (UDDT): Urine-diversion dehydration toilets (UDDTs) are
simple, low-cost, on-site sanitation facility that makes use of desiccation (dehydration)
processes for the hygienically safe on-site treatment of human excreta. Urine-diversion
dehydration toilets divert all liquids in order to keep the faeces as dry as possible. Adding
wood ash, lime, dry earth etc. after defecation helps in lowering the moisture content and to
raise the pH, which enhances pathogen die-off during storage. Separately collected urine is
rich in nutrients and low in pathogens and can be used as fertilizer. Faeces from UDDTs can be
composted or stored and dried before using them as soil amendment for crop production.
UDDTs can be an option for families and communities of farmers located in agricultural zone
of Nellore, with the agricultural land for the up-take of urine and faeces. The approximated
cost of 1 unit (double vault) is INR. 25000/- – 30000/-.
2. Implementation of a management system for the construction, operation,
maintenance and upgrading of community toilets in slums:
Construction of community toilet: Shared or community toilets are the most appropriate
solution in slum areas, because of the notably high-density with a high proportion of tenants.
A programme shall be carried out by the NMC, in order to cover the sanitation needs of the
slum dwellers. This can be done in the frame of different programs for the rehabilitation of
the Urban Impoverished Programs, such as:
City Sanitation Plan Nellore
Page 86 of 128
“Swachh Andhra Mission”, that aims at open defecation elimination, eradication of manual
scavenging, modern and scientific municipal solid waste management, to effect behavioral
change regarding healthy sanitation practices, generate awareness about sanitation and its
linkage with public health, capacity augmentation for ULB’s and to create enabling
environment for private sector participation in capital expenditure and operation and
maintenance.
Under the mission, Nellore Municipal Corporation has identified and approved for the
construction of 9269 individual toilets in slums. More information can be found at:
http://sac.ap.gov.in/sac/UserInterface/Application/Reports/StateReport.aspx
Rajiv Awas Yojana (RAY): The national government approved the scheme in June 2011 with
the launch of the phase-1 to facilitate affordable housing for slum dwellers. According to the
plan, the centre would provide financial assistance to States willing to assign property rights to
slum dwellers for provision of shelter and basic civic and social services for slum re-
development and for creation of affordable housing stock under the RAY scheme. As per the
Cabinet Committee on Economic Affairs decision, the Centre will bear 50% of the cost of slum
re-development. More information can be found at:
http://mhupa.gov.in/w_new/RAY%20Guidelines-%20English.pdf
Central Sector Scheme of “Urban Statistics for HR and Assessments (USHA)”, which aims at the
development and maintenance of a national database, MIS and knowledge repository relating
to urban poverty, slums, housing, construction and other urbanization related statistics. Funds
and grants are offered for ULB in order to support with the sample surveys, socio-economic
research studies and training. More information can be found at:
http://mhupa.gov.in/w_new/USHAGuidelines.pdf.
Integrated Housing & Slum Development (IHSDP) Scheme, it is a program under which the
Ministry of Housing & Urban Poverty Alleviation (MoHUPA) caters to housing and basic
amenities and services to the urban poor and slum dwellers. The scheme applies to all
cities\towns, excepting cities\towns covered under JNNURM. The target group under the
scheme is slum dwellers from all sections of the community through a cluster approach.
Allocation of funds among States will be on the basis of the States’ urban slum population in
the country. More information can be found at:
http://india.gov.in/outerwin.php?id=http://hpurbandevelopment.nic.in/PROJECT/IHSDP.HTM.
Operation and Maintenance of Community Toilet: Operation and maintenance of community
toilet is the most important for sustenance in the long run, following is recommended:
Pay & Use basis: One time monthly pass system on fixed rate basis should be planned out in consensus with the community and the ward councillor. A caretaker to be appointed to take care of daily cleaning and other activities like purchasing of cleaning materials and keeping all the records
Maintenance by the Municipal Corporation: The Nellore Municipal Corporation shall be responsible for maintaining the toilet and overall in-charge of the O&M of the toilet block.
Involving a private party like Sulabh International for operation and maintenance
City Sanitation Plan Nellore
Page 87 of 128
Institutionalize appropriate monitoring systems involving community, officials from NMC and private party
3. Construction of Public Sanitation Facilities
Being a railway junction for many cities and having a National Highway passing through the
city connecting Tamil Nadu and Andhra States, Nellore experience high numbers of floating
population. Considering this, Nellore Municipal Corporation needs to construct few public
toilet blocks at various places like railway stations, bus stands, markets and tourist places, etc.
These toilet blocks can be built on the Built Operate and Transfer (BOT) basis in order to
ensure the quality of construction and operation and maintenance. Public toilet blocks should
also provide more number of urinals and less number of toilet seats. Water saving urinals can
also be fitted in the public toilet blocks which can make it easy to operate and maintain.
4. School Sanitation Planning
A focus on school sanitation stems from the facts that clean toilets, water supply and health
environment is a basic necessity for overall growth and development of students.
Furthermore, a responsible school with all the sanitation facilities should also support children
in developing skills, attitudes and knowledge on public health and hygiene. As discussed in
previous chapters, there is an immediate need to fill the gaps in the existing infrastructure i.e
construct additional 164 toilet seats and 54 urinals to meet the demands of existing student
strength.
Additionally, it is recommended that the schools in Nellore should enroll in the National
School Sanitation Initiative, a program carried out in collaboration by the Ministry of Urban
Development (MoUD), Ministry of Human Resource Development (MoHRD), Central Board of
Secondary Examination (CBSE) and GIZ to effectuate a quantifiable achievement in the
provisions and practices of sanitation in the country. For more information visit:
www.schoolsanitation.in
5. Adopting Community Led Total Sanitation Approach
Community Led Total Sanitation (CLTS) is an innovative methodology for mobilising
communities to completely eliminate open defecation (OD). CLTS approach is basically based
on community participation where the communities are usually facilitated to conduct their
own appraisal and analysis of open defecation and take their own action to become open
defecation free. It is a grassroots approach to sanitation and is active in more than 15
countries. It focuses on the behavioural change needed to ensure real and sustainable
improvements – investing in community mobilisation instead of hardware, and shifting the
focus from toilet construction for individual households. By raising awareness that as long as
even a minority continues to defecate in the open everyone is at risk of disease, CLTS triggers
the community’s desire for collective change, propels people into action and encourages
innovation, mutual support and appropriate local solutions, thus leading to greater ownership
and sustainability. The steps identified under CLTS include:
Selection: selecting a community and developing a better-defined sense of the community
Mobilization: educating the community regarding the consequences of living in a focally contaminated environment. Some of the triggering activities include defecation area
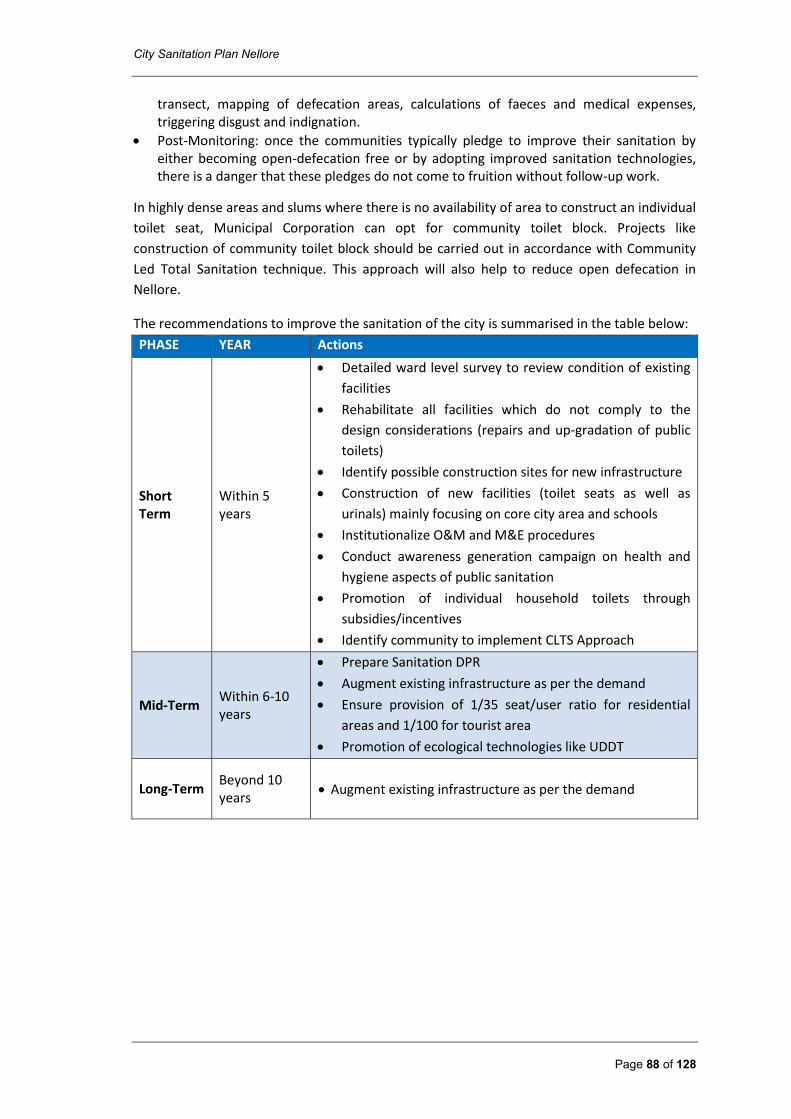
City Sanitation Plan Nellore
Page 88 of 128
transect, mapping of defecation areas, calculations of faeces and medical expenses, triggering disgust and indignation.
Post-Monitoring: once the communities typically pledge to improve their sanitation by either becoming open-defecation free or by adopting improved sanitation technologies, there is a danger that these pledges do not come to fruition without follow-up work.
In highly dense areas and slums where there is no availability of area to construct an individual
toilet seat, Municipal Corporation can opt for community toilet block. Projects like
construction of community toilet block should be carried out in accordance with Community
Led Total Sanitation technique. This approach will also help to reduce open defecation in
Nellore.
The recommendations to improve the sanitation of the city is summarised in the table below:
PHASE YEAR Actions
Short Term
Within 5 years
Detailed ward level survey to review condition of existing
facilities
Rehabilitate all facilities which do not comply to the
design considerations (repairs and up-gradation of public
toilets)
Identify possible construction sites for new infrastructure
Construction of new facilities (toilet seats as well as
urinals) mainly focusing on core city area and schools
Institutionalize O&M and M&E procedures
Conduct awareness generation campaign on health and
hygiene aspects of public sanitation
Promotion of individual household toilets through
subsidies/incentives
Identify community to implement CLTS Approach
Mid-Term Within 6-10 years
Prepare Sanitation DPR
Augment existing infrastructure as per the demand
Ensure provision of 1/35 seat/user ratio for residential
areas and 1/100 for tourist area
Promotion of ecological technologies like UDDT
Long-Term Beyond 10 years
Augment existing infrastructure as per the demand
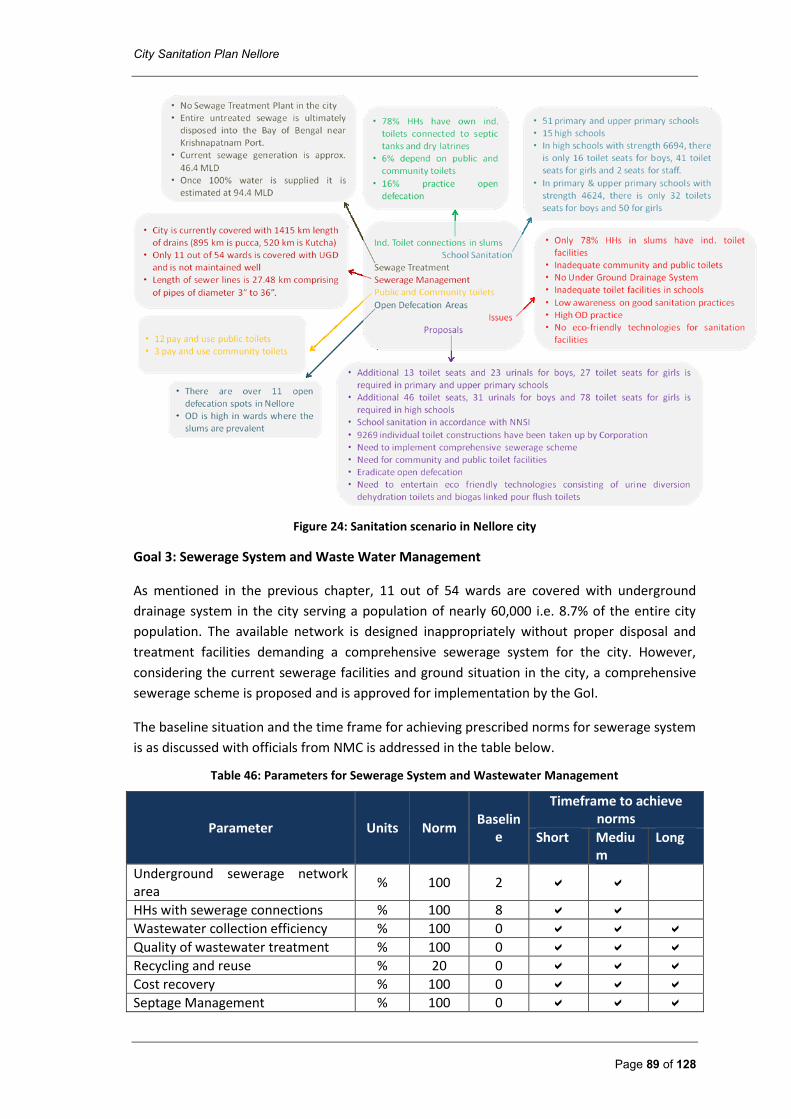
City Sanitation Plan Nellore
Page 89 of 128
Figure 24: Sanitation scenario in Nellore city
Goal 3: Sewerage System and Waste Water Management
As mentioned in the previous chapter, 11 out of 54 wards are covered with underground
drainage system in the city serving a population of nearly 60,000 i.e. 8.7% of the entire city
population. The available network is designed inappropriately without proper disposal and
treatment facilities demanding a comprehensive sewerage system for the city. However,
considering the current sewerage facilities and ground situation in the city, a comprehensive
sewerage scheme is proposed and is approved for implementation by the GoI.
The baseline situation and the time frame for achieving prescribed norms for sewerage system
is as discussed with officials from NMC is addressed in the table below.
Table 46: Parameters for Sewerage System and Wastewater Management
Parameter Units Norm Baselin
e
Timeframe to achieve norms
Short Medium
Long
Underground sewerage network area
% 100 2
HHs with sewerage connections % 100 8
Wastewater collection efficiency % 100 0
Quality of wastewater treatment % 100 0
Recycling and reuse % 20 0
Cost recovery % 100 0
Septage Management % 100 0
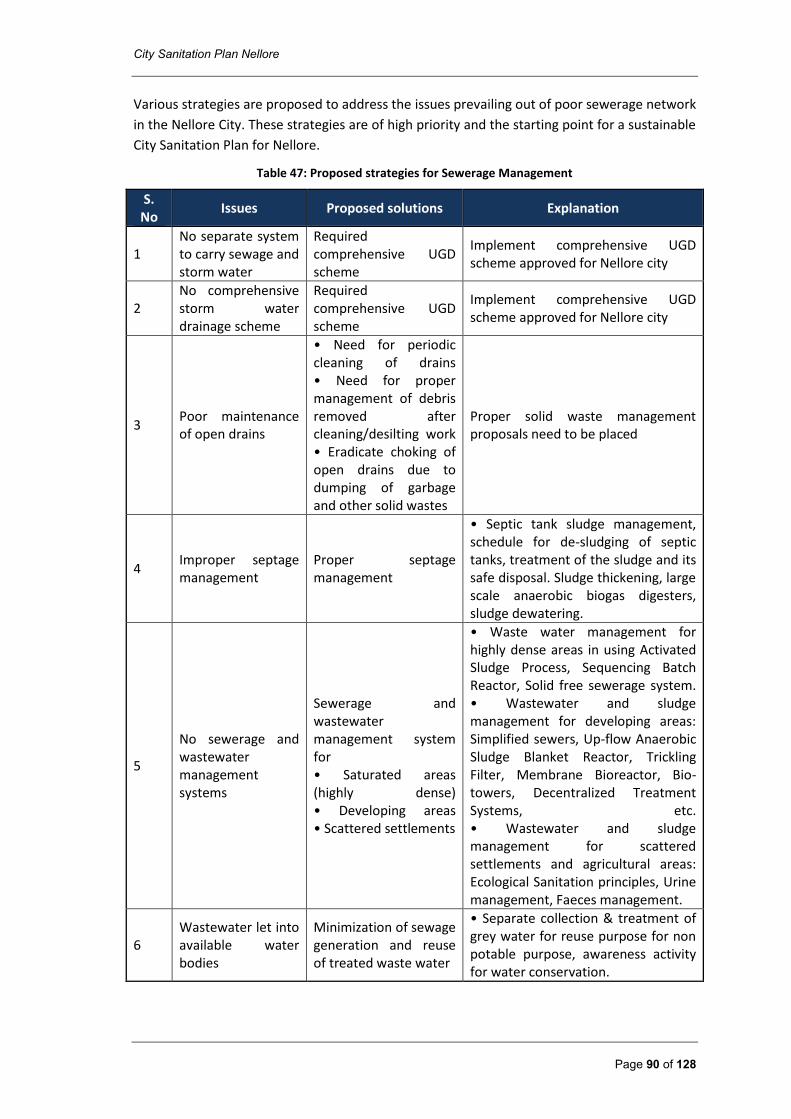
City Sanitation Plan Nellore
Page 90 of 128
Various strategies are proposed to address the issues prevailing out of poor sewerage network
in the Nellore City. These strategies are of high priority and the starting point for a sustainable
City Sanitation Plan for Nellore.
Table 47: Proposed strategies for Sewerage Management
S. No
Issues Proposed solutions Explanation
1 No separate system to carry sewage and storm water
Required comprehensive UGD scheme
Implement comprehensive UGD scheme approved for Nellore city
2 No comprehensive storm water drainage scheme
Required comprehensive UGD scheme
Implement comprehensive UGD scheme approved for Nellore city
3 Poor maintenance of open drains
• Need for periodic cleaning of drains • Need for proper management of debris removed after cleaning/desilting work • Eradicate choking of open drains due to dumping of garbage and other solid wastes
Proper solid waste management proposals need to be placed
4 Improper septage management
Proper septage management
• Septic tank sludge management, schedule for de-sludging of septic tanks, treatment of the sludge and its safe disposal. Sludge thickening, large scale anaerobic biogas digesters, sludge dewatering.
5
No sewerage and wastewater management systems
Sewerage and wastewater management system for • Saturated areas (highly dense) • Developing areas • Scattered settlements
• Waste water management for highly dense areas in using Activated Sludge Process, Sequencing Batch Reactor, Solid free sewerage system. • Wastewater and sludge management for developing areas: Simplified sewers, Up-flow Anaerobic Sludge Blanket Reactor, Trickling Filter, Membrane Bioreactor, Bio-towers, Decentralized Treatment Systems, etc. • Wastewater and sludge management for scattered settlements and agricultural areas: Ecological Sanitation principles, Urine management, Faeces management.
6 Wastewater let into available water bodies
Minimization of sewage generation and reuse of treated waste water
• Separate collection & treatment of grey water for reuse purpose for non potable purpose, awareness activity for water conservation.
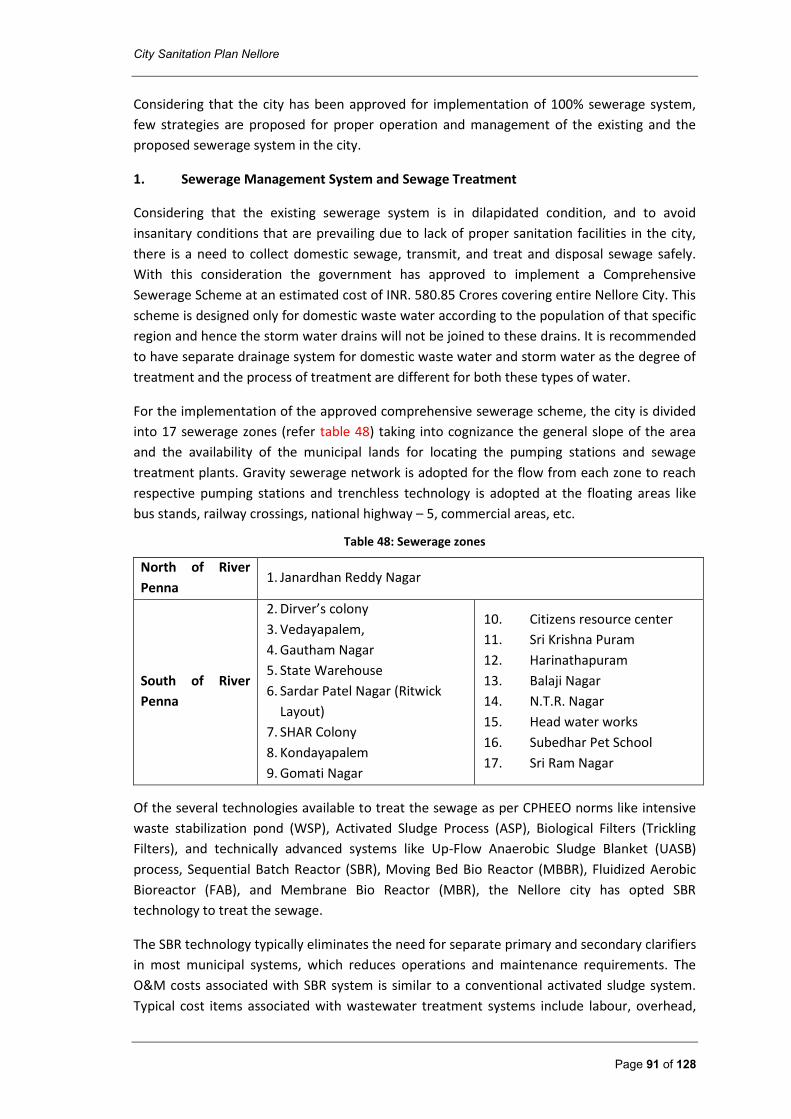
City Sanitation Plan Nellore
Page 91 of 128
Considering that the city has been approved for implementation of 100% sewerage system,
few strategies are proposed for proper operation and management of the existing and the
proposed sewerage system in the city.
1. Sewerage Management System and Sewage Treatment
Considering that the existing sewerage system is in dilapidated condition, and to avoid
insanitary conditions that are prevailing due to lack of proper sanitation facilities in the city,
there is a need to collect domestic sewage, transmit, and treat and disposal sewage safely.
With this consideration the government has approved to implement a Comprehensive
Sewerage Scheme at an estimated cost of INR. 580.85 Crores covering entire Nellore City. This
scheme is designed only for domestic waste water according to the population of that specific
region and hence the storm water drains will not be joined to these drains. It is recommended
to have separate drainage system for domestic waste water and storm water as the degree of
treatment and the process of treatment are different for both these types of water.
For the implementation of the approved comprehensive sewerage scheme, the city is divided
into 17 sewerage zones (refer table 48) taking into cognizance the general slope of the area
and the availability of the municipal lands for locating the pumping stations and sewage
treatment plants. Gravity sewerage network is adopted for the flow from each zone to reach
respective pumping stations and trenchless technology is adopted at the floating areas like
bus stands, railway crossings, national highway – 5, commercial areas, etc.
Table 48: Sewerage zones
North of River
Penna 1. Janardhan Reddy Nagar
South of River
Penna
2. Dirver’s colony
3. Vedayapalem,
4. Gautham Nagar
5. State Warehouse
6. Sardar Patel Nagar (Ritwick
Layout)
7. SHAR Colony
8. Kondayapalem
9. Gomati Nagar
10. Citizens resource center
11. Sri Krishna Puram
12. Harinathapuram
13. Balaji Nagar
14. N.T.R. Nagar
15. Head water works
16. Subedhar Pet School
17. Sri Ram Nagar
Of the several technologies available to treat the sewage as per CPHEEO norms like intensive
waste stabilization pond (WSP), Activated Sludge Process (ASP), Biological Filters (Trickling
Filters), and technically advanced systems like Up-Flow Anaerobic Sludge Blanket (UASB)
process, Sequential Batch Reactor (SBR), Moving Bed Bio Reactor (MBBR), Fluidized Aerobic
Bioreactor (FAB), and Membrane Bio Reactor (MBR), the Nellore city has opted SBR
technology to treat the sewage.
The SBR technology typically eliminates the need for separate primary and secondary clarifiers
in most municipal systems, which reduces operations and maintenance requirements. The
O&M costs associated with SBR system is similar to a conventional activated sludge system.
Typical cost items associated with wastewater treatment systems include labour, overhead,
City Sanitation Plan Nellore
Page 92 of 128
supplies, maintenance, operating administration, utilities, chemicals, safety and training,
laboratory testing, and solids handling. Labour and maintenance requirements are less in SBRs
because clarifiers, clarification equipment, and RAS pumps are not necessary. Though the SBR
system best suits for the need of Nellore city, the corporation should be responsible in
monitoring and checking the performance of the system as the controls, automatic valves, and
automatic switches, and other important systems are delicate and require more maintenance
than required in other systems. An increased level of sophistication usually equates to more
items that can fail or require maintenance. The level of sophistication is very advanced in
larger SBR technologies requiring a higher level of maintenance on the automatic valves and
switches.
In the vicinity of Nellore city there are number of educational institutes scattered near the
agricultural areas. Therefore, at such areas if the approved Comprehensive UGD Scheme is not
covered, it is then recommended to have an institutional level Decentralized Waste Water
Treatment Plants (DeWATS) wherein the treated water can be locally reused either for
irrigation purpose or to meet the institutions own water need. In case the segregation of grey
water and black water is done, then for treatment of grey water on a decentralized level
technologies which can be used are Compost Filters, Constructed Wetlands, etc.
At the outer periphery of Nellore City where the houses are scattered, the conventional
gravity system with centralized treatment is not feasible, therefore, it is sustainable to
implement an ecological sanitation program, in which different technical options could be
constructed to allow the separated collection of urine and faeces and its separated treatment.
The following section explains the principles of ecological sanitation and logistics involved:
An ecological Sanitation principle is a holistic approach to sanitation and water management
based on the systematic closure of local material flow-cycles. The concept thus recognizes
human excreta and water from households not as waste but as resources that can be
recovered, treated where necessary and use it safely.
Infrastructure needed for agricultural areas of Nellore City: This system requires a urine-
diverting user interface, which are usually called “Urine Diversion Dehydration Toilets” or
UDDT. Urine is collected through the front outlet and conveyed to a collection vessel (a tank in
larger, more expensive systems or a jerry can in similar, simpler systems), a garden or possibly
a soak pit, if the urine is not brought to use. Through the rear outlet the faeces are collected in
a container located underneath the toilet. Some urine diverting squat pans are also equipped
with an additional outlet for anal cleansing water (beige water), which is then treated, in a
separate flow stream.
Urine Management: The urine can be used as a fertilizer for crop production. In larger systems, urine must be sanitized through storage; while at the household level, the urine can be used directly but the time from fertilizing until harvesting should be at least one month. Urine shall be applied as nitrogen rich fertilizer to kitchen gardens, agricultural plantations or orchids after providing appropriate storage time. As urine will be collected throughout the year, going for fruit trees, flowers, etc. that requires regular fertilization throughout the year is advisable. If such plants can’t be identified, going for a polyculture of plants having different growth pattern and therefore require nutrient application at different times of the year may
City Sanitation Plan Nellore
Page 93 of 128
be an option. Hygiene and sanitation guidelines on how to safely use urine as a fertilizer for crop production have been published by the WHO.
Faeces Management: Dehydration is the simplest way of treating the faecal fraction, although
they can also be mixed with organics and composted. By dehydrating the faeces with or
without the addition of a drying or pH control agent (e.g. ash, lime, etc.), the faeces can be
sanitized and used, or disposed off, safely. Faeces should be kept as dry as possible and
covered continually to aid in drying and form a barrier between the faeces and vectors.
2. Septic tank/Sludge/Septage Management
In absence of any systematic municipal sanitation network, on-site sanitation facilities are
most commonly developed by the residents themselves, as in the case of Nellore too. Those
are little concerned about the problems with sludge removed from their facilities. Sludge or
Septage management is usually limited to a de-sludging service that is provided by municipal
agencies or the private sector, proper solutions for sludge disposal are generally lacking. This
situation may have less serious impacts when the population density is low. However, in urban
areas with dense population, the negative impacts on the urban environment become too
high and actions have to be taken. Instead of leaving the responsibility completely to
individuals, the public relevance of sludge management must be recognized and a strategy for
better management of sludge be developed. Sludge management is an integral as well as
indispensable part of every sanitation plan, which builds on on-site sanitation facilities. It is
definitely irresponsible to promote septic tanks without providing solutions for regular de-
sludging of the facilities and for safe management and disposal of the sludge. 100% of human
excreta and liquid wastes from all sanitation facilities including toilets must be disposed of
safely. In order to achieve this goal, the following activities shall be undertaken:
Promoting proper functioning of network-based sewerage systems and ensuring connections of households to them wherever possible.
Promoting recycle and reuse of treated waste water for non potable applications wherever possible will be encouraged.
Promoting proper disposal and treatment of sludge from on-site installations (septic tanks, pit latrines, etc.).
Ensuring that all the human wastes are collected safely confined and disposed of after treatment so as not to cause any hazard to public health or the environment.
Management of On-site sanitation need attention as these appears to be an area of neglect
where limited attention has been accorded to proper construction, maintenance and
management and safe disposal of Septage from septic tanks and pit latrines. The problems
associated with on-site sanitation facilities can be summarized as follows:
Lack of awareness/knowledge on planning and designing on-site systems and its installations, operations and maintenance among the system owners, public and urban local bodies.
On-site systems are not built to national standards, but rather constructed and installed in ad-hoc manner leading to issues in its performance and failure and higher environmental risks.
Poor O&M like infrequent de-sludging, clogged absorption fields, and hydraulic overloading causes system failures.
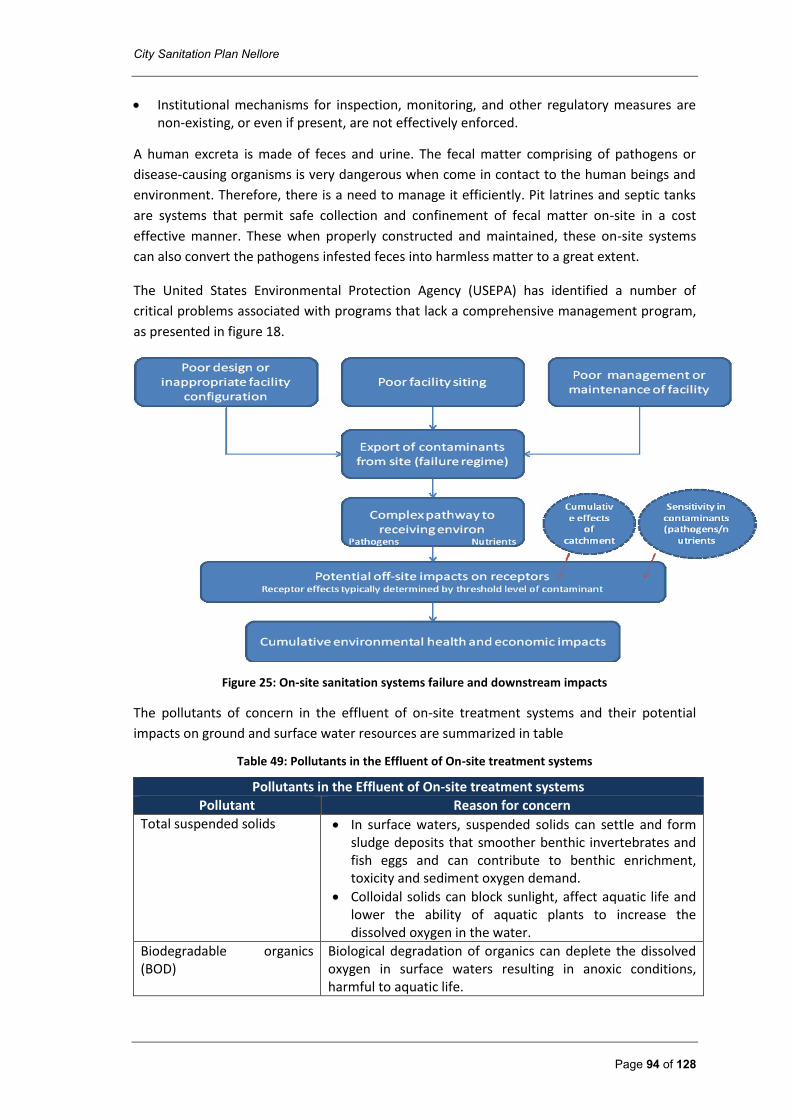
City Sanitation Plan Nellore
Page 94 of 128
Institutional mechanisms for inspection, monitoring, and other regulatory measures are non-existing, or even if present, are not effectively enforced.
A human excreta is made of feces and urine. The fecal matter comprising of pathogens or
disease-causing organisms is very dangerous when come in contact to the human beings and
environment. Therefore, there is a need to manage it efficiently. Pit latrines and septic tanks
are systems that permit safe collection and confinement of fecal matter on-site in a cost
effective manner. These when properly constructed and maintained, these on-site systems
can also convert the pathogens infested feces into harmless matter to a great extent.
The United States Environmental Protection Agency (USEPA) has identified a number of
critical problems associated with programs that lack a comprehensive management program,
as presented in figure 18.
Figure 25: On-site sanitation systems failure and downstream impacts
The pollutants of concern in the effluent of on-site treatment systems and their potential
impacts on ground and surface water resources are summarized in table
Table 49: Pollutants in the Effluent of On-site treatment systems
Pollutants in the Effluent of On-site treatment systems
Pollutant Reason for concern
Total suspended solids In surface waters, suspended solids can settle and form sludge deposits that smoother benthic invertebrates and fish eggs and can contribute to benthic enrichment, toxicity and sediment oxygen demand.
Colloidal solids can block sunlight, affect aquatic life and lower the ability of aquatic plants to increase the dissolved oxygen in the water.
Biodegradable organics (BOD)
Biological degradation of organics can deplete the dissolved oxygen in surface waters resulting in anoxic conditions, harmful to aquatic life.
City Sanitation Plan Nellore
Page 95 of 128
Pollutants in the Effluent of On-site treatment systems
Pollutant Reason for concern
Phosphorous Phosphorous would also lead to eutrophicatoin and reduction of dissolved oxygen in surface waters.
Toxic organics Toxic organic compounds present in household chemicals and cleaning agents can be present in groundwater and contaminate drinking water sources. They can also affect surface water ecosystems and human health through ingestion of contaminated aquatic organisms
Heavy metals Heavy metals like lead and mercury can be toxic to human and aquatic life. They tend to accumulate in fish and shell fish and if consumed by humans could affect their health
Pathogens Parasites, bacteria and viruses can cause communicable diseases through body contact, ingestion of contaminated water or shellfish. Transport distances of some pathogens (bacteria and viruses can be quire significant).
Different suitable on-site applications are discussed below
Double Ventilated Improved Pit: This is more appropriate for denser, peri-urban areas. The
material is manually emptied (it is dug out not pumped out), so vacuum truck access to the
pits is not necessary. The users can remove the pit material after a sufficient resting time of
one or more years even though the treatment processes in the pit are not complete and the
material is not entirely hygienic. The double VIP technology will only work properly if the two
pits are used sequentially and not concurrently. For more information refer annexures.
Twin Pits Pour Flush: the twin pits with pour flush is a permanent technology that is
appropriate for areas where it is not appropriate to continuously move a pit latrine. It is a
water-based technology and is only appropriate where there is a constant supply of water for
flushing. Grey water can be co-managed along with the black water in the twin pits. This
technology is not appropriate for areas with a high groundwater table or areas that are
frequently flooded. In order for the pits to drain properly, the soil must have a good
absorptive capacity; clay, tightly packed or rocky soils are not appropriate. For more
information refer annexures.
Septic Tank:
Two compartments septic tanks have been found to be more effective with lower solids
concentration in the treated effluent. More information is enclosed in annexures.
Other than placing appropriate on-site technologies, the goal of Septage Management Plan is
to provide the local operator with the clear understanding of:
How often sludge is removed from the facilities
The preferred method of treatment and disposal of sludge
The back-up plan when preferred method is unavailable; such as land-filling
Management of the sludge collection, transport and treatment processes
Most of the septic tanks are actually unlined soak-pits in Nellore, and hence the de-sludging
interval varies depending upon the infiltration of the liquid component. Hence, assuming an
City Sanitation Plan Nellore
Page 96 of 128
interval of 3 months to each septic tank, Nellore will require 3000L capacity vacuum suction
pump mounted TATA 407 vehicles.
Most of the wastes either solid or liquid wastes find their way directly into land or water
bodies causing land pollution and water pollution. These wastes also emit green house gases
like methane and carbon dioxide that adds to air pollution. In order to avoid the direct
discharge of the sludge on to the land, a set of decentralized sludge treatment plants will have
to be installed in different zones of the town. Decentralized treatment systems of sludge per
zone would avoid the long distance transportation of the sludge. The following flow diagram
explains the steps involved in sludge processing:
Thickening -> Stabilization -> Dewatering -> Large scale composting -> Reuse or Disposal
The following paragraphs explain the technical options for the steps mentioned above:
Sludge Thickening: The first and the most important step in sludge processing is the sludge
thickening. Its primary function is to reduce the water content and sludge volume. The solid
concentration of unthickened anaerobically digested primary sludge from primary digester is
8% whereas that of thickened sludge it is 12%. This means that the reduction in volume is 33%
approximately. For achieving this volume reduction, technical options are gravity thickening,
floatation thickening, centrifugal thickening, gravity belt thickening or rotary drum thickening.
Large-scale anaerobic biogas digester: are reactors used for the conversion of the organic
fraction of large volumes of slurries and sludge into biogas by anaerobic digestion. The
volumes of the reactors are ranging from several hundred to several thousand m3. The bio-
methanation Plant provides a cost – effective and eco-friendly solution for extracting energy,
mainly derived from organic waste. Biogas is produced through the anaerobic digestion
(fermentation) of decaying plants, animal matter, human excreta etc. It is naturally occurring
emission of bacteria that thrive without oxygen and occurs in three stages of digestion. Biogas
produced in anaerobic digesters is burned to generate clean renewable energy. Biogas is
recovered and used either directly for heating the reactors or transformed into combined
power and heat and fed into the grid or can be used for indigenous application.
Sludge dewatering technologies: Sludge dewatering is a physical/chemical operation to reduce
liquid residuals (i.e., sludge) volumes by up to 90%, converting them into a solid “cake”.
Municipal and industrial water and wastewater treatment facilities commonly use mechanical
sludge dewatering techniques (e.g., belt-filter press, sieve drum, centrifuge, dissolved air
flotation, gravity belt thickeners, etc.) to facilitate the dewatering of their sludge, usually
resulting in a substantial net savings in sludge disposal costs. Mechanical sludge dewatering
options are available as short-term or long-term remedies but are capital and energy intensive
for facilities already operating on a tight budget.
Other options for sludge treatment include planted and unplanted drying beds: Drying beds
are either planted or unplanted sealed shallow ponds filled with several drainage layers and
designed for the separation of the solid from the liquid fraction of (faecal) sludge from
wastewater treatment systems. Sludge is dried naturally by a combination of percolation and
evaporation. When plants are present, evaporation is enhanced by transpiration (evapo-
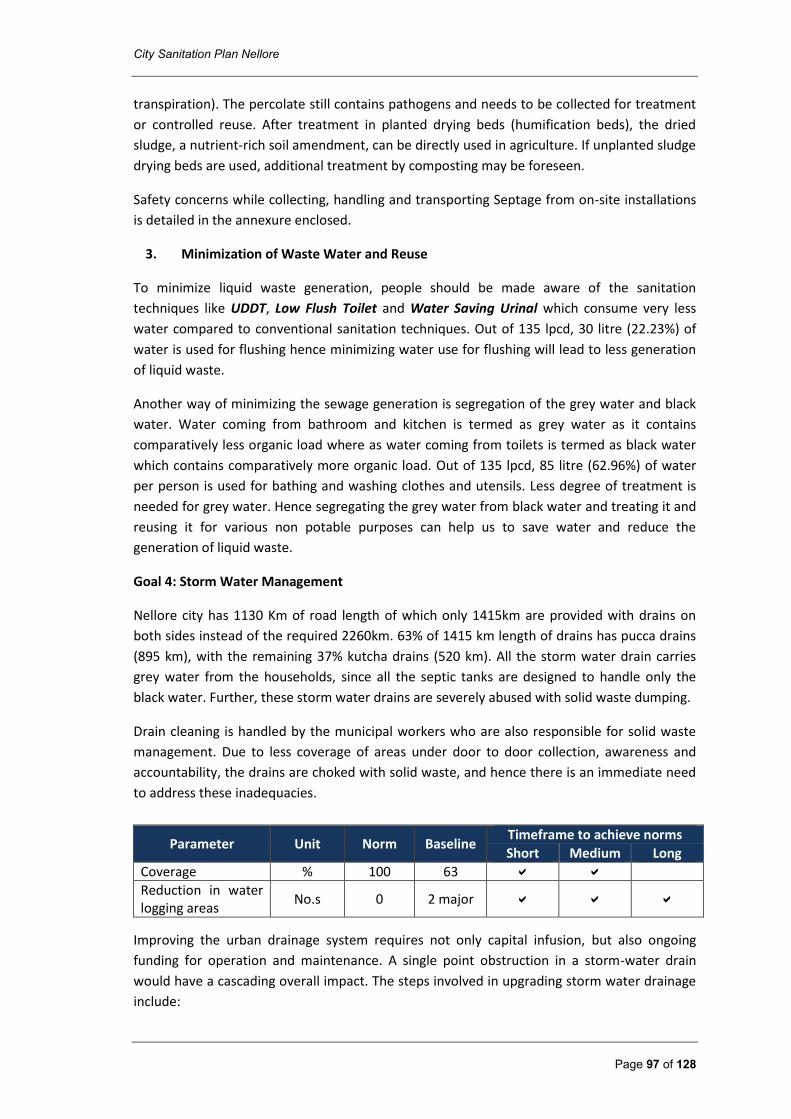
City Sanitation Plan Nellore
Page 97 of 128
transpiration). The percolate still contains pathogens and needs to be collected for treatment
or controlled reuse. After treatment in planted drying beds (humification beds), the dried
sludge, a nutrient-rich soil amendment, can be directly used in agriculture. If unplanted sludge
drying beds are used, additional treatment by composting may be foreseen.
Safety concerns while collecting, handling and transporting Septage from on-site installations
is detailed in the annexure enclosed.
3. Minimization of Waste Water and Reuse
To minimize liquid waste generation, people should be made aware of the sanitation
techniques like UDDT, Low Flush Toilet and Water Saving Urinal which consume very less
water compared to conventional sanitation techniques. Out of 135 lpcd, 30 litre (22.23%) of
water is used for flushing hence minimizing water use for flushing will lead to less generation
of liquid waste.
Another way of minimizing the sewage generation is segregation of the grey water and black
water. Water coming from bathroom and kitchen is termed as grey water as it contains
comparatively less organic load where as water coming from toilets is termed as black water
which contains comparatively more organic load. Out of 135 lpcd, 85 litre (62.96%) of water
per person is used for bathing and washing clothes and utensils. Less degree of treatment is
needed for grey water. Hence segregating the grey water from black water and treating it and
reusing it for various non potable purposes can help us to save water and reduce the
generation of liquid waste.
Goal 4: Storm Water Management
Nellore city has 1130 Km of road length of which only 1415km are provided with drains on
both sides instead of the required 2260km. 63% of 1415 km length of drains has pucca drains
(895 km), with the remaining 37% kutcha drains (520 km). All the storm water drain carries
grey water from the households, since all the septic tanks are designed to handle only the
black water. Further, these storm water drains are severely abused with solid waste dumping.
Drain cleaning is handled by the municipal workers who are also responsible for solid waste
management. Due to less coverage of areas under door to door collection, awareness and
accountability, the drains are choked with solid waste, and hence there is an immediate need
to address these inadequacies.
Parameter Unit Norm Baseline Timeframe to achieve norms
Short Medium Long
Coverage % 100 63
Reduction in water logging areas
No.s 0 2 major
Improving the urban drainage system requires not only capital infusion, but also ongoing
funding for operation and maintenance. A single point obstruction in a storm-water drain
would have a cascading overall impact. The steps involved in upgrading storm water drainage
include:
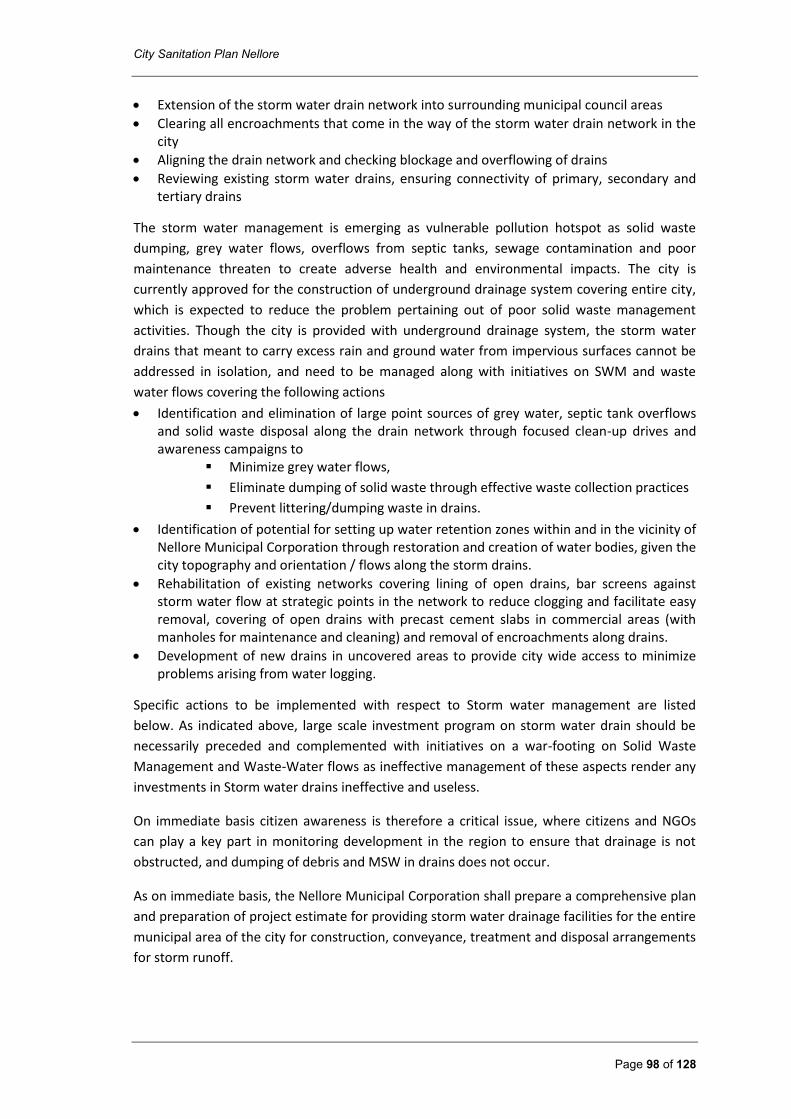
City Sanitation Plan Nellore
Page 98 of 128
Extension of the storm water drain network into surrounding municipal council areas
Clearing all encroachments that come in the way of the storm water drain network in the city
Aligning the drain network and checking blockage and overflowing of drains
Reviewing existing storm water drains, ensuring connectivity of primary, secondary and tertiary drains
The storm water management is emerging as vulnerable pollution hotspot as solid waste
dumping, grey water flows, overflows from septic tanks, sewage contamination and poor
maintenance threaten to create adverse health and environmental impacts. The city is
currently approved for the construction of underground drainage system covering entire city,
which is expected to reduce the problem pertaining out of poor solid waste management
activities. Though the city is provided with underground drainage system, the storm water
drains that meant to carry excess rain and ground water from impervious surfaces cannot be
addressed in isolation, and need to be managed along with initiatives on SWM and waste
water flows covering the following actions
Identification and elimination of large point sources of grey water, septic tank overflows and solid waste disposal along the drain network through focused clean-up drives and awareness campaigns to
Minimize grey water flows,
Eliminate dumping of solid waste through effective waste collection practices
Prevent littering/dumping waste in drains.
Identification of potential for setting up water retention zones within and in the vicinity of Nellore Municipal Corporation through restoration and creation of water bodies, given the city topography and orientation / flows along the storm drains.
Rehabilitation of existing networks covering lining of open drains, bar screens against storm water flow at strategic points in the network to reduce clogging and facilitate easy removal, covering of open drains with precast cement slabs in commercial areas (with manholes for maintenance and cleaning) and removal of encroachments along drains.
Development of new drains in uncovered areas to provide city wide access to minimize problems arising from water logging.
Specific actions to be implemented with respect to Storm water management are listed
below. As indicated above, large scale investment program on storm water drain should be
necessarily preceded and complemented with initiatives on a war-footing on Solid Waste
Management and Waste-Water flows as ineffective management of these aspects render any
investments in Storm water drains ineffective and useless.
On immediate basis citizen awareness is therefore a critical issue, where citizens and NGOs
can play a key part in monitoring development in the region to ensure that drainage is not
obstructed, and dumping of debris and MSW in drains does not occur.
As on immediate basis, the Nellore Municipal Corporation shall prepare a comprehensive plan
and preparation of project estimate for providing storm water drainage facilities for the entire
municipal area of the city for construction, conveyance, treatment and disposal arrangements
for storm runoff.
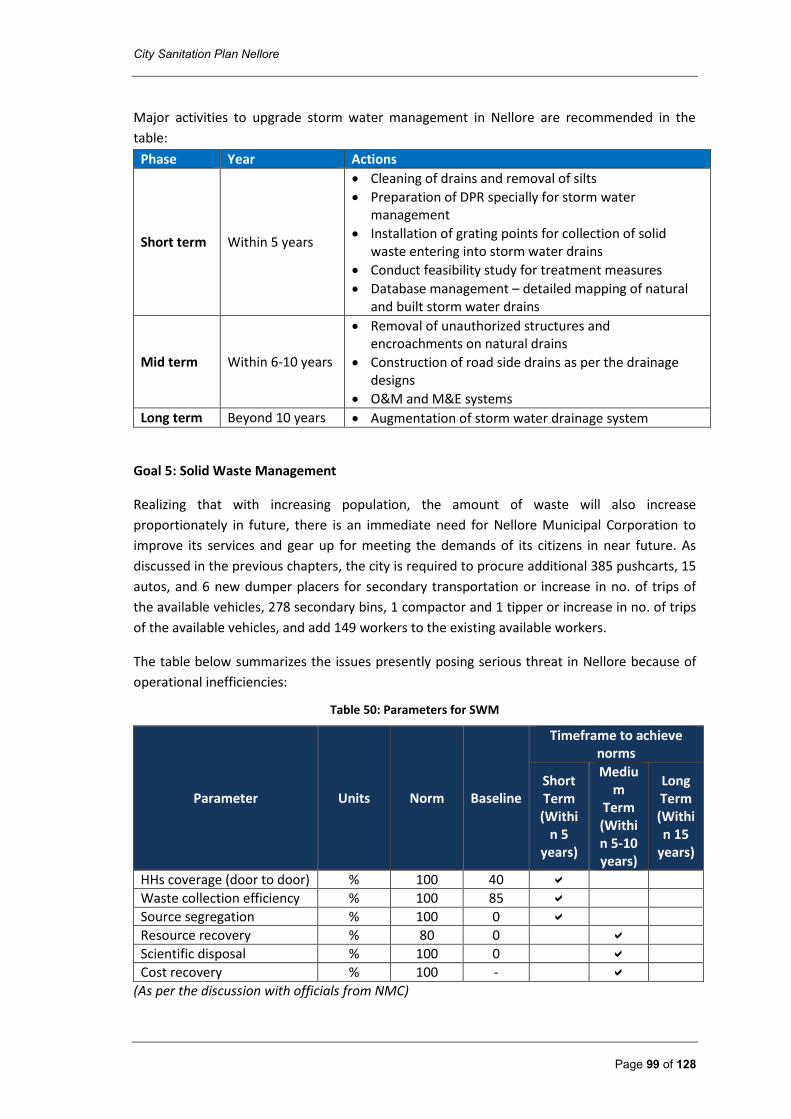
City Sanitation Plan Nellore
Page 99 of 128
Major activities to upgrade storm water management in Nellore are recommended in the
table:
Phase Year Actions
Short term Within 5 years
Cleaning of drains and removal of silts
Preparation of DPR specially for storm water management
Installation of grating points for collection of solid waste entering into storm water drains
Conduct feasibility study for treatment measures
Database management – detailed mapping of natural and built storm water drains
Mid term Within 6-10 years
Removal of unauthorized structures and encroachments on natural drains
Construction of road side drains as per the drainage designs
O&M and M&E systems
Long term Beyond 10 years Augmentation of storm water drainage system
Goal 5: Solid Waste Management
Realizing that with increasing population, the amount of waste will also increase
proportionately in future, there is an immediate need for Nellore Municipal Corporation to
improve its services and gear up for meeting the demands of its citizens in near future. As
discussed in the previous chapters, the city is required to procure additional 385 pushcarts, 15
autos, and 6 new dumper placers for secondary transportation or increase in no. of trips of
the available vehicles, 278 secondary bins, 1 compactor and 1 tipper or increase in no. of trips
of the available vehicles, and add 149 workers to the existing available workers.
The table below summarizes the issues presently posing serious threat in Nellore because of
operational inefficiencies:
Table 50: Parameters for SWM
Parameter Units Norm Baseline
Timeframe to achieve norms
Short Term (Withi
n 5 years)
Medium
Term (Within 5-10 years)
Long Term (Within 15
years)
HHs coverage (door to door) % 100 40
Waste collection efficiency % 100 85
Source segregation % 100 0
Resource recovery % 80 0
Scientific disposal % 100 0
Cost recovery % 100 -
(As per the discussion with officials from NMC)
City Sanitation Plan Nellore
Page 100 of 128
Various strategies are discussed and proposed to address the inefficiencies in solid waste
management in Nellore. These strategies are of high priority and a step towards clean Nellore
City
Proposed system improvements
The system improvements shall focus on the following aspects of MSWM system:
Segregation of Waste: As per the Draft MSW (Management & Handling) Rules, 2015, it is the duty of waste
generators to segregate waste into at least 3 types viz. dry waste, wet waste and domestic
hazardous waste and store it separately. Citizens need to be made aware and sensitized
towards segregation. It is recommended for NMC to distribute bins in the city and
promote segregation at source. Segregating waste at source will ensure that waste is less
contaminated and can be collected and transported for further processing.
No. of households in city 159362
No. of bins to be distributed 318724 (2 bins each to HH)
Organization of door to door collection of waste (with community participation) in entire city:
Presently, only 40% of households are being covered under door to door collection of waste.
NMC needs to scale the service to cover entire city in the immediate next step. The primary
waste collection system in residential areas shall be a mix of motorized door to door collection
(auto), manual waste collection in areas inaccessible by vehicles and individual disposal at the
community waste bins. The commercial establishments including hotels and restaurants
should be covered by door to door collection and through secondary waste storage depots
provided in vicinity. The vegetable and meat waste to be collected separately through door to
door collection.
Street Sweeping and Drain Cleaning: The length of roads in the city being at 1130 km stretch, considering that one worker shall cover 500m it is proposed to engage 2260 workers specifically to carryout street sweeping and drain cleaning. Workers engaged in street sweeping shall also be engaged in drain cleaning along the same beat. It will be made sure that drain silts and street sweeping will not be mixed with the MSW at secondary points and transferred directly to transfer station of landfill site.
Secondary Collection and Transportation: The main objective of the secondary collection system is to store the waste temporarily and transport it as quickly as possible. As proposed in previous chapter, it is recommended to procure additional 278 bins of 3 cum capacity in order to store the waste. It is also desirable that placement of bins is in accordance with the need and requirement of the city so as to also avoid open kachchra/dumping points. In order to promote single handling system, it is desirable to discontinue any current open (land) and static (masonry bins) collection system.
For Nellore, considering the existing situations, it is recommended to procure 6 more dumper placers to the available vehicles for 100% secondary transportation or recommended to increase the trips by each available vehicle for secondary transportation. It shall also be ensured that the waste is transported to the waste processing and disposal facility by closed vehicles to avoid littering and the route shall be optimised as far as possible.
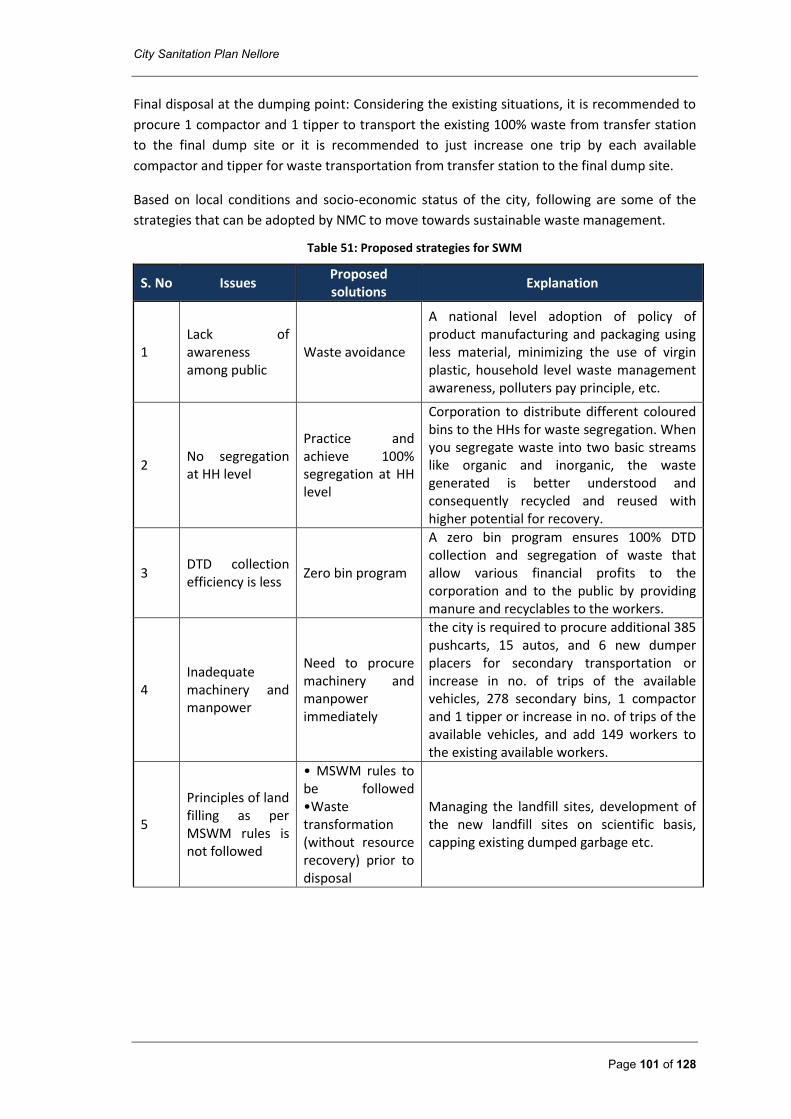
City Sanitation Plan Nellore
Page 101 of 128
Final disposal at the dumping point: Considering the existing situations, it is recommended to
procure 1 compactor and 1 tipper to transport the existing 100% waste from transfer station
to the final dump site or it is recommended to just increase one trip by each available
compactor and tipper for waste transportation from transfer station to the final dump site.
Based on local conditions and socio-economic status of the city, following are some of the
strategies that can be adopted by NMC to move towards sustainable waste management.
Table 51: Proposed strategies for SWM
S. No Issues Proposed solutions
Explanation
1 Lack of awareness among public
Waste avoidance
A national level adoption of policy of product manufacturing and packaging using less material, minimizing the use of virgin plastic, household level waste management awareness, polluters pay principle, etc.
2 No segregation at HH level
Practice and achieve 100% segregation at HH level
Corporation to distribute different coloured bins to the HHs for waste segregation. When you segregate waste into two basic streams like organic and inorganic, the waste generated is better understood and consequently recycled and reused with higher potential for recovery.
3 DTD collection efficiency is less
Zero bin program
A zero bin program ensures 100% DTD collection and segregation of waste that allow various financial profits to the corporation and to the public by providing manure and recyclables to the workers.
4 Inadequate machinery and manpower
Need to procure machinery and manpower immediately
the city is required to procure additional 385 pushcarts, 15 autos, and 6 new dumper placers for secondary transportation or increase in no. of trips of the available vehicles, 278 secondary bins, 1 compactor and 1 tipper or increase in no. of trips of the available vehicles, and add 149 workers to the existing available workers.
5
Principles of land filling as per MSWM rules is not followed
• MSWM rules to be followed •Waste transformation (without resource recovery) prior to disposal
Managing the landfill sites, development of the new landfill sites on scientific basis, capping existing dumped garbage etc.
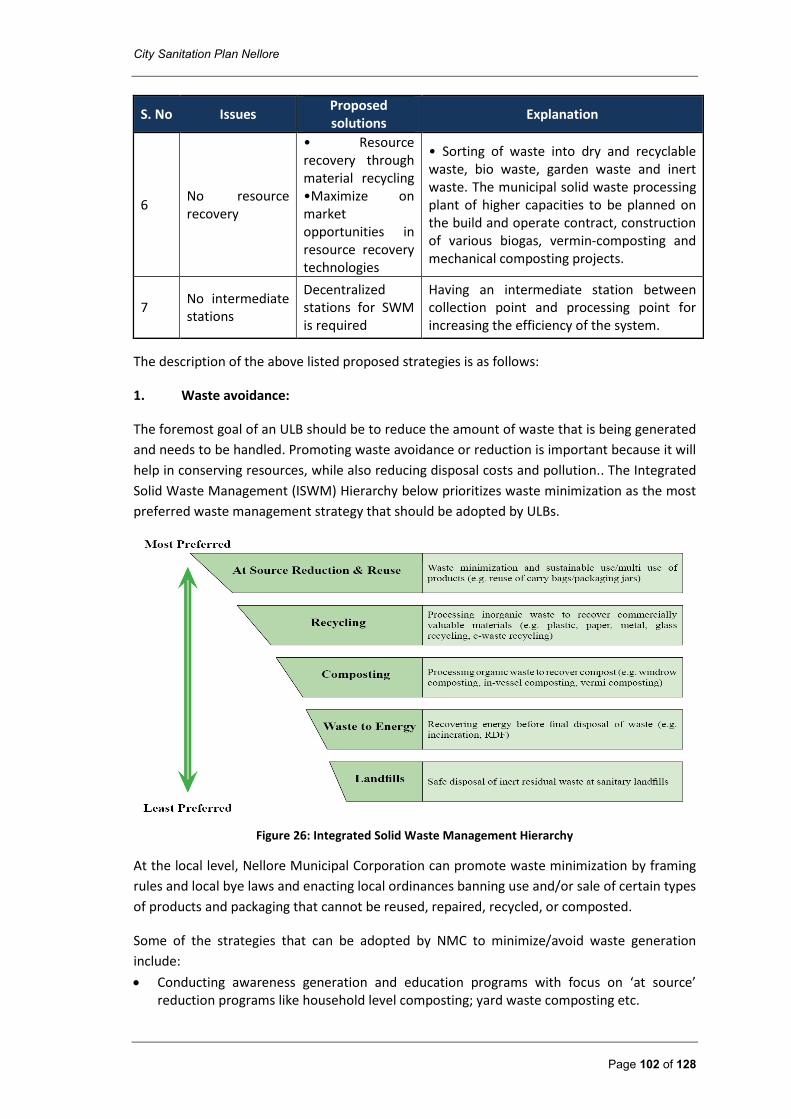
City Sanitation Plan Nellore
Page 102 of 128
S. No Issues Proposed solutions
Explanation
6 No resource recovery
• Resource recovery through material recycling •Maximize on market opportunities in resource recovery technologies
• Sorting of waste into dry and recyclable waste, bio waste, garden waste and inert waste. The municipal solid waste processing plant of higher capacities to be planned on the build and operate contract, construction of various biogas, vermin-composting and mechanical composting projects.
7 No intermediate stations
Decentralized stations for SWM is required
Having an intermediate station between collection point and processing point for increasing the efficiency of the system.
The description of the above listed proposed strategies is as follows:
1. Waste avoidance:
The foremost goal of an ULB should be to reduce the amount of waste that is being generated
and needs to be handled. Promoting waste avoidance or reduction is important because it will
help in conserving resources, while also reducing disposal costs and pollution.. The Integrated
Solid Waste Management (ISWM) Hierarchy below prioritizes waste minimization as the most
preferred waste management strategy that should be adopted by ULBs.
Figure 26: Integrated Solid Waste Management Hierarchy
At the local level, Nellore Municipal Corporation can promote waste minimization by framing
rules and local bye laws and enacting local ordinances banning use and/or sale of certain types
of products and packaging that cannot be reused, repaired, recycled, or composted.
Some of the strategies that can be adopted by NMC to minimize/avoid waste generation
include:
Conducting awareness generation and education programs with focus on ‘at source’ reduction programs like household level composting; yard waste composting etc.
City Sanitation Plan Nellore
Page 103 of 128
Conducting campaigns for reducing the use of specific non-recyclable, non-reusable or toxic material like promoting the use of rechargeable batteries instead of single use batteries
Replacing disposable materials and products with recyclables and reusable materials and products (e.g. banning the use of plastic bags).
Introducing incentives for communities practicing 3Rs i.e Reduce, Reuse and Recycle
A household management system should be put in place, levying fees for waste management services that penalize generators in case of increase in waste quantities. This is driven by the “polluters pay” principle, in which the amount of money to be charged to each property will depend on the number and size of bins assigned to each property.
A strong solid waste minimization and management at the “community” level should be carried out, especially in developing areas, where new middle class residential areas are being constructed. In this new areas, it should be compulsory to have their own waste management station for the sorting at source, recycling at source and processing at source (e.g. yard composting) which helps in waste minimization.
2. Zero bin program:
One of the medium term goals of the Nellore Municipal Corporation is to become a bin less
city. In order to promote non-usage of secondary bins or prevent open dumping of waste at
nook and corners of the road, it is advisable to synchronise primary collection and secondary
collection of the city, thereby avoiding the need for secondary storage bins/ depots.
Segregated waste at the household level shall be collected by primary collection vehicles,
which directly transport this waste to secondary collection vehicles. Secondary collection
vehicles are parked at specific locations for the entire duration of time taken for primary
collection daily. Separate vehicles/chambers within a vehicle should be provided, to ensure
segregated transportation of waste.
Nellore Municipal Corporation shall develop an approach based on zero-waste as an efficient
model, which includes reduction, reuse, recycling solutions, information and education
campaigns based on a strategic interaction of regional/local governments and other
stakeholders to address ongoing issues in handling, transporting, processing, and disposing of
the wastes in an environmentally conducive manner. This program shall be initially
implemented in one ward on a pilot basis and shall be expanded to the entire city as it gives
experiences to the workers who were already involved to replicate in new areas without flaws
and very efficiently and swiftly.
This program involves 100% door to door collection of waste along with the source
segregation, where the organic waste shall be sent to the decentralized (ward-level) compost
plant composting while the dry recyclables shall be sent/sold off to the recycling companies.
This initiative will reduce the financial expenditure in collecting and transportation of waste
for the corporation as it reduces the involvement of fuel vehicles allowing it only for
secondary transportation.
City Sanitation Plan Nellore
Page 104 of 128
Program outcomes:
Ensure 100% door-to-door collection of waste and source segregation from households, commercial and institutional establishments in the identified ward/division
Ensure motivated and productive workforce with a dignified and safe working environment among the sanitary workers
By the end of the project, the ward will be transformed into a Bin Free Ward by removing waste collection bins/containers along the roadsides and at the street corners by implementing 100% door-to-door collection
Reduced littering even after removal of roadside bins/containers
Ensure dedicated collection of wet organic wastes on a daily basis and transport it for processing plant
Material recovery through composting of organic waste.. The compost so produced shall be given back to the residents to boost their morale in effective source segregation.
Reduce cost in secondary transportation of waste thus leading to saving of financial resources for the ULB
Financial implication:
For a ward with 3500 HHs, by providing only pushcarts for waste collection and
transportation, the corporation is estimated to save approximately 1818 litres of diesel per
month for its transportation to the final dump site i.e. around INR. 100000/- at diesel price INR
55/- per litre. It is also estimated that around 4.36 tons waste can be processed for manure
and approx. 1 ton of manure can be produced every month.
Explanation and Calculation:
Autos: Rs. 550/- in one day
Auto on an average transports 300kg from HHs to the secondary bin in its each trip.
To cover 3500 HHs from ward, 4 autos are required (considering 1 auto covers on max. 1000 HHs).
On an average each auto makes 25 kms to collect waste from each HH and dump at the secondary bin. (25 kms as from the parking point to start and end in a day)
Average auto mileage at 10kms per litre, auto expenses includes around Rs. 550/- (at diesel rate Rs. 55 per litre).
Secondary Bins: Rs. 1467/- in one day
Dumper placer on an average transports 2300kg from bins to the transfer station in its each trip.
To transport 4500 kg of waste from the ward, it needs two dumper placers.
On an average each dumper placer travels 40 kms to start from parking point, transport the waste and reach the parking point again.
Therefore, 80kms by 2 dumper placers at Rs. 1467/- (considering that it makes 3 kms per 1 litre)
Compactors from transfer station to dumpsite: Rs. 1100/- in one day
Compactor carries on an average 4650kg in its each trip. Therefore, need 1 trip to transport 4500 kgs from the ward.
Compactor travels around 80 kms in each trip (from parking point to the dumpsite to the parking point). Dumpsite is around 30 kms from transfer station.
City Sanitation Plan Nellore
Page 105 of 128
Compactor consumes 1 litre of diesel for 3 kms. Therefore, it costs Rs. 1100/- for transporting.
Therefore, cost that can be reduced by removing bins in the wards and just by controlling
vehicle trips is estimated at nearly Rs. 1,00,000/- per month (auto costs per month + dumper
placer cost per month + compactors cost per month). This can be expanded and can be
implemented in the entire city that would turn the entire city into zero bin city. In addition to
this the ward workers gains profits by selling the recyclable waste and citizen profits by
manure. Also maintenance costs will be reduced to the corporation.
3. Resource recovery through material recycling
It is recommended to NMC to set up small material recovery facility where sorting of waste
can take place. Material recovery facilities (MRFs) are an essential part of a zero waste
management program as it receives separates and prepares recyclable materials for
marketing to end-user manufacturers. The primary objective of setting material recovery
facility is to maximize the quantity of recyclables processed, while producing materials that
will generate the highest possible revenues in the market. MRFs can also process wastes into a
feedstock for biological conversion through composting and anaerobic digestion. The
desirable sorting streams at household level are:
Dry recyclable materials e.g. glass, paper, plastics, cans etc.,
Bio-waste and garden waste,
Combined MSW (mixed waste).
Centralized sorting is desirable but expensive where recyclable materials are collected in a
mixed state. Hand sorting from a raised picking belt is extensively adopted in several countries
but is not desirable.
3. Decentralized stations for Solid Waste Management
Decentralized transfer stations can beone of the most suitable techniques for cities like
Nellore. A totally decentralized collection and transfer system is recommended where each
ward or a group of ward will have a transfer station from where the municipal solid waste in
compacted form will be transported for processing and disposal.
4. Maximize on market opportunities in Resource Recovery Technologies
With the aim of reducing the land requirement for landfilling the waste, resource recovery
technologies such as composting, biomethanation, electricity generation from incineration
and landfill gas recovery should be implemented to enhance its market attractiveness.. Other
suggestions to increase the economic benefits are:
Promoting decentralized composting at household level
Decentralized bio-methanation plant of 10 TPD for hotel, vegetable and fruit market waste
Development of independent processing facility for ‘E Waste’ on BOT/PPP basis.
City Sanitation Plan Nellore
Page 106 of 128
5. Waste Disposal (without resource recovery)
At the end of all sorting processes, prior to this disposal, waste may need to be subjected to
transformation by mechanical treatment, thermal treatment or other methods to make it
suitable for land filling. The following are aspects that have to be taken into account:
Account for all Land Disposal Uses: Land disposal is an essential part of every solid waste management system. Regardless of the extent of recycling or resource recovery, there are always some wastes that must be put in a land disposal site (e.g., ashes from incineration, non-compostable residuals). In virtually all developing countries there is an urgent need to close existing open dumpsites and implement sanitary landfills. Identify land and plan for dumping of inert material and rejects (30% of total waste generated) for next 30 years
Capping of existing dumped garbage site should be carried out. This will include capping, leachate collection & treatment, dislodgement & compaction of waste & treatment dislodgement & compaction geo-membrane, methane gas trapping & land reclamation. Development of this proposed capped site should be planned for next 15 years.
Management Information System:
NMC is collecting and processing data electronically thereby avoiding day to day human
intervention, and reducing human errors. Data thus stored is also readily available. Short
Messaging Services (SMS) prevailing in the city shall be scaled to 100% coverage and
participation. ,
Short Messaging Services (SMS) can also be used to register a complaint from the citizens
thereby maintain a electronic complaint redressal system as well. .
The table below briefly discusses goals and actions recommended for Nellore Municipal
Corporation.
Table 52: Goals and actions recommended for SWM
PHASE YEAR Actions
Short Term
Within 5 years
Initiate primary segregation , storage and door to door collection system (for remaining 60% households)
Introduce user charges
Procurement of gears/equipment for street sweeping, and waste transportation
Set up material recovery facility
Promote decentralized solid waste management practices
Conduct awareness generation and sensitization towards segregation, 3Rs (reduce, reuse, recycle)
Enforcement of application of Polluter pays Principle/penalty for littering as per Draft MSW (M&H) Rules 2015
Mid-Term Within 6-10 years
Augmentation of SWM system to meet the demands of growing population
Regular O&M involving in entire system of SWM
Identify land for landfilling purpose
Replacements of components as per the maintenance plan
Regular M&E of entire SWM system
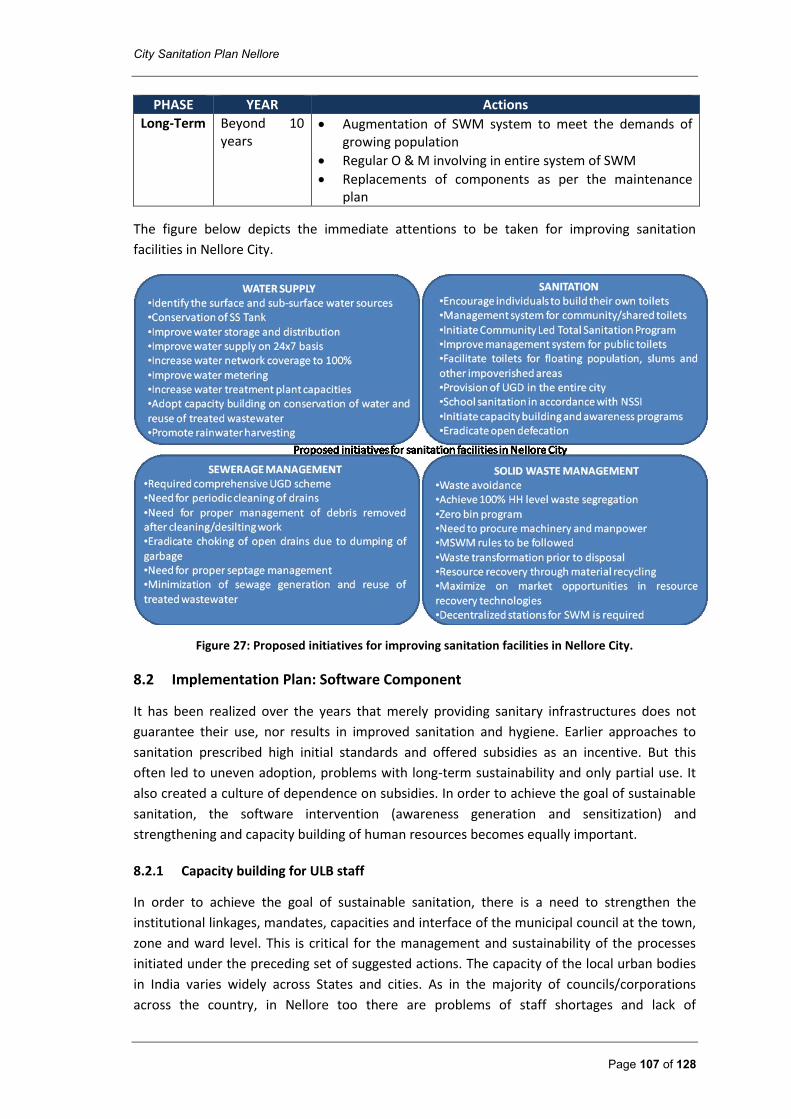
City Sanitation Plan Nellore
Page 107 of 128
PHASE YEAR Actions
Long-Term Beyond 10 years
Augmentation of SWM system to meet the demands of growing population
Regular O & M involving in entire system of SWM
Replacements of components as per the maintenance plan
The figure below depicts the immediate attentions to be taken for improving sanitation
facilities in Nellore City.
Figure 27: Proposed initiatives for improving sanitation facilities in Nellore City.
8.2 Implementation Plan: Software Component
It has been realized over the years that merely providing sanitary infrastructures does not
guarantee their use, nor results in improved sanitation and hygiene. Earlier approaches to
sanitation prescribed high initial standards and offered subsidies as an incentive. But this
often led to uneven adoption, problems with long-term sustainability and only partial use. It
also created a culture of dependence on subsidies. In order to achieve the goal of sustainable
sanitation, the software intervention (awareness generation and sensitization) and
strengthening and capacity building of human resources becomes equally important.
8.2.1 Capacity building for ULB staff
In order to achieve the goal of sustainable sanitation, there is a need to strengthen the
institutional linkages, mandates, capacities and interface of the municipal council at the town,
zone and ward level. This is critical for the management and sustainability of the processes
initiated under the preceding set of suggested actions. The capacity of the local urban bodies
in India varies widely across States and cities. As in the majority of councils/corporations
across the country, in Nellore too there are problems of staff shortages and lack of
City Sanitation Plan Nellore
Page 108 of 128
appropriate skills. The problem becomes more aggravated at the zonal levels. The status of
the sanitation staff finds special mention even in the NUSP. They are a critical link in the
efficiency of the entire city sanitation system. A systematic institutional development exercise
is required. Broadly, the issues with existing capacity can be categorized into the following:
Lack of personnel with appropriate skill sets
Inadequate skill sets of personnel already deployed
Lack of appropriate institutional framework
Capacity gaps at the apex level
Capacity building will need to be done at three levels - city level, zone level and ward and
lower level i.e. clusters. Capacity building shall focus on specific orientation on health, hygiene
and sanitation practices as well as planning and monitoring mechanisms required to
implement the CSP at the ward/cluster level. Implementation of the capacity building shall be
done through a variety of methods such as exposure visit/cross visit, workshops, training, and
learning by doing and technical assistance. The capacity building needs of sanitation managers
should be given priority.
8.2.2 Formation of monitoring and supervision cell
It is a common practice that State and National governments support urban local bodies in
putting in place infrastructure, with different levels of finance and implementation support.
However, it has been observed and proven that, over a period of time, the responsibility of
the maintenance of the infrastructure is not assumed by any institution, leading to
deterioration and lack of use, which in turns make the project a dead investment. No agency
concerned in the city vicinity would be in a position to monitor it. This has been a crucial issue
in sanitation, which has hampered the growth in terms of sanitation and also has pushed the
cities to look unhygienic by redundant services. Therefore, having a sound institutional
arrangement would enable the infrastructure to be used in a proposed manner to its fullest
capacity coupled with a monitoring and supervision and community mobilization through
awareness programmes on various health and sanitation issues.
The first important step before implementing the project design (hardware and software) is to create a Project Monitoring Unit (PMU). This cell should be integrated within the Nellore Municipal Corporation and responsible for the successful implementation of the projects. It would be advantageous if the head of the cell is experienced in grassroots movements and particular in the work of community based organizations (CBOs). The stakeholders of the cell and their responsibilities are the following:
Special cell in NMC: The organizational framework needs to be created to look after hardware activities (engineering activities) as well as software activities like community mobilization and community development activities. This cell will assist CBO’s in their O&M activities. The NMC will act as a coordinating agency between the different stakeholders. Furthermore, the NMC is expected to provide the required funds and to make sure that land is made available for toilet construction.
Sanitary engineering wing: It will be directly responsible for new infrastructure as well as repairing the old infrastructure, if necessary. The entire process of construction such as planning, designing and construction activities needs to be planned and implemented in consultation with community and community development cell of NMC.
City Sanitation Plan Nellore
Page 109 of 128
Stand-by technical aid: This group shall be a pool of technical experts in sewage systems and will come into action in case of damaged material, problems with sewer lines, clogged toilets, broken washbasins, etc. which cannot be mended by the caretakers.
Septage Management Plan team: This unit is in charge of accomplishing an appropriate transportation system of wastewater and sludge within the whole sanitation system and also organizes the transportation of sludge from those places which are not connected to the sewer-lines. Furthermore, this unit has to coordinate and this team will also take care of treatment of sludge.
Sanitation Inspector: The Sanitation Inspector will run the O&M-unit through the supervisors heading each unit. Main task of the Inspector is to organize any provision needed at toilet blocks and for the wastewater conveyance system. Furthermore the sanitation inspector is in charge of ensuring proper maintenance of facilities in his jurisdiction. The direct supervision of facilities lies in the hand of the supervisor of each unit. Nevertheless, the sanitation inspector will have to perform unannounced checks to different sites to ensure compliance with monitoring norms.
Supervisor: The supervisor is responsible for the schedule of the shifts of his team and will be their contact person regarding claims, damages etc. Furthermore, the supervisor takes care of the distribution of the required equipment (according to the manual) to his team – the material being provided by the Sanitation Inspector of the District.
Caretakers: The member of CBO who will be assigned for the actual O&M of the toilets will attend beforehand a specific training to learn about the standard that is expected by NMC.
Having described the stakeholders with their responsibilities integrated within the
recommended NMC sanitation cell, it is important to highlight other actors strongly connected
and involved in the new sanitation system:
Local Councilors: Political will is important for the success of any project. Local councilors bring with them the political strength to the project implementation and management. They also act as local champions bringing community together.
Construction contractors: Private contractors have to be strongly accountable for constructing high quality sanitation facilities in local communities.
In order to achieve the above described structure, and to form a CBO, the local authority will
have to take the lead. As described above, the start up phase will concentrate on the
grassroot level. It is strongly recommended to collaborate with agencies which can look back
on years of experience and numerous success stories. The following chart presents the
institutional set up for O&M of sanitation facilities, based on the CLTS approach:
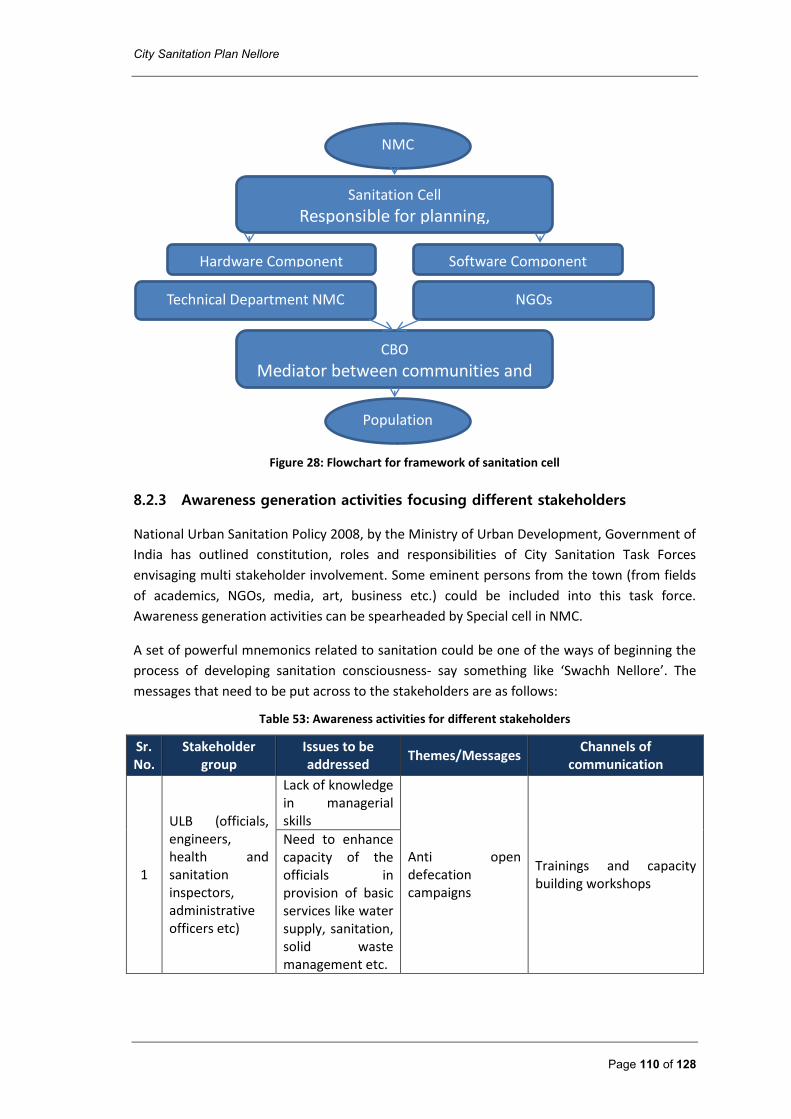
City Sanitation Plan Nellore
Page 110 of 128
Figure 28: Flowchart for framework of sanitation cell
8.2.3 Awareness generation activities focusing different stakeholders
National Urban Sanitation Policy 2008, by the Ministry of Urban Development, Government of
India has outlined constitution, roles and responsibilities of City Sanitation Task Forces
envisaging multi stakeholder involvement. Some eminent persons from the town (from fields
of academics, NGOs, media, art, business etc.) could be included into this task force.
Awareness generation activities can be spearheaded by Special cell in NMC.
A set of powerful mnemonics related to sanitation could be one of the ways of beginning the
process of developing sanitation consciousness- say something like ‘Swachh Nellore’. The
messages that need to be put across to the stakeholders are as follows:
Table 53: Awareness activities for different stakeholders
Sr. No.
Stakeholder group
Issues to be addressed
Themes/Messages Channels of
communication
1
ULB (officials, engineers, health and sanitation inspectors, administrative officers etc)
Lack of knowledge in managerial skills
Anti open defecation campaigns
Trainings and capacity building workshops
Need to enhance capacity of the officials in provision of basic services like water supply, sanitation, solid waste management etc.
Sanitation Cell
Responsible for planning, implementation, management and
monitoring of the project Hardware Component Software Component
Technical Department NMC
Technical support for sanitation facilities
NGOs
Mediator between PMC, IEC/training CBO
Mediator between communities and NMC
Population
NMC
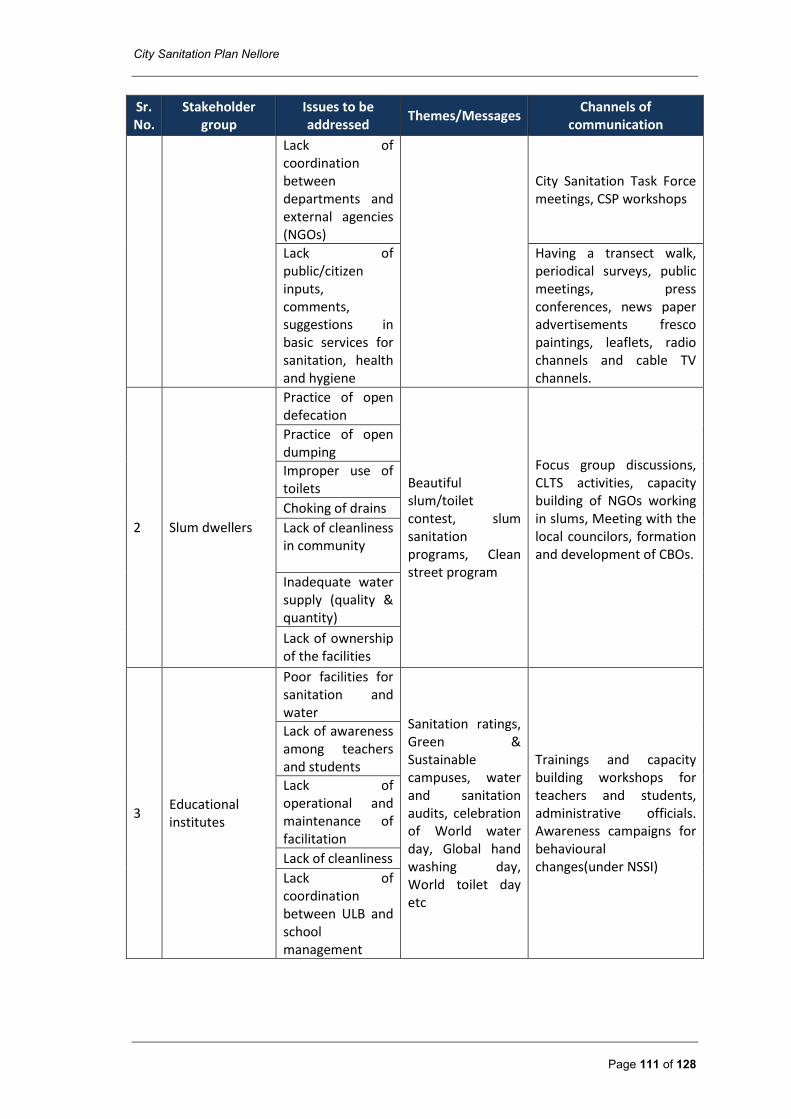
City Sanitation Plan Nellore
Page 111 of 128
Sr. No.
Stakeholder group
Issues to be addressed
Themes/Messages Channels of
communication
Lack of coordination between departments and external agencies (NGOs)
City Sanitation Task Force meetings, CSP workshops
Lack of public/citizen inputs, comments, suggestions in basic services for sanitation, health and hygiene
Having a transect walk, periodical surveys, public meetings, press conferences, news paper advertisements fresco paintings, leaflets, radio channels and cable TV channels.
2 Slum dwellers
Practice of open defecation
Beautiful slum/toilet contest, slum sanitation programs, Clean street program
Focus group discussions, CLTS activities, capacity building of NGOs working in slums, Meeting with the local councilors, formation and development of CBOs.
Practice of open dumping
Improper use of toilets
Choking of drains
Lack of cleanliness in community
Inadequate water supply (quality & quantity)
Lack of ownership of the facilities
3 Educational institutes
Poor facilities for sanitation and water
Sanitation ratings, Green & Sustainable campuses, water and sanitation audits, celebration of World water day, Global hand washing day, World toilet day etc
Trainings and capacity building workshops for teachers and students, administrative officials. Awareness campaigns for behavioural changes(under NSSI)
Lack of awareness among teachers and students
Lack of operational and maintenance of facilitation
Lack of cleanliness
Lack of coordination between ULB and school management
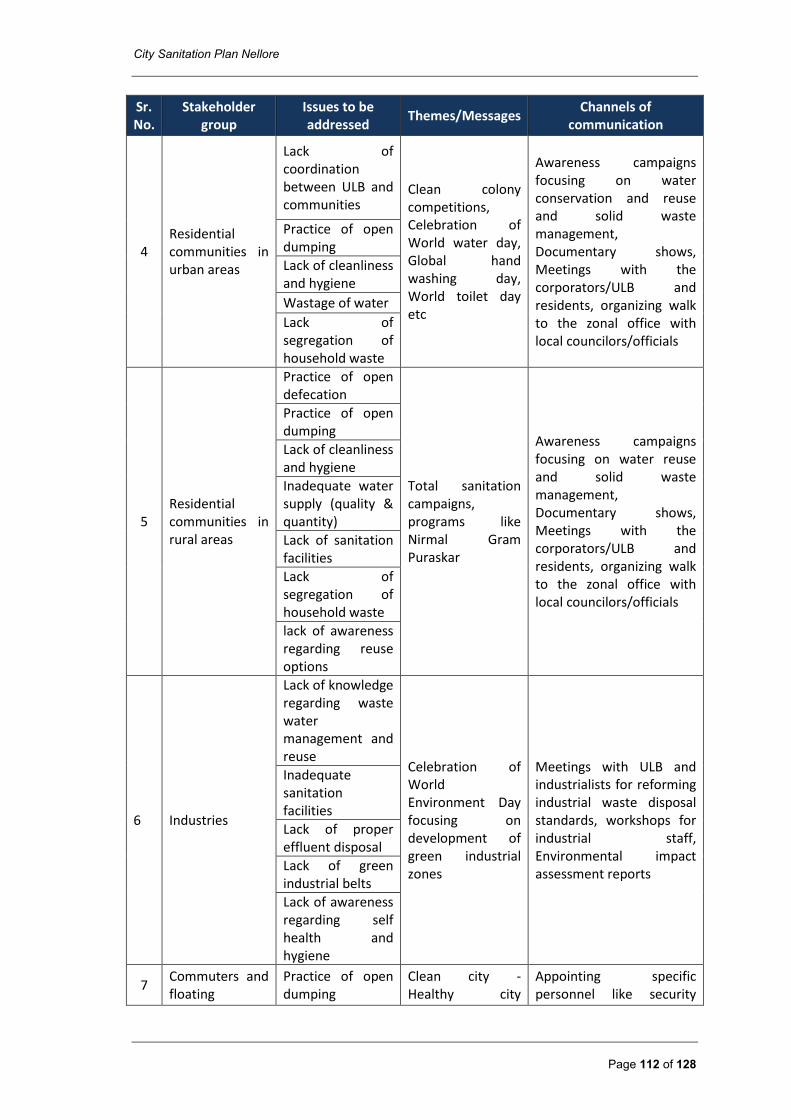
City Sanitation Plan Nellore
Page 112 of 128
Sr. No.
Stakeholder group
Issues to be addressed
Themes/Messages Channels of
communication
4 Residential communities in urban areas
Lack of coordination between ULB and communities
Clean colony competitions, Celebration of World water day, Global hand washing day, World toilet day etc
Awareness campaigns focusing on water conservation and reuse and solid waste management, Documentary shows, Meetings with the corporators/ULB and residents, organizing walk to the zonal office with local councilors/officials
Practice of open dumping
Lack of cleanliness and hygiene
Wastage of water
Lack of segregation of household waste
5 Residential communities in rural areas
Practice of open defecation
Total sanitation campaigns, programs like Nirmal Gram Puraskar
Awareness campaigns focusing on water reuse and solid waste management, Documentary shows, Meetings with the corporators/ULB and residents, organizing walk to the zonal office with local councilors/officials
Practice of open dumping
Lack of cleanliness and hygiene
Inadequate water supply (quality & quantity)
Lack of sanitation facilities
Lack of segregation of household waste
lack of awareness regarding reuse options
6 Industries
Lack of knowledge regarding waste water management and reuse
Celebration of World Environment Day focusing on development of green industrial zones
Meetings with ULB and industrialists for reforming industrial waste disposal standards, workshops for industrial staff, Environmental impact assessment reports
Inadequate sanitation facilities
Lack of proper effluent disposal
Lack of green industrial belts
Lack of awareness regarding self health and hygiene
7 Commuters and floating
Practice of open dumping
Clean city - Healthy city
Appointing specific personnel like security
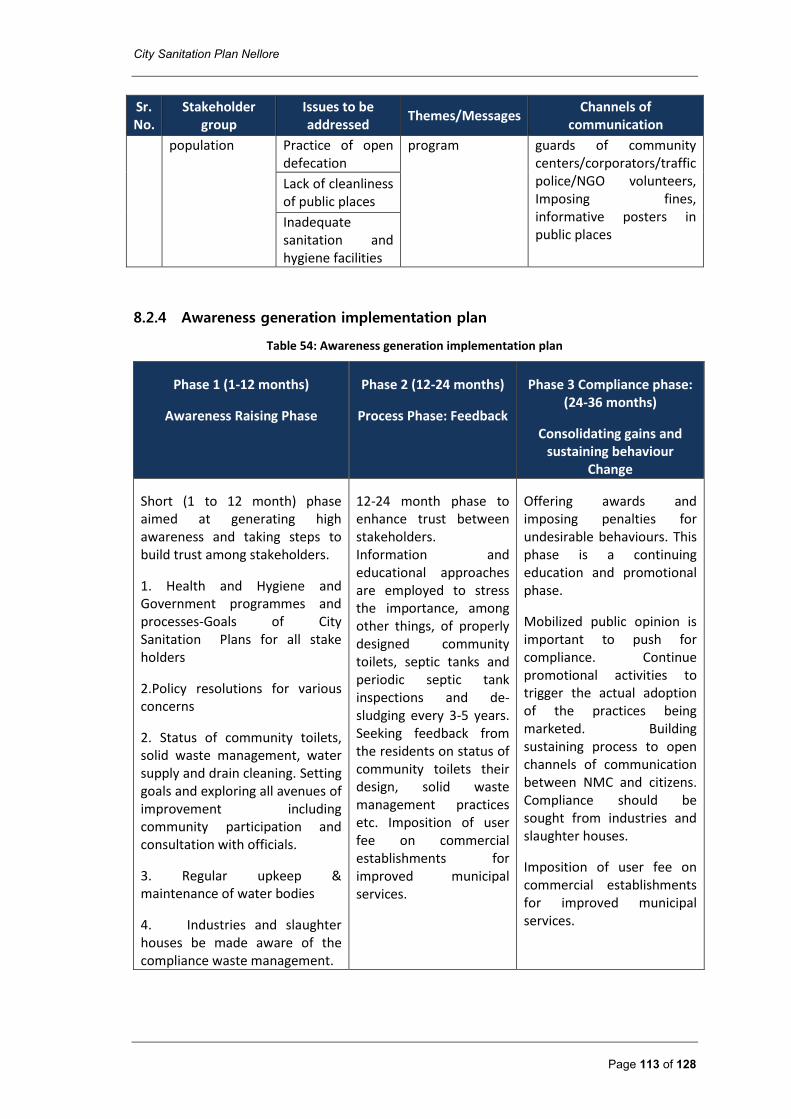
City Sanitation Plan Nellore
Page 113 of 128
Sr. No.
Stakeholder group
Issues to be addressed
Themes/Messages Channels of
communication
population Practice of open defecation
program guards of community centers/corporators/traffic police/NGO volunteers, Imposing fines, informative posters in public places
Lack of cleanliness of public places
Inadequate sanitation and hygiene facilities
8.2.4 Awareness generation implementation plan
Table 54: Awareness generation implementation plan
Phase 1 (1-12 months)
Awareness Raising Phase
Phase 2 (12-24 months)
Process Phase: Feedback
Phase 3 Compliance phase: (24-36 months)
Consolidating gains and sustaining behaviour
Change
Short (1 to 12 month) phase aimed at generating high awareness and taking steps to build trust among stakeholders.
1. Health and Hygiene and Government programmes and processes-Goals of City Sanitation Plans for all stake holders
2.Policy resolutions for various concerns
2. Status of community toilets, solid waste management, water supply and drain cleaning. Setting goals and exploring all avenues of improvement including community participation and consultation with officials.
3. Regular upkeep & maintenance of water bodies
4. Industries and slaughter houses be made aware of the compliance waste management.
12-24 month phase to enhance trust between stakeholders. Information and educational approaches are employed to stress the importance, among other things, of properly designed community toilets, septic tanks and periodic septic tank inspections and de-sludging every 3-5 years. Seeking feedback from the residents on status of community toilets their design, solid waste management practices etc. Imposition of user fee on commercial establishments for improved municipal services.
Offering awards and imposing penalties for undesirable behaviours. This phase is a continuing education and promotional phase.
Mobilized public opinion is important to push for compliance. Continue promotional activities to trigger the actual adoption of the practices being marketed. Building sustaining process to open channels of communication between NMC and citizens. Compliance should be sought from industries and slaughter houses.
Imposition of user fee on commercial establishments for improved municipal services.
City Sanitation Plan Nellore
Page 114 of 128
9 FINANCING OPTIONS AND BLOCK ESTIMATES
9.1 Financial Options
Expansion of sanitation systems will not be possible unless an institution or group of
individuals, preferably the intended users, is willing to pay for the new facilities required. Even
when facilities have been provided, they will fail sooner or later unless funds are available to
cover their ongoing operation and maintenance. So, it will be impossible to first provide and
then sustain services to cities as a whole unless the finances of those who are responsible for
providing and managing them are sound. Most conventional financing goes to established
services in already served areas and to conventional technological and administrative systems.
This approach is not going to fulfil the sanitation target of the MDGs and beyond. To revise the
current trend of an ever-growing sanitation backlog in poor urban areas we need not only to
invest more and more wisely, but also finance in much more creative ways.
Every proposal for a sanitation service, and its non-technical components, needs financing.
The amounts required can be estimated in the early stages of strategic planning, and should
include costs to be incurred by the municipal government and other parties. The strategy will
consider both the initial capital and recurrent financing needs. The sustainability of most
sanitation systems depends on having adequate recurrent funds for operations and
maintenance. Financing is often regarded as the defining factor in sanitation development.
This is true, especially if a city relies only on the local government budget. However, with a
good citywide sanitation plan, a municipal government will plan to access finances from other
sources, such as central government, provincial government, the private sector and the public.
Furthermore, since the nominal amount of municipal budget is small, sanitation budgets are
correspondingly small. The citywide sanitation strategy can propose a larger allocation from
the municipal budget and recommend optimizing use of funds from other sources. Increasing
the municipal budget allocation for sanitation requires commitment from all relevant decision
makers, both in the legislative and executive bodies. Approval from the local legislature is key,
and such support can be gained if the sanitation working group designs awareness-building
activities for all decision makers. Thus, strategies for developing funding for sanitation needs
to be supported by strategies for developing non-technical components, especially community
participation, policy and regulation, and institutions. Without the support of these
components, the sanitation working group would have difficulty in obtaining additional
financing for sanitation development. These mutual linkages will be described in the citywide
sanitation plan.
9.1.1 14th Finance Commission:
The 14th finance commission has grants to the local bodies towards supporting and
strengthening the delivery of basic services like water supply, sanitation including Septage
management, sewerage, storm water drainage and solid waste management, street lighting,
local body roads and footpaths, parks, playgrounds, burial and cremation grounds. The 14th
finance commission is meant to only spend the grants on the basic services within the
functions assigned to them under relevant legislations.
City Sanitation Plan Nellore
Page 115 of 128
9.1.2 State Finance Commission:
The State Finance Commission plays a vital role in cities achieving open defecation free status.
The SFC grants help the cities to take care of the salaries of the municipal employees apart
from providing funds for the other basic services to the urban citizens apart from urban poor.
9.1.3 Swachh Bharat Mission
In April 1999, the GoI restructured the Comprehensive Rural Sanitation Programme and
launched the Total Sanitation Campaign (TSC) which was again renamed as Nirmal Bharat
Abhiyan (NBA). On 2nd October, 2014, the prime minister of India launched Swachh Bharat
Mission that aims at eradicating open defecation by 2019, thus restricting the NBA. The
programme has funds allocated under NBA which were not utilized and also received funding
and technical support from World Bank, corporations as part of Corporate Social
Responsibility (CSR) initiatives, and by state governments under Sarva Siksha Abhiyan and
Rashtriya Madhyamik Shiksha Abhiyan schemes. The program plans to construct 12 crore
toilets in rural India by October 2019.
During 2013-2014, the GoI has sanctioned Rs. 40 Cr towards strengthening SWM, IHHL & CTBs,
IEC activities and Capacity Building to the state of Andhra Pradesh and during 2014-2015 it has
sanctioned Rs. 30 Cr to the state of Andhra Pradesh towards constructing IHHL.
9.1.4 Jawaharlal Nehru National Urban Renewal Missoin, GoI, JnNURM
Under the Ministry of Urban Development, there are several components which have funding
options for sanitation. The Urban Infrastructure and Governance (UIG) component has funds
for building sewerage network and the Urban Infrastructure Development Scheme for Small &
Medium Towns (UIDSSMT) component has funds for developing and strengthening sanitation
related activities like Storm Water Drainage, Sewerage, SWM and Water Supply.
9.1.5 Atal Mission for Rejuvenation and Urban Transformation (AMRUT)
Under the AMRUT scheme, the GoI of India has funds for developing and implementing
projects related to Water Supply and Parks/Green spaces. The aim of this programme is to
encourage reforms and fast track planned development of identified cities. Focus is to be on
efficiency in urban infrastructure and service delivery mechanisms, community participation,
and accountability of ULBs/ Parastatal agencies towards citizens.
9.1.6 Ministry of Housing and Urban Poverty Alleviation (MoHUPA), GoI
Ministry of Housing and urban poverty alleviation provides large amount of finance for the
Urban Slums in India. The Ministry has several poverty alleviation programs which cater to the
needs of housing in turn catering to the issue of sanitation by constructing toilets in the
housing structure.
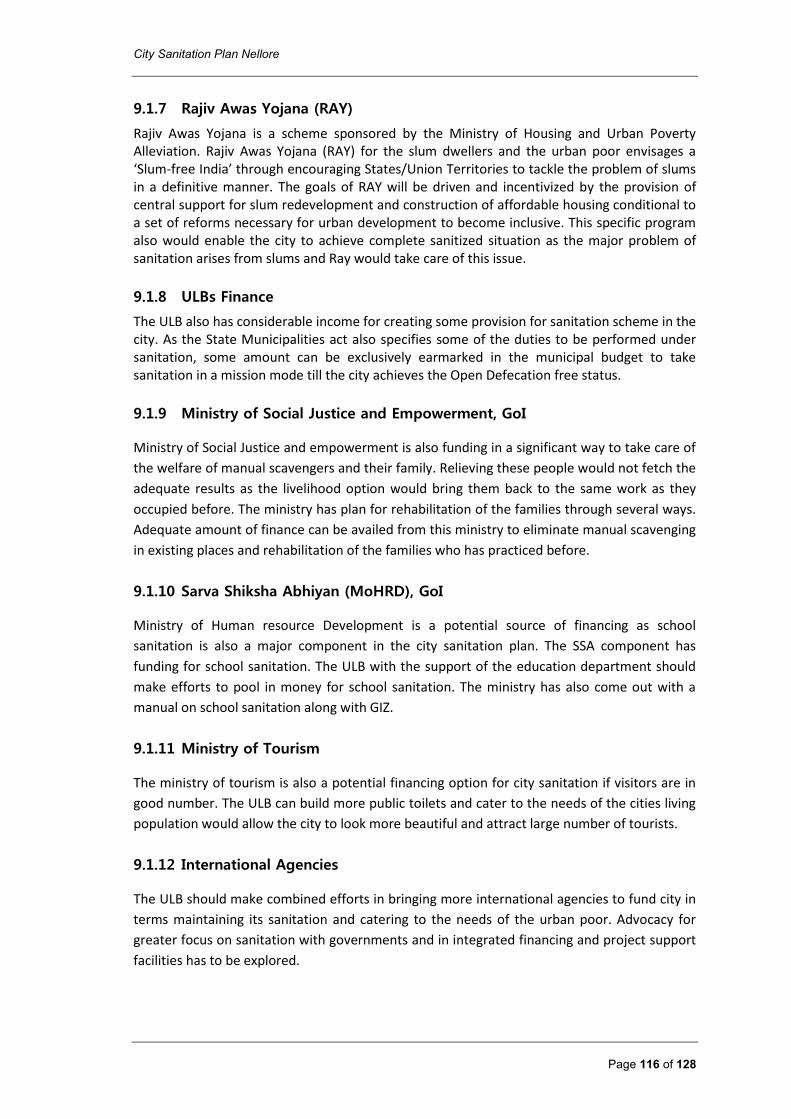
City Sanitation Plan Nellore
Page 116 of 128
9.1.7 Rajiv Awas Yojana (RAY)
Rajiv Awas Yojana is a scheme sponsored by the Ministry of Housing and Urban Poverty Alleviation. Rajiv Awas Yojana (RAY) for the slum dwellers and the urban poor envisages a ‘Slum-free India’ through encouraging States/Union Territories to tackle the problem of slums in a definitive manner. The goals of RAY will be driven and incentivized by the provision of central support for slum redevelopment and construction of affordable housing conditional to a set of reforms necessary for urban development to become inclusive. This specific program also would enable the city to achieve complete sanitized situation as the major problem of sanitation arises from slums and Ray would take care of this issue.
9.1.8 ULBs Finance
The ULB also has considerable income for creating some provision for sanitation scheme in the city. As the State Municipalities act also specifies some of the duties to be performed under sanitation, some amount can be exclusively earmarked in the municipal budget to take sanitation in a mission mode till the city achieves the Open Defecation free status.
9.1.9 Ministry of Social Justice and Empowerment, GoI
Ministry of Social Justice and empowerment is also funding in a significant way to take care of
the welfare of manual scavengers and their family. Relieving these people would not fetch the
adequate results as the livelihood option would bring them back to the same work as they
occupied before. The ministry has plan for rehabilitation of the families through several ways.
Adequate amount of finance can be availed from this ministry to eliminate manual scavenging
in existing places and rehabilitation of the families who has practiced before.
9.1.10 Sarva Shiksha Abhiyan (MoHRD), GoI
Ministry of Human resource Development is a potential source of financing as school
sanitation is also a major component in the city sanitation plan. The SSA component has
funding for school sanitation. The ULB with the support of the education department should
make efforts to pool in money for school sanitation. The ministry has also come out with a
manual on school sanitation along with GIZ.
9.1.11 Ministry of Tourism
The ministry of tourism is also a potential financing option for city sanitation if visitors are in
good number. The ULB can build more public toilets and cater to the needs of the cities living
population would allow the city to look more beautiful and attract large number of tourists.
9.1.12 International Agencies
The ULB should make combined efforts in bringing more international agencies to fund city in
terms maintaining its sanitation and catering to the needs of the urban poor. Advocacy for
greater focus on sanitation with governments and in integrated financing and project support
facilities has to be explored.
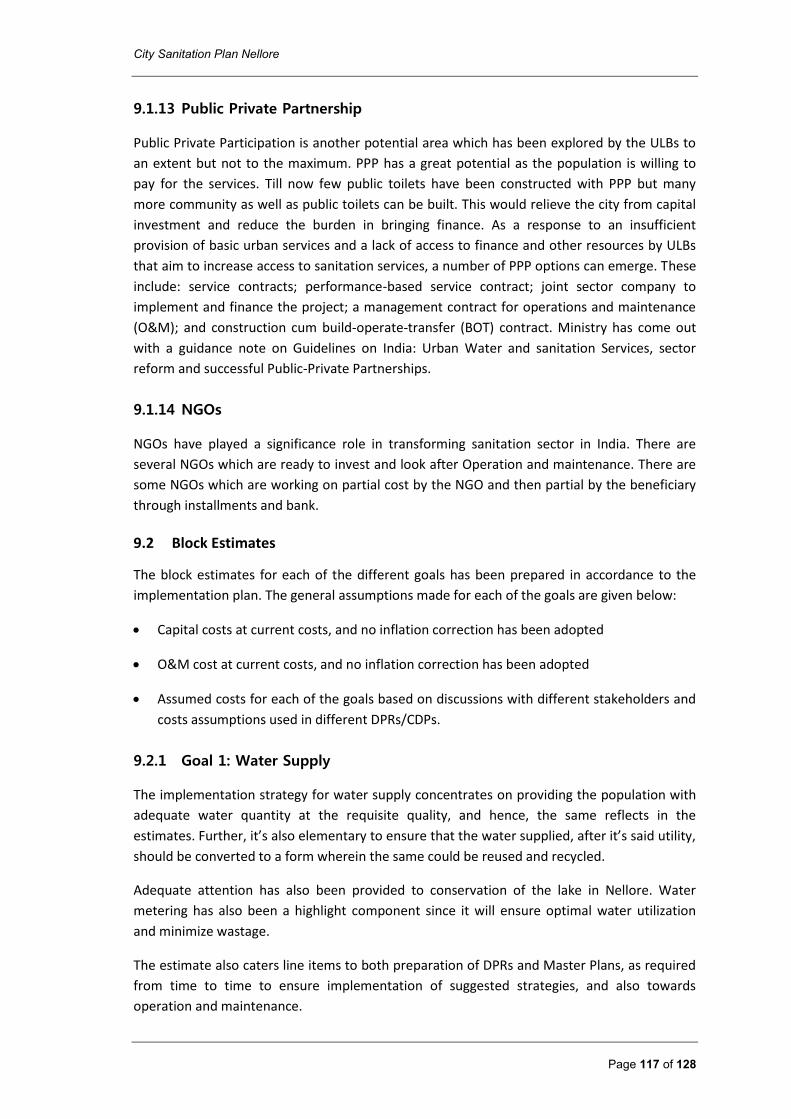
City Sanitation Plan Nellore
Page 117 of 128
9.1.13 Public Private Partnership
Public Private Participation is another potential area which has been explored by the ULBs to
an extent but not to the maximum. PPP has a great potential as the population is willing to
pay for the services. Till now few public toilets have been constructed with PPP but many
more community as well as public toilets can be built. This would relieve the city from capital
investment and reduce the burden in bringing finance. As a response to an insufficient
provision of basic urban services and a lack of access to finance and other resources by ULBs
that aim to increase access to sanitation services, a number of PPP options can emerge. These
include: service contracts; performance-based service contract; joint sector company to
implement and finance the project; a management contract for operations and maintenance
(O&M); and construction cum build-operate-transfer (BOT) contract. Ministry has come out
with a guidance note on Guidelines on India: Urban Water and sanitation Services, sector
reform and successful Public-Private Partnerships.
9.1.14 NGOs
NGOs have played a significance role in transforming sanitation sector in India. There are
several NGOs which are ready to invest and look after Operation and maintenance. There are
some NGOs which are working on partial cost by the NGO and then partial by the beneficiary
through installments and bank.
9.2 Block Estimates
The block estimates for each of the different goals has been prepared in accordance to the
implementation plan. The general assumptions made for each of the goals are given below:
Capital costs at current costs, and no inflation correction has been adopted
O&M cost at current costs, and no inflation correction has been adopted
Assumed costs for each of the goals based on discussions with different stakeholders and
costs assumptions used in different DPRs/CDPs.
9.2.1 Goal 1: Water Supply
The implementation strategy for water supply concentrates on providing the population with
adequate water quantity at the requisite quality, and hence, the same reflects in the
estimates. Further, it’s also elementary to ensure that the water supplied, after it’s said utility,
should be converted to a form wherein the same could be reused and recycled.
Adequate attention has also been provided to conservation of the lake in Nellore. Water
metering has also been a highlight component since it will ensure optimal water utilization
and minimize wastage.
The estimate also caters line items to both preparation of DPRs and Master Plans, as required
from time to time to ensure implementation of suggested strategies, and also towards
operation and maintenance.
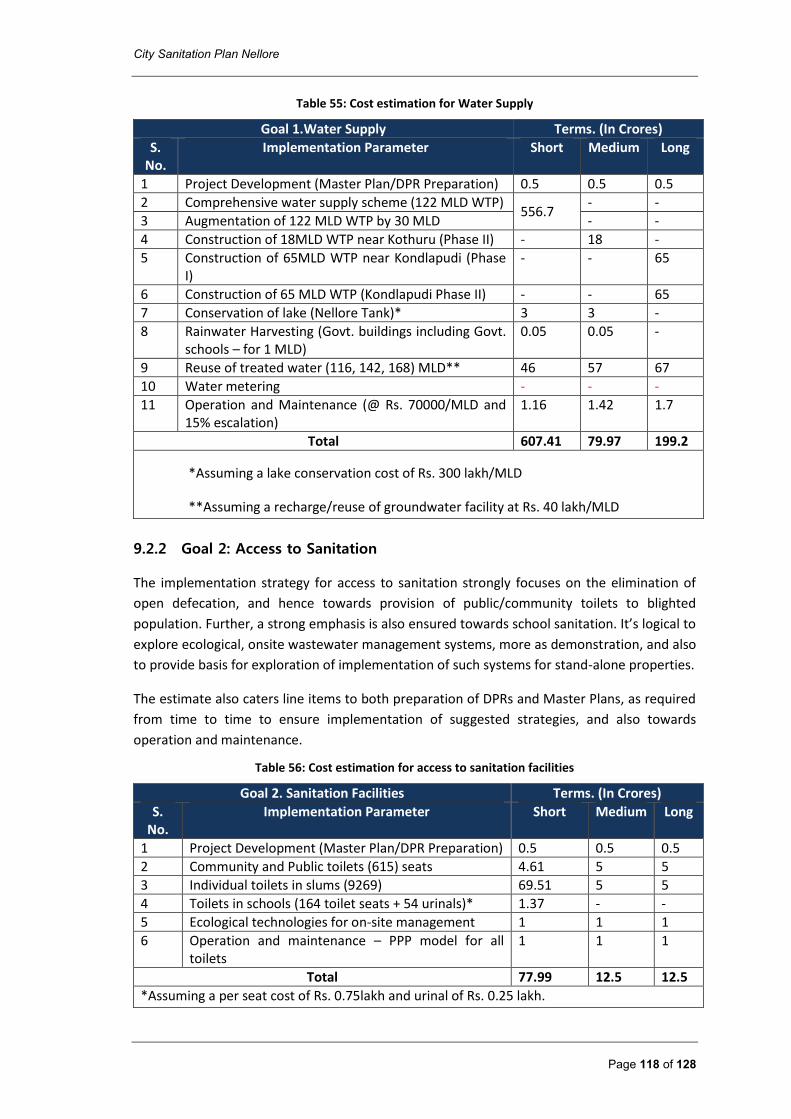
City Sanitation Plan Nellore
Page 118 of 128
Table 55: Cost estimation for Water Supply
Goal 1.Water Supply Terms. (In Crores)
S. No.
Implementation Parameter Short Medium Long
1 Project Development (Master Plan/DPR Preparation) 0.5 0.5 0.5
2 Comprehensive water supply scheme (122 MLD WTP) 556.7
- -
3 Augmentation of 122 MLD WTP by 30 MLD - -
4 Construction of 18MLD WTP near Kothuru (Phase II) - 18 -
5 Construction of 65MLD WTP near Kondlapudi (Phase I)
- - 65
6 Construction of 65 MLD WTP (Kondlapudi Phase II) - - 65
7 Conservation of lake (Nellore Tank)* 3 3 -
8 Rainwater Harvesting (Govt. buildings including Govt. schools – for 1 MLD)
0.05 0.05 -
9 Reuse of treated water (116, 142, 168) MLD** 46 57 67
10 Water metering - - -
11 Operation and Maintenance (@ Rs. 70000/MLD and 15% escalation)
1.16 1.42 1.7
Total 607.41 79.97 199.2
*Assuming a lake conservation cost of Rs. 300 lakh/MLD
**Assuming a recharge/reuse of groundwater facility at Rs. 40 lakh/MLD
9.2.2 Goal 2: Access to Sanitation
The implementation strategy for access to sanitation strongly focuses on the elimination of
open defecation, and hence towards provision of public/community toilets to blighted
population. Further, a strong emphasis is also ensured towards school sanitation. It’s logical to
explore ecological, onsite wastewater management systems, more as demonstration, and also
to provide basis for exploration of implementation of such systems for stand-alone properties.
The estimate also caters line items to both preparation of DPRs and Master Plans, as required
from time to time to ensure implementation of suggested strategies, and also towards
operation and maintenance.
Table 56: Cost estimation for access to sanitation facilities
Goal 2. Sanitation Facilities Terms. (In Crores)
S. No.
Implementation Parameter Short Medium Long
1 Project Development (Master Plan/DPR Preparation) 0.5 0.5 0.5
2 Community and Public toilets (615) seats 4.61 5 5
3 Individual toilets in slums (9269) 69.51 5 5
4 Toilets in schools (164 toilet seats + 54 urinals)* 1.37 - -
5 Ecological technologies for on-site management 1 1 1
6 Operation and maintenance – PPP model for all toilets
1 1 1
Total 77.99 12.5 12.5
*Assuming a per seat cost of Rs. 0.75lakh and urinal of Rs. 0.25 lakh.
City Sanitation Plan Nellore
Page 119 of 128
9.2.3 Goal 3: UGD and wastewater treatment system
As an immediate action point, it is important to provide adequate attention to manage the
Septage generated for the numerous septic tanks the city now has. This definitely is a must,
given the context of the town and the timeframe for implementation of underground
drainage system, and wastewater treatment system.
Further, immediate attention is provided to set-up wastewater management system for both
the highly dense as well as developing areas.
The estimate also caters line items to both preparation of DPRs and Master Plans, as required
from time to time to ensure implementation of suggested strategies, and also towards
operation and maintenance.
Table 57: Cost estimation for sewerage management
Goal 3. UGD & Wastewater management Terms. (In Crores)
S. No.
Implementation Parameter Short Medium Long
1 Project development (Master plan/DPR preparation) 0.5 0.5 0.5
2 Under ground drainage network 580.85
- -
3 Sewage Treatment Plants (105MLD capacity)* - -
4 Sewage Treatment Plant (50 MLD capacity)* - 50
5 Sewage Treatment Plant (50 MLD capacity)* 50
6 Operation and Maintenance costs 0.5 1.5 2
Total 581.85 52 52.5
*Assuming an STP cost of Rs. 1 Cr/MLD
9.2.4 Goal 4: Storm water management
With the provision of underground drainage system, the storm water drains will cater only the
storm water, and hence the goal is interlinked with the successful implementation of the goal
for UGD. The storm water management also focuses on micro-shed management by involving
the lakes, and ensuring on-site rainwater infiltration mechanisms.
The estimate also caters line items to both preparation of DPRs and Master Plans, as required
from time to time to ensure implementation of suggested strategies, and also towards
operation and maintenance.
Table 58: Cost estimation for storm water management
Goal 4. Storm water management Terms. (In Crores)
S. No.
Implementation Parameter Short Medium Long
1 Project development (Master plan/DPR preparation) 0.75 0.75 1
2 Storm water management plan (300 km length) 101.4 - -
3 Storm water management plan (300 km length) - 101.4 -
4 Storm water management plan (300 km length) - - 101.4
5 Operation and maintenance costs 0.5 0.5 1
Total 102.65 102.65 103.4
*Cost of drain @ Rs. 12 lakh/km
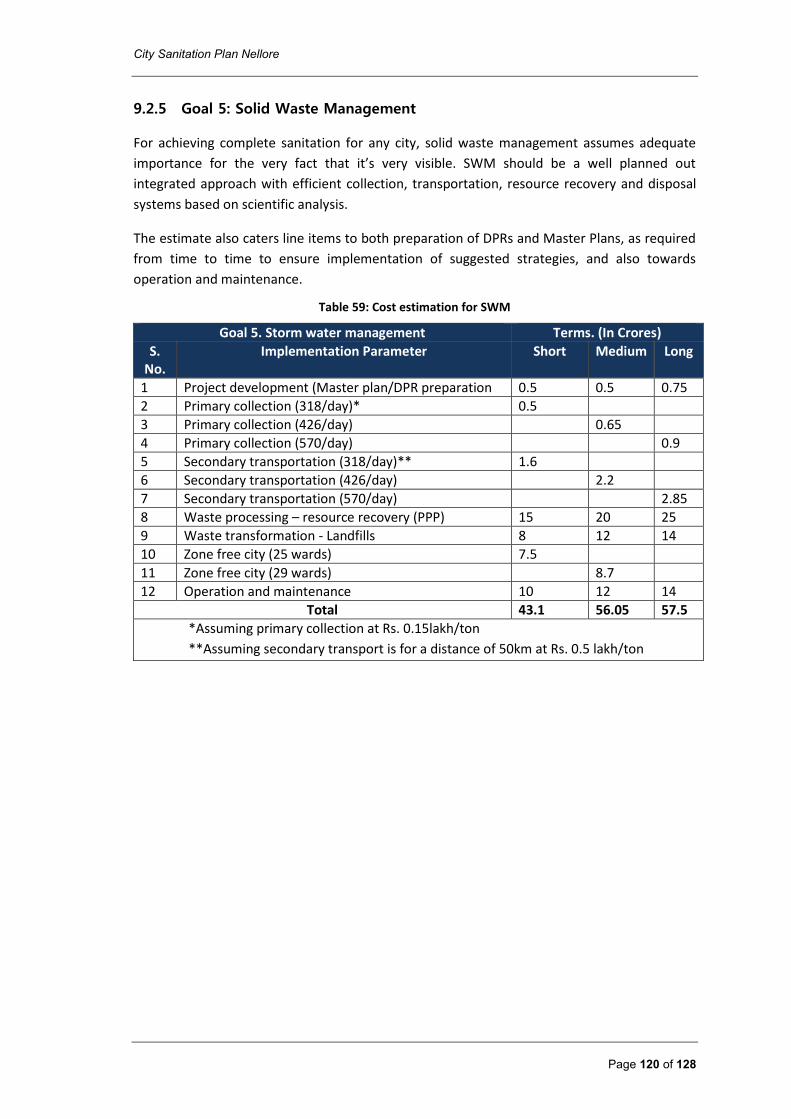
City Sanitation Plan Nellore
Page 120 of 128
9.2.5 Goal 5: Solid Waste Management
For achieving complete sanitation for any city, solid waste management assumes adequate
importance for the very fact that it’s very visible. SWM should be a well planned out
integrated approach with efficient collection, transportation, resource recovery and disposal
systems based on scientific analysis.
The estimate also caters line items to both preparation of DPRs and Master Plans, as required
from time to time to ensure implementation of suggested strategies, and also towards
operation and maintenance.
Table 59: Cost estimation for SWM
Goal 5. Storm water management Terms. (In Crores)
S. No.
Implementation Parameter Short Medium Long
1 Project development (Master plan/DPR preparation 0.5 0.5 0.75
2 Primary collection (318/day)* 0.5
3 Primary collection (426/day) 0.65
4 Primary collection (570/day) 0.9
5 Secondary transportation (318/day)** 1.6
6 Secondary transportation (426/day) 2.2
7 Secondary transportation (570/day) 2.85
8 Waste processing – resource recovery (PPP) 15 20 25
9 Waste transformation - Landfills 8 12 14
10 Zone free city (25 wards) 7.5
11 Zone free city (29 wards) 8.7
12 Operation and maintenance 10 12 14
Total 43.1 56.05 57.5
*Assuming primary collection at Rs. 0.15lakh/ton
**Assuming secondary transport is for a distance of 50km at Rs. 0.5 lakh/ton