citizen weather observer program (cwop)€¦ · · 2016-08-19it’s gonna start raining men...
TRANSCRIPT

1
Citizen Weather Observer Program
(CWOP)
Weather Station Siting, Performance, and Data Quality Guide
Version 1.0 March 8, 2005

2
Table of Contents 1. Forward 2. Safety first 3. Parameters
a. Ambient temperature and dew point (relative humidity) b. Precipitation c. Wind d. Pressure
4. Weather station purchase and setup considerations a. Considerations before you buy b. Positioning your sensors c. Data loggers
5. Weather station operations a. Determining position and elevation b. Time c. Station log d. Backup sensors e. Station archive and climatology f. Station operation tips
6. Communications a. Computer security b. APRS Protocol data format c. How does CWOP data get to NOAA? d. System status pages e. APRS data format wish list
7. Summary Figures 1. Wind distribution on FINDU 2. Wave cyclone model 4. Temperature radiation shield technology 5. Temperature and dew point sensor siting standard 6. Rain gauge wind shield technology 7. Wind flow turbulence over precipitation gauge diagram 8. Wind speed verses under-catchment graph 9. Relationship of elevation to rain gauge precipitation under-catch and wind speed 10. Precipitation gauge siting standard 11. Lower atmospheric (troposphere) layers - side-view of boundary (Ekman) layer wind
flow 12. Lower atmospheric (troposphere) layers and scales 13. Anemometer sensor siting standard 14. Pressure as a function of height above ground level 15. Time-Series of temperature and dew point for unshielded and shielded sensors 16. Time-Series of observed temperatures (readings) verses guess (analysis), from
QCMS

3
17. NIST traceability process diagram 18. Examples of observational accuracy and precision Tables 1. Temperature and dew point performance standards 2. Temperature QCMS validity and temporal consistency check ranges 3. Rain gauge performance standards 4. Wind accuracy and reporting standards 5. Wind QCMS validity and temporal consistency check ranges 6. Pressure reporting and accuracy standards 7. Pressure QCMS validity and temporal consistency check ranges 8. Determining optimal sensor siting for your location 9. Example APRS Weather Message 10. Example QCMS Hourly Statistics 11. Time conversion to/from the Universal Time Constant 12. Temperature conversion (Celsius/Fahrenheit) 13. Pressure conversion (millibars/inches) 14. Wind speed conversion (statute miles per hour (mph)/nautical miles per hour
(Kts)/meters per second (m/s)) 15. Precipitation conversion (inches to millimeters) 16. Beaufort wind scale Appendices 1. Case Study: Impact of solar radiation on temperature measurements 2. MADIS Quality Control and Monitoring System (QCMS) Background 3. Discussion of the origin of meteorology 4. Brief history of meteorological observations and instruments 5. Discussion of “meteorological” time 6. Discussion of measurement and calibration terms 7. NWS Skywarn Program 8. Useful weather station related web page 9. Latitude/Longitude Formats and Conversions Definitions References

4
Section 1. Forward
"Never doubt that a small group of thoughtful, committed citizens can change the world. Indeed, it's the only thing that ever has." Margaret Mead
Since the invention of writing, man has recorded natural events such as the motion of the Earth, moon, planets, and stars. Ideas about how weather events occur were documented in Aristotle’s Meteorologica in 350 B.C.. While Aristotle’s Meteorologica (see Appendix 3) helped mark the emergence of meteorology as a scientific discipline, it also introduced several concepts that could not otherwise be objectively measured at that time. It was not until the invention of weather instruments (1500-1900; see Appendix 4), and standards for meteorological measurement, that enabled the field of meteorology to evolve beyond (and scientifically refute) many of Aristotle’s original concepts on meteorology. For our generation, improved sensors, computing, and communication technology provide the means for a worldwide revolution in weather observing. As these technologies become ubiquitous, we have the opportunity to document the environment at scales in time and space never possible before including mapping of precipitation variability, influence and growth of temperature “heat islands” surrounding cities and other micro-climates, and global climate monitoring. However, only through meticulous observations and standardization of measurements will these data have a collective impact on the understanding of the atmosphere. The objective of this guide is inform and educate weather station operators, software developers, and hardware manufacturers on the desired performance for collecting automated meteorological observations for the Citizen Weather Observer Program (CWOP). We encourage prospective weather station operators to review system performance guidelines when selecting weather stations to determine which vendors meet these guidelines. We also encourage weather application developers to use these guidelines to process raw data using this guide’s recommendations for data sampling and reporting, particularly for the Automated Position Reporting System (APRS) protocol which CWOP uses to as its interface control document for weather message formatting. CWOP performance guidelines are very close to the standards used by the professional meteorological community. Achieving professional performance using technology which cost a fraction of a professional weather station is possible if care is taken during installation and by monitoring equipment performance. It is important that weather stations measure and report observations using the same procedures as those contained in this guide, so your data can be confidently compared between nearby professional weather station reports and against the climatic record for your area. CWOP understands perfect siting and equipment performance is not possible in all cases. However, we strongly encourage weather observers to make the most of siting and technology opportunities available to come as close to these siting guidelines as possible. When trees block wind speed measurements or should you be forced to place your
5
temperature sensors on a rooftop, the data will still have some value in most situations. Don’t let less than ideal conditions prevent you from contributing your data to the network. Author: David Helms, CW0351 Email: [email protected] Editors: Russ Chadwick, KB0TVJ (AP001) Email: [email protected] Jeff McQueen, CW0497 Email: [email protected] Gary Oldham, CW0146 Email: [email protected]

6
Section 2. Safety First Use caution when setting up and operating your weather station equipment. Particular care is necessary when installing your anemometer mast. Hazards include electrical shock, falls from the roof or ladder, and from lightning strikes. Pay particular attention to the proximity of power lines. Should power lines be closer to you at any point than the length of antenna mast or mounting pole you may be handling, you are in a particularly dangerous situation. Please follow all equipment manufacturer’s installation procedures to maximize equipment performance and safety. Use professional contractors to install your equipment if necessary. Ground outside sensors in accordance with manufacturer’s instructions to reduce risk of damage resulting from a lightning strike.
7
Section 3. Parameters a. Ambient Temperature and Dew Point
The humidity’s rising The barometer’s getting low According to all sources The street’s the place to go Cause tonight for the first time Just about half past ten For the first time in history It’s gonna start raining men It’s raining men Hallejulah It’s raining men Hey hey hey
It’s Raining Men by the Weather Girls Preamble: Temperature and humidity* are the most fundamental meteorological parameters. Everyone wants to know the current and future temperature to plan their day to plan and carry out their daily lives. Whether your job is to clear snow, generate electricity, or sell winter coats, knowing the temperature is critically import to your success. Many have the mistaken assumption that is it easy to accurately measure temperature and humidity. However, this is not the case. Measuring temperature is more like making a soufflé, it can be easily ruined if not handled properly. * Note: Humidity and dew point are used interchangeably throughout this section. While CWOP technically collects humidity data, it is more straightforward to show performance standards using the dew point convention. 1. Objective: The objective of measuring the ambient air temperature is to determine the amount of thermal energy stored in the atmosphere. A fundamental concept is that the air measured at a point is representative of the nearby atmosphere.
Conditions that produce unrepresentative air temperature measurements include: a. Direct Solar Heating: Direct exposure to the sun’s rays (short wave radiation) causes undesired heating of the temperature sensor. You can avoid this condition by using a Richardson shield such as the one depicted in Figure 4c to limit exposure to direct or indirect sunlight. Temperature measurements can be further improved by using an

8
aspirated shield (fan), which moves representative environmental air over the temperature sensor. b. Local (Unrepresentative) Heating or Cooling Sources: Heating or cooling of the temperature sensor from nearby objects such as air conditioning exhaust, heat pumps, roof shingles, or pavement and asphalt result in unrepresentative temperature measurements. Siting the temperature sensor sufficiently away from local heating/cooling will eliminate this problem. 2. Siting: See Figure 5 - Depiction of temperature and dew point siting guidelines. System performance can be improved by a combination of calibrated sensors, adequate temperature shielding, and optimal sensor siting. Consistent performance of high and low temperatures can only be achieved with an adequately shielded thermometer that to ensures solar radiation does not produce erroneously high temperatures. Appendix 1 contains a case study showing the behavior temperature sensor from a shielded and unshielded shelter. The following are temperature and dew point sensor siting objectives:
Locate the sensor on a level surface and avoid steep slopes unless it is typical for the area
Locate in an open clearing to allow ventilation and air mixing Use a radiation shield mounted on a 5 ft (1.5 m) post Be at least 100 ft (30 m) from road/concrete If possible, be no closer than four times the height of any nearby obstruction Preferred ground cover is grass, trimmed close enough to allow air to mix freely
between the ground and the sensor. The temperature/dew point sensor can also be located above dirt or other natural groundcover, if this groundcover is representative of the region (e.g., in a semi-arid location). 3. Standards, Units, and Performance When purchasing your weather station or simply assessing your current weather station’s performance, use the following CWOP guidelines to assess your system’s performance: Table 1a. CWOP Temperature and Dew Point Performance Standards – U.S. Units Measurement Units Accuracy Range Precision
Ambient Temperature
Degrees (F) a. +/- 1.8F b. +/- 0.9F c. +/- 1.8F
-80F to –58F -58F to +122F +122 to +130F
0.1F 0.1F 0.1F
Dew Point Temperature
Degrees (F) a. +/- 4.5F b. +/- 3.4F c. +/- 2.0F
-80F to –0.4F -0.4F to +32F +32F to +86F
0.1F 0.1F 0.1F

9
Table 1b. CWOP Temperature and Dew Point Performance Standards - Metric Units Measurement Units Accuracy Range Precision Ambient Temperature
Degrees (C) a. +/- 1.1C b. +/- 0.6C c. +/- 1.1C
-62C to –50C -50C to +50C +50C to +54C
0.1C 0.1C 0.1C
Dew Point Temperature
Degrees (C) a. +/- 2.2C b. +/- 1.7C c. +/- 1.1C
-34C to –24C -24C to –01C -01C to +30C
0.1C 0.1C 0.1C
To reduce small variations in second to second measurements that are attributed to sensor sampling “noise” and not representative of ambient temperature, the following time sampling intervals for measurements are suggested:
Temperature: latest 5 minute average Dew Point: latest 1 minute average
Notes:
APRS format sends temperatures in Fahrenheit degrees APRS format requires relative humidity, which is converted to dew point by
NOAA for assessing quality. 4. Testing and Quality Control Equipment Testing: Test your equipment using your weather station manufacturer’s procedures to validate your station’s performance does meet suggested performance standards. (See Appendix 6 for testing and calibration terms) You can directly compare temperature and dew point having a second set of sensors (cost $50-$200). Instruments choices include: Sling Psychrometer: A manually aspirated mercury in glass wet and dry bulb
temperature sensor. Learn how to use a sling psychrometer: http://www.globe.uah.edu/documents/psychrometer.ppt
Digital Thermometers/Hygrometers Monitoring Performance: Monitor your station’s performance by comparing your data to nearby stations (within 15 miles and about the same elevation). CWOP does this quantitatively using the NOAA Forecast Systems Laboratory (FSL) Quality Control and Monitoring System (QCMS). You can use the QCMS statistics from your station’s temperature and dew point to evaluate your weather station’s performance. QCMS does a series of checks on CWOP data including validity checks, temporal consistency checks, and buddy checks where Table 2 lists the range of valid measurements.
10
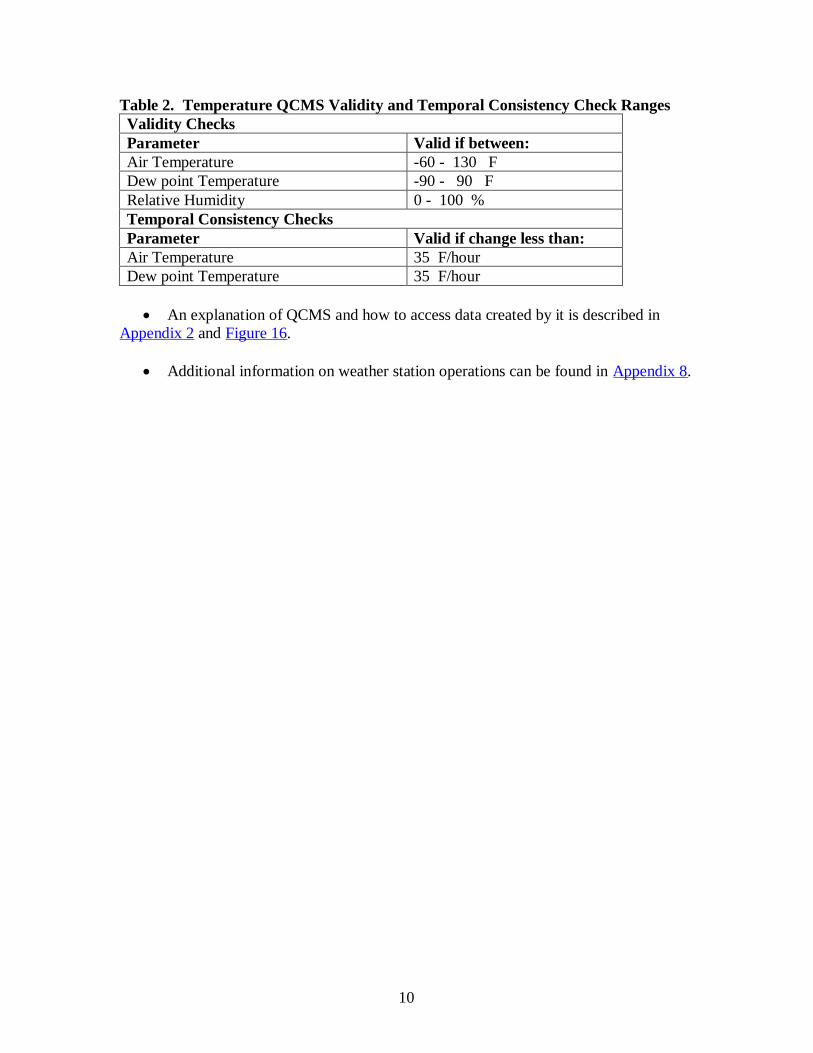
Table 2. Temperature QCMS Validity and Temporal Consistency Check Ranges Validity Checks Parameter Valid if between: Air Temperature -60 - 130 F Dew point Temperature -90 - 90 F Relative Humidity 0 - 100 % Temporal Consistency Checks Parameter Valid if change less than: Air Temperature 35 F/hour Dew point Temperature 35 F/hour
An explanation of QCMS and how to access data created by it is described in
Appendix 2 and Figure 16.
Additional information on weather station operations can be found in Appendix 8.

11
Section 3. Parameters b. Precipitation What makes rain? What makes rain? You want to find out what makes rainfall, Find out what makes rain. Air can be so cold, air can be so warm, When both combine together rainy skies are born… What Makes Rain? Words & Music by Nick Walker (mp3) Preamble: Abundantly available clean water has until recently been taken for granted; however with environmental stresses and population growth, water resources are increasingly being managed as a finite resource. The recent 5-year drought in the southwest U.S. and resulting in historic low levels of Lake Mead underscores the need for a change of attitude towards fresh water resources. Use of water to drive hydroelectric generators, which provide clean energy for our cities, must be balanced with keeping sufficient water in our rivers to support fisheries and inland marine transportation. Additionally, too much water is a danger resulting in 110 drowning deaths and $3.7 billion in losses annually from flash floods in the United States alone. Effective management of fresh water resources requires a clear understanding of how much water is coming into our river basins as well as knowing how much water is used for agriculture and in homes. Precipitation observations from CWOP volunteers help increase the density, timeliness, and quality of rainfall information falling within river basins aiding the management of our water resources and support public safety during flash floods. Measuring precipitation also helps weather models estimate soil moisture and temperature and improve predictions of atmospheric stability, cloud cover, and high and low temperature. 1. Objective: For automated weather stations, the objective is to accurately measure cumulative precipitation. In simple terms, precipitation measurement consists of documenting the (linear) amount of precipitation falling in a given observation point (typically 4 or 8 inch diameter rain gauge) for a given time. Challenges to accurate precipitation measurement include:
Rain shadow from surrounding barriers such as trees, walls, and roof eaves causing under measurement
Turbulent wind flow causing rain and snow to fall in a chaotic manner resulting in under measurement (also called “undercatch”)
Splashing or drainage of precip from areas outside the observation point resulting in an over measurement
Having a proper gauge configuration for winter precipitation measurement
12
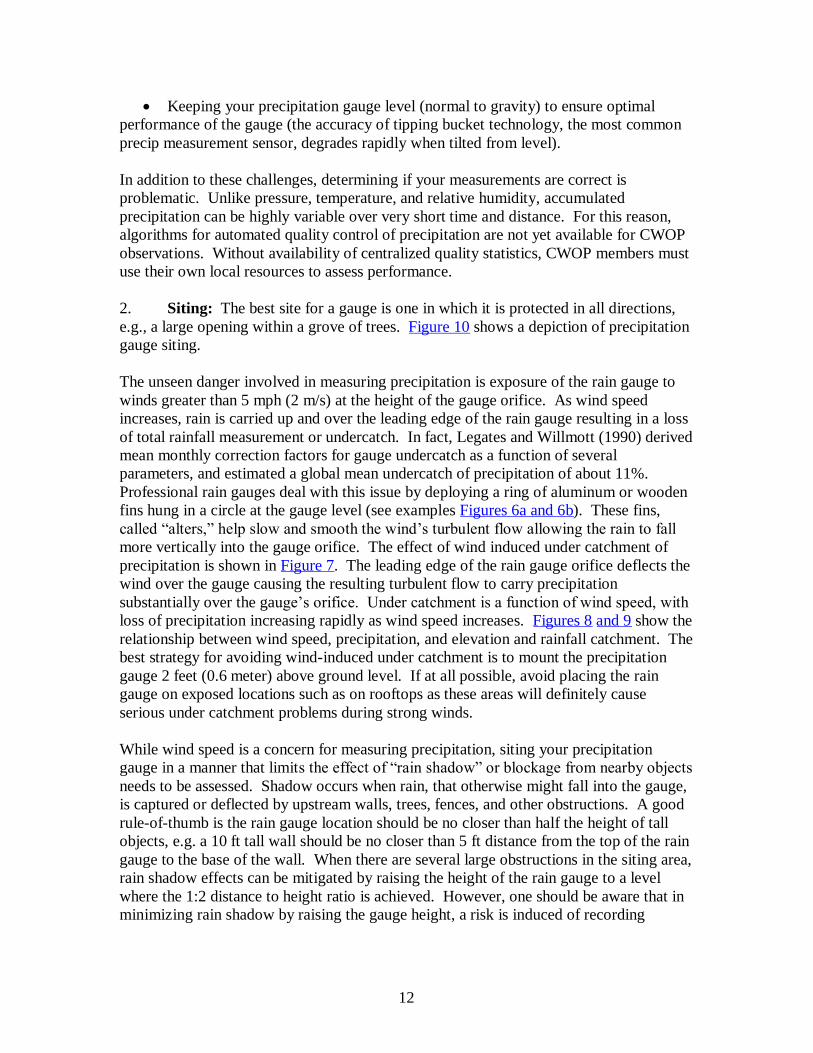
Keeping your precipitation gauge level (normal to gravity) to ensure optimal performance of the gauge (the accuracy of tipping bucket technology, the most common precip measurement sensor, degrades rapidly when tilted from level). In addition to these challenges, determining if your measurements are correct is problematic. Unlike pressure, temperature, and relative humidity, accumulated precipitation can be highly variable over very short time and distance. For this reason, algorithms for automated quality control of precipitation are not yet available for CWOP observations. Without availability of centralized quality statistics, CWOP members must use their own local resources to assess performance. 2. Siting: The best site for a gauge is one in which it is protected in all directions, e.g., a large opening within a grove of trees. Figure 10 shows a depiction of precipitation gauge siting. The unseen danger involved in measuring precipitation is exposure of the rain gauge to winds greater than 5 mph (2 m/s) at the height of the gauge orifice. As wind speed increases, rain is carried up and over the leading edge of the rain gauge resulting in a loss of total rainfall measurement or undercatch. In fact, Legates and Willmott (1990) derived mean monthly correction factors for gauge undercatch as a function of several parameters, and estimated a global mean undercatch of precipitation of about 11%. Professional rain gauges deal with this issue by deploying a ring of aluminum or wooden fins hung in a circle at the gauge level (see examples Figures 6a and 6b). These fins, called “alters,” help slow and smooth the wind’s turbulent flow allowing the rain to fall more vertically into the gauge orifice. The effect of wind induced under catchment of precipitation is shown in Figure 7. The leading edge of the rain gauge orifice deflects the wind over the gauge causing the resulting turbulent flow to carry precipitation substantially over the gauge’s orifice. Under catchment is a function of wind speed, with loss of precipitation increasing rapidly as wind speed increases. Figures 8 and 9 show the relationship between wind speed, precipitation, and elevation and rainfall catchment. The best strategy for avoiding wind-induced under catchment is to mount the precipitation gauge 2 feet (0.6 meter) above ground level. If at all possible, avoid placing the rain gauge on exposed locations such as on rooftops as these areas will definitely cause serious under catchment problems during strong winds. While wind speed is a concern for measuring precipitation, siting your precipitation gauge in a manner that limits the effect of “rain shadow” or blockage from nearby objects needs to be assessed. Shadow occurs when rain, that otherwise might fall into the gauge, is captured or deflected by upstream walls, trees, fences, and other obstructions. A good rule-of-thumb is the rain gauge location should be no closer than half the height of tall objects, e.g. a 10 ft tall wall should be no closer than 5 ft distance from the top of the rain gauge to the base of the wall. When there are several large obstructions in the siting area, rain shadow effects can be mitigated by raising the height of the rain gauge to a level where the 1:2 distance to height ratio is achieved. However, one should be aware that in minimizing rain shadow by raising the gauge height, a risk is induced of recording

13
precipitation under catchment during high wind events. The relationship between vertical wind profile, precipitation under catchment, and elevation is shown in Figure 6. As stated, generally siting the rain gauge near the ground should be a goal. However, placing the gauge below 2 feet (0.6 meters) above ground may cause an over catchment problem from splashing from surfaces below and in the vicinity of the gauge. The degree of maintenance of the vegetation under the gauge should be a consideration; allowing vegetation to grow close to the gauge invites splashing and insect invasion of the gauge’s electronics. 3. Sampling Standards and Units and Performance: Table 3. Rain Gauge Performance Standards Measurement Units Accuracy Range Precision Accumulated Liquid Precipitation
Inches (APRS reporting unit)
±0.02 inches (±0.5 mm); or, 4 percent of hourly amount (whichever is greater)
Able to measure up to 10.00 inches (254 mm) per hour
Hundredth of Inch: XX.XX Inch Tenth of a mm: XX.X mm
Notes:
1.0 inch = 25.4 millimeters APRS format supports “since midnight” accumulated precipitation. In this case,
this refers to local midnight where the observation is being measured. Precipitation Measurement Technology: Automated devices for precipitation measurements typically use a tipping bucket technology (exceptions to the tipping bucket technology include an electrode raindrop “shorting” count and “weighing” gauges). Tipping bucket precipitation gauges are the most common rainfall sensor used by CWOP members. Details of Tipping Bucket Siting: Most gauges are “tipping bucket” type gauges that have a tipping lever with small “buckets” each end that alternatively fill with rain to a certain weight, then the lever tips which empties the full bucket and repositions the empty bucket so that it can be filled. An electronic device counts the number of tips and this number is sent to the weather station where it is used to determine rain fall, generally one tip is 0.01 inches of rain. a. The tipping bucket requires a clear and unobstructed mounting location to obtain
accurate rainfall readings. It must also be mounted on a level surface free of vibration. Once the tipping bucket is mounted, remove the housing cover and verify that the tipping bucket is not held in the center position. Many units are shipped with a cable tie or similar device used to hold the buckets steady during shipping; carefully remove this tie if yours is so equipped.
b. To ensure that the surface is level, use a bubble level or pour water into the T-shaped leveling trough in the base and observe the surface of the water.

14
c. Be sure there is an unobstructed path for water runoff from the drain screens. d. Choose a location that is easily accessible for normal cleaning and is distant from
trees or other sources of heavy pollen or debris. e. Follow manufacturer’s instruction when installing your rain gauge.
Quality Control (QC): NOAA and CWOP do not provide quality feedback for rainfall measurements because real-time quantitative QC algorithms do not exist. Members must conduct their own assessment of quality based on local information. 4. Testing and Quality Control Direct Accuracy Check: Use the your hardware vendor’s test procedures to determine the accuracy of your automated rain gauge. These procedures generally require you to use a medicine syringe (your pharmacist will have one) to slowly drip a certain amount of water through the precipitation gauge orifice to obtain a certain measurement, as per factory specification. Another technique is to use a plastic cup with very small pin holes will allow a measured amount of water to flow into the gauge at rates similar to rainfall rates. “Buddy” Checking: Checking rainfall accuracy using an adjacent (same height and location) manual rain gauge for comparison. The National Weather Service considers the 4-inch diameter (wide) manual rain gauge to be the minimum diameter size gauge for climate measurements. A 4 inch manual plastic rain gauge sells for $25 to $40. If you can afford it, get the 8 inch “standard” rain gauge which is the professional rain gauge diameter. Monitor Storm and Monthly Precipitation: The NWS WSR-88D radar measures storm precipitation amounts (to the nearest 0.25 inch). Check the storm total precipitation amount over your location from the WSR-88D total precipitation product for a gross check (generally good in non-winter precipitation events). Check near-by ASOS and COOP station climate reports for daily and monthly precipitation totals. Both the WSR-88D and ASOS precipitation reports are available on your local NWS Weather Forecast Office web page. Another source of precipitation totals is from your local NWS River Forecast Center (RFC). More on Manual Rain Gauges: o How to measure rain using a manual rain gauge: http://www.rain-check.org/help/Raincheck_Rain_Instructions.htm http://meted.ucar.edu/qpf/rgauge/index1.htm http://ccc.atmos.colostate.edu/~hail/howto/help/rain.htm o How to measure liquid amount of snow using a manual rain gauge: http://www.rain-check.org/help/Raincheck_Snow_Instructions.htm

15
Most CWOP members encounter at least some precipitation during sub-freezing conditions (< 0C / 32F). For those members with heated rain gauges, remember to plug in the heating element during the part of the season when these conditions are expected. After the winter season is over, remember to unplug your heater as well because the excessive heat could cause damage to the gauge electronics during the heat of the summer. For the many people without heated precipitation gauges, you may wish to use an all weather pipe-wrap to gently warm the gauge during sub-freezing conditions. The caution with heated rain gauges is that it reduces the catchment as a result of the thermal air currents above the gauge and from evaporation. Therefore, you should keep your heater unplugged unless you expect solid or freezing precipitation (snow, sleet, ice pellets, or freezing rain). Additional Information:
Appendix 8 for additional information on rain and snow measurement Table 15 for conversion between inches and millimeters
16
Section 3. Parameters c. Wind You don't need a weatherman to know which way the wind blows. Subterranean Homesick Blues by Bob Dylan Preamble: Interpreting the meteorological significance of wind information is difficult and usually considered in tandem with other parameters like temperature, humidity, pressure, and other winds aloft (5,000 ft or higher). Like precipitation, wind speed and direction can be highly variable in time and space. Winds, measured from near the Earth’s surface, are a primary indicator of atmospheric stability. Strong winds indicate a well-mixed atmosphere and unstable conditions while light to calm winds typically indicate the atmosphere is absolutely stable or has neutral stability. Wind information, combined with humidity, temperature, and measurements made over minutes or hours indicate how the atmosphere’s stability is changing over time. Examples of wind applications: Air Quality: Degree of atmospheric mixing present used to estimate amount of low level pollution which will be vented from urban areas Fire Control: Wind speed and direction are used to estimate the fire behavior, and the likely motion of the down-wind smoke plume. Irrigation/Plant Evaporation: When combined with precipitation and humidity, wind speed and direction can be used to estimate amount of crop drying and irrigation necessary to maintain optimum soil temperature and humidity for crop growth. Wave Height: Using wind speed, meteorologists estimate growth in (wind) wave height over time over lakes, bays, and gulfs. Aviation Safety: Aircraft and the Federal Aviation Administration (FAA) have rules for the amount of cross-wind or tail-wind allowable for runway landings and take-offs. Airport winds are critical to maintaining safe runway configuration. Energy Production: Wind farms are being built all over the world based on surface wind climate data from potential locations. Meteorology: Wind data are used to locate and track cold, warm, and sea breeze fronts as well as low and high pressure systems. 1. Objective: Meteorologists often want to know what the character of “free air winds” (winds not influenced by the Earth’s frictional drag,), also known as geostrophic winds, in order to monitor changes in the atmosphere. To measure free air winds, you typically have to extend your sensor above the region of the Earth’s influence, called the Planetary Boundary Layer (PBL). Since the PBL generally extends up to 1-2 km (3,000 ft to 6,000 ft) above the Earth’s surface, measuring free air winds directly is a challenge and traditionally done with weather balloons (radiosondes) and not surface based instruments.

17
Within the PBL, there are several sub-layers that categorized by the predictability of the winds found in the sub-layer. In upper PBL is the transition or Ekman sub-layer (Figure. 11) where winds are influenced by the Earth, but can be characterized by decreasing wind speeds and wind direction “backing” wind direction (e.g. against the clock; ex. winds from 270 degrees to 210 degrees) as you descend from the top to the bottom of the PBL. In the transition (or Ekman) sub-layer, the frictional drag on the free-air winds is predictable and so winds measured in this layer are useful in determining changes in the upper atmosphere. Closer to the Earth’s surface, winds become less predictable and more chaotic depending on the roughness of the surface. As such, winds closest to the Earth’s surface tell you more about the character of the Earth’s surface and less about the atmosphere. The most chaotic layer immediately adjacent to the ground is called the Urban Canopy Layer (UCL), which typically extends up to the height of the tallest surface obstructions in the immediate area. Linking the UCL to the transition sub-layer is Roughness Sub-Layer (RSL), as shown in Figures 12a and 12b. As shown in Figure 12b, useful information about atmospheric winds is possible even in the RSL. However within the UCL, wind measurements tell you more about the geometry of local obstructions, such as trees and buildings, rather than the atmospheric wind above this layer. The key objective then is to measure winds that are most similar to free air winds. This generally means that we want to extend our anemometer at least as high as the local obstructions comprising the UCL. 2. Siting The international standard for anemometer height above ground level is 10 meters (33 feet) with no obstructions at or above this level. CWOP encourages weather station operators to place their anemometers at this level, consistent with safety considerations, if no obstructions are at or immediately below this height. Simple Anemometer standard (see Figure 13): 10 meters (33 feet) above ground level (AGL). If there are obstructions above 8 meters, anemometer should be at least 2 meters (7
feet) above obstructions (trees and/or buildings) that are within the immediate vicinity of weather station (20 meters horizontally).
Anemometer mast should be absolutely vertically level. Anemometer should be orientated to yield wind direction values from “true north” Discussion of alternatives: Unfortunately, most CWOP members live in urban areas where there are buildings with two or more floors (8 meters or 25 feet) and mature trees, many taller than 20 meters (66 feet) (Coombes, 1992). In these difficult siting environments, anemometer siting requires compromise and thoughtfulness.
18
If obstructions are higher than the 10 m level on your property, you may consider raising the height of the anemometer to get above the UCL as shown in Figure 13. However, stability of roof mounted masts and tripods decrease quickly as lengths extend; therefore, CWOP does not encourage our members to install masts higher than 5 meters (16 feet), if tripod mounted, or 10 meters (33 feet), if a ground based mast connected to a building or supported using guy wires. For masts higher than 10 meters, seek professional help for installation (your local ham radio club may be helpful in recommending a tower installer). Anemometers placed on rooftops should extend at least 3 meters (10 feet) above the roof to avoid anomalous winds caused by the roof itself. Use care to ensure placement and installation of the tripod or mast does not compromise your roof’s integrity. Other considerations for anemometer installation: ENSURE THE ANEMOMETER AND ITS MAST IS GROUNDED ACCORDING TO MANUFACTURER SPECIFICATIONS. If improperly grounded, lightning will travel from wired anemometers to your weather station console and finally to your PC, potentially resulting is a total loss of all components. Another risk of improper grounding is lightning will find ground by traveling through the house, creating a fire, electronic equipment, or even electrical shock resulting in personal injury. If in doubt, consult an electrician. Use caution when installing your anemometer mast. Ask friends to assist with the mast’s installation. The longer masts can cause you to lose balance and potentially fall. Having two or more people available to install the mast will make the job easier and safer. Do not try to work on your mast during slippery conditions or in strong winds. MAKE ABSOLUTELY SURE THAT YOUR MAST WILL NOT CONTACT POWER LINES IN ANY DIRECTION SHOULD IT FALL. Consider local ordinances, home owner association restrictions, and neighbor sensitivities before installing your mast to make sure you won’t have to remove it after installation. Mount your mast in a robust manner so that high winds and icing conditions will not cause damage to it. Strongly secure your mast such that it will not pivot or rotate after installation. Your mast mounting system should allow for occasional access to the anemometer for routine maintenance and parts replacement. Consider an annual anemometer bearing cleaning and possible lubrication schedule for the anemometer (consult your weather equipment manual for details– not all anemometers should be lubricated). Always mount your mast absolutely vertically level (using a carpenter’s bubble level); unbalanced/unleveled masts will cause the wind direction to be unrepresentative of actual conditions.
19
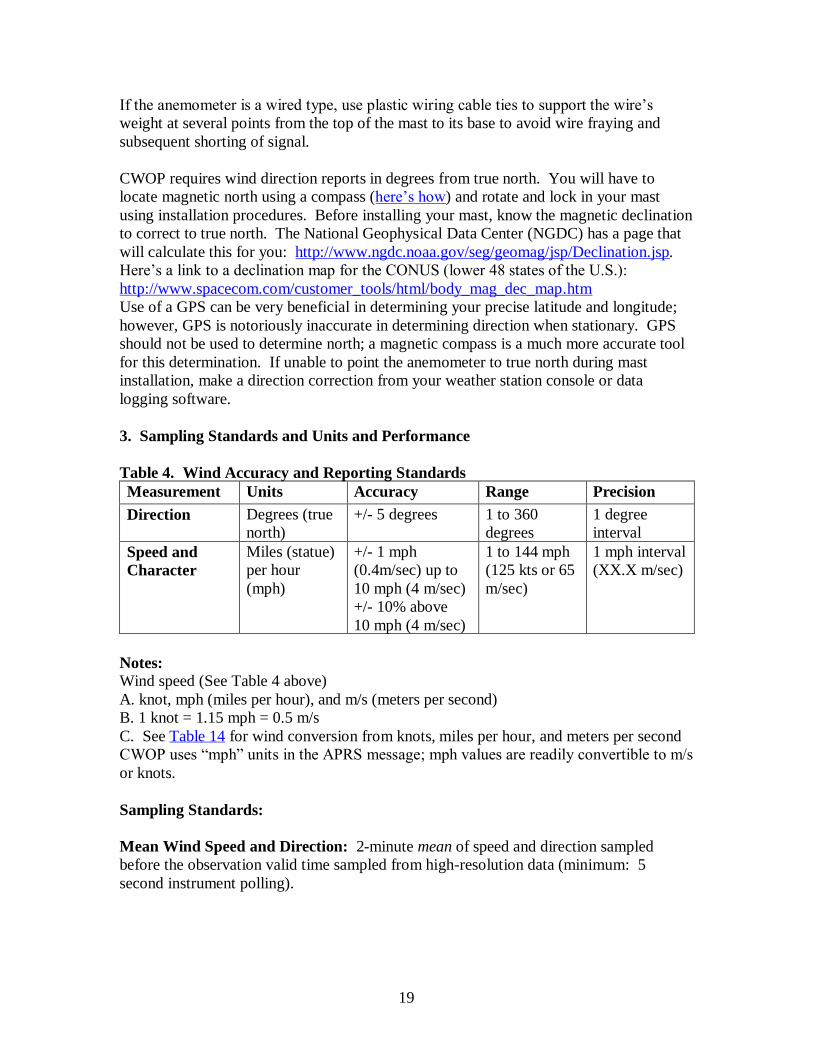
If the anemometer is a wired type, use plastic wiring cable ties to support the wire’s weight at several points from the top of the mast to its base to avoid wire fraying and subsequent shorting of signal. CWOP requires wind direction reports in degrees from true north. You will have to locate magnetic north using a compass (here’s how) and rotate and lock in your mast using installation procedures. Before installing your mast, know the magnetic declination to correct to true north. The National Geophysical Data Center (NGDC) has a page that will calculate this for you: http://www.ngdc.noaa.gov/seg/geomag/jsp/Declination.jsp. Here’s a link to a declination map for the CONUS (lower 48 states of the U.S.): http://www.spacecom.com/customer_tools/html/body_mag_dec_map.htm Use of a GPS can be very beneficial in determining your precise latitude and longitude; however, GPS is notoriously inaccurate in determining direction when stationary. GPS should not be used to determine north; a magnetic compass is a much more accurate tool for this determination. If unable to point the anemometer to true north during mast installation, make a direction correction from your weather station console or data logging software. 3. Sampling Standards and Units and Performance Table 4. Wind Accuracy and Reporting Standards Measurement Units Accuracy Range Precision Direction Degrees (true
north) +/- 5 degrees
1 to 360 degrees
1 degree interval
Speed and Character
Miles (statue) per hour (mph)
+/- 1 mph (0.4m/sec) up to 10 mph (4 m/sec) +/- 10% above 10 mph (4 m/sec)
1 to 144 mph (125 kts or 65 m/sec)
1 mph interval (XX.X m/sec)
Notes: Wind speed (See Table 4 above) A. knot, mph (miles per hour), and m/s (meters per second) B. 1 knot = 1.15 mph = 0.5 m/s C. See Table 14 for wind conversion from knots, miles per hour, and meters per second CWOP uses “mph” units in the APRS message; mph values are readily convertible to m/s or knots. Sampling Standards: Mean Wind Speed and Direction: 2-minute mean of speed and direction sampled before the observation valid time sampled from high-resolution data (minimum: 5 second instrument polling).

20
Gust: Maximum instantaneous wind value observed in the 10 minutes before the observation valid time sampled from full resolution data (minimum: 5 second instrument polling). 4. Testing and Quality Control It is difficult to install the wind direction instrument exactly to true north even with good planning and following installation procedures. Therefore, it will be necessary to validate your installation by monitoring your winds against area airport winds to see if your wind direction is consistent with their data. Complete your wind direction validation on an afternoon that is the day before or the day after a cold frontal passage (note: compare wind direction from within the comfort of your home, not on your roof). Ideally you want moderate, but not overly gusty, winds where flow is relatively uniform in speed and direction throughout your region. If wind direction is consistently off by more than 30 degrees from your reference station, apply a correction to your direction so it is consistent with area wind direction. This can typically be done using your weather station’s data logging application or using the weather station console. Wind speed will be difficult to validate using regional weather station sources. Obstructions surrounding your anemometer will decrease your wind speed significantly relative to your local airport’s wind speed. A quick and dirty calibration procedure is to use the Beaufort Scale for wind speed (land version) (Table 16). Observe the motion of tree leaves, twigs, and chimney smoke plumes to estimate wind speed at the elevation of the anemometer. Another method for checking anemometer performance is to use a separate hand-held anemometer, such as those marketed by Kestrel. Taking a series of comparisons between the hand-held anemometer and a magnetic compass and your weather station anemometer will help establish your anemometer’s performance. You can also check wind direction performance by monitoring your wind speed and direction on the FINDU server. Figure 1 below shows a 240-hour time series of speed and direction on the first row, and a “wind rose” and a hodograph depiction of the distribution of wind speed and direction over the period on the bottom row. In this example, station AB9FX has observed at least two cold frontal passages. The top chart shows consistent wind direction veering (clockwise) in wind direction over time associated the cold frontal passages. The bottom charts depict a wide distribution of wind directions showing this station is capable of observing wind from a full range (1-360 degrees) of directions. This is the consistency you should look for in your data. (Note: In some cases, stations will only report wind direction in 8 or 16 compass points rather than the full 360 degree range).

21
Figure 1. Wind Distribution on FINDU and Mesowest Station AB9FX (Chicago, IL)
Wind Direction and Speed Time Series (MPH) (last 240 hours)
FINDU Wind Rose Direction/Speed Distribution (240 hours)
Mesowest Hodograph Direction/Speed Distribution (240 hours)
In additional to direct and indirect wind comparisons, you can also use the NOAA Forecast Systems Laboratory (FSL) Quality Control and Monitoring System (QCMS) statistics for your station’s wind direction and speed. See Appendix 2 for details. The following table contains the gross validity checks, temporal consistency checks, and buddy checks for winds. See Appendix 8 for additional information on measuring wind. Table 5. Wind QCMS Validity and Temporal Consistency Check Ranges Validity Checks Parameter Valid if between: Wind Direction 1 and 360 degrees Wind Speed 0 to 350 kts Temporal Consistency Checks Parameter Valid if change less than: Wind Speed 20 kts/hr

22
Section 3. Parameters d. Pressure
I’m sure you’ll have some cosmic rationale But here you are with your faith And your peter pan advice You have no scars on your face And you cannot handle pressure Pressure, pressure One, two, three, four Pressure
Pressure by Billy Joel Preamble: Atmospheric pressure is the force exerted on a given point by the Earth’s atmosphere (see Figure 14). Most pressure measurements are assumed to be static, with little or no air motion (horizontal or vertical motions). Dynamic pressure (e.g. winds) causes an error in pressure measurements. Pressure decreases rapidly with elevation, changing 1.0 millibar (mb) with every 32 feet at sea level. See Figure 14 for pressure and elevation relationship. Scientists have suspected the existence of atmospheric pressure for hundreds of years from the limitation of the level water could be siphoned over hills (32 feet). This knowledge eventually led to the development of water barometers by Evangelista Torricelli in 1644. Eventually, networks of surface observations were established by the Norwegians used to establish, validate, and exploit Jacob (Jack) Bjerknes’ polar wave cyclone model, as shown in Figure 2 (Friedman, 1989). Today, surface pressure measurements are used in concert with wind, temperature, and humidity observations to locate and predict synoptic macro-, meso-, and micro-scale pressure systems (Orlanski, 1975). With a dense network of calibrated surface pressure observations, a complete picture of the location and movement of weather systems is
Figure 2. Wave Cyclone Model

23
possible. On the smallest scale, individual meso-highs and lows generated by severe thunderstorms can be identified and tracked, helping to assess the risk of micro-bursts and tornadic thunderstorms. 1. Objective: The key objective of pressure measurements is to consistently measure atmospheric pressure using barometers that have been calibrated against a reference pressure source, e.g. a pressure instrument that is professionally maintained. Lacking calibration, pressure measurements from personal weather stations are of little value beyond identifying trends. But which pressure format should your use and from where do you obtain reference pressure measurements for comparisons? Sections 3 and 4 address this question. It’s important that you understand most personal weather station pressure sensors can be calibrated with relative ease and delivers consistent performance. 2. Siting Most personal weather stations will have their barometer sensor contained within the weather station master console. Therefore, the physical environment of the master console will influence the barometer. If possible, install the instrument indoors in a location least affected by drafts, heat, and the sun, e.g., where the temperature is as constant as practical. 3. Sampling Standards and Units Reporting frequency: 1-minute updates derived from the minimum reported pressure value observed in the past minute. Typically, basis for the 1-minute minimum pressure reports are from a series of ten 6-second interval instantaneous pressure measurements. Pressure reduction format: Altimeter (QNH) Pressure - Altimeter pressure is a corrected pressure value that includes the pressure between the station’s elevation and sea level. Note: Altimeter is the CWOP pressure standard because it is the simplest pressure reduction format that most CWOP members can reliably deliver and which can be useful by the National Meteorological Services.
24
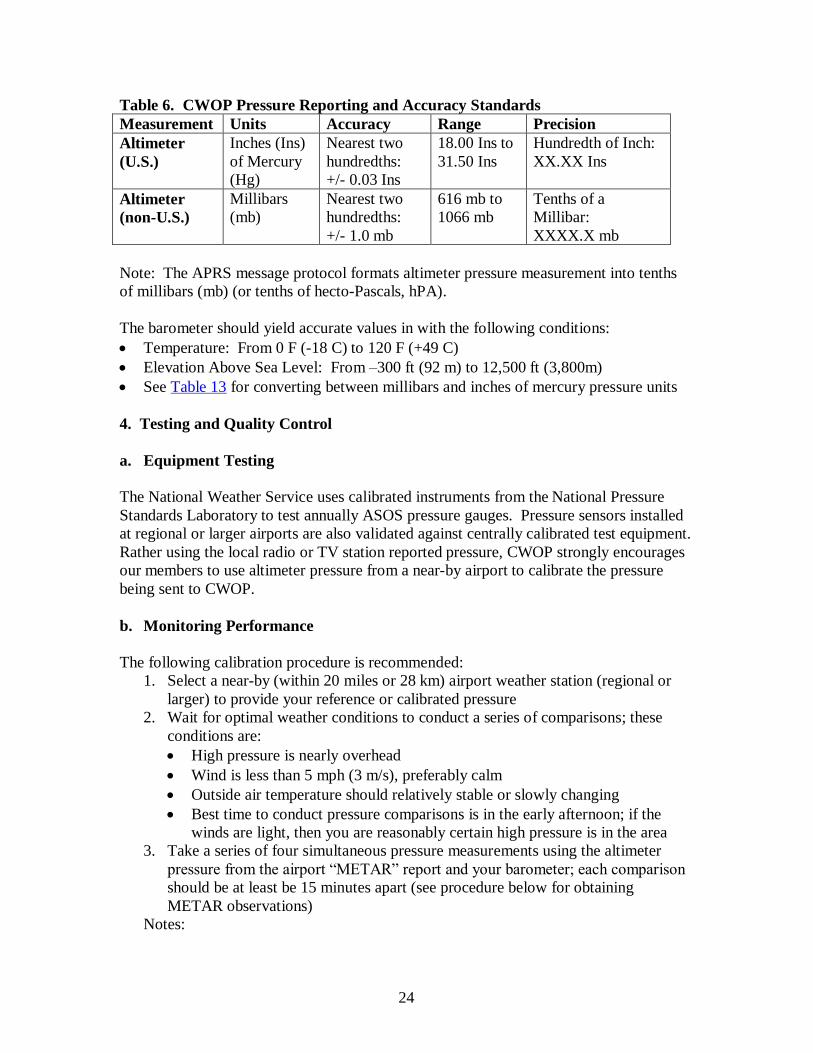
Table 6. CWOP Pressure Reporting and Accuracy Standards Measurement Units Accuracy Range Precision Altimeter (U.S.)
Inches (Ins) of Mercury (Hg)
Nearest two hundredths: +/- 0.03 Ins
18.00 Ins to 31.50 Ins
Hundredth of Inch: XX.XX Ins
Altimeter (non-U.S.)
Millibars (mb)
Nearest two hundredths: +/- 1.0 mb
616 mb to 1066 mb
Tenths of a Millibar: XXXX.X mb
Note: The APRS message protocol formats altimeter pressure measurement into tenths of millibars (mb) (or tenths of hecto-Pascals, hPA). The barometer should yield accurate values in with the following conditions: Temperature: From 0 F (-18 C) to 120 F (+49 C) Elevation Above Sea Level: From –300 ft (92 m) to 12,500 ft (3,800m) See Table 13 for converting between millibars and inches of mercury pressure units 4. Testing and Quality Control a. Equipment Testing The National Weather Service uses calibrated instruments from the National Pressure Standards Laboratory to test annually ASOS pressure gauges. Pressure sensors installed at regional or larger airports are also validated against centrally calibrated test equipment. Rather using the local radio or TV station reported pressure, CWOP strongly encourages our members to use altimeter pressure from a near-by airport to calibrate the pressure being sent to CWOP. b. Monitoring Performance The following calibration procedure is recommended:
1. Select a near-by (within 20 miles or 28 km) airport weather station (regional or larger) to provide your reference or calibrated pressure
2. Wait for optimal weather conditions to conduct a series of comparisons; these conditions are: High pressure is nearly overhead Wind is less than 5 mph (3 m/s), preferably calm Outside air temperature should relatively stable or slowly changing Best time to conduct pressure comparisons is in the early afternoon; if the
winds are light, then you are reasonably certain high pressure is in the area 3. Take a series of four simultaneous pressure measurements using the altimeter
pressure from the airport “METAR” report and your barometer; each comparison should be at least be 15 minutes apart (see procedure below for obtaining METAR observations)
Notes:

25
* Some airports only report every hour on the hour, so you will have to take 4 hourly comparisons in this case. * Check that the valid time of each pressure comparison pair are within 5 minutes of each other. 4. After completing the four comparisons noting your altimeter and the reference
airport pressure simultaneously; sum the differences between the comparisons and divide by 4 (the number of comparisons) to get a mean difference.
5. If the mean difference between your station and the reference station is more than +/- 00.03 inches for U.S. altimeter comparisons, or +/- 1.0 mb for international altimeter comparisons; add (or subtract) the difference to correct your altimeter, as appropriate. Let the pressure settle for at least 15 minutes and try another series of comparisons to see if you get within +/- 00.03 inches. Repeat the procedure until you achieve the goal a pressure difference of less than +/- 00.03 inches.
6. Stop the comparison series when the mean difference is less than or equal to +/- 00.03 inches for U.S. altimeter comparisons, or +/- 1.0 mb for international altimeter comparisons.
7. Barometers occasionally will “drift” requiring re-calibration. Therefore, re-accomplish barometer comparisons at least annually.
8. Keep a record of your comparisons to monitor performance over time. Obtaining Airport Observations: You can obtain METAR reports, A) from your government’s weather service page, such as this National Weather Service page, http://weather.noaa.gov/cgi-bin/mgetmetar.pl (which includes international METAR reports), or B) call your local weather service office. Find your airport’s 4-letter (ICAO) Airport Identifiers: http://www.airrouting.com/content/airportloc.html
A) Through a web page (assume undecoded METAR) For undecoded METAR airport weather reports, altimeter will be encoded in two
different units, millibars (mb) and inches if mercury (INS) Examples:
1. International METAR altimeter: EDDF 040050Z 21015KT 9999 -RA FEW008 BKN024 BKN028 06/05 Q1031 NOSIG -- here, the EDDF (Frankfurt, Germany) altimeter is 1031.0 millibars (mb),
and identified within the METAR report with the letter “Q” prefix 2. United States METAR altimeter: KBWI 040054Z 00000KT 10SM BKN100 BKN120 12/08 A3017 RMK AO2 SLP216 T01170078 PNO $ -- here, the KBWI (Baltimore-Washington International) altimeter is 30.17 inches of mercury (QNH), and identified within the METAR report with the letter “A”

26
B) Call the airport automated weather recording. The automated recorded message is updated every minute. This is the better than through the web since you don’t have to wait for the airport observation to update on the hour. The airport automated weather recording will state the pressure in "inches of mercury", typically either 30.xx or 29.xx inches. The recording will state the full METAR observation, including temperature and dew
point in degrees Celsius and altimeter in inches of mercury. To determine the automated weather recording phone number, retrieve it is from
airnav.com. For example, the phone number for KBWI is obtained through the following web page: http://www.airnav.com/airport/KBWI
Airport Communications UNICOM: 122.95 ATIS: 115.1 127.8 WX ASOS: PHONE 410-691-1278
In additional to reference barometer comparisons, you can also use the NOAA Forecast Systems Laboratory (FSL) Quality Control and Monitoring System (QCMS) statistics for your station’s altimeter pressure to evaluate your pressure measurements. See Appendix 2 for details. Philip Gladstone has created a table using the QCMS data to showing CWOP stations that have a 3 mb (00.09 inch of mercury) over the most recent two week period. Philip’s table show that many stations have a large mean error and relatively low standard deviation indicating most of these stations could be adjusted to be within performance specifications. Here is the link to Philip’s pressure table: http://pond1.gladstonefamily.net/cgi-bin/wxmiscal.pl The following table contains the gross validity checks, temporal consistency checks, and buddy checks for pressure. Table 7. Pressure QCMS Validity and Temporal Consistency Check Ranges Validity Checks Parameter Valid if between: Sea-Level Pressure 846 mb to 1100 mb Stations Pressure 568 mb to 1100 mb Altimeter Setting 568 mb to 1100 mb Temporal Consistency Checks Parameter Valid if change less than: Sea-Level Pressure 15 mb/hr
See Appendix 8 for additional information on pressure measurement.

27
Section 4. Weather station purchase and setup considerations
a. Considerations before you buy: The weather station vendors have many different price and performance options. The following are weather station issues need to be considered before purchasing your system. Cabled Systems Cabled systems will get the job done reliably and generally for a lower price than solar powered wireless systems. The down side is, what to do to get the wires from the sensors outside the home to the console location inside the house? This typically involves drilling a hole in a perfectly good wall. If you decide to do this, take care not to drill through electrical wires within the wall. Securing Wires: Use plastic cable ties to secure wires to reduce the long-term stresses from winds
fraying wires at contact points and gravity pulling on connections. Bury wires in a trench four or more inches deep from the sensor to the access point to
the home so they aren’t a tripping hazard or cut by the lawn mower. Another issue with wired systems, especially with the sensors mounted on rooftops, will be the potential for a lightning strike. Lightning strikes can follow the wired sensor from the roof, down to your console, and to your PC damaging all the component that were touched by the lightning along the way (this can be very expensive). If considering a wired system, ask the weather station vendor for in-line fuses within the cable and grounding procedures that will minimize the potential for significant damage to your system. Sensor signal can be reduced as the length of the cable length increases between the console and the sensor. Check your weather station manufacturer’s manual on the impact to sensor performance as a function of cable length. Wireless Systems There are four key issues you need to consider before purchasing wireless weather station: Location of weather station console location within your home Known sources of radio frequency interference Optimum siting location of sensors on your property (Chapter 3), Reliable transmitting distance between the sensor and the console, as specified by the
weather station manufacturer. Realistically estimate these distances (likely different for temperature/humidity, rain, and anemometer sensors) and the console and assess these distances against the weather station specification for effective sensor communications. Also consider the negative impact on transmission distance resulting from obstructions such as walls and other

28
electronics. If the distance between the console and the optimal siting location of the sensors is greater than the wireless transmission distance, then wireless communications may not be a good choice for you. Also check the price difference between wired and wireless systems which cost more than wired systems, sometimes 10-25% more. Check the frequency(ies) used by the weather station. In the United States, these will typically be either in the 433 MHz range or the 906-928 MHz range. Many cordless phones are in use that are in the 900 MHz range, and these can cause interference to your weather station. Typically, cordless phones in the 2.4 or 5 GHz range, along with wireless networking devices (typically known as 802.11b or 802.11g devices) will not cause interference to a weather station using either of these frequency ranges. Many other potential conflicts can happen. If possible, buy your station from a dealer who will accept a return if you find an unresolvable source of interference in your own application. Solar Powered Sensors: Its possible to substantially achieve siting goals described in chapter 3, yet still have considerable shadow from trees and buildings during the morning and late afternoon. If this is your situation, you should assess the effectiveness of your solar panels to capture enough energy to power the sensors through the low sun angle and cloudy periods (this could be an issue for high latitude areas such as Alaska). We advise you to discuss the suitability of solar powered sensors with your weather equipment technical representative before purchasing a wireless solar powered system. Solar powered systems will typically use batteries for powering the unit during darkness, when the rechargeable batteries are drawn down, or when the capacitor storing the energy provided by the solar panel has discharged. Whenever possible, use of Lithium batteries will provide longer life and will continue to operate at temperatures below –4F where alkaline batteries will typically fail. An advantage of a solar powered sensors is that is can operate for long periods without commercial (AC) power, which is great when severe weather takes down the grid in your area. However, during power grid outages, your station will not be able to report data to CWOP unless your weather station console is battery powered or on an Uninterruptible Power Supply (UPS) and your computer, TNC and amateur radio if applicable, and internet connection are also on a UPS. A disadvantage of solar sensors its panels will eventually degrade and need t o be replaced. Battery Powered Sensors: Generally a convenient solution for placing sensor in locations not possible with wired sensors. However, the there will be some lost data when the battery fails when, according to Murphy’s law, will be when you are away on vacation or just before the 100 year flood event. Sensor Sampling Frequency Limitations Irrespective of the cabled/wireless consideration, you will also want to assess the accuracy, precision, update frequency, and reporting range of your station. This document shows the desired accuracy and precision for reporting to CWOP as each set of
29
observed data is described. Update frequency varies considerably, from as often as once per second to as infrequently as every three minutes or more. Not only will this affect how useful the data is to CWOP, it will also have an affect on your enjoyment of your weather station. Seeing wind data updated only every three minutes during windy conditions may prove very unsatisfying. Reporting range is also very important; some weather stations may not report humidities below 20% or above 90%. If you are in a particularly dry or damp climate, this may be very unsatisfying as well as of nominal utility at best to CWOP and the users of the CWOP products. Generally speaking, the more you pay for a weather station, the better accuracy, precision, reporting range, and update frequency you will experience, so economics will be a factor in your decision – but compare specifications closely as “you get what you pay for” is not a universal truth. b. Positioning Your Sensors Perfection in sensor siting is difficult, if not impossible, to achieve. In most cases, it is not necessary to have perfectly siting sensors to produce useful and substantially representative weather information. Key concepts to remember from Chapter 3: The anemometer should be located as high (33 ft optimal), and rain gauges should be
low and unobstructed as possible (2 feet optimal). This implies you should avoid mounting your anemometer and rain gauge on the same post.
Temperature and dew point (relative humidity) sensors typically should be 5 ft off of the ground near the rain gauge in an area away from artificial heating/cooling sources. It is very important that your temperature/dew point sensor be shielded and the sensor ventilated (naturally open to breezes or mechanically using a fan).
Table 8 was created to help decide the most optimal sensor siting for a series of potential urban locations. The basis for the table’s scoring technique focuses on the impact on sensor performance as a function of height above ground, obstructions, local heating/cooling and moisture sources, access to mixed or ventilated air, and surface type. A “10” score is a perfect siting score, and a “1” is the lowest siting score. The goal is to achieve a “10” in each of the three sensor categories for a total score of 30, or come as close to 30 as possible given your particular siting challenges. If you don’t have a full set of temperature/humidity, rain, and anemometer sensors, base an optimum siting score on the sensors you have. The idea is to maximize your location’s siting opportunities before purchasing and installing your weather station. Note: The pressure sensor siting isn’t assessed, as it is generally inside the home in the weather station master console in a stable temperature environment, away from pressurized rooms and drafts.


31
Table 8. Determining Optimal Sensor Siting for Your Location (Green = Best Location, Red = Poorest Location)
1. Temperature/Humidity (Dew Point) Siting Condition and sensor location
% Daylight Sun a. Unshielded b. Shielded c. Shielded and
Aspirated 2. Rain Gauge 3. Anemometer
a. Under the house eves, above grass
40% 3 4 5 1 – Poor, house creates rain shadow
1 – Poor, eddies caused by house measured, not true wind
b. Under a mature pine tree, above grass (5 ft AGL)
20% (trimmed at
base)
4 – Best, shade will reduce solar contamination (5 ft, 1.5m AGL)
4 5 2 2
c. Next to tree, above grass 60% 2 6 7 4 3 d. In the open, above concrete (5 ft AGL)
100% 1 – Poor, sun and concrete significantly degrade performance
3 – Poor, concrete degrades performance
4 – Poor, concrete degrades performance
7 5
e. In the open, above grass (5 ft AGL)
100% 2 8 – Best, optimal siting (5 ft, 1.5m AGL)
10 – Best, optimal siting (5 ft, 1.5m AGL)
10 – Best, optimal siting (2 ft, 0.6m AGL)
5
f. In the open, above dirt ground (5 ft AGL)
1 – Poor, sun will degrade performance
3 4 5 - Some splashing from ground?
1 – Poor, ground surface winds have little useful value
g. Near house, next to air conditioner or heat pump (5 ft AGL)
50% 2 3 – Poor, AC and house restricted ventilation degrade performance
4 – Poor, AC and house restricted ventilation degrade performance
6 3
h. In the open, near automated sprinklers (5 ft AGL)
100% 1 – Poor, sun will degrade performance
6 7 4 5
i. In the open, next to pool (5 ft AGL)
100% 1 – Poor, sun will degrade performance
5 6 9 – Some splashing? 5
j. 2 m (7ft) above roof apex, trees above sensor level
80% 1 – Poor, sun will degrade performance
4 5 5 7
k. 4m (13 ft) above roof apex, trees below sensor level
100% 2 6 7 3 10 – Best, anemometer above the roof apex influence and tree canopy (33 ft, 10m AGL)
Total Siting Score (perfect score = 30)

32
Section 4. Weather station purchase and setup considerations
c. Data Loggers: Some personal weather stations are available with dataloggers that allow the user to download data from the weather station into a personal computer for a period of time where the weather station and computer might not be connected together. The amount of time that can be stored locally in the datalogger is dependent on the amount of memory in the datalogger and the interval at which data is being archived. While this can be a desirable feature, CWOP cannot accept data retroactively, due to the uncertainty of time stamping for when that data was recorded. Other weather stations allow connection to a personal computer but require that connection to be full-time, having no mechanism for storing data at the weather station for later transfer to a computer. Various software applications are available to transfer data from your weather station, via computer, to CWOP. Not all software is available for all brands and models of weather station, and some weather stations have no provision for connection to a computer. Not all software made to interface with personal weather stations has the capability to transfer data to CWOP, though fortunately, almost all does. A list of software that can send data to CWOP is available at http://mywebpages.comcast.net/dshelms/cwop.html#Weather%20Software%20Supporting%20CWOP/APRSWXNET%20Protocal: For use by CWOP, the weather station and computer must be communicating all the time, or at least at such times that data is being sent to CWOP.

33
Section 5. Weather Station Operations a. Determining position and elevation: As important as setting up your sensors in optimal locations is documenting is documenting your weather station’s position on the Earth horizontally (latitude and longitude) and vertically (elevation). The goal is to determine your location to within 100 feet (30 meters) horizontally, and 10 feet (3 meters) vertically. To meet the guideline of defining your weather station’s position to within 100 feet or 30 meters, you must use the 1’s seconds, 0.0001 decimal, or 0.01 minutes place in your latitude/longitude to achieve this goal. Different software will have you describe your position using different formats, typically HH:MM:SS, sometimes decimal, and rarely LORAN format (WeatherDisplay) position. All these application convert to LORAN format to communicate with CWOP using the APRS protocol. Note: Addition information on latitude/longitude position formats and conversion appears in Appendix 9. Horizontal Position: Any point on the Earth can be represented by a combination of latitude and longitude coordinates. Background: Earth Coordinates - Latitude and Longitude The Earth is divided into: two latitude hemispheres (North and South); sub divided into 180 degrees south pole
to north pole two longitude hemispheres (East and West); sub-divided into 360 degrees circling the
Earth. 8-octants (or eighths) Convention: North latitude is positive and south latitude negative if the “N” or “S” hemisphere is not designated; and degrees east longitude is positive and degrees west longitude is negative if not designated with “E” or “W” hemisphere. Determining your position: There are several ways to determine your position with the goal of within 100 feet or 30 meters 1. Geo-Positioning System (GPS): GPS is a great way to determine your
latitude/longitude as long as your GPS unit acquires (communicates with) four or more satellites.
2. U.S. Postal Mailing Address: For people in the United States, you can use the geocode.com web page to obtain a latitude/longitude position using your U.S. Post Office mailing address. The will work well in most locations, but not for Rural

34
Routes and P.O. Boxes. Validate the position Geocode.com provides by checking your plotted position on the FINDU maps.
3. Nudge your way into position: If you don’t have access to a GPS system and Geocode does not work for you, try to first estimate your position using a map with latitude/longitude lines. Another way to estimate position is to use a nearby airport as a first guess. Landings.com will provide a latitude/longitude in most cases. Finally, nudge you station’s position slowly north or south and east or west using your weather application and APRS/CWOP setup and the positions indicated by the FINDU maps (replace CW0351 with your CWOP ID) to get your position spot-on. Once you are confident of your position information, please email Russ Chadwick ([email protected]) to confirm your location.
Determining your elevation: Once you know your latitude/longitude, you can determine your elevation with the goal of within 10 feet or 3 meters. 1. Geo-Positioning System (GPS): Get the most accurate elevation by waiting long
enough for four or more satellites to be acquired by the GPS unit. Vertical measurements from GPS can vary significantly during short periods. Allow the GPS elevation to stabilize then take the average of the elevation reports. Always validate your GPS elevation against USGS maps or other mapping resources.
2. 1:24,000 USGS: TopoZone.com has high resolution USGS maps on-line for most of the United States. These maps have elevation contours at various intervals (5, 10, 20, 40 feet) for the 1:24,000 scale maps (the highest resolution). Use your validated latitude/longitude position to find your location on a contour map and interpolate your elevation between the two contours either side of your station. Make sure you know the units of the contours. At the 1:24,000 scale, the contour units are typically in feet, but not always. Check the “Map/Photo Info” page to verify the units of the map. All the other Topozone lower resolution maps have meter contour units. (1 foot = 0.3048 meter). If non-US folks can identify international mapping resources, please pass them along.
Note: Always confirm the units of elevation you are working with, either feet of meters. Elevation unit confusion is a significant problem when setting up a new station within CWOP. b. Time: Routinely set your PC’s system clock to an Internet time service. Recent
versions of the Windows operating system can be configured to do this, or you can find freeware applications that will do this.
c. Station Log: It is important to document your station’s siting and equipment and
make this information to people using your data. o Description of the site’s location and exposure. This could include digital
photos, drawings, or text. o Type of sensors and manufacturer o Frequency of maintenance

35
d. Backup sensors: It’s not likely your automated sensors will accurately work all the time. To keep a climate record with minimal holes in it, it’s a good idea to have some backup instruments. The most basic of all backup sensors is a manual rain gauge. The U.S. National Weather Service recommends using a 4-inch or larger diameter rain gauge for reporting climate quality precipitation. The next most important sensor you may want to have is a temperature/dew point sensor. All in one hand-held sensors like the Kestrel could be a good low cost backup system. Of course none of these backup sensors can provide data to CWOP.
e. Station Archive and Climatology: The data collected by your station not only has value in real-time applications such as CWOP, but also has value as the beginning of a climatological database for your area. In various parts of the U.S. and internationally there are regional efforts underway that involve the sharing of climate data collected by personal weather stations. In some cases, some rather sophisticated analysis and interpretation of this data takes place. Some examples are the Washington/Baltimore Climatological Record (no web presence at present) and the Atlantic Coast Observers’ Network (ACON) VA/NC/SC: http://members.cox.net/wxr/acon.htm, MD/DE/DC: http://www.jhuapl.edu/weather/education/ACONdata.html, MA/RI: http://mywebpages.comcast.net/hydromet/in1.htm). Your data is valuable; back it up routinely! At least once a month, back up your computerized data files. Use of a floppy drive, CD, USB memory stick, or other such media can be used; you can also send a copy of your data to a web site. If you’re in an area with a collaborative data sharing project such as those mentioned above, consider joining. Not only will you find it fascinating, but you may also make some useful weather contacts in the same general area as you. You’ll often find much more detailed analysis going on at these collaborative projects than you will with official sources. As an example, the temperature averages used by NOAA for Co-Operative Observer stations will only be the high and low temperatures divided by two. Regional climate projects will generally show a continuous mean, a more meaningful number. If you post your live weather to a web site, consider making your historical data available as well. Others will find it useful. CWOP members have had requests for their past data for high school science fair projects, for hydrological engineering purposes, from contractors looking at work days lost due to hailstorms, and other reasons. The decision as to whether to share data is up to you, but there are others out there with a need or interest for such information; you have an opportunity to provide a unique and valuable service to others. f. Station Operation Tips: This section will provide a somewhat random list of “tips and tricks” recorded by other users of personal weather stations. Most will apply to virtually any personal weather station; few if any are brand or model specific:

36
Keep the grass and creeping plants away from the temperature and precipitation gauges. If your instruments are mounted above grass, keep the grass clipped to be representative of the surrounding area, and make sure no grass or other vegetation interferes with instrument operation or free airflow into and around the instruments. Secure all wires/lines (bury) to keep the dog and lawn mowing from eating your wires. Consider using PVC pipe as a conduit in which to bury your cables. Clear snow and ice from temp shields (will effect temps) and out of unheated rain gauges (to prevent “melt out” precip) soon after snow or winter precipitation stops. (You may wish to manually melt and measure the liquid equivalent precipitation amounts from this removed frozen precipitation.) Use insecticide or other control measures around the base supporting your weather station. Ants and other critters seem to have a fascination for building nests and other habitats around weather instruments. BE CAREFUL not to get insecticide or other chemicals on any of the plastic parts of your weather station as they can be very harmful to the plastic surfaces. Check your rain gauge frequently for obstructions either in the funnel (leaves, pine needles, etc.) as well as under the rain collector. Do so with CAUTION however, as wasps, black widow spiders, and other potentially harmful creatures have been known to set up housekeeping within weather stations. Use cable ties or other means of attaching loose cables to your mounting mast so that instrument cables will not be whipped around by the wind, causing premature wear and failure. If you have an electric heater for your rain gauge or anemometer, make sure it is unplugged during warmer weather, so it does not cause any melting or damage to components and does not skew temperatures upward. Some heaters have thermostats, however once the danger of your last frost has passed, unplugging the heater is still a prudent safety measure. Check your weather station’s manual for manufacturer recommendations about maintenance and cleaning. Follow those recommendations. Some stations, for instance, encourage periodic lubrication of the anemometer components while others state absolutely that they should NEVER be lubricated. Follow your manufacturers recommendations about replacing batteries in remote sensors. Some users find that replacing batteries slightly more frequently than recommended results in maintaining good communications between the instruments and console. If your area is subjected to below zero temperatures, consider using Lithium batteries as backup batteries in your remote instruments (if so equipped), at least during the winter.

37
If your station uses rechargeable batteries, however, just follow manufacturers recommendations about battery types (likely either NiCad or NiMH). Anemometers will sometimes ice up during frozen precipitation events. Extreme caution should be used in clearing ice from anemometers; these are typically constructed of plastic and can break fairly easily if struck or chipped, particularly during low temperatures when the plastic will tend to be most brittle. Given the many recommendations in this manual about sensor placement, you may think you have little flexibility left in configuring your station! Well, if you do, and your station uses solar panels for powering any portion of your station, orient the solar panel(s) for southern exposure, receiving as much sunlight as possible each day throughout the year.

38
Section 6. Communications and Security A combination of Automatic Position Reporting System (APRS) Internet Service (IS), NOAA, and University of Utah servers process CWOP data. This collection of servers has kept up with the rapid growth in the number and frequency of CWOP weather reports. Occasionally, CWOP does have some instability but generally the system availability is very high thanks to the dedication and generosity of the APRS IS volunteers. CWOP collects only real-time data. The reason for accepting only real-time data is we find with the many time zones and wide variety of PC system clock settings, we cannot trust the valid times from a large percentage of weather stations. Instead, CWOP time stamps weather reports as they are accepted with a receive time stamp synchronized with an Internet time service. The requirement to send only real-time weather reports requires CWOP members to keep their weather stations, Personal Computers, and Data Logging software (e.g. Ambient, Davis, FreeWx, WeatherDisplay, WeatherSolution, etc.) to be on continuously. Systems like the Davis datalogger can “queue” data in their in-line hardware storage units when their PC is shut off, but CWOP cannot accept these older data because of the uncertainty of their time stamps. a. Computer Security Many CWOP members have concerns about leaving their PCs continuously on fearing that this might increase the risk of a hacker attack. Participating in the CWOP does not by itself increase risk from Internet attacks. CWOP communications protocol does not allow other computers to connect to your computer, rather CWOP members connect to trusted APRS-IS servers, upload weather data, and immediately disconnect. No data are sent from the APRS-IS servers to your computer. However, increased exposure to the risks of computer software damage, denial of service, and identity theft is possible if you don't take steps to educate and protect yourself when using the Internet. There are three ways people can gain access to your computer and personal information: 1. Leaving communication "doors" (ports) open to your computer allowing a successful active attack, and 2. Allowing malicious software hidden in an email, a web site, or an application to be loaded onto your computer. 3. Responding to unsolicited email (e.g. “phish”) which request private information such as credit card numbers, bank accounts, social security numbers, passwords, personal identify numbers (PIN), etc. For additional information on preventing computer attacks and identity theft, visit these pages: http://mywebpages.comcast.net/dshelms/web_security.html http://mywebpages.comcast.net/dshelms/cwop_phishing.htm

39
b. APRS File Format Protocol All software supporting CWOP uses the APRS communications protocol to format messages for transmission. The following is an example of a formatted APRS weather message from Philip Gladstone’s page: http://pond1.gladstonefamily.net/aprswxnet.html CW0003>APRS,TCPXX*:@241505z4220.45N/07128.59W_032/005g008t054r001p078P048h50b10245e1w
The full APRS Protocol specification can be found at the following link (pdf file): ftp://ftp.tapr.org/aprssig/aprsspec/spec/aprs101/APRS101.pdf c. How does CWOP Data get to NOAA? Figure 3 below shows the multiple steps a CWOP/APRS message takes to arrive at NOAA. While your weather report travels through three separate computers, the time it takes to send your weather report from your computer to the FINDU server is typically not more than a couple seconds. NOAA fetches data from the FINDU server every 15 minutes, but is considering increasing the pick-up rate to once every 5 minutes in the future. We suggest upload frequency of every 5 minutes for CWOP members with
Table 9. Example APRS Weather Message Field Meaning CW0003 Your CW number >APRS,TCPXX*: Boilerplate @241505z The ddhhmm in UTC of the time that you generate the report 4220.45N/07128.59W Your location. This is ddmm.mm -- i.e. degrees, minutes and
hundredths of minutes. The Longitude has three digits of degrees and leading zero are required.
_032 The direction of the wind from true north (in degrees). /005 The average wind speed in mph g008 The maximum gust wind speed in mph (over the last ten minutes) t054 The temperature in degrees Fahrenheit -- if not available, then use
't...' Temperatures below zero are expressed as -01 to -99. r001 The rain in the last 1 hour (in hundredths of an inch) -- this can be
omitted p078 Rain in the last 24 hours (in hundredths of an inch) -- this can be
omitted P044 The rain since the local midnight (in hundredths of an inch) -- this
can be omitted h50 The humidity in percent. '00' => 100%. -- this can be omitted. b10245 The barometric pressure in tenths of millibars -- this can be omitted.
The pressure is adjusted according altimeter pressure reduction method
e1w The software you are using
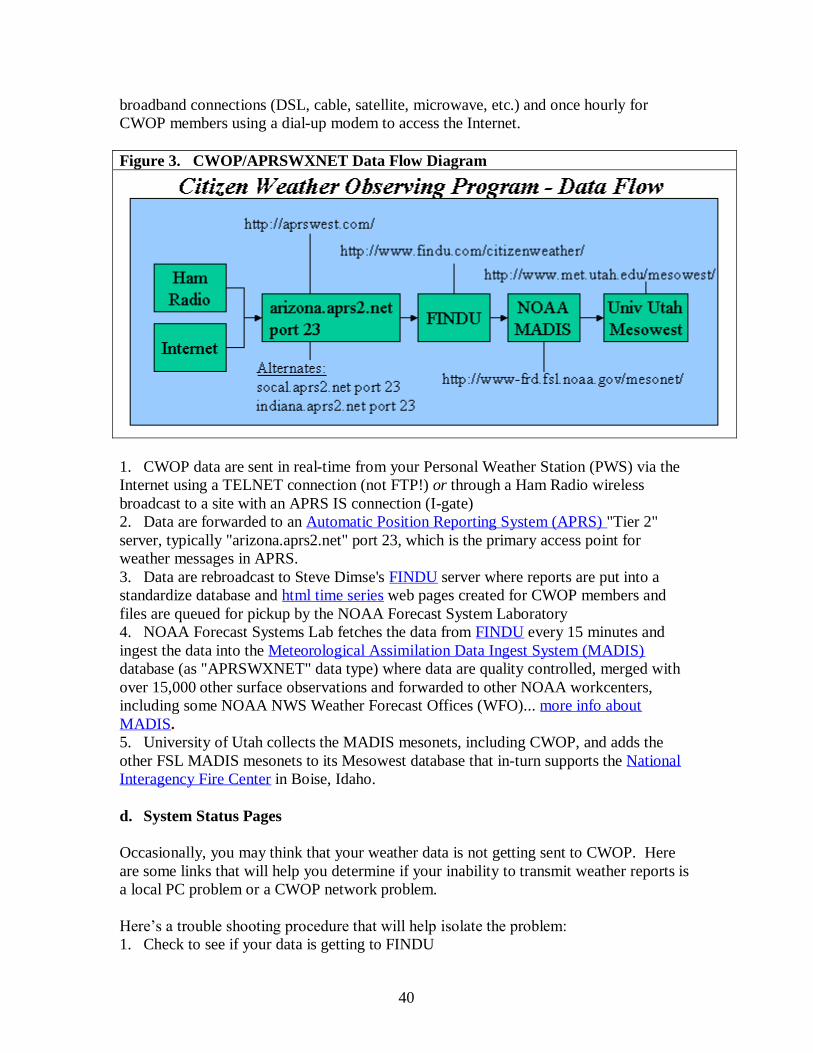
40
broadband connections (DSL, cable, satellite, microwave, etc.) and once hourly for CWOP members using a dial-up modem to access the Internet. Figure 3. CWOP/APRSWXNET Data Flow Diagram
1. CWOP data are sent in real-time from your Personal Weather Station (PWS) via the Internet using a TELNET connection (not FTP!) or through a Ham Radio wireless broadcast to a site with an APRS IS connection (I-gate) 2. Data are forwarded to an Automatic Position Reporting System (APRS) "Tier 2" server, typically "arizona.aprs2.net" port 23, which is the primary access point for weather messages in APRS. 3. Data are rebroadcast to Steve Dimse's FINDU server where reports are put into a standardize database and html time series web pages created for CWOP members and files are queued for pickup by the NOAA Forecast System Laboratory 4. NOAA Forecast Systems Lab fetches the data from FINDU every 15 minutes and ingest the data into the Meteorological Assimilation Data Ingest System (MADIS) database (as "APRSWXNET" data type) where data are quality controlled, merged with over 15,000 other surface observations and forwarded to other NOAA workcenters, including some NOAA NWS Weather Forecast Offices (WFO)... more info about MADIS. 5. University of Utah collects the MADIS mesonets, including CWOP, and adds the other FSL MADIS mesonets to its Mesowest database that in-turn supports the National Interagency Fire Center in Boise, Idaho. d. System Status Pages Occasionally, you may think that your weather data is not getting sent to CWOP. Here are some links that will help you determine if your inability to transmit weather reports is a local PC problem or a CWOP network problem. Here’s a trouble shooting procedure that will help isolate the problem: 1. Check to see if your data is getting to FINDU
41
http://www.findu.com/cgi-bin/wxpage.cgi?call=CW0351 --- replace “CW0351” with your CWOP ID 2. Check your weather application/data logger communication log file for errors 3. CWOP/APRSWXNET News and Overall System Status at the CWOP News Page
http://wxqa.com/news.html 4. Check Dick Stanich's IU-View32 Web Server to look at latest APRS "CW" traffic at
this web page: http://206.123.154.99/wxall.html 5. Check the FINDU News and Status Page:
http://www.findu.com/new.html 6. Forecast Systems Lab MADIS Status - TBD 7. Check to see if the CWOP data is getting to the University of Utah:
Mesowest / ROMAN System Status: http://www.met.utah.edu/droman/help/status.html Mesowest Mesonets Status Page: http://www.met.utah.edu/cgi-bin/database/meso_status.cgi Time-Series of CWOP/APRSWXNET observations received at Mesowest: http://www.met.utah.edu/mesowest/monitor/APRSWXNET.gif
Sometimes individual Tier 2 APRS IS servers go off-line. You will know this as a significant fraction of the typical number of CWOP stations of stop transmitting. Some applications like WeatherDisplay and Ambient VWS will “time out” on the primary programmed APRS IS server and try to connect to the second and third choice of servers in the queue without any intervention. However, other applications like Davis WeatherLink will simply time-out without trying an alternative server. If this is your situation, you must manually reset the default APRS IS server in the APRS setup menu to an alternative server. Here is the list of available APRS IS servers CWOP/APRSWXNET members can send data to:
arizona.aprs2.net port 23 socal.aprs2.net port 23 indiana.aprs2.net port 23 newengland.aprs2.net port 23 aprsfl.net port 14580
e. APRS Data Format Wish List The APRS message format adequately supports CWOP, but it could be improved upon in a couple ways. Here is our APRS message format wish list: 1. Change the “5 minute” peak gust to a “10 minute” peak gust to be more consistent with ASOS/METAR observations. 2. Change the “1 minute” mean wind to a “2 minute” mean wind to be more consistent with ASOS/METAR observations. 3. Explicitly define temperature as a the most recent 5-minute average ambient air temperature value and the relative humidity (dew point) as the most recent 1-minute average relative humidity value to be consistent with the ASOS/METAR sampling paradigm and to achieve optimal signal to noise data quality.
42
4. Most weather stations have the precision and accuracy to observe and report temperatures to the nearest tenth of a degree Fahrenheit (F). APRS should allow the full precision (XXX.XF) to be transmitted. This will require expanding the temperature (t) parameter to four significant digits including the negative sign 5. Support for SI units: Temperature in tenths of degrees Celsius, wind in meters per second. CWOP/APRSWXNET is no longer a North American format, but an international de facto standard and needs to embrace international measurement units. 6. Many manufacturers provide additional instruments that could be incorporated into CWOP database, including:
solar radiation, ultra-violet measurements, ozone, soil temperature, soil moisture, evaporation
These parameters will need to be assessed for inclusion into the APRS protocol in the future. Section 7. Summary The Ham Radio community has enabled CWOP to become one of the largest surface mesonets in the world with members from every U.S. state, territory, and over 30 countries. With the Ham’s continued support and the expansion of the Internet, CWOP will grow at a rapid rate. While it is important to continue to expand our membership, CWOP will have the greatest impact going forward if data quality and reliability are improved. This guide was written to provide a common set of standards that our members and partners in industry might apply towards improving the quality of our observations. In addition to establishing uniform observing standards, this guide was written to improve the understanding of the atmosphere such that our members will see the rationale behind the standards enabling them to creatively apply the standards in a way that yields the best results. Ultimately, our goal is for CWOP be a valuable resource to our communities, educators, and professional meteorologists alike while recognizing that we do this for fun and the love of weather watching. We hope that this guide is successful in this regard.
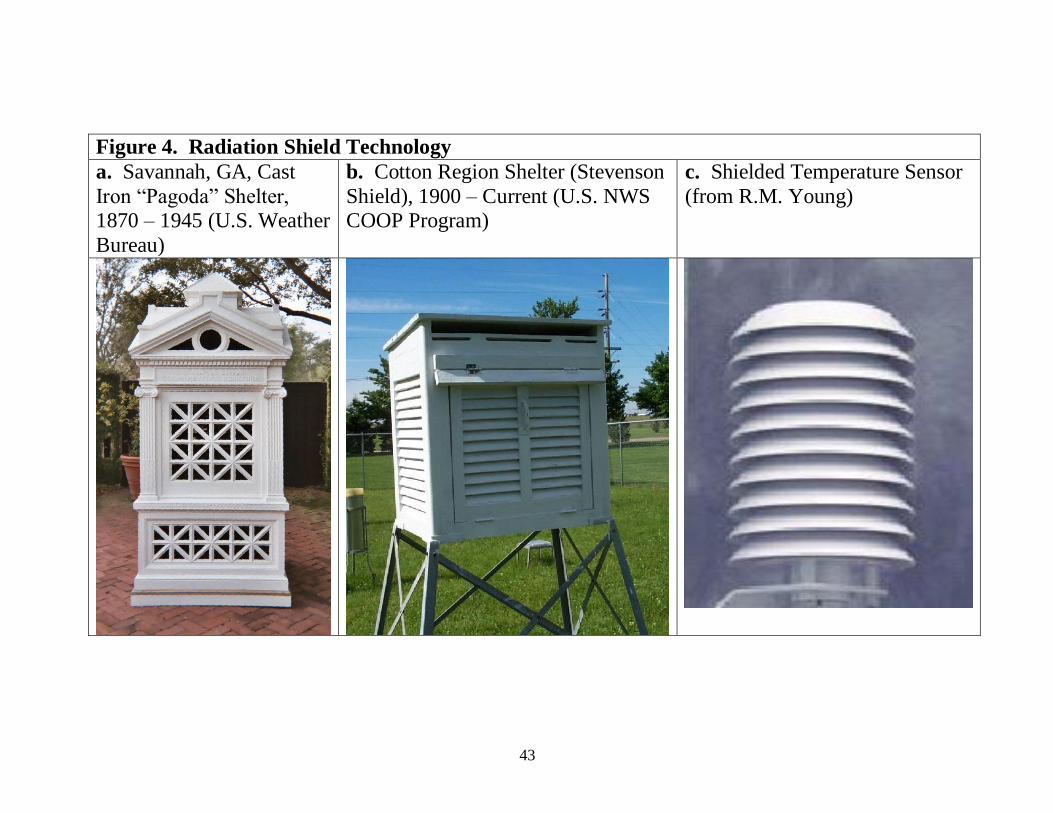
43
Figure 4. Radiation Shield Technology a. Savannah, GA, Cast Iron “Pagoda” Shelter, 1870 – 1945 (U.S. Weather Bureau)
b. Cotton Region Shelter (Stevenson Shield), 1900 – Current (U.S. NWS COOP Program)
c. Shielded Temperature Sensor (from R.M. Young)

44
Figure 5. Temperature and Dew Point Sensor Siting
• On a level, well-ventilated, open clearing
• Radiation shield mounted on a 5.0 ft (1.5 m) post
• At least 100 ft (30 m) from road/concrete
• No closer than four times the height of any obstruction
• Located on natural/ representative groundcover, such as trimmed grass or dirt in semi-arid areas • Avoid sprinkler systems
100 ft from road
4:1 distancefrom tall objects
80 ft
20 ft sensor shieldon 5 ft post
clear overhead helps ventilation
100 ft from road
4:1 distancefrom tall objects
80 ft
20 ft sensor shieldon 5 ft post
clear overhead helps ventilation

45
Figure 6.a Alter (Rain Gauge) Wind Shield surrounding an 8 inch Standard Rain Gauge (manual)
Figure 6.b Double Alter (Rain Gauge) Wind Shield surrounding a Geonor Weighing Gauge (automated)

46
Figure 7. Influence of wind flow over and across rain gauge resulting in turbulent flow and reduction in rain catch efficiency. Catch decreases rapidly with increase in wind speed above 4 mph (2 m/s).
From: Nespor and Sevruk (1999)

47
Figure 8. Effect of Increasing Winds and Resulting Turbulence on Rain Gauge “Catch” Efficiency on 8 inch Unshielded Standard Rain Gauge
% Precipitation Catch vs. Wind Speed100
82.8
68
53.2
40.6
3022
16.412
0
10
20
30
40
50
60
70
80
90
100
0.0 1.0 2.0 3.0 4.0 5.0 6.0 7.0 8.0
Wind Speed (meters/second)
Perc
ent P
reci
p "C
atch
"
From: Ensuring Quality Long-Term Monitoring with Geonor Precipitation Gauges Workshop Report, May 13-14, 2003 (Daqing Yang, University of Alaska at Fairbanks)

48
Figure 9. Relationship of Elevation to Rain Gauge Precipitation Under-Catch and Wind Speed
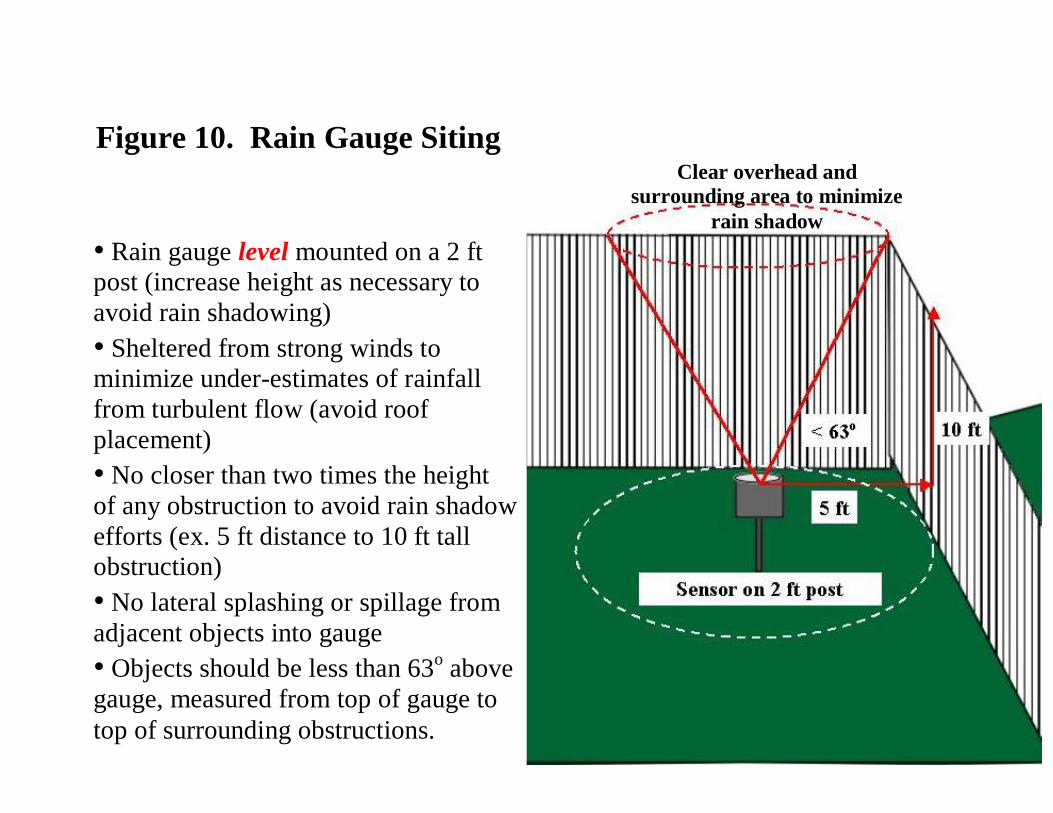
49
Figure 10. Rain Gauge Siting
• Rain gauge level mounted on a 2 ft post (increase height as necessary to avoid rain shadowing) • Sheltered from strong winds to minimize under-estimates of rainfall from turbulent flow (avoid roof placement) • No closer than two times the height of any obstruction to avoid rain shadow efforts (ex. 5 ft distance to 10 ft tall obstruction) • No lateral splashing or spillage from adjacent objects into gauge • Objects should be less than 63o above gauge, measured from top of gauge to top of surrounding obstructions.
Clear overhead and surrounding area to minimize
rain shadow
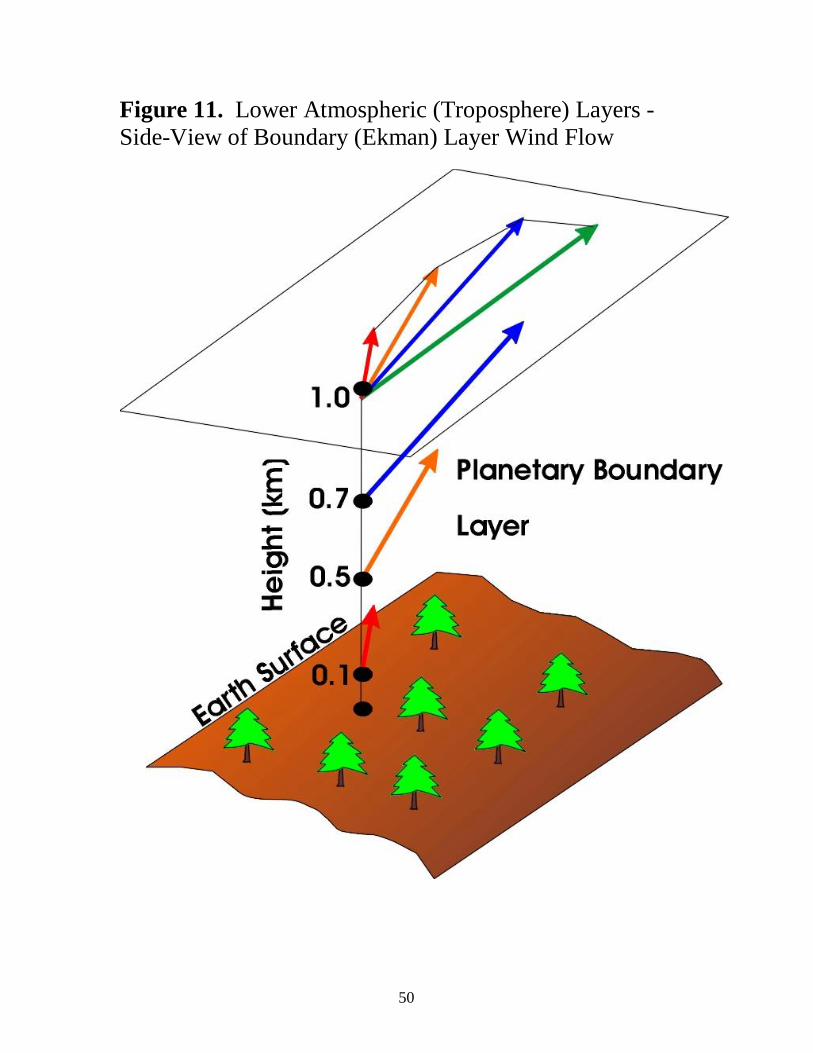
50
Figure 11. Lower Atmospheric (Troposphere) Layers - Side-View of Boundary (Ekman) Layer Wind Flow
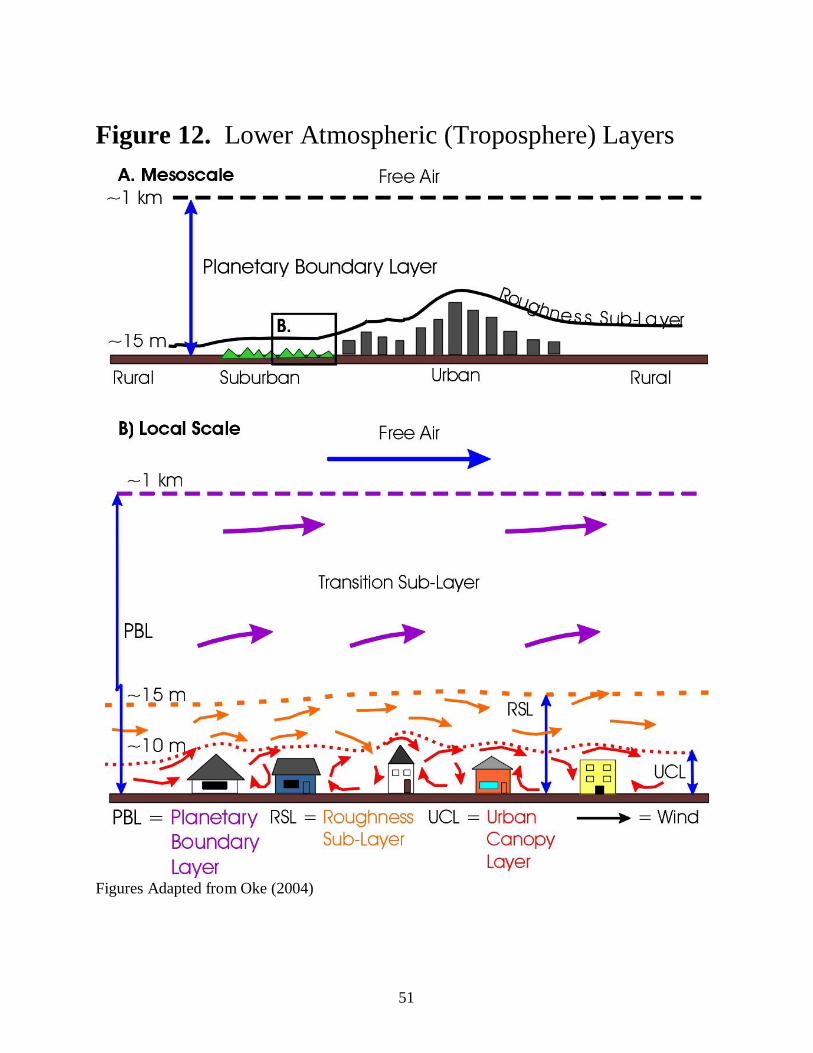
51
Figure 12. Lower Atmospheric (Troposphere) Layers
Figures Adapted from Oke (2004)
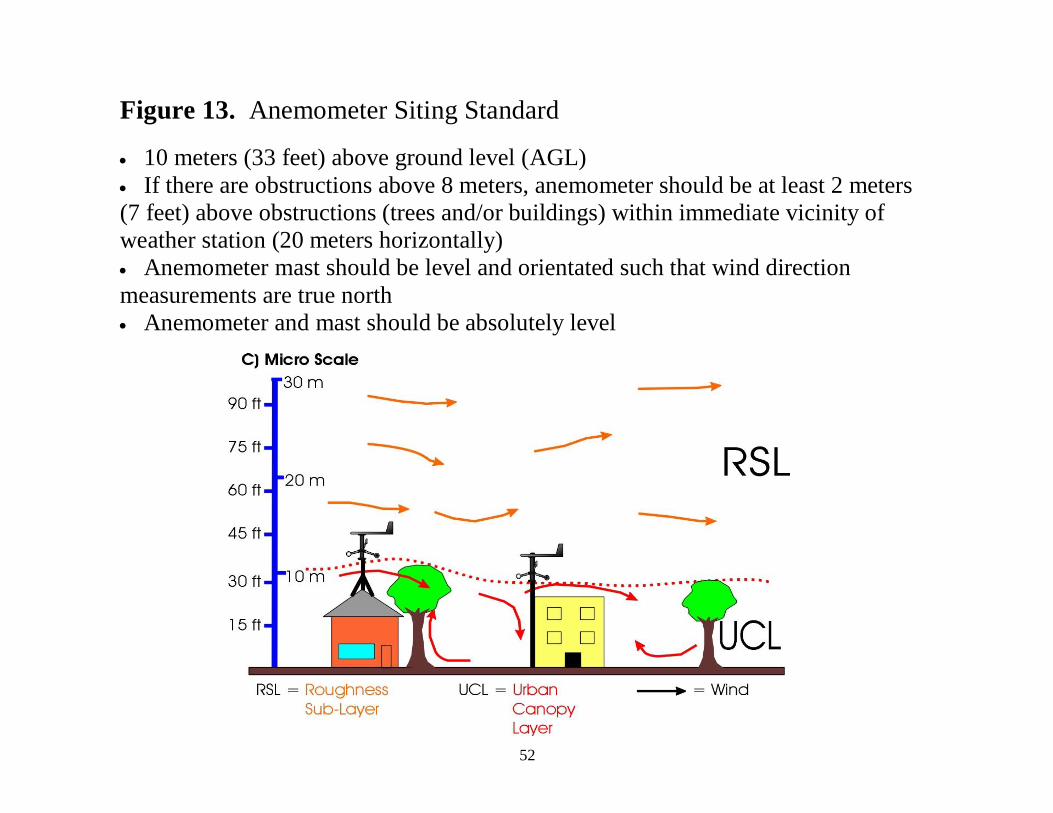
52
Figure 13. Anemometer Siting Standard 10 meters (33 feet) above ground level (AGL) If there are obstructions above 8 meters, anemometer should be at least 2 meters (7 feet) above obstructions (trees and/or buildings) within immediate vicinity of weather station (20 meters horizontally) Anemometer mast should be level and orientated such that wind direction measurements are true north Anemometer and mast should be absolutely level
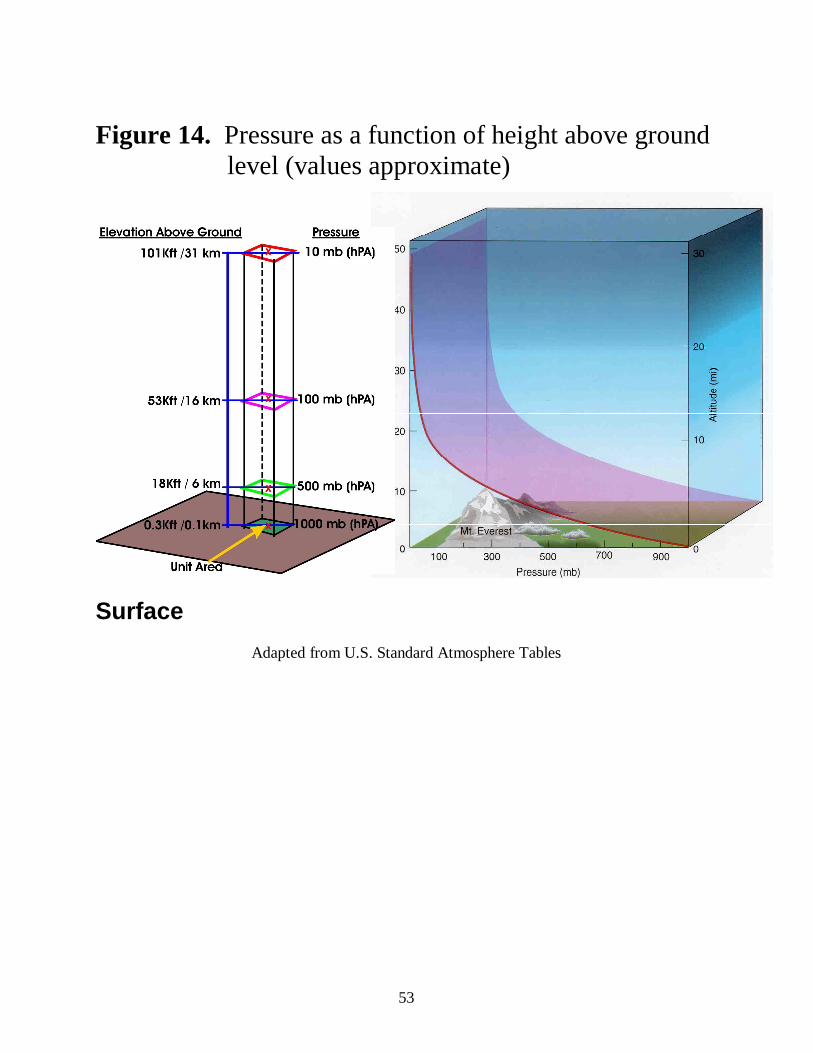
53
Figure 14. Pressure as a function of height above ground level (values approximate)
Surface
Adapted from U.S. Standard Atmosphere Tables
54
Appendices: 1. Case Study of Two Stations to Illustrate the Impact of Solar Radiation on Temperature
Measurements 2. MADIS Quality Control and Monitoring System (QCMS) Background 3. Discussion of the Origin of Meteorology 4. Brief History of Meteorological Observations and Instruments 5. Discussion of “Meteorological” Time 6. Discussion of Measurement and Calibration Terms 7. NWS Skywarn Program 8. Useful Weather Station Related Web Pages 9. Latitude/Longitude Formats and Conversions


56
Appendix 1. Case Study of Two Stations to Illustrate the Impact of Solar Radiation on Temperature Measurements Daily QC: http://www-sdd.fsl.noaa.gov/MSAS/qcms_data/qc12/qcday.txt Table 1. APRSWXNET DAILY QUALITY CONTROL MESSAGE (PAGE 15 OF 92) ********************************************************************************* * 8-MAR-2005* SLP * POT TEMP * DEW PNT * DD * FF * ALT * * 00-23 UTC * (MB) * (DEG F) * (DEG F) * (DEG) * (KNTS) * (MB) * ********************************************************************************* * TOTAL OBS * 0 * 193592 * 181127 * 193724 * 193724 * 181598 * * QST OBS * 0 * 7343 * 15576 * 6066 * 6103 * 47240 * *PERCENT QST* 0.00 * 3.79 * 8.60 * 3.13 * 3.15 * 26.01 * ********************************************************************************* * AP612 * * * * * * 2/ 2/ 74* * AP627 * * * 9/ -9/ 38* * * * * AP638 * *13/-12/ 31* * * * 2/ 2/ 43* * AP645 * * * * * * 9/ -9/ 76* * AP647 * * *22/-21/100* * * * * AP648 * * * * * * 2/ 2/ 29* * AP650 * * *10/-10/ 28* * * * * AP651 * * *12/-12/ 39* * * 3/ -3/100* * AP653 * * *10/ 10/ 52* * * 2/ 2/ 31* ********************************************************************************* ERROR= ANALYSIS-OBSERVATION RMS ERROR/MEAN ERROR/PERCENT QST Figure 15. Time-Series of temperature and dew point for unshielded (left) and shielded (right) sensors
a. Unshielded Thermometer WB5SYS-1 (AP638) b. Shielded Thermometer KE5AQD-7, within 4 miles of WB5SYS-1

57
Appendix 1: Case Study Discussion
1. Table 1. The CWOP daily quality control shows station AP638 with possible 13 F degree “hot” temperature 31% of the time (minus sign means you need to subtract this amount to correct the temperature to the expected temperature).
2. The error is non-linear meaning it is not a constant bias. As shown in figure 15, the low temperatures and are generally within 2-4 F degrees which is good agreement. However, the afternoon temperatures differ by 15-20 F degrees between WB5SYS-1 (left) and KE5AQD-7 (right). The rapid spiking of station WB5SYS-1’s afternoon temperatures is a clear sign its thermometer needs better shielding from the sun. Station KE5AQD-7 has a thermometer with adequate shielding with a gradual and rounded low and high temperature time series without “spikes” seen in the WB5SYS-1 time-series. Its notable that from March 3rd through March 7th both station’s data track closely together. This occurred during a cloudy and rainy event where there was no direct solar radiation.

58
Appendix 2. MADIS Quality Control and Monitoring System (QCMS) Background http://www-sdd.fsl.noaa.gov/MSAS/qcms_descrip.html QCMS checks station data every hour against internal consistency (IC), validity (VC), temporal consistency (TC), and spatial consistency (SC). Thresholds for these checks are: Validity Checks (VC) flagging if exceeds: Temperature outside of -60F and 130F Dew Point outside of -90F and 90F Temporal Consistency (TC) Check: Temperature more than 35F change per hour Dew Point more than 35F change per hour Internal Consistency (IC) Check flagging: The dew point observation must not exceed the temperature observation made at the same station at the same time. Spatial Consistency (SC) flagging: Temperature: Station temperature is 6 F degrees* or more different from the surrounding stations during the hourly check Dew Point: Station dew point is 7 F degrees or more different from the surrounding stations during the hourly check Checking the CWOP QCMS information frequently will help identify potential systemic problems with your weather station reports. An example of QCMS output showing flagged ambient temperature and dew point from stations AP474 and AP476 is shown in Table 10 below. Table 10. Example questionable (potential) temperature and dew point from APRSWXNET HOURLY QUALITY web page 1-JUN-2004 0000 UTC
SLP (MB)
POT TEMP (DEG F)
DEW PNT (DEG F)
DD (DEG)
FF (KNTS)
ALT (MB)
TOTAL OBS 0 4785 4314 4791 4791 4457 QST OBS 0 225 594 131 137 1397 PERCENT QST 0.00 4.70 13.77 2.73 2.86 31.34 AP474 -7 ( 6) 4(2) AP476 -8( 6) 9( 7)
OB ERROR ( ERROR THRESHOLD ) Decode: a. On June 1, 2004, Station AP474 exceeded the spatial consistency check (6F degrees) and the expected temperature by an average +7F (or the observation needed –7F to be subtracted from the temperature to be corrected to other nearby stations). b. On June 1, 2004, Station AP476 exceeded the spatial consistency check (7F degrees) and the expected dew point by an average -9F (or the observation needed +9F to be added to the dew point to be corrected to other nearby stations). Note 1: a. SLP = Sea Level Pressure (not checked)

59
b. POT TEMP = QCMS uses the “potential” temperature to compare stations temperatures at different elevations against each other. Potential temperature is the temperature reduced to sea level. c. DEW PNT = Dew Point (F = Fahrenheit) d. DD = Wind Direction (DEG = Degrees) e. FF = Wind Speed (KNTS = Knots, 1 knot = 1.15 mile per hour) The following are web pages that monitor CWOP/APRSWXNET weather station reports. If you are a new CWOP member, it may take 1-2 weeks for your data to appear on the web pages. If your station is operating within the QCMS validity checks, its data will not be flagged and your station will not appear. CWOP Access to QCMS Data: Register for emailed daily QC reports for your weather station: http://weather.gladstonefamily.net/weather-qc Look at time series of your station’s weather verses the analysis: http://pond1.gladstonefamily.net/cgi-bin/wxqchart.pl?site=XXXXX where XXXXX is your station ID (e.g., C0001 or AR001 or AP001) Quality Control Description: http://www-sdd.fsl.noaa.gov/MSAS/qcms_smry_descrip.html Hourly Quality Control Statistics: http://www-sdd.fsl.noaa.gov/MSAS/qcms_data/qc12/qchour.txt Daily Quality Control Statistics: http://www-sdd.fsl.noaa.gov/MSAS/qcms_data/qc12/qcday.txt Weekly Quality Control Statistics: http://www-sdd.fsl.noaa.gov/MSAS/qcms_data/qc12/qcweek.txt Monthly Quality Control Statistics: http://www-sdd.fsl.noaa.gov/MSAS/qcms_data/qc12/qcmonth.txt Philip Gladstone’s Graphical Plots of QCMS Statistics http://pond1.gladstonefamily.net/weather-qc http://pond1.gladstonefamily.net/cgi-bin/wxqchart.pl?site=XXXXX where XXXX is your station ID (e.g., C0001 or AR001 or AP001) http://pond1.gladstonefamily.net/cgi-bin/wxqual.pl?site=XXXXX where XXXX is your station ID (e.g., C0001 or AR001 or AP001) Philip’s table of stations with pressure mean errors greater than 3 mb: http://pond1.gladstonefamily.net/cgi-bin/wxmiscal.pl Register for Philip’s QC Listserver and Daily Email Service: http://pond1.gladstonefamily.net/mailman/listinfo/wxqc QC Listserver Archive: http://pond1.gladstonefamily.net/pipermail/wxqc/ Mesowest Station Quality Control Time-Series http://www.met.utah.edu/cgi-bin/droman/regress_database.cgi?stn=XXXXX where XXXXX is your station ID (e.g., C0001 or AR001 or AP001)

60
Philip Gladstone’s Time Series of QCMS Statistics Figure 16. Observed (Raw Data) verses Guess (Analysis) a. Pressure (Altimeter) c. Dew Point
b. Temperature d. Station Standard Deviation/Mean Error Scatter Plot

61
Appendix 3. Origin of Meteorology – Meteorologica Written by Aristotle in 350 BC Translated by E. W. Webster http://classics.mit.edu/Aristotle/meteorology.html
From Intro: Aristotle’s Definition of Meteorology
“It is concerned with events that are natural, though their order is less perfect than that of the first of the elements of bodies. They take place in the region nearest to the motion of the stars. Such are the milky way, and comets, and the movements of meteors. It studies also all the affections we may call common to air and water, and the kinds and parts of the earth and the affections of its parts. These throw light on the causes of winds and earthquakes and all the consequences the motions of these kinds and parts involve. Of these things some puzzle us, while others admit of explanation in some degree. Further, the inquiry is concerned with the falling of thunderbolts and with whirlwinds and fire-winds, and further, the recurrent affections produced in these same bodies by concretion.”
Following comments on Meteorologica by Bryan Yeaton, Host of the Weather Notebook http://www.weathernotebook.org/transcripts/2000/11/10.html
It's a pretty safe bet that people have been thinking about the weather for as long as they've been thinking, but the Greek philosopher Aristotle was the first person to organize and record his weather thoughts in a systematic way. In a book he called Meteorologica, which dates to around 340 BC, Aristotle dealt with the properties and processes of everything that happens between the surface of the earth and the orbit of the moon -- from comets to clouds.
Aristotle grappled with a lot of the questions that weather researchers still study today the cause of lightning, why seasonal rainfall varies from region to region, the relationship between cloud height and precipitation, the origin of wind direction and speed.
The questions were sound; unfortunately most of the answers were wrong. Aristotle's core problem was that he based all his explanations on two false assumptions first that the earth is at the center of the cosmos, and second, and even more fatal, that four elements earth, water, air and fire make up everything in our world including weather. Rather than look out the window and study what was falling from the sky, Aristotle kept trying to squeeze atmospheric phenomena into the four-element theory.
Aristotle's Meteorologica did not give us a sound foundation for weather science but the book did establish meteorology as a distinct discipline of study and, more importantly, it grounded the new discipline on the assumption that whatever happens in the sky has a rational explanation. And of course the book had a catchy title after all, we're still using it more than 2,000 years later.
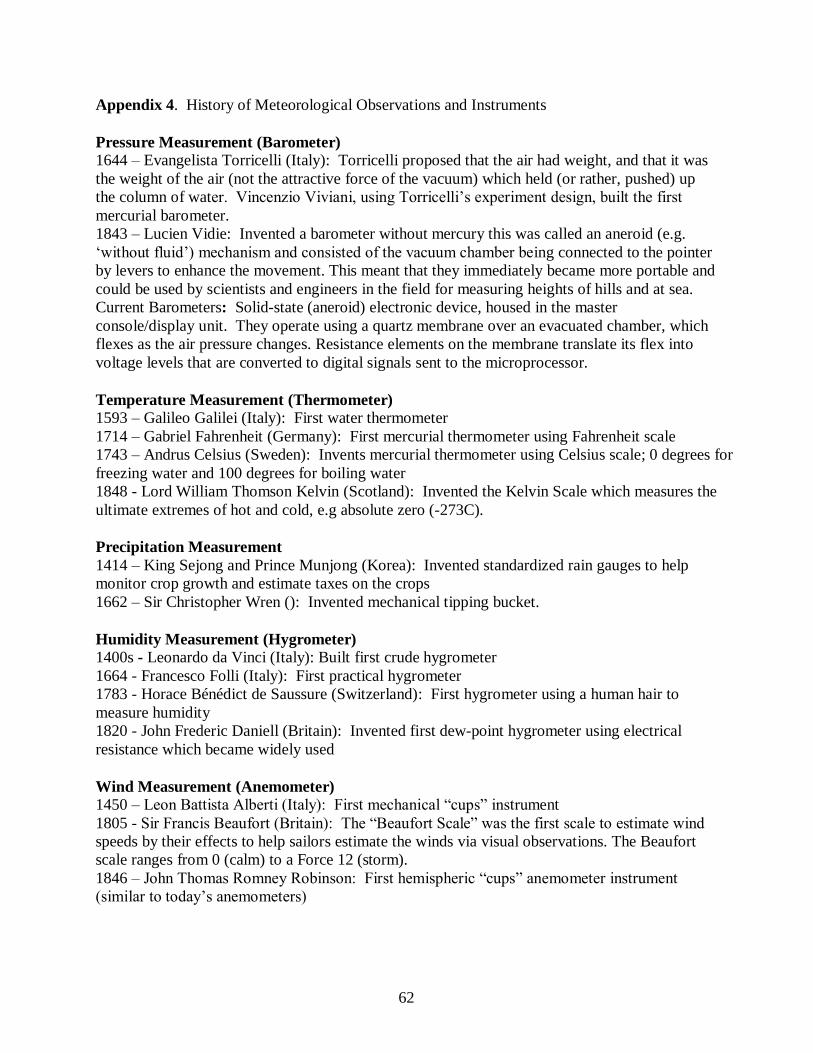
62
Appendix 4. History of Meteorological Observations and Instruments
Pressure Measurement (Barometer) 1644 – Evangelista Torricelli (Italy): Torricelli proposed that the air had weight, and that it was the weight of the air (not the attractive force of the vacuum) which held (or rather, pushed) up the column of water. Vincenzio Viviani, using Torricelli’s experiment design, built the first mercurial barometer. 1843 – Lucien Vidie: Invented a barometer without mercury this was called an aneroid (e.g. ‘without fluid’) mechanism and consisted of the vacuum chamber being connected to the pointer by levers to enhance the movement. This meant that they immediately became more portable and could be used by scientists and engineers in the field for measuring heights of hills and at sea. Current Barometers: Solid-state (aneroid) electronic device, housed in the master console/display unit. They operate using a quartz membrane over an evacuated chamber, which flexes as the air pressure changes. Resistance elements on the membrane translate its flex into voltage levels that are converted to digital signals sent to the microprocessor.
Temperature Measurement (Thermometer) 1593 – Galileo Galilei (Italy): First water thermometer 1714 – Gabriel Fahrenheit (Germany): First mercurial thermometer using Fahrenheit scale 1743 – Andrus Celsius (Sweden): Invents mercurial thermometer using Celsius scale; 0 degrees for freezing water and 100 degrees for boiling water 1848 - Lord William Thomson Kelvin (Scotland): Invented the Kelvin Scale which measures the ultimate extremes of hot and cold, e.g absolute zero (-273C).
Precipitation Measurement 1414 – King Sejong and Prince Munjong (Korea): Invented standardized rain gauges to help monitor crop growth and estimate taxes on the crops 1662 – Sir Christopher Wren (): Invented mechanical tipping bucket.
Humidity Measurement (Hygrometer) 1400s - Leonardo da Vinci (Italy): Built first crude hygrometer 1664 - Francesco Folli (Italy): First practical hygrometer 1783 - Horace Bénédict de Saussure (Switzerland): First hygrometer using a human hair to measure humidity 1820 - John Frederic Daniell (Britain): Invented first dew-point hygrometer using electrical resistance which became widely used
Wind Measurement (Anemometer) 1450 – Leon Battista Alberti (Italy): First mechanical “cups” instrument 1805 - Sir Francis Beaufort (Britain): The “Beaufort Scale” was the first scale to estimate wind speeds by their effects to help sailors estimate the winds via visual observations. The Beaufort scale ranges from 0 (calm) to a Force 12 (storm). 1846 – John Thomas Romney Robinson: First hemispheric “cups” anemometer instrument (similar to today’s anemometers)
63
Appendix 5. Description of Meteorological Time
References: National Weather Service Radar Product Description Page http://www.erh.noaa.gov/radar/radinfo/radinfo.html#utc NIST Time “History” Page: http://physics.nist.gov/GenInt/Time/time.html Weather observations around the world (including radar observations) are always taken with respect to a standard time. By convention, the world's weather communities use a twenty four hour clock, similar to "military" time, based on the 0° longitude meridian, also known as the Greenwich meridian. Prior to 1972, this time was called Greenwich Mean Time (GMT) but is now referred to as Coordinated Universal Time or Universal Time Coordinated (UTC). It is a coordinated time scale, maintained by the Bureau International des Poids et Mesures (BIPM). It is also known a "Z time" or "Zulu Time" (“Z” for zero longitude or the prime meridian, where the Greenwich Observatory is located and the origin of GMT). To obtain your local time here in the United States, you need to subtract a certain number of hours from UTC depending on how many time zones you are away from Greenwich (England). Table 11 shows the standard difference from UTC time to local time. The switch to daylight saving time does not affect UTC. It refers to time on the zero or Greenwich meridian, which is not adjusted to reflect changes either to or from Daylight Saving Time. However, you need to know what happens during daylight saving time in the United States. In short, the local time is advanced one hour during daylight saving time. As an example, the Eastern Time zone difference from UTC is a -4 hours during daylight saving time rather than -5 hours as it is during standard time. Weather observations around the world (including radar observations) are always taken with respect to a standard time. By convention, the world's weather communities use a twenty four hour clock, similar to "military" time based on the 0° longitude meridian, also known as the Greenwich meridian. Prior to 1972, this time was called Greenwich Mean Time (GMT) but is now referred to as Coordinated Universal Time or Universal Time Coordinated (UTC). It is a coordinated time scale, maintained by the Bureau International des Poids et Mesures (BIPM). It is also known a "Z time" or "Zulu Time". To obtain your local time here in the United States, you need to subtract a certain number of hours from UTC depending on how many time zones you are away from Greenwich (England).
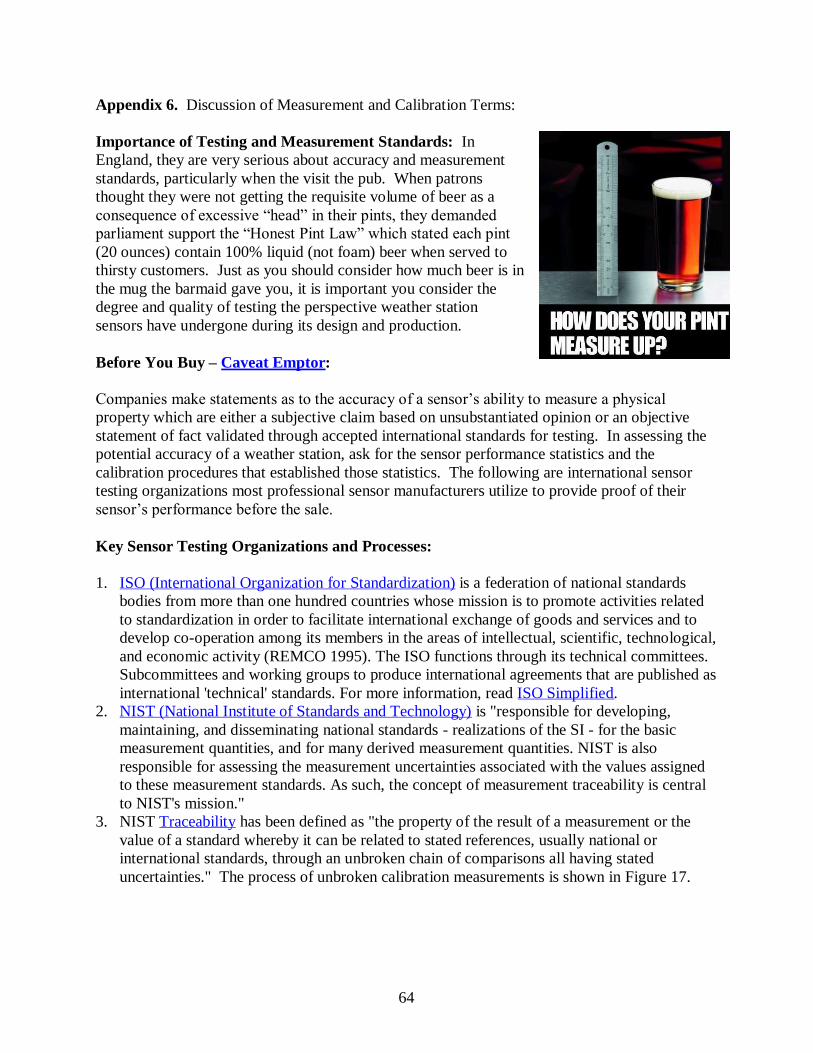
64
Appendix 6. Discussion of Measurement and Calibration Terms: Importance of Testing and Measurement Standards: In England, they are very serious about accuracy and measurement standards, particularly when the visit the pub. When patrons thought they were not getting the requisite volume of beer as a consequence of excessive “head” in their pints, they demanded parliament support the “Honest Pint Law” which stated each pint (20 ounces) contain 100% liquid (not foam) beer when served to thirsty customers. Just as you should consider how much beer is in the mug the barmaid gave you, it is important you consider the degree and quality of testing the perspective weather station sensors have undergone during its design and production. Before You Buy – Caveat Emptor: Companies make statements as to the accuracy of a sensor’s ability to measure a physical property which are either a subjective claim based on unsubstantiated opinion or an objective statement of fact validated through accepted international standards for testing. In assessing the potential accuracy of a weather station, ask for the sensor performance statistics and the calibration procedures that established those statistics. The following are international sensor testing organizations most professional sensor manufacturers utilize to provide proof of their sensor’s performance before the sale.
Key Sensor Testing Organizations and Processes: 1. ISO (International Organization for Standardization) is a federation of national standards
bodies from more than one hundred countries whose mission is to promote activities related to standardization in order to facilitate international exchange of goods and services and to develop co-operation among its members in the areas of intellectual, scientific, technological, and economic activity (REMCO 1995). The ISO functions through its technical committees. Subcommittees and working groups to produce international agreements that are published as international 'technical' standards. For more information, read ISO Simplified.
2. NIST (National Institute of Standards and Technology) is "responsible for developing, maintaining, and disseminating national standards - realizations of the SI - for the basic measurement quantities, and for many derived measurement quantities. NIST is also responsible for assessing the measurement uncertainties associated with the values assigned to these measurement standards. As such, the concept of measurement traceability is central to NIST's mission."
3. NIST Traceability has been defined as "the property of the result of a measurement or the value of a standard whereby it can be related to stated references, usually national or international standards, through an unbroken chain of comparisons all having stated uncertainties." The process of unbroken calibration measurements is shown in Figure 17.

65
Figure 17. NIST Traceability Process Diagram
Links Organizations Supporting Measurement and Calibration Standards: Davis Instruments Statement on NIST Traceability: http://www.davisnet.com/support/weather/cert.asp ISO Standards Defined: http://www.ivstandards.com/tech/articles/quality/iso-simple.asp NIST Traceability Reference Materials http://ts.nist.gov/traceability/suppl_matls_for_nist_policy_rev.htm NIST Guidelines for Expressing Uncertainty: http://physics.nist.gov/Pubs/guidelines/contents.html Defines of Measurement, Testing, and Statistical Terms:
Accuracy verses Precision (repeatability): See examples in Figure 18.
1. “Accurate” means truthful or how correct a set of measurements are as a group.
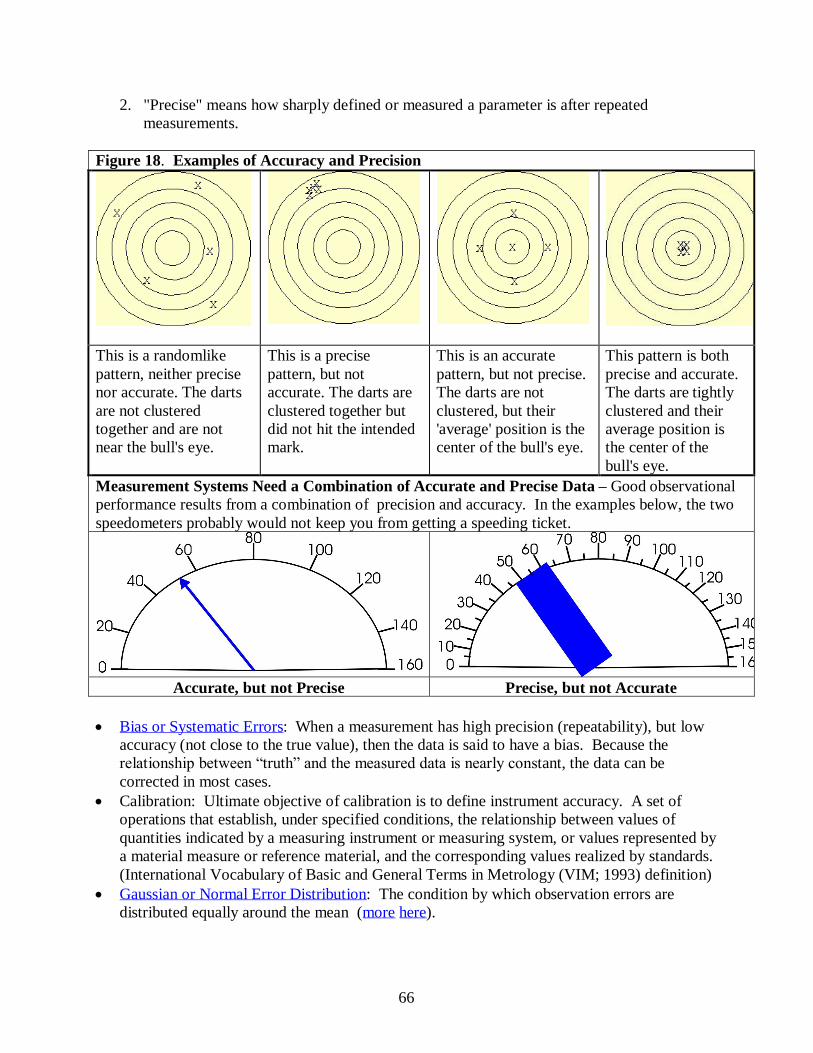
66
2. "Precise" means how sharply defined or measured a parameter is after repeated measurements.
Figure 18. Examples of Accuracy and Precision
This is a randomlike pattern, neither precise nor accurate. The darts are not clustered together and are not near the bull's eye.
This is a precise pattern, but not accurate. The darts are clustered together but did not hit the intended mark.
This is an accurate pattern, but not precise. The darts are not clustered, but their 'average' position is the center of the bull's eye.
This pattern is both precise and accurate. The darts are tightly clustered and their average position is the center of the bull's eye.
Measurement Systems Need a Combination of Accurate and Precise Data – Good observational performance results from a combination of precision and accuracy. In the examples below, the two speedometers probably would not keep you from getting a speeding ticket.
Accurate, but not Precise Precise, but not Accurate
Bias or Systematic Errors: When a measurement has high precision (repeatability), but low
accuracy (not close to the true value), then the data is said to have a bias. Because the relationship between “truth” and the measured data is nearly constant, the data can be corrected in most cases.
Calibration: Ultimate objective of calibration is to define instrument accuracy. A set of operations that establish, under specified conditions, the relationship between values of quantities indicated by a measuring instrument or measuring system, or values represented by a material measure or reference material, and the corresponding values realized by standards. (International Vocabulary of Basic and General Terms in Metrology (VIM; 1993) definition)
Gaussian or Normal Error Distribution: The condition by which observation errors are distributed equally around the mean (more here).

67
Hysteresis: When the sensor output for a given input depends upon whether the input was increasing or decreasing. For example, relative humidity measurements may have less error when the temperature is cooling than when the temperature is warming.
Instrument Performance: Most sensors have sensitivity to other unwanted signals (second inputs) that can be rarely removed (e.g. solar radiation is a secondary signal when measuring ambient temperature). Instrument performance is measured under the following conditions: 1. Static: How the sensor performs under static or unchanging conditions 2. Dynamic: How the sensor performs under dynamic or changing conditions
Lag Time: The time between the initial exposure of a sensor to the environment it is measuring and when the sensor achieves measurement stability.
Linearity: The difference between “truth” and an observation over a range of conditions (temperature, humidity, winds). If the accuracy of a set of observations gathered over a range of temperatures has similar errors, then the observation’s error is said to have “linearity”.
Mean: An average of “n” numbers computed by adding some function of the numbers and dividing by some function of “n”
Measurand: Variable to be measured (e.g. air temperature, air pressure, humidity, wind speed). We never know the measurand properties exactly because all instruments extract some energy from the measurand and add some noise to the output signal (e.g. to observe something changes it, at least by a small amount).
Quality Assurance (QA): The method of dealing with uncertainty in our measurements. To maintain the highest possible data quality, QA program must: 1. Have lab calibrations – Look closely at the weather station manufacturer’s claims for
these 2. Have field inter-comparisons – This is something you can do with comparisons with
backup sensors and against nearby weather stations 3. Have data monitoring – MADIS QCMS helps with this 4. Detect and flag faulty data immediately – MADIS QCMS daily QC reports 5. Have documentation - Keep good long term statistics on your station’s performance by
benchmarking your station against nearby ASOS. 6. Be open to review – discuss system performance on Philip Gladstone’s QC listserver
Random error: Non-systematic error that can only be described statistically and cannot be corrected.
Range: Measurand interval over which a sensor is designed to respond. Resolution: Resolution is similar to measurement precision. There are several types of
resolution: 1. Spatial: The number of observations made over a given distance, area, or volume.
Weather forecast spatial resolution improves (distance between forecast points is decreased) every year requiring additional verification observations from satellites, radar, and weather station data to assess forecast performance.
2. Temporal: The number of observations made in a give time period (frequency). It was once appropriate that radiosonde balloon data were collected twice per day, but hourly weather model updates demand much higher frequency observations to initialize the models. In response to the need for high frequency observations has justified hourly satellite soundings, aircraft observations, radar wind profiles, and GPS integrated
68
precipitable water (IPW) observations as well as sub-hourly surface observations such as those provided by CWOP.
3. Radiometeric: The number of significant digits used in reporting a measurement. Weather radar observations moved from 4 bits (2**4 or 16 data bins) to 8 bits (2**8 or 256 data bins) allowing for many more precipitation amount increments. For CWOP, the APRS message format defines, and sometimes limits in the case of temperature, the radiometric resolution we can disseminate.
Significant Digits: Rules for applying significant digits: 1. Nonzero digits are significant 2. Zeros between nonzero digits are significant 3. Zeros to the left of the first nonzero digit in a number are not significant 4. Zeros to the right of the decimal point are significant 5. Some ambiguity when a number ends in zeros that are not to the right of the decimal
point Stability and Drift: The behavior of repeated measurements over long time increments
(months and years). If the measurements have a similar relationship to “truth” over time, then the sensor and observations are said to be “stable”. Climatologists prefer stability of measurements so long-term trends can be identified. “Drift” is the opposite of stability, in that long-term measurements relative to truth changes or drifts making conclusions about the natural signal in the data difficult to assess. It is likely that your weather station’s sensor performance will drift over time requiring recalibration or replacement to achieve optimal accuracy.
Standard Deviation (sigma, σ): A measure of the range of values in a set of numbers. Standard deviation is a statistic used as a measure of the dispersion or variation in a distribution, equal to the square root of the arithmetic mean of the squares of the deviations from the arithmetic mean. (more here)
Variance: the second moment around the mean; the expected value of the square of the deviations of a random variable from its mean value.
Calibration of Installed Sensors: Monitoring and calibration techniques are provided in section 3 for individual sensors.

69
Appendix 7. NWS Skywarn Program Since Skywarn’s beginning in the 1970s, NWS Warning Coordination Meteorologists (WCMs) have trained over 250,000 Skywarn observers all over the United States making Skywarn the largest single weather network in the world. The deployment of the WSR-88D NexRad weather radar in the early 1990’s was a significant improvement to the National Weather Service’s ability to monitor developing severe weather; however, the primary means of verifying warnings remains trained Skywarn observers who use their eyes, ears, and sometimes a ruler to provide timely information about the ever changing weather. Skywarn spotters provide critical observations for the following severe weather events:
Hail, especially for diameters ¾ of an inch (roughly the size of a dime) or greater Wind damage (downed trees and limbs) and gusts of 58 mph (50 knots) or higher Hail damage (dents in cars, broken windows, etc.) Wall Clouds, Funnel Clouds, and Tornados Flash Flooding of Creeks and Rivers (above bankfull) Heavy Snow (typically 4 inches or more, 2 inches in the deep south)*** Significant Icing/Freezing Rain Events (1/4 inch or more)
Skywarn and CWOP tap into the same motivated weather and ham radio enthusiast communities. With CWOP’s quantitative data and Skywarn’s qualitative information, these programs provide complementary information about the atmosphere. Therefore, we encourage all CWOP members to consider becoming a Skywarn as well as a CWOP weather observer as you will be an extremely valuable asset to the National Weather Service in this combined role. Likewise, we encourage WCMs to solicit CWOP membership registration at Skywarn classes to build stronger, long term, relationships with highly motivated weather enthusiasts in their communities. Here’s the CWOP sign-up page: http://www.findu.com/citizenweather/signup.html By using Skywarn classes as a recruiting forum for CWOP, Weather Forecast Offices will increase the density of high frequency surface observations throughout their County Warning Area (CWA) supporting a large cross-section of NWS services. NWS offers the following Skywarn Spotter training courses in your local community annually: Basic Storm Spotter Training Advanced Storm Spotter Training Winter Precipitation Spotter Training Check your local National Weather Service Forecast Office to see when and where the next Skywarn class is being taught. They are interesting and free!

70
Learn more about Skywarn training by visiting the following web pages: NWS Southern Region – WFO Norman Spotter Page: http://www.srh.noaa.gov/oun/stormspotting/ NWS Basic Spotter Training Brochure: http://www.nws.noaa.gov/om/brochures/basicspot.pdf NWS Advanced Spotter Training Brochure: http://www.nws.noaa.gov/om/brochures/adv_spotters.pdf The Skywarn program is best known for its contributions in reporting tornados, severe thunderstorms, and hail. The “cold” part of the Skywarn Program contributes thousands of snow measurements every year. While technology has made amazing progress since the start of Skywarn, NWS still relies on mostly Skywarn volunteers to accurately report snowfall and snow depth measurements, as ASOS stations cannot yet measure snow depth automatically. In an effort to gather quality snow measurements, NWS WFOs give winter Skywarn classes in the northern portions of the U.S., please check in with your local office to see when the next course will be conducted. Follow these links to learn more about snow measurements: http://www.nws.noaa.gov/om/coop/Publications/snowguid.htm http://ccc.atmos.colostate.edu/~hail/howto/help/snow.htm http://www-wwrc.uwyo.edu/wrds/wsc/reference/snowmeas.html

71
Appendix 8. Useful Weather Station Related Web Pages Accuracy and Testing Background Pages Airport Weather Reports Automatic Position Reporting System (APRS) Protocol Citizen Weather Observer Program (CWOP)/APRSWXNET Pages Computer Security Determining Station Position, Elevation, and Magnetic Declination Mesowest Pages Meteorology History Meteorological Time NOAA Forecast Systems Lab (FSL) Meteorological Assimilation Data Ingest System
(MADIS) Pages Pressure Measurement Rainfall Measurement Skywarn Program Snow Measurement Temperature and Humidity Measurement Quality Control and Monitoring System (QCMS) Data Access Weather Station Related Web Pages Wind Measurement Accuracy and Testing Background Pages International Organization for Standardization (ISO)
http://www.iso.org/iso/en/ISOOnline.frontpage National Institute of Standards and Technology (NIST)
http://www.nist.gov/ Davis Instruments Statement on NIST Traceability
http://www.davisnet.com/support/weather/cert.asp ISO Standards Defined
http://www.ivstandards.com/tech/articles/quality/iso-simple.asp NIST Traceability Reference Materials
http://ts.nist.gov/traceability/suppl_matls_for_nist_policy_rev.htm NIST Guidelines for Expressing Uncertainty
http://physics.nist.gov/Pubs/guidelines/contents.html Airport Weather Reports Airport METAR Observations On-Line
http://weather.noaa.gov/cgi-bin/mgetmetar.pl Airport METAR Observations using a Telephone: Example KBWI
http://www.airnav.com/airport/KBWI Find your airport’s 4-letter (ICAO) Airport Identifiers
http://www.airrouting.com/content/airportloc.html
72
Automatic Position Reporting System (APRS) Protocol The Founder of APRS, Bob Bruninga, WB4APR, Page
http://web.usna.navy.mil/~bruninga/index.html Full APRS Protocol specification can be found at the following link (pdf file)
ftp://ftp.tapr.org/aprssig/aprsspec/spec/aprs101/APRS101.pdf Example of a formatted APRS weather message from Philip Gladstone’s page
http://pond1.gladstonefamily.net/aprswxnet.html Citizen Weather Observer Program (CWOP)/APRSWXNET Pages CWOP Sign-up Page
http://www.findu.com/citizenweather/signup.html Russ Chadwick’s CWOP Main Page
http://www.cwop.net CWOP/APRSWXNET News and Overall System Status
http://wxqa.com/news.html Dave Helms’ CWOP Info Page
http://www.cwop.info Steve Dimse’ FINDU Page
http://www.findu.com/citizenweather/ FINDU News and Status Page
http://www.findu.com/new.html FINDU Weather Station Plot Page Example (wind, temperature, dew point, pressure, and
precipitation time series and wind rose plots) http://www.findu.com/cgi-bin/wxpage.cgi?call=AB9FX!Chicago&last=240
Dick Stanich's APRS "CW" traffic web page http://206.123.154.99/wxall.html
WX4NHC/National Hurricane Center Page http://www.fiu.edu/orgs/w4ehw/CWOP-Main.html
Computer Security Information on preventing computer attacks
http://mywebpages.comcast.net/dshelms/web_security.html Information on preventing identity theft
http://mywebpages.comcast.net/dshelms/cwop_phishing.htm Determining Station Position, Elevation, and Magnetic Declination Use your U.S. Postal Mailing Address to Determine a Latitude/Longitude
http://www.geocode.com/modules.php?name=TestDrive_Eagle Use a Latitude and Longitude to determine elevation on Topozone web page
http://www.topozone.com/viewmaps.asp Using a compass to find magnetic north
http://www.suuntousa.com/products_compuse.htm National Geophysical Data Center (NGDC) magnetic declination calculation page
http://www.ngdc.noaa.gov/seg/geomag/jsp/Declination.jsp. Map of CONUS (lower 48 states of the U.S.) Magnetic Declination
73
http://www.spacecom.com/customer_tools/html/body_mag_dec_map.htm Mesowest Pages Mesowest Home Page
http://www.met.utah.edu/mesowest/ Mesonets Status Page
http://www.met.utah.edu/cgi-bin/database/meso_status.cgi CWOP/APRSWXNET observations received at Mesowest
http://www.met.utah.edu/mesowest/monitor/APRSWXNET.gif Example of CWOP Station Depiction on Mesowest
http://www.met.utah.edu/cgi-bin/droman/meso_base.cgi?stn=C1793 Example of a Wind Hodograph
http://www.met.utah.edu/cgi-bin/droman/hodo.cgi?stn=AP878
Meteorology History Origin of Meteorology – Meteorologica, Written by Aristotle in 350 BC
http://classics.mit.edu/Aristotle/meteorology.html Meteorological Time National Weather Service Radar Product Description Page
http://www.erh.noaa.gov/radar/radinfo/radinfo.html#utc NIST Time “History” Page
http://physics.nist.gov/GenInt/Time/time.html NOAA Forecast Systems Lab (FSL) Meteorological Assimilation Data Ingest System (MADIS) Pages MADIS Overview
http://www-sdd.fsl.noaa.gov/MADIS_Overview/MADIS_Overview.html MADIS Data Access Java Page
http://www-sdd.fsl.noaa.gov/MADIS/ Pressure Measurement USA Today Article on Understanding Pressure Measurement
http://www.usatoday.com/weather/wbarocx.htm Barometer Fundamentals from the University of Toronto
http://www.upscale.utoronto.ca/GeneralInterest/Harrison/Barometer/Barometer.html Pressure as a function of height above ground level from U.S. Standard Atmosphere Tables
http://www.tpub.com/content/aerographer/14269/css/14269_75.htm Rainfall Measurement How to measure rain using a manual rain gauge
http://www.rain-check.org/help/Raincheck_Rain_Instructions.htm http://meted.ucar.edu/qpf/rgauge/index1.htm http://ccc.atmos.colostate.edu/~hail/howto/help/rain.htm
How to measure liquid amount of snow using a manual rain gauge http://www.rain-check.org/help/Raincheck_Snow_Instructions.htm
74
Skywarn Program NWS Southern Region, WFO Norman Spotter Page
http://www.srh.noaa.gov/oun/stormspotting/ NWS Basic Spotter Training Brochure
http://www.nws.noaa.gov/om/brochures/basicspot.pdf NWS Advanced Spotter Training Brochure
http://www.nws.noaa.gov/om/brochures/adv_spotters.pdf Snow Measurement NWS COOP Snow Measurement Page
http://www.nws.noaa.gov/om/coop/Publications/snowguid.htm Colorado State University COCoRah Page
http://ccc.atmos.colostate.edu/~hail/howto/help/snow.htm University of Wyoming Snow Measurement Page
http://www-wwrc.uwyo.edu/wrds/wsc/reference/snowmeas.html Temperature and Humidity Measurement Learn how to use a sling psychrometer
http://www.globe.uah.edu/documents/psychrometer.ppt USA Today Articles on Temperature and Humidity
* Understanding Temperature Measurements http://www.usatoday.com/weather/whattemp.htm
* Understanding Relative Humidity Measurements http://www.usatoday.com/weather/whumdef.htm
* Why are temperatures taken in the shade? http://www.usatoday.com/weather/resources/askjack/2004-07-19-official-temperatures_x.htm
Quality Control and Monitoring System (QCMS) Data Access FSL MADIS Quality Control and Monitoring System (QCMS)
* QCMS Description http://www-sdd.fsl.noaa.gov/MADIS/madis_sfc_qc.html
* QCMS Table Format Description http://www-sdd.fsl.noaa.gov/MSAS/qcms_smry_descrip.html
* Hourly Quality Control Statistics http://www-sdd.fsl.noaa.gov/MSAS/qcms_data/qc12/qchour.txt
* Daily Quality Control Statistics http://www-sdd.fsl.noaa.gov/MSAS/qcms_data/qc12/qcday.txt
* Weekly Quality Control Statistics http://www-sdd.fsl.noaa.gov/MSAS/qcms_data/qc12/qcweek.txt
* Monthly Quality Control Statistics http://www-sdd.fsl.noaa.gov/MSAS/qcms_data/qc12/qcmonth.txt
Philip Gladstone Quality Control Pages * Main QC Page
http://pond1.gladstonefamily.net/weather-qc
75
* Register for Philip’s QC Listserver and Email Service http://pond1.gladstonefamily.net/mailman/listinfo/wxqc
* QC Listserver Archive: http://pond1.gladstonefamily.net/pipermail/wxqc/
* Time series of your station’s weather verses the analysis http://pond1.gladstonefamily.net/cgi-bin/wxqchart.pl?site=XXXXX where XXXXX is your station ID (e.g., C0001 or AR001 or AP001)
* Table of stations with pressure mean errors greater than 3 mb http://pond1.gladstonefamily.net/cgi-bin/wxmiscal.pl
* Table of stations which appear to be incorrect altitude and/or position http://pond1.gladstonefamily.net/cgi-bin/wxalt.pl Mesowest Station Quality Control Time-Series
http://www.met.utah.edu/cgi-bin/droman/regress_database.cgi?stn=XXXXX where XXXXX is your station ID (e.g., C0001 or AR001 or AP001)
Mesowest Quality Control Explained (different than QCMS) http://www.met.utah.edu/droman/help/qc.html
Weather Station Related Web Pages ProWeather Siting Guidelines
http://www.weatherstations.co.uk/gooddata.htm US Forest Service RAWS Weather Station Standards
http://www.fs.fed.us/raws/standards/NFDRS_rev0402.pdf Comparison between 20 foot RAWS and 33 foot ASOS Anemometer Height Above Ground:
http://www.fs.fed.us/raws/photos/windstudy/windstudy.shtml University of North Carolina at Asheville: ATMS 320 - Meteorological Instruments (Fall
2004) Lecture Series - Prof. Douglas K. Miller http://www.unca.edu/~dmiller/atms320_2004.html
River Forecast Center Precipitation Totals http://www.hpc.ncep.noaa.gov/cgi-bin/npvu.data.cgi
Wind Measurement Discussion of the Causes of Wind:
http://www.physicalgeography.net/fundamentals/7n.html Background Material for Winds, Dr James B. Calvert
http://www.du.edu/~jcalvert/weather/wind.htm WW2010 – Boundary Level Winds
http://ww2010.atmos.uiuc.edu/(Gl)/guides/mtr/fw/bndy.rxml

76
Appendix 9. Latitude/Longitude Formats and Conversions Formats of Latitude and Longitude: Decimal: Latitude and longitude represented by ten-thousandths (XX.XXXX) thousandths (XX.XXX), hundredths, (XX.XX), or tenths (XX.X) or a degree. Hours (H), Minutes (M), Seconds (S): A degree is divided between 60 minutes, and a minute is divided into 60 seconds, the format being HH:MM:SS. One degree is equal to 3,600 seconds. LORAN: LORAN format is a cross between decimal and hours, minutes, and seconds. CWOP uses LORAN format position because decimal minutes is more accurate than a seconds format (100 verses 60 possible increments, respectively). The format of LORAN position is Hours, Minutes, and decimal Minutes, or HH:MM.MM. Example: Latitude: 30.1781N or 30.1781 Longitude: 120.8734W or -120.8734 Distance and Latitude/Longitude: Hours:Minutes:Seconds: 1 degree latitude = 60 statue miles or 96 km 1 degree latitude = 316,800 feet (5,280 feet in a mile) or 96,000 meters 1 minute of latitude = 5,280 feet or 1 statue mile or 1,600 meters or 1.6 km 1 second of latitude = 88 feet or 26.7 meters Decimal: 1 degree latitude = 60 statue miles or 96 km 0.1 degree latitude = 6.0 statue miles or 9.6 km 0.01 degree latitude = 0.60 statue mile or 3,168 feet or 0.96 km 0.001 degree latitude = 0.060 statue mile or 317 feet or 0.096 km or 96 meter 0.0001 degree latitude = 0.0060 statue mile or 31.7 feet or 0.0096 km or 9.6 meters LORAN: 1 degree latitude = 60 statue miles or 96 km 1 degree latitude = 316,800 feet (5,280 feet in a mile) or 96,000 meters 1 minute of latitude = 5,280 feet or 1 statue mile or 1,600 meters or 1.6 km 0.1 minute of latitude = 528 feet or 160 meters 0.01 minute of latitude = 52.8 feet or 16.0 meters Note: The conversion between latitude and distance is the same everywhere in the world, but the conversion between longitude and distance depends on latitude.
77
Thus to meet the guideline of defining your weather station’s position to within 100 feet or 30 meters, you must use the 1’s seconds, 0.0001 decimal, or 0.01 minutes place in your latitude/longitude to achieve this goal. Different software will have you describe your position using different formats, typically HH:MM:SS, sometimes decimal, and rarely LORAN format (WeatherDisplay) position. All these application convert to LORAN format to communicate with CWOP using the APRS protocol. Conversion between HH:MM:SS, LORAN, and decimal format position Decimal to HH:MM:MM (LORAN) Ex. 30.1261 = 30:07.57
Taking the decimal part of the position, .XXXX, o .1261 * 60 minutes / 1 degree = 07.566 minutes rounded to 07.57 minutes
Decimal to HH:MM:SS: Ex. 30.1261 = 30:07:34
Taking the decimal part of the position, .XXXX, o .1261 * 60 minutes / 1 degree = 07.566 minutes
Taking the remainder calculate the seconds o .566 * 60 seconds / 1 minute = 33.96 seconds rounded to 34 seconds
HH:MM:SS to LORAN: Ex. 120:52:04 = 120:52.07
Taking the seconds position of the HHH:MM:SS, 04 o 04 seconds * 1 minute / 60 seconds = 0.07 minutes
LORAN to Decimal Ex. 120:52.07 = 120.8678
Taking the minutes position of the HHH:MM.NN, 52.07 o 52.07 * 1 degree / 60 minutes = .8678
Note: Topozone.com maps convert coordinate formats between decimal (DD.DDD), Hours, Minutes, Seconds (H/M/S), and LORAN (DD MM.MM) formats. If you have one format latitude/longitude, then topozone.com can perform conversions into the other formats.

78
Table 11. Standard Time to UTC Conversion
Standard Time Daylight Saving
UTC Guam HI AK PST MST CST EST AST PDT MDT CDT EDT
Diff +10 -10 -9 -8 -7 -6 -5 -4 -7 -6 -5 -4
00 10a 2p* 3p* 4p* 5p* 6p* 7p* 8p* 5p* 6p* 7p* 8p*
01 11a 3p* 4p* 5p* 6p* 7P* 8p* 9p* 6p* 7p* 8p* 9p*
02 12N 4p* 5p* 6p* 7p* 8p* 9p* 10p* 7p* 8p* 9p* 10p*
03 1p 5p* 6p* 7p* 8p* 9p* 10p* 11p* 8p* 9p* 10* 11p*
04 2p 6p* 7p* 8p* 9p* 10p* 11p* 12M 9p* 10p* 11p* 12M
05 3p 7p* 8p* 9p* 10p* 11p* 12M 1a 10p* 11p* 12M 1a
06 4p 8p* 9p* 10p* 11p* 12M 1a 2a 11p* 12M 1a 2a
07 5p 9p* 10p* 11p* 12M 1a 2a 3a 12M 1a 2a 3a
08 6p 10p* 11p* 12M 1a 2a 3a 4a 1a 2a 3a 4a
09 7p 11p* 12M 1a 2a 3a 4a 5a 2a 3a 4a 5a
10 8p 12M 1a 2a 3a 4a 5a 6a 3a 4a 5a 6a
11 9p 1a 2a 3a 4a 5a 6a 7a 4a 5a 6a 7a
12 10p 2a 3a 4a 5a 6a 7a 8a 5a 6a 7a 8a
13 11p 3a 4a 5a 6a 7a 8a 9a 6a 7a 8a 9a
14 12M% 4a 5a 6a 7a 8a 9a 10a 7a 8a 9a 10
15 1a% 5a 6a 7a 8a 9a 10a 11a 8a 9a 10a 11a
16 2a% 6a 7a 8a 9a 10a 11a 12N 9a 10a 11a 12N
17 3a% 7a 8a 9a 10a 11a 12N 1p 10a 11a 12N 1p
18 4a% 8a 9a 10a 11a 12N 1p 2p 11a 12N 1p 2p
19 5a% 9a 10a 11a 12N 1p 2p 3p 12N 1p 2p 3p
20 6a% 10a 11a 12N 1p 2p 3p 4p 1p 2p 3p 4p
21 7a% 11a 12N 1p 2p 3p 4p 5p 2p 3p 4p 5p
22 8a% 12N 1p 2p 3p 4p 5p 6p 3p 4p 5p 6p
23 9a% 1p 2p 3p 4p 5p 6p 7p
4p 5p 6p 7p AST - Atlantic, AK - Alaska time, HI - Hawaii time, *The previous day, %The next day

79
Table 12. Fahrenheit/Celsius Conversion Table °F °C °F °C °F °C °F °C -40 -40.0 2 -16.7 44 6.7 86 30.0 -39 -39.4 3 -16.1 45 7.2 87 30.6 -38 -38.9 4 -15.6 46 7.8 88 31.1 -37 -38.3 5 -15.0 47 8.3 89 31.7 -36 -37.8 6 -14.4 48 8.9 90 32.2 -35 -37.2 7 -13.9 49 9.4 91 32.8 -34 -36.7 8 -13.3 50 10.0 92 33.3 -33 -36.1 9 -12.8 51 10.6 93 33.9 -32 -35.6 10 -12.2 52 11.1 94 34.4 -31 -35.0 11 -11.7 53 11.7 95 35.0 -30 -34.4 12 -11.1 54 12.2 96 35.6 -29 -33.9 13 -10.6 55 12.8 97 36.1 -28 -33.3 14 -10.0 56 13.3 98 36.7 -27 -32.8 15 -9.4 57 13.9 99 37.2 -26 -32.2 16 -8.9 58 14.4 100 37.8 -25 -31.7 17 -8.3 59 15.0 101 38.3 -24 -31.1 18 -7.8 60 15.6 102 38.9 -23 -30.6 19 -7.2 61 16.1 103 39.4 -22 -30.0 20 -6.7 62 16.7 104 40.0 -21 -29.4 21 -6.1 63 17.2 105 40.6 -20 -28.9 22 -5.6 64 17.8 106 41.1 -19 -28.3 23 -5.0 65 18.3 107 41.7 -18 -27.8 24 -4.4 66 18.9 108 42.2 -17 -27.2 25 -3.9 67 19.4 109 42.8 -16 -26.7 26 -3.3 68 20.0 110 43.3 -15 -26.1 27 -2.8 69 20.6 111 43.9 -14 -25.6 28 -2.2 70 21.1 112 44.4 -13 -25.0 29 -1.7 71 21.7 113 45.0 -12 -24.4 30 -1.1 72 22.2 114 45.6 -11 -23.9 31 -0.6 73 22.8 115 46.1 -10 -23.3 32 0.0 74 23.3 116 46.7 -9 -22.8 33 0.6 75 23.9 117 47.2 -8 -22.2 34 1.1 76 24.4 118 47.8 -7 -21.7 35 1.7 77 25.0 119 48.3 -6 -21.1 36 2.2 78 25.6 120 48.9 -5 -20.6 37 2.8 79 26.1 121 49.4 -4 -20.0 38 3.3 80 26.7 122 50.0 -3 -19.4 39 3.9 81 27.2 123 50.6 -2 -18.9 40 4.4 82 27.8 124 51.1 -1 -18.3 41 5.0 83 28.3 125 51.7 0 -17.8 42 5.6 84 28.9 126 52.2 1 -17.2 43 6.1 85 29.4 127 52.8
Temperature Conversion: 1 degree C = 1.8 degree F Fresh Water Freezing = 0 C, 32 F Fresh Water Boiling = 100 C, 212 F (sea level)

80
Table 13. Millibars (Mb) to Inches (In Hg) Pressure Conversion Table Mb In Hg Mb In Hg Mb In Hg Mb In Hg Mb In Hg
980.0 28.94 994.7 29.37 1009.3 29.81 1024.0 30.24 1038.7 30.67 980.3 28.95 995.0 29.38 1009.7 29.82 1024.3 30.25 1039.0 30.68 980.7 28.96 995.3 29.39 1010.0 29.83 1024.7 30.26 1039.3 30.69 981.0 28.97 995.7 29.40 1010.3 29.84 1025.0 30.27 1039.7 30.70 981.3 28.98 996.0 29.41 1010.7 29.84 1025.3 30.28 1040.0 30.71 981.7 28.99 996.3 29.42 1011.0 29.85 1025.7 30.29 1040.3 30.72 982.0 29.00 996.7 29.43 1011.3 29.86 1026.0 30.30 1040.7 30.73 982.3 29.01 997.0 29.44 1011.7 29.87 1026.3 30.31 1041.0 30.74 982.7 29.02 997.3 29.45 1012.0 29.88 1026.7 30.32 1041.3 30.75 983.0 29.03 997.7 29.46 1012.3 29.89 1027.0 30.33 1041.7 30.76 983.3 29.04 998.0 29.47 1012.7 29.90 1027.3 30.34 1042.0 30.77 983.7 29.05 998.3 29.48 1013.0 29.91 1027.7 30.35 1042.3 30.78 984.0 29.06 998.7 29.49 1013.3 29.92 1028.0 30.36 1042.7 30.79 984.3 29.07 999.0 29.50 1013.7 29.93 1028.3 30.37 1043.0 30.80 984.7 29.08 999.3 29.51 1014.0 29.94 1028.7 30.38 1043.3 30.81 985.0 29.09 999.7 29.52 1014.3 29.95 1029.0 30.39 1043.7 30.82 985.3 29.10 1000.0 29.53 1014.7 29.96 1029.3 30.40 1044.0 30.83 985.7 29.11 1000.3 29.54 1015.0 29.97 1029.7 30.41 1044.3 30.84 986.0 29.12 1000.7 29.55 1015.3 29.98 1030.0 30.42 1044.7 30.85 986.3 29.13 1001.0 29.56 1015.7 29.99 1030.3 30.43 1045.0 30.86 986.7 29.14 1001.3 29.57 1016.0 30.00 1030.7 30.44 1045.3 30.87 987.0 29.15 1001.7 29.58 1016.3 30.01 1031.0 30.45 1045.7 30.88 987.3 29.16 1002.0 29.59 1016.7 30.02 1031.3 30.46 1046.0 30.89 987.7 29.17 1002.3 29.60 1017.0 30.03 1031.7 30.46 1046.3 30.90 988.0 29.18 1002.7 29.61 1017.3 30.04 1032.0 30.47 1046.7 30.91 988.3 29.19 1003.0 29.62 1017.7 30.05 1032.3 30.48 1047.0 30.92 988.7 29.20 1003.3 29.63 1018.0 30.06 1032.7 30.49 1047.3 30.93 989.0 29.21 1003.7 29.64 1018.3 30.07 1033.0 30.50 1047.7 30.94 989.3 29.21 1004.0 29.65 1018.7 30.08 1033.3 30.51 1048.0 30.95 989.7 29.22 1004.3 29.66 1019.0 30.09 1033.7 30.52 1048.3 30.96 990.0 29.23 1004.7 29.67 1019.3 30.10 1034.0 30.53 1048.7 30.97 990.3 29.24 1005.0 29.68 1019.7 30.11 1034.3 30.54 1049.0 30.98 990.7 29.25 1005.3 29.69 1020.0 30.12 1034.7 30.55 1049.3 30.99 991.0 29.26 1005.7 29.70 1020.3 30.13 1035.0 30.56 1049.7 31.00 991.3 29.27 1006.0 29.71 1020.7 30.14 1035.3 30.57 1050.0 31.01 991.7 29.28 1006.3 29.72 1021.0 30.15 1035.7 30.58 1050.3 31.02 992.0 29.29 1006.7 29.73 1021.3 30.16 1036.0 30.59 1050.7 31.03 992.3 29.30 1007.0 29.74 1021.7 30.17 1036.3 30.60 1051.0 31.04 992.7 29.31 1007.3 29.75 1022.0 30.18 1036.7 30.61 1051.3 31.05 993.0 29.32 1007.7 29.76 1022.3 30.19 1037.0 30.62 1051.7 31.06 993.3 29.33 1008.0 29.77 1022.7 30.20 1037.3 30.63 1052.0 31.07 993.7 29.34 1008.3 29.78 1023.0 30.21 1037.7 30.64 1052.3 31.08 994.0 29.35 1008.7 29.79 1023.3 30.22 1038.0 30.65 1052.7 31.09 994.3 29.36 1009.0 29.80 1023.7 30.23 1038.3 30.66 1053.0 31.09
Pressure Conversion: 29.92 In Hg = 1.0 atm = 101.325 kPa = 1013.25 mb
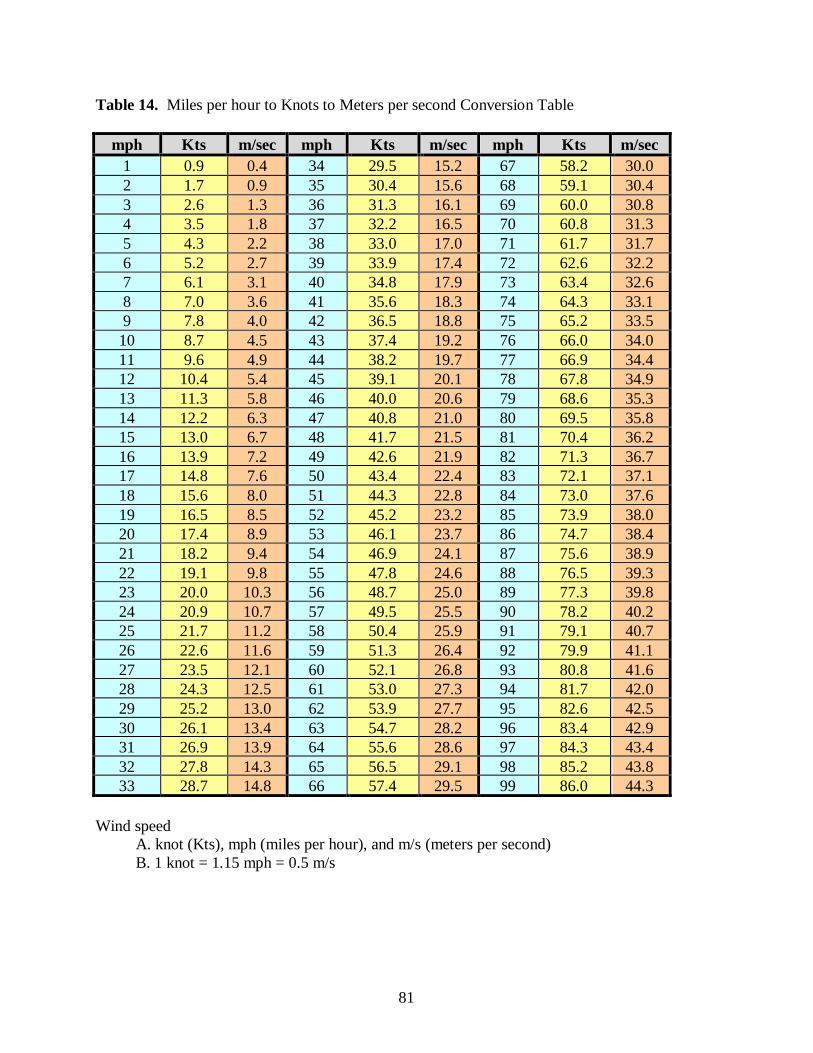
81
Table 14. Miles per hour to Knots to Meters per second Conversion Table
mph Kts m/sec mph Kts m/sec mph Kts m/sec 1 0.9 0.4 34 29.5 15.2 67 58.2 30.0 2 1.7 0.9 35 30.4 15.6 68 59.1 30.4 3 2.6 1.3 36 31.3 16.1 69 60.0 30.8 4 3.5 1.8 37 32.2 16.5 70 60.8 31.3 5 4.3 2.2 38 33.0 17.0 71 61.7 31.7 6 5.2 2.7 39 33.9 17.4 72 62.6 32.2 7 6.1 3.1 40 34.8 17.9 73 63.4 32.6 8 7.0 3.6 41 35.6 18.3 74 64.3 33.1 9 7.8 4.0 42 36.5 18.8 75 65.2 33.5
10 8.7 4.5 43 37.4 19.2 76 66.0 34.0 11 9.6 4.9 44 38.2 19.7 77 66.9 34.4 12 10.4 5.4 45 39.1 20.1 78 67.8 34.9 13 11.3 5.8 46 40.0 20.6 79 68.6 35.3 14 12.2 6.3 47 40.8 21.0 80 69.5 35.8 15 13.0 6.7 48 41.7 21.5 81 70.4 36.2 16 13.9 7.2 49 42.6 21.9 82 71.3 36.7 17 14.8 7.6 50 43.4 22.4 83 72.1 37.1 18 15.6 8.0 51 44.3 22.8 84 73.0 37.6 19 16.5 8.5 52 45.2 23.2 85 73.9 38.0 20 17.4 8.9 53 46.1 23.7 86 74.7 38.4 21 18.2 9.4 54 46.9 24.1 87 75.6 38.9 22 19.1 9.8 55 47.8 24.6 88 76.5 39.3 23 20.0 10.3 56 48.7 25.0 89 77.3 39.8 24 20.9 10.7 57 49.5 25.5 90 78.2 40.2 25 21.7 11.2 58 50.4 25.9 91 79.1 40.7 26 22.6 11.6 59 51.3 26.4 92 79.9 41.1 27 23.5 12.1 60 52.1 26.8 93 80.8 41.6 28 24.3 12.5 61 53.0 27.3 94 81.7 42.0 29 25.2 13.0 62 53.9 27.7 95 82.6 42.5 30 26.1 13.4 63 54.7 28.2 96 83.4 42.9 31 26.9 13.9 64 55.6 28.6 97 84.3 43.4 32 27.8 14.3 65 56.5 29.1 98 85.2 43.8 33 28.7 14.8 66 57.4 29.5 99 86.0 44.3
Wind speed A. knot (Kts), mph (miles per hour), and m/s (meters per second) B. 1 knot = 1.15 mph = 0.5 m/s
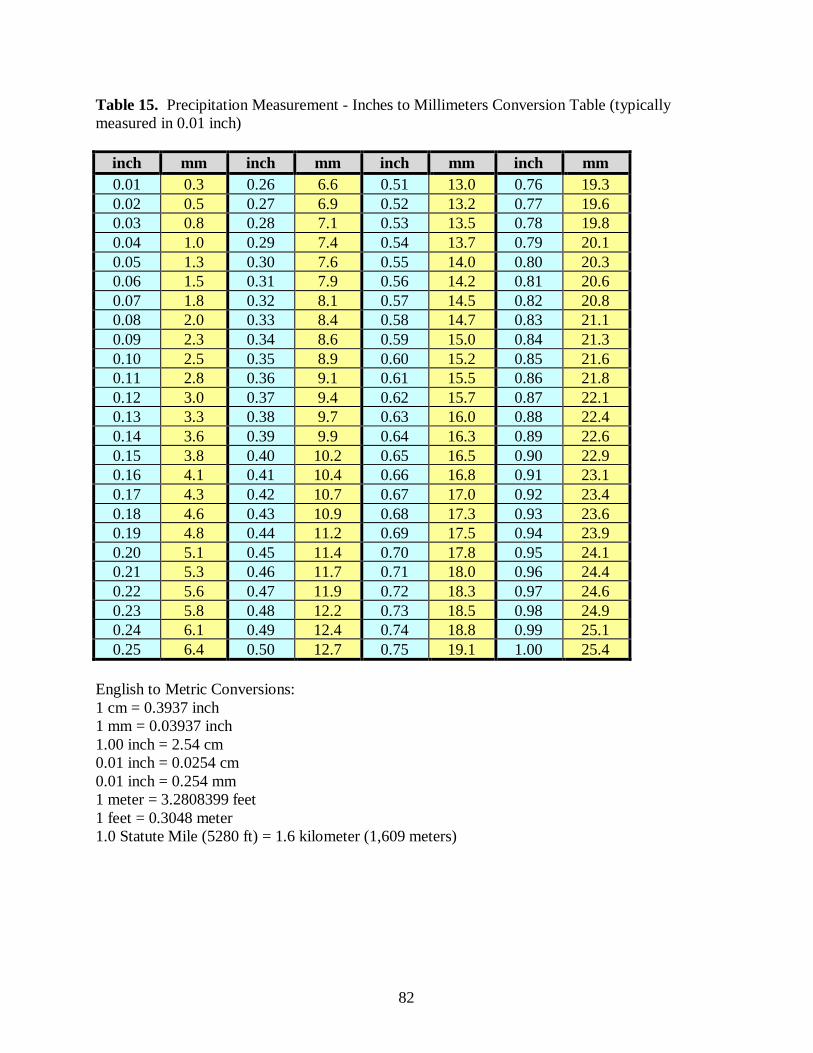
82
Table 15. Precipitation Measurement - Inches to Millimeters Conversion Table (typically measured in 0.01 inch)
inch mm inch mm inch mm inch mm 0.01 0.3 0.26 6.6 0.51 13.0 0.76 19.3 0.02 0.5 0.27 6.9 0.52 13.2 0.77 19.6 0.03 0.8 0.28 7.1 0.53 13.5 0.78 19.8 0.04 1.0 0.29 7.4 0.54 13.7 0.79 20.1 0.05 1.3 0.30 7.6 0.55 14.0 0.80 20.3 0.06 1.5 0.31 7.9 0.56 14.2 0.81 20.6 0.07 1.8 0.32 8.1 0.57 14.5 0.82 20.8 0.08 2.0 0.33 8.4 0.58 14.7 0.83 21.1 0.09 2.3 0.34 8.6 0.59 15.0 0.84 21.3 0.10 2.5 0.35 8.9 0.60 15.2 0.85 21.6 0.11 2.8 0.36 9.1 0.61 15.5 0.86 21.8 0.12 3.0 0.37 9.4 0.62 15.7 0.87 22.1 0.13 3.3 0.38 9.7 0.63 16.0 0.88 22.4 0.14 3.6 0.39 9.9 0.64 16.3 0.89 22.6 0.15 3.8 0.40 10.2 0.65 16.5 0.90 22.9 0.16 4.1 0.41 10.4 0.66 16.8 0.91 23.1 0.17 4.3 0.42 10.7 0.67 17.0 0.92 23.4 0.18 4.6 0.43 10.9 0.68 17.3 0.93 23.6 0.19 4.8 0.44 11.2 0.69 17.5 0.94 23.9 0.20 5.1 0.45 11.4 0.70 17.8 0.95 24.1 0.21 5.3 0.46 11.7 0.71 18.0 0.96 24.4 0.22 5.6 0.47 11.9 0.72 18.3 0.97 24.6 0.23 5.8 0.48 12.2 0.73 18.5 0.98 24.9 0.24 6.1 0.49 12.4 0.74 18.8 0.99 25.1 0.25 6.4 0.50 12.7 0.75 19.1 1.00 25.4
English to Metric Conversions: 1 cm = 0.3937 inch 1 mm = 0.03937 inch 1.00 inch = 2.54 cm 0.01 inch = 0.0254 cm 0.01 inch = 0.254 mm 1 meter = 3.2808399 feet 1 feet = 0.3048 meter 1.0 Statute Mile (5280 ft) = 1.6 kilometer (1,609 meters)

83
Table 16. Beaufort Scale for Winds (land version)
Beaufort Code
Speed (Miles
per Hour)
Speed (Kilometers per Hour)
Wind Category
Description Effects on the Environment
0 < 1 < 1 calm smoke rises vertically 1 2 - 3 1 - 5 light air smoke drifts slowly
2 4 - 7 6 - 11 light breeze leaves rustle, wind can be felt, wind vanes move
3 8 - 12 12 - 19 gentle breeze leaves and twigs on trees move
4 13 - 18 20 - 29 moderate breeze
small tree branches move, dust is picked up from the ground surface
5 19 - 24 30 - 38 fresh breeze small trees move
6 25 - 31 39 - 51 strong breeze large branches move, telephone and power overhead wires whistle
7 32 - 38 51 - 61 near gale trees move, difficult to walk in the wind 8 39 - 46 62 - 74 gale twigs break off from trees
9 47 - 54 75 - 86 strong gale branches break off from trees, shingles blown off roofs
10 55 - 63 87 - 101 whole gale trees become uprooted, structural damage on buildings
11 64 - 74 102 - 120 storm widespread damage to buildings and trees 12 > 75 > 120 hurricane severe damage to buildings and trees

84
Definitions Accumulated Precipitation: Amount of all precipitation observed over a period of time at a specific location. CWOP, using the APRS coding format, supports the following accumulated precipitation definitions:
o Rainfall since last hour (r), units in hundredths of an inch. (00.00 inch) o Rainfall since midnight (p), units in hundredths of an inch (00.00 inch) o Rainfall in the last 24 hours (P), units in hundredths of an inch (00.00 inch)
Altimeter Setting (QNH): Altimeter setting defines the pressure value to which an aircraft altimeter scale is set so that the altimeter indicates the altitude above mean sea level of an aircraft on the ground at the location for which the value was determined. Ambient. n. The measure of something that surrounds an instrument as a fluid or air without heating or cooling, the prevailing or average condition. The surrounding external air temperature as distinguished from the temperature of the device making the measurement. Atmospheric Pressure: The force per unit area exerted against a surface by the weight of the air above that surface at a given point. Buys-Ballot Law: With your back to wind, the low pressure center will be to your left in the northern hemisphere. Canopy: The overhead shade and layers of foliage provided by trees and shrubs in forests and woodlands. A canopy may have a single layer, or many. The uppermost layer in a forest is called the crown canopy. Coriolis Force: An apparent force observed on any free moving object in a rotating system. On the Earth, this deflection force results from the Earth’s rotation and causes moving particles or wind to deflect to the right in the Northern Hemisphere and to the left in the Southern Hemisphere (any why the toilet water rotates counter-clockwise in the northern hemisphere when flushed?). Dew point. n. The temperature to which a given parcel of air must be cooled at constant pressure and constant water vapor content in order for saturation to occur. The relative humidity and the dew point are calculated from the temperature and the wet bulb. Ekman Profile/Spiral or Transition Layer: Wind direction veers (turns clockwise) with height and wind speed increases with height in the planetary boundary layer. Free Air Wind: Winds not influenced by the Earth’s frictional drag (see also geostrophic winds) above the planetary boundary layer. Friction Effect: Surface winds on a weather map do not blow exactly parallel to the isobars as in geostrophic and gradient winds. Instead, surface winds tend to cross the isobars at an angle varying from 10 to 45°. Close to the Earth's surface, friction reduces the wind speed, which in turn reduces the Coriolis force. http://www.physicalgeography.net/fundamentals/7n.html Geostrophic Wind: An air parcel initially at rest will move from high pressure to low pressure because of the pressure gradient force (PGF). However, as that air parcel begins to move, it is deflected by the Coriolis force to the right in the northern hemisphere (to the left on the southern hemisphere). As the wind gains speed, the deflection increases until the Coriolis force equals the pressure gradient force. At this point, the wind will be blowing parallel to the

85
isobars. When this happens, the wind is referred to as geostrophic. No frictional drag is present with geostrophic winds. http://ww2010.atmos.uiuc.edu/(Gh)/guides/mtr/fw/geos.rxml Gust: The maximum instantaneous wind speed measured in the most recent 10 minutes prior to the observation time. Instantaneous Precipitation: A rate-of-fall estimate, sampled over a short time period (e.g. a snap-shot), that extrapolates the amount precipitation that would fall if that rate-of-fall were constant for an hour, described in inches or millimeter (mm) per hour. Mean Wind Speed and Direction: The mean wind speed and direction measured in the most recent 2 minutes prior to the observation time. Planetary Boundary Layer: “that part of the troposphere that is directly influenced by the presence of the earth’s surface, and responds to surface forcing with a timescale of about an hour or less.” Almost all exchange of heat, moisture, momentum, naturally occurring particles, aerosols, and gasses, and pollutants occurs through the PBL. Precipitation: As used in hydrology, precipitation is the discharge of water, in a liquid or solid state, out of the atmosphere, generally onto a land or water surface. It is the common process by which atmospheric water becomes surface, or subsurface water. The term "precipitation" is also commonly used to designate the quantity of water that is precipitated. Precipitation includes rainfall, snow, hail, and sleet, and is therefore a more general term than rainfall. Pressure Designators (“Q”): Short hand means of referencing which type of pressure is being used. River Basin or Watershed (EPA Definition): A watershed is the area of land where all of the precipitation that falls into it, water that is under it, or drains off it goes into the same place. John Wesley Powell, scientist geographer Grand Canyon explorer, put it best when he said that a watershed is:
o "that area of land, a bounded hydrologic system, within which all living things are inextricably linked by their common water course and where, as humans settled, simple logic demanded that they become part of a community."
Watersheds come in all shapes and sizes. They include county, state, and national boundaries. No matter where you are, you're in a watershed. Find your watershed by going here. Sea Level Pressure (QFF): A pressure value obtained by the theoretical reduction of station pressure to sea level. Where the earth’s surface is above sea level, it is assumed the atmosphere extends to sea level below the unit (station) and the properties of the hypothetical atmosphere are related to conditions observed at the unit. Snow Water Equivalent: The liquid water content obtained from melting accumulated snow. Standard Atmosphere: A hypothetical vertical distribution of the atmospheric temperature, pressure, and density, which by international agreement, is considered representative of the atmosphere for pressure altimeter calibrations and other purposes. Station Elevation (Hp): The officially designated height above sea level to which station pressure pertains. It is generally the same as field elevation. Station Pressure (QFE): The atmospheric pressure at the station elevation (Hp).

86
Temperature. n. Latin temperatura, due measure, from temperatus, past participle of temperare, to mix.
o The degree of hotness or coldness of the ambient air as measured by any suitable instrument.
o A measure of the average kinetic energy of the particles in a sample of matter, expressed in terms of units or degrees designated on a standard scale
Wind Direction: In operational meteorology, winds are said to “come from a particular direction.” For instance, winds at the airport are reported to be from 320 degrees at 12 mph gusting to 20 mph (32012/20). This means that the winds are coming from the northwest and moving to the southeast. This representation is opposite to standard physics notation with wind vectors (magnitude and direction) is going “to” a particular direction.
87
References Allen J. Coombes, 1992: Eyewitness Handbook of Trees, DK Publishing, Inc., New York. ASOS User’s Guide, 1998: Office of the Federal Coordinator for Meteorology (OFCM). http://www.nws.noaa.gov/asos/aum-toc.pdf Complementary Data Sources and Networks, February 11, 2005. NOAA National Weather Service Instruction (NWSI) 10-1312. http://www.weather.gov/directives/010/pd01013012a..pdf Friedman, R.M., 1989: Appropriating the Weather – Vilhelm Bjerknes and the Construction of a Modern Meteorology. Cornell University Press, Ithaca, xx + 251 pp. Gunn, R. and Kinzer, G. D. 1949: The terminal velocity of fall for water drops in stagnant air. Journal of Meteorology, 6, 243-248. Instrument Requirements and Standards for the NWS Surface Observing Programs (Land), October 17, 2003. NOAA National Weather Service Instruction (NWSI) 10-1302. http://www.nws.noaa.gov/directives/010/pd01013002b.pdf Legates DR, Willmott CJ. 1990: Mean seasonal and spatial variability in gauge-corrected, global precipitation. International Journal of Climatology 10: 111–127. Nespor V, Sevruk B. 1999: Estimation of wind-induced error of rainfall gauge measurements using a numerical simulation. Journal of Atmospheric and Oceanic Technology 16: 450-464. Orlanski, I., 1975: A rational subdivision of scales for atmospheric processes. Bulletin of the American Meteorological Society, 56(5), 527-530. http://www.gfdl.noaa.gov/~gth/netscape/1975/io7501.pdf Oke, T.R., 2004: Initial Guidance to Obtain Representative Meteorological Observations at Urban Sites. World Meteorological Organization (WMO) Report #81 – Instruments and Observing Methods. http://www.wmo.ch/web/www/IMOP/publications/IOM-81/IOM-81-UrbanMetObs.pdf NWS COOP Modernization Program Development Plan, 2004: Appendix E. Siting and Observing Standards. NOAA National Weather Service. http://www.nws.noaa.gov/om/coop/reference/PDP4COOP.pdf NWS COOP Program Station Siting Standards http://www.nws.noaa.gov/om/coop/standard.htm RAWS Anemometer Height Adjustment for Obstructions. USDA U.S. Forest Service.

88
http://www.fs.fed.us/raws/book/anemometer.shtml Spadaro, J.V., 1999: "Quantifying the Effects of Airborne Pollution: Impact Models, Sensitivity Analyses and Applications". Doctoral thesis, Ecole des Mines, 60 boul. St.-Michel, F-75272 Paris, France. http://www-cenerg.ensmp.fr/english/themes/impact/ Stull, R.B., 1988: An introduction to boundary layer meteorology. Kluwer Academic Publishers. Surface Weather Observations. Air Force Manual (AFMAN) 15-111, 2003. Air Force Weather Agency (AFWA), U.S. Air Force. http://www.e-publishing.af.mil/pubs/publist.asp?puborg=AF&series=15 University of Illinois Urbana-Champaign (UIUC) Weather World 2010 Project (WW2010) http://ww2010.atmos.uiuc.edu/(Gh)/guides/mtr/fw/prs/def.rxml Wade, Ian (ed.), 2000: Automatic Position Reporting System (APRS) Protocol Reference, Version 1.0. APRS Working Group. http://www.uiview.org/files/APRS101.pdf WMO (1996): Guide to Meteorological Instruments and Methods of Observation. World Meteorological Organization No. 8, 6th edition, Geneva Switzerland.