citation for published version - university of...
TRANSCRIPT

Research Archive
Citation for published version:R. J. Ivison, et al, ‘THE SPACE DENSITY OF LUMINOUS DUSTY STAR-FORMING GALAXIES AT z > 4: SCUBA-2 AND LABOCA IMAGING OF ULTRARED GALAXIES FROM HERSCHEL-ATLAS’, The Astrophysical Journal, Vol. 832 (1), November 2016.
DOI: https://doi.org/10.3847/0004-637X/832/1/78
Document Version:This is the Accepted Manuscript version. The version in the University of Hertfordshire Research Archive may differ from the final published version.
Copyright and Reuse: © 2016. The American Astronomical Society.Content in the UH Research Archive is made available for personal research, educational, and non-commercial purposes only. Unless otherwise stated, all content is protected by copyright, and in the absence of an open license, permissions for further re-use should be sought from the publisher, the author, or other copyright holder.
EnquiriesIf you believe this document infringes copyright, please contact the Research & Scholarly Communications Team at [email protected]
arX
iv:1
611.
0076
2v1
[ast
ro-p
h.G
A]
2 N
ov 2
016
IN PRESS ATTHE ASTROPHYSICALJOURNALPreprint typeset using LATEX style emulateapj v. 12/16/11
THE SPACE DENSITY OF LUMINOUS DUSTY STAR-FORMING GALAXIES AT Z > 4:SCUBA-2 AND LABOCA IMAGING OF ULTRARED GALAXIES FROMHERSCHEL-ATLAS
R. J. IVISON1,2, A. J. R. LEWIS2, A. WEISS3, V. ARUMUGAM1,2, J. M. SIMPSON2, W. S. HOLLAND 4, S. MADDOX2,5, L. DUNNE2,5,E. VALIANTE 5, P.VAN DER WERF6, A. OMONT7,8, H. DANNERBAUER9,10,11, IAN SMAIL 12, F. BERTOLDI13, M. BREMER14,
R. S. BUSSMANN15, Z.-Y. CAI 16, D. L. CLEMENTS17, A. COORAY18, G. DE ZOTTI19,20, S. A. EALES5, C. FULLER5,J. GONZALEZ-NUEVO19,21, E. IBAR22, M. NEGRELLO5, I. OTEO2,1, I. PÉREZ-FOURNON9,10, D. RIECHERS15, J. A. STEVENS23,
A. M. SWINBANK 12, AND J. WARDLOW12
In press at The Astrophysical Journal
ABSTRACTUntil recently, only a handful of dusty, star-forming galaxies (DSFGs) were known atz> 4, most of them sig-nificantly amplified by gravitational lensing. Here, we haveincreased the number of such DSFGs substantially,selecting galaxies from the uniquely wide 250-, 350- and 500-µm Herschel-ATLAS imaging survey on the ba-sis of their extremely red far-infrared colors and faint 350- and 500-µm flux densities –ergothey are expectedto be largely unlensed, luminous, rare and very distant. Theaddition of ground-based continuum photometry atlonger wavelengths from the James Clerk Maxwell Telescope (JCMT) and the Atacama Pathfinder Experiment(APEX) allows us to identify the dust peak in their spectral energy distributions (SEDs), better constrainingtheir redshifts. We select the SED templates best able to determine photometric redshifts using a sample of 69high-redshift, lensed DSFGs, then perform checks to assessthe impact of the CMB on our technique, and toquantify the systematic uncertainty associated with our photometric redshifts,σ = 0.14(1+ z), using a sampleof 25 galaxies with spectroscopic redshifts, each consistent with our color selection. ForHerschel-selectedultrared galaxies with typical colors ofS500/S250∼ 2.2 andS500/S350∼ 1.3 and flux densities,S500∼ 50 mJy,we determine a median redshift,zphot = 3.66, an interquartile redshift range, 3.30–4.27, with a median rest-frame 8–1000-µm luminosity, LIR, of 1.3× 10¹³ L⊙. A third lie at z> 4, suggesting a space density,ρz>4,of ≈ 6× 10⁻⁷ Mpc−3. Our sample contains the most luminous known star-forming galaxies, and the mostover-dense cluster of starbursting proto-ellipticals yetfound.Keywords:galaxies: high-redshift — galaxies: starburst — submillimeter: galaxies — infrared: galaxies
1 European Southern Observatory, Karl-Schwarzchild-Straße 2, D-85748 Garching, Germany
2 Institute for Astronomy, University of Edinburgh, Royal Observatory,Blackford Hill, Edinburgh EH9 3HJ, UK
3 Max-Planck-Institut für Radioastronomie, Auf dem Hügel 69, D-53121 Bonn, Germany
4 UK Astronomy Technology Centre, Royal Observatory, BlackfordHill, Edinburgh EH9 3HJ, UK
5 School of Physics & Astronomy, Cardiff University, Queen’sBuild-ings, The Parade, Cardiff CF24 3AA, UK
6 Leiden Observatory, Leiden University, P.O. Box 9513, NL-2300 RALeiden, The Netherlands
7 UPMC Univ Paris 06, UMR 7095, IAP, 75014, Paris, France8 CNRS, UMR7095, IAP, F-75014, Paris, France9 IAC, E-38200 La Laguna, Tenerife, Spain10 Departamento de Astrofisica, Universidad de La Laguna, E-38205 La
Laguna, Tenerife, Spain11 Universität Wien, Institut für Astrophysik, Türkenschanzstr. 18, 1180
Wien, Austria12 Centre for Extragalactic Astronomy, Department of Physics, Durham
University, South Road, Durham DH1 3LE, UK13 Argelander-Institute for Astronomy, Bonn University, Aufdem
Huegel 71, 53121 Bonn, Germany14 H. H. Wills Physics Laboratory, University of Bristol, Tyndall Av-
enue, Bristol BS8 1TL, UK15 Astronomy Department, Cornell University, Ithaca, NY 1485316 CAS Key Laboratory for Research in Galaxies and Cosmology, De-
partment of Astronomy, University of Science and Technology of China,Hefei, Anhui 230026, China
17 Astrophysics Group, Imperial College London, Blackett Laboratory,Prince Consort Road, London SW7 2AZ, UK
18 Department of Physics and Astronomy, University of California,Irvine, CA 92697, USA
19 SISSA, Via Bonomea 265, I-34136, Trieste, Italy20 INAF-Osservatorio Astronomico di Padova, Vicolo dellâAZOsserva-
torio 5, I-35122 Padova, Italy21 CSIC-UC, Avda los Castros s/n, 39005 Santander, Spain22 Instituto de Física y Astronomía, Universidad de Valparaíso, Avda.
Gran Bretaña 1111, Valparaíso, Chile23 Centre for Astrophysics, Science and Technology Research Institute,
University of Hertfordshire, Hatfield AL10 9AB, UK
2 IVISON ET AL.
1. INTRODUCTION
The first deep submillimeter (submm) imaging surveys –made possible by large, ground-based telescopes equippedwith highly multiplexed bolometer arrays (e.g. Kreysa et al.1998; Holland et al. 1999) – resolved a previously unknownpopulation of submm-bright galaxies, or dusty star-forminggalaxies (hereafter DSFGs — Smail et al. 1997; Barger et al.1998; Hughes et al. 1998). Interferometric imaging refinedthe positions of these DSFGs sufficiently to allow conven-tional optical spectroscopic observations, and they were thenshown to lie atz> 1 (e.g. Chapman et al. 2003), and to bea thousand times more numerous than their supposed localanalogs, ultraluminous infrared (IR) galaxies (ULIRGs —e.g. Sanders & Mirabel 1996).
The Spectral and Photometric Imaging Receiver (SPIRE— Griffin et al. 2010) on boardHerschel(Pilbratt et al. 2010)gave astronomers a new tool to select dusty galaxies. More-over, simultaneous imaging through three far-infrared filtersat 250, 350 and 500µm enables the selection of ‘ultrared DS-FGs’ in the early Universe,z> 4. The space density and phys-ical properties of the highest-redshift starbursts provide someof the most stringent constraints on galaxy-formation models,since these galaxies lie on the most extreme tail of the galaxystellar mass function (e.g. Hainline et al. 2011).
Cox et al. (2011) were the first to search amongst the so-called ‘500-µm risers’ (S250 < S350 < S500, whereSλ is theflux density atλµm), reporting extensive follow-up obser-vations of one of the brightest, reddest DSFGs in the firstfew 16-deg2 tiles of the ≈ 600-deg2 imaging survey,H-ATLAS (HerschelAstrophysical Terahertz Large Area Sur-vey — Eales et al. 2010), a lensed starburst atz = 4.2,G15.141 or HATLAS J142413.9+022304, whose clear, asym-metric double-peaked CO lines betray an asymmetric disk orring, and/or the near-ubiquitous merger found in such sys-tems (Engel et al. 2010). Dowell et al. (2014) demonstratedthe effectiveness of a similar SPIRE color-selection tech-nique, finding 1HERMES S350 J170647.8+584623 atz= 6.3(Riechers et al. 2013) in the northern 7-deg2 First Look Sur-vey field (see also Asboth et al. 2016). Meanwhile, rela-tively wide and shallow surveys with the South Pole Tele-scope (SPT) have allowed the selection of large numbers ofgravitationally lensed DSFGs (Vieira et al. 2010). These tendto contain cold dust and/or to lie at high redshifts (Vieira et al.2013; Weiß et al. 2013; Strandet et al. 2016), due in part totheir selection at wavelengths beyond 1 mm, which makes thesurvey less sensitive to warmer sources atz≈ 1–3.
In this paper, we report efforts to substantially increase thenumber of ultrared DSFGs, using a similar color-selectionmethod to isolate colder and/or most distant galaxies, atz> 4,a redshift regime where samples are currently dominated bygalaxies selected in the rest-frame ultraviolet (e.g. Ellis et al.2013). Our goal here is to select galaxies that are largelyunlensed, rare and very distant, modulo the growing opti-cal depth to lensing at increasing redshift. We hope to findthe progenitors of the most distant quasars, of which morethan a dozen are known to host massive (> 108 M⊙) blackholes atz> 6 (e.g. Fan et al. 2001; Mortlock et al. 2011). Wewould expect to find several in an area the size ofH-ATLAS,≈ 600 deg2, if the duration of their starburst phase is com-mensurate with their time spent as ‘naked’ quasars. We ac-complish this by searching over the wholeH-ATLAS surveyarea – an order of magnitude more area than the earlier workin H-ATLAS.
We exploit both ground- and space-based observations,concentrating our efforts in a flux-density regime,S500 <100 mJy where most DSFGs are not expected to be boostedsignificantly by gravitational lensing (Negrello et al. 2010;Conley et al. 2011). We do this partly to avoid the uncer-tainties associated with lensing magnification corrections anddifferential magnification (e.g. Serjeant 2012), partly becausethe areal coverage of ourHerschelsurvey would otherwiseyield only a handful of targets, and partly because wider sur-veys with the SPT are better suited to finding the brighter,distant, lensed population.
In the next section we describe our data acquisition andour methods of data reduction. We subsequently outline oursample selection criteria before presenting, analyzing, inter-preting and discussing our findings in §4. Our conclusionsare outlined in §5. Follow-up spectral scans of a subsetof these galaxies with the Atacama Large Millimeter Array(ALMA) and with Institute Radioastronomie Millimetrique’s(IRAM’s) Northern Extended Millimeter Array (NOEMA)are presented by Fudamoto et al. (2016). Following the de-tailed ALMA study by Oteo et al. (2016d) of one extraordi-narily luminous DSFG from this sample, Oteo et al. (2016b)present high-resolution continuum imaging of a substantialsubset of our galaxies, determining the size of their star-forming regions and assessing the fraction affected by gravi-tational lensing. Submillimeter imaging of the environmentsof the reddest galaxies using the 12-m Atacama PathfinderTelescope (APEX) are presented by Lewis et al. (2016). Adetailed study of a cluster of starbursting proto-ellipticals cen-tered on one of our reddest DSFGs is presented by Oteo et al.(2016c).
We adopt a cosmology withH0 = 71 km s−1 Mpc−1, Ωm =0.27 andΩΛ = 0.73.
2. SAMPLE SELECTION
2.1. Far-infrared imaging
We utilize images created for theH-ATLAS Data Release1 (Valiante et al. 2016), covering three equatorial fields withright ascensions of 9, 12 and 15 hr, the so-called GAMA09,GAMA12 and GAMA15 fields, each covering≈ 54 deg2; inthe north, we also have≈ 170 deg2 of areal coverage in theNorth Galactic Pole (NGP) field; finally, in the south, we have≈ 285 deg2 in the South Galactic Pole (SGP) field, making atotal of ≈ 600 deg2. The acquisition and reduction of theseHerschelparallel-mode data from SPIRE and PACS (Photo-conductor Array Camera and Spectrometer — Poglitsch et al.2010) forH-ATLAS are described in detail by Valiante et al.(2016). Summarising quickly: before the subtraction of asmooth background or the application of a matched filter, asdescribed next in §2.2, the 250-, 350- and 500-µm SPIREmaps exploited here have 6, 8 and 12′′ pixels, point spreadfunctions (PSFs) with azimuthally-averagedFWHM of 17.8,24.0 and 35.2′′ and mean instrumental [confusion] r.m.s. noiselevels of 9.4 [7.0], 9.2 [7.5] and 10.6 [7.2] mJy, respectively,
whereσtotal =√
σ2conf+σ2
instr.
2.2. Source detection
Sources were identified and flux densities were measuredusing a modified version of the Multi-band Algorithm forsource eXtraction (MADX ; Maddox et al., in prep).MADXfirst subtracted a smooth background from the SPIRE maps,and then filtered them with a ‘matched filter’ appropriate for

SUBMM IMAGING OF ULTRARED GALAXIES 3
each band, designed to mitigate the effects of confusion (e.g.Chapin et al. 2011). At this stage, the map pixel distributionsin each band have a highly non-Gaussian positive tail becauseof the sources in the maps, as discussed at length for the un-filtered maps by Valiante et al. (2016).
Next, 2.2-σ peaks were identified in the 250-µm map,and ‘first-pass’ flux-density estimates were obtained from thepixel values at these positions in each SPIRE band. Sub-pixelpositions were estimated by fitting to the 250-µm peaks, thenmore accurate flux densities were estimated using bi-cubicinterpolation to these improved positions. In each band, thesources were sorted in order of decreasing flux density usingthe first-pass pixel values, and a scaled PSF was subtractedfrom the map, leaving a residual map used to estimate fluxesfor any fainter sources. This step prevents the flux densities offaint sources being overestimated when they lie near brightersources. In the modified version ofMADX , the PSF subtrac-tion was applied only for sources with 250-µm peaks greaterthan 3.2σ. The resulting 250-µm-selected sources were la-belled asBANDFLAG=1 and the pixel distribution in the resid-ual 250-µm map is now close to Gaussian, since all of thebright 250-µm sources have been subtracted.
The residual 350-µm map, in which the pixel distribu-tion retains a significant non-Gaussian positive excess, wasthen searched for sources, using the same algorithms as forthe initial 250-µm selection. Sources with peak significancemore than 2.4-σ in the 350-µm residual map are saved asBANDFLAG=2 sources. Next, the residual 500-µm map wassearched for sources, and 2.0-σ peaks are saved asBAND-FLAG=3 sources.
Although the pixel distributions in the final 350- and 500-µm residual images are much closer to Gaussian than the orig-inals, a significant non-Gaussian positive tail remains, due tosubtracting PSFs from sources that are not well fit by the PSF.Some of these are multiple sources detected as a single blend,while some are extended sources. Since even a single, bright,extended source can leave hundreds of pixels with large resid-uals — comparable to the residuals from multiple faint redsources — it is not currently feasible to disentangle the two.
For the final catalogue, we keep sources only if they areabove 3.5σ in any one of the three SPIRE bands. For eachsource, the astrometric position was determined by the datainthe initial detection band. No correction for flux boosting hasbeen applied24. The catalogue thus created contains 7× 10⁵
sources across the five fields observed as part of H-ATLAS.
2.3. Parent sample of ultrared DSFG candidates
Definition of our target sample began with the 7,961sources detected at≥ 3.5-σ at 500µm, with S500/S250≥ 1.5and S500/S350 ≥ 0.85, as expected for DSFGs atz >
∼ 4 (seethe redshift tracks of typical DSFGs, e.g. the Cosmic Eye-lash, SMM J2135−0102 — Swinbank et al. 2010; Ivison et al.2010, in Fig. 1) of which 29, 42 and 29% areBANDFLAG = 1,2 and 3, respectively.
2.3.1. Conventional completeness
To calculate the fraction of real, ultrared DSFGs excludedfrom the parent sample because of our source detection proce-dures, we injected 15,000 fake, PSF-convolved point sources
24 For our selection process this correction depends sensitively on the fluxdensity distribution of the sources as well as on their colour distribution, nei-ther of which is known well, such that the uncertainty in the correction is thenlarger than the correction itself (see also §4.2.6).
E y
e
l
a
s
h
Pope
+08
ALESS
3
6
z pho
t
0.5 1.0 1.5 2.0 2.5S500 / S350
1
2
3
4
5
6
S 500
/ S 250
Figure 1. S350/S500 versusS250/S500 for our sample, overlaid with theredshift tracks expected for a galaxy with the SED of the Cosmic Eye-lash (Swinbank et al. 2010; Ivison et al. 2010) and for two SEDtemplatesthat were synthesized for submm-selected DSFGs by Pope et al. (2008) andSwinbank et al. (2014, ALESS). To match our color-selectioncriteria, galax-ies must haveS500/S250 ≥ 1.5 andS500/S350 ≥ 0.85 and thus lie in the top-right region of the plot. The points representing our sample(and the redshifttrack) are color-coded according to their photometric redshifts, as describedin §4.2. Thez= 4 points on the redshift tracks are marked with orange stars.A representative color uncertainty is shown. Sources from the Phase 1 datarelease ofH-ATLAS lie in the black-pink cloud (Valiante et al. 2016).
10 20 30 40 60 100 200 300 4000
0.2
0.4
0.6
0.8
1
S500
/mJy
Com
plet
enes
s
BANDFLAG=1BANDFLAG=1+2BANDFLAG=1+2+3
Figure 2. Completeness as a function of 500-µm flux density, as assessedby injecting fake sources with colors consistent with the SEDs of the ul-trared DSFGs we expect to detect. For the individual fake SPIRE images(see §2.3.1), completeness is consistent with expectations for sources at agiven signal-to-noise ratio (SNR). Using all threeBANDFLAG values resultsin a relatively high level of completeness (77± 3%) down to 30 mJy, theflux-density level (marked with a dotted line) at which we have selected oursample. Adding theBANDFLAG=2 and 3 sources improves the completenesssignificantly.

4 IVISON ET AL.
into our H-ATLAS images (following Valiante et al. 2016)with colors corresponding to the spectral energy distribution(SED) of a typical DSFG, the Cosmic Eyelash, at redshiftsbetween 0 and 10. The mean colors of these fake sourceswereS500/S250= 2.25 andS500/S350= 1.16, cf. the median col-ors for the sample chosen for ground-based imaging (§2.3.2),S500/S250 = 2.15 andS500/S350 = 1.26, so similar. Values ofS250 were set to give a uniform distribution in log10S250. Wethen re-ran the same source detection process described above(§2.2), as for the real data, matching the resulting catalogtothe input fake catalog.
To determine the completeness for the ultrared sources, wehave examined how many of the recovered fake sources matchour color criteria, as a function of inputS500 andBANDFLAG.Fig. 2 shows how adding theBANDFLAG=2 and 3 sources im-proves the completeness: the blue line is forBANDFLAG=1only; magenta is forBANDFLAG=1 and 2, and black showsBANDFLAG=1, 2 and 3. Selecting only at 250µm yields acompleteness of 80% at 100 mJy; includingBANDFLAG=2sources pushes us down to 50 mJy; using all threeBANDFLAGvalues gets us down to 30 mJy. We estimate a completeness atthe flux-density and color limits of the sample presented hereof 77±3%.
2.3.2. Eyeballing
Of these sources, a subset of 2,725 were eyeballed by ateam of five (RJI, AJRL, VA, AO, HD) to find a reliablesub-sample for imaging with SCUBA-2 and LABOCA. Asa result of this step, 708 (26± 5%) of the eyeballed sourceswere deemed suitable for ground-based follow-up observa-tions, where the uncertainty is taken to be the scatter amongstthe fractions determined by individual members of the eye-balling team. Fig. 3 shows typical examples of the remainder– those not chosen25 – usually because visual inspection re-vealed that blue (250-µm) emission had been missed or un-derestimated byMADX (49% of cases). None of these arelikely to be genuine, ultrared DSFGs. The next most commonreason for rejection (22% of cases) was heavy confusion, suchthat the assigned flux densities and colors were judged to beunreliable. For the remaining 3%, the 350- and/or 500-µmmorphologies were suggestive of Galactic cirrus or an imag-ing artifact.
2.3.3. Completeness issues related to eyeballing
Our team of eyeballers estimated that up to 14% of the can-didates excluded by our eyeballing team – i.e. up to 55% ofthose in the latter two categories discussed in §2.3.2, or plau-sibly roughly half as many again as those deemed suitable forground-based follow-up observations – could in fact be gen-uine, ultrared DSFGs. Phrased another way, the procedurewas judged to recover at least 64% of the genuine, ultraredDSFGs in the parent sample.
Without observing a significant subset of the parent samplewith SCUBA-2 or LABOCA, which would be prohibitivelycostly and inefficient, it is not possible to know exactly whatfraction of genuine, ultrared DSFGs were missed because ofour eyeballing procedure. However, it is possible to determinethe fraction of sources that were missed in a more quantita-tive manner than we have accomplished thus far. To do this, asample of 500 fake, injected ultrared sources – with the sameflux density and color distribution as the initial sample – were
25 Fig. 3 also shows a case whereMADX succeeds in cataloging an ultraredDSFG candidate that is nestled alongside a very bright, local galaxy.
BANDFLAG = 1
19560
S500/S250 = 1.5 S500/S350 = 1.1
BANDFLAG = 1
36016
S500/S250 = 1.6 S500/S350 = 1.1
BANDFLAG = 3
98822
S500/S250 = 1.7 S500/S350 = 2.0
BANDFLAG = 1
35811
S500/S250 = 1.5 S500/S350 = 1.5
BANDFLAG = 2
86201
S500/S250 = 2.7 S500/S350 = 1.3
BANDFLAG = 1
58405
S500/S250 = 2.0 S500/S350 = 1.3
Figure 3. HerschelSPIRE imaging of candidate ultrared DSFGs from ourparent sample of 7,961 sources, each displayed from−6 to +60 mJy beam−1,chosen to illustrate the different reasons that sources were excluded from thesample to be observed by SCUBA-2 and LABOCA by our eyeballingteam.In each column, from left to right, we show 250-, 350- and 500-µm cut-outimages, each 3′×3′ and centered on the (labelled) galaxy. The 250-µm cut-out images have been convolved with a 7′′ Gaussian. North is up and Eastis left. The field labelled 19560 is an example where emissionfrom one ormore 250-µm sources is missed or dealt with poorly byMADX , leading tomisleading colors. None of the candidates in this category are likely to begenuine, ultrared DSFGs. The examples labelled 36016, 35811 and 86201show confused regions in which theMADX flux densities and colors werejudged unreliable. We estimate that up to≈55% of these fields could containgenuine, ultrared DSFGs. The bright galaxy in the field labelled 98822 hasled to a spurious detection byMADX – such examples are rare, fortunately,andMADX is in fact capable of identifying plausible ultrared DSFGs along-side very bright, local galaxies, as illustrated in the lower row for the fieldlabelled 58405.
given to the same team of eyeballers for classification, us-ing the same criteria they had used previously, along with thesame number of real, ultrared DSFG candidates. The frac-tion of genuine, ultrared DSFGs accepted by the eyeballingteam is then taken to be the fraction of fake, injected sourcesassessed to be worthy of follow-up observations during thiseyeballing process: 69± 8%, cf. at least 64%, as estimatedearlier by the eyeballing team.
2.4. Summary of issues affecting sample completeness
Since we have faced a considerable number of complete-ness issues, it is worth summarising their influence on oursample.
SUBMM IMAGING OF ULTRARED GALAXIES 5
Based on robust simulations, we estimate thatCMADX = 77±3% of genuine, ultrared DSFGs made it through ourMADXcataloging procedures; of these, we eyeballedCeye = 34%, ofwhich 26± 5% were deemed suitable for follow-up obser-vations with SCUBA-2 and/or LABOCA by our eyeballingteam. A final set of simulations suggest that the eyeballingprocess was able to recoverCcheck= 69±8% of the availableultrared DSFG population from the parentMADX catalog.
Of those selected for further study, a random subset of 109were observed with SCUBA-2 and/or LABOCA (§3), justoverCobs = 15% of the sample available from our eyeballingteam. Their SPIRE colors are shown in Fig. 1. TheBAND-FLAG = 1, 2 and 3 subsets make up 48, 53 and 8 of this finalsample, respectively.
To estimate the number ofz> 4 DSFGs across our sur-vey fields, detectable toS500 > 30 mJy withS500/S250 ≥ 1.5andS500/S350≥ 0.85, we must scale up the number ofz> 4DSFGs found amongst these 109 targets byCMADX ×Ceye×Ccheck× Cobs)−1 = 36.0± 8.2, where we have included (inquadrature) the uncertainty in the fraction deemed suitablefor follow-up observations with SCUBA-2 and/or LABOCA.In a more conventional sense, the completeness,C = 0.028±0.006.
We note that although we are unable to satisfactorily quan-tify the number of DSFGs scattered by noise from the cloudshown in the bottom-left corner of Fig. 1 into our ultraredDSFG color regime, these DSFGs will be amongst the frac-tion shown to lie atzphot< 4 (§4.2) and so a further correctionto the space density ofz> 4 DSFGs (§4.3) is not required.
3. SUBMM OBSERVATIONS AND DATA REDUCTION
3.1. 850-µm continuum imaging with SCUBA-2
Observations of 109 ultrared DSFGs were obtained usingSCUBA-2 (Holland et al. 2013), scheduled flexibly during theperiod 2012–13, in good or excellent weather. The precip-itable water vapor (PWV) was in the range 0.6–2.0mm, cor-responding to zenith atmospheric opacities of≈ 0.2–0.4 in theSCUBA-2 filter centered at 850µm with a passband width tohalf power of 85µm. TheFWHM of the main beam is 13.0′′
at 850µm, before smoothing, with around 25% of the totalpower in the much broader [49′′] secondary component (seeHolland et al. 2013).
The observations were undertaken whilst moving the tele-scope at a constant speed in a so-calledDAISY pattern(Holland et al. 2013), which provides uniform exposure-timecoverage in the central 3′-diameter region of a field, but usefulcoverage over 12′.
Around 10–15 min was spent integrating on each target,typically (see Table 1), sufficient to detect 850-µm emissionrobustly forz> 4 far-IR-bright galaxies with a characteristictemperature of 10–100K.
The flux-density scale was set using Uranus and Mars,and also secondary calibrators from the JCMT calibrator list(Dempsey et al. 2013), with estimated calibration uncertain-ties amounting to 5% at 850µm. Since we visited each targetonly once (the handful of exceptions are noted in Table 1),the astrometry of the SCUBA-2 images is expected to be thesame as the JCMT r.m.s. pointing accuracy, 2–3 arcsec.
The data were reduced using the Dynamic Iterative Map-Maker within theSTARLINK SMURF package (Chapin et al.2013) using the ‘zero-mask’ algorithm, wherein the image isassumed to be free of significant emission apart from one ormore specified regions, in our case a 30-arcsec-diameter cir-
cle (larger where appropriate, e.g. for SGP-354388 – see §4.1)centered on the target. This method is effective at suppressinglarge-scale noise. SCUBA-2 observations of flux density cali-brators are handled in a similar manner, generally, so measur-ing reliable flux densities is significantly more straightforwardthan in other situations, as discussed later in §4.
3.2. 870-µm continuum imaging with LABOCA
Images were also taken with the Large APEX bolometercamera (LABOCA — Siringo et al. 2009) mounted on the12-m Atacama Pathfinder EXperiment (APEX) telescope26,on Llano Chajnantor at an altitude of 5,100 m, in Chile.LABOCA contains an array of 295 composite bolometers, ar-ranged as a central channel with nine concentric hexagons,operating at a central wavelength of 870µm (806–958µm athalf power, so a wider and redder passband than the SCUBA-2 850-µm filter) with aFWHM resolution of 19.2′′.
All sources were observed using a compact raster pattern inwhich the telescope performed a 2.5′-diameter spiral at con-stant angular speed at each of four raster positions, leading toa fully sampled map over the full 11′-diameter field of viewof LABOCA. Around 2–4 hr was spent integrating on eachtarget (see Table 1). The data were reduced using the BoAsoftware package, applying standard reductions steps (seee.g.Weiß et al. 2009).
The PWV during the observations was typically between0.6 and 1.4 mm, corresponding to a zenith atmospheric opac-ity of 0.30–0.55 in the LABOCA passband. The flux-densityscale was determined to an accuracy of 10% using observa-tions of Uranus and Neptune. Pointing was checked everyhour using nearby quasars and was stable. The astrometry ofour LABOCA images, each the result of typically three indi-vidual scans, separated by pointing checks, is expected to beσ ≈ 1–2′′.
4. RESULTS, ANALYSIS AND DISCUSSION
In what follows we describe our measurements of 850-µm[870µm for LABOCA] flux densities for our candidate ultra-red DSFGs.27
4.1. Measurements of flux density
We measured 850- or 870-µm flux densities via severalmethods, each useful in different circumstances, listing theresults in Table 1.
In the first method, we searched beam-convolved images28
for the brightest peak within a 45-arcsec-diameter circle,cen-tered on the target coordinates. For point sources these peaksprovide the best estimates of both flux density and astromet-ric position. The accuracy of the latter can only be accurateto a 1′′ × 1′′ pixel, but this is better than the expected statis-tical accuracy for our generally low-SNR detections, as com-monly expressed byσpos = 0.6θ/SNR, whereθ is theFWHMbeam size (see Appendix of Ivison et al. 2007); it is also betterthan the r.m.s. pointing accuracy of the telescopes which, atleast for our JCMT imaging, dominates the astrometric bud-get. The uncertainty in the flux density was taken to be the
26 This publication is based on data acquired with APEX, a collaborationbetween the Max-Planck-Institut fur Radioastronomie, theEuropean South-ern Observatory, and the Onsala Space Observatory.
27 For the handful of objects where data exist from both SCUBA-2andLABOCA, e.g. SGP-354388, the measured flux densities are consistent.
28 Effective beam sizes after convolution: 18.4′′ [25.6′′] for the SCUBA-2850-µm [LABOCA 870-µm] data.
6 IVISON ET AL.
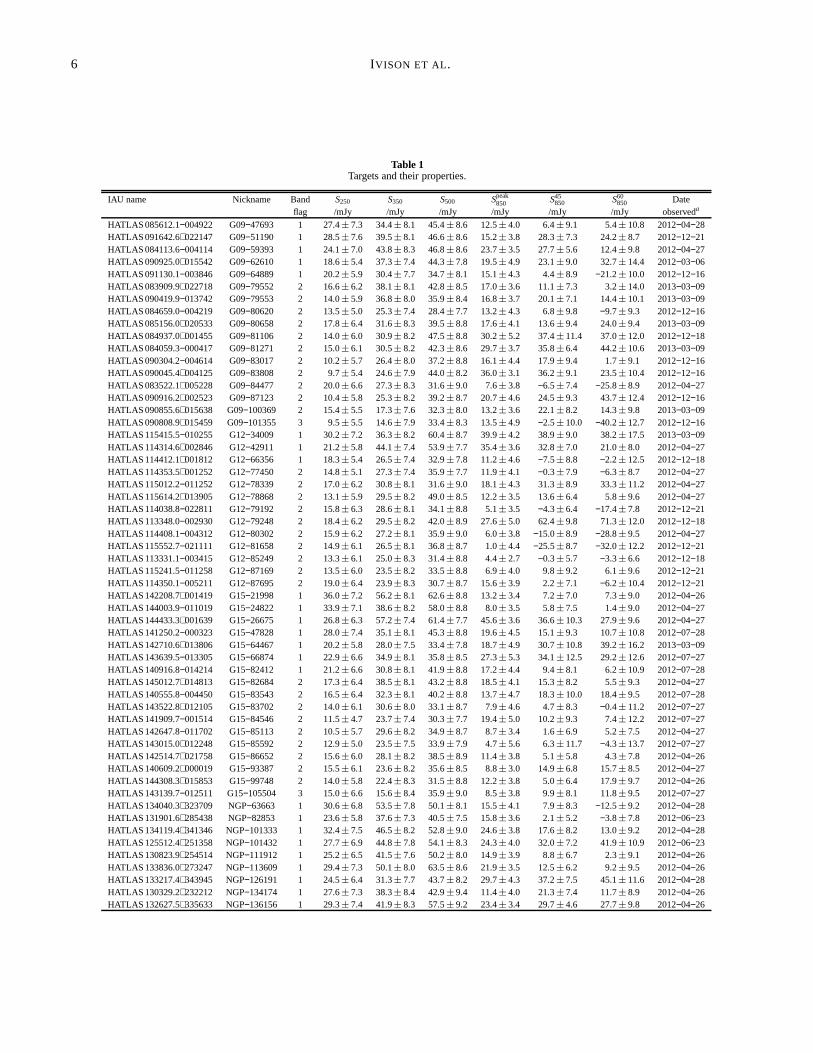
Table 1Targets and their properties.
IAU name Nickname Band S250 S350 S500 Speak850 S45
850 S60850 Date
flag /mJy /mJy /mJy /mJy /mJy /mJy observeda
HATLAS 085612.1−004922 G09−47693 1 27.4± 7.3 34.4± 8.1 45.4±8.6 12.5± 4.0 6.4±9.1 5.4± 10.8 2012−04−28HATLAS 091642.6+022147 G09−51190 1 28.5± 7.6 39.5± 8.1 46.6±8.6 15.2± 3.8 28.3±7.3 24.2± 8.7 2012−12−21HATLAS 084113.6−004114 G09−59393 1 24.1± 7.0 43.8± 8.3 46.8±8.6 23.7± 3.5 27.7±5.6 12.4± 9.8 2012−04−27HATLAS 090925.0+015542 G09−62610 1 18.6± 5.4 37.3± 7.4 44.3±7.8 19.5± 4.9 23.1±9.0 32.7± 14.4 2012−03−06HATLAS 091130.1−003846 G09−64889 1 20.2± 5.9 30.4± 7.7 34.7±8.1 15.1± 4.3 4.4±8.9 −21.2± 10.0 2012−12−16HATLAS 083909.9+022718 G09−79552 2 16.6± 6.2 38.1± 8.1 42.8±8.5 17.0± 3.6 11.1±7.3 3.2± 14.0 2013−03−09HATLAS 090419.9−013742 G09−79553 2 14.0± 5.9 36.8± 8.0 35.9±8.4 16.8± 3.7 20.1±7.1 14.4± 10.1 2013−03−09HATLAS 084659.0−004219 G09−80620 2 13.5± 5.0 25.3± 7.4 28.4±7.7 13.2± 4.3 6.8±9.8 −9.7± 9.3 2012−12−16HATLAS 085156.0+020533 G09−80658 2 17.8± 6.4 31.6± 8.3 39.5±8.8 17.6± 4.1 13.6±9.4 24.0± 9.4 2013−03−09HATLAS 084937.0+001455 G09−81106 2 14.0± 6.0 30.9± 8.2 47.5±8.8 30.2± 5.2 37.4±11.4 37.0± 12.0 2012−12−18HATLAS 084059.3−000417 G09−81271 2 15.0± 6.1 30.5± 8.2 42.3±8.6 29.7± 3.7 35.8±6.4 44.2± 10.6 2013−03−09HATLAS 090304.2−004614 G09−83017 2 10.2± 5.7 26.4± 8.0 37.2±8.8 16.1± 4.4 17.9±9.4 1.7± 9.1 2012−12−16HATLAS 090045.4+004125 G09−83808 2 9.7± 5.4 24.6± 7.9 44.0±8.2 36.0± 3.1 36.2±9.1 23.5± 10.4 2012−12−16HATLAS 083522.1+005228 G09−84477 2 20.0± 6.6 27.3± 8.3 31.6±9.0 7.6± 3.8 −6.5±7.4 −25.8± 8.9 2012−04−27HATLAS 090916.2+002523 G09−87123 2 10.4± 5.8 25.3± 8.2 39.2±8.7 20.7± 4.6 24.5±9.3 43.7± 12.4 2012−12−16HATLAS 090855.6+015638 G09−100369 2 15.4± 5.5 17.3± 7.6 32.3±8.0 13.2± 3.6 22.1±8.2 14.3± 9.8 2013−03−09HATLAS 090808.9+015459 G09−101355 3 9.5± 5.5 14.6± 7.9 33.4±8.3 13.5± 4.9 −2.5±10.0 −40.2± 12.7 2012−12−16HATLAS 115415.5−010255 G12−34009 1 30.2± 7.2 36.3± 8.2 60.4±8.7 39.9± 4.2 38.9±9.0 38.2± 17.5 2013−03−09HATLAS 114314.6+002846 G12−42911 1 21.2± 5.8 44.1± 7.4 53.9±7.7 35.4± 3.6 32.8±7.0 21.0± 8.0 2012−04−27HATLAS 114412.1+001812 G12−66356 1 18.3± 5.4 26.5± 7.4 32.9±7.8 11.2± 4.6 −7.5±8.8 −2.2± 12.5 2012−12−18HATLAS 114353.5+001252 G12−77450 2 14.8± 5.1 27.3± 7.4 35.9±7.7 11.9± 4.1 −0.3±7.9 −6.3± 8.7 2012−04−27HATLAS 115012.2−011252 G12−78339 2 17.0± 6.2 30.8± 8.1 31.6±9.0 18.1± 4.3 31.3±8.9 33.3± 11.2 2012−04−27HATLAS 115614.2+013905 G12−78868 2 13.1± 5.9 29.5± 8.2 49.0±8.5 12.2± 3.5 13.6±6.4 5.8± 9.6 2012−04−27HATLAS 114038.8−022811 G12−79192 2 15.8± 6.3 28.6± 8.1 34.1±8.8 5.1± 3.5 −4.3±6.4 −17.4± 7.8 2012−12−21HATLAS 113348.0−002930 G12−79248 2 18.4± 6.2 29.5± 8.2 42.0±8.9 27.6± 5.0 62.4±9.8 71.3± 12.0 2012−12−18HATLAS 114408.1−004312 G12−80302 2 15.9± 6.2 27.2± 8.1 35.9±9.0 6.0± 3.8 −15.0±8.9 −28.8± 9.5 2012−04−27HATLAS 115552.7−021111 G12−81658 2 14.9± 6.1 26.5± 8.1 36.8±8.7 1.0± 4.4 −25.5±8.7 −32.0± 12.2 2012−12−21HATLAS 113331.1−003415 G12−85249 2 13.3± 6.1 25.0± 8.3 31.4±8.8 4.4± 2.7 −0.3±5.7 −3.3± 6.6 2012−12−18HATLAS 115241.5−011258 G12−87169 2 13.5± 6.0 23.5± 8.2 33.5±8.8 6.9± 4.0 9.8±9.2 6.1± 9.6 2012−12−21HATLAS 114350.1−005211 G12−87695 2 19.0± 6.4 23.9± 8.3 30.7±8.7 15.6± 3.9 2.2±7.1 −6.2± 10.4 2012−12−21HATLAS 142208.7+001419 G15−21998 1 36.0± 7.2 56.2± 8.1 62.6±8.8 13.2± 3.4 7.2±7.0 7.3± 9.0 2012−04−26HATLAS 144003.9−011019 G15−24822 1 33.9± 7.1 38.6± 8.2 58.0±8.8 8.0± 3.5 5.8±7.5 1.4± 9.0 2012−04−27HATLAS 144433.3+001639 G15−26675 1 26.8± 6.3 57.2± 7.4 61.4±7.7 45.6± 3.6 36.6±10.3 27.9± 9.6 2012−04−27HATLAS 141250.2−000323 G15−47828 1 28.0± 7.4 35.1± 8.1 45.3±8.8 19.6± 4.5 15.1±9.3 10.7± 10.8 2012−07−28HATLAS 142710.6+013806 G15−64467 1 20.2± 5.8 28.0± 7.5 33.4±7.8 18.7± 4.9 30.7±10.8 39.2± 16.2 2013−03−09HATLAS 143639.5−013305 G15−66874 1 22.9± 6.6 34.9± 8.1 35.8±8.5 27.3± 5.3 34.1±12.5 29.2± 12.6 2012−07−27HATLAS 140916.8−014214 G15−82412 1 21.2± 6.6 30.8± 8.1 41.9±8.8 17.2± 4.4 9.4±8.1 6.2± 10.9 2012−07−28HATLAS 145012.7+014813 G15−82684 2 17.3± 6.4 38.5± 8.1 43.2±8.8 18.5± 4.1 15.3±8.2 5.5± 9.3 2012−04−27HATLAS 140555.8−004450 G15−83543 2 16.5± 6.4 32.3± 8.1 40.2±8.8 13.7± 4.7 18.3±10.0 18.4± 9.5 2012−07−28HATLAS 143522.8+012105 G15−83702 2 14.0± 6.1 30.6± 8.0 33.1±8.7 7.9± 4.6 4.7±8.3 −0.4± 11.2 2012−07−27HATLAS 141909.7−001514 G15−84546 2 11.5± 4.7 23.7± 7.4 30.3±7.7 19.4± 5.0 10.2±9.3 7.4± 12.2 2012−07−27HATLAS 142647.8−011702 G15−85113 2 10.5± 5.7 29.6± 8.2 34.9±8.7 8.7± 3.4 1.6±6.9 5.2± 7.5 2012−04−27HATLAS 143015.0+012248 G15−85592 2 12.9± 5.0 23.5± 7.5 33.9±7.9 4.7± 5.6 6.3±11.7 −4.3± 13.7 2012−07−27HATLAS 142514.7+021758 G15−86652 2 15.6± 6.0 28.1± 8.2 38.5±8.9 11.4± 3.8 5.1±5.8 4.3± 7.8 2012−04−26HATLAS 140609.2+000019 G15−93387 2 15.5± 6.1 23.6± 8.2 35.6±8.5 8.8± 3.0 14.9±6.8 15.7± 8.5 2012−04−27HATLAS 144308.3+015853 G15−99748 2 14.0± 5.8 22.4± 8.3 31.5±8.8 12.2± 3.8 5.0±6.4 17.9± 9.7 2012−04−26HATLAS 143139.7−012511 G15−105504 3 15.0± 6.6 15.6± 8.4 35.9±9.0 8.5± 3.8 9.9±8.1 11.8± 9.5 2012−07−27HATLAS 134040.3+323709 NGP−63663 1 30.6± 6.8 53.5± 7.8 50.1±8.1 15.5± 4.1 7.9±8.3 −12.5± 9.2 2012−04−28HATLAS 131901.6+285438 NGP−82853 1 23.6± 5.8 37.6± 7.3 40.5±7.5 15.8± 3.6 2.1±5.2 −3.8± 7.8 2012−06−23HATLAS 134119.4+341346 NGP−101333 1 32.4± 7.5 46.5± 8.2 52.8±9.0 24.6± 3.8 17.6±8.2 13.0± 9.2 2012−04−28HATLAS 125512.4+251358 NGP−101432 1 27.7± 6.9 44.8± 7.8 54.1±8.3 24.3± 4.0 32.0±7.2 41.9± 10.9 2012−06−23HATLAS 130823.9+254514 NGP−111912 1 25.2± 6.5 41.5± 7.6 50.2±8.0 14.9± 3.9 8.8±6.7 2.3± 9.1 2012−04−26HATLAS 133836.0+273247 NGP−113609 1 29.4± 7.3 50.1± 8.0 63.5±8.6 21.9± 3.5 12.5±6.2 9.2± 9.5 2012−04−26HATLAS 133217.4+343945 NGP−126191 1 24.5± 6.4 31.3± 7.7 43.7±8.2 29.7± 4.3 37.2±7.5 45.1± 11.6 2012−04−28HATLAS 130329.2+232212 NGP−134174 1 27.6± 7.3 38.3± 8.4 42.9±9.4 11.4± 4.0 21.3±7.4 11.7± 8.9 2012−04−26HATLAS 132627.5+335633 NGP−136156 1 29.3± 7.4 41.9± 8.3 57.5±9.2 23.4± 3.4 29.7±4.6 27.7± 9.8 2012−04−26

SUBMM IMAGING OF ULTRARED GALAXIES 7
Table 1Cont...
IAU name Nickname Band S250 S350 S500 Speak850 S45
850 S60850 Date
flag /mJy /mJy /mJy /mJy /mJy /mJy observeda
HATLAS J130545.8+252953 NGP−136610 1 23.1± 6.2 39.3± 7.7 46.3±8.3 19.4± 3.6 34.6±7.5 29.3± 9.9 2012−07−12HATLAS J130456.6+283711 NGP−158576 1 23.4± 6.3 38.5± 7.7 38.2±8.1 13.1± 4.0 12.0±7.3 15.8± 10.2 2012−04−26HATLAS J130515.8+253057 NGP−168885 1 21.2± 6.0 35.2± 7.7 45.3±8.0 26.5± 3.8 17.8±7.2 4.7± 8.9 2013−03−09HATLAS J131658.1+335457 NGP−172391 1 25.1± 7.1 39.2± 8.1 52.3±9.1 15.4± 3.1 7.2±6.0 5.3± 8.6 2012−04−26HATLAS J125607.2+223046 NGP−185990 1 24.3± 7.0 35.6± 8.1 41.7±8.9 33.6± 4.1 18.4±9.9 13.4± 12.0 2013−03−09HATLAS J133337.6+241541 NGP−190387 1 25.2± 7.2 41.9± 8.0 63.3±8.8 37.4± 3.8 33.4±8.0 29.4± 10.0 2012−04−26HATLAS J125440.7+264925 NGP−206987 1 24.1± 7.1 39.2± 8.2 50.1±8.7 22.7± 3.7 17.5±6.5 25.7± 9.4 2012−04−26HATLAS J134729.9+295630 NGP−239358 1 21.3± 6.6 28.7± 8.1 33.9±8.7 15.2± 5.1 39.5±13.0 61.5± 15.7 2013−03−09HATLAS J133220.4+320308 NGP−242820 2 18.1± 6.1 35.4± 7.9 33.8±8.6 14.7± 3.9 10.5±7.8 −4.6± 9.4 2012−04−26HATLAS J130823.8+244529 NGP−244709 2 23.1± 6.9 34.2± 8.2 34.9±8.7 17.4± 4.0 15.6±9.7 24.0± 11.5 2013−03−09HATLAS J134114.2+335934 NGP−246114 2 17.3± 6.5 30.4± 8.1 33.9±8.5 25.9± 4.6 32.4±8.2 37.2± 8.9 2012−04−26HATLAS J131715.3+323835 NGP−247012 2 10.5± 4.8 25.3± 7.5 31.7±7.7 18.4± 3.9 18.5±8.4 6.4± 8.7 2013−03−09HATLAS J131759.9+260943 NGP−247691 2 16.5± 5.6 26.2± 7.6 33.2±8.2 17.8± 4.2 17.5±8.7 21.2± 13.1 2013−03−09HATLAS J133446.1+301933 NGP−248307 2 10.4± 5.4 28.3± 8.0 35.1±8.3 10.7± 3.7 2.6±7.1 −8.5± 9.1 2012−04−26HATLAS J133919.3+245056 NGP−252305 2 15.3± 6.1 27.7± 8.1 40.0±9.4 24.0± 3.5 23.5±7.6 21.2± 8.7 2012−04−26HATLAS J133356.3+271541 NGP−255731 2 8.4± 5.0 23.6± 7.7 29.5±7.9 24.6± 5.2 31.0±12.4 29.5± 18.4 2013−03−09HATLAS J132731.0+334850 NGP−260332 2 12.2± 5.8 25.1± 8.1 44.4±8.6 10.1± 3.2 15.9±6.0 12.0± 8.8 2012−04−26HATLAS J133251.5+332339 NGP−284357 2 12.6± 5.3 20.4± 7.8 42.4±8.3 28.9± 4.3 27.4±9.9 37.0± 14.4 2013−03−09HATLAS J132419.5+343625 NGP−287896 2 3.4± 5.7 21.8± 8.1 36.4±8.7 18.7± 4.3 −8.7±8.9 −10.7± 11.7 2013−03−09HATLAS J131425.9+240634 NGP−297140 2 15.5± 6.2 21.1± 8.2 36.8±8.6 9.0± 4.3 18.2±9.8 14.5± 10.2 2013−03−09HATLAS J132600.0+231546 NGP−315918 3 8.1± 5.7 15.4± 8.2 41.8±8.8 16.1± 3.9 21.8±8.4 31.7± 11.6 2013−03−09HATLAS J132546.1+300849 NGP−315920 3 17.8± 6.2 16.6± 8.1 39.4±8.6 10.4± 4.3 0.0±10.3 −1.5± 14.2 2013−03−09HATLAS J125433.5+222809 NGP−316031 3 7.0± 5.5 11.4± 8.2 33.2±8.6 16.8± 4.0 14.1±9.3 9.1± 10.9 2013−03−09HATLAS J000124.9−354212 SGP−28124 1 61.6± 7.7 89.1± 8.3 117.7±8.8 37.2± 2.6 46.7±6.0 51.6± 7.8 2012−12−15HATLAS J000124.9−354212 SGP−28124b 1 61.6± 7.7 89.1± 8.3 117.7±8.8 46.9± 1.7 48.4±2.5 55.1± 3.8 2013−04HATLAS J010740.7−282711 SGP−32338 2 16.0± 7.1 33.2± 8.0 63.7±8.7 23.1± 2.9 27.9±9.4 14.3± 10.0 2012−12−17HATLAS J000018.0−333737 SGP−72464 1 43.4± 7.6 67.0± 8.0 72.6±8.9 20.0± 4.2 17.2±8.9 7.5± 8.2 2012−12−15HATLAS J000624.3−323019 SGP−93302 1 31.2± 6.7 60.7± 7.7 61.7±7.8 37.1± 3.7 18.4±9.1 3.6± 8.3 2012−12−19HATLAS J000624.3−323019 SGP−93302b 1 31.2± 6.7 60.7± 7.7 61.7±7.8 35.3± 1.6 31.3±2.3 30.9± 3.7 2013−04HATLAS J001526.4−353738 SGP−135338 1 32.9± 7.3 43.6± 8.1 53.3±8.8 14.7± 3.8 20.8±8.0 17.9± 8.4 2012−12−19HATLAS J223835.6−312009 SGP−156751 1 28.4± 6.9 37.7± 7.9 47.6±8.4 12.6± 2.0 12.0±2.9 12.5± 3.5 2013−04HATLAS J000306.9−330248 SGP−196076 1 28.6± 7.3 28.6± 8.2 46.2±8.6 32.5± 4.1 32.5±9.8 32.2± 11.2 2012−12−15HATLAS J003533.9−280302 SGP−208073 1 28.0± 7.4 33.2± 8.1 44.3±8.5 19.4± 2.9 19.7±4.3 18.9± 6.3 2013−04HATLAS J001223.5−313242 SGP−213813 1 23.9± 6.3 35.1± 7.6 35.9±8.2 18.1± 3.6 18.6±6.9 12.0± 8.9 2012−12−19HATLAS J001635.8−331553 SGP−219197 1 27.6± 7.4 51.3± 8.1 43.6±8.4 12.2± 3.7 15.0±7.5 6.4± 10.1 2012−12−21HATLAS J002455.5−350141 SGP−240731 1 25.1± 7.0 40.2± 8.4 46.1±8.9 1.4± 4.4 −2.7±12.2 −7.8± 10.2 2012−12−21HATLAS J000607.6−322639 SGP−261206 1 22.6± 6.3 45.2± 8.0 59.4±8.4 45.8± 3.5 56.9±8.9 65.1± 12.4 2012−12−18HATLAS J002156.8−334611 SGP−304822 1 23.0± 6.7 40.7± 8.0 41.3±8.7 19.8± 3.8 38.8±8.3 35.1± 9.0 2012−12−21HATLAS J001003.6−300720 SGP−310026 1 23.1± 6.8 33.2± 8.2 42.5±8.7 10.9± 3.8 17.7±7.2 13.5± 8.5 2012−12−15HATLAS J002907.0−294045 SGP−312316 1 20.2± 6.0 29.8± 7.7 37.6±8.0 10.3± 3.5 19.8±7.2 10.5± 8.5 2012−12−19HATLAS J225432.0−323904 SGP−317726 1 20.4± 6.0 35.1± 7.7 39.5±8.0 19.4± 3.2 7.9±5.9 10.5± 7.3 2013−09−01HATLAS J004223.5−334340 SGP−354388 1 26.6± 8.0 39.8± 8.9 53.5±9.8 40.4± 2.4 46.0±5.7 57.5± 7.2 2014−06−30HATLAS J004223.5−334340 SGP−354388b 1 26.6± 8.0 39.8± 8.9 53.5±9.8 38.7± 3.2 39.9±4.7 64.1± 10.9 2013−10HATLAS J004614.1−321826 SGP−380990 2 14.4± 5.9 45.6± 8.2 40.6±8.5 7.7± 1.8 6.8±2.7 7.8± 3.1 2013−01HATLAS J000248.8−313444 SGP−381615 2 19.4± 6.6 39.1± 8.1 34.7±8.5 8.5± 3.6 4.4±6.5 2.5± 7.3 2012−12−15HATLAS J223702.2−340551 SGP−381637 2 18.7± 6.8 41.5± 8.4 49.3±8.6 12.6± 3.7 5.9±6.8 −3.1± 8.3 2013−09−01HATLAS J001022.4−320456 SGP−382394 2 15.7± 5.9 35.6± 8.1 35.9±8.6 8.0± 2.4 3.5±2.9 9.1± 3.9 2012−09HATLAS J230805.9−333600 SGP−383428 2 16.4± 5.6 32.7± 7.9 35.6±8.4 8.2± 2.9 4.3±4.8 7.0± 6.8 2013−08−19HATLAS J222919.2−293731 SGP−385891 2 13.0± 8.2 45.6± 9.8 59.6±11.5 20.5± 3.6 21.6±7.1 11.7± 10.4 2013−09−01HATLAS J231146.6−313518 SGP−386447 2 10.5± 6.0 33.6± 8.4 34.5±8.6 22.4± 3.6 34.3±8.4 29.0± 11.3 2013−08−19HATLAS J003131.1−293122 SGP−392029 2 18.3± 6.5 30.5± 8.3 35.3±8.4 13.8± 3.5 17.4±6.2 20.0± 8.1 2012−12−19HATLAS J230357.0−334506 SGP−424346 2 0.7± 5.9 25.1± 8.3 31.6±8.8 10.5± 3.6 −14.2±5.7 −19.1± 7.6 2013−08−19HATLAS J222737.1−333835 SGP−433089 2 23.8± 9.4 31.5± 9.7 39.5±10.6 14.8± 1.7 15.6±2.9 14.7± 4.1 2012−09HATLAS J225855.7−312405 SGP−499646 3 5.8± 5.9 10.8± 8.1 41.4±8.6 18.7± 3.0 15.2±5.6 11.9± 6.5 2013−08−19HATLAS J222318.1−322204 SGP−499698 3 −7.8± 8.5 14.9± 10.3 57.0±11.6 11.1± 3.7 8.5±7.7 6.4± 10.0 2013−09−01HATLAS J013301.9−330421 SGP−499828 3 5.6± 5.8 13.5± 8.3 36.6±8.9 9.8± 2.6 6.4±4.2 4.2± 5.0 2013−10
aTargets observed with LABOCA have dates in the format YYYY-MM, since data were taken over a number of nights.bTargets observed with both LABOCA and SCUBA-2 (previous row).

8 IVISON ET AL.
r.m.s. noise in a beam-convolved, 9-arcmin2 box centered onthe target, after rejecting outliers. We have ignored the smalldegree of flux boosting anticipated for a method of this kind,since this is mitigated to a large degree by the high probabilityof a single, real submm emitter being found in the small areawe search.
In the second method, we measured flux densities in 45- and60-arcsec-diameter apertures (the former is shown in the Ap-pendix, Figs A1–5, where we adopt the same format used forFig. 3) using theAPER routine in Interactive Data Language(IDL — Landsman 1993), following precisely the recipe out-lined by Dempsey et al. (2013), with a sky annulus between1.5× and 2.0× the aperture radius. The apertures were firstcentered on the brightest peak within a 45-arcsec-diametercircle, centered in turn on the target coordinates. For thismethod, the error was measured using 500 aperture/annuluspairs placed at random across the image.
For the purposes of the redshift determination – describedin the next section – we adopted the flux density measuredin the beam-convolved image unless the measurement in a45-arcsec aperture was at least 3-σpeak
850 larger, following theprocedure outlined by Karim et al. (2013). For NGP-239358,we adopted the peak flux density since examination of the im-age revealed extended emission that we regard as unreliable;for SGP-354388, we adopted the 60-arcsec aperture measure-ment because the submm emission is clearly distributed onthat scale (a fact confirmed by our ALMA 3-mm imaging –Oteo et al. 2016c).
We find that 86% of our sample are detected at SNR>2.5 in the SCUBA-2 and/or LABOCA maps. The medianS500/S250 color of this subset falls from 2.15 to 2.08, whilstthe medianS500/S350 color remains at 1.26. There is no ap-preciable change in either color as SNR increases. We findthat 94, 81 and 75% of theBANDFLAG=1, 2 and 3 subsetshave SNR> 2.5. This reflects the higher reliability ofBAND-FLAG=1 sources, as a result of their detection in all threeSPIRE bands, though the small number (eight) of sourcesinvolved in theBANDFLAG=3 subset means the fraction de-tected is not determined accurately.
4.2. Photometric redshifts
Broadly speaking, two approaches have been used to mea-sure the redshifts of galaxies via the shape of their far-IR/submm SEDs, and to determine the uncertainty associatedwith those measurements. One method uses a library of tem-plate SEDs, following Aretxaga et al. (2003); the other usesasingle template SED, chosen to be representative, as proposedby Lapi et al. (2011), Pearson et al. (2013) and others.
For the first method, the distribution of measured redshiftsand their associated uncertainties are governed by the choiceof template SEDs, where adopting a broad range of SEDsmakes more sense in some situations than in others. Blindlyemploying the second method offers less understanding of thepotential systematics and uncertainties.
To characterize the systematics and overall uncertainties,we adopt seven well-sampled SEDs, all potentially represen-tative of distant DSFGs: those for HFLS3, Arp 220, whichare both relatively blue for DSFGs, plus those for the CosmicEyelash and G15.141, as well as synthesized templates fromPope et al. (2008), Pearson et al. (2013) and Swinbank et al.(2014, ALESS) – see Fig. 4. The Pearson et al. template wassynthesised from 40 bright H-ATLAS sources with known
ALESSArp220
EyelashG15.141
HFLS3Pearson+13
Pope+08
101 102 103
λrest / µm
10-4
10-3
10-2
10-1
100
S ν [n
orm
aliz
ed a
t 100
µm
]
Figure 4. The SED templates used here to determine photometric redshifts,normalized in flux density at 100-µm. The HFLS3 and Arp 220 SEDs are rel-atively blue for typical DSFGs, giving us a range of plausibly representativetemplates.
spectroscopic29 redshifts and comprises two modified Planckfunctions, Thot = 46.9 K and Tcold = 23.9 K, where the fre-quency dependence of the dust emissivity,β, is set to +2,and the ratio of cold to hot dust masses is 30.1:1. Thelensed source, G15.141, is modelled using two greybodieswith parameters taken from Lapi et al. (2011),Thot = 60 K andTcold = 32 K, β = +2 and the ratio of cold to hot dust massesof 50:1. Fig. 4 shows the diversity of these SEDs in the restframe, normalized in flux density at 100µm.
4.2.1. Training
Before we use these SED templates to determine the red-shifts of our ultrared DSFGs, we want to estimate any system-atic redshift uncertainties and reject any unsuitable templates,thereby ‘training’ our technique. To accomplish this, the SEDtemplates were fitted to the available photometry for 69 brightDSFGs with SPIRE (S250,S350,S500) and S870 photometricmeasurements, the latter typically from the SubmillimeterAr-ray (Bussmann et al. 2013), and spectroscopic redshifts de-termined via detections of CO using broadband spectrome-ters (e.g. Weiß et al. 2013; Riechers et al. 2013; Asboth et al.2016; Strandet et al. 2016). We used accurate filter transmis-sion profiles in each case, searching for minima in theχ2 dis-tribution over 0< zphot< 10, ignoring possible contaminationof the various filters passbands by bright spectral lines30 suchas [CII ] (Smail et al. 2011).
The differences between photometric redshifts estimated inthis way and the measured spectroscopic redshifts for these69 bright DSFGs were quantified using the property (zphot−zspec)/(1+ zspec), or∆z/(1+ zspec) hereafter.
Fig. 5 shows the outcome when our seven SED templatesare used to determine photometric redshifts for the 69 brightDSFGs with spectroscopic redshifts. We might have expectedthat the Pearson et al. template would yield the most accurate
29 It is worth noting a subtle circularity here, in that around half of thesebright sources were selected as targets for broadband spectroscopic observa-tions, e.g. with the Zpectrometer on the Green Bank Telescope (Frayer et al.2011; Harris et al. 2012) on the basis of rough photometric estimates of theirredshifts. The resulting bias will be modest, but extreme SEDs may not befully represented.
30 With the detection of several galaxies in [CII ] (e.g. Oteo et al. 2016d),we are closer to being able to quantify the effect of line emission on photo-metric redshift estimates.

SUBMM IMAGING OF ULTRARED GALAXIES 9
µ1/2 = − 0.076µ = − 0.060σ = 0.161
ALESS
HerMESSPTH-ATLAS
-1
0
+1
∆ z
/ (1
+ z
spe
c)
µ1/2 = + 0.145µ = + 0.185σ = 0.227
Arp220
HerMESSPTH-ATLAS
-1
0
+1
∆ z
/ (1
+ z
spe
c)
µ1/2 = − 0.072µ = − 0.071σ = 0.153
Linear fitEyelash
HerMESSPTH-ATLAS
-1
0
+1
∆ z
/ (1
+ z
spe
c)
µ1/2 = + 0.072µ = + 0.116σ = 0.197
G15.141
HerMESSPTH-ATLAS
-1
0
+1
∆ z
/ (1
+ z
spe
c)
µ1/2 = + 0.207µ = + 0.206σ = 0.194
HFLS3
HerMESSPTH-ATLAS
-1
0
+1
∆ z
/ (1
+ z
spe
c)
µ1/2 = − 0.104µ = − 0.054σ = 0.187
Pearson+13
HerMESSPTH-ATLAS
-1
0
+1
∆ z
/ (1
+ z
spe
c)
µ1/2 = − 0.003µ = − 0.003σ = 0.174
0 5 10 15 20Frequency
Pope+08
HerMESSPTH-ATLAS
1 2 3 4 5 6z
spec
-1
0
+1
∆ z
/ (1
+ z
spe
c)
Figure 5. Difference, (zphot − zspec)/(1 + zspec) or ∆z/(1+ zspec), as a func-tion of zspec, between photometric redshifts determined using the SED tem-plates shown in Fig. 4 and the spectroscopic redshifts,zspec, determined viadetections of CO using broadband spectrometers for 69 bright DSFGs. Weemployed the available SPIRE photometric measurements andall additionalphotometry out to 1 mm, as tabulated by Ivison et al. (2010); Riechers et al.(2013); Robson et al. (2014); Bussmann et al. (2013); Weiß etal. (2013);Asboth et al. (2016) and Strandet et al. (2016). Approximately the sametrend can be seen in each panel. A linear fit of the form∆z/(1 + zspec) ∝−0.059× zspec, which is typical, is shown in the Cosmic Eyelash panel. Thestatistics noted in each panel illustrate the systematic underestimates or over-estimates ofzphot found using the relevant SED templates, and the degree ofscatter. It is worth noting that the redshifts of the templates are recoveredaccurately, showing that the process works well, e.g. in theHFLS3 panel,HFLS3 itself can be seen atz = 6.3 with ∆z/(1 + zspec) = 0. The outlier atz∼ 2 is discussed in §4.2.2. On the basis of these statistics we discontinueusing the Arp 220, G15.141, HFLS3 and Pearson et al. templateSEDs infuture analyses.
µ1/2 = − 0.024µ = − 0.031σ = 0.141
ALESS
HerMESSPTH-ATLAS
-1
0
+1
∆ z / (1 +
z spec
)
µ1/2 = − 0.063µ = − 0.059σ = 0.131
Eyelash
HerMESSPTH-ATLAS
-1
0
+1
∆ z / (1 +
z spec
)
µ1/2 = + 0.018µ = + 0.021σ = 0.143
Pope+08
HerMESSPTH-ATLAS
-1
0
+1
∆ z / (1 +
z spec
)µ1/2 = − 0.024µ = − 0.027σ = 0.140
0 5Frequency
HerMESSPTH-ATLAS
Best χ 2
3 4 5 6z
spec
-1
0
+1
∆ z
/ (1
+ z
spe
c)
Figure 6. Difference,∆z/(1+ zspec), as a function ofzspec, between photo-metric redshifts determined using the three SEDs shown to bethe most ef-fective templates in Fig. 5 and the spectroscopic redshifts, zspec, determinedvia detections of CO using broadband spectrometers for 25 ultrared DSFGsthat match the color requirements of our sample here, drawn from this pa-per, from Weiß et al. (2013), Riechers et al. (2013), Asboth et al. (2016) andStrandet et al. (2016). As in Fig. 5, we employed the available SPIRE photo-metric measurements and all additional photometry out to 1 mm. The statis-tics noted in each panel show that the systematic underestimates or overes-timates ofzphot found using the relevant SED templates are small, as is thescatter. The lower panel shows∆z/(1+ zspec) for the template that yields thelowestχ2 for each ultrared DSFG, this being the approach we adopt hereafterto determine the redshift distribution of our full sample. The scatter in thislower panel represents the minimum systematic uncertaintyin photometricredshift since these sources typically have higher S/N photometry than ourfaint, ultrared DSFG candidates.
redshifts for this sample, given that it was synthesized usingmany of these same galaxies, but seemingly the inclusion ofgalaxies with optical spectroscopic redshifts during its con-struction has resulted in a slightly redder SED31 than the aver-age for those DSFGs with CO spectroscopic redshifts, result-ing in mean and median offsets,µ= −0.062 andµ1/2 = −0.116,with an r.m.s. scatter,σ = 0.187. While the Pearson et al. tem-plate fares better than those of Arp 220, G15.141 and HFLS3,which have both higher offsets and higher scatter, as wellas a considerable fraction of outliers (defined as those with|∆z/(1+ zspec)| > 0.3), at this stage we discontinued usingthese four SEDs in the remainder of our analysis. We retainedthe three SED templates with|µ1/2|< 0.1 and fewer than 10%outliers for the following important sanity check.
4.2.2. Sanity check
31 This may be due to blending or lensing, or both, where the galaxy withthe spectroscopic redshift may be just one of a number of contributors to thefar-IR flux density.
10 IVISON ET AL.
For this last test we employed the 25 ultrared DSFGsthat match the color requirements32 of our ultrared sample.Their spectroscopic redshifts have been determined via de-tections of CO using broadband spectrometers, typically the3-mm receivers at ALMA and NOEMA, drawn partly fromthe sample in this paper (see Fudamoto et al. 2016, for thespectroscopic follow-up) but mainly from from the litera-ture (Cox et al. 2011; Weiß et al. 2013; Riechers et al. 2013;Asboth et al. 2016; Strandet et al. 2016).
Without altering our redshift-fitting procedure, we em-ployed the available SPIRE photometric measurements to-gether with all additional photometry out to 1 mm. For eachsource we noted the redshift and the template with the bestχ2. Fig. 6 shows∆z/(1+ zspec) as a function ofzspecand wecan see that the Cosmic Eyelash and the synthesized templatesfrom Swinbank et al. (ALESS) and Pope et al. have excellentpredictive capabilities, with|µ1/2| <∼ 0.06 andσ ∼ 0.14.
The lower panel of Fig. 6 shows∆z/(1+ zspec) versuszspec
for the SED template that yields the bestχ2 for each ultra-red DSFG, whereµ1/2 = −0.024. The scatter seen in thisplot is representative of the minimum systematic uncertaintyin determining photometric redshifts for ultrared galaxies,σ ∼ 0.14, given that the photometry for these brighter sourcestends to be of a relatively high quality. Despite a marginallyhigher scatter than the best individual SED templates, weadopt the photometric redshifts with the lowestχ2 valueshereafter.
4.2.3. The effect of the CMB
We have quantified the well-known effect of the CMB onthe SED shape (da Cunha et al. 2013; Zhang et al. 2016) byusing a dual-greybody 30K + 60K parameterization of theCosmic Eyelash – the prescription of Ivison et al. (2010). Atz= 2.3, the Cosmic Eyelash is affected negligably by the CMBeffect – of the two greybodies, the coolest is affected most,and it changes by just∼ 4 mK compared withz = 0. Wetherefore ignore this and modify the parameterizedz = 2.3SED to account for the effect of the CMB at progressivelyhigher redshifts, then fit the unmodified Cosmic Eyelash SEDto monochromatic flux densities drawn from these modifiedSEDs atλobs = 250, 350, 500 and 870µm. The CMB effectcauses us to underestimate (1+z) by 0.03, 0.05, 0.10 and 0.18at z = 4, 6, 8 and 10. Thus, the effect is small, even at thehighest plausible redshifts; moreover, since the effect biasesour redshifts to lower values, our estimate of the space densityof ultrared DSFGs atz> 4 presented in §4.3 will be biasedlower rather than higher.
4.2.4. Redshift trends
As an aside, a trend — approximately the same trendin each case — can be seen in each panel of Figs 5–6,with ∆z/(1 + zspec) decreasing numerically with increasingredshift. The relationship takes the form∆z/(1 + zspec) ∝−0.059+0.016
−0.014× zspec for the Cosmic Eyelash, and a consistenttrend is seen for the other SED templates. Were we to cor-rect for this trend, the typical scatter in∆z/(1+ zspec) wouldfall to ∼ 0.10. This effect is much stronger than can be as-cribed to the influence of the CMB and betrays a link betweenredshift andTdust, which in turn may be related to the rela-tionship between redshift andLIR seen by Symeonidis et al.
32 Although 26 DSFGs meet our color-selection criteria, we do not includethe extreme outlier, SPT 0452−50, which has∆z/(1+ zspec) = 0.66,0.61 and0.75 for the ALESS, Eyelash and Pope+08 template SEDs, respectively.
(2013), though disentangling the complex relationships be-tweenTdust, Mdust, LIR, starburst size and redshift is extraor-dinarily challenging, even if the cross-section to gravitationallensing were constant with distance, which it is not (see §4.3).By considering a greybody at the temperature of each of thetemplates in our library, we can deduce that an offset betweenthe photometric and spectroscopic redshifts corresponds to achange in dust temperature of
∆Tdust= Tgreydust
(
1+ zphot
1+ zspec− 1
)
, (1)
where∆Tdust is difference between the dust temperature ofthe source and the temperature of the template SED,TSED
dust .Using the offset between the photometric and spectroscopicredshifts for the Cosmic Eyelash template, we estimate thatthe typical dust temperature of the sources in our samplebecomes warmer on average by 9.4+4.8
−3.3 K as we move fromz = 2 (−0.7K) to z = 6 (+8.7K). We find consistent re-sults for the Pope et al. and ALESS template SEDs, where∆Tdust= 7.5+4.0
−3.1 K and 7.1+3.9−3.0 K, respectively. We do not repro-
duce the drop of 10K between low and high redshift reportedby Symeonidis et al. (2013) — quite the reverse, in fact. Thismay be related to the higher fraction of gravitationally lensed(and thus intrisically less luminous) galaxies expected inthebright sample we have used here to calibrate and test our pho-tometric redshift technique (§4.3). As with the CMB effect,the observed evolution in temperature with redshift predom-inantly biases our photometric redshifts to lower values, re-inforcing the conservative nature of our estimate of the spacedensity of ultrared DSFGs atz> 4.
It is also worth noting that the correlation betweenLIR andredshift – discussed later in §4.2.6 and probably due in parttothe higher flux density limits atz> 5 – may mean that opticaldepth effects become more influential at the highest redshifts,with consequences for the evolution of DSFG SEDs that aredifficult to predict.
4.2.5. Ultimate test of zphot reliability
Finally, we employed the refined SED fitting procedure out-lined above to determine the redshift distribution of our fullsample of ultrared DSFGs.
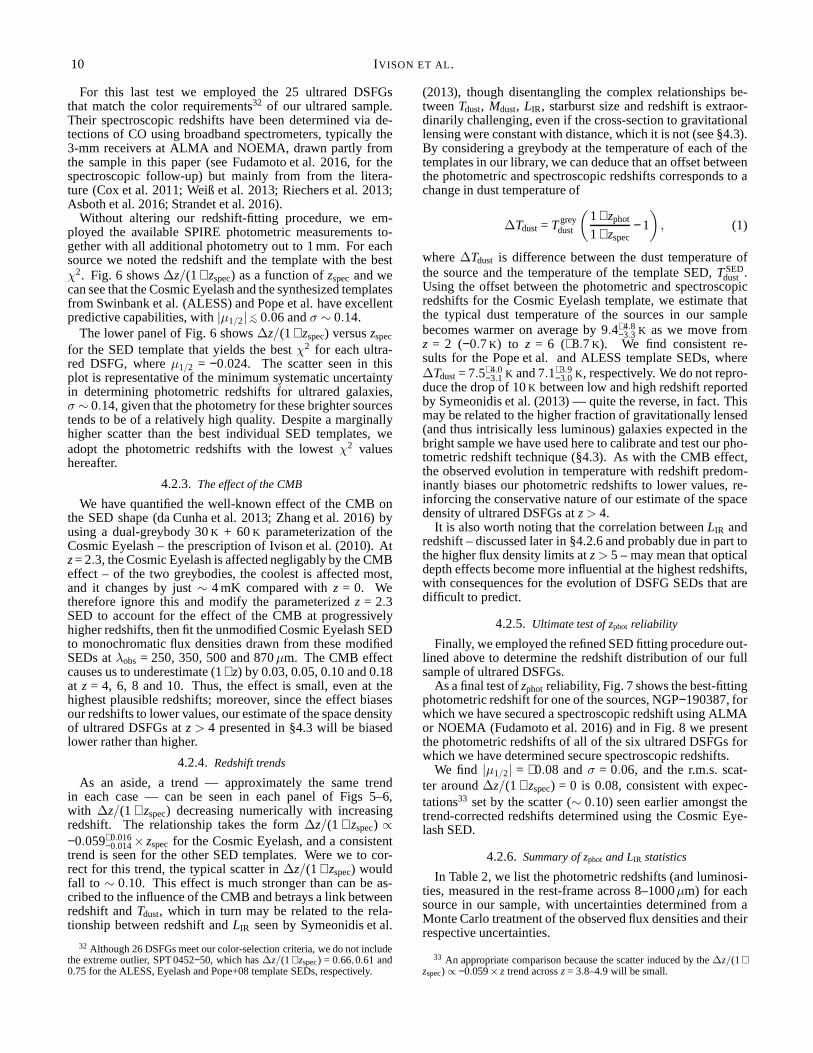
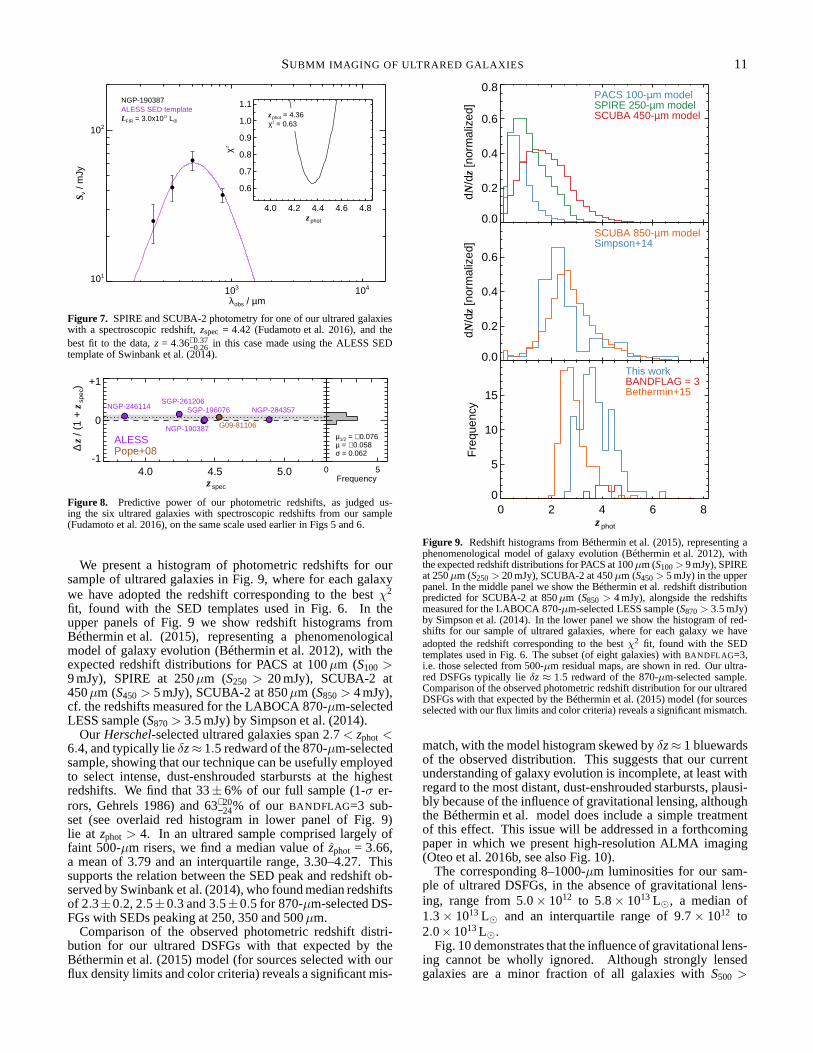
As a final test ofzphot reliability, Fig. 7 shows the best-fittingphotometric redshift for one of the sources, NGP−190387, forwhich we have secured a spectroscopic redshift using ALMAor NOEMA (Fudamoto et al. 2016) and in Fig. 8 we presentthe photometric redshifts of all of the six ultrared DSFGs forwhich we have determined secure spectroscopic redshifts.
We find |µ1/2| = +0.08 andσ = 0.06, and the r.m.s. scat-ter around∆z/(1+ zspec) = 0 is 0.08, consistent with expec-tations33 set by the scatter (∼ 0.10) seen earlier amongst thetrend-corrected redshifts determined using the Cosmic Eye-lash SED.
4.2.6. Summary of zphot and LIR statistics
In Table 2, we list the photometric redshifts (and luminosi-ties, measured in the rest-frame across 8–1000µm) for eachsource in our sample, with uncertainties determined from aMonte Carlo treatment of the observed flux densities and theirrespective uncertainties.
33 An appropriate comparison because the scatter induced by the∆z/(1+zspec) ∝ −0.059× z trend acrossz= 3.8–4.9 will be small.
SUBMM IMAGING OF ULTRARED GALAXIES 11
1000 1000010
100
NGP-190387ALESS SED templateLFIR = 3.0x10¹³ L
O •
103 104
λobs / µm
101
102
S ν /
mJy
4.0 4.2 4.4 4.6 4.8
0.6
0.7
0.8
0.9
1.0
1.1
z
phot = 4.36χ2 = 0.63z
phot = 4.36χ2 = 0.63
4.0 4.2 4.4 4.6 4.8z
phot
0.6
0.7
0.8
0.9
1.0
1.1
χ2
Figure 7. SPIRE and SCUBA-2 photometry for one of our ultrared galaxieswith a spectroscopic redshift,zspec = 4.42 (Fudamoto et al. 2016), and thebest fit to the data,z = 4.36+0.37
−0.26 in this case made using the ALESS SEDtemplate of Swinbank et al. (2014).
µ1/2 = + 0.076µ = + 0.058σ = 0.062
0 5Frequency
NGP-190387
NGP-246114
G09-81106
NGP-284357SGP-196076SGP-261206
ALESSPope+08
4.0 4.5 5.0z
spec
-1
0
+1
∆ z
/ (1
+ z
spe
c)
Figure 8. Predictive power of our photometric redshifts, as judged us-ing the six ultrared galaxies with spectroscopic redshiftsfrom our sample(Fudamoto et al. 2016), on the same scale used earlier in Figs5 and 6.
We present a histogram of photometric redshifts for oursample of ultrared galaxies in Fig. 9, where for each galaxywe have adopted the redshift corresponding to the bestχ2
fit, found with the SED templates used in Fig. 6. In theupper panels of Fig. 9 we show redshift histograms fromBéthermin et al. (2015), representing a phenomenologicalmodel of galaxy evolution (Béthermin et al. 2012), with theexpected redshift distributions for PACS at 100µm (S100 >9 mJy), SPIRE at 250µm (S250 > 20 mJy), SCUBA-2 at450µm (S450> 5 mJy), SCUBA-2 at 850µm (S850> 4 mJy),cf. the redshifts measured for the LABOCA 870-µm-selectedLESS sample (S870> 3.5 mJy) by Simpson et al. (2014).
Our Herschel-selected ultrared galaxies span 2.7< zphot <6.4, and typically lieδz≈ 1.5 redward of the 870-µm-selectedsample, showing that our technique can be usefully employedto select intense, dust-enshrouded starbursts at the highestredshifts. We find that 33± 6% of our full sample (1-σ er-rors, Gehrels 1986) and 63+20
−24% of our BANDFLAG=3 sub-set (see overlaid red histogram in lower panel of Fig. 9)lie at zphot > 4. In an ultrared sample comprised largely offaint 500-µm risers, we find a median value ofzphot = 3.66,a mean of 3.79 and an interquartile range, 3.30–4.27. Thissupports the relation between the SED peak and redshift ob-served by Swinbank et al. (2014), who found median redshiftsof 2.3±0.2, 2.5±0.3 and 3.5±0.5 for 870-µm-selected DS-FGs with SEDs peaking at 250, 350 and 500µm.
Comparison of the observed photometric redshift distri-bution for our ultrared DSFGs with that expected by theBéthermin et al. (2015) model (for sources selected with ourflux density limits and color criteria) reveals a significantmis-
PACS 100-µm modelSPIRE 250-µm modelSCUBA 450-µm model
0.0
0.2
0.4
0.6
0.8
dN/d
z [n
orm
aliz
ed]
SCUBA 850-µm modelSimpson+14
0.0
0.2
0.4
0.6
dN/d
z [n
orm
aliz
ed]
0 2 4 6 8z
phot
0
5
10
15
Fre
quen
cy
This workBANDFLAG = 3Bethermin+15
Figure 9. Redshift histograms from Béthermin et al. (2015), representing aphenomenological model of galaxy evolution (Béthermin et al. 2012), withthe expected redshift distributions for PACS at 100µm (S100> 9 mJy), SPIREat 250µm (S250> 20 mJy), SCUBA-2 at 450µm (S450> 5 mJy) in the upperpanel. In the middle panel we show the Béthermin et al. redshift distributionpredicted for SCUBA-2 at 850µm (S850 > 4 mJy), alongside the redshiftsmeasured for the LABOCA 870-µm-selected LESS sample (S870> 3.5 mJy)by Simpson et al. (2014). In the lower panel we show the histogram of red-shifts for our sample of ultrared galaxies, where for each galaxy we haveadopted the redshift corresponding to the bestχ2 fit, found with the SEDtemplates used in Fig. 6. The subset (of eight galaxies) withBANDFLAG=3,i.e. those selected from 500-µm residual maps, are shown in red. Our ultra-red DSFGs typically lieδz ≈ 1.5 redward of the 870-µm-selected sample.Comparison of the observed photometric redshift distribution for our ultraredDSFGs with that expected by the Béthermin et al. (2015) model(for sourcesselected with our flux limits and color criteria) reveals a significant mismatch.
match, with the model histogram skewed byδz≈ 1 bluewardsof the observed distribution. This suggests that our currentunderstanding of galaxy evolution is incomplete, at least withregard to the most distant, dust-enshrouded starbursts, plausi-bly because of the influence of gravitational lensing, althoughthe Béthermin et al. model does include a simple treatmentof this effect. This issue will be addressed in a forthcomingpaper in which we present high-resolution ALMA imaging(Oteo et al. 2016b, see also Fig. 10).
The corresponding 8–1000-µm luminosities for our sam-ple of ultrared DSFGs, in the absence of gravitational lens-ing, range from 5.0× 10¹² to 5.8× 10¹³ L⊙, a median of1.3× 1013 L⊙ and an interquartile range of 9.7× 10¹² to2.0×1013L⊙.
Fig. 10 demonstrates that the influence of gravitational lens-ing cannot be wholly ignored. Although strongly lensedgalaxies are a minor fraction of all galaxies withS500 >

12 IVISON ET AL.
Table 2Targets and their photometric redshift properties.
Nickname z log10 (LFIR) Nickname z log10 (LFIR)G09-47693 3.12+0.39
−0.33 13.01+0.14−0.07 NGP-136610 4.27+0.51
−0.51 13.40+0.09−0.12
G09-51190 3.83+0.58−0.48 13.31+0.11
−0.12 NGP-158576 3.15+0.36−0.29 13.00+0.12
−0.07
G09-59393 3.70+0.35−0.26 13.28+0.05
−0.09 NGP-168885 4.09+0.42−0.30 13.32+0.06
−0.08
G09-62610 3.70+0.44−0.26 13.15+0.13
−0.06 NGP-172391 3.27+0.34−0.26 13.08+0.09
−0.06
G09-64889 3.48+0.48−0.40 13.10+0.09
−0.14 NGP-185990 4.47+0.49−0.37 13.42+0.06
−0.06
G09-79552 3.59+0.34−0.26 13.11+0.09
−0.06 NGP-190387 4.36+0.37−0.26 13.49+0.05
−0.06
G09-79553 3.66+0.39−0.30 13.08+0.11
−0.07 NGP-206987 4.07+0.06−0.60 13.31+0.02
−0.13
G09-80620 4.01+0.22−0.78 13.07+0.06
−0.19 NGP-239358 3.47+0.52−0.49 13.09+0.10
−0.15
G09-80658 4.07+0.09−0.72 13.20+0.03
−0.17 NGP-242820 3.41+0.44−0.30 13.02+0.13
−0.06
G09-81106 4.95+0.13−0.73 13.43+0.04
−0.13 NGP-244709 3.48+0.42−0.40 13.14+0.07
−0.12
G09-81271 4.62+0.46−0.38 13.39+0.05
−0.09 NGP-246114 4.35+0.51−0.46 13.30+0.08
−0.10
G09-83017 3.99+0.53−0.34 13.09+0.12
−0.08 NGP-247012 4.59+0.16−0.71 13.21+0.04
−0.16
G09-83808 5.66+0.06−0.76 13.51+0.02
−0.11 NGP-247691 3.90+0.51−0.45 13.15+0.08
−0.13
G09-84477 2.94+0.44−0.39 12.83+0.15
−0.09 NGP-248307 3.59+0.36−0.36 12.96+0.10
−0.10
G09-87123 4.28+0.52−0.34 13.17+0.12
−0.06 NGP-252305 4.34+0.43−0.38 13.29+0.06
−0.09
G09-100369 3.79+0.61−0.46 13.05+0.09
−0.13 NGP-255731 4.94+0.73−0.66 13.30+0.09
−0.15
G09-101355 4.20+0.70−0.39 13.03+0.16
−0.08 NGP-260332 3.50+0.38−0.29 12.96+0.10
−0.08
G12-34009 4.53+0.37−0.31 13.51+0.05
−0.06 NGP-284357 4.99+0.44−0.45 13.40+0.05
−0.10
G12-42911 4.33+0.31−0.26 13.45+0.05
−0.07 NGP-287896 4.54+0.53−0.37 13.15+0.10
−0.09
G12-66356 3.66+0.19−0.72 13.04+0.06
−0.19 NGP-297140 3.41+0.57−0.44 12.91+0.15
−0.11
G12-77450 3.53+0.46−0.31 12.99+0.14
−0.07 NGP-315918 4.32+0.54−0.33 13.10+0.11
−0.07
G12-78339 4.41+0.98−0.70 13.31+0.17
−0.18 NGP-315920 3.88+0.33−0.89 13.05+0.07
−0.21
G12-78868 3.58+0.34−0.26 13.04+0.08
−0.08 NGP-316031 4.65+0.68−0.47 13.10+0.13
−0.07
G12-79192 2.95+0.38−0.36 12.80+0.12
−0.12 SGP-28124 3.93+0.08−0.45 13.65+0.02
−0.09
G12-79248 6.43+0.81−0.89 13.76+0.11
−0.14 SGP-28124* 3.80+0.02−0.42 13.61+0.00
−0.11
G12-80302 3.06+0.39−0.35 12.83+0.12
−0.10 SGP-72464 3.06+0.21−0.19 13.23+0.07
−0.05
G12-81658 2.93+0.38−0.42 12.77+0.12
−0.14 SGP-93302 3.91+0.27−0.22 13.46+0.04
−0.07
G12-85249 2.87+0.37−0.36 12.70+0.11
−0.12 SGP-93302* 3.79+0.24−0.21 13.43+0.04
−0.07
G12-87169 3.26+0.51−0.39 12.85+0.13
−0.12 SGP-135338 3.06+0.33−0.26 13.08+0.11
−0.04
G12-87695 3.68+0.58−0.53 13.09+0.09
−0.14 SGP-156751 2.93+0.24−0.22 12.97+0.08
−0.04
G15-21998 2.91+0.20−0.19 13.10+0.06
−0.05 SGP-196076 4.51+0.47−0.39 13.42+0.07
−0.06
G15-24822 2.77+0.27−0.27 12.97+0.09
−0.08 SGP-208073 3.48+0.40−0.28 13.18+0.06
−0.08
G15-26675 4.36+0.25−0.21 13.55+0.04
−0.05 SGP-213813 3.49+0.40−0.32 13.15+0.07
−0.10
G15-47828 3.52+0.50−0.39 13.20+0.09
−0.11 SGP-219197 2.94+0.25−0.24 13.03+0.08
−0.07
G15-64467 3.75+0.55−0.49 13.15+0.09
−0.14 SGP-240731 2.70+0.27−0.25 12.88+0.10
−0.09
G15-66874 4.07+0.57−0.49 13.30+0.10
−0.11 SGP-261206 5.03+0.58−0.47 13.64+0.09
−0.10
G15-82412 3.96+0.15−0.70 13.20+0.04
−0.16 SGP-304822 4.33+0.63−0.51 13.41+0.12
−0.12
G15-82684 3.65+0.38−0.25 13.13+0.11
−0.06 SGP-310026 3.12+0.38−0.31 12.97+0.12
−0.07
G15-83543 3.53+0.42−0.34 13.05+0.12
−0.09 SGP-312316 3.17+0.41−0.32 12.94+0.12
−0.08
G15-83702 3.27+0.39−0.36 12.90+0.12
−0.12 SGP-317726 3.69+0.39−0.30 13.20+0.06
−0.10
G15-84546 4.34+0.56−0.53 13.19+0.10
−0.14 SGP-354388 5.35+0.56−0.52 13.68+0.08
−0.08
G15-85113 3.40+0.37−0.34 12.90+0.09
−0.11 SGP-354388* 5.43+0.84−0.72 13.69+0.12
−0.13
G15-85592 3.39+0.49−0.39 12.89+0.15
−0.13 SGP-32338 3.93+0.26−0.24 13.24+0.05
−0.04
G15-86652 3.43+0.44−0.35 12.97+0.11
−0.09 SGP-380990 2.84+0.22−0.21 12.84+0.06
−0.07
G15-93387 3.24+0.50−0.33 12.87+0.12
−0.08 SGP-381615 2.98+0.29−0.29 12.91+0.09
−0.09
G15-99748 3.98+0.25−0.79 13.06+0.05
−0.20 SGP-381637 3.30+0.28−0.25 13.06+0.08
−0.07
G15-105504 3.43+0.64−0.53 12.87+0.16
−0.13 SGP-382394 2.96+0.29−0.26 12.84+0.08
−0.08
NGP-63663 3.08+0.23−0.22 13.11+0.08
−0.06 SGP-383428 3.08+0.33−0.30 12.88+0.10
−0.09
NGP-82853 3.66+0.06−0.61 13.17+0.02
−0.15 SGP-385891 3.70+0.29−0.24 13.20+0.07
−0.06
NGP-101333 3.53+0.34−0.27 13.30+0.06
−0.09 SGP-386447 4.89+0.78−0.73 13.41+0.13
−0.17
NGP-101432 3.65+0.36−0.28 13.31+0.05
−0.10 SGP-392029 3.42+0.47−0.32 13.00+0.13
−0.06
NGP-111912 3.27+0.36−0.26 13.09+0.10
−0.06 SGP-424346 3.99+0.45−0.39 12.95+0.10
−0.10
NGP-113609 3.43+0.34−0.20 13.22+0.09
−0.04 SGP-433089 3.60+0.08−0.62 13.11+0.01
−0.13
NGP-126191 4.33+0.45−0.46 13.37+0.07
−0.08 SGP-499646 4.68+0.49−0.34 13.14+0.10
−0.05
NGP-134174 2.98+0.34−0.31 12.98+0.12
−0.07 SGP-499698 4.22+0.39−0.38 13.00+0.09
−0.11
NGP-136156 3.95+0.06−0.57 13.33+0.01
−0.12 SGP-499828 3.88+0.49−0.41 12.88+0.10
−0.09
30mJy, they become more common atz> 4 due to the com-bined effect of the increase with redshift of the optical depthto lensing and the magnification bias. This will be addressedin a forthcoming paper, in which we present high-resolutionALMA imaging (Oteo et al. 2016b).
In Fig. 11 we show how the 8–1000-µm luminosities ofour ultrared DSFGs behave as a function of redshift, to helpexplain the shape of our redshift distribution, and any biases.TheS500> 30-mJy detection limit for our three best SED tem-
Figure 10. Redshift distribution ofS500 > 30-mJy sources from the phys-ical model of Cai et al. (2013) which provides a good fit to a broad varietyof data, including the IR luminosity functions determined observationally byGruppioni et al. (2013) at several redshifts up toz ∼ 4 (see also Figure 1of Bonato et al. 2014). The dot-dashed green histogram and the dot-dashedorange histogram show the contributions of strongly lensed(magnification,µ≥ 2) and unlensed galaxies, respectively, while the black histogram showsthe total. The distribution of lensed galaxies was computedusing the SISSAmodel (Lapi et al. 2012). Although strongly lensed galaxiesare a minor frac-tion of all galaxies withS500> 30mJy, they become common atz> 4 due tothe combined effect of the increase with redshift of the optical depth to lens-ing and the magnification bias. This will be addressed in a forthcoming paper,in which we present high-resolution ALMA imaging (Oteo et al. 2016b).
L
FIR with template SEDsat 500-µm detection limitALESSEyelashPope+08
L
FIR ∝ (1 + z)4
BANDFLAG = 1BANDFLAG = 2BANDFLAG = 3
2 3 4 5 6 7z phot
1013
1014
L F
IR /
L O •
Figure 11. LIR as a function ofzphot for our sample, color-coded byBAND-FLAG, with theS500> 30-mJy detection limits shown for our three best SEDtemplates, and luminosity evolution of the form∝ (1+z)4 illustrated. We seethat theBANDFLAG = 1, 2 and 3 galaxies lie in distinct regions, as one mightexpect. The least luminous galaxies at any redshift are those detected only inthe 500-µm filter, since in the SPIRE maps with the lowest spatial resolutionthey suffer considerably more flux boosting and blending. The growing gapbetween the galaxies and the expected detection limits atz> 5 is potentiallyinteresting.
plates are shown, as well as luminosity evolution of the form(1+z)4, scaled arbitrarily. The differentBANDFLAG categoriesseparate from one another, as one might expect, where theleast luminous galaxies at any redshift are those detected onlyin the 500-µm filter, having suffered considerably more fluxboosting34 and blending in the SPIRE maps with the lowest
34 BANDFLAG = 1 and 2 sources are extremely unlikely to coincide with

SUBMM IMAGING OF ULTRARED GALAXIES 13
spatial resolution. The growing gap between the ultrared DS-FGs and the expected detection limits atz> 5 is potentiallyinteresting, possibly reflecting the relatively low numberofBANDFLAG = 3 sources in our sample and the growing influ-ence of multi-band detections at the highest redshifts.
4.3. The space density of distant DSFGs
With photometric redshift estimates for each of the sourcesin our sample we can now set a lower limit on the space den-sity, ρ, of S500> 30-mJy ultrared DSFGs that lie atz> 4. Assummarised in S4.2.6, we find that 33±6% of the sources inour sample lie in the range 4< z< 6 and the space density ofthese DSFGs is
ρ =Nz
CVobs×
tobs
tburstMpc−3, (2)
whereNz represents the number of sources within 4< z< 6,Vobs is the comoving volume contained within the redshiftrange considered,tobs/tburst is a duty-cycle correction, sincethe ongoing, obscured starburst in DSFGs has a finite du-ration, wheretburst≈ 100 Myr is in agreement with their ex-pected gas depletion times (Ivison et al. 2011; Bothwell et al.2013) but is uncertain at the≈ 2× level. C is the complete-ness correction required for our sample, as discussed at lengthin §2.3–2.4. Vobs is the comoving volume contained within4< z< 6, given by
Vobs=4π3
∫ z=6
z=4
c/H0√
ΩM(1+ z′)3 +ΩV
dz′ Mpc3 (3)
(Hogg 1999), which we scale by the fractional area of sky thatwas surveyed,≈ 600 deg2, or≈ 1.5%.
Applying these corrections we estimate that ultrared, DS-FGs atz> 4 have a space density of≈ 6×10⁻⁷ Mpc−3. Ourwork represents the first direct measurement of the space den-sity of z> 4 DSFGs at such faint flux-density limits and assuch it is not possible to make a direct comparison with previ-ous studies in the literature. For example, Asboth et al. (2016)recently presented the number counts of ultrared, 500–µm–selected DSFGs, identified in the 274-deg2 HerMES LargeMode Survey (HELMS). However, the Asboth et al. galax-ies are considerably brighter than ours, meaning a significantfraction will be gravitationally lensed, and they lack redshiftestimates, so it is impossible to judge meaningfully whethertheir source density is consistent with the results presentedhere.
4.4. Relationship of DSFGs with other galaxy populations
It has been suggested by a number of authors (e.g.Simpson et al. 2014; Toft et al. 2014; Ikarashi et al. 2015) thathigh-redshift DSFGs may be the progenitors of the populationof massive, quiescent galaxies that have been uncovered innear-IR surveys (e.g. van Dokkum et al. 2008; Newman et al.2012; Krogager et al. 2014; Straatman et al. 2014). Thesegalaxies are generally found to be extremely compact which,when taken in conjunction with their high stellar masses,≈ 1011 M⊙, and high redshifts,z>
∼ 2, motivates the idea thatthe stellar component was formed largely during an intensestarburst phase, enshrouded in dust.
positive noise peaks in two or three independent images simultaneously.
Is the comoving space density of ultrared, high-redshiftDSFGs consistent with that of massive, high-redshift, qui-escent galaxies? As discussed earlier, the 4< z < 6 DS-FGs presented in this work have a comoving space density of≈6×10⁻⁷ Mpc−3. As a comparison, we use the galaxies in thesample presented by Straatman et al. (2014), which were clas-sified as quiescent viaUVJ selection (e.g. Labbé et al. 2005)and are drawn from a mass-limited sample (> 4×10¹⁰M⊙).These galaxies were selected to lie in the redshift range 3.4<z< 4.2 and were estimated to have a median stellar age of≈ 0.8 Gyr, indicating a typical formation epoch ofz≈ 5, mak-ing them an ideal match to our sample of 4< z< 6 DSFGs.
The quiescent sources presented by Straatman et al. (2014)have a comoving space density of≈ 2×10⁻⁵ Mpc−3, ≈ 30×more numerous than the sample of DSFGs presented here.Even atMstars>∼ 1011 M⊙, Straatman et al. estimate a spacedensity of≈ 4×10⁻⁶ Mpc−3 for their quiescent near-IR galax-ies, still almost an order of magnitude higher than ourz> 4DSFGs. This indicates clearly thatz> 4 DSFGs cannot ac-count for the formation of massive, quiscent galaxies atz∼ 3–4 when selected at the flux-density levels we have been ableto probe withHerschel. Even an infeasibly short duration of<∼ 10 Myr for the starburst phase of DSFGs is insufficient tobring the comoving space densities of the two populationsinto agreement, except at the very highest masses. Instead,ourS350≈ S500≈ 30-mJy flux density limits are selecting therarest, most FIR-bright objects on the sky — hyperluminousgalaxies (e.g. Fu et al. 2013; Ivison et al. 2013) — which canform a galaxy with>∼ 1011 M⊙ of stars in<
∼ 100 Myr, and/orless massive galaxies caught during a tremendously violent,short-lived phase, or gravitationally magnified by a chancealignment, populations that — even collectively — are con-siderably rarer than massive, high-redshift, quiescent galax-ies.
The ALMACAL program of Oteo et al. (2016a) has shownthat thatS870>
∼ 1-mJy DSFGs with SFRs of≈ 50–100M⊙ yr−1
are three orders of magnitude more common than ourz> 4Herschel-selected DSFGs, such that≈ 1–2% of them lying atz> 4 may account for the massive, quiescent near-IR-selectedgalaxies. Given the limited mapping speed of ALMA, eventhis fainter, more numerous DSFG population will be best ac-cessed via a facility designed to obtain deep, wide-field imag-ing in passbands spanning 350µm through 2 mm, either alarge dish or a compact array equipped with focal-plane ar-rays.
We must therefore admit that although the progenitors ofthe most massive (>∼ 1011-M⊙) quiescent galaxies are per-haps just within our grasp, if we can push this color-selectiontechnique further, the progenitors of the more general near-IR-selected quiescent galaxy population lie below the flux-density regime probed directly byHerschel. The progenitorsof z> 6 quasars, discussed in §1, remain similarly elusive: ourultrared DSFG space density is well matched, but we have yetto unveil any of thez> 6 galaxies that may be hidden withinour sample.
5. CONCLUSIONS
We have presented follow up SCUBA-2 and LABOCAimaging of a sample of 109 ultrared DSFGs withHerschelSPIRE colors ofS500/S250≥ 1.5 andS500/S350≥ 0.85, therebyimproving the accuracy of FIR-/submm-based photometricredshifts. After selecting the three SED templates most suit-able for determining photometric redshifts, from a parent
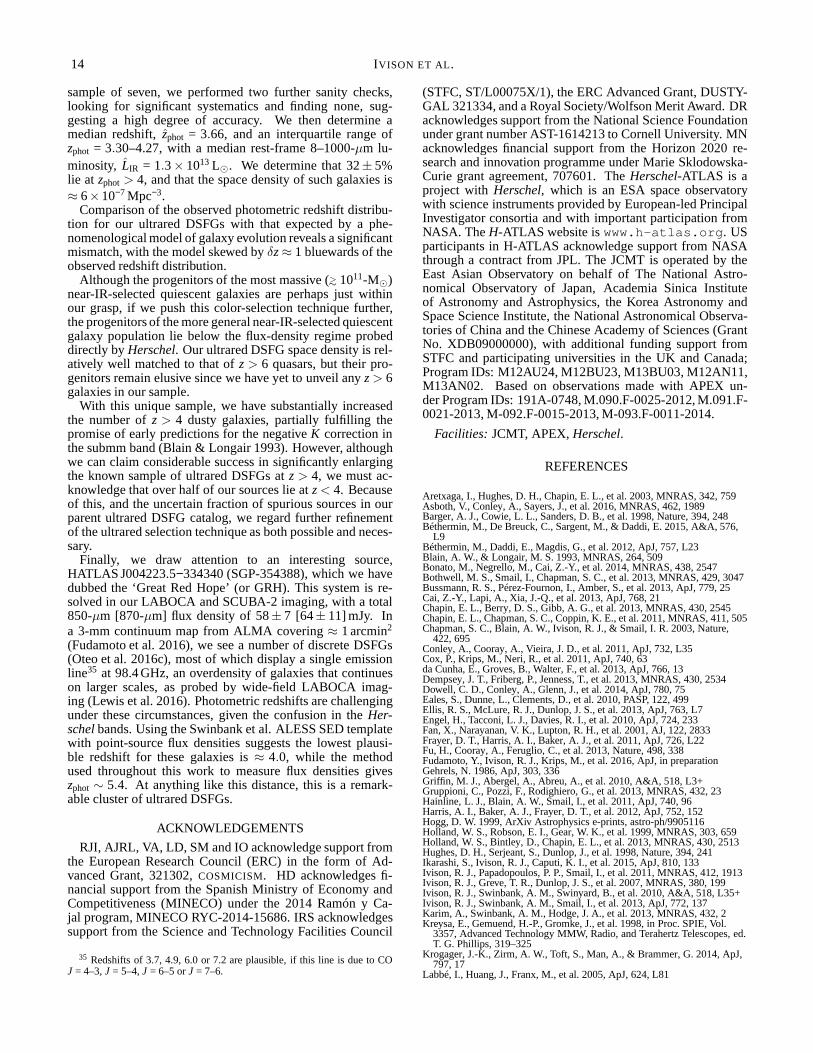
14 IVISON ET AL.
sample of seven, we performed two further sanity checks,looking for significant systematics and finding none, sug-gesting a high degree of accuracy. We then determine amedian redshift,zphot = 3.66, and an interquartile range ofzphot = 3.30–4.27, with a median rest-frame 8–1000-µm lu-minosity, LIR = 1.3× 10¹³ L⊙. We determine that 32± 5%lie at zphot > 4, and that the space density of such galaxies is≈ 6×10⁻⁷ Mpc−3.
Comparison of the observed photometric redshift distribu-tion for our ultrared DSFGs with that expected by a phe-nomenological model of galaxy evolution reveals a significantmismatch, with the model skewed byδz≈ 1 bluewards of theobserved redshift distribution.
Although the progenitors of the most massive (>∼ 1011-M⊙)
near-IR-selected quiescent galaxies are perhaps just withinour grasp, if we push this color-selection technique further,the progenitors of the more general near-IR-selected quiescentgalaxy population lie below the flux-density regime probeddirectly byHerschel. Our ultrared DSFG space density is rel-atively well matched to that ofz> 6 quasars, but their pro-genitors remain elusive since we have yet to unveil anyz> 6galaxies in our sample.
With this unique sample, we have substantially increasedthe number ofz > 4 dusty galaxies, partially fulfilling thepromise of early predictions for the negativeK correction inthe submm band (Blain & Longair 1993). However, althoughwe can claim considerable success in significantly enlargingthe known sample of ultrared DSFGs atz> 4, we must ac-knowledge that over half of our sources lie atz< 4. Becauseof this, and the uncertain fraction of spurious sources in ourparent ultrared DSFG catalog, we regard further refinementof the ultrared selection technique as both possible and neces-sary.
Finally, we draw attention to an interesting source,HATLAS J004223.5−334340 (SGP-354388), which we havedubbed the ‘Great Red Hope’ (or GRH). This system is re-solved in our LABOCA and SCUBA-2 imaging, with a total850-µm [870-µm] flux density of 58± 7 [64± 11] mJy. Ina 3-mm continuum map from ALMA covering≈ 1 arcmin2
(Fudamoto et al. 2016), we see a number of discrete DSFGs(Oteo et al. 2016c), most of which display a single emissionline35 at 98.4 GHz, an overdensity of galaxies that continueson larger scales, as probed by wide-field LABOCA imag-ing (Lewis et al. 2016). Photometric redshifts are challengingunder these circumstances, given the confusion in theHer-schelbands. Using the Swinbank et al. ALESS SED templatewith point-source flux densities suggests the lowest plausi-ble redshift for these galaxies is≈ 4.0, while the methodused throughout this work to measure flux densities giveszphot ∼ 5.4. At anything like this distance, this is a remark-able cluster of ultrared DSFGs.
ACKNOWLEDGEMENTS
RJI, AJRL, VA, LD, SM and IO acknowledge support fromthe European Research Council (ERC) in the form of Ad-vanced Grant, 321302,COSMICISM. HD acknowledges fi-nancial support from the Spanish Ministry of Economy andCompetitiveness (MINECO) under the 2014 Ramón y Ca-jal program, MINECO RYC-2014-15686. IRS acknowledgessupport from the Science and Technology Facilities Council
35 Redshifts of 3.7, 4.9, 6.0 or 7.2 are plausible, if this line is due to COJ = 4–3,J = 5–4,J = 6–5 orJ = 7–6.
(STFC, ST/L00075X/1), the ERC Advanced Grant, DUSTY-GAL 321334, and a Royal Society/Wolfson Merit Award. DRacknowledges support from the National Science Foundationunder grant number AST-1614213 to Cornell University. MNacknowledges financial support from the Horizon 2020 re-search and innovation programme under Marie Sklodowska-Curie grant agreement, 707601. TheHerschel-ATLAS is aproject with Herschel, which is an ESA space observatorywith science instruments provided by European-led PrincipalInvestigator consortia and with important participation fromNASA. TheH-ATLAS website iswww.h-atlas.org. USparticipants in H-ATLAS acknowledge support from NASAthrough a contract from JPL. The JCMT is operated by theEast Asian Observatory on behalf of The National Astro-nomical Observatory of Japan, Academia Sinica Instituteof Astronomy and Astrophysics, the Korea Astronomy andSpace Science Institute, the National Astronomical Observa-tories of China and the Chinese Academy of Sciences (GrantNo. XDB09000000), with additional funding support fromSTFC and participating universities in the UK and Canada;Program IDs: M12AU24, M12BU23, M13BU03, M12AN11,M13AN02. Based on observations made with APEX un-der Program IDs: 191A-0748, M.090.F-0025-2012, M.091.F-0021-2013, M-092.F-0015-2013, M-093.F-0011-2014.
Facilities: JCMT, APEX,Herschel.
REFERENCES
Aretxaga, I., Hughes, D. H., Chapin, E. L., et al. 2003, MNRAS, 342, 759Asboth, V., Conley, A., Sayers, J., et al. 2016, MNRAS, 462, 1989Barger, A. J., Cowie, L. L., Sanders, D. B., et al. 1998, Nature, 394, 248Béthermin, M., De Breuck, C., Sargent, M., & Daddi, E. 2015, A&A, 576,
L9Béthermin, M., Daddi, E., Magdis, G., et al. 2012, ApJ, 757, L23Blain, A. W., & Longair, M. S. 1993, MNRAS, 264, 509Bonato, M., Negrello, M., Cai, Z.-Y., et al. 2014, MNRAS, 438, 2547Bothwell, M. S., Smail, I., Chapman, S. C., et al. 2013, MNRAS, 429, 3047Bussmann, R. S., Pérez-Fournon, I., Amber, S., et al. 2013, ApJ, 779, 25Cai, Z.-Y., Lapi, A., Xia, J.-Q., et al. 2013, ApJ, 768, 21Chapin, E. L., Berry, D. S., Gibb, A. G., et al. 2013, MNRAS, 430, 2545Chapin, E. L., Chapman, S. C., Coppin, K. E., et al. 2011, MNRAS, 411, 505Chapman, S. C., Blain, A. W., Ivison, R. J., & Smail, I. R. 2003, Nature,
422, 695Conley, A., Cooray, A., Vieira, J. D., et al. 2011, ApJ, 732, L35Cox, P., Krips, M., Neri, R., et al. 2011, ApJ, 740, 63da Cunha, E., Groves, B., Walter, F., et al. 2013, ApJ, 766, 13Dempsey, J. T., Friberg, P., Jenness, T., et al. 2013, MNRAS,430, 2534Dowell, C. D., Conley, A., Glenn, J., et al. 2014, ApJ, 780, 75Eales, S., Dunne, L., Clements, D., et al. 2010, PASP, 122, 499Ellis, R. S., McLure, R. J., Dunlop, J. S., et al. 2013, ApJ, 763, L7Engel, H., Tacconi, L. J., Davies, R. I., et al. 2010, ApJ, 724, 233Fan, X., Narayanan, V. K., Lupton, R. H., et al. 2001, AJ, 122,2833Frayer, D. T., Harris, A. I., Baker, A. J., et al. 2011, ApJ, 726, L22Fu, H., Cooray, A., Feruglio, C., et al. 2013, Nature, 498, 338Fudamoto, Y., Ivison, R. J., Krips, M., et al. 2016, ApJ, in preparationGehrels, N. 1986, ApJ, 303, 336Griffin, M. J., Abergel, A., Abreu, A., et al. 2010, A&A, 518, L3+Gruppioni, C., Pozzi, F., Rodighiero, G., et al. 2013, MNRAS, 432, 23Hainline, L. J., Blain, A. W., Smail, I., et al. 2011, ApJ, 740, 96Harris, A. I., Baker, A. J., Frayer, D. T., et al. 2012, ApJ, 752, 152Hogg, D. W. 1999, ArXiv Astrophysics e-prints, astro-ph/9905116Holland, W. S., Robson, E. I., Gear, W. K., et al. 1999, MNRAS,303, 659Holland, W. S., Bintley, D., Chapin, E. L., et al. 2013, MNRAS, 430, 2513Hughes, D. H., Serjeant, S., Dunlop, J., et al. 1998, Nature,394, 241Ikarashi, S., Ivison, R. J., Caputi, K. I., et al. 2015, ApJ, 810, 133Ivison, R. J., Papadopoulos, P. P., Smail, I., et al. 2011, MNRAS, 412, 1913Ivison, R. J., Greve, T. R., Dunlop, J. S., et al. 2007, MNRAS,380, 199Ivison, R. J., Swinbank, A. M., Swinyard, B., et al. 2010, A&A, 518, L35+Ivison, R. J., Swinbank, A. M., Smail, I., et al. 2013, ApJ, 772, 137Karim, A., Swinbank, A. M., Hodge, J. A., et al. 2013, MNRAS, 432, 2Kreysa, E., Gemuend, H.-P., Gromke, J., et al. 1998, in Proc.SPIE, Vol.
3357, Advanced Technology MMW, Radio, and Terahertz Telescopes, ed.T. G. Phillips, 319–325
Krogager, J.-K., Zirm, A. W., Toft, S., Man, A., & Brammer, G.2014, ApJ,797, 17
Labbé, I., Huang, J., Franx, M., et al. 2005, ApJ, 624, L81
SUBMM IMAGING OF ULTRARED GALAXIES 15
Landsman, W. B. 1993, in Astronomical Society of the Pacific ConferenceSeries, Vol. 52, Astronomical Data Analysis Software and Systems II, ed.R. J. Hanisch, R. J. V. Brissenden, & J. Barnes, 246
Lapi, A., Negrello, M., González-Nuevo, J., et al. 2012, ApJ, 755, 46Lapi, A., González-Nuevo, J., Fan, L., et al. 2011, ApJ, 742,24Lewis, A., Ivison, R. J., Weiss, A., et al. 2016, MNRAS, in preparationMortlock, D. J., Warren, S. J., Venemans, B. P., et al. 2011, Nature, 474, 616Negrello, M., Hopwood, R., De Zotti, G., et al. 2010, Science, 330, 800Newman, A. B., Ellis, R. S., Bundy, K., & Treu, T. 2012, ApJ, 746, 162Oteo, I., Zwaan, M. A., Ivison, R. J., Smail, I., & Biggs, A. D.2016a, ApJ,
822, 36Oteo, I., Ivison, R. J., Perez-Fournon, I., et al. 2016b, ApJ, in preparationOteo, I., Ivison, R. J., Dunne, L., et al. 2016c, ApJ, in preparation—. 2016d, ApJ, 827, 34Pearson, E. A., Eales, S., Dunne, L., et al. 2013, MNRAS, 435,2753Pilbratt, G. L., Riedinger, J. R., Passvogel, T., et al. 2010, A&A, 518, L1+Poglitsch, A., Waelkens, C., Geis, N., et al. 2010, A&A, 518,L2+Pope, A., Chary, R., Alexander, D. M., et al. 2008, ApJ, 675, 1171Riechers, D. A., Bradford, C. M., Clements, D. L., et al. 2013, Nature, 496,
329Robson, E. I., Ivison, R. J., Smail, I., et al. 2014, ApJ, 793,11
Sanders, D. B., & Mirabel, I. F. 1996, ARA&A, 34, 749Serjeant, S. 2012, MNRAS, 424, 2429Simpson, J. M., Swinbank, A. M., Smail, I., et al. 2014, ApJ, 788, 125Siringo, G., Kreysa, E., Kovács, A., et al. 2009, A&A, 497, 945Smail, I., Ivison, R. J., & Blain, A. W. 1997, ApJ, 490, L5+Smail, I., Swinbank, A. M., Ivison, R. J., & Ibar, E. 2011, MNRAS, 414,
L95Straatman, C. M. S., Labbé, I., Spitler, L. R., et al. 2014, ApJ, 783, L14Strandet, M. L., Weiss, A., Vieira, J. D., et al. 2016, ApJ, 822, 80Swinbank, A. M., Smail, I., Longmore, S., et al. 2010, Nature, 464, 733Swinbank, A. M., Simpson, J. M., Smail, I., et al. 2014, MNRAS, 438, 1267Symeonidis, M., Vaccari, M., Berta, S., et al. 2013, MNRAS, 431, 2317Toft, S., Smolcic, V., Magnelli, B., et al. 2014, ApJ, 782, 68Valiante, E., Smith, M. W. L., Eales, S., et al. 2016, MNRAS, 462, 3146van Dokkum, P. G., Franx, M., Kriek, M., et al. 2008, ApJ, 677,L5Vieira, J. D., Crawford, T. M., Switzer, E. R., et al. 2010, ApJ, 719, 763Vieira, J. D., Marrone, D. P., Chapman, S. C., et al. 2013, Nature, 495, 344Weiß, A., Kovács, A., Coppin, K., et al. 2009, ApJ, 707, 1201Weiß, A., De Breuck, C., Marrone, D. P., et al. 2013, ApJ, 767,88Zhang, Z.-Y., Papadopoulos, P. P., Ivison, R. J., et al. 2016, R. Soc. open sci.,
3, 160025
APPENDIX
In this Appendix we present theHerschelSPIRE, JCMT/SCUBA-2 and APEX/LABOCA imaging of our red galaxy samplein the GAMA 9-hr, 12-hr and 15-hr fields, as well as the NGP and SGP fields. In each column, from left to right, we show 250-,350-, 500- and 850-µm [870-µm for LABOCA] cut-out images, each 3′×3′ and centered on the (labelled) galaxy. The 250- and850-µm [870-µm] cut-out images have been convolved with 7′′ and 13′′ [19′′] Gaussians, respectively. The 45′′ aperture used tomeasureStot is shown. A 60′′ aperture was also used but is not shown, to aid clarity. The annulus used to measure the backgroundlevel is shown in the uppermost case (this is correspondingly larger for the 60′′ aperture – see §4.1). SPIRE images are displayedfrom −6 to +60 mJy beam−1; SCUBA and LABOCA images are displayed from−3 to +30 mJy beam−1; both scales are relative tothe local median. North is up and East is left.
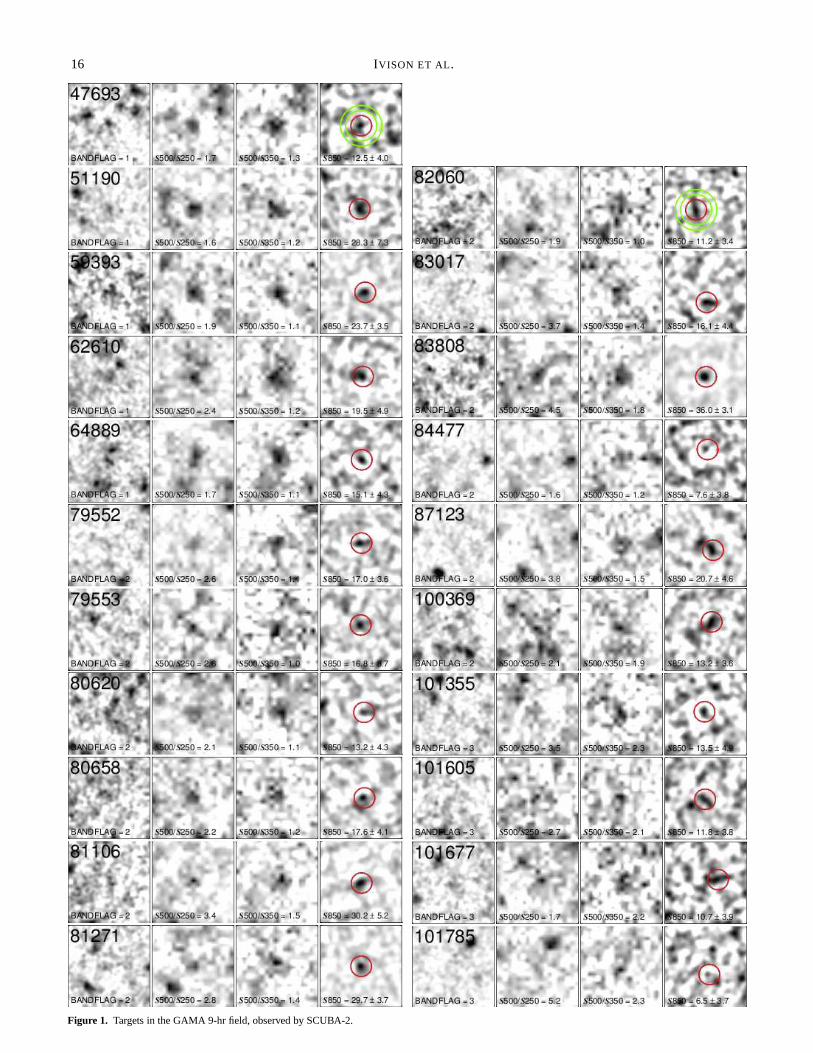
16 IVISON ET AL.
Figure 1. Targets in the GAMA 9-hr field, observed by SCUBA-2.

SUBMM IMAGING OF ULTRARED GALAXIES 17
Figure 2. Targets in the GAMA 12-hr field, observed by SCUBA-2.

18 IVISON ET AL.
Figure 3. Targets in the GAMA 15-hr field, observed by SCUBA-2.

SUBMM IMAGING OF ULTRARED GALAXIES 19
Figure 4. Targets in the NGP field, observed by SCUBA-2.
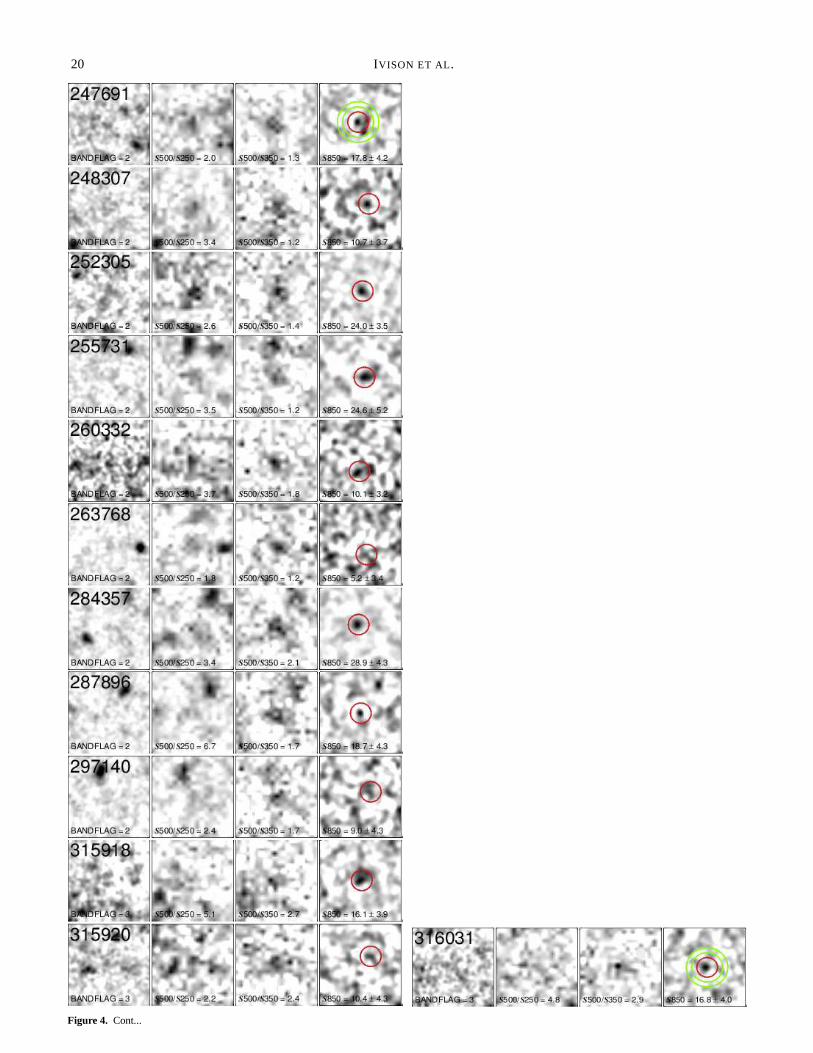
20 IVISON ET AL.
Figure 4. Cont...

SUBMM IMAGING OF ULTRARED GALAXIES 21
Figure 5. Targets in the SGP field, observed by SCUBA-2.

22 IVISON ET AL.
Figure 5. Left: Cont...Right: Targets in the SGP field, observed by LABOCA.