cif stock recommendation report (spring 2014) · cif stock recommendation report (spring 2014) ......
TRANSCRIPT

1
Date: April 7, 2014
Analyst Name: Todd Mehrkens
CIF Stock Recommendation Report (Spring 2014) Company Name and Ticker: Chipotle Mexican Grill Inc. (CMG)
Section (A) Investment Summary
Recommendation Buy: Yes Target Price:
$631.70 (+14%) Stop-Loss Price:
$487.62 (-12%)
Sector:
Consumer Discretionary Industry:
Restaurants Market Cap (in Billions):
17.66 # of Shrs. O/S (in Millions):
31.087
Current Price:
$554.12 (4/4/2014) 52 WK Hi:
622.90 52 WK Low:
316.87 EBO Valuation:
$334.97
Morningstar (MS) Fair
Value Est.: $410.00
MS FV Uncertainty:
High MS Consider Buying:
$246.00 MS Consider Selling:
$635.50
EPS (TTM):
10.47 EPS (FY1):
12.93
EPS (FY2):
16.05
MS Star Rating:
2 Stars
Next Fiscal Yr. End
December 31, 2014 Last Fiscal Qtr. End:
Less Than 8 WK:
No
If Less Than 8 WK, next
Earnings Ann. Date:
N/A
Analyst Consensus
Recommendation:
Buy or Hold
Forward P/E:
36.07 Mean LT Growth:
21.85% PEG:
1.65 Beta:
0.73 (Reuters)
% Inst. Ownership:
94.29% Inst. Ownership- Net
Buy: No
Short Interest Ratio:
3.30 (4/1/14) Short as % of Float:
5.80% (4/1/14)
Ratio Analysis Company Industry Sector
P/E (TTM) 54.25 (Reuters) 124.91 (Reuters) 17.23 (Reuters)
P/S (TTM) 5.49 (Reuters) 2.11 (Reuters) 290.60 (Reuters)
P/B (MRQ) 11.46 (Reuters) 6.14 (Reuters) 2.92 (Reuters)
P/CF (TTM) 41.70 (Reuters) 19.03 (Reuters) 10.81 (Reuters)
Dividend Yield N/A (Reuters) 1.06 (Reuters) 2.32 (Reuters)
Total Debt/Equity
(MRQ)
0.00 (Reuters) 61.30 (Reuters) 74.021 (Reuters)
Net Profit Margin
(TTM)
10.19 (Reuters) 4.43 (Reuters) 11.00 (Reuters)
ROA (TTM) 17.81 (Reuters) 6.67 (Reuters) 9.66 (Reuters)
ROE (TTM) 23.52 (Reuters) 12.84 (Reuters) 20.61 (Reuters)

2
Investment Thesis
Chipotle is one of the fast growing
companies in the restaurant industry. The
company has consistently been
outperforming estimations and benchmarks
for the past 5 years; with the most recent
success the past year. There is a strong two
year outlook for growth as well as for the
long term. This company is in the fastest
growing restaurant industry and is the
biggest company for that specific restaurant
style. The summer has a pattern of producing
the highest EPS and revenue growth and this
would be a great time to buy.
Cons:
High uncertainty
Company has been buying their stock
back, but some analyst think the
company is overvalued
High stock price
Supplier problems could make food
prices volatile
Going International is risky as well as
branching out into different types of
cuisine restaurants
SUMMARY
Company Profile: Chipotle Mexican Grill, Inc.
operates Chipotle Mexican Grill restaurants, which
serve a focused menu of burritos, tacos, and burrito
bowls (a burrito without the tortilla) and salads, made
using fresh ingredients” (Morningstar). The company
has the philosophy and image on having dairy and meat
products that are naturally raised and are local.
Fundamental Valuation: The EBO valuation, $334.97,
does fall within the 52-week range of $316.87 -
$622.90. This valuation is on the low spectrum of the
52-week range and implies that the current stock price
of $555.16 is highly overvalued.
Relative Valuation: Two of the six valuation matrix
produced a median value that was within the 52 week
price range, those being PEG and P/B. The competitors
for comparison are McDonalds, Starbucks, Yum!
Brands, and Darden Restaurants.
Revenue and Earnings Estimates: Revenue estimates
have been increasing every quarter and Chipotle has
been outperforming. Chipotle’s EPS has been going
down the last 3 quarters and in general hard to predict
an accurate estimate.
Analyst Recommendations: Analysts have a bullish
sentiment about the stock and have been moving their
recommendations up. Most recommendations are to
buy, outperform, or hold.
Institutional Ownership: Recently there have been a
negative net buyers for this term by % of shares being
sold off at -3.33%. The major ownership of the
company is by T. Rowe Price who has 12.68% stake in
the company.
Short Interest: Recently Chipotle’s short interest has
been going down as well as their days to cover which
signals stronger bullish sentiment for the stock. Also
their 10 day average volume is significantly higher than
their 3 month average meaning the company is
becoming more liquid.
Stock Price Chart: The company has been greatly
outperforming the S&P 500, Consumer Discretionary
Sector, and their closest rival, McDonalds, for the past 5
years. Currently the 10 day moving average is beating
the 50 day moving average.

3
Section (B) Company Profile
(B-1) Profile
“Chipotle Mexican Grill, Inc. operates Chipotle Mexican Grill restaurants, which serve a
focused menu of burritos, tacos, and burrito bowls (a burrito without the tortilla) and salads,
made using fresh ingredients” (Morningstar). The company has the philosophy and image on
having dairy and meat products that are naturally raised and are local. By having this scheme
they have many suppliers based on location and have high purchasing power over them. On the
other side, there is a select few of naturally raised dairy and meet farmers which has the potential
to make volatile prices. Currently Chipotle has a strong, loyal customer base which allows them
to be able to be somewhat flexible with raising their prices. A concern is that if they raise prices
too high, consumers may see eating at Chipotle to expensive based on the quality and type of
good they are consuming.
Chipotle specifically operates within the fast-casual industry. This market is seen to be
the fast growing industry within the restaurant industry. MorningStar analyst estimate it to grow
nearly 10% in the upcoming years. The reason for this is due to consumers wanting better quality
of food that is seen in the dinning industry, but do not have the time to eat out. Because it is seen
as being attractive, competitors in other restaurant industries are trying to adapt and gain some of
the fast-casual market.
(Chipotle’s 2013 Annual Report)

4
Chipotle’s main competitors are Yum! Brands Inc., McDonalds, Starbucks, and Darden
Restaurants Inc. The largest restaurant in the market is McDonalds which has around 26% of the
market weight. Many of their competitors are international. Chipotle in 2009 opened in the UK
and have been slowly opening other international locations. Chipotle’s restaurant location make
up is 7 in Canada, 2 in France, 1 in Germany, 6 in U.K., and 1,579 in 43 states.
Last year Chipotle opened 185 new restaurants and had 0 relocations. They plan to open
200 more stores for 2014. Chipotle is smart in the way they open stores and make sure that a
store will profitable in the long run when they open one. Last year after opening more stores,
their average restaurant sales increased 5.6% from last year.
Chipotle’s revenue breakdown is around 99% from in store sales and 1% from catering.
Catering was just started in 2013 and is seen to grow in popularity, which has huge upsides to
profit. Almost all of Chipotle’s revenue is domestic. Chipotle’s revenue and earnings react
cyclically and seasonally. Chipotle’s sees the highest revenue and earnings growth in the summer
time when people tend to eat out more often.
Management at Chipotle has allowed them to have a high retention rate. The company
has a culture to promote within and because the restaurant has an assembly line for the whole
process, it simple and is low cost to train employees. This low cost management scheme along
with the company’s highly leveragable model has given Chipotle an advantage in the industry.
In the past couple of years there has been no significant mergers or acquisition for
Chipotle. The company has started branching out into different types of cuisine restaurants. They
have opened ShopHouse for Asian cuisine and Pizzeria Locale. This is seen to be risky, but has
the potential to diversify the company and increase the company’s market share in the restaurant
industry. Currently there is not litigation or pending lawsuits against the company.

5
(B-2) Revenue and Earnings History
Revenue History Observations:
Revenue (in millions)
Periods 2011 2012 2013
March
510
641
727
June
571
691
817
September
592
701
827
December
597
699
844
Total
2,270
2,732
3,215
There is a trend that the revenue has gone up almost every quarter for the past three years. There
is a seasonal trend that between March and June there is the largest increase in quarterly revenue.
The smallest revenue growth tends to be from September to December. Overall year over year
revenue has been growing at an increasing rate.
Earnings History Observations:
Earnings Per Share
Periods 2011 2012 2013
March 1.46 1.97 2.45
June 1.59 2.56 2.82
September 1.9 2.27 2.66
December 1.81 1.95 2.53
Total 6.76 8.75 10.46
Earnings per share has been increasing annually for the past three years. Comparing quarterly
EPS, there is a trend that in EPS goes upward for the months of January through June then there
is a downward trend for the months of July through December. Second quarter tends to have the
highest EPS of the year except for the year 2011.

6
(B-3) Most Recent Quarterly Earnings Release
1) When was the company’s most recent earning release?
The most recent earning release for the company was on January 30, 2014.
2) In that earnings report, was reported revenue a (1) beat, (2) match, or (3) miss from
consensus estimate?
Revenue was $844.15 when it was estimated at $826.30; a surprise of 2.16%.
3) Likewise, was reported earnings a (1) beat, (2) match, or (3) miss from consensus
estimate?
Earnings estimate was a match at 2.53.
4) What did the management attribute the beat/miss to?
The main attribute for beating the revenue estimate was they had more customers and meals
bought than expected.
5) Did the management provide guidance about their current quarter and their outlook
for the year? What were the key points of the guidance?
Management expects to keep expanding in 2014 by opening 200 new restaurants. The focus
is also to expand more internationally. With this plan they expect to keep growing every year
in revenue and earnings.
6) How did the stock react to that earnings release?
The stock went up 11.74% after the earnings release. On January 30, 2014 the stock was
$493.96 and after the release, the stock was $551.96 on January 31, 2014.

7
Section (C) Fundamental Valuation (EBO)
CMG Fundamental Valuation (EBO) Spreadsheet
CMG
PARAMETERS FY1 FY2 Ltg
EPS Forecasts 12.93 16.05 21.85%
Total Equity 1583.30
Preferred Stock 0.00
Book Value (end of last fye) 1583.30
Common Equity Shr. O/S 31.03
Book value/share (last fye) 51.025
30- Year T-Bond Rate 3.56%
E(rm) 9.00%
Beta 0.73
Discount Rate 7.53%
Dividend Payout Ratio (POR) 0.00%
Next Fsc Year end 2014
Current Fsc Mth (1 to 12) 4
Target ROE (industry avg.) 12.11%

8
Year 2014 2015 2016 2017 2018 2019 2020 2021 2022 2023 2024 2025
Long-term EPS
Growth Rate (Ltg)
0.2185 0.2185 0.2185 0.2185 0.2185
Forecasted EPS 12.93 16.05 19.56 23.83 29.04 35.38 43.11
Beg. of year BV/Shr 51.025 63.955 80.005 99.562 123.392 152.429 187.810
Implied ROE
0.251 0.244 0.239 0.235 0.232 0.230
ROE
(Beg. ROE, from
EPS forecasts) 0.253 0.251 0.244 0.239 0.235 0.232 0.230 0.208 0.186 0.164 0.143 0.121
Abnormal ROE
(ROE-k) 0.178 0.176 0.169 0.164 0.160 0.157 0.154 0.133 0.111 0.089 0.067 0.046
growth rate for B
(1-POR)*(ROEt-1) 0.000 0.253 0.251 0.244 0.239 0.235 0.232 0.230 0.208 0.186 0.164 0.143
Compounded
growth
1.000 1.253 1.568 1.951 2.418 2.987 3.681 4.526 5.466 6.484 7.551 8.629
growth*AROE
0.178 0.220 0.265 0.320 0.387 0.468 0.568 0.600 0.606 0.578 0.510 0.395
required rate (k)
0.075 0.075 0.075 0.075 0.075 0.075 0.075 0.075 0.075 0.075 0.075 0.075 0.075
Compound discount
rate
1.075 1.156 1.243 1.337 1.438 1.546 1.662 1.788 1.922 2.067 2.223 2.390
div. payout rate
(k)
0.000
Add to P/B
PV(growth*AROE) 0.17 0.19 0.21 0.24 0.27 0.30 0.34 0.34 0.32 0.28 0.23 0.17
Cum P/B
1.17 1.36 1.57 1.81 2.08 2.38 2.72 3.06 3.37 3.65 3.88 4.05
Add: Perpetuity
beyond current yr
(Assume this yr's
AROE forever) 2.20 2.53 2.83 3.18 3.57 4.02 4.53 4.46 4.19 3.71 3.04 2.19
Total P/B
(P/B if we stop est.
this period) 3.36 3.88 4.40 4.99 5.65 6.40 7.26 7.51 7.56 7.37 6.93 6.24
Implied price 176.00 203.16 230.22 260.87 295.61 334.97 379.58 393.01 395.39 385.34 362.26 326.51
Check:
Beg. BV/Shr
51.025 63.955 80.005 99.562 123.392 152.429 187.810 230.923 278.923 330.851 385.269 440.282
Implied EPS
12.930 16.050 19.557 23.830 29.037 35.382 43.112 48.000 51.928 54.419 55.013 53.318
Implied EPS
growth
0.241 0.219 0.219 0.219 0.219 0.219 0.113 0.082 0.048 0.011 -0.031

9
Inputs
EPS forecasts (FY1 & FY2): 12.93, 16.05
Long-term growth rate: 21.85%
Book value /share (along with book value and number of shares outstanding):
Book value: 1583.30 Million
# of shares outstanding: 31.03 Million
Book value / share: 51.025
Dividend payout ratio: 0.00%
Next fiscal year end: December 31, 2014
Current fiscal month: 4, April
Target ROE: 12.11%
Discount rate
Input for discount rate: 7.53%
Risk-free rate: 3.56%
Beta: 0.73
Market risk premium: 9.00%
Output
Above normal growth period chosen: 2019, 5 Years
The growth expectations are based on a 5 year trend and this stock is expected to see long
term growth which is why a 5 year outlook is chosen.
EBO valuation (Implied price from the spreadsheet): $334.97
The EBO valuation, $334.97, does fall within the 52-week range of $316.87 - $622.90. This
valuation is on the low spectrum of the 52-week range and implies that the current stock
price of $555.16 is highly overvalued. In my opinion, the fundamental valuation is not a great
fit with the stock. The stock has been performing above expected for growth and revenue.
The soft spots of the inputs for this valuation are the high beta and low LTG %. The beta
should be lower based on how the company is gaining more market share within the fast-
casual restaurant category as well as outperforming growth expectations on a constant basis
for the past 5 years.

10
Sensitivity Analysis
1) Explain the input values used in sensitivity analysis. Compare the fundamental values
obtained here in relation to the value from the base case
All of the input values used in the sensitivity analysis seemed to be a good representation, so
there were no alterations to the original numbers.
EBO valuation would be (you can include more than one scenario in each of the following):
$334.97 if changing above normal growth period to 2019.
$350.07 if changing growth rate from mean (consensus) to the highest estimate 23.2%
$320.05 if changing growth rate from mean (consensus) to the lowest estimate 20.47%
$227.01 if changing discount rate to 10%
$319.70 if changing target ROE to 36.2% (Ind. Average from MorningStar)

11
Section (D) Relative Valuation
Cougar Investment Fund Relative Valuation Template
CMG
Mean FY2
Earnings
Estimate Forward Mean LT PEG P/B ROE Value P/S P/CF
Ticker Name Mkt Cap
Current
Price (next fiscal year) P/E
Growth
Rate (MRQ)
5 yr
ave Ratio TTM TTM
1 MCD
McDonald's
Corporation
$
97,038.07
$
97.90
$
6.32 15.49 8.15% 1.90 6.06 35.66% 0.17 3.45 13.53
2 SBUX
Starbucks
Corporation
$
55,467.94
$
74.01
$
3.17 23.35 19.81% 1.18 11.36 20.17% 0.56 3.62 69.68
3 YUM Yum Brands Inc.
$
33,317.93
$
76.06
$
4.17 18.24 12.32% 1.48 15.42 81.98% 0.19 2.55 18.67
4 DRI
Darden Restaurants,
Inc.
$
6,662.98
$
51.48
$
2.82 18.26 -0.90% -20.28 3.14 23.82% 0.13 0.76 8.8
CMG
Chipotle Mexican
Grill
$
17,660.21
$
578.97
$
16.05 36.07 21.85% 1.65 11.46 23.05% 0.50 5.49 41.7
Implied Price based
on: P/E PEG P/B Value P/S P/CF
1 MCD
McDonald's
Corporation
$248.62
$666.55 $306.16
$197.89 $363.83 $187.85
2 SBUX
Starbucks
Corporation
$374.72
$413.31 $573.92
$655.87 $381.76 $967.45
3 YUM Yum Brands Inc.
$292.75
$519.20 $779.03
$219.04 $268.92 $259.22
4 DRI
Darden Restaurants,
Inc. $293.00
-
$7,113.34 $158.64 $153.51 $80.15 $122.18
High $374.72 $666.55 $779.03 $655.87 $381.76 $967.45
Low
$248.62
-
$7,113.34 $158.64
$153.51 $80.15 $122.18
Median $292.87 $466.25 $440.04 $208.47 $316.38 $223.54

12
McDonald’s Corporation franchises and operated restaurants that are in the fast food service
industry. They are similar to Chipotle in being a large fast food service and the company is trying
to get more of the market for fast-casual service which Chipotle is the leader in.
Starbucks Corporation is in the same fast-casual service industry. Starbucks focuses on quality
of goods, which is similar to Chipotle and both companies offer goods around the same price of
$4 to $10 per single order.
Yum! Brands Inc. is in both the fast food service industry and the fast-casual industry. The
company operates KFC, Pizza Hut and Taco Bell.
Darden Restaurants “owns and operates dining restaurants under the trade names Red
Lobster®, Olive Garden®, LongHorn Steakhouse®, Bahama Breeze®, Seasons 52®, Eddie V's
Prime Seafood®, Wildfish Seafood Grille® and Yard House®.” (MorningStar)
*The strongest correlation between these companies is they are the leaders in the restaurant
industry and compete against each other for sales and customers.

13
1) Discuss various valuation multiples of your stock and its peers. Comment if any of these
stocks have multiples far off from the others and explain whether it makes sense.
The forward P/E ratio are relatively similar around 18, except for Chipotle which is almost twice
the ratio as their competitors. The reason for this is due to the fact that Chipotle’s stock price is
highly expensive around $578, while the other companies’ are around $50 to $100. The PEG for
each company are almost the same, except for Darden which is the outlier at -20.28. Having a
lower Peg ratio is a signal that the stock will be more undervalued given its earnings
performance. When comparing the PEG to the other competitors, Chipotle is in the upper middle
range.
2) Discuss the various implied prices of your stock derived from peers’ (“Comparables”)
multiples. Compare these implied prices to current price and 52-week high and low.
How different are the prices derived from the various valuation metrics?
The implied prices that are set from the P/E range between $248.62 and $374.72 with the median
being $292.87. The current price is $555.16 which is not within the range, but Chipotle is within
that range for their 52-week range of $312.87-622.90. The P/B, Value, P/S, and P/CF ranges
were all within Chipotle’s 52-week range. The PEG ratio was not within the 52-week range of
Chipotle.
3) Compare your findings with comments from analysts from Morningstar Direct and
other online resources.
The findings more or less fell in line with analyst estimates. The hardest part for estimating is
how Chipotle has been the outlier against competitors with their extreme growth in the last five
years.

14
Section (E) Revenue and Earnings Estimates
(E-1) HISTORICAL SURPRISES
Sales and Profit Figures in US Dollar (USD)
Earnings and Dividend Figures in US Dollar (USD)
Estimates vs Actual Estimate Actual Difference Surprise %
SALES (in millions)
Quarter Ending Dec-13 826.30 844.15 +17.84 +2.16
Quarter Ending Sep-13 820.13 826.91 +6.78 +0.83
Quarter Ending Jun-13 802.78 816.79 +14.01 +1.74
Quarter Ending Mar-13 725.13 726.75 +1.62 +0.22
Quarter Ending Dec-12 698.89 699.16 +0.27 +0.04
Earnings (per share)
Quarter Ending Dec-13 2.53 2.53 0.00 0.00
Quarter Ending Sep-13 2.78 2.66 -0.12 -4.32
Quarter Ending Jun-13 2.81 2.82 +0.01 +0.29
Quarter Ending Mar-13 2.13 2.35 +0.22 +10.11
Quarter Ending Dec-12 1.96 1.95 -0.01 -0.26
Overall Chipotle has been surprising the estimates for sales, the biggest surprises has been the
past 3 quarters with the largest surprise of +2.16% being last quarter. Chipotle’s earnings last
quarter had no surprise. Looking farther out, Chipotle varies in positive and negative surprises
for the previous quarters. The largest negative surprise was -4.32% and the largest positive
surprise was +10.11%. In general the company is more volatile in surprises for earning than sales
because there is no trend for EPS surprises and they are larger percentages.

15
(E-2) CONSENSUS ESTIMATES ANALYSIS
Sales and Profit Figures in US Dollar (USD)
Earnings and Dividend Figures in US Dollar (USD)
# of
Estimate Mean High Low
1 Year
Ago
% Difference
of High and
Mean
% Difference
of Low and
Mean
SALES (In Millions)
Quarter Ending Jun-14 24
958.28
989.80
935.30
925.01 3.289% -2.398%
Quarter Ending Sep-14 24
977.32
1,005.33
948.90
936.89 2.866% -2.908%
Year Ending Dec-14 27
3,797.54
3,898.20
3,681.90
3,644.74 2.651% -3.045%
Year Ending Dec-15 25
4,406.44
4,602.80
4,217.00
4,240.17 4.456% -4.299%
EARNINGS (Per Share)
Quarter Ending Jun-14 28 3.35 3.54 3.11 3.45 5.672% -7.164%
Quarter Ending Sep-14 28 3.40 3.68 3.04 3.29 8.235% -10.588%
Year Ending Dec-14 30 12.93 13.54 12.21 12.38 4.718% -5.568%
Year Ending Dec-15 28 16.05 17.25 15.04 15.06 7.477% -6.293%
LT Growth Rate (%) 4 21.85 23.20 20.00 20.47 6.178% -8.467%
There are more divergence with earnings compared to revenue. For the most part the divergence
percentage is higher for time periods that are farther out. There is a huge discrepancy when
comparing the number of analysts that provide revenue and earnings to the ones that provide the
LT Growth Rate. LT Growth Rate analyst are 4 compared to around 24-30 analysts for revenue
and earnings.

16
(E-3) CONSENSUS ESTIMATES TREND
Sales and Profit Figures in US Dollar (USD)
Earnings and Dividend Figures in US Dollar (USD)
Current
1 Week
Ago
1 Month
Ago
2 Month
Ago
1 Year
Ago
SALES (in millions)
Quarter Ending Jun-14 958.28 957.89 957.80 956.65 925.01
Quarter Ending Sep-14 977.32 976.94 976.69 976.52 936.89
Year Ending Dec-14 3,797.54 3,796.50 3,793.91 3,789.84 3,644.74
Year Ending Dec-15 4,406.44 4,402.14 4,398.62 4,396.29 4,240.17
Earnings (per share)
Quarter Ending Jun-14 3.35 3.35 3.35 3.35 3.45
Quarter Ending Sep-14 3.40 3.39 3.40 3.40 3.29
Quarter Ending Dec-14 12.93 12.92 12.91 12.92 12.38
Quarter Ending Dec-15 16.05 16.03 15.98 15.94 15.06
The consensus estimates are trending upwards for both earnings and sales. This trend was more
notable farther out. In recent weeks there is still a slight upward trend, but not to the extent as
farther out.

17
(E-4) ESTIMATES REVISIONS SUMMARY
Last Week Last 4 Weeks
Number Of Revisions: Up Down Up Down
Revenue
Quarter Ending Jun-14 1 0 2 0
Quarter Ending Sep-14 1 0 2 0
Year Ending Dec-14 1 0 3 0
Year Ending Dec-15 1 0 2 0
Earnings
Quarter Ending Jun-14 0 2 1 3
Quarter Ending Sep-14 2 0 3 0
Year Ending Dec-14 2 0 4 0
Year Ending Dec-15 2 0 4 0
Overall there tend to be more upward revisions than downward revisions for earnings and
revenue. All revisions for revenue have been upward. The earnings revisions have been mostly
upward, but has only downward revisions for the most the recent quarter that is ending in June
2014. There are no notable revisions of last week compared to those of the last 4 weeks.

18
(E-5) “Consensus Earnings Revisions” from CNBC
Revision
Date
Revision
Type
Revision
Up/Down
Current
Previous
% Change
# of
Analysts
Reporting
3/21/2014 Up 2/0 $2.85 $2.85 +0.14% 28
3/20/2014 Up 2/0 $2.85 $2.85 +0.04% 27
3/6/2014 Up 3/0 $2.85 $2.85 +0.11% 27
The most recent earnings date was on February 5, 2014. The next earning reporting date is April
17, 2014. The revisions tend to not be clustered. The changes of the earnings revisions were not
very significant by being less than 0.15% of a change. All the revisions in the last month were
only upward.
19
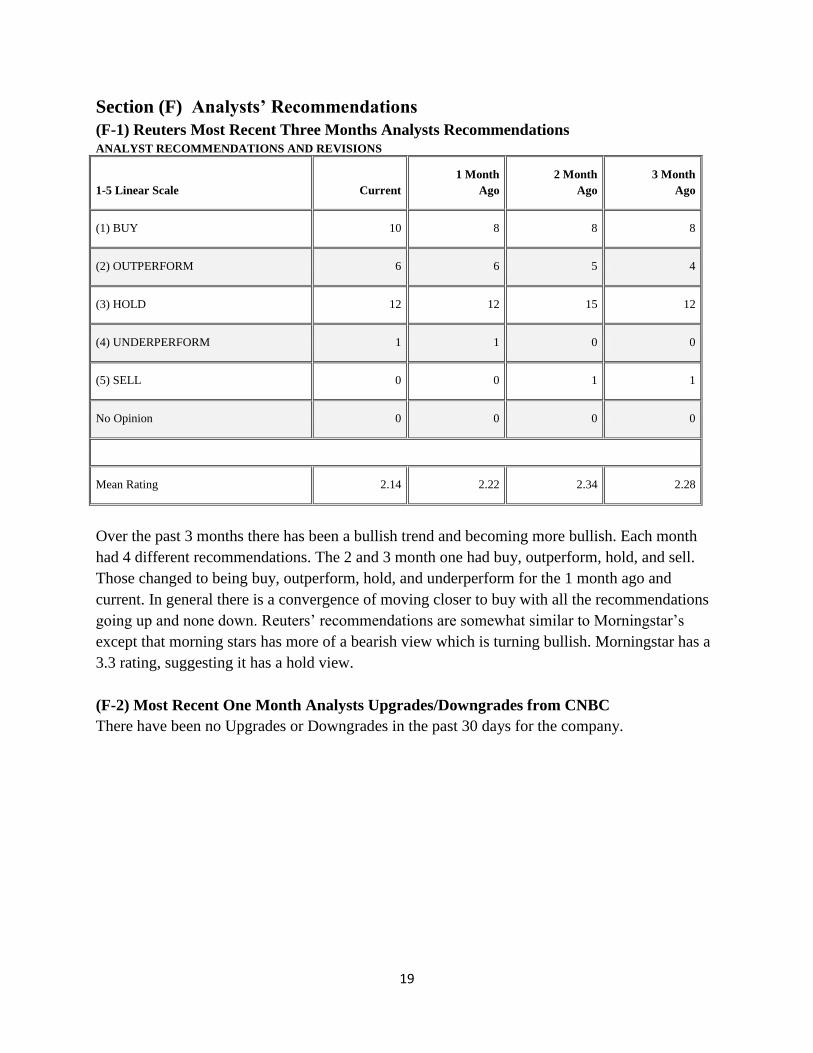
Section (F) Analysts’ Recommendations
(F-1) Reuters Most Recent Three Months Analysts Recommendations ANALYST RECOMMENDATIONS AND REVISIONS
1-5 Linear Scale Current
1 Month
Ago
2 Month
Ago
3 Month
Ago
(1) BUY 10 8 8 8
(2) OUTPERFORM 6 6 5 4
(3) HOLD 12 12 15 12
(4) UNDERPERFORM 1 1 0 0
(5) SELL 0 0 1 1
No Opinion 0 0 0 0
Mean Rating 2.14 2.22 2.34 2.28
Over the past 3 months there has been a bullish trend and becoming more bullish. Each month
had 4 different recommendations. The 2 and 3 month one had buy, outperform, hold, and sell.
Those changed to being buy, outperform, hold, and underperform for the 1 month ago and
current. In general there is a convergence of moving closer to buy with all the recommendations
going up and none down. Reuters’ recommendations are somewhat similar to Morningstar’s
except that morning stars has more of a bearish view which is turning bullish. Morningstar has a
3.3 rating, suggesting it has a hold view.
(F-2) Most Recent One Month Analysts Upgrades/Downgrades from CNBC
There have been no Upgrades or Downgrades in the past 30 days for the company.

20
Section (G) Institutional Ownership
CMG Institutional Ownership spreadsheet
You only need to input values to cells highlighted in "yellow"
The rest of the spreadsheet is calculated automatically
Please read "Stock Recommendation Report Guidelines" document carefully
CMG
Ownership Activity # of Holders % Beg. Holders Shares
%
Shares
Shares Outstanding
31,087,917 100.00%
# of Holders/Total Shares Held/% Shares 576 102.86% 29,312,797 94.29%
# New Positions 67 11.96%
# Closed Positions 51 9.11%
# Increased Positions 212 37.86%
# Decreased Positions 286 51.07%
Beg. Total Inst. Positions 560 100.00% 30,347,034 97.62%
# Net Buyers/3 Mo. Net Chg -74 42.57% -1,034,237 -3.33%
Ownership Information % Outstanding
% Institutional Ownership NA
Top 10 Institutions % Ownership 55.03%
Mutual Fund % Ownership 54.83%
5%/Insider Ownership 2.18%
Float % 86.00%
> 5% Ownership
Holder Name % Change % Outstanding Report Date
T. Rowe Price Associates, Inc. 2.78% 12.68/% 12/31/2013
FMR LLC -2.58% 9.43% 12/31/2013
Sands Capital Management, LLC -16.38% 7.49% 12/31/2013
The Vanguard Group, Inc. 2.14% 6.61% 12/31/2013

21
1. On a net basis, institutions have been selling off their ownership in Chipotle. Overall the
number of buyers in Chipotle have decreased by 74 this term. Ownership has been
decreasing at a substantial rate for >5% owners, which could be a signal to not invest in
Chipotle. The major change which happened at the end of last year was Sands Capital
Management selling off -16.38% of their shares and they have 7.49% invested in the
company.
2. Chipotle does not have sizeable institution interest, but does have sizeable interest from
mutual funds at 54.83%.
3. T. Rowe Price Associates has a huge role in the company by owning 12.68% of the
shares outstanding and at the end of last year they invested more in the company with a
2.78% change for institutional ownership. Fidelity has the largest mutual fund ownership
at 5.63% and is the only one above 5% for mutual funds. Overall >5% owners make up
for 36.21% of the shares outstanding.

22
Section (H) Short Interest
(H-1) Short Interest Data from http://www.nasdaq.com/ (NASDAQ’s website)
CMG: Chipotle Mexican Grill

23
MCD: McDonald’s Corp

24
YUM: Yum! Brands, Inc.

25
(H-2) Short Interest Data From http://finance.yahoo.com/
CMG: Chipotle Mexican Grill
Avg Vol Avg Vol Shares Float
(3 month) (10 day) Outstanding
534,600 604,400 31.02M 30.45M
Shares Short Short Ratio Short % of Float Shares Short
(March 14, 2014) (March 14, 2014) (March 14, 2014) (March 1, 2014)
1.39M 3.30 5.80% 1.31M
MCD: McDonald’s Corp
Avg Vol Avg Vol Shares Float
(3 month) (10 day) Outstanding
5,430,940 4,699,600 989.88M 988.37M
Shares Short Short Ratio Short % of Float Shares Short
(March 14, 2014) (March 14, 2014) (March 14, 2014) (March 1, 2014)
13.82M 2.60 1.40% 12.59M
YUM: Yum! Brands, Inc.
Avg Vol Avg Vol Shares Float
(3 month) (10 day) Outstanding
3,373,230 2,936,090 442.93M 441.43M
Shares Short Short Ratio Short % of Float Shares Short
(March 14, 2014) (March 14, 2014) (March 14, 2014) (March 1, 2014)
8.85M 3.50 2.00% 8.58M
The last earnings report was on January 30, 2014 and the next earnings reporting date is on April
17, 2014. Based on the short interest statistics, on can infer that market sentiment is turning more
bullish due to the days to recover and short interest falling over the past year. Days to cover was
extremely high at 12 in August 2013 and is now around 3 days for March. After the last
reporting date, short interest slightly fell by 54,000 while days to cover rose by from 1.78 to 2.6.
Just before the last release the stock price was falling for a couple of weeks and then soared 12%
after the release. When comparing Chipotle to their closest competitors, McDonalds has a
bearish sentiment with rising short interest. Also Yum! has been constant with their numbers
which signifies no major change in the sentiment of the stock.

26
Section (I) Stock Charts
(I-1) A three month price chart
The three month price chart shows that Chipotle started the year being slightly below the
consumer discretionary sector until the announcement of their annual earning on January 30th.
Also during that time period the S&P 500 was outperforming the sector and McDonalds was
outperforming the market. After the earnings announcement, Chipotle’s stock was outperforming
the market, consumer discretionary sector, and McDonalds by about 4-8%. Over the 3 month
period the sector has been underperforming compared to the S&P 500.

27
(I-2) A one year price chart
When looking at the 1 year price chart, Chipotle has immensely outperformed the market, the
consumer discretionary sector, and McDonalds as time progresses. Overall the sector has
outperformed market while being around 25% growth compared to S&P 500’s 20%. McDonalds
compared to the market has been struggling to compete by having around 3% growth.

28
(I-3) A five year price chart
Observing the 5 year chart, Chipotle has being outperforming the sector by having around 700%
growth compared to the sector’s 200%. Comparing the sector to the S&P, the sector has
outperformed by almost 2 times the growth of the market. The 5 year chart also shows that
McDonalds has been struggling to compete in growth; which suggests that Chipotle is growing at
a faster rate and taking some of McDonald’s market.

29
(I-4) Technical Indicators
6 Month
The 6 month moving average shows that Chipotle has had a couple of crosses and two distinct
crosses that took place the week before and after the earnings announcement on January 30th.
The current outlook suggests that there is a bullish outlook on the stock by having the 10 day
above the 50 day for almost 2 months. Currently the 10 day and 50 day are approaching each
other for a death cross which would signal that the market is turning more bearish.

30
2 Year
When looking at the 2 year moving average chart of Chipotle there has been one major death cross as
well as one Golden cross. The death cross took place in July 2012 and the stock price stayed around the
same before moving upward. The golden cross took place March 2013 where the stock price started rising
after the cross. Currently the 50 day moving average is pushing away from the 200 day moving average
which signifies the market has a bullish sentiment that is becoming even stronger.

31
Work Cited
“Chipotle Mexican Grill Inc.” MSN Money. MSN. Web. 3 April. 2014
“Chipotle Mexican Grill Inc.” Reuters. Thompson Reuters. Web. 3 April. 2014.
"Chipotle Mexican Grill Inc." Yahoo! Finance. Yahoo! Web. 3 April 2014.
“Chipotle Mexican Grill Inc.: Short Interest.” NASDAQ.com. Web. 3 April. 2014
“Earnings Calendar.” CNBC.com. Web. 3 April. 2014
“Chipotle Mexican Grill Inc." Morningstar.com. Web. 3 April. 2014