chrisman geospatial summit2015
TRANSCRIPT
Carrying through on the
promise:Lessons from prototype efforts in
Wisconsin 30 years ago
Nicholas Chrisman
Honorary Professor
Geospatial Sciences, School of Mathematical and Geospatial Sciences, RMIT University, Melbourne, AUSTRALIA
1982-87 Assistant Professor, University of Wisconsin-Madison,
Landscape Architecture and Environmental Studies
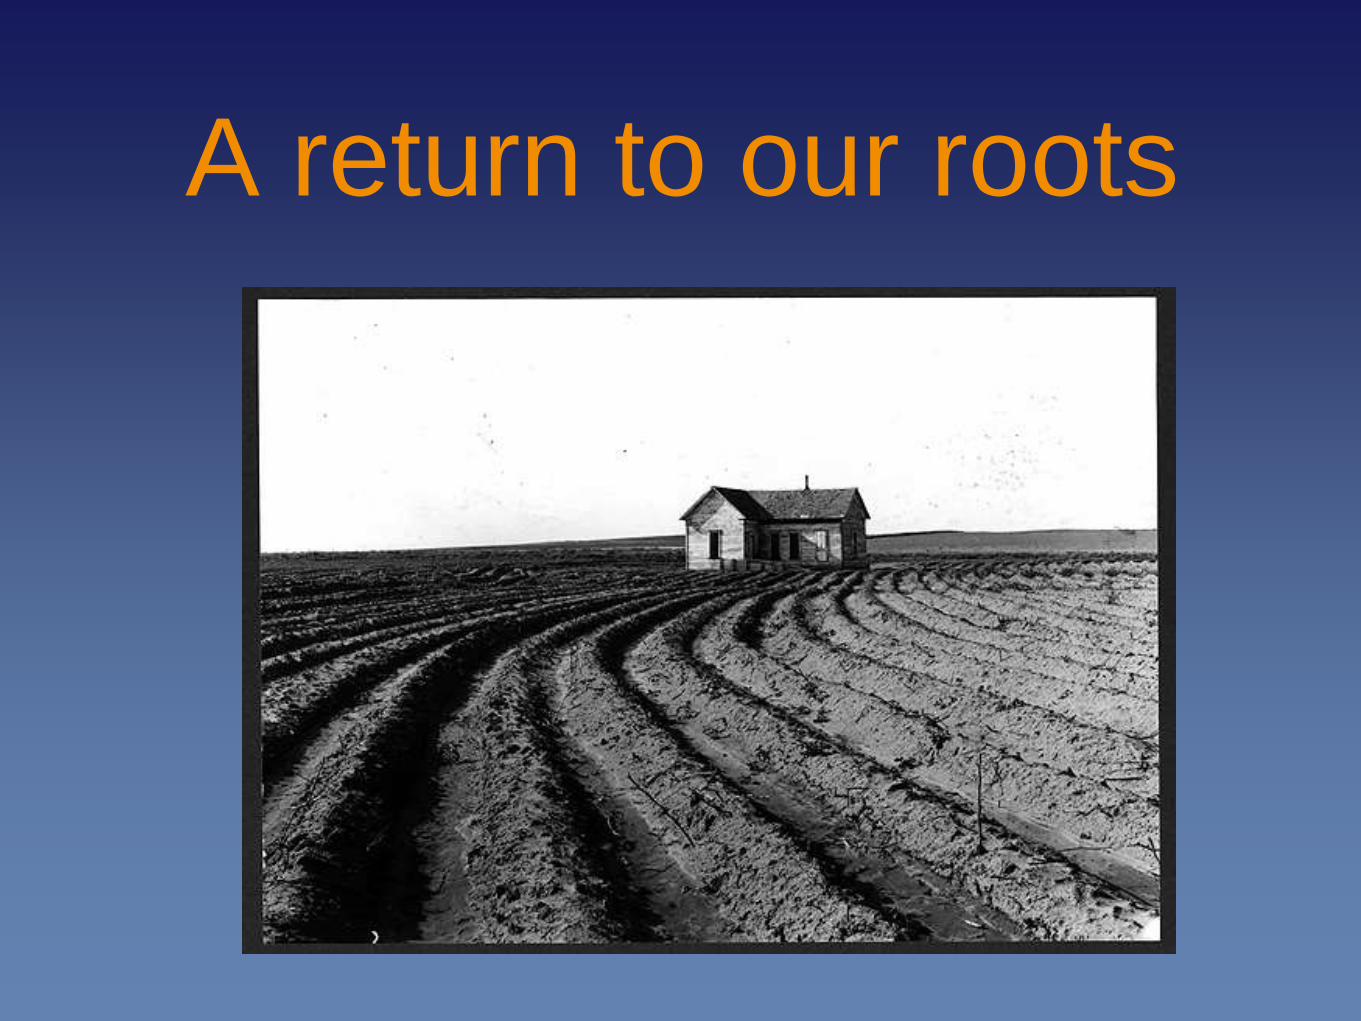
A return to our roots
A moment to reflect
• Return to Madison after 30 years
• Immense technical advances
• More limited advance in basic science
•Goal of the presentation
• More clear-headed than nostalgic (?)
• Lessons learned
• New openings
Blast from the past?
• Dane County Land Records Project
• presented in the original slides
• (date from 1985-87)
• Version presented across the State…
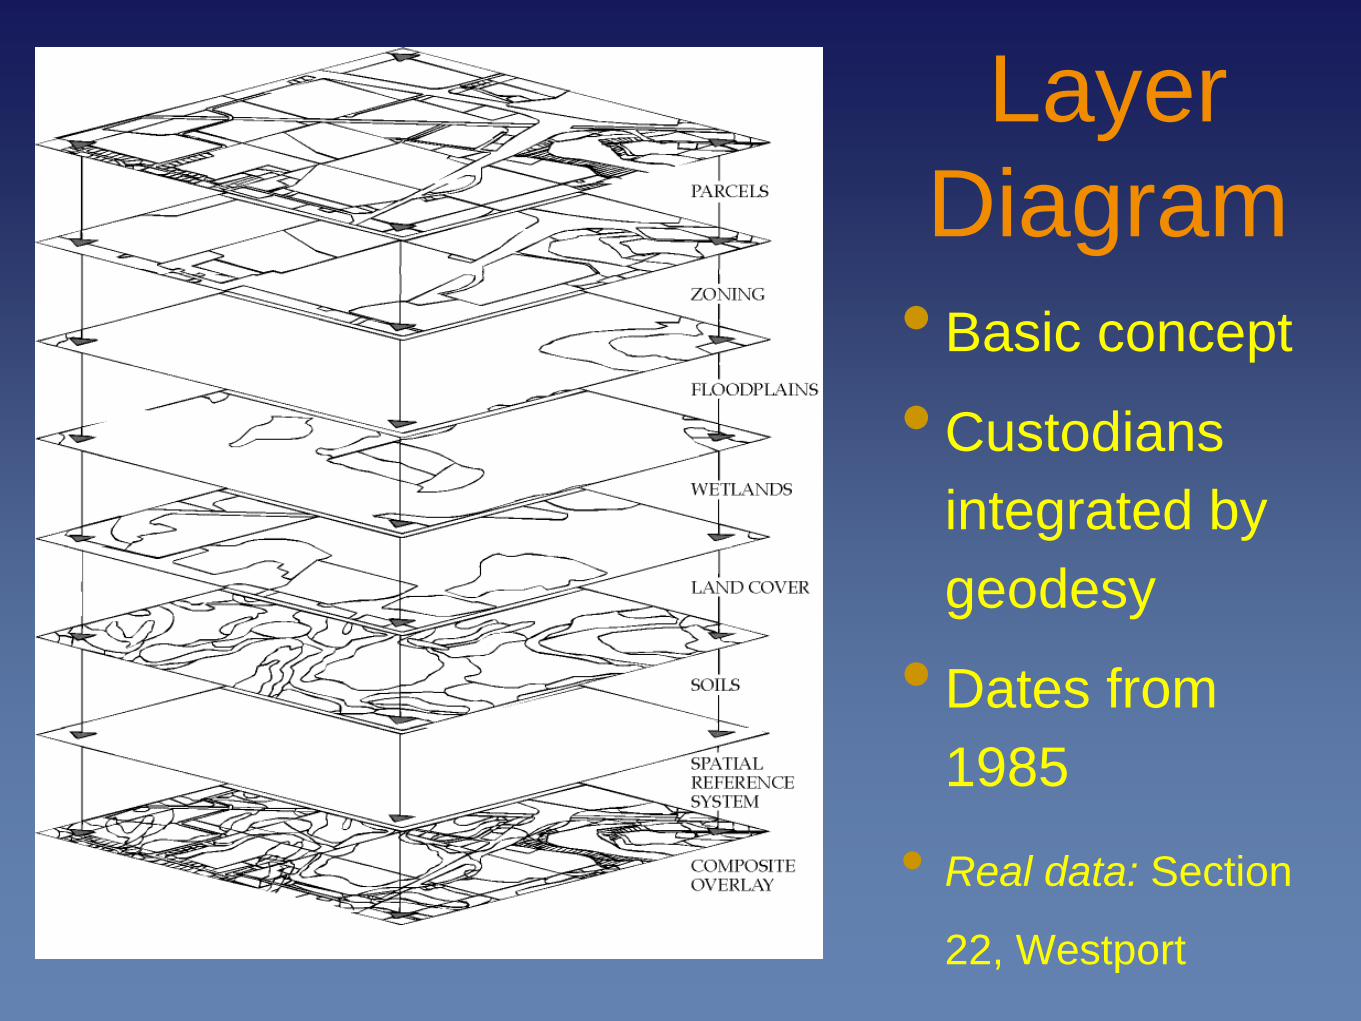
Layer
Diagram
• Basic concept
• Custodians
integrated by
geodesy
• Dates from
1985
• Real data: Section
22, Westport
Stepping stone
• Dane County Land Records Project
• led to CONSOIL, Soil Erosion Plan
• provided practical background to:
• Wisconsin Land Information Committee
• which led to WLI Program
Specific lessons• Multi-purpose / multi-discipline solutions
• Institutional issues matter:
• Mandates (still to resolve…)
• Custodians (stewardship, collaboration)
• Incremental solutions work (never complete)
• Full-scale trials build confidence; nothing
confronts a limited theory better than the real stuff
Key point about DCLRP
•Did not try to redo everything anew
•Set out to improve EXISTING
records / maps / databases
• Integrating sources
• Improving geodetic framework
• Applying data quality checks (logical
consistency, completeness)
Wisconsin 2015
• What remains the same:
• 72 distinct county programs
• more projection systems, etc.
• New departures?
• Finally possible to talk about full state
coverages
• Worldwide services architecture
Bigger picture:
3 threads
• Now: Big data?
• Then: Integration
• (lessons of an Australian past)
• Always: Information
Big Data?
• AGILE-2012 conference: Jean-Philippe
LAGRANGE (then at IGN France) set out the
dilemma of an organization flooded with data.
• Years prior to 2007: 50 Tb total
• Now 100 Tb / year and increasing…
I am suspicious; demand out of balance.
Economic bubbles
• Public enthusiasm (and greed) take
charge
• 1637: Tulipomania (Netherlands)
• 1720: Compagnie perpetuelle des
Indes (France)
• 1720: South Seas Bubble (England)
• And more recently…

Has Moore’s Law been
protecting us from
our lack of innovation?
Paper presentated at AGILE 2012
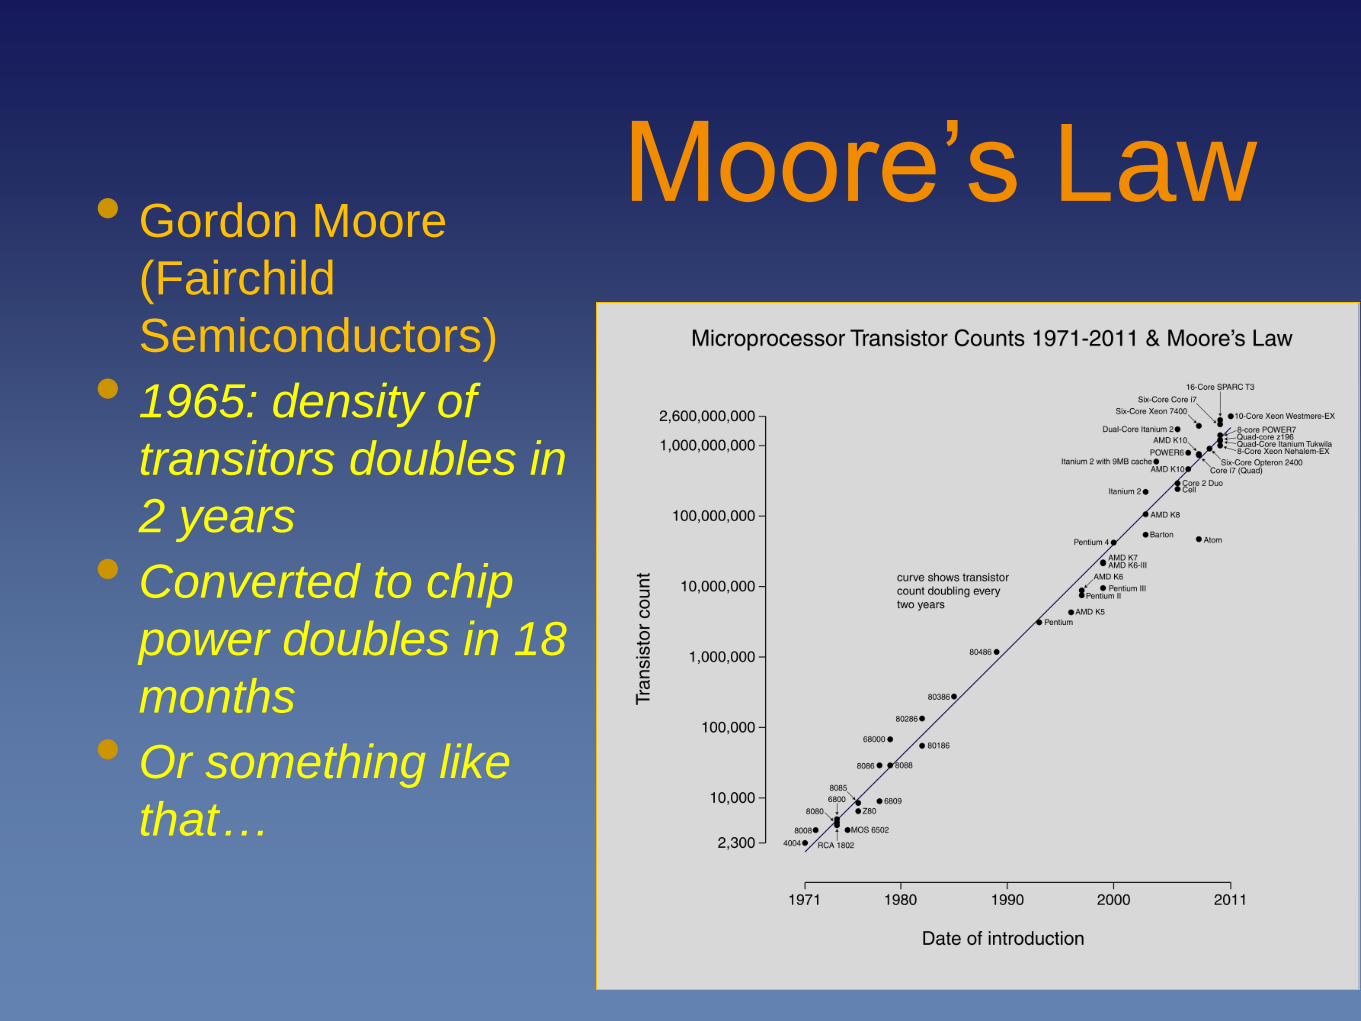
Moore’s Law• Gordon Moore
(Fairchild
Semiconductors)
• 1965: density of
transitors doubles in
2 years
• Converted to chip
power doubles in 18
months
• Or something like
that…
The Great Moore’s Law
Compensator (TGMLC)
• “Software is getting slower more rapidly
than hardware becomes faster” (Wirth 1995)
• Other versions attributed with ironic
reference to various devils (Bill Gates, etc.)
Consequences for Geographic
Information Science
• Databases expand to fill the available
space
• Operating systems and user interfaces
consume more and more cycles
• Overall laziness propped up by
expanding power and capacities
Inability to choose
• For now, we are storing everything.
• Delaying the moment when we will have
to return to the old rules of selection,
compilation;
• Hard truth that information has to be
extracted, reducing the data
Lessons?
• Is the technology really the issue?
• Is it important to use resources
sparingly (intelligently)?
• Is calculation essentially ‘free’?
• Does some unevaluated mass of crowd-
sourced, cloud-served stuff substitute
for what you really need?
Integration:
return to roots
• When Roger Tomlinson presented his
work on the “first GIS”, where did he
give the presentation?
… Canberra
• 26-31 August 1968
• Conference on Terrain Evaluation
• Hosted by CSIRO
Vibrant research community
• Terrain evaluation had an established
group of practitioners
• 1950s 60s, CSIRO
• 1960s ITC
• International focus, development
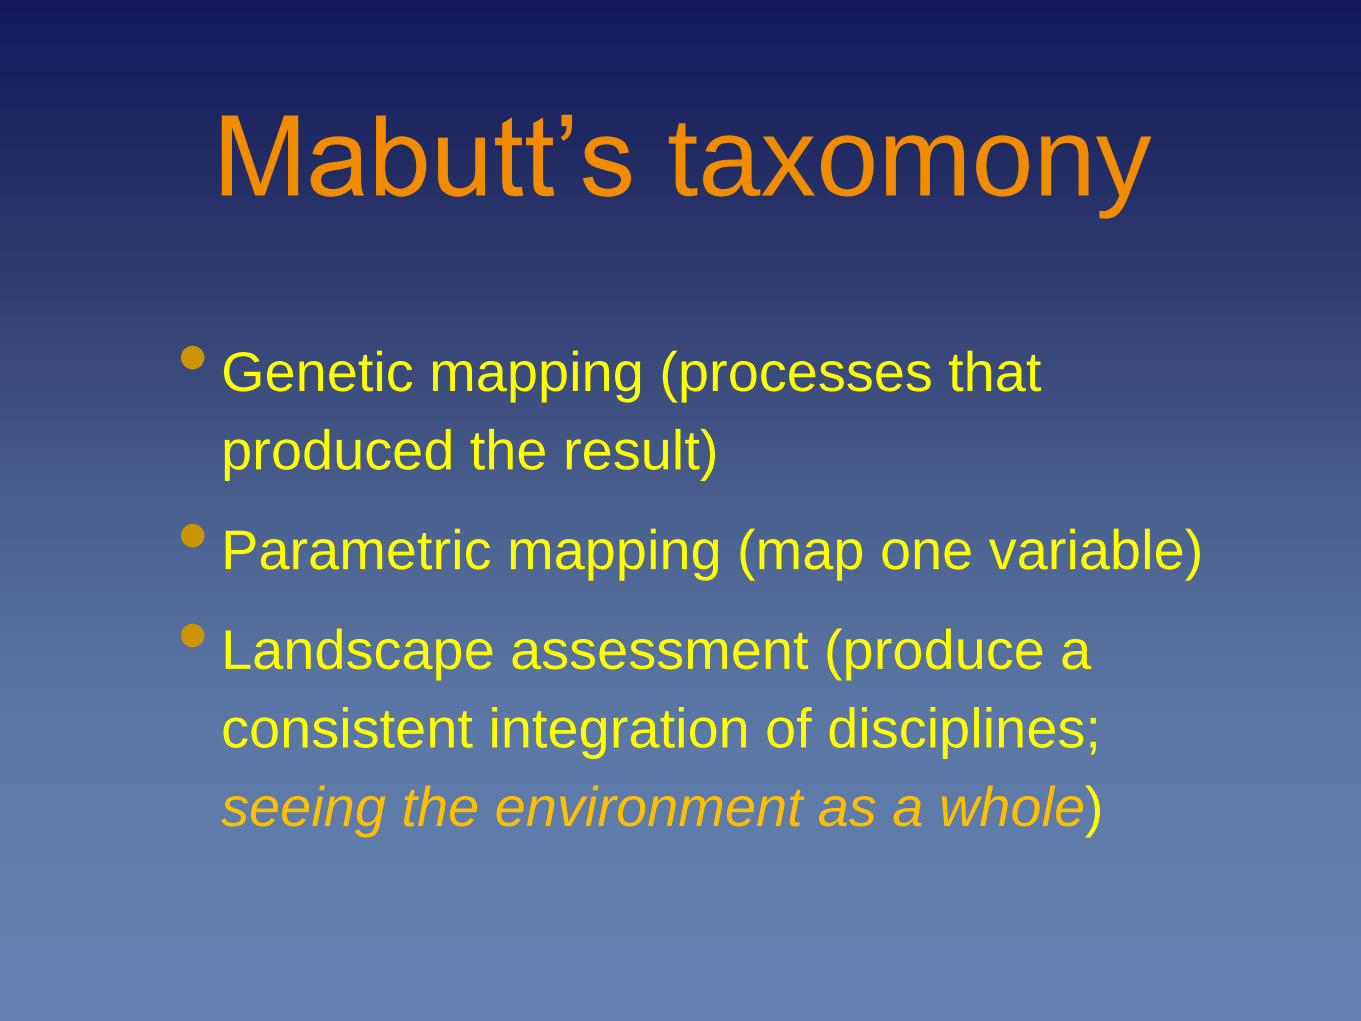
Mabutt’s taxomony
• Genetic mapping (processes that
produced the result)
• Parametric mapping (map one variable)
• Landscape assessment (produce a
consistent integration of disciplines;
seeing the environment as a whole)
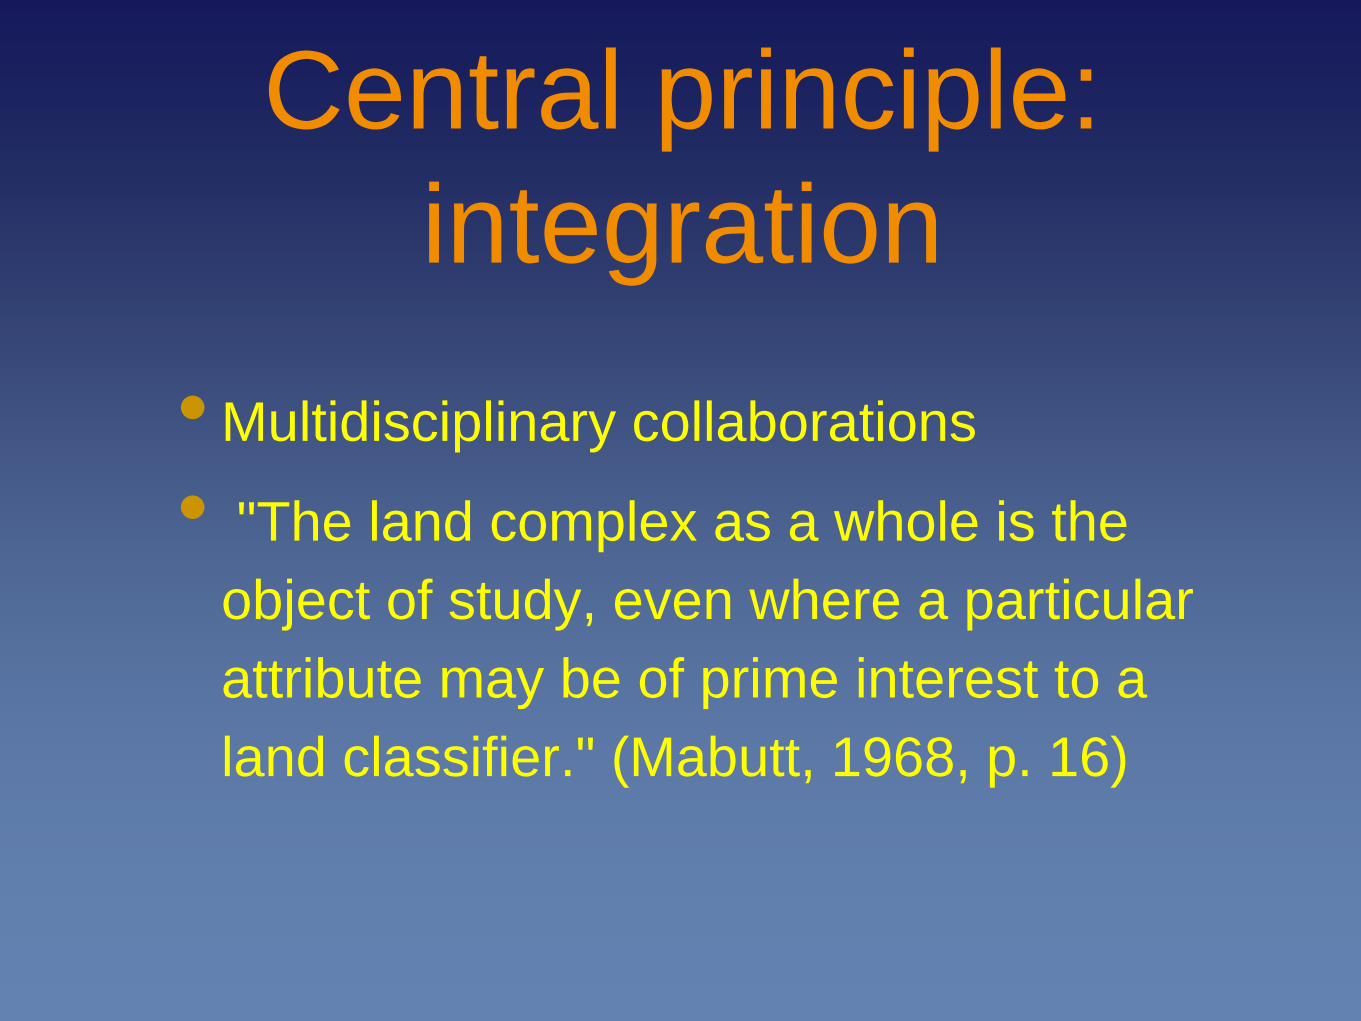
Central principle:
integration
• Multidisciplinary collaborations
• "The land complex as a whole is the
object of study, even where a particular
attribute may be of prime interest to a
land classifier." (Mabutt, 1968, p. 16)
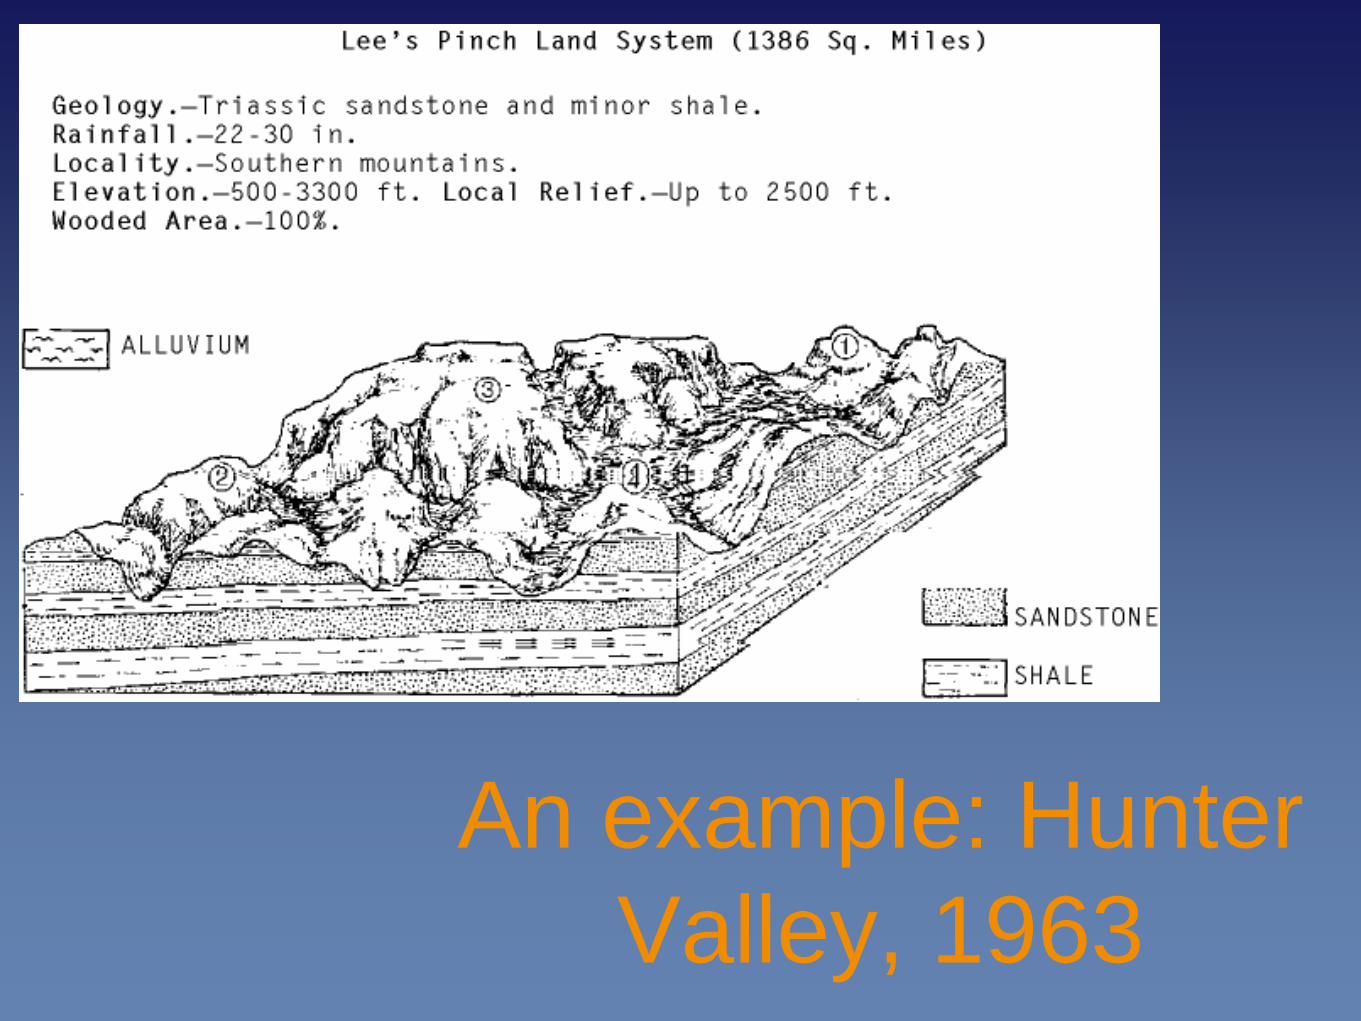
An example: Hunter
Valley, 1963
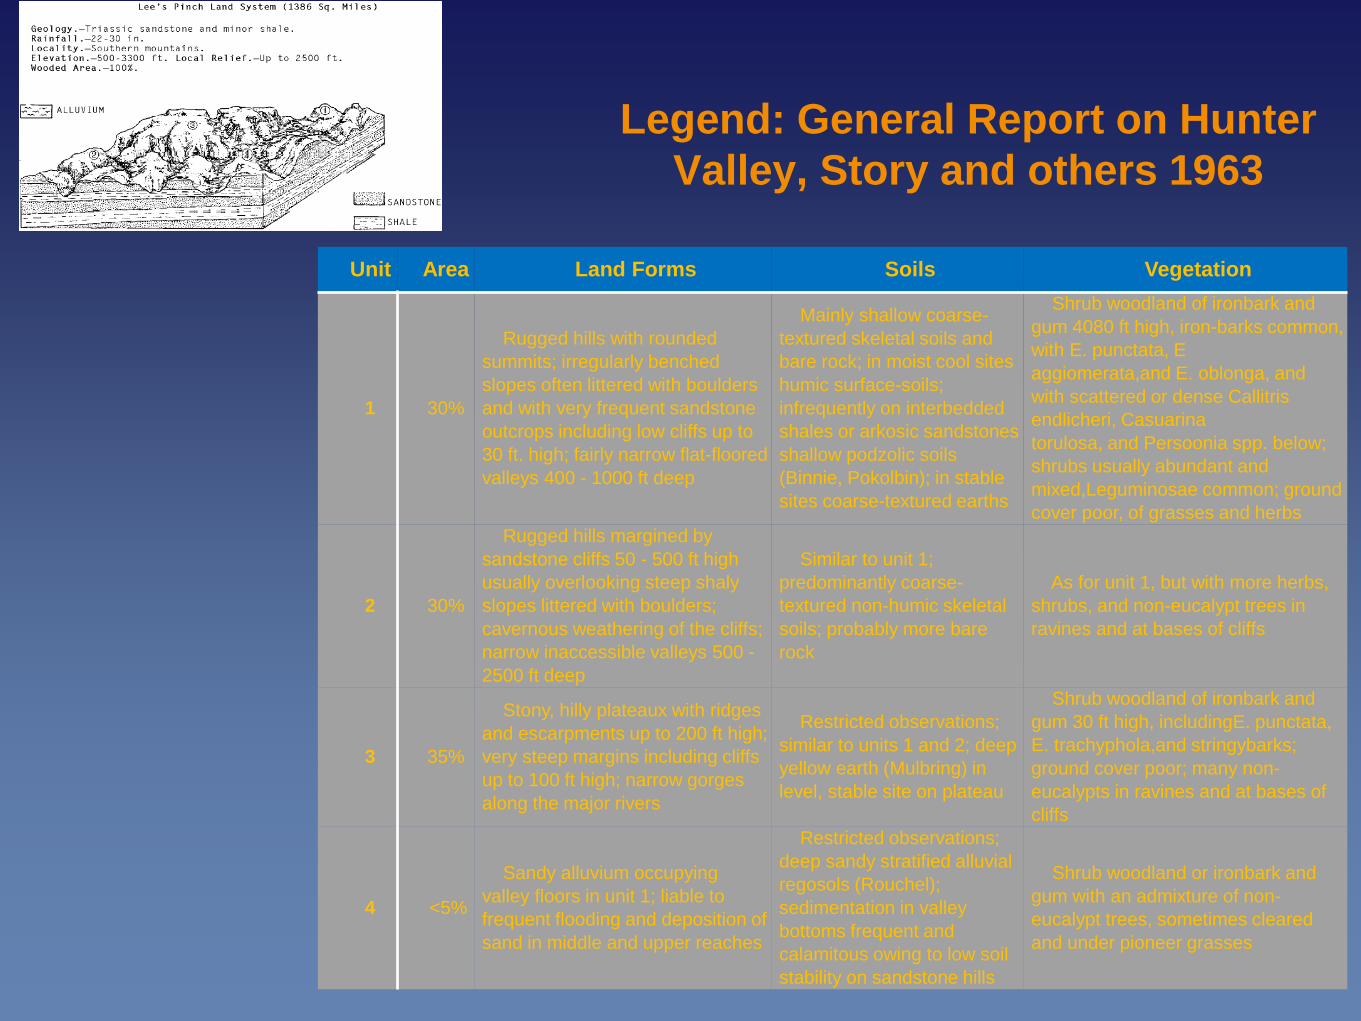
Legend: General Report on Hunter
Valley, Story and others 1963
Unit Area Land Forms Soils Vegetation
1 30%
Rugged hills with rounded
summits; irregularly benched
slopes often littered with boulders
and with very frequent sandstone
outcrops including low cliffs up to
30 ft. high; fairly narrow flat-floored
valleys 400 - 1000 ft deep
Mainly shallow coarse-
textured skeletal soils and
bare rock; in moist cool sites
humic surface-soils;
infrequently on interbedded
shales or arkosic sandstones
shallow podzolic soils
(Binnie, Pokolbin); in stable
sites coarse-textured earths
Shrub woodland of ironbark and
gum 4080 ft high, iron-barks common,
with E. punctata, E
aggiomerata,and E. oblonga, and
with scattered or dense Callitris
endlicheri, Casuarina
torulosa, and Persoonia spp. below;
shrubs usually abundant and
mixed,Leguminosae common; ground
cover poor, of grasses and herbs
2 30%
Rugged hills margined by
sandstone cliffs 50 - 500 ft high
usually overlooking steep shaly
slopes littered with boulders;
cavernous weathering of the cliffs;
narrow inaccessible valleys 500 -
2500 ft deep
Similar to unit 1;
predominantly coarse-
textured non-humic skeletal
soils; probably more bare
rock
As for unit 1, but with more herbs,
shrubs, and non-eucalypt trees in
ravines and at bases of cliffs
3 35%
Stony, hilly plateaux with ridges
and escarpments up to 200 ft high;
very steep margins including cliffs
up to 100 ft high; narrow gorges
along the major rivers
Restricted observations;
similar to units 1 and 2; deep
yellow earth (Mulbring) in
level, stable site on plateau
Shrub woodland of ironbark and
gum 30 ft high, includingE. punctata,
E. trachyphola,and stringybarks;
ground cover poor; many non-
eucalypts in ravines and at bases of
cliffs
4 <5%
Sandy alluvium occupying
valley floors in unit 1; liable to
frequent flooding and deposition of
sand in middle and upper reaches
Restricted observations;
deep sandy stratified alluvial
regosols (Rouchel);
sedimentation in valley
bottoms frequent and
calamitous owing to low soil
stability on sandstone hills
Shrub woodland or ironbark and
gum with an admixture of non-
eucalypt trees, sometimes cleared
and under pioneer grasses
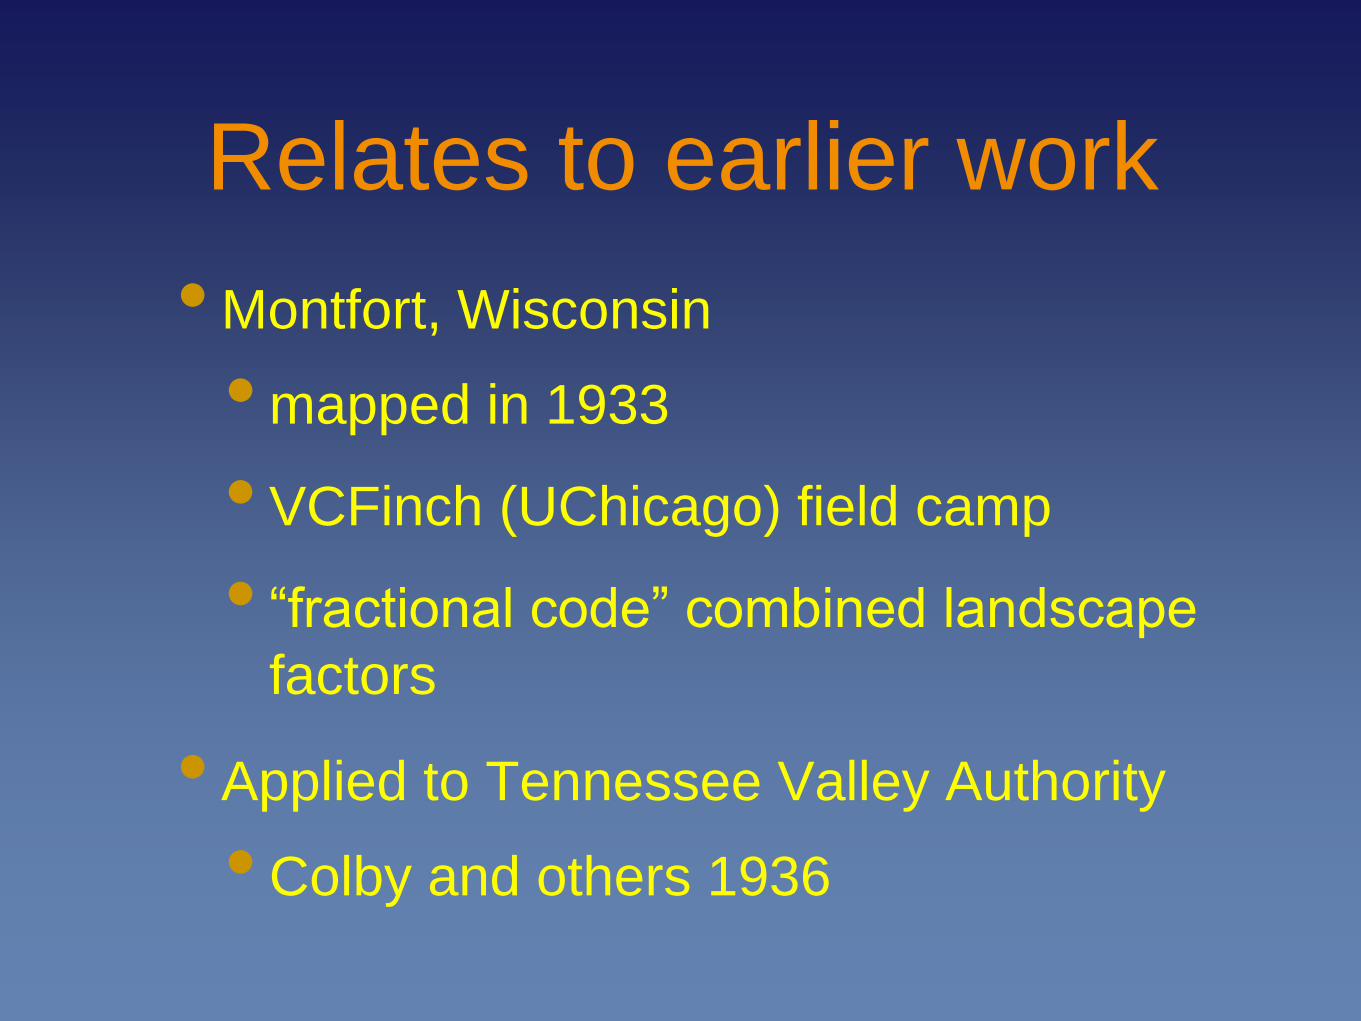
Relates to earlier work
• Montfort, Wisconsin
• mapped in 1933
• VCFinch (UChicago) field camp
• “fractional code” combined landscape
factors
• Applied to Tennessee Valley Authority
• Colby and others 1936
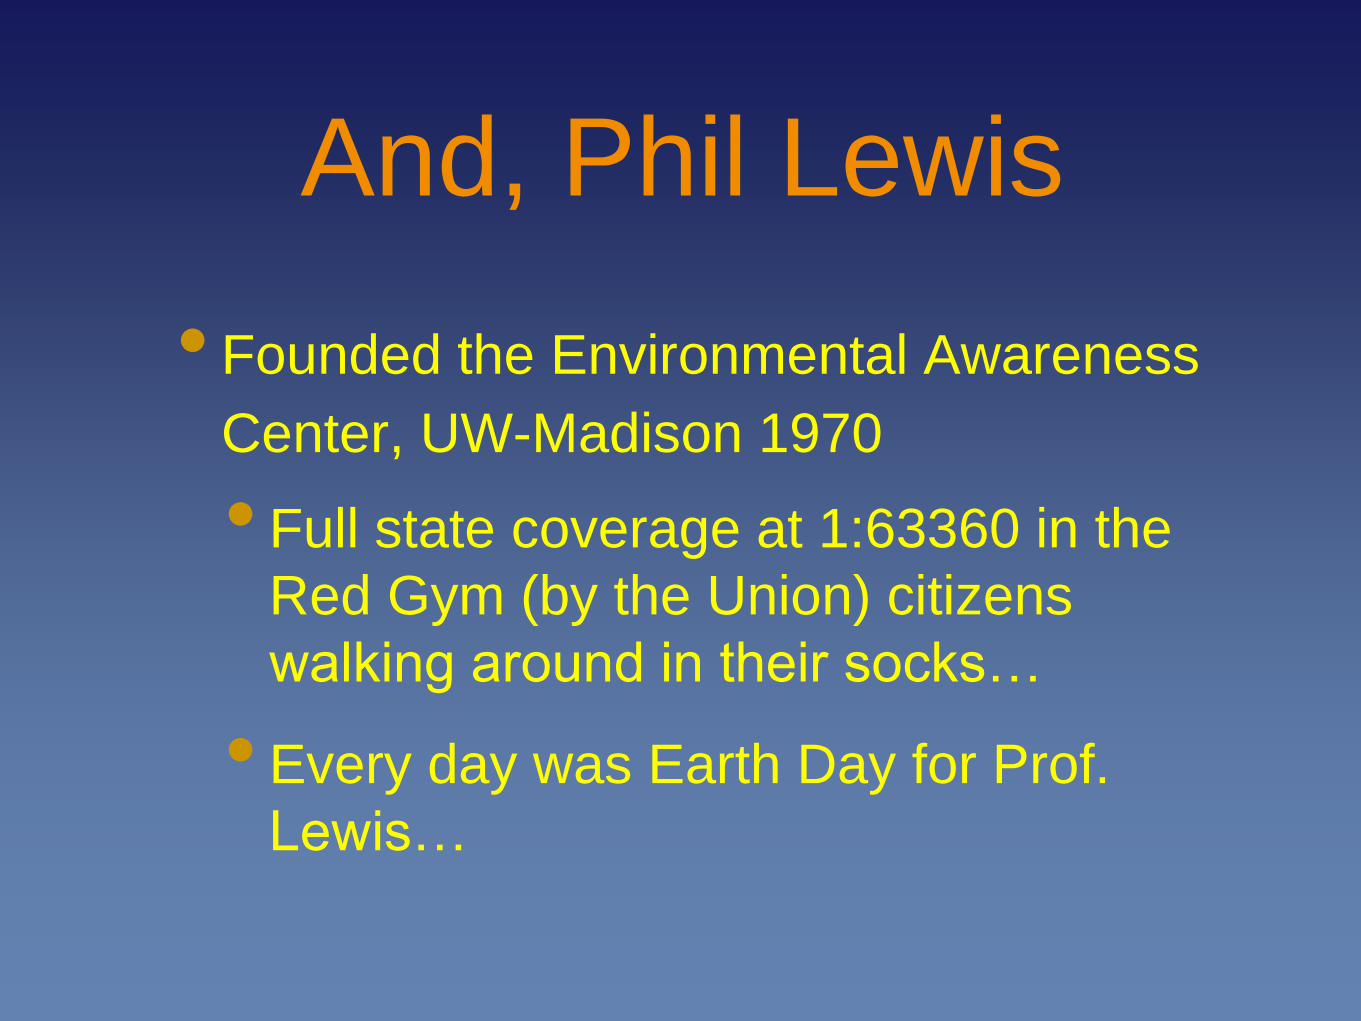
And, Phil Lewis
• Founded the Environmental Awareness
Center, UW-Madison 1970
• Full state coverage at 1:63360 in the
Red Gym (by the Union) citizens
walking around in their socks…
• Every day was Earth Day for Prof.
Lewis…
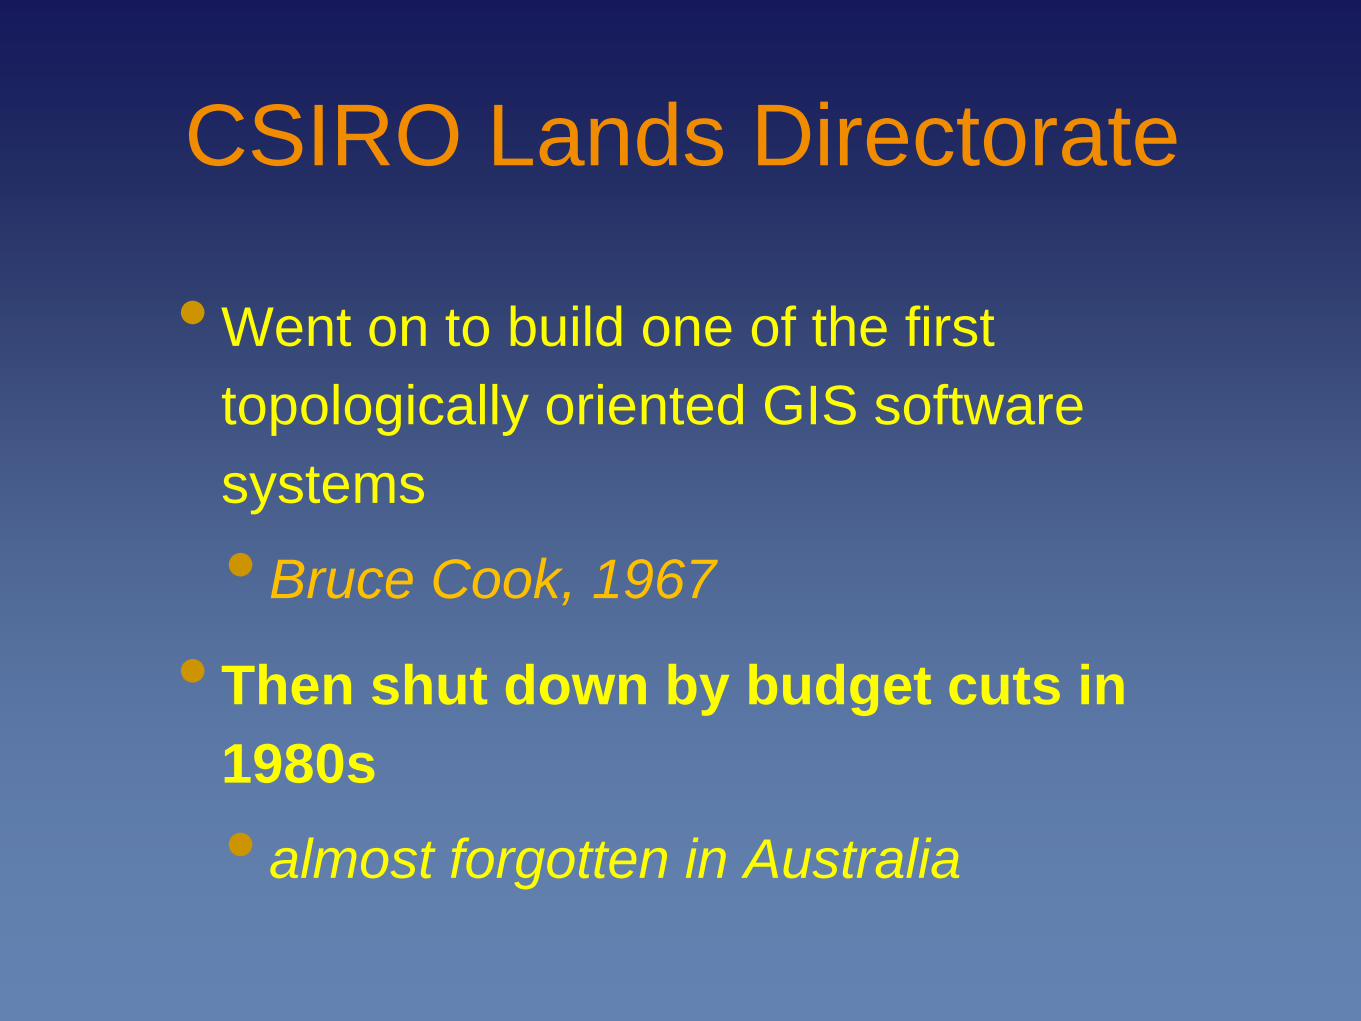
CSIRO Lands Directorate
• Went on to build one of the first
topologically oriented GIS software
systems
• Bruce Cook, 1967
• Then shut down by budget cuts in
1980s
• almost forgotten in Australia
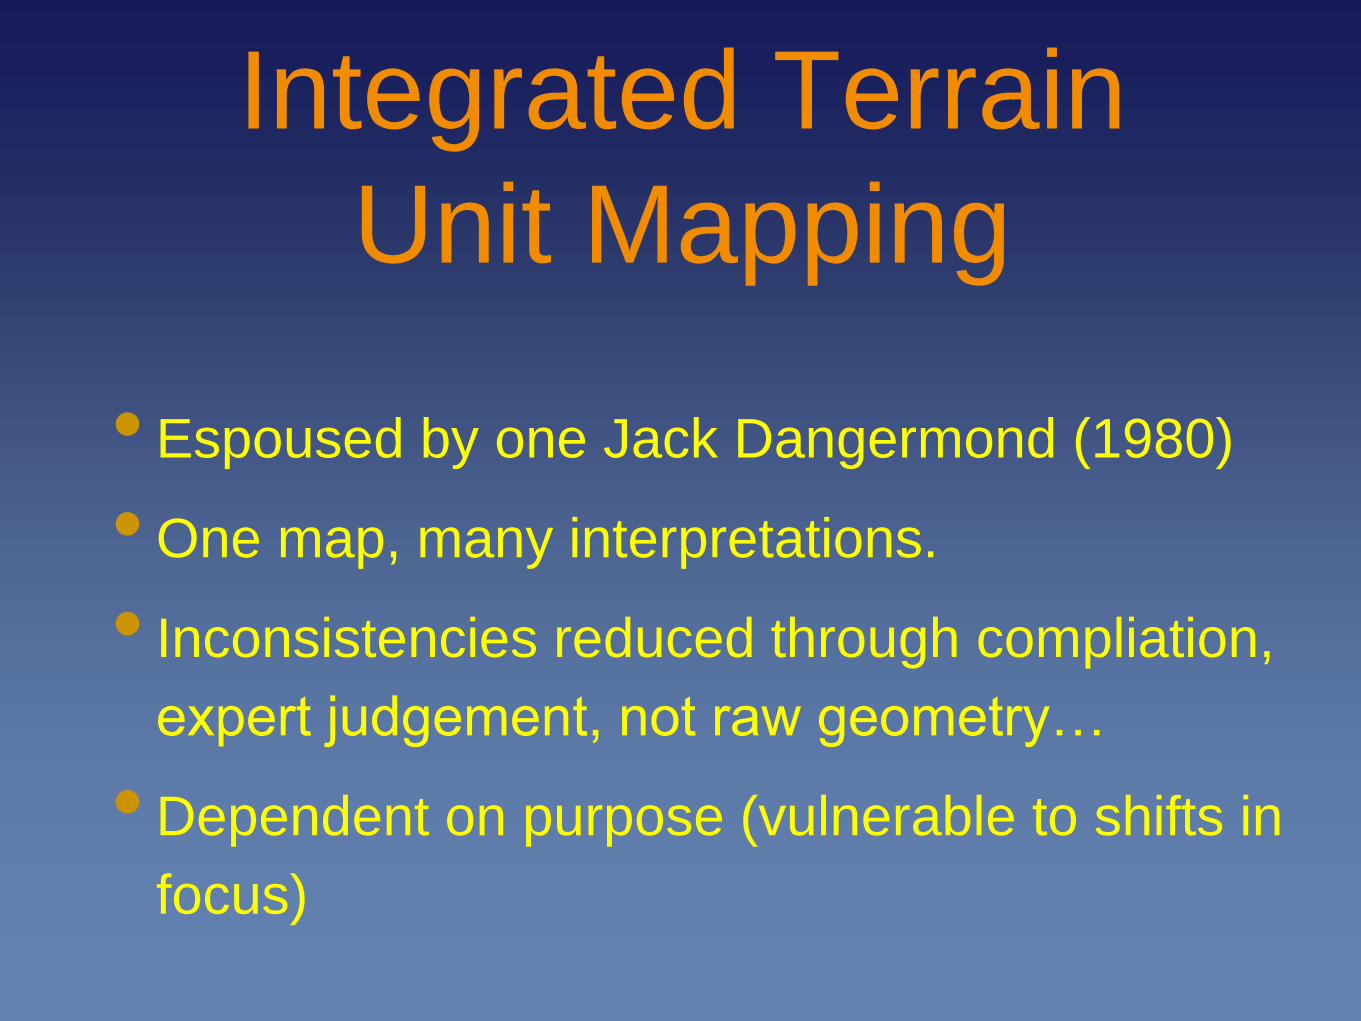
Integrated Terrain
Unit Mapping
• Espoused by one Jack Dangermond (1980)
• One map, many interpretations.
• Inconsistencies reduced through compliation,
expert judgement, not raw geometry…
• Dependent on purpose (vulnerable to shifts in
focus)
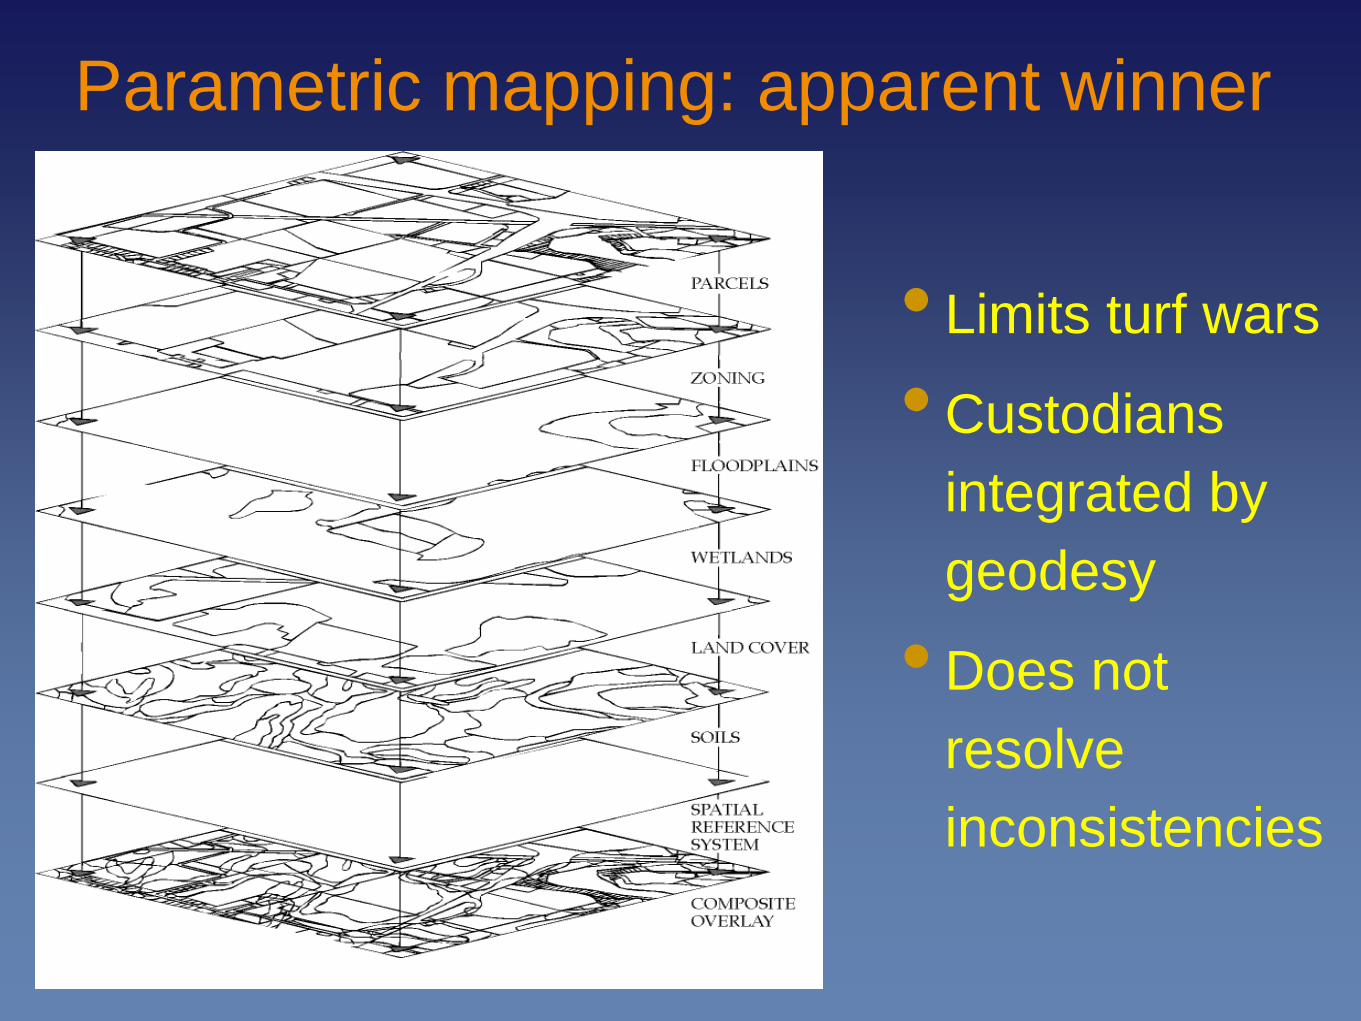
Parametric mapping: apparent winner
• Limits turf wars
• Custodians
integrated by
geodesy
• Does not
resolve
inconsistencies
Why?
• A better fit to institutional circumstances
• Modular
• Executed piecemeal / incremental
• Better? Remains to be proven…
Lesson:
• Remember that parametric maps (and
thus the layer model) are just one way
of seeing the world.
• Getting an institutional actor to shift
world-view may require geological
timescales…
comes down to
information
Extract from a paper:
Order from Noise:
Towards a social theory of information
Barbara Poore, US Geological Survey
Nick Chrisman, GEOIDE, Canada
Two conflicting models of information
• Both arise from Cybernetics movement in late 1940s
• Shannon [Bell Labs] (publicized by Weaver)
• Transmission model: encoding as bits
• Norbert Weiner [MIT, Lincoln Labs]
• Control of aircraft gunnery, cybernetics
• Feedback as main issue
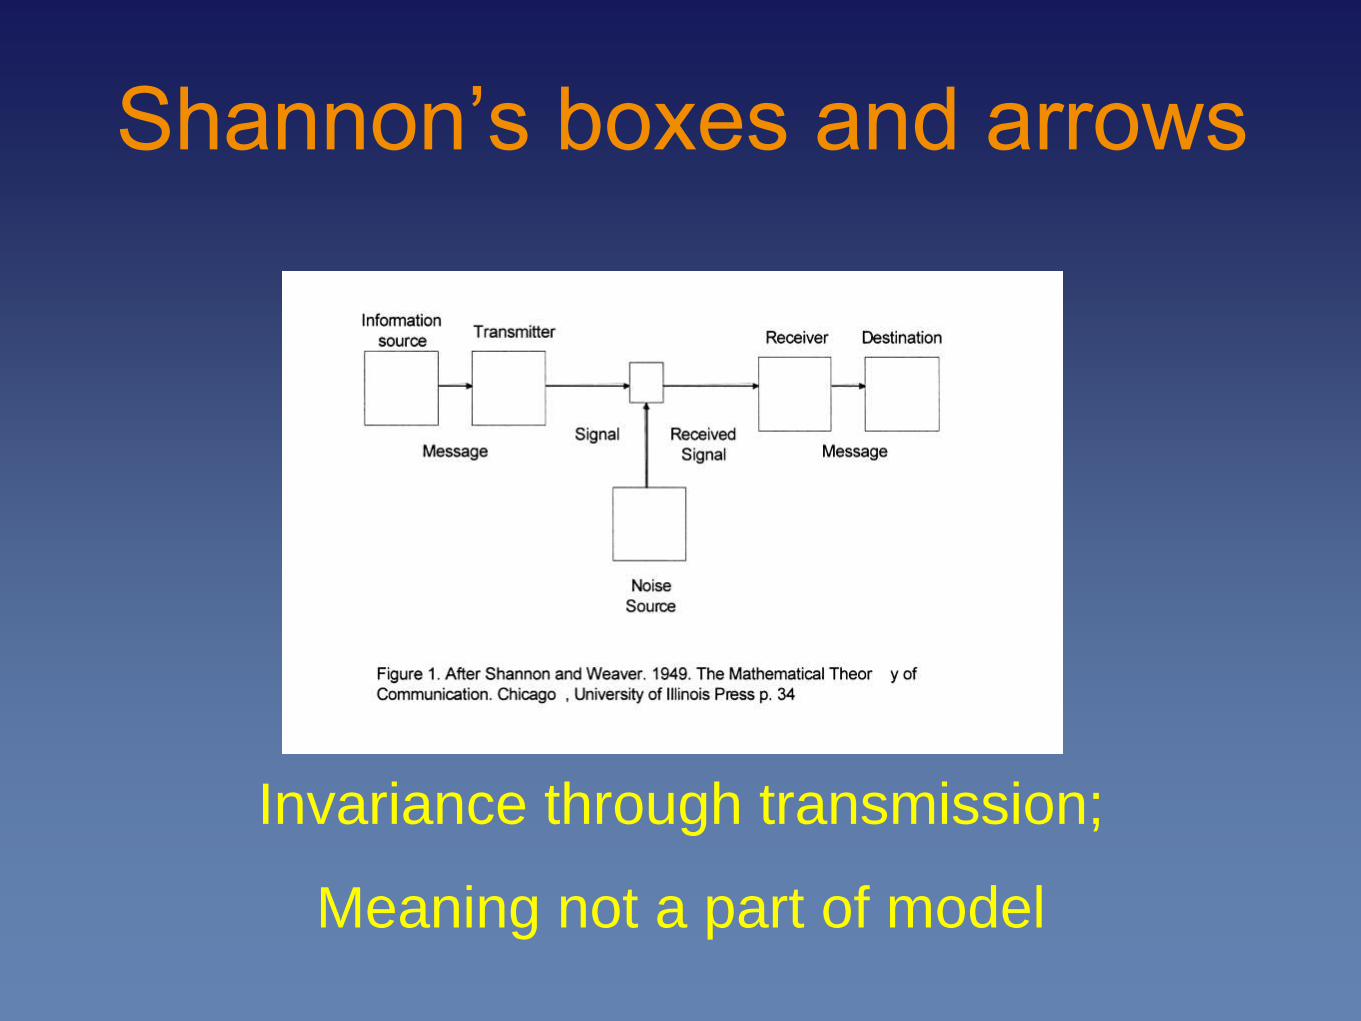
Shannon’s boxes and arrows
Invariance through transmission;
Meaning not a part of model
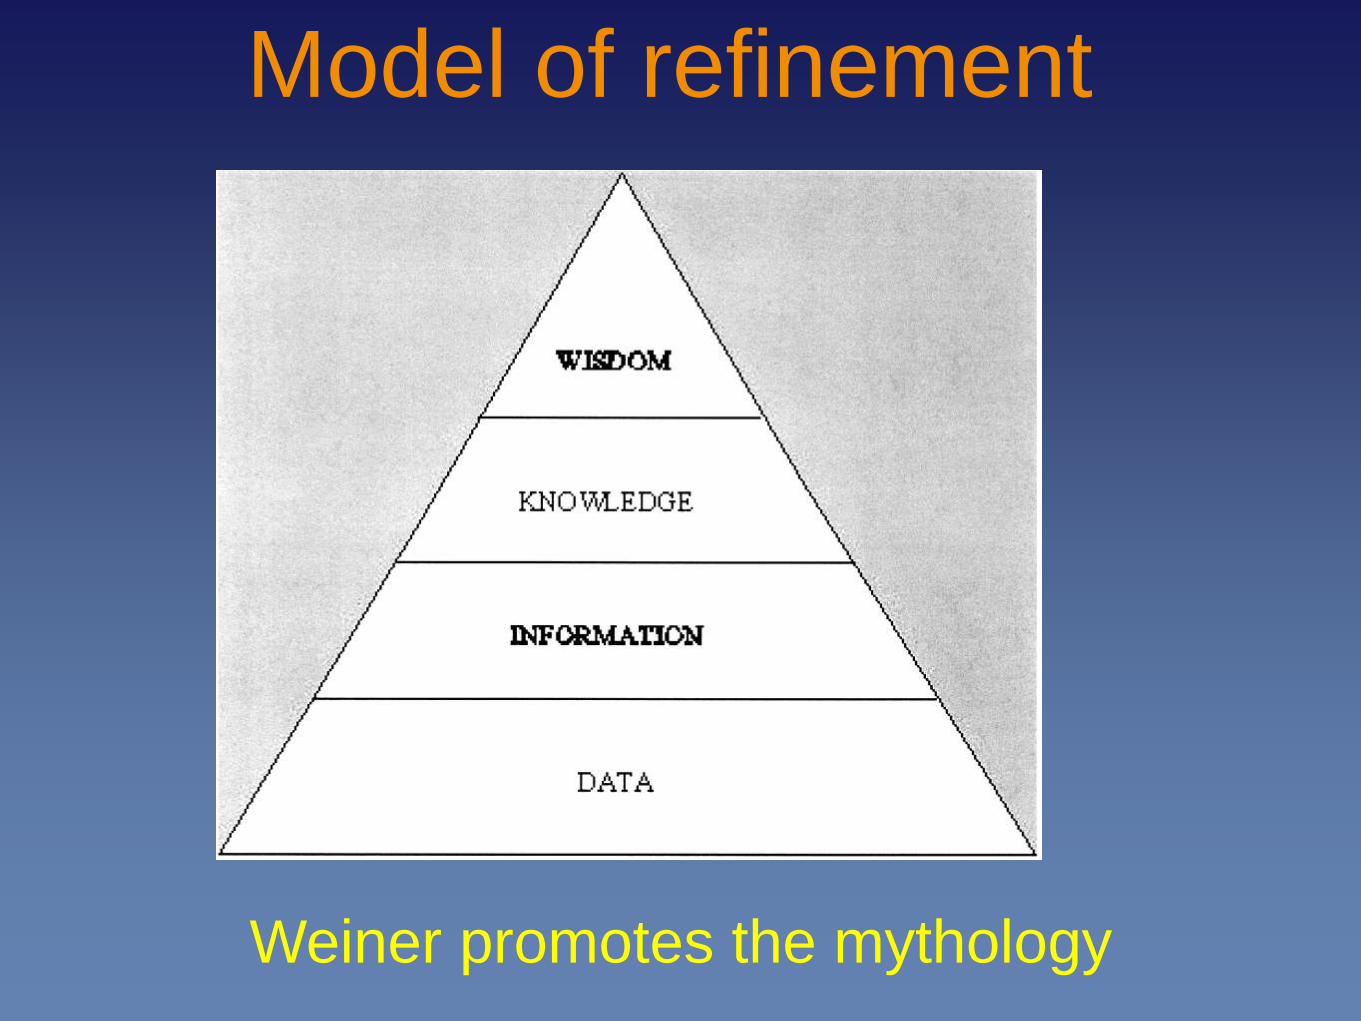
Model of refinement
Weiner promotes the mythology

How the information model
matters:
Treated as a “thing”, information is
capital, a precious resource
BUT, information is the result of work,
interactions of sensors and humans
• Sensor webs depend on a more
social view of information…
A social model of information
Goguen: an interpretation of a
configuration of signs for which
some social group is accountable.
Bateson: “a difference that makes a
difference”
And a consequence (or two)
• van Foerster: « you can turn a library
upside down, but not a drop of
information will flow out »
• All writing requires an audience;
meaning is interpreted by the reader
Defining Value
• Comes from use
• NOT inherent in the data
Conclusion
• History is written by the winners
• Good ideas do not always prevail
• Lessons to learn in what appear to be
dead-ends, and tracks not taken.
• Pay attention to the real source of value
It’s a long process
Toward Los Angeles; Dorothea Lange, 1937
Acknowledgements
• Research support
• Recent: RMIT
• Past: NSF, USA; GEOIDE, Canada
• USDA Hatch, US Soil Cons. Serv., WI DNR, Dane Co.
• Assistance: many students, colleagues and
collaborators
• Photo: Dorothea Lange (FSA, 1937…)