china activated carbon industry report, 2014 2017
TRANSCRIPT

China Activated Carbon Industry
Report, 2014-2017
Apr. 2015

METHODOLOGY
Both primary and secondary research methodologies were used
in preparing this study. Initially, a comprehensive and exhaustive
search of the literature on this industry was conducted. These
sources included related books and journals, trade literature,
marketing literature, other product/promotional literature, annual
reports, security analyst reports, and other publications.
Subsequently, telephone interviews or email correspondence
was conducted with marketing executives etc. Other sources
included related magazines, academics, and consulting
companies.
INFORMATION SOURCES
The primary information sources include Company Reports,
and National Bureau of Statistics of China etc.
STUDY GOAL AND OBJECTIVES
This report provides the industry executives with strategically significant
competitor information, analysis, insight and projection on the
competitive pattern and key companies in the industry, crucial to the
development and implementation of effective business, marketing and
R&D programs.
REPORT OBJECTIVES
To establish a comprehensive, factual, annually updated and cost-
effective information base on market size, competition patterns,
market segments, goals and strategies of the leading players in the
market, reviews and forecasts.
To assist potential market entrants in evaluating prospective
acquisition and joint venture candidates.
To complement the organizations’ internal competitor information
gathering efforts with strategic analysis, data interpretation and
insight.
To suggest for concerned investors in line with the current
development of this industry as well as the development tendency.
To help company to succeed in a competitive market, and
understand the size and growth rate of any opportunity.
Room 502, Block 3, Tower C, Changyuan Tiandi Building, No. 18, Suzhou Street, Haidian District, Beijing, China 100080 Phone: +86 10 82600828 ● Fax: +86 10 82601570 ● www.researchinchina.com ● [email protected]
Copyright 2012 ResearchInChina
Abstract
Over the recent years, the global activated carbon consumption has
kept growing with an AAGR of 5.5% or so, approximating 1.437
million tons in 2014. With the rising demand from the global
industrial environmental protection, home/automotive environmental
protection, water purification and other fields, the world’s demand
for activated carbon is expected to hit 1.733 million tons in 2017.
The global capacity of activated carbon is mainly concentrated in the
United States, Japan, France and a few other developed countries
as well as some developing countries like China and the Philippines
who abound in raw materials. The United States, Japan and France
devote themselves to producing medium and high-end activated
carbon products, while China manufactures low- and medium-end
products with inferior quality and low added value.
However, China is the world's largest producer of activated carbon in
terms of capacity, accounting for 43.2% of the global capacity.
China’s activated carbon output was about 588,800 tons in 2014.
As China’s environmental awareness gets enhanced and
environmental protection policies tightened, China’s demand for
activated carbon will present a CAGR of up to 6% in the next 3-5
years, higher than the global level.
Room 502, Block 3, Tower C, Changyuan Tiandi Building, No. 18, Suzhou Street, Haidian District, Beijing, China 100080 Phone: +86 10 82600828 ● Fax: +86 10 82601570 ● www.researchinchina.com ● [email protected]
Copyright 2012ResearchInChina
China is also a major exporter of activated carbon. However, Chinese activated carbon with a focus on low-end products suffers anti-
dumping investigations of some countries, thereby affecting the export in near future. In 2014, China exported 53,960 tons of wooden
activated carbon and 191,550 tons of other types of activated carbon.
At present, Chinese medium and high-end activated carbon markets are dominated by Calgon, Meadwestvaco, Cabot, CECA, Kuraray and
Osaka Gas Chemicals, who enter China usually by acquisitions or establishing plants with investments. Calgon has established three
wholly-owned subsidiaries in China, namely Calgon Carbon (Tianjin), Datong Carbon Corporation and Calgon Carbon (Suzhou).
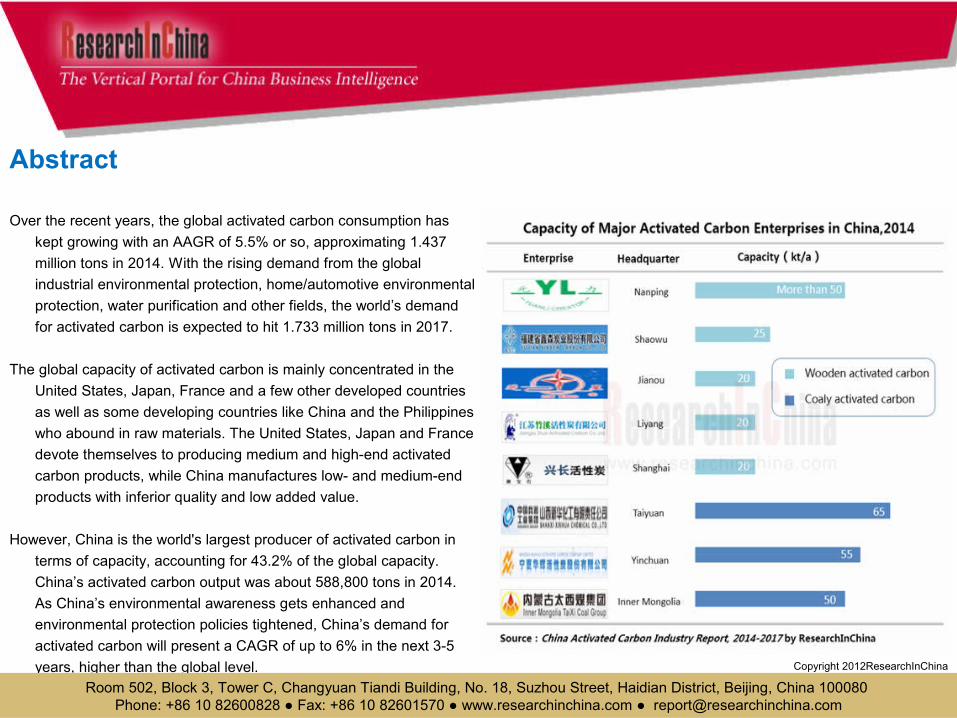
In China, activated carbon falls into wooden activated carbon and coaly activated carbon, which occupy 65.2% and 34.8% of the total output
in 2014 respectively.
The leading Chinese producers of wooden activated carbon are represented by Fujian Yuanli Active Carbon, Fujian Xinsen Carbon, Zhixing
Activated Carbon, Zhuxi Activated Carbon, etc.. Fujian Yuanli Active Carbon, a leader of the industry, sold 53,500 tons of activated carbon in
2014, up 11.2% year on year.
Among Chinese coaly activated carbon enterprises -- Xinhua Chemical, Huahui Activated Carbon and Taixi Coal, Xinhua Chemical ranked
first with the capacity of 65,000 tons in 2014. However, Datong Coal Jinding Activated Carbon may surpass Xinhua Chemical to become the
champion with the annual capacity of 100,000 tons by the end of 2015.
The report highlights the followings:
Overview of the global activated carbon industry, including status quo and major countries and regions;
Overview of China activated carbon industry, embracing status quo, development environments, import and export, competitive landscape,
upstream and downstream sectors, and development trends;
Six foreign activated carbon manufacturers and 19 Chinese counterparts, covering profile, operation, activated carbon business, etc..
Room 502, Block 3, Tower C, Changyuan Tiandi Building, No. 18, Suzhou Street, Haidian District, Beijing, China 100080 Phone: +86 10 82600828 ● Fax: +86 10 82601570 ● www.researchinchina.com ● [email protected]
Copyright 2012ResearchInChina

1. Overview of Activated Carbon Industry
1.1 Definition
1.2 Classification
1.3 Application and Sales Model
2. Development of Global Activated Carbon Industry
2.1 Status Quo
2.2 Major Countries and Regions
2.2.1 USA
2.2.2 Japan
2.2.3 Russia
2.2.4 Western Europe
2.2.5 Asia
3. Development of China Activated Carbon Industry
3.1 Status Quo
3.2 Development Environment
3.2.1 Regulatory System
3.2.2 Industry Policy
3.2.3 Trade Policy
3.3 Import and Export
3.3.1 Import
3.3.2 Export
3.4 Competition Pattern
3.5 Upstream and Downstream Sectors
Table of contents
Room 502, Block 3, Tower C, Changyuan Tiandi Building, No. 18, Suzhou Street, Haidian District, Beijing, China 100080 Phone: +86 10 82600828 ● Fax: +86 10 82601570 ● www.researchinchina.com ● [email protected]
3.5.1 Upstream
3.5.2 Downstream
3.6 Development Trends
3.6.1 Demand for Wooden Activated Carbon Ascends
3.6.2 Some Weak Small Firms will Retreat from the Market
3.6.3 Mergers and Reorganizations will Continue, and the Concentration Rate of the Industry will Climb
3.6.4 The Industry Tends to be Scaled up and Standardized
3.6.5 Product Quality will be Improved
4. Leading Activated Carbon Companies Worldwide
4.1 Calgon
4.1.1 Profile
4.1.2 Operation
4.1.3 Revenue Structure
4.1.4 Gross Margin
4.1.5 R & D and Investment
4.1.6 Development in China
4.1.7 Forecast and Outlook
4.2 Cabot Norit
4.2.1 Profile
4.2.2 Operation
4.2.3 Revenue Structure
4.2.4 Gross Margin
4.2.5 Activated Carbon Business
4.3 Meadwestvaco
4.3.1 Profile
4.3.2 Operation
4.3.3 Revenue Structure
4.3.4 Gross Margin
4.3.5 Activated Carbon Business
4.4 Kuraray
4.4.1 Profile
4.4.2 Development in China
4.5 Osaka Gas Chemicals Group
4.5.1 Profile
4.5.2 Osaka Gas Chemicals (OGC)
4.5.3 Japan EnviroChemicals (JEC)
4.6 CECA
4.6.1 Profile
5. Leading Wooden Activated Carbon Enterprises in China
5.1 Fujian Yuanli Active Carbon
5.1.1 Profile
5.1.2 Operation
5.1.3 Revenue Structure
5.1.4 Gross Margin
5.1.5 R & D and Investment
5.1.6 Customers and Suppliers
5.1.7 Production and Sales

5.2 Fujian Xinsen Carbon
5.2.1 Profile
5.2.2 Operation
5.2.3 Development
5.3 Fujian Zhixing Activated Carbon
5.3.1 Profile
5.3.2 Operation
5.3.3 R & D
5.3.4 Development
5.4 Jiangsu Zhuxi Activated Carbon
5.4.1 Profile
5.4.2 Operation
5.5 Quzhou Yunhe Carbon
5.5.1 Profile
5.5.2 Operation
5.6 Shanghai Xingchang Activated Carbon
5.6.1 Profile
5.6.2 Operation
5.6.3 Activated Carbon Business
5.7 Hangzhou Hengxing Activated Carbon
5.7.1 Profile
5.7.2 Operation
5.8 Guizhou Qianmin Activated Carbon
5.8.1 Profile
5.8.2 Operation
5.9 Others
5.9.1 Chifeng Zhongsen Zhongtian Chemical Industry
Table of contents
Room 502, Block 3, Tower C, Changyuan Tiandi Building, No. 18, Suzhou Street, Haidian District, Beijing, China 100080 Phone: +86 10 82600828 ● Fax: +86 10 82601570 ● www.researchinchina.com ● [email protected]
5.9.2 Golden Lake Carbon
5.9.3 Datong Locomotive Coal
6 Major Coaly Activated Carbon Enterprises in China
6.1 Ningxia Huahui Activated Carbon
6.1.1 Profile
6.1.2 Operation
6.2 Datong Municipal Yunguang Activated Carbon
6.2.1 Profile
6.2.2 Operation
6.3 Ningxia Guanghua Cherishmet Activated Carbon
6.3.1 Profile
6.3.2 Operation
6.4 Shanxi Xinhua Chemical
6.4.1 Profile
6.4.2 Shanxi Xinhua Activated Carbon
6.5 Inner Mongolia Taixi Coal
6.5.1 Profile
6.5.2 Operation
6.5.3 Activated Carbon Business
6.6 Datong Coal Jinding Activated Carbon
6.6.1 Profile
6.6.2 Activated Carbon Business
6.7 Others
6.7.1Huairen Huanyu Purification Materials
6.7.2 Shanxi Huaqing Activated Carbon

• Classification and Brief Introduction of Activated Carbon
• Application and Sales Model of Activated Carbon
• Global Demand for Activated Carbon and YoY Growth, 2008-2014
• Global Demand for Activated Carbon and YoY Growth, 2012-2017E
• Structure of Key Activated Carbon Supply Regions Worldwide (by Capacity), 2014
• Global Activated Carbon Demand Structure by Terminal Application, 2014
• Activated Carbon Demand Structure in USA by Application, 2014
• Activated Carbon Demand Structure in Japan by Application, 2014
• Activated Carbon Demand Structure in Western Europe by Application, 2014
• Distribution of Main Activated Carbon Production Areas in China
• Price Trend of Coconut Shell Activated Carbon in China, 2015
• China's Activated Carbon Output and YoY Growth Rate, 2008-2014
• China's Activated Carbon Output and YoY Growth Rate, 2012-2017E
• China's Activated Carbon Output Structure (by Type), 2014
• Activated Carbon Demand Structure in China by Application, 2014
• Policies on China Activated Carbon Industry, 2003-2013
• Name List of Chinese Activated Carbon Enterprises Exposed to Anti-Dumping Administrative Review Final Launched by USA and Anti-Dumping Duty, 2013
• Import Volume and Value of Wooden Activated Carbon in China, 2010-2014
• Top 10 Import Sources of Wooden Activated Carbon in China by Import Volume and Value, Jan-Feb 2015
• Import Volume and Value of Other Activated Carbon in China, 2010-2014
• Top 10 Import Sources of Other Activated Carbon in China by Import Volume and Value, Jan-Feb 2015
• Export Volume and Value of Wooden Activated Carbon in China, 2010-2014
• Top 10 Export Destinations of Wooden Activated Carbon in China by Export Volume and Value, Jan-Feb 2015
• Export Volume and Value of Other Activated Carbon in China, 2010-2014
Selected Charts
Room 502, Block 3, Tower C, Changyuan Tiandi Building, No. 18, Suzhou Street, Haidian District, Beijing, China 100080 Phone: +86 10 82600828 ● Fax: +86 10 82601570 ● www.researchinchina.com ● [email protected]

• Top 10 Export Destinations of Other Activated Carbon in China by Export Volume and Value, Jan-Feb 2015
• Capacity of Major Wooden Activated Carbon Companies in China, 2014
• Capacity of Major Coaly Activated Carbon Companies in China, 2014
• China’s Forestry Output Value and YoY Growth Rate, 2008-2014
• China's Wood Output and YoY Growth Rate, 2008-2014
• China's Log Output and YoY Growth Rate, 2008-2014
• China's Log Import Volume and Value, 2008-2014
• Price Trend of Phosphoric Acid (85%, Industrial Grade) in China, 2010-2015
• China's Anthracite Coal Output and YoY Growth Rate, 2009-2014
• Average Price of Anthracite Coal (by Type) in China, 2014
• China's Per Capita Water Consumption and YoY Growth Rate in China, 2008-2014
• Output and YoY Growth Rate of Bottled (Canned) Drinking Water in China, 2008-2014
• Emissions of Domestic Sewage and Industrial Wastewater in China, 2008-2014
• China's Starch Sugar Output and YoY Growth Rate, 2008-2014
• China's Sugar Output and YoY Growth Rate, 2008-2014
• China's Carbonated Beverage Output and YoY Growth Rate, 2008-2014
• Demand from China's Fermentation Industry for Activated Carbon (by Product), 2010-2016E
• Output Value and YoY Growth Rate of China's Pharmaceutical Manufacturing, 2008-2014
• China's Automobile Output and YoY Growth Rate, 2008-2014
• China's Automobile Sales Volume and YoY Growth Rate, 2008-2014
• Calgon's Revenue and Net Income, 2010-2014
• Calgon's Revenue (by Division), 2010-2014
• Calgon's Revenue Structure (by Division), 2010-2014
• Calgon's Revenue (by Region), 2010-2014
• Calgon's Revenue (by Product), 2010-2013
Selected Charts
Room 502, Block 3, Tower C, Changyuan Tiandi Building, No. 18, Suzhou Street, Haidian District, Beijing, China 100080 Phone: +86 10 82600828 ● Fax: +86 10 82601570 ● www.researchinchina.com ● [email protected]

• Calgon's Gross Margin, 2011-2013
• Calgon's R & D Costs and% of Total Revenue, 2010-2013
• Calgon's Capital Expenditure and YoY Growth Rate, 2010-2014
• Calgon's Revenue in China, YoY Growth Rate and % of Total Revenue
• Calgon's Revenue and Net Income, 2010-2017E
• Revenue and Net Income of Cabot, FY2010-FY2014
• Revenue of Cabot (by Product), FY2011-FY2014
• Revenue Structure of Cabot (by Product), FY2011-FY2014
• Revenue of Cabot (by Region), FY2011-FY2014
• Revenue Structure of Cabot (by Region), FY2011-FY2014
• Gross Margin of Cabot, FY2011-FY2014
• Activated Carbon Revenue, YoY Growth Rate and % of Total Revenue of Cabot, FY2011-FY2014
• MWV's Revenue and Net Income, 2010-2014
• MWV Revenue (by Division), 2012-2014
• MWV's Revenue Structure (by Division), 2012-2014
• MWV's Revenue (by Region), 2010-2014
• MWV's Revenue Structure (by Region), 2010-2014
• MWV's Gross Margin, 2010-2014
• Kuraray’s Subsidiaries
• Layout and Information of Activated Carbon Production Plants of Japan EnviroChemicals
• Subsidiaries of Fujian Yuanli Active Carbon
• Revenue and Net Income of Fujian Yuanli Active Carbon, 2010-2014
• Revenue of Fujian Yuanli Active Carbon (by Product), 2010-2013
• Revenue Structure of Fujian Yuanli Active Carbon (by Product), 2010-2013
• Revenue of Fujian Yuanli Active Carbon (by Region), 2010-2014
Selected Charts
Room 502, Block 3, Tower C, Changyuan Tiandi Building, No. 18, Suzhou Street, Haidian District, Beijing, China 100080 Phone: +86 10 82600828 ● Fax: +86 10 82601570 ● www.researchinchina.com ● [email protected]

• Revenue Structure of Fujian Yuanli Active Carbon (by Region), 2010-2014
• Gross Margin of Fujian Yuanli Active Carbon, 2010-2014
• Gross Margin of Fujian Yuanli Active Carbon (by Region), 2010-2014
• R & D Costs and % of Total Revenue of Fujian Yuanli Active Carbon, 2010-2014
• Implementation of Fundraising Projects of Fujian Yuanli Active Carbon, by 2014
• Progress of Research Projects of Fujian Yuanli Active Carbon, 2014
• Revenue of Fujian Yuanli Active Carbon from Top 5 Clients and % of Total Revenue, 2010-2014
• Procurement of Fujian Yuanli Active Carbon from Top 5 Suppliers and % of Total Procurement, 2010-2014
• Activated Carbon Output, Sales Volume and Inventory of Fujian Yuanli Active Carbon, 2011-2014
• Revenue and Net Income of Fujian Yuanli Active Carbon, 2013-2017E
• Capacity of Fujian Xinsen Carbon (by Product), 2014
• Activated Carbon Applications of Fujian Xinsen Carbon
• Revenue and Total Profit of Fujian Xinsen Carbon, 2007-2009
• Gross Margin of Fujian Xinsen Carbon, 2007-2009
• Total Assets and Total Liabilities of Fujian Xinsen Carbon, 2007-2009
• Revenue and Total Profit of Zhixing Activated Carbon, 2007-2011
• Gross Margin of Zhixing Activated Carbon, 2007-2009
• Total Assets and Total Liabilities of Zhixing Activated Carbon, 2007-2009
• Powdered Wooden Activated Carbon Output of Zhixing Activated Carbon, 2010-2012
• 50,000 t/a Activated Carbon Deep (Fine) Processing Project Planning of Zhuxi Activated Carbon
• Key Financial Data of Zhuxi Activated Carbon, 2008
• Revenue and Total Profit of Yunhe Carbon, 2007-2013
• Gross Margin of Yunhe Carbon, 2007-2009
• Total Assets and Total Liabilities of Yunhe Carbon, 2007-2013
• Revenue, Total Profit, Net Income, Total Assets and Total Liabilities of Xingchang Activated Carbon, 2013
Selected Charts
Room 502, Block 3, Tower C, Changyuan Tiandi Building, No. 18, Suzhou Street, Haidian District, Beijing, China 100080 Phone: +86 10 82600828 ● Fax: +86 10 82601570 ● www.researchinchina.com ● [email protected]

• Revenue, Total Profit, Net Income, Total Assets and Total Liabilities of Hengxing Activated Carbon, 2013
• Qianmin’s Revenue and Net Income, 2012-2013
• Registered Capital, Total Assets, Net Assets, Revenue and Net Income of Huahui Activated Carbon, 2011-2013
• Revenue and Total Profit of Yunguang Activated Carbon, 2007-2009
• Gross Margin of Yunguang Activated Carbon, 2007-2009
• Total Assets and Total Liabilities of Yunguang Activated Carbon, 2007-2009
• Revenue, Total Profit, Gross Margin, Total Assets and Total Liabilities of Guanghua Cherishmet, 2008-2009
• Main Production Lines and Capacity of Xinhua Activated Carbon
• Total Assets, Total Revenue, Total Profit, Net Income and Total Liabilities of Xinhua Activated Carbon, 2013-2014
• Revenue of Taixi Coal, 2010-2016E
• Activated Carbon Output, Sales Volume and Sales-Output Ratio of Taixi Coal, 2010-2013
• Total Assets, Total Revenue, Total Profit, Net Income and Total Liabilities of Huaqing Activated Carbon, 2013
Selected Charts
Room 502, Block 3, Tower C, Changyuan Tiandi Building, No. 18, Suzhou Street, Haidian District, Beijing, China 100080 Phone: +86 10 82600828 ● Fax: +86 10 82601570 ● www.researchinchina.com ● [email protected]
You can place your order in the following alternative ways:
1.Order online at www.researchinchina.com
2.Fax order sheet to us at fax number:+86 10 82601570
3. Email your order to: [email protected]
4. Phone us at +86 10 82600828/ 82601561
Party A:Name:Address:Contact Person: TelE-mail: Fax
Party B:Name: Beijing Waterwood Technologies Co., Ltd (ResearchInChina)Address: Room 502, Block 3, Tower C, Changyuan Tiandi Building, No. 18,
Suzhou Street, Haidian District, Beijing, China 100080Contact Person:
Liao Yan Phone:
86-10-82600828
E-mail: [email protected] Fax: 86-10-82601570Bank details:
Beneficial Name: Beijing Waterwood Technologies Co., LtdBank Name: Bank of Communications, Beijing BranchBank Address: NO.1 jinxiyuan shijicheng,Landianchang,Haidian District,BeijingBank Account No #: 110060668012015061217Routing No # : 332906Bank SWIFT Code: COMMCNSHBJG
Title Format Cost
Total
Choose type of format
PDF (Single user license) …………..2,100 USD
Hard copy ………………….……. 2,250 USD
PDF (Enterprisewide license)…....... 3,300 USD
※ Reports will be dispatched immediately
once full payment has been received.
Payment may be made by wire transfer or
credit card via PayPal.
How to Buy
Room 502, Block 3, Tower C, Changyuan Tiandi Building, No. 18, Suzhou Street, Haidian District, Beijing, China 100080 Phone: +86 10 82600828 ● Fax: +86 10 82601570 ● www.researchinchina.com ● [email protected]
About ResearchInChina
ResearchInChina (www.researchinchina.com) is a leading independent provider of China business intelligence. Our research is designed to meet the diverse planning and information needs of businesses, institutions, and professional investors worldwide. Our services are used in a variety of ways, including strategic planning, product and sales forecasting, risk and sensitivity management, and as investment research.
Our Major Activities
Multi-users market reports
Database-RICDB
Custom Research
Company Search
RICDB (http://www.researchinchina.com/data/database.html ), is a visible financial data base presented by map and graph covering global and China macroeconomic data, industry data, and company data. It has included nearly 500,000 indices (based on time series), and is continuing to update and increase. The most significant feature of this base is that the vast majority of indices (about 400,000) can be displayed in map.
After purchase of our report, you will be automatically granted to enjoy 2 weeks trial service of RICDB for free.
After trial, you can decide to become our formal member or not. We will try our best to meet your demand. For more information, please find at www.researchinchina.com
For any problems, please contact our service team at:
Room 502, Block 3, Tower C, Changyuan Tiandi Building, No. 18, Suzhou Street, Haidian District, Beijing, China 100080 Phone: +86 10 82600828 ● Fax: +86 10 82601570 ● www.researchinchina.com ● [email protected]
RICDB service