chemotaxis increases vertical migration and apparent transverse dispersion of bacteria in a...
TRANSCRIPT

ARTICLE
Chemotaxis Increases Vertical Migration andApparent Transverse Dispersion of Bacteria in aBench-Scale Microcosm
Kathryn L. Strobel,1 Sara McGowan,1 Robert D. Bauer,2 Christian Griebler,2 Jun Liu,1
Roseanne M. Ford1
1Department of Chemical Engineering, University of Virginia, Charlottesville, Virginia
22904; telephone: 434-924-6283; fax: 434-982-2658; e-mail: [email protected] of Groundwater Ecology, Helmholtz ZentrumMunchen, German Research Center
for Environmental Health, Neuherberg, Germany
Received 15 November 2010; revision received 28 February 2011; accepted 22 March 2011
Published online 14 April 2011 in Wiley Online Library (wileyonlinelibrary.com). DOI 10.1002/bit.23159
ABSTRACT: The success of in situ bioremediation is oftenlimited by the inability to bring bacteria in contact with thepollutant, which they will degrade. A bench-scale modelaquifer was used to evaluate the impact of chemotaxis on themigration of bacteria toward the source of a chemicalpollutant. The model was packed with sand and aqueousmedia was pumped across horizontally, simulating ground-water flow in a homogenous aquifer. A vertical gradient inchemoattractant was created by either a continuous injec-tion of sodium benzoate or a pulse injection of sodiumacetate. A pulse of chemotactic Pseudomonas putida F1 or anon-chemotactic mutant of the same species was injectedbelow the attractant. The eluent was sampled at the micro-cosm outlet to generate vertical concentration profiles of thebacteria and chemoattractant. Moment analysis was used todetermine the center and variance of the bacterial profiles.The center of the chemotactic bacterial population waslocated at an average of 0.74� 0.07 cm closer to the levelat which the chemoattractant was injected than its non-chemotactic mutant in benzoate experiments (P< 0.015)and 0.4� 0.2 cm closer in acetate experiments (P< 0.05).The transverse dispersivity of the chemotactic bacteria was4� 1� 10�3 cm higher in benzoate experiments than thetransverse dispersivity of the non-chemotactic mutant and1� 2� 10�3 cm higher in acetate experiments. These resultsunderscore the contribution of chemotaxis to improvetransport of bacteria to contaminant sources, potentiallyenhancing the effectiveness of in situ bioremediation.
Biotechnol. Bioeng. 2011;108: 2070–2077.
� 2011 Wiley Periodicals, Inc.
KEYWORDS: chemotaxis; bioremediation; microcosm;transverse dispersivity
Introduction
In situ bioremediation, a technology that relies on bacteriato degrade contaminants underground, has the potential toefficiently and economically clean-up contaminatedgroundwater. The effectiveness of this technology is limited,however, by the inability to successfully deliver selecteddegrader populations to the source of contamination(Boopathy, 2000). Contaminant exposure to bacteria isespecially poor in areas of low hydraulic conductivity,resulting in pockets of residual contaminant that continue toslowly leach into high conductivity layers after remediation.
Chemotaxis, the ability of some bacteria to sense andswim preferentially towards higher concentrations ofchemical attractants, could potentially improve bioreme-diation in isolated areas by directing bacteria to the source ofcontamination (Ford and Harvey, 2007; Marx and Aitken,2000; Parales and Haddock, 2004). Chemotaxis has beenwell characterized in open aqueous systems (e.g., Adler,1973; Ford et al., 1991) but chemotaxis in saturated porousmedia is still not well understood. Because enhanced in situbioremediation via bioaugmentation is dependent on thedegrading bacteria coming into contact with the contami-nant, characterizing bacterial transport through saturatedporous media is critical to determine the potential impact ofchemotaxis on bioremediation.
Only a few studies have been reported that quantify theeffect of chemotaxis in two-dimensional experimentalsystems with convective flow through porous media.Long and Ford (2009) used a microfluidic device, a porousT-sensor, to directly observe the migration of a bacterialpopulation transverse to the flow direction in response to achemoattractant gradient. Migration transverse to flow wasgreater for chemotactic bacteria than a non-chemotacticmutant used as a control. The observed chemotacticresponse was greater than what was predicted from an
Correspondence to: R.M. Ford
Contract grant sponsor: National Science Foundation
Contract grant number: EAR 04-08454; EAR 07-11377
2070 Biotechnology and Bioengineering, Vol. 108, No. 9, September, 2011 � 2011 Wiley Periodicals, Inc.

advection–dispersion equation for unidirectional flow in aporous medium. Thus, the coupling between fluid flow andchemotaxis appears to augment the effect of chemotaxis.Wang and Ford (2009) showed that chemotaxis enhancestransverse bacterial migration using a laboratory scalepacked column with a structured physical heterogeneity. Todemonstrate that chemotaxis produces an observable effectin more complex systems at larger scales, bench-scaleexperiments are an important intermediate step towardquantifying the impact of chemotaxis on bioremediation.
The objective of this study was to determine thesignificance of chemotaxis on bacterial transport toward achemoattractant in a homogeneous two-dimensionalbench-scale model aquifer. Two-dimensional microcosmslike the one in this study have been used previously to studyvarious aspects of the subsurface environment such asbiodegradation, chemotaxis, dispersion, and bioclogging(Bauer et al., 2009b; Boyd, 2007, M.S. Thesis, University ofVirginia; Cirpka et al., 2006; Thullner et al., 2004; Weisbrodet al., 2003). To accomplish this objective, the migration ofbacterial plumes under well-controlled conditions in amicrocosm was monitored. A chemoattractant source wasmaintained above the level at which bacteria were injected.The hypothesis that was tested was that chemotactic bacteriawould migrate upward toward the source of the con-taminant relative to a non-chemotactic mutant populationthat served as the control.
Materials and Methods
A total of eight experiments were performed, four withacetate as the chemoattractant and four with benzoate as thechemoattractant. For each attractant, two replicates wereperformed with Pseudomonas putida F1, which is chemo-tactic toward both attractants and two experiments wereperformed with P. putida CheA, a motile, but non-
chemotactic mutant of the same species. Using two differentattractants and slightly different experimental conditions(described bellow) allowed the observation of chemotaxisunder different situations that could arise in a naturalaquifer.
Two-Dimensional Microcosm System
The microcosm used in all experiments, shown in Figure 1,was constructed at the Institute of Groundwater Ecology atthe Helmholtz Center (Munich, Germany). Similar to thesystem used by Bauer et al. (2009a), it has inner dimensions of95.0 cm� 14 cm� 1 cm and is composed of a Teflon base,aluminum fittings, two sheets of glass, and silicon sealant. Theinlet and outlet ends of the system contained 12 ports with avertical spacing of 1.0 cm. Stainless steel capillaries (1/16 in.,Alltech, Flemington, NJ) were used as inflow and outflowports and were coupled to pump tubing (acetate experiments:1.02mm ID, Ismatec, Glattbrugg, CH; benzoate experiments:0.89mm ID, Thermo Scientific, Dubuque, IA), which ranthrough two peristaltic pumps (acetate experiments: ICP,Ismatec; benzoate experiments: Manostat Carter, ThermoScientific). Inflow capillaries extended 0.5 cm into themicrocosm, while outflow capillaries were flush with theTeflon wall. Steel wire gauze was used to cover the tips ofthe outflow ports to prevent plugging by sediment grains. Themicrocosm was packed with Ottowa sand with an averagegrain diameter of approximately 710mm. To maintain steadyflow through the microcosm the flow rates of the pumps wereset such that the overall flow from the 12 outlet ports wasapproximately 5% higher than the overall flow from the 11inlet ports. The overflow on the outlet side was captured bythe uppermost port, thereby maintaining an unsaturatedzone at the top of the sand and keeping the water levelconstant. The interstitial velocity used in experiments wasapproximately 3.9m/day for acetate experiments and 1.1m/day for benzoate experiments.
Figure 1. Schematic view of the two-dimensional microcosm system indicating a continuous contaminant plume and pulse injection of bacteria. (1) Reservoir containing
aqueous media; (2) reservoir for benzoate attractant; (3a,b) peristaltic pumps maintaining a homogeneous flow regime; (4) syringe for injecting bacteria; (5) two-dimensional
sediment microcosmwith 12 inlet and outlet ports and filled with sand; (6) multi-channel syringe pump replacing 3b during sampling periods in acetate experiments; (7) conical tubes
for collecting tank outlet during sampling in benzoate experiments. Adapted from Bauer et al. (2009b).
Strobel et al.: Chemotaxis Increases Bacteria Migration 2071
Biotechnology and Bioengineering

Between all experiments, the microcosm was unpackedand sterilized with 0.3MNaOH or 70% ethanol, then rinsedwith distilled water. The sand was washed with 0.3MNaOH,rinsed with distilled water, then autoclaved for allexperiments.
Media
The porous medium used in all experiments was 20–30mesh Ottawa sand with grain sizes that ranged from 590 to840mm. The liquid medium pumped across the microcosmwas 10% M9 minimal medium (Sambrook et al., 1989)(27 g/L Na2HPO4, 30 g/L KH2PO4, 5 g/L NaCl, 10 g/L NH4Cl, 10mM MgSO4, and 0.1mM CaCl2, pH adjustedto 7.0 with NaOH). To generate homogenous packing, themicrocosm was filled initially with M9 media and then wetsand was slowly added in 2–4mm-thick layers at a time.Although, in some instances, layering was observable usingthis method, transport of the tracers were unaffected. Afterthe system was filled with sand, an unsaturated zone of1.5 cm was established at the top of the microcosm.
Bacteria Strain, Inoculation, and Cultivation
Two bacterial strains were used in the experiments: a wild-type for chemotaxis P. putida F1 (Harwood et al., 1989) anda motile but non-chemotactic mutant P. putida CheA (Liuet al., 2009) A frozen aliquot of bacteria was thawed, and 50–200mL was used to inoculate 50mL of growth media in a250mL Erlenmeyer flask. Growth media in acetate experi-ments was 90% of a 1:10 dilution of M9 minimal media and10% Luria Broth augmented with 1mM sodium acetate.Growth media in benzoate experiments was ModifiedHutner’s Mineral Base Media augmented with 2mMsodium benzoate. After inoculation, flasks were placed ona shaker table (acetate experiments: Lab Line Orbit EnvironShaker; benzoate experiments: Max Q 4000, ThermoScientific) rotating at 150 rpm at approximately 288C for12–24 h depending on inoculation volume and growthmedia. Bacteria were harvested after reaching an OD(590 nm) of approximately 1.0 in acetate experiments(DU-7, Beckman Coulter, Fullerton, CA) and 0.8 inbenzoate experiments (DU 730, Beckman Coulter). TheseOD values corresponded to the mid-exponential growthphase of the bacteria. The bacteria solution was filteredthrough a 0.22mm Durapore1 membrane filter (Millipore,Billerica, MA) and resuspended in 10% M9 to reach a finalconcentration of 0.2–2.5� 109 cells/mL.
Injections and Sampling
Before beginning the experiments, steady flow behavior inthe microcosm was confirmed by injecting colored tracers aspulses and continuous injections. These visually confirmedthat both injection types traveled steadily and horizontally
across the system, centered at the same vertical location thatthey entered.
In acetate experiments, a pulse injection of sodium acetatewas used to generate a chemoattractant concentrationgradient transverse to flow. In benzoate experiments, whichwere performed after the completion of the acetateexperiments, a continuous injection of sodium benzoatewas used to increase the exposure of the bacterial populationto the chemoattractant as it traveled along the length of thechamber. Colored tracers were added to the bacteria andchemoattractant injections in all experiments in order tovisually verify that the plumes traveled horizontally acrossthe tank.
In acetate experiments, approximately 1mL of 10% M9media containing 10mM sodium acetate, 0.1 g/L rezazurin,and 0.05 g/L sodium bromide was injected into inlet port 6.A syringe containing the solution was connected to theinflow tubing and the injectate was pumped into themicrocosm at the same flow rate as the inflow using theIsmatec pump. In benzoate experiments, inlet port 5 was fedcontinuously with 10% M9 medium containing 2–5mMsodium benzoate and 0.2 g/L of either uranine or rezazurinthrough the multichannel pump, keeping the flow rateidentical to the other inlet ports. A 0.75–1.0mL aliquot ofbacterial solution was injected into port 10 of themicrocosmby connecting a sterile syringe to the inflow tubing andinjecting by hand over approximately 60 s. In acetateexperiments, the bacteria were injected in the same manneras the pulse of sodium acetate and at the same time. Inbenzoate experiments, the bacteria were injected 3–5 h afterbeginning the continuous sodium benzoate injection. For allbacterial injections, resazurin or uranine tracer was added tobacteria solutions suspended in 10%M9 medium to achievea final tracer concentration of 0.2 g/L.
In all eight experiments, sampling was conducted at theoutflow ports. The collection of samples was started at themoment the visual marker in the bacterial pulse reached theend of the tank and was continued until the entire pulsepassed through the outlet. Although the mass of bacteriainjected may have been partly retarded in the porous media,causing the colored tracer to reach the outlet ahead of themain breakthrough of bacteria, mass balance estimatesrevealed that the entire amount of cells injected left the flow-through system. Therefore, our sampling strategy issuggested to be reliable for a direct comparison ofchemotactic and non-chemotactic transport. In acetateexperiments, sampling was done using a multi-channelsyringe pump (WPI, Berlin, Germany) holding 10mL steriledisposable syringes (Becton Dickinson, Franklin Lakes, NJ).Samples were taken of the first and second halves of theplumes through ten outflow ports. The syringe pump was setto the same flow rate as the peristaltic pump connected tothe outflow tubing, so the linear velocity in the microcosmremained constant throughout sampling. In benzoateexperiments, sampling was done by placing each outletpump tube in a 15mL conical-shaped tube. Approximately4–7mL of sample was collected from each port in order to
2072 Biotechnology and Bioengineering, Vol. 108, No. 9, September, 2011
capture the entire colored plume. Samples were kept on iceuntil analysis.
Sample Analysis
Bacteria concentrations were determined using epifloures-cence enumeration (Hobbie et al., 1997). Samples werestained with SYBR1 Gold nucleic acid stain (MolecularProbes, Invitrogen Detection Technologies, Eugene, OR) inacetate experiments and with acridine orange in benzoateexperiments. After staining, samples were filtered onto blackpolycarbonate filters (GE Osmonics, Minnetonka, MN) forepifluorescence microscopy. Filters were dried and placedon glass microscope slides (Fisher Scientific, Pittsburgh,PA), a drop of immersion oil (Type A, Cargille Laboratories,Cedar Grove, NJ) was applied, and a cover glass (FisherScientific) was placed on top of the filter. Slides were storedin slide boxes in the refrigerator until counted. A ZeissStandard Fluorescence microscope and 100� objective lens(Zeiss Ph3 F100/1.25 Oil, 160/-) were used for epifluores-cence enumeration.
In two experiments, benzoate concentrations weredetermined using HPLC (1200 Series LC, Agilent, SantaClara, CA). Samples were injected into a PhenomenexHypersil 5 C18 reverse phase column. Acidified water (5%phosphoric acid) and methanol were used as carrier phase.The gradient changed from 20% to 55% methanol over3min and held for 6min before changing back to 20% over1min. The flow rate was 0.4mL/min and benzoate wasdetected at 240 nm.
Results and Discussion
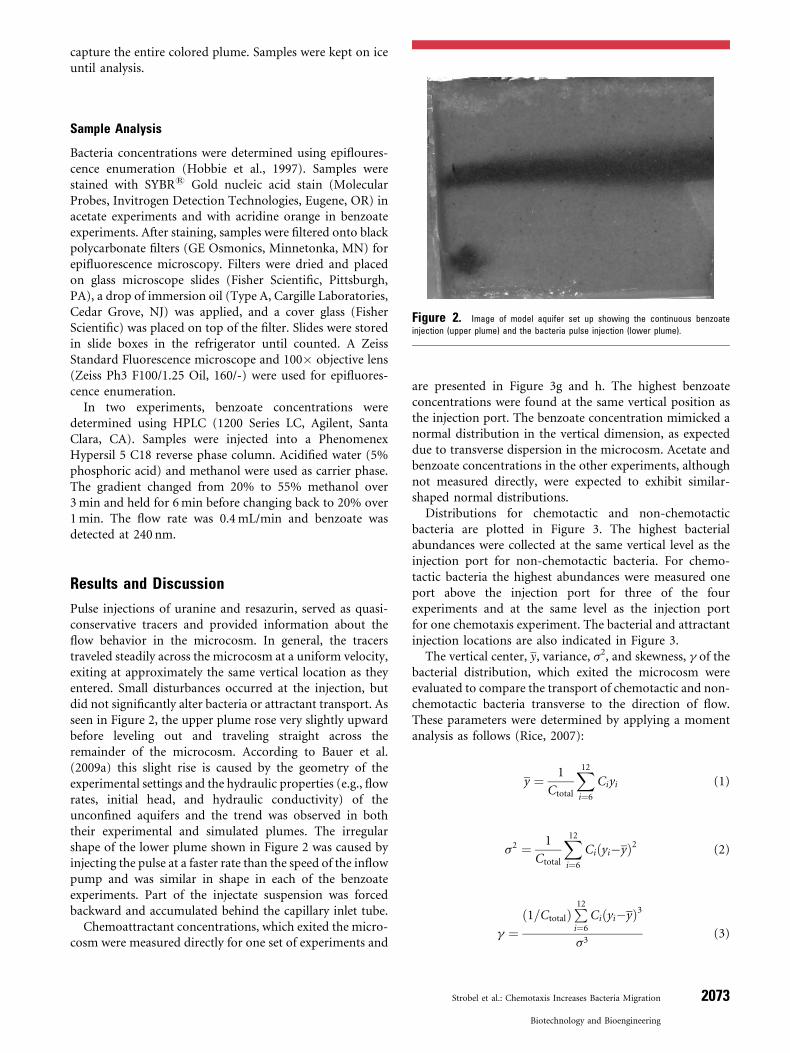
Pulse injections of uranine and resazurin, served as quasi-conservative tracers and provided information about theflow behavior in the microcosm. In general, the tracerstraveled steadily across the microcosm at a uniform velocity,exiting at approximately the same vertical location as theyentered. Small disturbances occurred at the injection, butdid not significantly alter bacteria or attractant transport. Asseen in Figure 2, the upper plume rose very slightly upwardbefore leveling out and traveling straight across theremainder of the microcosm. According to Bauer et al.(2009a) this slight rise is caused by the geometry of theexperimental settings and the hydraulic properties (e.g., flowrates, initial head, and hydraulic conductivity) of theunconfined aquifers and the trend was observed in boththeir experimental and simulated plumes. The irregularshape of the lower plume shown in Figure 2 was caused byinjecting the pulse at a faster rate than the speed of the inflowpump and was similar in shape in each of the benzoateexperiments. Part of the injectate suspension was forcedbackward and accumulated behind the capillary inlet tube.
Chemoattractant concentrations, which exited the micro-cosm were measured directly for one set of experiments and
are presented in Figure 3g and h. The highest benzoateconcentrations were found at the same vertical position asthe injection port. The benzoate concentration mimicked anormal distribution in the vertical dimension, as expecteddue to transverse dispersion in the microcosm. Acetate andbenzoate concentrations in the other experiments, althoughnot measured directly, were expected to exhibit similar-shaped normal distributions.
Distributions for chemotactic and non-chemotacticbacteria are plotted in Figure 3. The highest bacterialabundances were collected at the same vertical level as theinjection port for non-chemotactic bacteria. For chemo-tactic bacteria the highest abundances were measured oneport above the injection port for three of the fourexperiments and at the same level as the injection portfor one chemotaxis experiment. The bacterial and attractantinjection locations are also indicated in Figure 3.
The vertical center, y, variance, s2, and skewness, g of thebacterial distribution, which exited the microcosm wereevaluated to compare the transport of chemotactic and non-chemotactic bacteria transverse to the direction of flow.These parameters were determined by applying a momentanalysis as follows (Rice, 2007):
y ¼ 1
Ctotal
X12
i¼6
Ciyi (1)
s2 ¼ 1
Ctotal
X12
i¼6
Ciðyi�yÞ2 (2)
g ¼ð1=CtotalÞ
P12
i¼6
Ciðyi�yÞ3
s3(3)
Figure 2. Image of model aquifer set up showing the continuous benzoate
injection (upper plume) and the bacteria pulse injection (lower plume).
Strobel et al.: Chemotaxis Increases Bacteria Migration 2073
Biotechnology and Bioengineering

where, Ctotal is the sum of the bacterial concentrationscollected from each port analyzed, Ci is the bacterialconcentration at port i and yi is the vertical position of port i.Low levels of bacteria (about 10 times lower than the peakmicrobe concentrations sampled) were observed in theupper ports of the microcosm for all experiments and areassumed to be background contamination. Although, allcomponents of the system were sterilized prior to eachexperiment, the microcosm was not assembled or packed
using sterile techniques. Also, the sediment used to pack themicrocosm most likely contained dead bacteria even afterwashing and autoclaving that still contained DNA and werethus stained and counted. Both of these factors were likely tohave contributed to the low background levels of bacteriathroughout the microcosm. To account for these back-ground levels the average concentration of bacteria fromports 2–5, the upper four ports that were sampled, wassubtracted from each of the lower seven ports. Bacterial
Figure 3. Bacterial abundance in the effluent samples normalized by the initial injectate concentration for chemotactic (a, c, e, and g) and non-chemotactic (b, d, f, and h)
bacteria. Benzoate concentrations in the effluent samples normalized by the initial concentration in the injectate are included in panels g and h. Equation (4) was used to generate a
normal distribution using the parameters from the moment analysis for the benzoate and non-chemotactic bacterial distributions and is plotted with the average background
concentration added to the output.
2074 Biotechnology and Bioengineering, Vol. 108, No. 9, September, 2011

concentrations from the upper four ports were thus set tozero and did not contribute to the center, variance, andskewness calculations.
The center and variance values determined for eachexperiment were used to generate normal distributions forthe non-chemotactic bacteria and benzoate according to(Rice, 2007):
f ðy; y; s2Þ ¼ 1ffiffiffiffiffiffiffiffiffiffi2ps2
p e�ðy�yÞ2=ð2s2Þ (4)
As seen in Figure 3, the normal distribution provides agood fit to the benzoate and non-chemotactic bacteriaprofiles. The normal distribution, however, does notaccount for the chemotactic bacteria swimming preferen-tially toward the chemoattractant, which tends to producean asymmetric distribution with a bias in the direction of thechemoattractant.
For experiments with non-chemotactic bacteria in thepresence of benzoate, the vertical center of the bacterialdistribution was slightly lower than the original injectionlocation. Settling of the non-chemotactic bacteria plume wasobserved consistently in the experiments and was morepronounced at slower velocities. It is reasonable to assumethat the density of the bacteria was greater than the aqueousmedium (Harvey et al., 1997), and at the slow fluid velocities(�1.0m/day) used in experiments with benzoate, somesettling may have occurred. A settling velocity of 44 nm/swas calculated for a spherical particle with a diameter of 1mand a density 2% greater than the aqueous medium, averagevalues for cultured groundwater bacteria such as P. putida(Harvey et al., 1997). Over the course of an experimentlasting 21 h, the average residence time in the benzoateexperiments, such a particle would be expected to settleapproximately at 0.3 cm, which is comparable to the�0.2 cm distance reported in Table I.
The variance calculated from Equation (2) was used todetermine the transverse dispersion coefficient, DT, of thebenzoate and bacteria, from the Einstein relationship(Cussler, 1997)
DT ¼ s2
2t(5)
where, t is the residence time of the injectate in themicrocosm. These values were then used to calculate thedispersivity, aT, according to Scheidegger (1961)
DT ¼ Deff þ aTv (6)
where, n is the velocity in the direction of flow and Deff is theeffective diffusion coefficient. The effective diffusioncoefficient, estimated as 1.5� 0.6� 10�7 cm2/s (Olsonet al., 2005), was small compared to the second term ofEquation (6) and was neglected for this analysis.
Values for the vertical center of mass, variance, dispersioncoefficient, and dispersivity are presented in Table I for eachof the experimental configurations, including chemotaxis ofP. putida F1 toward acetate and benzoate, dispersion ofnonchemotactic bacteria P. putida F1 CheA in the presenceof acetate and benzoate, and the dispersion of benzoate only.
The center of mass of the chemotactic bacteria was higherfor the experiments with benzoate as a chemoattractant thanthe experiments using acetate. This was anticipated becausethe continuous injection of benzoate led to a more stableconcentration gradient over the length of the microcosmthan the pulse injection of acetate. Another possible reasonfor the stronger response in the benzoate experiments wasthe slower velocity (1.1m/day) compared with acetateexperiments (3.9m/day). Wang and Ford (2009) found thatP. putida exhibited a chemotactic response to acetate in apacked column with an average fluid velocity of 1.9m/daybut not with 5.1m/day. It was postulated that, at higher flowrates bacterial swimming was constrained by the local fluidvelocity and shear stress within the pore spaces, decreasingthe impact of chemotaxis (Wang and Ford, 2009).
The vertical center of the chemotactic bacteria was closerto the attractant injection level than the non-chemotacticbacteria by 0.4� 0.2 cm for the experiments with acetate and0.74� 0.07 cm for the experiments with benzoate. Theseresults are statistically significant for P< 0.05 and P< 0.015,respectively, as determined by a one-tailed t-test (t¼ 3.3 andt¼ 14.8, respectively, df¼ 2).
Along with having a center of mass that exited themicrocosm closer to the vertical location of the chemoat-tractant injection, the chemotactic bacterial distributionsexhibited a higher variance and transverse dispersivity thanthe non-chemotactic bacteria. This was another indicator
Table I. Center of mass and dispersivity summary.
Bacteria/Attractant Velocity (m/day) Center y (cm) Variance s2 (cm2) Skewness g Dispersion DT� 105 (cm2/s) Dispersivity aT� 102 (cm)
P. putida F1
Acetate 3.9 0.4� 0.1 1.1� 0.4 �0.36� 0.06 2� 0.9 0.5� 0.2
Benzoate 1.1 0.54� 0.02 2.7� 0.2 0.17� 0.02 1.77� 0.01 1.40� 0.09
P. putida F1 CheA
Acetate 3.9 0.0� 0.1 0.8� 0.2 0.7� 0.4 1.8� 0.4 0.39� 0.08
Benzoate 1.1 �0.20� 0.07 1.9� 0.2 0.8� 0.1 0.8� 0.1 1.01� 0.08
Benzoate
N/A 1.1 4.7� 0.1 1.9� 0.4 �0.09� 0.08 1.2� 0.3 1.0� 0.2
Strobel et al.: Chemotaxis Increases Bacteria Migration 2075
Biotechnology and Bioengineering

that the chemotactic bacteria migrated transverse to flow inthe direction of the benzoate concentration gradient. Inexperiments performed with acetate, the chemotactictransverse dispersivity was 1� 2� 10�3 cm higher thanthe non-chemotactic transverse dispersivity (P< 0.24,t¼ 0.96, df¼ 2). In experiments performed with benzoate,the chemotactic transverse dispersivity was 4� 1� 10�3 cmhigher than the non-chemotactic transverse dispersivity(P< 0.02, t¼ 4.6, df¼ 2). As seen in Table I, the transversedispersivities in the acetate experiments were much smallerthan the dispersivities observed in the benzoate experiments.This difference is most likely due to the different flow ratesused. Cirpka et al. (2006) found that transverse dispersivitesincreased with decreased velocity. Olsson and Grathwohl(2007) reported the same phenomenon and noted that it waspronounced in the region of typical groundwater flowvelocities (0.1–10m/day).
Dispersivity increases with increasing heterogeneity of theexperimental system and in field scale studies greaterdispersivity is often observed (Garabedian et al., 1991) dueto increased scales of heterogeneity that are sampled overlarge length scales. Results from our microcosm studies fallwithin expected ranges based on the literature valuespresented in Figure 4. Dispersivities from our microcosmexperiments were larger than the dispersivity of 0.0012 cmdetermined by Long and Ford for Escherichia coli HCB1 in avery homogeneous porous micromodel (Long and Ford,2009). This was expected due to the smaller grain diameterand higher velocity used by Long and Ford. Both smallergrain diameters and higher velocities have been shown todecrease transverse dispersivity (Olsson and Grathwohl,2007). The transverse dispersivities determined in this studywere much smaller than the value of 0.15 cm determined in alarge-scale (280m) sampling array at Cape Cod MA byGarabedian et al. (1991). This was expected because
dispersivity values observed over large distances in thefield are typically much greater than values resultingfrom laboratory column tests. It has been suggested thatthis is caused by fluid velocity variations induced by theheterogeneity of aquifer hydraulic conductivity (Garabedianet al., 1991).
Cirpka et al. (2006) used two-dimensional microcosmssimilar to the system used for our experiments to study thetransverse dispersion of the colored dyes methyl red andthymol blue. When packed with glass beads of grain size 1.0–2.5mm with a seepage velocity of 1.8–2.0m/day, they foundthe transverse dispersivity of the dyes to be 0.02 cm by fittingthe empirical data. Olsson and Grathwohl (2007), used asimilar two-dimensional microcosm and packing to studythe dispersion of fluorescein, and the transverse dispersivitywas found to be 0.011 cm under a flow velocity of 0.68m/dayand 0.0053 cm under a flow velocity of 4.0m/day. Baueret al. (2009a) found the transverse dispersivity of bromide tobe 0.0076 cm by using a two-dimensional microcosm similarto this study and a flow velocity of 1.2m/day. Robbins(1989) performed a column experiment with sphericalglass beads with an average grain size 0.48mm and with aflow velocity of approximately 6.6m/day. They foundthe transverse dispersion coefficient of bromide to be3.8� 10�5 cm2/s, corresponding to a transverse dispersivityof 0.004 cm.
The skewness parameter, a measure of the asymmetry in anormal distribution about its center position, was calculatedfor the bacterial populations exiting the microcosm. Anegatively skewed distribution indicates that the bulk of themass is at values higher than the mean with a long tail atvalues below the mean. In the acetate experiments, thechemotactic bacteria populations had a skewness value of�0.36� 0.06, while the non-chemotactic bacteria had askewness of 0.7� 0.4. The negative value of skewness for the
Figure 4. Transverse dispersivity values from this and other studies plotted against the Peclet number.
2076 Biotechnology and Bioengineering, Vol. 108, No. 9, September, 2011

chemotactic bacteria was expected because a chemotacticresponse will bias the bacterial distribution toward thehigher concentrations of acetate in the upper portions of themicrocosm. The positive value of skewness for the non-chemotactic bacteria may have reflected the sinking of thebacterial pulse due to settling of the bacteria. In the benzoateexperiments, the chemotactic bacteria populations had askewness value of 0.17� 0.02, while the non-chemotacticbacteria had a skewness of 0.8� 0.1. The positive skewnessfor both types of bacteria in the benzoate runs is most likely aresult of sinking, which was much more pronounced atlower flow rates. Although, both types of bacteria had apositive skewness value in benzoate experiments, theskewness for the chemotactic bacteria is much lower thanthe skewness for the non-chemotactic bacteria.
Concluding Remarks
The center of mass of the chemotactic bacteria plumemovedupward toward the level at which the chemoattractantbenzoate was injected relative to that of the non-chemotacticbacteria. The same was true for the experiments with acetateas the chemoattractant, although to a lesser extent. Theseresults support the assertion that chemotaxis can enhancethe transport of bacteria to contaminants in groundwateraquifers, potentially improving the overall effectiveness of insitu bioremediation. Therefore, bioremediation via bioaug-mentation schemes may benefit from considering chemo-taxis and motility in addition to degradation capabilitiesas criteria for bacterial strain selection. Also, includingchemotaxis in mathematical bioremediation models mayimprove our predictions of the time scale in bioremediationscenarios, allowing a more accurate assessment of thepotential of natural attenuation as a remediation alternativeas well as an optimized management of contaminated sites.
This work was supported by the Harrison Undergraduate Research
Award sponsored by the Center for Undergraduate Excellence at the
University of Virginia and the Rodman Sustainability Grant spon-
sored by the Rodman Scholars of the University of Virginia and
partially by grants from the National Science Foundation (EAR 04-
08454 and EAR 07-11377) and Graduate Assistantships in Areas of
National Need (GAANN). Technical assistance with HPLC measure-
ments from Professor Lisa Colosi is gratefully acknowledged. At the
Institute of Groundwater Ecology inMunich, technical help of Gunter
Teichmann and Michael Stockl is acknowledged. Helpful discussions
were provided by M. Weng, X. Wang, and J. Mellor. Constructive
comments from the anonymous reviewers helped to improve the
manuscript.
References
Adler J. 1973. Amethod for measuring chemotaxis and use of the method to
determine optimum conditions for chemotaxis by Escherichia coli.
J Gen Microbiol 74:77–91.
Bauer RD, Rolle M, Bauer S, Eberhardt C, Grathwohl P, Kolditz O,
Meckenstock R, Griebler C. 2009a. Enhanced biodegradation of
hydraulic heterogeneities in petroleum hydrocarbon plumes.
J Contam Hydrol 105(1–2):56–68.
Bauer RD, Rolle M, Kurzinger P, Grathwohl P, Meckenstock RU, Griebler
C. 2009b. Two-dimensional flow-through microcosms—Versatile test
systems to study biodegradation processes in porous aquifers. J Hydrol
369(3–4):284–295.
Boopathy R. 2000. Factors limiting bioremediation technologies. Bioresour
Technol 74(1):63–67.
Boyd S. 2007. Transverse vertical dispersion of chemotactic bacteria in
response to a chemical gradient. Unpublished M.S. CE, University of
Virginia.
Cirpka OA, Olsson A, Ju Q, Rahman MA, Grathwohl P. 2006. Determina-
tion of transverse dispersion coefficients from reactive plume lengths.
Ground Water 44:212–221.
Cussler EL. 1997. Diffusion: Mass transfer in fluid systems. 2nd edn.
New York: Cambridge University Press, p. 581.
Ford RM, Harvey RW. 2007. Role of chemotaxis in the transport of bacteria
through saturated porous media. Adv Water Resour 30(6–7):1608–
1617.
Ford RM, Phillips BR, Quinn JA, Lauffenburger DA. 1991. Measurement of
bacterial randommotility and chemotaxis coefficients. 1. Stopped-flow
diffusion chamber assay. Biotechnol Bioeng 37(7):647–660.
Garabedian SP, LeBlanc MA, Gelhar LW, Celia MA. 1991. Large-scale
natural gradient tracer test in sand and gravel, Cape Cod, Massachu-
setts: 2. Analysis of spatial moments for a nonreactive tracer. Water
Resour Res 27(5):911–924.
Harvey RW, Metge DW, Kinner N, Mayberry N. 1997. Physiological
considerations in applying laboratory-determined buoyant densities
to predictions of bacterial and protozoan transport in groundwater:
Results of in-situ and laboratory tests. Environ Sci Technol 31:289–295.
Harwood CS, Fosnaugh K, Dispensa M. 1989. Pseudomonas putida and
analysis of its motile behavior. J Bacteriol 171:4063–4066.
Hobbie JE, Daley RJ, Jasper S. 1997. Use of nuclepore filters for counting
bacteria by fluorescence microscopy. Appl Environ Microbiol 33:1225–
1228.
Liu X, Wood PL, Parales JV, Parales RE. 2009. Chemotaxis to pyrimidines
and identification of a cytosine chemoreceptor in Pseudomonas putida.
J Bacteriol 191:2909–2916.
Long T, Ford RM. 2009. Enhanced transverse migration of bacteria by
chemotaxis in a porous T-sensor. Environ Sci Technol 43:1546–1552.
Marx RB, Aitken MD. 2000. Bacterial chemotaxis enhances naphthalene
degradation in a heterogeneous aqueous system. Environ Sci Technol
34(16):3379–3383.
Olson MS, Ford RM, Smith JA, Fernandez EJ. 2005. Analysis of column
tortuosity for MnCl2 and bacterial diffusion using magnetic resonance
imaging. Environ Sci Technol 39:149–154.
Olsson A, Grathwohl P. 2007. Transverse dispersion of non-reactive tracers
in porous media: A new nonlinear relationship to predict dispersion
coefficients. J Contam Hydrol 92(3–4):149–161.
Parales RE, Haddock JD. 2004. Biocatalytic degradation of pollutants. Curr
Opin Biotechnol 15(4):374–379.
Rice JA. 2007. Mathematical statistics and data analysis. India: Duxbury,
p. 603.
Robbins GA. 1989. Methods for determining transverse dispersion coeffi-
cient of porousmedia in laboratory column experiments. Water Resour
Res 25:1249–1258.
Sambrook J, Fritsch EF, Maniatis T. 1989. Molecular cloning: A laboratory
manual, Vol. 3. Cold Spring Harbor, NY: Cold Spring Harbor Labora-
tory Press.
Scheidegger AE. 1961. General theory of dispersion in porous media.
J Geophys Res 66(10):3273–3278.
Thullner M, Schroth MH, Zeyer J, Kinzelbach W. 2004. Modeling of a
microbial growth experiment with bioclogging in a two-dimensional
saturated porous media flow field. J Contam Hydrol 70(1–2):37–62.
Wang M, Ford RM. 2009. Transverse bacterial migration induced by
chemotaxis in a packed column with structured physical heterogeneity.
Environ Sci Technol 43(15):5921–5927.
Weisbrod N, Niemet MR, Selker JS. 2003. Light transmission technique for
the evaluation of colloidal transport and dynamics in porous media.
Environ Sci Technol 37(16):3694–3700.
Strobel et al.: Chemotaxis Increases Bacteria Migration 2077
Biotechnology and Bioengineering