chemistry 251 — spectroscopy problems - … mass spectrum below is most likely of: note: the...
TRANSCRIPT
CHEMISTRY 251 — Spectroscopy Problems
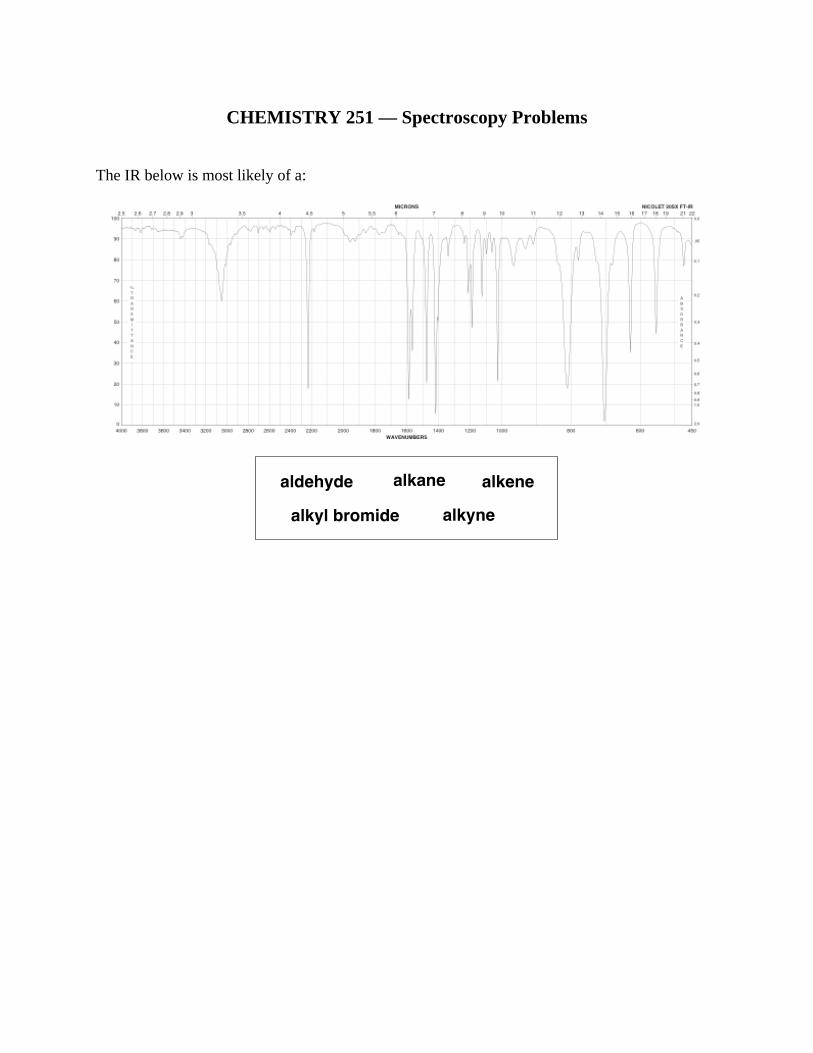
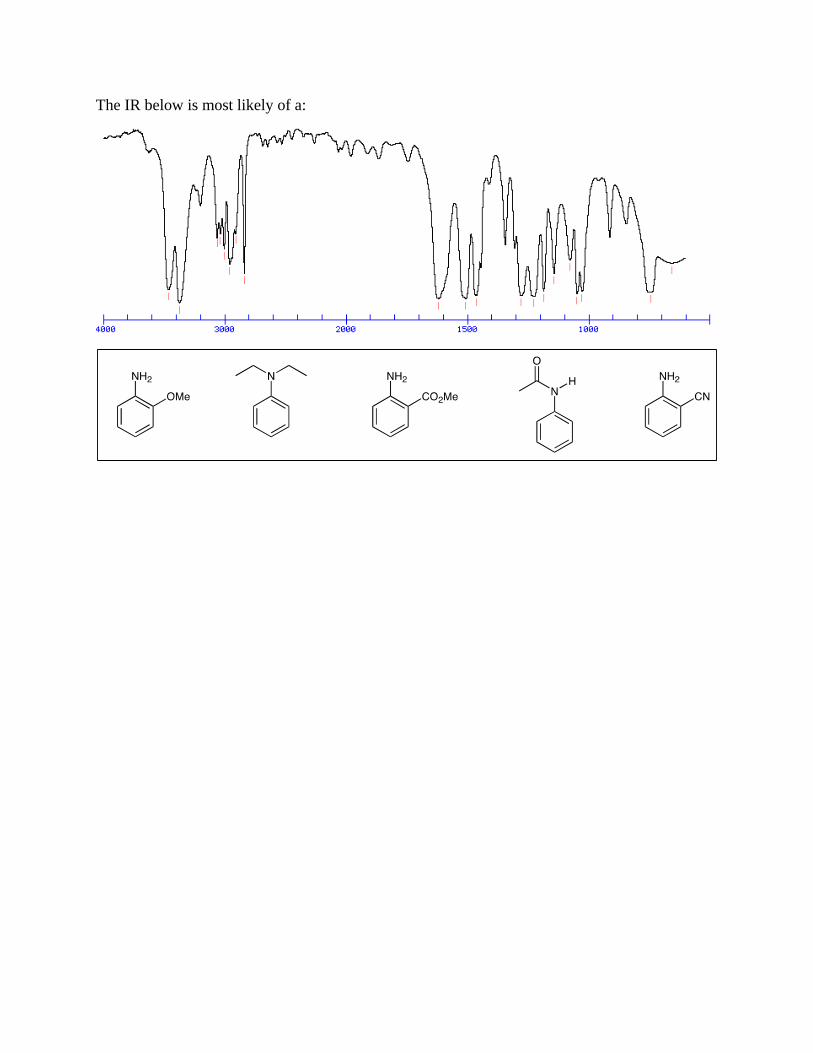
The IR below is most likely of a:
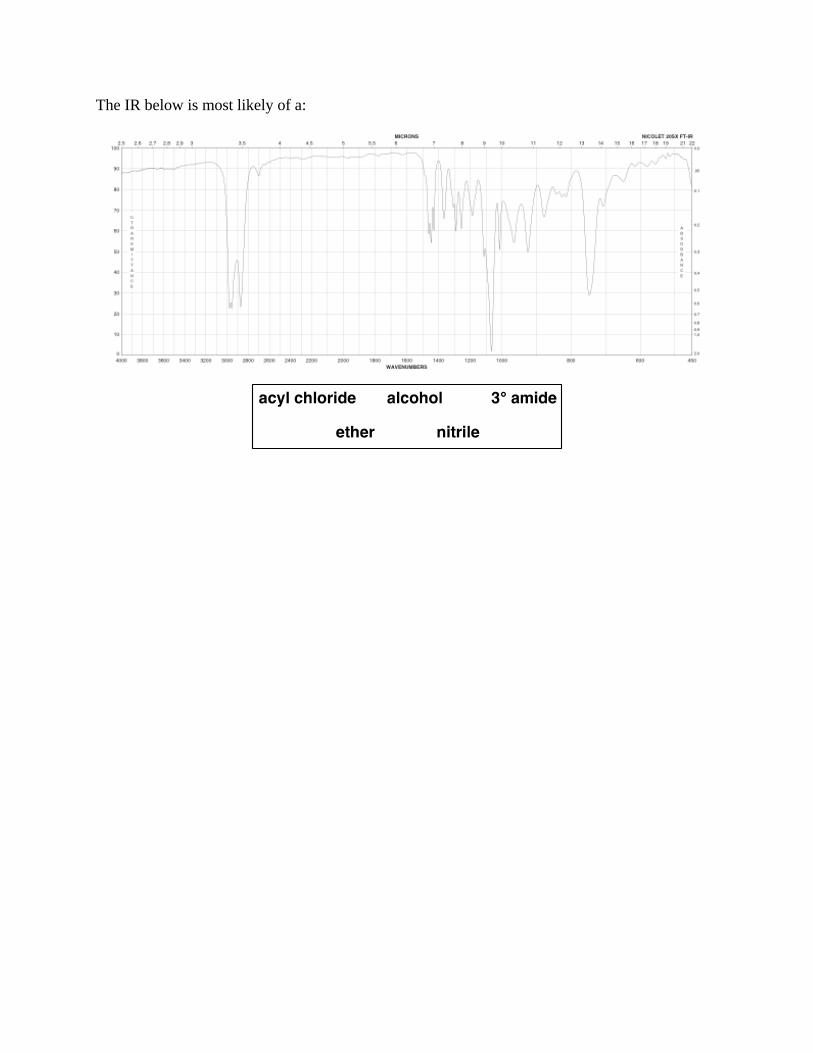
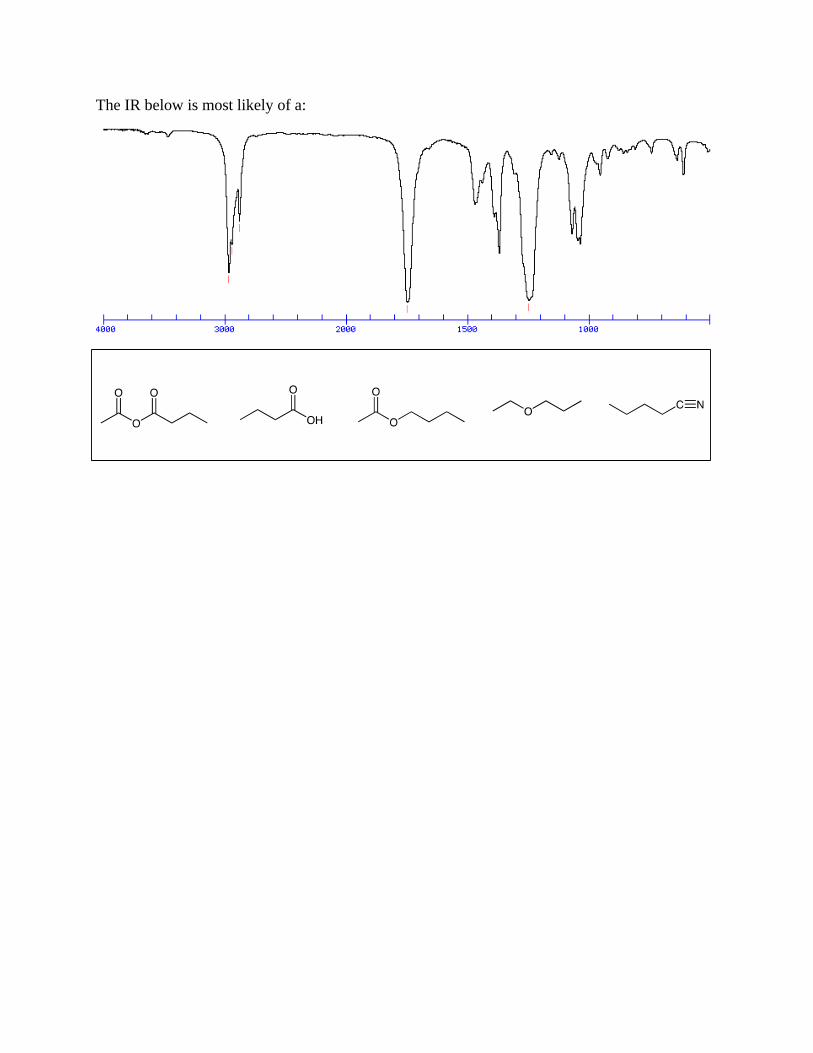
The IR below is most likely of a:
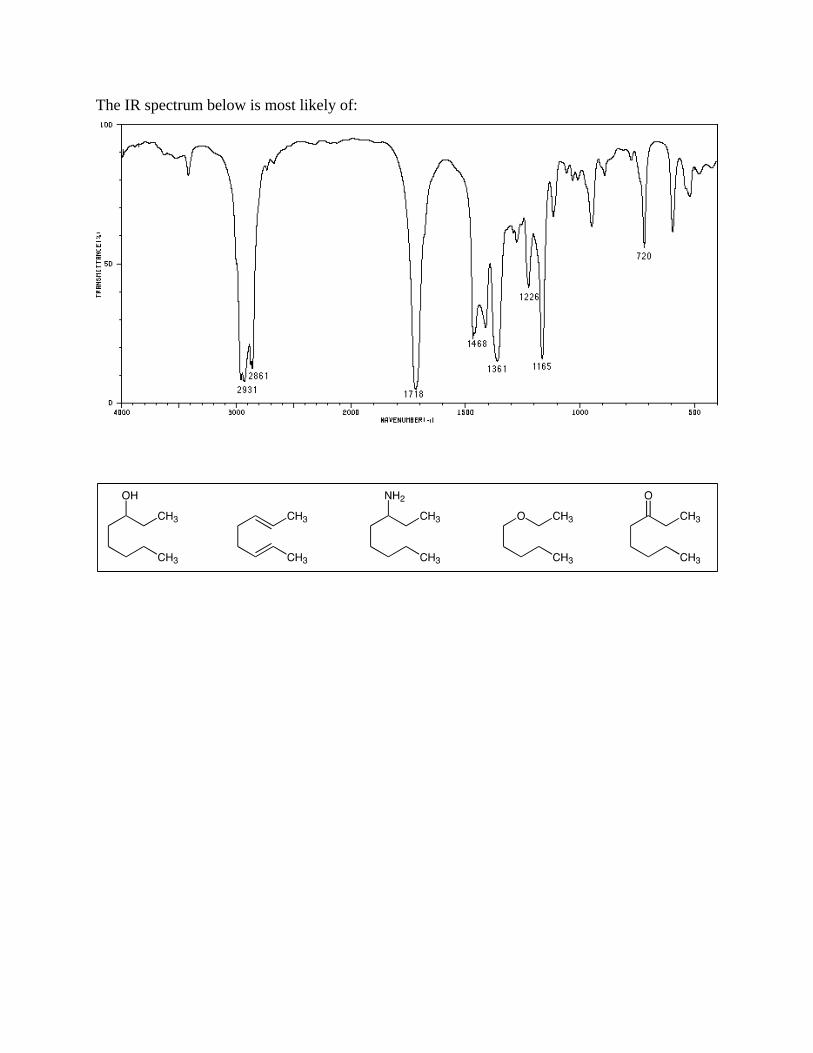
The IR spectrum below is most likely of:
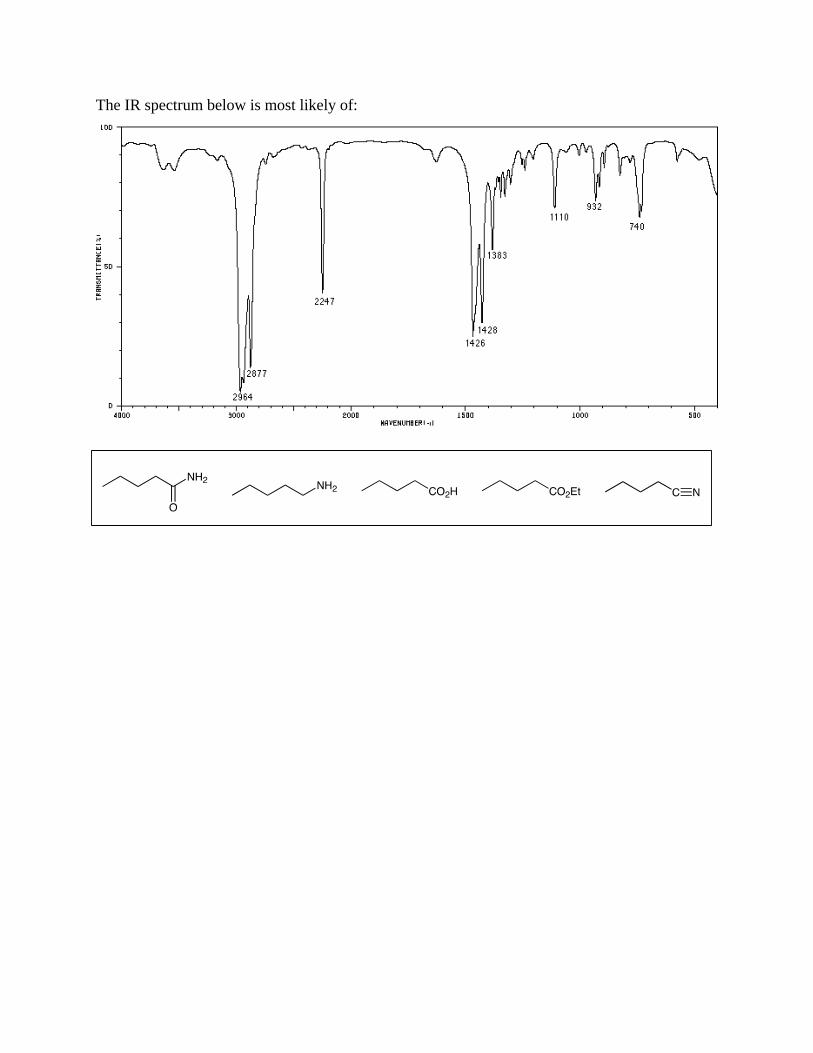
The IR spectrum below is most likely of:
The IR below is most likely of a:

The IR below is most likely of a:
The IR below is most likely of a:

The IR spectrum below is most likely of:

The IR spectrum below is most likely of:

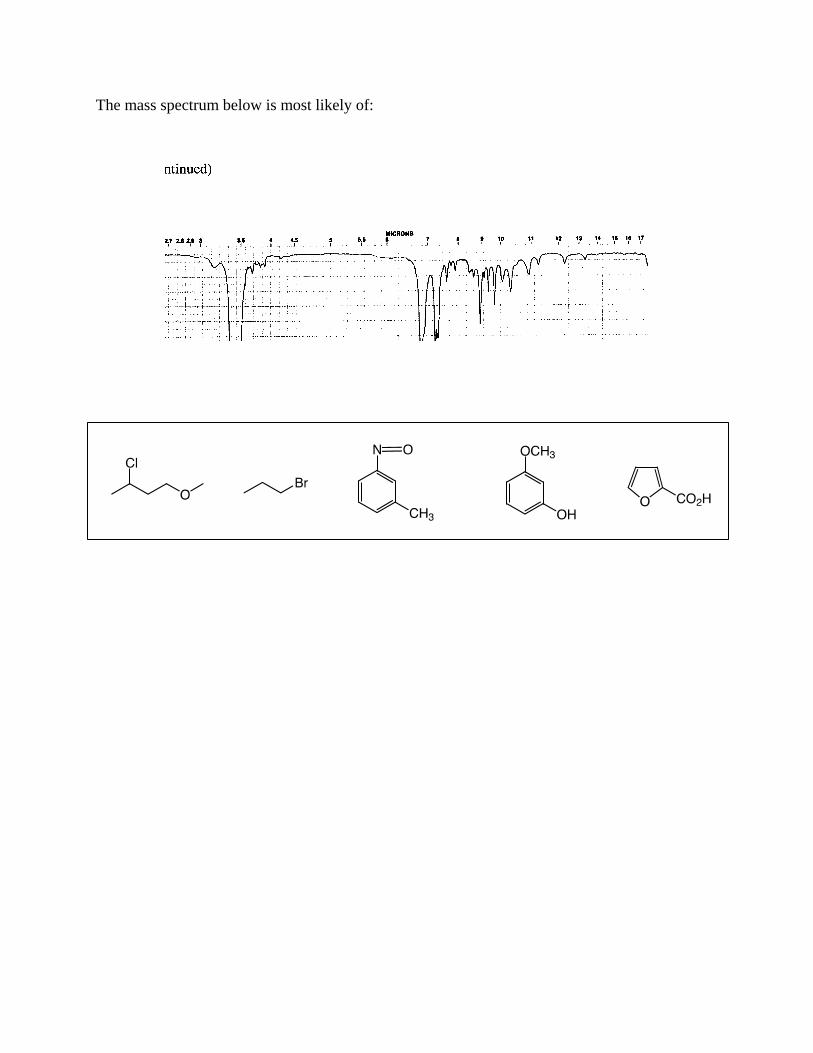
The mass spectrum below is most likely of:
Note: The atomic mass of C is 12, the atomic mass of H is 1, the atomic mass of N is 14, & the atomic mass of O is 16. Br exists as ~50% 79Br and 50% 81Br. Cl exists as ~75% 35Cl and 25% 37Cl.

The mass spectrum below is most likely of:

The mass spectrum below is most likely of:

The mass spectrum below is most likely of:
The mass spectrum below is most likely of:
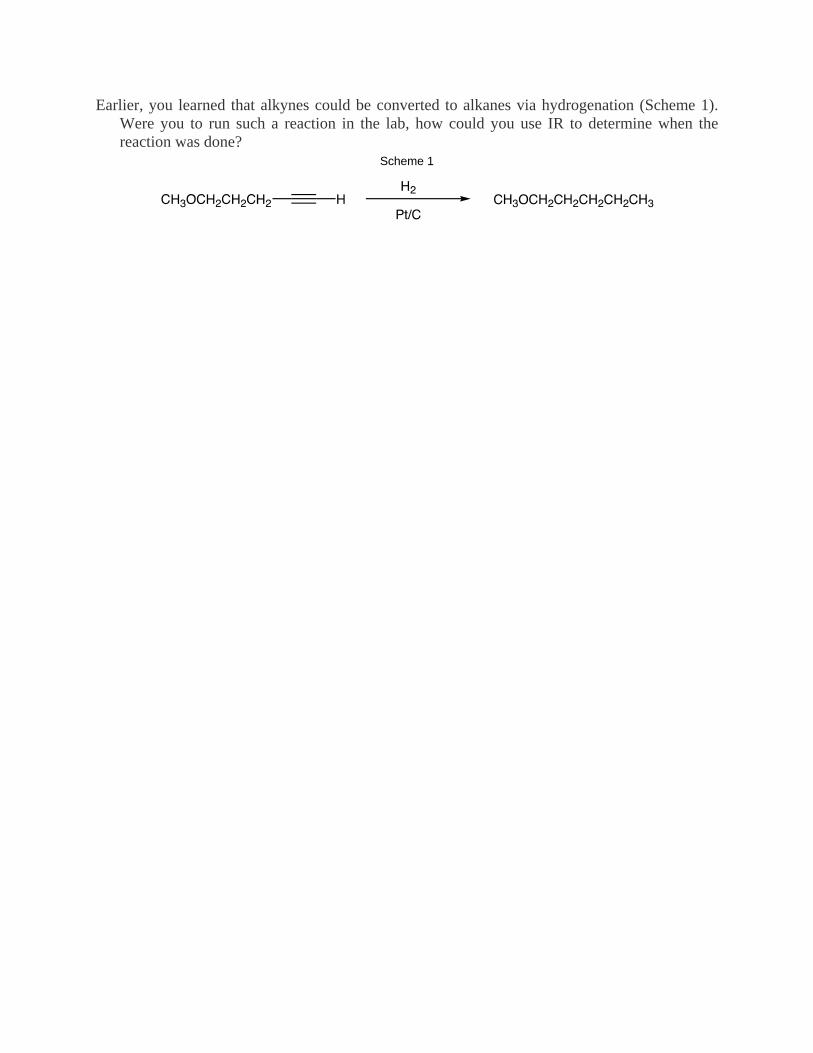
Earlier, you learned that alkynes could be converted to alkanes via hydrogenation (Scheme 1). Were you to run such a reaction in the lab, how could you use IR to determine when the reaction was done?
Scheme 1

(a) Describe how one would use IR to distinguish between the two amine isomers shown below
(b) Describe how one would use mass spec to distinguish between the two amine isomers shown below (5 pts).
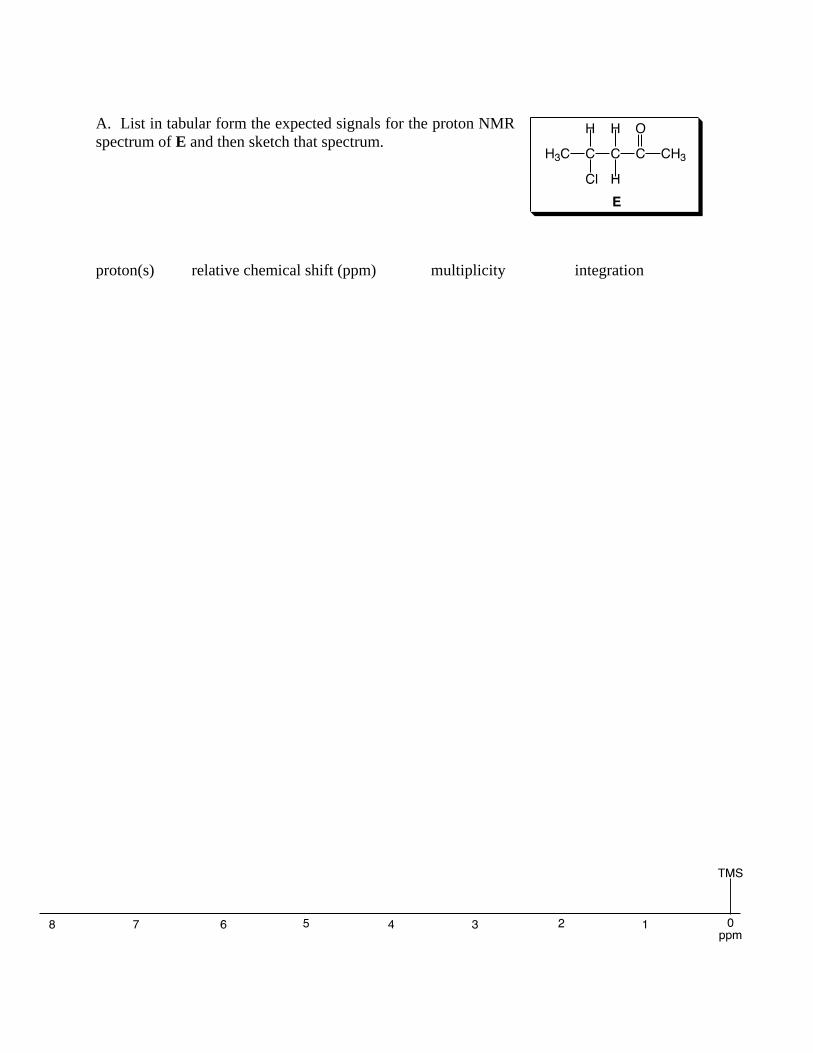
A. List in tabular form the expected signals for the proton NMR spectrum of E and then sketch that spectrum. proton(s) relative chemical shift (ppm) multiplicity integration

List in tabular form the expected signals for the proton NMR spectrum of A and then sketch that spectrum.
proton(s) relative chemical shift (ppm) multiplicity integration
~7.2 ppm m 5

List in tabular form the expected signals for the proton NMR spectrum of D and then sketch that spectrum proton(s) relative chemical shift (ppm) multiplicity integration
~7.2 ppm m 5

List in tabular form the expected signals for the proton NMR spectrum of A and then sketch that spectrum.
proton(s) relative chemical shift (ppm) multiplicity integration
~7.2 ppm m 5
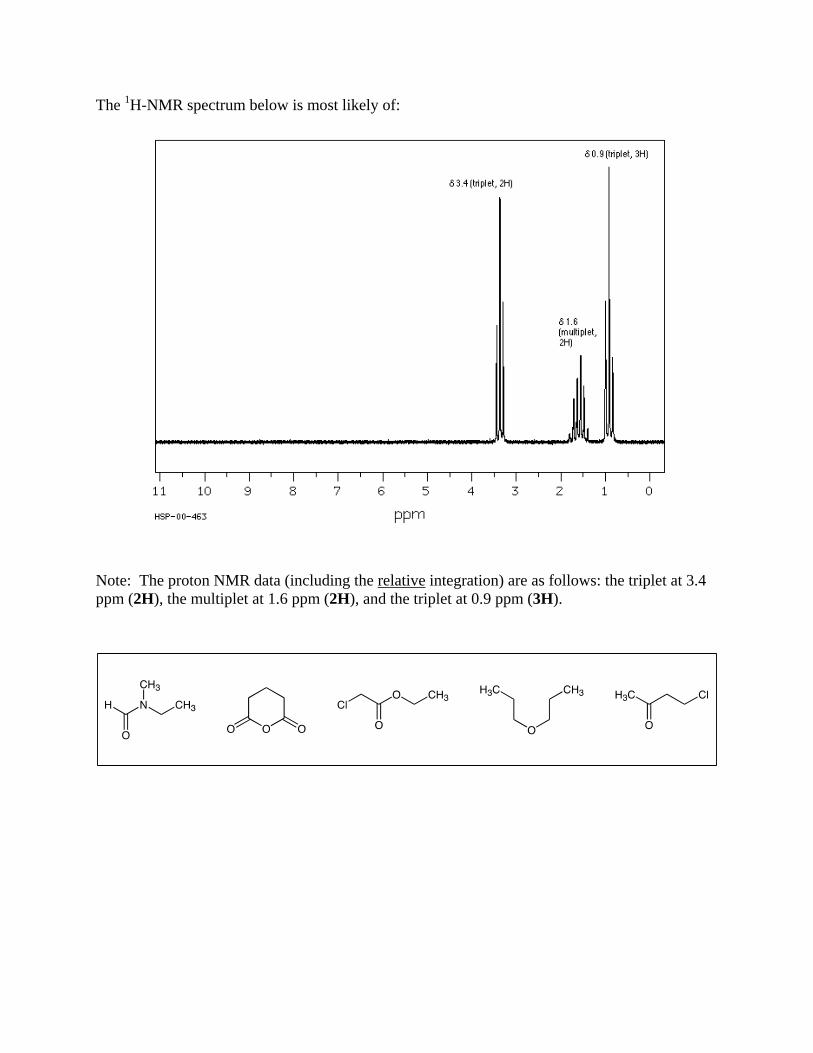
The 1H-NMR spectrum below is most likely of:
Note: The proton NMR data (including the relative integration) are as follows: the triplet at 3.4 ppm (2H), the multiplet at 1.6 ppm (2H), and the triplet at 0.9 ppm (3H).

The 1H-NMR spectrum below is most likely of:
Note: The proton NMR data (including the relative integration) are as follows: the doublet at 7.83 ppm (1H), the overlapping series peaks from 7.20-7.63 ppm (3H), the quartet at 2.90 ppm (2H), and the triplet at 1.27 ppm (3H).
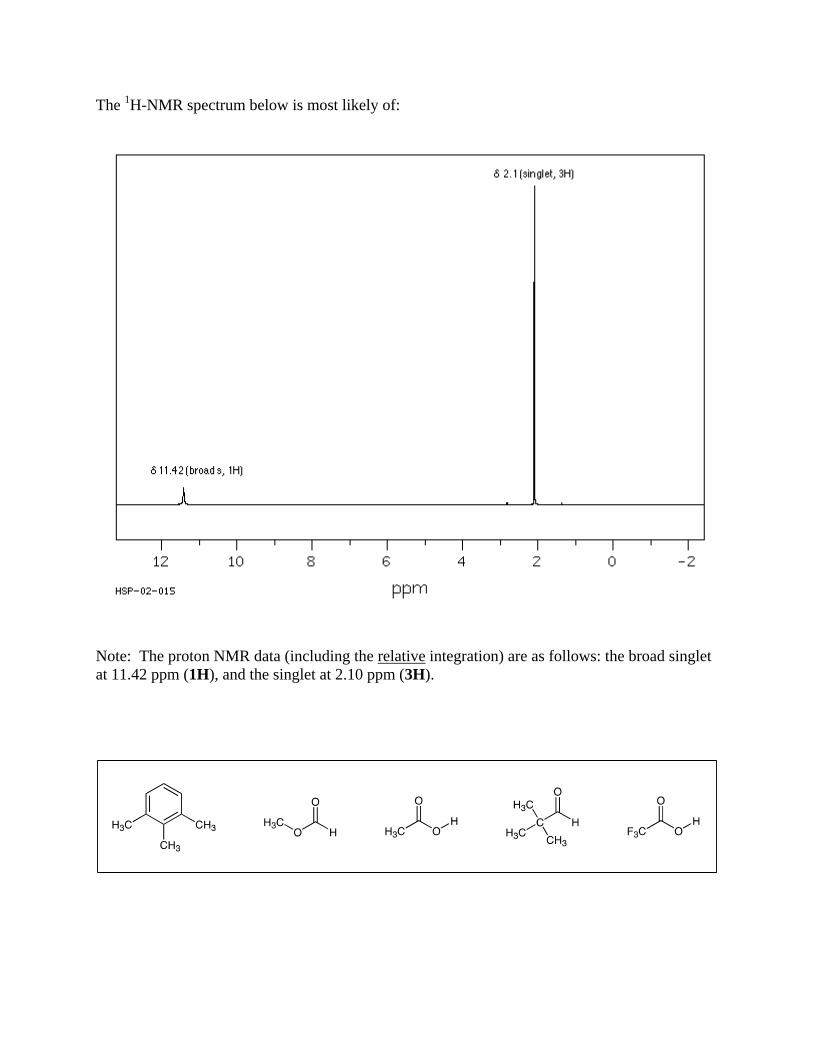
The 1H-NMR spectrum below is most likely of:
Note: The proton NMR data (including the relative integration) are as follows: the broad singlet at 11.42 ppm (1H), and the singlet at 2.10 ppm (3H).

The 1H-NMR spectrum below is most likely of:
Note: The proton NMR data (including the relative integration) are as follows: the doublet at 7.97 ppm (2H), the doublet at 6.89 ppm (2H), the singlet at 3.86 ppm (3H), and the singlet at 3.82 ppm (3H).

The 1H-NMR spectrum below is most likely of:
Note: The proton NMR data (including the relative integration) are as follows: the multiplet at 7.25 ppm (2H), and the singlet at 2.40 ppm (3H).
The 1H-NMR spectrum below is most likely of:
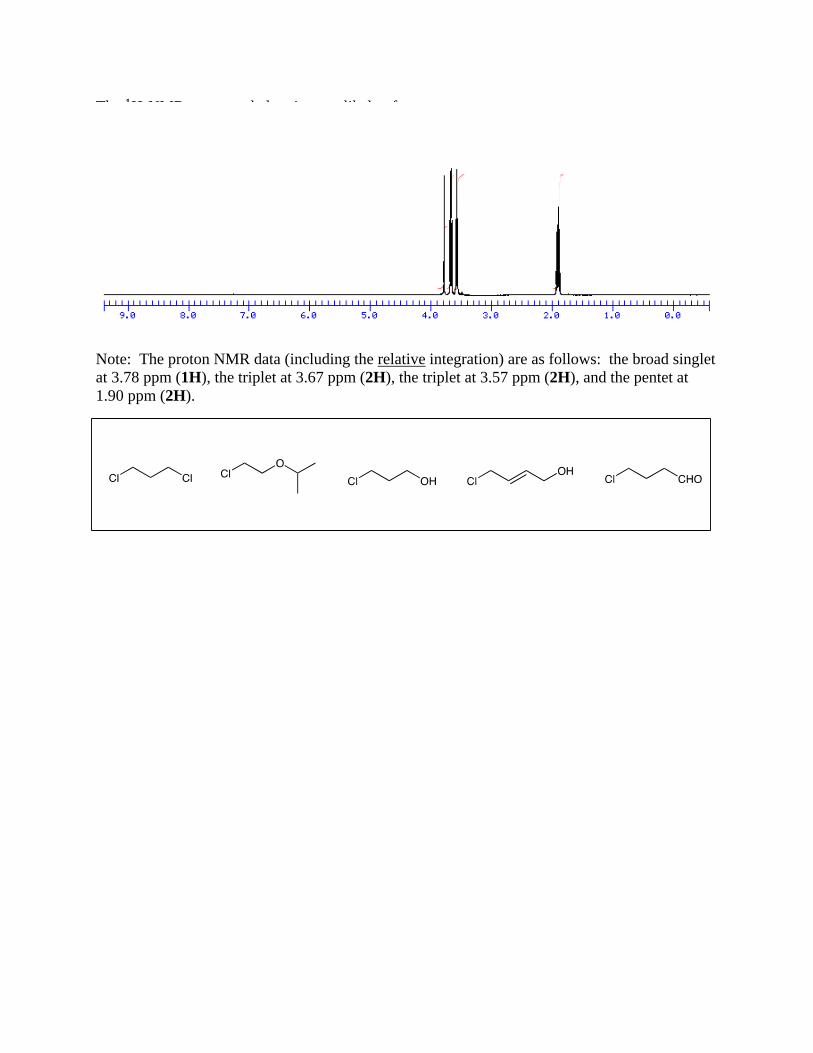
Note: The proton NMR data (including the relative integration) are as follows: the broad singlet at 3.78 ppm (1H), the triplet at 3.67 ppm (2H), the triplet at 3.57 ppm (2H), and the pentet at 1.90 ppm (2H).
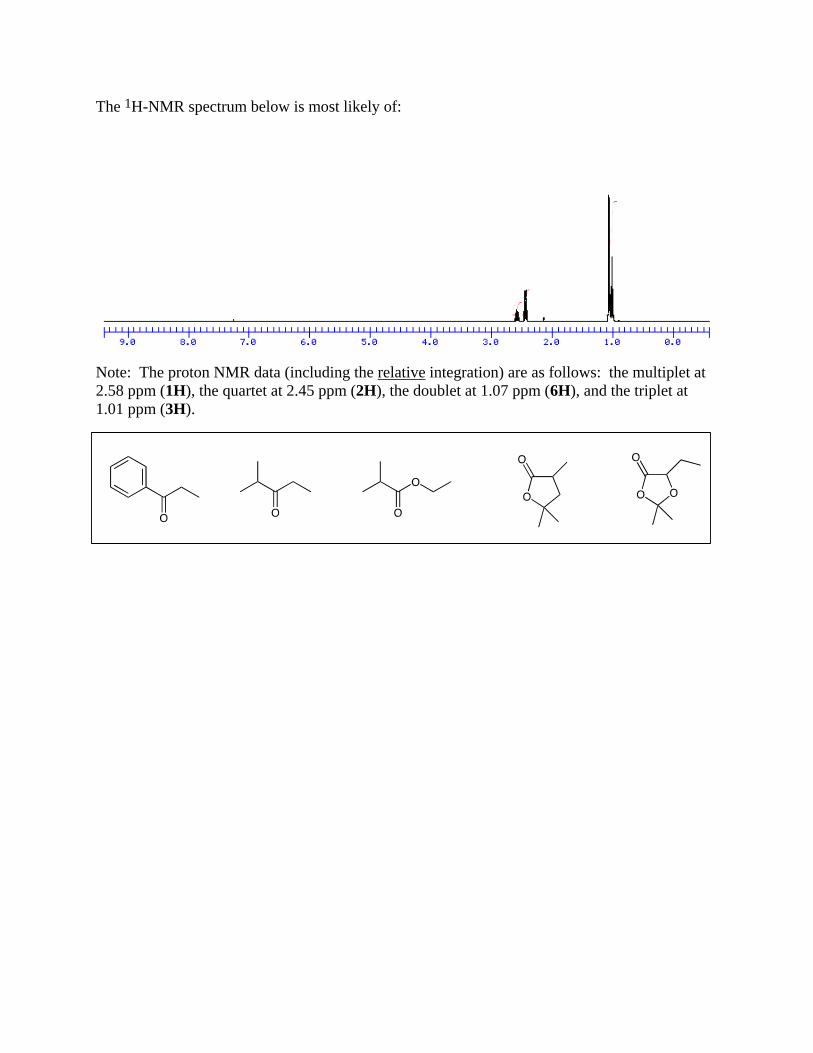
The 1H-NMR spectrum below is most likely of:
Note: The proton NMR data (including the relative integration) are as follows: the multiplet at 2.58 ppm (1H), the quartet at 2.45 ppm (2H), the doublet at 1.07 ppm (6H), and the triplet at 1.01 ppm (3H).
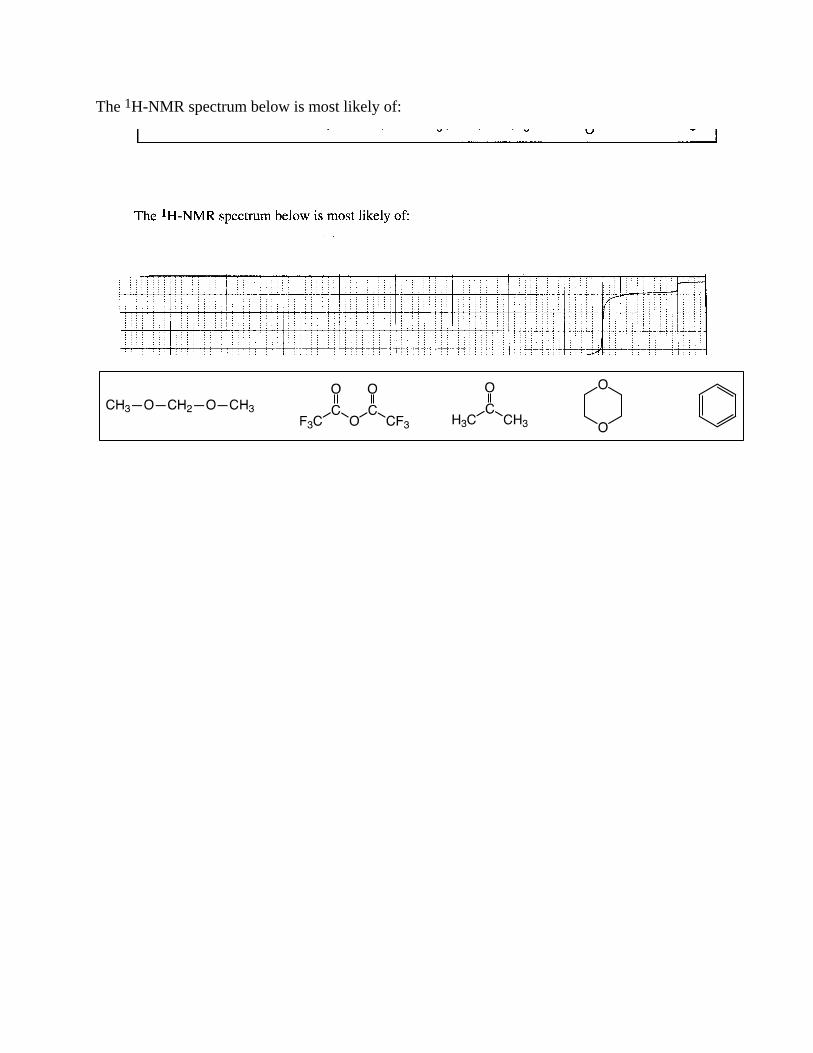
The 1H-NMR spectrum below is most likely of:

The 1H-NMR spectrum below is most likely of:
integration: 1 2 2 2 3
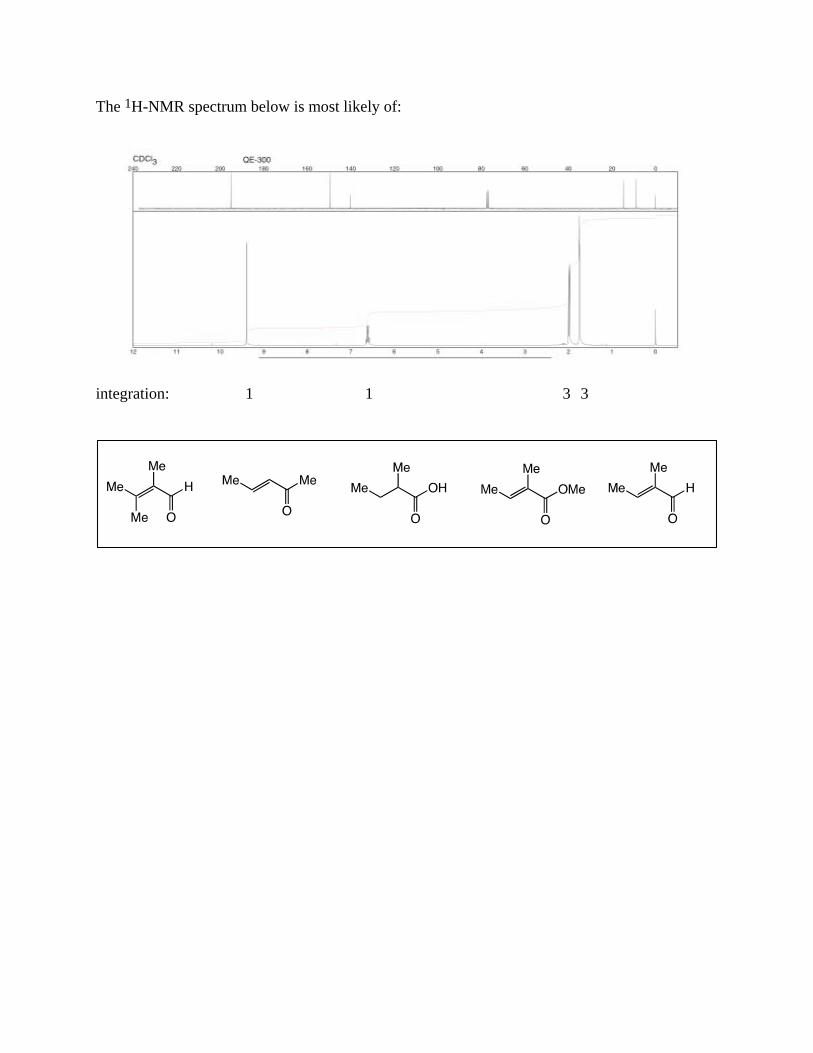
The 1H-NMR spectrum below is most likely of:
integration: 1 1 3 3
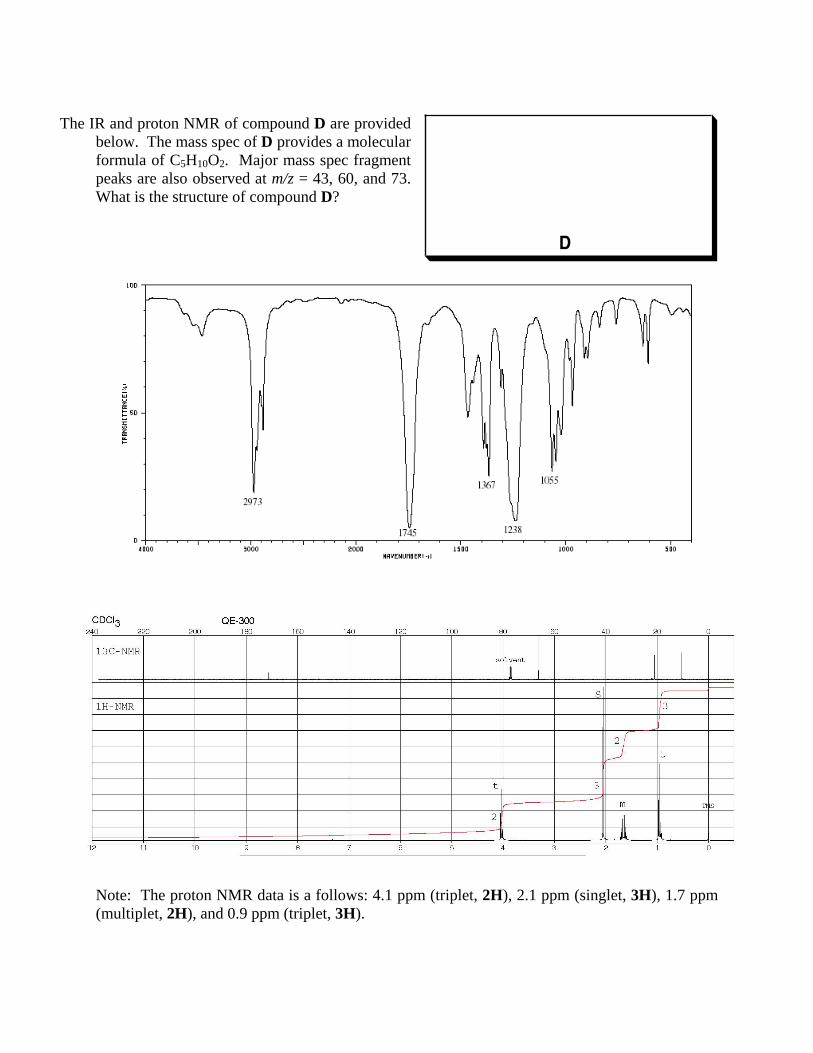
The IR and proton NMR of compound D are provided
below. The mass spec of D provides a molecular formula of C5H10O2. Major mass spec fragment peaks are also observed at m/z = 43, 60, and 73. What is the structure of compound D?
Note: The proton NMR data is a follows: 4.1 ppm (triplet, 2H), 2.1 ppm (singlet, 3H), 1.7 ppm (multiplet, 2H), and 0.9 ppm (triplet, 3H).

The IR and proton NMR of compound E are provided below. The molecular formula of compound E is C6H12O2. What is the structure of compound E?
Note: The relative integration for the proton NMR is a follows: the quartet at 4.1 ppm (2H), the triplet at 2.2 ppm (2H), the multiplet at 1.7 ppm (2H), and the triplet at 1.3 ppm (3H) and the triplet at 0.9 ppm (3H).
E

The IR and proton NMR of compound F are provided below. The molecular formula of compound F is C5H10O. What is the structure of compound F?
Note: The relative pintegration for the proton NMR is a follows: the triplet at 2.4 ppm (2H), the singlet at 2.12 ppm (3H), the multiplet at 1.6 ppm (2H), and the triplet at 0.91 ppm (3H).