chemical speciation and toxicity of metals assessed by three bioluminescence-based assays using...
TRANSCRIPT
Chemical Speciation and Toxicity of MetalsAssessed by Three Bioluminescence-BasedAssays Using Marine Organisms
Dimitri D. Deheyn, Rizlan Bencheikh-Latmani, Michael I. Latz
Marine Biology Research Division, Scripps Institution of Oceanography,University of California, San Diego, La Jolla, California 92093-0202, USA
Received 1 November 2003; accepted 14 January 2004
ABSTRACT: Metal toxicity is a function of the biology of the target organism and the chemical speciationof the metal. The toxicity of 11 metals was assessed with three cell-based bioassays based on marineorganisms: the bacterium Photobacterium phosphoreum of the Microtox� bioassay, an environmentalstrain of P. phosphoreum, and photocytes isolated from the brittlestar Ophiopsila californica. Metalspeciation was calculated for three commonly used media: NaCl-based Microtox� bioassay medium,artificial seawater glycerol, and artificial seawater. Decreased bioluminescence was considered a proxyfor cell toxicity. In all three assays the elements Cd and Hg exhibited similar speciation as well as similartoxicity profiles. The element Cu was toxic in all three assays despite different metal speciation for the P.phosphoreum bioassay. The element Ag was toxic to both bacterial strains but not to photocytes despitea similar chemical speciation for all three assays. In general, the Microtox� bioassay was sensitive to allmetals (except Pb), whereas the photocytes were the least sensitive to the metals. The heightenedresponse of the Microtox� bioassay probably resulted from a combination of the limited complexingpower of the medium and the greater sensitivity of the bacterial strain. © 2004 Wiley Periodicals, Inc. EnvironToxicol 19: 161–178, 2004.
Keywords: bioassay; bioluminescence; chemical speciation; free ion model; HYDRAQL; metal; Micro-tox�; photocyte; toxicity
INTRODUCTION
The toxicity of a substance is the measure of its incompat-ibility with normal biological function (Richardson, 1993).Thus, toxicity refers to the adverse impact of a substance onliving organisms. It depends on various factors such as thequantity of the substance actually absorbed, the route of
contamination (ingestion, physical contact, accumulation bydiffusion, or active cellular pumping), and time exposure.According to the free ion activity model, metal toxicitydepends on chemical species formed by the metal and ismainly correlated to free ion concentration; however, thatdoes not necessarily imply that the free metal ion is the onlytoxic species (Morel and Hering, 1993; Stumm and Morgan,1995; Campbell and Tessier, 1996). The model merelyreflects the ability of free-metal-ion concentration to betaken as an index of reactivity, even though the physiolog-ical effects of a metal can also be related to the interactionof its various chemical forms with a variety of cellularligands. Consequently, determining the toxicity of a given
Correspondence to: Dr. Dimitri Deheyn; e-mail: [email protected]
Contract grant sponsor: Belgium-NATO and Belgian-American Edu-cational Foundation (fellowship to D.D.D.); University of California ToxicSubstance Research & Training Program grant (to M.I.L).
Published online in Wiley InterScience (www.interscience.wiley.com).DOI 10.1002/tox.20009
© 2004 Wiley Periodicals, Inc.
161
metal requires assessing its chemical speciation in the me-dium.
Toxicity is dependent on the species involved and thetissue and cells targeted by the toxicant (Richardson, 1993;Clark, 1997; Crosby, 1998). Overall, a toxic effect occurs asthe result of a complex balance between the metal’s chem-ical speciation and reactivity and the biology of the organ-ism. Hence, toxicity measurements are usually performedby quantifying the alteration of given biological character-istics (e.g., gene expression, enzyme functionality, fertiliza-tion efficiency, growth, behavior) upon exposure to knownadded concentrations of a specific substance. Change in abiological characteristic is then considered a reflection of anadverse effect of the substance, with the observed changespossibly integrating toxicity that is occurring at variouslevels of biological complexity, from the genetic to themolecular, cellular, tissue, and organismal levels (Costan etal., 1993; Clark, 1997; Kennish, 1997). Biomonitoring pro-grams use a battery of bioassays to screen such a variety ofroutes of contamination, involving a diversity of organisms(bacteria, crustaceans, bivalves, fishs), possibly at differentstages of development (embryo, larvae, adult). Because ofthe complexity and cost of such an endeavor, there is stronginterest in simplifying toxicity assessment. A common al-ternative is to use microorganisms genetically engineered tobe sensitive to specific contaminants, resulting in assays thatare more rapid and less costly (Wood and Gruber, 1996;Hollis et al., 2000; Dizer et al., 2002).
Bioluminescence, the biological production of visiblelight with an ecological function (Morin, 1983), is com-monly used as an bioassay for environmental quality. Mostcommonly used are luminescent bacteria and dinoflagel-lates, as well as genetically engineered bacteria that useluminescence reporters (Danilov et al., 1985; Lapota et al.,1993; Kudryasheva et al., 1998; Heimann et al., 2002). Theassumption is that decreases in bioluminescence reflect thetoxicity of a given condition, because light emission is ameasure of the health and metabolism of the luminescentorganism.
Light production is the result of a chemical reactioninvolving the oxidation of a substrate, generally called lu-ciferin, mediated by a protein called luciferase in the pres-ence of an ionic cofactor; the intensity of produced light isproportional to the amount of reagents involved in thechemical reaction. A decrease in the intensity of the lightproduced therefore indicates alteration of one of the eventsleading to light production: either the chemical reaction(e.g., configurational inactivity of reagents), the expressionof genes coding for the reagents, and/or any physiologicalcontrol associated with the process.
The present study addressed metal chemical speciationand toxicity in a marine environment with three bioassaysbased on cellular bioluminescence, using the marine bacte-rium Photobacterium phosphoreum from the Microtox�bioassay, a wild-type strain of P. phosphoreum, and isolated
photocytes (light-producing cells) from the brittlestar Ophi-opsila californica (Echinodermata). This study addressedthe hypothesis that toxicity assessment is different amongbioassays because of differences in the physicochemicalcharacteristics of the medium and also because of howbiologically susceptible to metal toxicity the particular cellsare. In addition, as the study was a test of the free ionactivity model, it was expected that the toxicity would becorrelated with the free-metal-ion concentrations amongbioassays.
MATERIAL AND METHODS
The metals silver (Ag), aluminum (Al), cadmium (Cd),chromium (Cr), copper (Cu), iron (Fe), mercury (Hg), man-ganese (Mn), lead (Pb), uranium (U), and zinc (Zn) wereassessed for toxicity with three cell-based bioassays, eachusing in vivo bioluminescence as a reporter of physiologicalstate. The Microtox� bioassay used strain 11177 of thebacterium Photobacterium phosphoreum (synonym: Vibriofischeri), the P. phosphoreum bioassay used a wild-typestrain of the same bacterium (Haygood strain 849), and thephotocyte bioassay used metazoan luminescent cells (pho-tocytes) isolated from the brittlestar Ophiopsila californica(Echinodermata). For each bioassay the effect of each indi-vidual metal on cellular bioluminescence was determinedfrom three independent replicates of the experiment. De-pending on metal solubility, 4–6 total metal concentrationswere assayed, ranging from 10�8 to 10�3 M.
Preparation of Metal Solutions
Metal stock solutions were freshly prepared by dissolvingmetal chloride (Cd2�, Cu2�, Fe3�, Hg2�, Mn2�, Zn2�),sulfate (Al2�), or nitrate (Ag�, Pb2�) salt into the mediumof interest unless otherwise specified. Stock solutions for Uand Cr were made from uranyl (UO2
2�) acetate and sodiumchromate (CrO4
2�), respectively. All metals were obtainedfrom Sigma (St. Louis, MO, USA) and were ACS certified.Stock solutions were at concentrations at which no precip-itation was observed over 72 h at room temperature. Thefinal metal concentration used in experiments was obtainedby dilution of the corresponding stock solution.
For each treatment a control was prepared that wasidentical to the metal stock but without the metal salt.Duration of exposure to the contaminant was the same forall metals and concentrations, ranging from 0 (just beforeaddition of the metal in the medium) to a maximum of 2, 9,or 24 h, depending on the bioassay. If a precipitate wasobserved in the medium over the experimental period, theassayed concentration was not considered for further inves-tigation. All manipulations were conducted under controlledconditions, avoiding metal and microbial contamination andusing disposable polystyrene or high-density polyethylene
162 DEHEYN, BENCHEIKH-LATMANI, AND LATZ

supplies, sterile acid–washed metal-free glassware, andstainless-steel dissecting tools.
Microtox� Bioassay
The Microtox� Acute Toxicity Test kit, available fromAZUR Environmental (Carlsbad, CA, USA), was used ac-cording to the Microtox� protocol guidelines for toxicityevaluation (AZUR, 1992). Briefly, lyophilized bacteria P.phosphoreum strain NRRL B-11177 were resuspended in 1mL of ultrapure water (reconstitution solution; AZUR,Carlsbad, CA, USA). After 10 min, 10-�L subsamples wereadded into glass scintillation vials containing 900 �L of 2%NaCl solution (Diluent Solution, AZUR, Carlsbad, CA,USA), which is the only constituent of the medium for thebioassay (Table I). Metal treatment involved the addition of100 �L of 10.1� concentrated metal stock solution to theculture. Metal stock solutions were made in 2% NaCl so-lution obtained from the osmotic adjusting solution (22%NaCl solution, AZUR, Carlsbad, CA, USA) diluted with thereconstitution solution. The final solution, with a total vol-ume of 1010 �L, was incubated without agitation at 15°Cfor up to 2 h. The conditions employed in this experimentare known to be optimal for light to be produced in thisbacterium in the absence of metals. Growth is minimal overthe 3-h incubation time (Bulich and Isenberg, 1980; Bulichand Huynh, 1995). Bioluminescence was measured aftervarious exposure times (0, 0.25, 0.5, 1, and 2 h) using aQuantalum 2000 luminometer (Zefaco Inc., Gaithersburg,MD, USA).
Photobacterium phosphoreum Bioassay
A wild-type strain of the bacterium Photobacterium phos-phoreum was used in the Photobacterium phosphoreumbioassay The P. phosphoreum originally were collectedfrom symbiotic bacterial light organs of the salmoniformfish Opisthoproctus soleatus and were kept frozen at �80°Cin a 10% glycerol–seawater complete medium (Nealson,1978).
For this bioassay, bacteria were cultured at 16°C on asolid (agar-amended) artificial seawater glycerol (ASG) me-dium (Table I) and checked every other day for growth andbioluminescence. An ASG medium was used rather than arich medium to minimize bacterial growth over the durationof the bioassay and to limit metal complexation (Ra-mamoorthy and Kushner, 1975; Gellert et al., 1999). Theeffects of metal treatment on bacterial growth and biolumi-nescence were assessed using liquid cultures. Bacteria wereinoculated from the solid ASG medium into 7 mL of liquidASG medium using a sterile loop and were incubated over-night (ca. 10 h) under still conditions in glass culture tubesat room temperature (ca. 20°C). The culture was then sub-sampled, diluted 1000 times into another 7 mL of ASGmedium, and gently agitated on a reciprocal shaker at roomtemperature. Under these culture conditions, the lag phaselasted about 20 h after inoculation, followed by a log phaseof about 30 h, ending in a stationary phase approximately55 h after inoculation. The bioluminescence cell�1 changedduring this time, increasing in early log phase, peaking atmid–log phase, and decreasing during late log phase, as
TABLE I. Characteristics of the media used for the three bioassays
Microtox®NaCl-based mediumpH: 6.7 � 0.3; T(°C): 15 � 0.3
P. phosphoreumASG-based medium
pH: 7.4 � 0.1; T(°C): 22 � 0.2
PhotocyteASW-based medium
pH: 8.0 � 0.1; T(°C): 8 � 0.2
ion [ion]T (mM) ion [ion]T (mM) ion [ion]T (mM)
Na� 342.0 Cl� 341.05 Cl� 534.4Cl� 342.0 K� 303.5 Na� 455.8
Mg2� 48.96 Mg2� 52.3SO4
2� 48.96 SO42� 27.7
Glycerol 31.83 Trisc 20.0NH4
� 18.27 Ca2� 9.9HEPESa 9.77 K� 9.6Ca2� 9.638HCO3
� 1.954Na� 1.954Glycerophosphate 0.452FACb 0.0322
ASG: artificial seawater glycerol; ASW: artificial seawater.a HEPES: hydroxyethyl piperazine ethane sulfonic acid.b FAC: ferric ammonium citrate with 15%–18% Fe ion.c Tris: Tris(hydroxymethyl)-aminomethane hydrochloride.
SPECIATION AND TOXICITY OF METALS 163

previously reported (Hastings and Nealson, 1977). Based onthis characterization, the experimental window in this studywas restricted to a 9-h period (from 24 to 33 h after inoc-ulation into liquid ASG) to ensure a constant growth rateand an increase in bioluminescence. The metal treatmentinvolved the addition of 100 �L of the metal stock solutionto the bacterial culture. Stock solutions were made eitherwith the ASG medium (for Al, Cd, Cr, Mn, and U) or withultrapure MilliQ-water (for Ag, Cu, Fe, Hg, Pb, and Zn) toallow complete dissolution. Beginning 24 h after the liquidASG inoculation, cell concentration and bioluminescencewere measured at times 0, 0.5, 1, 2, 3, 4, 6, and 9 h after a3-s vortex mixing to allow homogeneous sampling. Cellconcentration was determined from optical density (OD)measured with a Spectronic 20 spectrophotometer at 600nm (Bausch & Lomb Inc., Madison, WI, USA), whereasglow luminescence was recorded from a 100-�L aliquot ofthe culture using the Quantalum 2000 luminometer. Aftereach experiment the culture was tested for possible micro-bial contamination by inoculating the content on a solidASG medium that was checked for growth and biolumines-cence on subsequent days. In every case luminescent bac-teria, assumed to be P. phosphoreum, were the only organ-isms growing on the plates.
Bacterial bioluminescence depends on cell concentration(Hastings and Nealson, 1977), so light levels measured inthis bioassay were expressed per unit cell. The relationshipbetween OD600 and corresponding cell concentration wasestablished during the experimental period. Aliquots fromthree independent experiments were taken at various times,measured for OD, and processed for cell counting (Smith etal., 1995). Aliquots were fixed with borate-buffered forma-lin (2% final concentration) and stained for 10 min with 1�g/mL 4�6-diamidino-2-phenylindole (DAPI). They werethen filtered onto 0.2 �m of black polycarbonate filters(Nucleopore), mounted on slides with low fluorescenceimmersion oil (Criterion, Sciences), and examined with anOlympus BH-2 epifluorescence microscope. Individualcells were counted, and the corresponding cell concentra-tion calculated (Porter and Feig, 1980). The linear regres-sion relationship between OD600 and cell abundance,Ncells � 2184.202 � 224 647.592 � OD600, with R2 �0.934 (p � 0.0001), was used to calculate the number ofcells from OD600 measurements.
Photocyte Bioassay
Photocytes were isolated from the brittlestar Ophiopsilacalifornica (Ophiuroidea, Echinodermata). Brittlestars werecollected by SCUBA at night in May and August 2000 at adepth of 7–10 m near the Wrigley Institute for Environmen-tal Studies of the University of Southern California, onCatalina Island, California. Individuals collected from thesandy bottom were immediately placed in fresh circulatingseawater aquariums at the Wrigley Center before being
transported to the Scripps Institution of Oceanography (LaJolla, CA, USA), where they were kept in circulating sea-water aquariums filled with sand from the collection areaand fed once a week with plankton broth.
Photocyte isolation was based on the method of (Deheynet al., 2000a). In summary, 3–5 brittlestars (ca. 5 g wetweight) were anesthetized for 5 min in 3.5% MgCl2 inartificial seawater (Table I); arms were then separated fromthe disc using surgical scissors and chopped into smallfragments with a scalpel blade. Cells were dissociated fromarm fragments by enzymatic digestion with three treatmentsof pronase (35 min each at 30°C, followed by ASW rins-ing). Dissociated cells from each treatment were pooledtogether and layered on a Percoll density gradient by ultra-centrifugation (30 000 g, 30 min, 4°C). The concentratedlayer of photocytes was then removed from the gradient bypipette and rinsed with ASW at 4°C. About 2 � 108 cellsg�1 arm tissue was obtained using this procedure. Photocytelight production showed no significant changes in intensityand kinetics for up to 36 h after isolation. The photocytebioassay was performed by exposing photocyte suspensionsin ASW (25 �L) to the same volume of metal stock solution(2� concentrated), for 0, 0.5, 1, 2, 3, 4, 6, 9, and 24 h (time0 was always � 1 h after completion of the photocyteisolation). Light emission was chemically stimulated using200 mM potassium chloride (KCl) to exhaust total lumines-cence capacity (Mallefet et al., 1992), and the light emissionwas recorded for 40 s using a Lumat 9507 luminometer(EG&G, Perkin Elmer, Gaithersburg, MD, USA). KCl-induced light production is monophasic, consisting of asingle flash of bioluminescence characterized by the maxi-mum intensity (Imax) of light production (Deheyn et al.,2000a). Imax values were normalized by the number ofphotocytes in the 25-�L volume, knowing the initial massof arm tissue used in the isolation process, the number ofcells extracted per gram of tissue, and the final volume ofASW-enriched photocyte solution.
Speciation Calculations
Each bioassay required the use of a specific medium (TableI). Consequently, the chemical characteristics (pH, ionicstrength, I) and metal speciation were different in eachbioassay. The speciation of each metal in each medium wascalculated using thermodynamic equilibrium constants ob-tained from a variety of sources (Martell and Smith, 1974;Martell et al., 1993; Morel and Hering, 1993) and thechemical equilibrium program HYDRAQL (Papelis et al.,1988). HYDRAQL uses the Davies activity correction,which is valid for I � 0.5. The medium used in the photo-cyte bioassay (ASW) was the only medium for which theionic strength exceeded 0.5. It was necessary to invoke theMacInnes convention and the Debye–Huckel limiting lawdeveloped by Millero and coworkers (Millero and Schre-iber, 1982; Millero and Hawke, 1992). It was not possible to
164 DEHEYN, BENCHEIKH-LATMANI, AND LATZ
apply the MacInnes convention for activity correction to 7of 183 complexes formed because the required physico-chemical data were unavailable for those complexes. How-ever, those complexes did not contribute significantly to themetal speciation (�0.00001%) and consequently were ig-nored. Finally, thermodynamic data for metal complexationby glycerol and glycerolphosphate (both constituents of themedium used in the P. phosphoreum bioassay) were un-available; both constituents were expected to have lowcomplexation with metals (Atay and Robinson, 1999; Atayand Varnali, 2000).
Speciation was calculated for 25°C despite the variabilityin the temperature conditions of the bioassays (Table I). Theformation of chemical complexes depends on temperature(Byrne et al., 1988) and can be accurately calculated ifenthalpy values are known for the relevant complexes.However, enthalpy values were not available for manycomplexes. Therefore, bias associated with the absence oftemperature correction was estimated for each medium andmetal by considering exclusively the most abundant metalcomplexes for which enthalpy values were available (Mar-tell and Smith, 1974; Byrne et al., 1988; Martell et al., 1993;Stumm and Morgan, 1995). Speciation at 25°C and at thetemperature of the bioassay was calculated using HY-DRAQL. Overall, complex concentrations at the experi-mental temperature were lower than that calculated for25°C; concentration (mean � 95% CI) was decreased by13.5 � 0.045% (n � 204) for the Microtox� bioassay(15°C), 1.4 � 0.023% (n � 237) for the P. phosphoreumbioassay (22°C), and 17.5 � 0.043% (n � 240) for thephotocyte bioassay (8°C). Thus, the speciation presentedhere may overestimate the concentration of some complexesby up to 17.5%.
Statistical Analysis
The original bioluminescence values or cell culture concen-tration (OD600) were log(x � 1) transformed before statis-tical analysis, as suggested when homoscedasticity is notfulfilled in a data set (Motulsky, 1995; Zar, 1996). De-creases in bioluminescence or cell concentration were testedfor significance using the upper-tailed paired “ratio” t-testanalysis (H0: mean difference � 0), which is appropriatewhen the relative difference between treatment and controlis a more consistent measure than the absolute value of thetreatment (Motulsky, 1995; Zar, 1996). In addition, anyoccasional increase in bioluminescence or cell concentra-tion (negative MDt) was tested using a lower-paired ratio ttest (H0: mean difference � 0).
Multifactorial analysis of variance (ANOVA) was per-formed on primary data of the P. phosphoreum bioassay toidentify the percentage of variation in bioluminescence be-cause of changes in cell concentration (OD600). The per-centage was determined by calculating the ratio between the
sum of squares associated with the factor and the total sumof squares (all possible factors of variation � residual; Zar,1996).
The common toxicity indices EC50 and LT50 could notbe used in this study because bioluminescence and cellconcentration often did not decrease by more than 50% aftermetal exposure. Therefore, the parameter MD (mean differ-ence � control � treatment) was used to compare metaleffects among bioassays. Thus, positive MD values indi-cated a decrease in treatment compared to the control,whereas negative MD values described an increase in thetreatment compared to the control. MDt values representedthe mean difference calculated at every experimental timepoint. The test used to determine significance of the MDt
values was based on the upper-tailed paired t-test analysis ofeach metal, and for each concentration the change in MDt
values with time exposure was described using a single-component first-order kinetics exponential model: MDt �MDeq (1 � exp�k*t), where MDt and MDeq are the meandifferences at time t (h) and at equilibrium, respectively, andk is the rate constant (h�1) (Kuroshima et al., 1993; Slob,2002). For each metal parameters of the model together withmetal chemical speciation were used for comparative anal-ysis of bioassays. All statistical analyses were performedwith 0.05 designated as the significance level (�) and usingStatview 5.0, Statistica, and SuperAnova 1.11 software(SAS Institute, Inc.).
RESULTS
For each bioassay, bioluminescence of the control (nometal) sample changed with time. For the Microtox� bio-assay, bioluminescence of the control decreased over the2-h incubation time, with the greatest decrease occurringwithin the first 0.5 h (Fig. 1). For the P. phosphoreumbioassay, bioluminescence increased steadily concomitantlywith cell concentration between the first and ninth hours ofthe experiment. For the photocyte bioassay, biolumines-cence usually increased over the first 6 h of the experiment,then decreased to the original level. These trends werereproduced for all replicates, but the bioluminescence levelvaried among replicates (data not shown).
In general, with increasing time and/or concentration ofmetal exposure, the bioluminescence of the three bioassaysdecreased compared to the control(Fig. 1). Changes in cellconcentration followed the same trend upon metal exposurein the P. phosphoreum bioassay. In this bioassay the growthphase of the culture affected the bioluminescence capacityof the bacteria. Therefore, the percentage of the observedvariation in bioluminescence was related to change in cellconcentration with time. The exposure concentrations of themetals, calculated using multifactor ANOVA, were Ag,13.1; Al, 25.9; Cd, 44.2; Cr, 14.6; Cu, 16.5; Fe, 27.1; Hg,7.2; Mn, 32.7; Pb, 25.7; U, 25.5; and Zn, 17.6. This indi-
SPECIATION AND TOXICITY OF METALS 165

cates that for metals like Hg most of the observed change inbioluminescence was a direct effect of the metal on lightproduction, whereas for metals like Cd, changes in biolu-minescence were also resulted from changes in cell concen-tration.
Modeling Changes in Bioluminescence
The effect of metal exposure on bioluminescence was mod-eled for each metal concentration and bioassay using anexponential model of the variation of the MDt values overtime. As shown for Cd for the three bioassays (Fig. 2), MDt
reached a plateau for the highest and intermediate metalconcentrations before the end of the exposure. At the lowestmetal concentrations, a plateau was not always reachedduring the experiment, indicating that at those concentra-tions, the effects on bioluminescence would be greater forlonger exposure times of the bioassay (Fig. 2).
Effect of Exposure Time
The effect of exposure time was tested for the highest metalconcentration considered (Table II). For the Microtox� as-says, bioluminescence MDt values significantly decreased(positive MDt values) over the entire exposure period(0.25–2 h, as shown for Cd in Fig. 1), except for Hg and Mn,for which the decrease was significant only after exposuresof 1 and 0.5 h, respectively.
For the P. phosphoreum bioassay, bioluminescence MDt
values significantly decreased over the entire exposure pe-riod (0.5–9 h, as shown for Cd in Fig. 1) for Ag, Cd, Cu, andHg. A similar effect was observed for Zn, but the decreasewas not always significant (Table II). Bioluminescence MDt
values did not change significantly on exposure to Al, Fe,Pb, Cr, Mn, and U, other than increasing significantly after6 h for Pb (Table II). The observed effects of the metals on
Fig. 1. Effect of Cd concentration as a function of time on (A) the Microtox� bioassay, (B, C) the P. phoshoreum bioassay,and (D) the photocyte bioassay (symbols legend: ■, control 0 M; ¹, 10�7 M; E, 10�5 M; ‚, 10�3 M).
Fig. 2. Exponential models describing values of bioluminescence mean difference from the control (MDt) as a function of timeexposure to the three highest total concentrations of Cd for (A) the Microtox� bioassay, (B) the P. phoshoreum bioassay, and(C) the photocyte bioassay (symbols legend: ‚, 10�3 M; E, 10�4 M; �, 10�5 M).
166 DEHEYN, BENCHEIKH-LATMANI, AND LATZ

the bioluminescence of P. phosphoreum were not alwaysrelated to the effects on bacterial growth. Cell concentrationMDt decreased significantly for Ag, Cd, Cu, and Hg (Fig.1), with the decrease generally becoming significant after6 h of exposure, except for Ag (1 h) and Hg (3 h), as shownin Table II. There was no significant decrease in the cellconcentration MDt values for Al, Cr, Fe, Mn, Pb, U, and Zn,yet, except for Mn and Cr, MDt values were markedlyincreased on metal exposure; this effect was significant forAl (negative MDt values; Table III).
For the photocyte bioassay, bioluminescence MDt valuesdecreased significantly for Cd (2, 4, 9, and 24 h), Cu (9 and24 h), and Hg, whereas it was significantly increased for Cr(6 and 9 h), Mn (0.5–4 h), Pb (0.5 h), and U (4 h), as shownin Table II.
Effect of Concentration
The effect of total metal concentration on bioluminescencewas tested at the longest time exposure for each bioassay (2h for the Microtox� bioassay, 9 h for the P. phosphoreumbioassay, 24 h for the photocyte bioassay). For the Micro-tox� bioassay, typically observed MD2 was significantlydecreased at 10�3 and 10�4 M for all metals and at as lowas 10�5 M for Ag, Al, U, and Zn and 10�6 M for Hg (TableIII).
For the P. phosphoreum bioassay, the observed biolumi-nescence MD9 significantly decreased for concentrations �10�6 M for Ag and Hg, and � 10�5 M for Cd and Cu (TableIII). Similarly, the cell concentration observed MD9 of wassignificantly decreased for the same metals and concentra-tions (data not shown). The observed bioluminescence MD9
consistently decreased, although the change was not signif-icant upon exposure to Cr and U at concentrations � 10�7
M, whereas there was no trend in the variation of growth.The observed bioluminescence MD9 significantly increasedon exposure to Al (except 10�5 M), Pb, Mn (except 10�3
M), and Zn (except 10�4 M), as shown in Table III. Simi-larly, the observed cell concentration MD9 was enhancedfor the same metals, expect for Al. The case of Fe exposurewas unusual; the observed bioluminescence and cell con-centration MD9 values both decreased at concentrations �10�6 M and increased at higher concentrations (Table III).
For the photocyte bioassay, the observed MD24 signifi-cantly decreased for Cd at 10�3 M, for Cu at 10�3 M, andfor Hg at 10�6 to 10�4 M. The observed MD24 significantlyincreased for Al at 10�7 M and for Mn from 10�7–10�4 M(Table III).
The effect of metal exposure over time was modeled foreach metal concentration of each bioassay. In general, MDt
values observed at the longest time exposure and MDeq
values calculated by the model were similar (Table III),indicating that the maximum effects of the metals werereached from the longest time exposure. Exceptions were at
lower metal concentrations, meaning that the observedmetal effect was not the greatest possible for those concen-trations because of the time limit of the bioassay. Thekinetic parameter, k, increased with metal concentration,suggesting a faster decrease of MDeq bioluminescence val-ues for increasing metal concentrations (Table III). For thesame metal and metal concentration the kinetics of metaleffect were different among bioassays. For Cd, Cu, and Hgmetals in all three bioassays that had a significant effect onMDeq bioluminescence, k was greatest for the Microtox�bioassay and lowest for the photocyte bioassay (Table III).
Metal Speciation
The highest soluble metal concentration varied among thethree media, ranging from 10�3 M for the Microtox� bio-assay to as low as 10�5 M for some metals in the P.phosphoreum and photocyte bioassays (Table IV). Ionicstrength of the medium varied among the bioassays; it was0.34 for the Microtox� bioassay, 0.43 for the P. phos-phoreum bioassay, and 0.61 for the photocyte bioassay. ThepH was similar between the Microtox� and photocyte bio-assays for a given metal, ranging from 3.5 to 6.4 dependingon the element, whereas it was 7.7 for the P. phosphoreumbioassay (Table IV). Each bioassay was characterized by thespecific chemical speciation of the metal in the correspond-ing medium; the concentration of free metal ions as well asthat of various metal complexes varied depending on themetal, the pH, and the ligands present in the medium (TableIV).
Based on chemical equilibrium computations, metal spe-ciation and corresponding concentrations were similaramong the three media for Ag, Cd, Cr, Hg, Mn, and Zn(Table IV). Dominant complexes were chlorides occurringin concentrations � the free-ion concentration, except forCr, which formed oxide complexes in concentrations � thefree-ion concentration.
For Al, Cu, and Pb, metal speciation and correspondingconcentrations were similar between the Microtox� andphotocyte bioassays (Table IV). Dominant complexes werehydroxides (Al only), chlorides, and sulfates occurring inconcentrations � the free ion concentration. According tothe thermodynamics calculations, Al(OH)3 was predicted toprecipitate, but only in the Microtox� bioassay medium. Inthe P. phosphoreum bioassay medium, Al occurred as asoluble or precipitated hydroxide complex in greater con-centrations than as Al3�. Consequently, Al3� had a lowerconcentration in this essay than in the other two. Theelement Cu formed a soluble hydroxide-citrate or ammo-nium complex or precipitated as a hydroxide complex inconcentrations usually � the free ion form. The Cu2�
concentration in the P. phosphoreum bioassay medium wasless than that for the other bioassays. The element Pboccurred in soluble chloride and sulfates complexes orprecipitated as carbonate hydroxide in concentrations sim-
SPECIATION AND TOXICITY OF METALS 167

TABLE II. Time course of mean difference from the control (MDt: mean control value—mean treatment value attime t (exposure) for each metal for the three bioassays
MetalTime(h)
Microtox® P. phosphoreum Photocyte
Conc. (M) MDt Biolum. Conc. (M) MDt Biolum. MDt OD Conc. (M) MDt Biolum.
Ag 0 10�3 �0.051 10�5 0.056 0.043 10�4 0.0400.25 0.263 NA NA NA0.5 0.438 2.165 0.075 �0.0341 0.616 2.207 0.107 �0.0122 0.722 2.178 0.154 �0.0033 NA 2.140 0.221 �0.0044 NA 2.216 0.310 0.0036 NA 2.370 0.447 0.0479 NA 2.579 0.642 0.061
24 NA NA NA 0.394A1 0 10�3 0.080 10�3 0.041 0.044 10�4 �0.001
0.25 0.888 NA NA NA0.5 1.049 0.362 �0.081 �0.0491 0.992 0.210 �0.063 0.0182 0.940 0.069 �0.048 0.0263 NA �0.081 �0.016 0.0954 NA �0.150 0.004 �0.0636 NA �0.308 0.055 �0.1039 NA �0.468 0.086 0.049
24 NA NA NA 0.004Cd 0 10�3 0.188 10�3 �0.308 0.040 10�3 �0.128
0.25 0.506 NA NA NA0.5 0.699 1.497 0.012 0.2941 0.634 2.033 0.045 0.2802 0.811 1.388 0.084 0.2743 NA 1.985 0.115 0.3254 NA 2.065 0.168 0.2556 NA 2.167 0.279 0.4249 NA 2.311 0.380 0.723
24 NA NA NA 0.620Cr 0 10�3 0.142 10�4 0.162 0.050 10�3 �0.033
0.25 0.283 NA NA NA0.5 0.422 0.085 0.056 �0.0121 0.639 �0.042 0.060 �0.0992 0.598 0.132 0.034 �0.0163 NA 0.063 0.053 �0.0314 NA 0.088 0.054 0.0616 NA 0.113 0.097 �0.0919 NA 0.210 0.081 0.039
24 NA NA NA �0.015Cu 0 10�3 0.065 10�4 �0.175 �0.027 10�3 �0.006
0.25 0.594 NA NA NA0.5 0.591 1.850 0.033 0.1181 0.544 1.784 0.060 0.1482 0.501 1.628 0.081 0.1243 NA 1.669 0.146 0.1944 NA 1.473 0.190 0.2656 NA 1.484 0.295 0.4719 NA 1.087 0.430 0.750
24 NA NA NA 1.607Fe 0 10�3 0.059 10�4 �0.105 �0.026 10�4 �0.029
0.25 0.872 NA NA NA0.5 0.788 �0.041 �0.087 0.0161 0.848 �0.098 �0.081 �0.0012 0.787 �0.012 �0.079 �0.013
168 DEHEYN, BENCHEIKH-LATMANI, AND LATZ
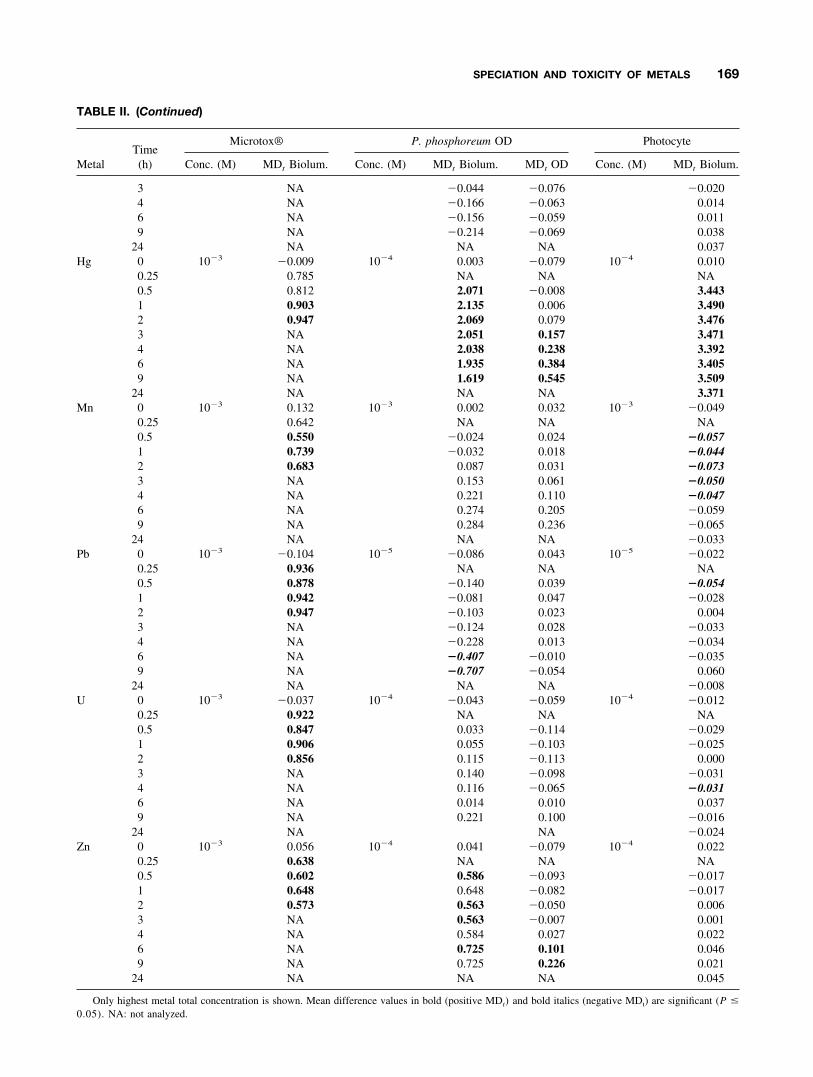
TABLE II. (Continued)
MetalTime(h)
Microtox® P. phosphoreum OD Photocyte
Conc. (M) MDt Biolum. Conc. (M) MDt Biolum. MDt OD Conc. (M) MDt Biolum.
3 NA �0.044 �0.076 �0.0204 NA �0.166 �0.063 0.0146 NA �0.156 �0.059 0.0119 NA �0.214 �0.069 0.038
24 NA NA NA 0.037Hg 0 10�3 �0.009 10�4 0.003 �0.079 10�4 0.010
0.25 0.785 NA NA NA0.5 0.812 2.071 �0.008 3.4431 0.903 2.135 0.006 3.4902 0.947 2.069 0.079 3.4763 NA 2.051 0.157 3.4714 NA 2.038 0.238 3.3926 NA 1.935 0.384 3.4059 NA 1.619 0.545 3.509
24 NA NA NA 3.371Mn 0 10�3 0.132 10�3 0.002 0.032 10�3 �0.049
0.25 0.642 NA NA NA0.5 0.550 �0.024 0.024 �0.0571 0.739 �0.032 0.018 �0.0442 0.683 0.087 0.031 �0.0733 NA 0.153 0.061 �0.0504 NA 0.221 0.110 �0.0476 NA 0.274 0.205 �0.0599 NA 0.284 0.236 �0.065
24 NA NA NA �0.033Pb 0 10�3 �0.104 10�5 �0.086 0.043 10�5 �0.022
0.25 0.936 NA NA NA0.5 0.878 �0.140 0.039 �0.0541 0.942 �0.081 0.047 �0.0282 0.947 �0.103 0.023 0.0043 NA �0.124 0.028 �0.0334 NA �0.228 0.013 �0.0346 NA �0.407 �0.010 �0.0359 NA �0.707 �0.054 0.060
24 NA NA NA �0.008U 0 10�3 �0.037 10�4 �0.043 �0.059 10�4 �0.012
0.25 0.922 NA NA NA0.5 0.847 0.033 �0.114 �0.0291 0.906 0.055 �0.103 �0.0252 0.856 0.115 �0.113 0.0003 NA 0.140 �0.098 �0.0314 NA 0.116 �0.065 �0.0316 NA 0.014 0.010 0.0379 NA 0.221 0.100 �0.016
24 NA NA �0.024Zn 0 10�3 0.056 10�4 0.041 �0.079 10�4 0.022
0.25 0.638 NA NA NA0.5 0.602 0.586 �0.093 �0.0171 0.648 0.648 �0.082 �0.0172 0.573 0.563 �0.050 0.0063 NA 0.563 �0.007 0.0014 NA 0.584 0.027 0.0226 NA 0.725 0.101 0.0469 NA 0.725 0.226 0.021
24 NA NA NA 0.045
Only highest metal total concentration is shown. Mean difference values in bold (positive MDt) and bold italics (negative MDt) are significant (P �
0.05). NA: not analyzed.
SPECIATION AND TOXICITY OF METALS 169
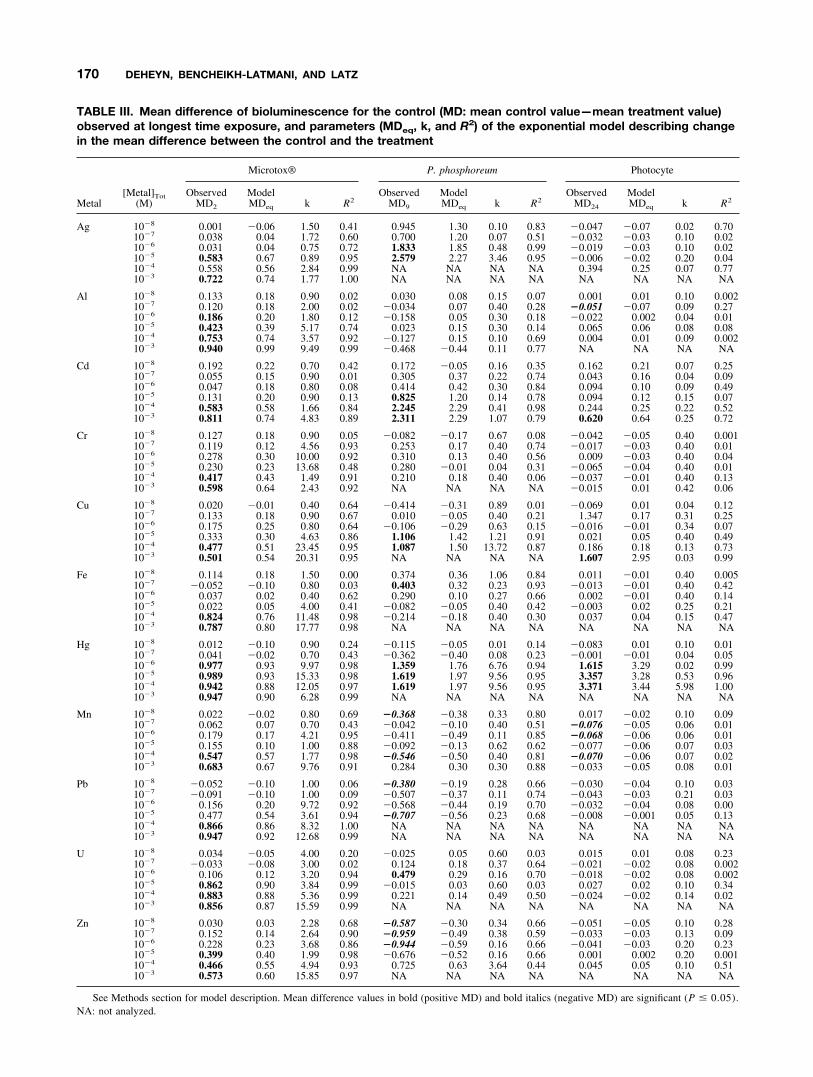
TABLE III. Mean difference of bioluminescence for the control (MD: mean control value—mean treatment value)observed at longest time exposure, and parameters (MDeq, k, and R2) of the exponential model describing changein the mean difference between the control and the treatment
Metal[Metal]Tot
(M)
Microtox® P. phosphoreum Photocyte
ObservedMD2
ModelMDeq k R2
ObservedMD9
ModelMDeq k R2
ObservedMD24
ModelMDeq k R2
Ag 10�8 0.001 �0.06 1.50 0.41 0.945 1.30 0.10 0.83 �0.047 �0.07 0.02 0.7010�7 0.038 0.04 1.72 0.60 0.700 1.20 0.07 0.51 �0.032 �0.03 0.10 0.0210�6 0.031 0.04 0.75 0.72 1.833 1.85 0.48 0.99 �0.019 �0.03 0.10 0.0210�5 0.583 0.67 0.89 0.95 2.579 2.27 3.46 0.95 �0.006 �0.02 0.20 0.0410�4 0.558 0.56 2.84 0.99 NA NA NA NA 0.394 0.25 0.07 0.7710�3 0.722 0.74 1.77 1.00 NA NA NA NA NA NA NA NA
Al 10�8 0.133 0.18 0.90 0.02 0.030 0.08 0.15 0.07 0.001 0.01 0.10 0.00210�7 0.120 0.18 2.00 0.02 �0.034 0.07 0.40 0.28 �0.051 �0.07 0.09 0.2710�6 0.186 0.20 1.80 0.12 �0.158 0.05 0.30 0.18 �0.022 0.002 0.04 0.0110�5 0.423 0.39 5.17 0.74 0.023 0.15 0.30 0.14 0.065 0.06 0.08 0.0810�4 0.753 0.74 3.57 0.92 �0.127 0.15 0.10 0.69 0.004 0.01 0.09 0.00210�3 0.940 0.99 9.49 0.99 �0.468 �0.44 0.11 0.77 NA NA NA NA
Cd 10�8 0.192 0.22 0.70 0.42 0.172 �0.05 0.16 0.35 0.162 0.21 0.07 0.2510�7 0.055 0.15 0.90 0.01 0.305 0.37 0.22 0.74 0.043 0.16 0.04 0.0910�6 0.047 0.18 0.80 0.08 0.414 0.42 0.30 0.84 0.094 0.10 0.09 0.4910�5 0.131 0.20 0.90 0.13 0.825 1.20 0.14 0.78 0.094 0.12 0.15 0.0710�4 0.583 0.58 1.66 0.84 2.245 2.29 0.41 0.98 0.244 0.25 0.22 0.5210�3 0.811 0.74 4.83 0.89 2.311 2.29 1.07 0.79 0.620 0.64 0.25 0.72
Cr 10�8 0.127 0.18 0.90 0.05 �0.082 �0.17 0.67 0.08 �0.042 �0.05 0.40 0.00110�7 0.119 0.12 4.56 0.93 0.253 0.17 0.40 0.74 �0.017 �0.03 0.40 0.0110�6 0.278 0.30 10.00 0.92 0.310 0.13 0.40 0.56 0.009 �0.03 0.40 0.0410�5 0.230 0.23 13.68 0.48 0.280 �0.01 0.04 0.31 �0.065 �0.04 0.40 0.0110�4 0.417 0.43 1.49 0.91 0.210 0.18 0.40 0.06 �0.037 �0.01 0.40 0.1310�3 0.598 0.64 2.43 0.92 NA NA NA NA �0.015 0.01 0.42 0.06
Cu 10�8 0.020 �0.01 0.40 0.64 �0.414 �0.31 0.89 0.01 �0.069 0.01 0.04 0.1210�7 0.133 0.18 0.90 0.67 0.010 �0.05 0.40 0.21 1.347 0.17 0.31 0.2510�6 0.175 0.25 0.80 0.64 �0.106 �0.29 0.63 0.15 �0.016 �0.01 0.34 0.0710�5 0.333 0.30 4.63 0.86 1.106 1.42 1.21 0.91 0.021 0.05 0.40 0.4910�4 0.477 0.51 23.45 0.95 1.087 1.50 13.72 0.87 0.186 0.18 0.13 0.7310�3 0.501 0.54 20.31 0.95 NA NA NA NA 1.607 2.95 0.03 0.99
Fe 10�8 0.114 0.18 1.50 0.00 0.374 0.36 1.06 0.84 0.011 �0.01 0.40 0.00510�7 �0.052 �0.10 0.80 0.03 0.403 0.32 0.23 0.93 �0.013 �0.01 0.40 0.4210�6 0.037 0.02 0.40 0.62 0.290 0.10 0.27 0.66 0.002 �0.01 0.40 0.1410�5 0.022 0.05 4.00 0.41 �0.082 �0.05 0.40 0.42 �0.003 0.02 0.25 0.2110�4 0.824 0.76 11.48 0.98 �0.214 �0.18 0.40 0.30 0.037 0.04 0.15 0.4710�3 0.787 0.80 17.77 0.98 NA NA NA NA NA NA NA NA
Hg 10�8 0.012 �0.10 0.90 0.24 �0.115 �0.05 0.01 0.14 �0.083 0.01 0.10 0.0110�7 0.041 �0.02 0.70 0.43 �0.362 �0.40 0.08 0.23 �0.001 �0.01 0.04 0.0510�6 0.977 0.93 9.97 0.98 1.359 1.76 6.76 0.94 1.615 3.29 0.02 0.9910�5 0.989 0.93 15.33 0.98 1.619 1.97 9.56 0.95 3.357 3.28 0.53 0.9610�4 0.942 0.88 12.05 0.97 1.619 1.97 9.56 0.95 3.371 3.44 5.98 1.0010�3 0.947 0.90 6.28 0.99 NA NA NA NA NA NA NA NA
Mn 10�8 0.022 �0.02 0.80 0.69 �0.368 �0.38 0.33 0.80 0.017 �0.02 0.10 0.0910�7 0.062 0.07 0.70 0.43 �0.042 �0.10 0.40 0.51 �0.076 �0.05 0.06 0.0110�6 0.179 0.17 4.21 0.95 �0.411 �0.49 0.11 0.85 �0.068 �0.06 0.06 0.0110�5 0.155 0.10 1.00 0.88 �0.092 �0.13 0.62 0.62 �0.077 �0.06 0.07 0.0310�4 0.547 0.57 1.77 0.98 �0.546 �0.50 0.40 0.81 �0.070 �0.06 0.07 0.0210�3 0.683 0.67 9.76 0.91 0.284 0.30 0.30 0.88 �0.033 �0.05 0.08 0.01
Pb 10�8 �0.052 �0.10 1.00 0.06 �0.380 �0.19 0.28 0.66 �0.030 �0.04 0.10 0.0310�7 �0.091 �0.10 1.00 0.09 �0.507 �0.37 0.11 0.74 �0.043 �0.03 0.21 0.0310�6 0.156 0.20 9.72 0.92 �0.568 �0.44 0.19 0.70 �0.032 �0.04 0.08 0.0010�5 0.477 0.54 3.61 0.94 �0.707 �0.56 0.23 0.68 �0.008 �0.001 0.05 0.1310�4 0.866 0.86 8.32 1.00 NA NA NA NA NA NA NA NA10�3 0.947 0.92 12.68 0.99 NA NA NA NA NA NA NA NA
U 10�8 0.034 �0.05 4.00 0.20 �0.025 0.05 0.60 0.03 0.015 0.01 0.08 0.2310�7 �0.033 �0.08 3.00 0.02 0.124 0.18 0.37 0.64 �0.021 �0.02 0.08 0.00210�6 0.106 0.12 3.20 0.94 0.479 0.29 0.16 0.70 �0.018 �0.02 0.08 0.00210�5 0.862 0.90 3.84 0.99 �0.015 0.03 0.60 0.03 0.027 0.02 0.10 0.3410�4 0.883 0.88 5.36 0.99 0.221 0.14 0.49 0.50 �0.024 �0.02 0.14 0.0210�3 0.856 0.87 15.59 0.99 NA NA NA NA NA NA NA NA
Zn 10�8 0.030 0.03 2.28 0.68 �0.587 �0.30 0.34 0.66 �0.051 �0.05 0.10 0.2810�7 0.152 0.14 2.64 0.90 �0.959 �0.49 0.38 0.59 �0.033 �0.03 0.13 0.0910�6 0.228 0.23 3.68 0.86 �0.944 �0.59 0.16 0.66 �0.041 �0.03 0.20 0.2310�5 0.399 0.40 1.99 0.98 �0.676 �0.52 0.16 0.66 0.001 0.002 0.20 0.00110�4 0.466 0.55 4.94 0.93 0.725 0.63 3.64 0.44 0.045 0.05 0.10 0.5110�3 0.573 0.60 15.85 0.97 NA NA NA NA NA NA NA NA
See Methods section for model description. Mean difference values in bold (positive MD) and bold italics (negative MD) are significant (P � 0.05).NA: not analyzed.
170 DEHEYN, BENCHEIKH-LATMANI, AND LATZ
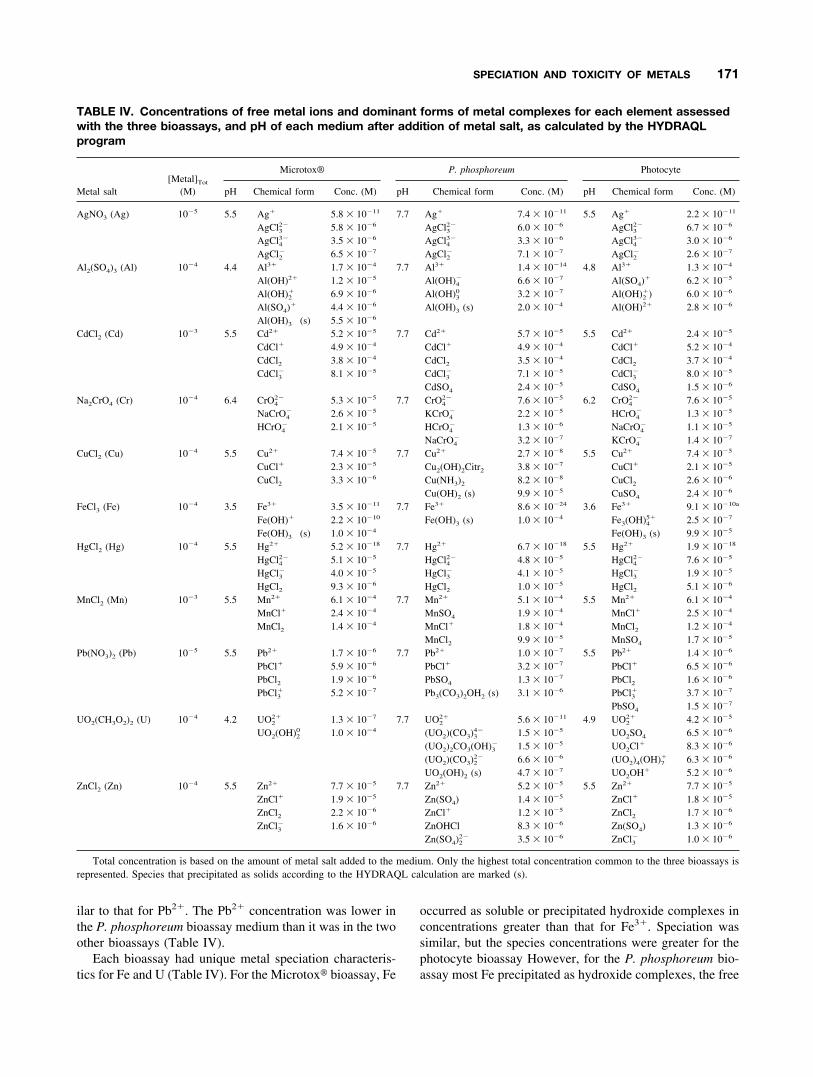
ilar to that for Pb2�. The Pb2� concentration was lower inthe P. phosphoreum bioassay medium than it was in the twoother bioassays (Table IV).
Each bioassay had unique metal speciation characteris-tics for Fe and U (Table IV). For the Microtox� bioassay, Fe
occurred as soluble or precipitated hydroxide complexes inconcentrations greater than that for Fe3�. Speciation wassimilar, but the species concentrations were greater for thephotocyte bioassay However, for the P. phosphoreum bio-assay most Fe precipitated as hydroxide complexes, the free
TABLE IV. Concentrations of free metal ions and dominant forms of metal complexes for each element assessedwith the three bioassays, and pH of each medium after addition of metal salt, as calculated by the HYDRAQLprogram
Metal salt[Metal]Tot
(M)
Microtox® P. phosphoreum Photocyte
pH Chemical form Conc. (M) pH Chemical form Conc. (M) pH Chemical form Conc. (M)
AgNO3 (Ag) 10�5 5.5 Ag� 5.8 � 10�11 7.7 Ag� 7.4 � 10�11 5.5 Ag� 2.2 � 10�11
AgCl32� 5.8 � 10�6 AgCl3
2� 6.0 � 10�6 AgCl32� 6.7 � 10�6
AgCl43� 3.5 � 10�6 AgCl4
3� 3.3 � 10�6 AgCl43� 3.0 � 10�6
AgCl2� 6.5 � 10�7 AgCl2
� 7.1 � 10�7 AgCl2� 2.6 � 10�7
Al2(SO4)3 (Al) 10�4 4.4 Al3� 1.7 � 10�4 7.7 Al3� 1.4 � 10�14 4.8 Al3� 1.3 � 10�4
Al(OH)2� 1.2 � 10�5 Al(OH)4� 6.6 � 10�7 Al(SO4)� 6.2 � 10�5
Al(OH)2� 6.9 � 10�6 Al(OH)3
0 3.2 � 10�7 Al(OH)2�) 6.0 � 10�6
Al(SO4)� 4.4 � 10�6 Al(OH)3 (s) 2.0 � 10�4 Al(OH)2� 2.8 � 10�6
Al(OH)3 (s) 5.5 � 10�6
CdCl2 (Cd) 10�3 5.5 Cd2� 5.2 � 10�5 7.7 Cd2� 5.7 � 10�5 5.5 Cd2� 2.4 � 10�5
CdCl� 4.9 � 10�4 CdCl� 4.9 � 10�4 CdCl� 5.2 � 10�4
CdCl2 3.8 � 10�4 CdCl2 3.5 � 10�4 CdCl2 3.7 � 10�4
CdCl3� 8.1 � 10�5 CdCl3
� 7.1 � 10�5 CdCl3� 8.0 � 10�5
CdSO4 2.4 � 10�5 CdSO4 1.5 � 10�6
Na2CrO4 (Cr) 10�4 6.4 CrO42� 5.3 � 10�5 7.7 CrO4
2� 7.6 � 10�5 6.2 CrO42� 7.6 � 10�5
NaCrO4� 2.6 � 10�5 KCrO4
� 2.2 � 10�5 HCrO4� 1.3 � 10�5
HCrO4� 2.1 � 10�5 HCrO4
� 1.3 � 10�6 NaCrO4� 1.1 � 10�5
NaCrO4� 3.2 � 10�7 KCrO4
� 1.4 � 10�7
CuCl2 (Cu) 10�4 5.5 Cu2� 7.4 � 10�5 7.7 Cu2� 2.7 � 10�8 5.5 Cu2� 7.4 � 10�5
CuCl� 2.3 � 10�5 Cu2(OH)2Citr2 3.8 � 10�7 CuCl� 2.1 � 10�5
CuCl2 3.3 � 10�6 Cu(NH3)2 8.2 � 10�8 CuCl2 2.6 � 10�6
Cu(OH)2 (s) 9.9 � 10�5 CuSO4 2.4 � 10�6
FeCl3 (Fe) 10�4 3.5 Fe3� 3.5 � 10�11 7.7 Fe3� 8.6 � 10�24 3.6 Fe3� 9.1 � 10�10a
Fe(OH)� 2.2 � 10�10 Fe(OH)3 (s) 1.0 � 10�4 Fe3(OH)45� 2.5 � 10�7
Fe(OH)3 (s) 1.0 � 10�4 Fe(OH)3 (s) 9.9 � 10�5
HgCl2 (Hg) 10�4 5.5 Hg2� 5.2 � 10�18 7.7 Hg2� 6.7 � 10�18 5.5 Hg2� 1.9 � 10�18
HgCl42� 5.1 � 10�5 HgCl4
2� 4.8 � 10�5 HgCl42� 7.6 � 10�5
HgCl3� 4.0 � 10�5 HgCl3
� 4.1 � 10�5 HgCl3� 1.9 � 10�5
HgCl2 9.3 � 10�6 HgCl2 1.0 � 10�5 HgCl2 5.1 � 10�6
MnCl2 (Mn) 10�3 5.5 Mn2� 6.1 � 10�4 7.7 Mn2� 5.1 � 10�4 5.5 Mn2� 6.1 � 10�4
MnCl� 2.4 � 10�4 MnSO4 1.9 � 10�4 MnCl� 2.5 � 10�4
MnCl2 1.4 � 10�4 MnCl� 1.8 � 10�4 MnCl2 1.2 � 10�4
MnCl2 9.9 � 10�5 MnSO4 1.7 � 10�5
Pb(NO3)2 (Pb) 10�5 5.5 Pb2� 1.7 � 10�6 7.7 Pb2� 1.0 � 10�7 5.5 Pb2� 1.4 � 10�6
PbCl� 5.9 � 10�6 PbCl� 3.2 � 10�7 PbCl� 6.5 � 10�6
PbCl2 1.9 � 10�6 PbSO4 1.3 � 10�7 PbCl2 1.6 � 10�6
PbCl3� 5.2 � 10�7 Pb3(CO3)2OH2 (s) 3.1 � 10�6 PbCl3
� 3.7 � 10�7
PbSO4 1.5 � 10�7
UO2(CH3O2)2 (U) 10�4 4.2 UO22� 1.3 � 10�7 7.7 UO2
2� 5.6 � 10�11 4.9 UO22� 4.2 � 10�5
UO2(OH)20 1.0 � 10�4 (UO2)(CO3)3
4� 1.5 � 10�5 UO2SO4 6.5 � 10�6
(UO2)2CO3(OH)3� 1.5 � 10�5 UO2Cl� 8.3 � 10�6
(UO2)(CO3)22� 6.6 � 10�6 (UO2)4(OH)7
� 6.3 � 10�6
UO2(OH)2 (s) 4.7 � 10�7 UO2OH� 5.2 � 10�6
ZnCl2 (Zn) 10�4 5.5 Zn2� 7.7 � 10�5 7.7 Zn2� 5.2 � 10�5 5.5 Zn2� 7.7 � 10�5
ZnCl� 1.9 � 10�5 Zn(SO4) 1.4 � 10�5 ZnCl� 1.8 � 10�5
ZnCl2 2.2 � 10�6 ZnCl� 1.2 � 10�5 ZnCl2 1.7 � 10�6
ZnCl3� 1.6 � 10�6 ZnOHCl 8.3 � 10�6 Zn(SO4) 1.3 � 10�6
Zn(SO4)22� 3.5 � 10�6 ZnCl3
� 1.0 � 10�6
Total concentration is based on the amount of metal salt added to the medium. Only the highest total concentration common to the three bioassays isrepresented. Species that precipitated as solids according to the HYDRAQL calculation are marked (s).
SPECIATION AND TOXICITY OF METALS 171
ion form occurring only at a low concentration. The elementU occurred as a hydroxide complex in the Microtox� bio-assay medium in concentrations greater than that for the freeion form. In the P. phosphoreum bioassay medium, Uformed soluble carbonate and precipitate hydroxide com-plexes, in concentrations greater than that for the free ionform. In the photocyte bioassay U occurred as dissolvedsulfate, chloride, or hydroxide complexes in concentrationssimilar to that for the free ion form. Overall, UO2
2� concen-tration followed the ranking of P. phosphoreum bioassay �Microtox� bioassay � photocyte bioassay (Table IV).
Bioassay Sensitivity
MDt values were different among bioassays and followedthe ranking Microtox� � P. phosphoreum � photocytebioassay for Cr and Mn, photocyte � P. phosphoreum �Microtox� for Hg, and Microtox� � photocyte � P. phos-phoreum for Ag and Cu. The three bioassays had similarconcentrations of free ions in the medium at the differentMDt values, a pattern usually present for the metal com-plexes (Fig. 3A–C). The element Ag was the exception;Ag� concentration in the medium was not similar amongbioassays but increased with increasing MDt values, a pat-tern also observed for AgCl2
� but not for the other com-plexes (Fig. 3D–G).
MDt values were similar for two bioassays and greaterfor the third bioassay for Al, Cd, Fe, Pb, and U, or lower forthe third bioassay for Zn. The Microtox� bioassay had MDt
values similar to those of the P. phosphoreum bioassay forAl, Fe, Pb, and U; the P. phosphoreum bioassay had MDt
values similar to those of the photocyte bioassay for Zn, andthe Microtox� and photocyte bioassays had similar MDt
values for Cd. Usually, bioassays with similar MDt valueshad different free-ion concentrations in the medium,whereas bioassays with different MDt values had concen-trations of free ions similar to that of one of the otherbioassays (Fig. 3H–I). This pattern was not necessarilyobserved for the complexes (Fig. 3J–K).
DISCUSSION
The toxicity of metals was assessed using three cell-basedbioluminescence assays in which a decrease of light pro-duction was used as a proxy for toxicity. In addition, chem-ical speciation of the metals was determined for the threecommon culture media used in the assays. Toxicity wasobserved for Cd, Cu, and Hg in all three bioassays, in Ag forthe Microtox� and P. phosphoreum bioassays, and in Al,Cr, Fe, Mn, Pb, U, and Zn for only the Microtox� bioassay(Fig. 4). The differences observed between the bioassaysreflected variations in chemical speciation and/or the bio-logical nature of the bioassay. The relative importance of
chemical speciation and biological susceptibility determinesthe toxicity of metals.
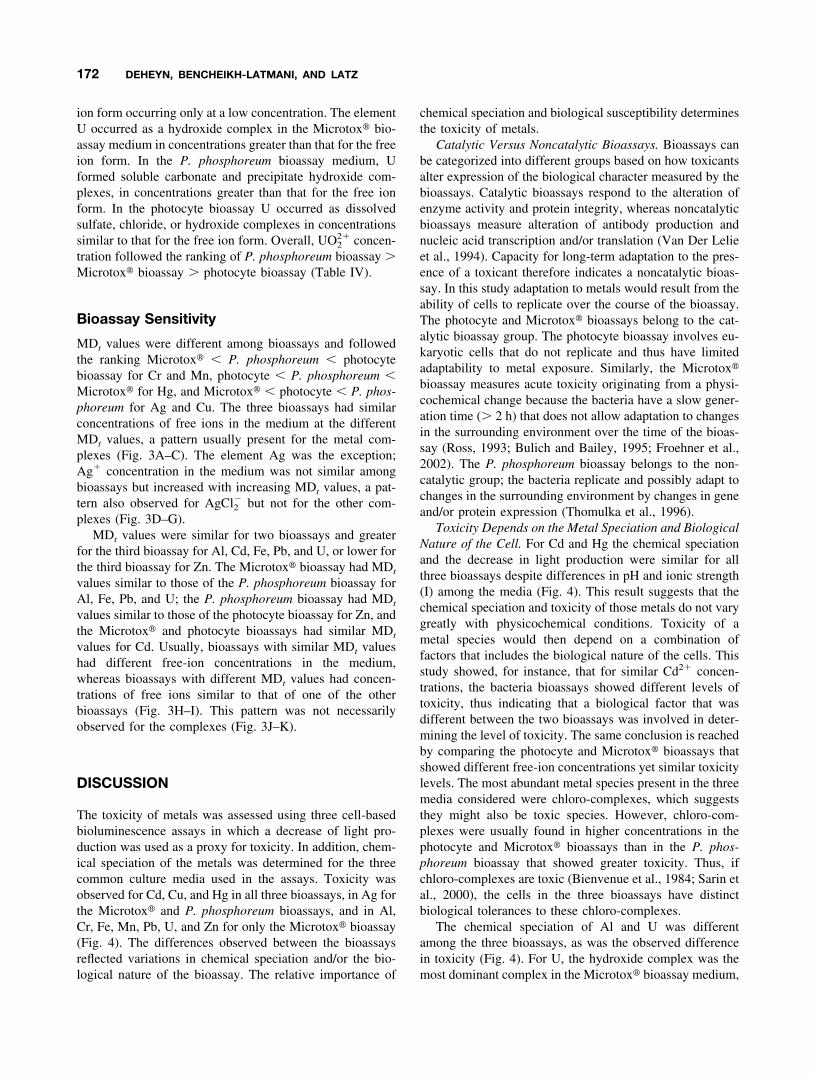
Catalytic Versus Noncatalytic Bioassays. Bioassays canbe categorized into different groups based on how toxicantsalter expression of the biological character measured by thebioassays. Catalytic bioassays respond to the alteration ofenzyme activity and protein integrity, whereas noncatalyticbioassays measure alteration of antibody production andnucleic acid transcription and/or translation (Van Der Lelieet al., 1994). Capacity for long-term adaptation to the pres-ence of a toxicant therefore indicates a noncatalytic bioas-say. In this study adaptation to metals would result from theability of cells to replicate over the course of the bioassay.The photocyte and Microtox� bioassays belong to the cat-alytic bioassay group. The photocyte bioassay involves eu-karyotic cells that do not replicate and thus have limitedadaptability to metal exposure. Similarly, the Microtox�bioassay measures acute toxicity originating from a physi-cochemical change because the bacteria have a slow gener-ation time (� 2 h) that does not allow adaptation to changesin the surrounding environment over the time of the bioas-say (Ross, 1993; Bulich and Bailey, 1995; Froehner et al.,2002). The P. phosphoreum bioassay belongs to the non-catalytic group; the bacteria replicate and possibly adapt tochanges in the surrounding environment by changes in geneand/or protein expression (Thomulka et al., 1996).
Toxicity Depends on the Metal Speciation and BiologicalNature of the Cell. For Cd and Hg the chemical speciationand the decrease in light production were similar for allthree bioassays despite differences in pH and ionic strength(I) among the media (Fig. 4). This result suggests that thechemical speciation and toxicity of those metals do not varygreatly with physicochemical conditions. Toxicity of ametal species would then depend on a combination offactors that includes the biological nature of the cells. Thisstudy showed, for instance, that for similar Cd2� concen-trations, the bacteria bioassays showed different levels oftoxicity, thus indicating that a biological factor that wasdifferent between the two bioassays was involved in deter-mining the level of toxicity. The same conclusion is reachedby comparing the photocyte and Microtox� bioassays thatshowed different free-ion concentrations yet similar toxicitylevels. The most abundant metal species present in the threemedia considered were chloro-complexes, which suggeststhey might also be toxic species. However, chloro-com-plexes were usually found in higher concentrations in thephotocyte and Microtox� bioassays than in the P. phos-phoreum bioassay that showed greater toxicity. Thus, ifchloro-complexes are toxic (Bienvenue et al., 1984; Sarin etal., 2000), the cells in the three bioassays have distinctbiological tolerances to these chloro-complexes.
The chemical speciation of Al and U was differentamong the three bioassays, as was the observed differencein toxicity (Fig. 4). For U, the hydroxide complex was themost dominant complex in the Microtox� bioassay medium,
172 DEHEYN, BENCHEIKH-LATMANI, AND LATZ
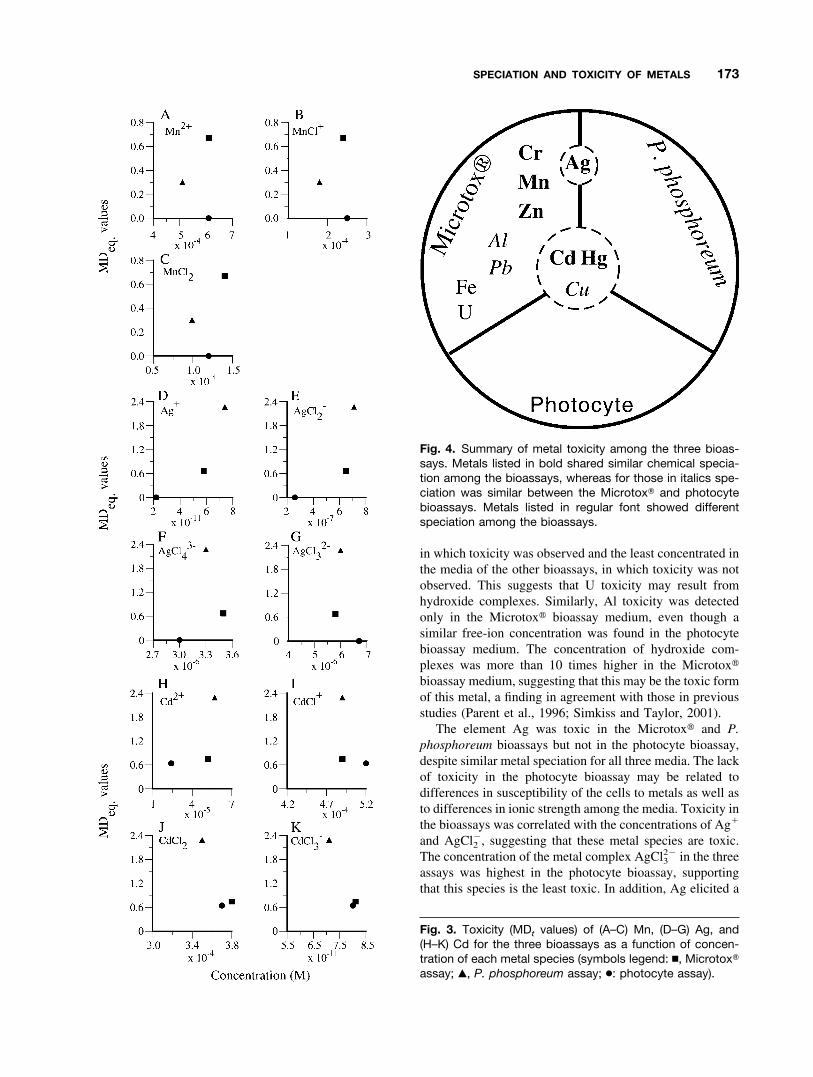
in which toxicity was observed and the least concentrated inthe media of the other bioassays, in which toxicity was notobserved. This suggests that U toxicity may result fromhydroxide complexes. Similarly, Al toxicity was detectedonly in the Microtox� bioassay medium, even though asimilar free-ion concentration was found in the photocytebioassay medium. The concentration of hydroxide com-plexes was more than 10 times higher in the Microtox�bioassay medium, suggesting that this may be the toxic formof this metal, a finding in agreement with those in previousstudies (Parent et al., 1996; Simkiss and Taylor, 2001).
The element Ag was toxic in the Microtox� and P.phosphoreum bioassays but not in the photocyte bioassay,despite similar metal speciation for all three media. The lackof toxicity in the photocyte bioassay may be related todifferences in susceptibility of the cells to metals as well asto differences in ionic strength among the media. Toxicity inthe bioassays was correlated with the concentrations of Ag�
and AgCl2�, suggesting that these metal species are toxic.
The concentration of the metal complex AgCl32� in the three
assays was highest in the photocyte bioassay, supportingthat this species is the least toxic. In addition, Ag elicited a
Fig. 3. Toxicity (MDt values) of (A–C) Mn, (D–G) Ag, and(H–K) Cd for the three bioassays as a function of concen-tration of each metal species (symbols legend: �, Microtox�assay; Œ, P. phosphoreum assay; ●: photocyte assay).
Fig. 4. Summary of metal toxicity among the three bioas-says. Metals listed in bold shared similar chemical specia-tion among the bioassays, whereas for those in italics spe-ciation was similar between the Microtox� and photocytebioassays. Metals listed in regular font showed differentspeciation among the bioassays.
SPECIATION AND TOXICITY OF METALS 173

toxic response only in bioassays using bacteria, suggestingthat with this metal there are different mechanisms of tox-icity for prokaryotic and metazoan cells.
The elements Cr, Mn, and Zn showed similar chemicalspeciation for the three media, yet toxicity was observedonly with the Microtox� bioassay. This was not an artifac-tual result, because in this study the greatest free-ion con-centration found to induce toxicity in the Microtox� bioas-say was on the same order of magnitude as the 15-min EC50
of the bioassay (McCloskey et al., 1996). This result thusemphasizes that the biological nature of the cell and/orphysicochemical parameters of the medium should also beconsidered to properly assess the toxic potential of metalspecies.
The element Cu was toxic at 10�4 M with both bacterial-based bioassays but not with the photocyte bioassay. TheMicrotox� and photocyte bioassays had the same metalspeciation for Cu. Thus, the difference in toxicity responsemay result from differences in biological processes leadingto toxicity or from the difference between the two media inionic strength, assuming that biological processes can beaffected by the load of salt in the medium (Hall and Ander-son, 1995; Hall et al., 1995a; 1995b; Cook et al., 2000). TheP. phosphoreum bioassay also exhibited toxicity despite adifferent chemical speciation than the Microtox� bioassayand a low concentration of free Cu. Yet in this case, ther-modynamic calculations predicted Cu precipitation under ahydroxide form. As precipitate was not observed over thetime frame of the experiment, it is difficult to establishwhether toxicity observed in this bioassay was from freeions and/or cupric hydroxides.
Thermodynamic calculations for equilibrium conditionsat 25°C predicted Fe precipitation as a ferric hydroxide inall three bioassays. However, no precipitation was observedduring the experiment, and therefore, in the absence ofprecipitate, Fe hydroxide complexes dominated the specia-tion in all three assays. Only the Microtox bioassay showedevidence of toxicity, suggesting that Fe hydroxides may betoxic species.
Toxicity Assessment Using the Microtox� Bioassay HasPoor Metal Specificity. The Microtox� and P. phosphoreumbioassays use two strains of the same bacterial species,Photobacterium phosphoreum. Strain 11177, used in theMicrotox� bioassay, is highly sensitive to contaminants(http://www.azurenv.com) including metals (Codina et al.,1993; Ghosh et al., 1996). Indeed, the toxicity response ofthe P. phosphoreum Microtox� bioassay to Cr, Mn, and Zncontrasted with the lack of effect of the same metals withsimilar speciation on the wild strain of P. phosphoreum. Inthe present study, the Microtox� bioassay exhibited poorspecificity to different metals, consistent with previous find-ings (Ross, 1993). According to the Microtox� bioassayresults, all metals were toxic at high concentrations (10�4
and 10�3 M), whereas only Ag, Al, Hg, U, and Zn weretoxic at lower concentrations. In contrast, for the P. phos-
phoreum bioassay, the wild strain showed decreased biolu-minescence only to Ag, Cd, Cu, and Hg. Fe plays animportant role in the regulation of growth and biolumines-cence in P. phosphoreum (Haygood and Nealson, 1984,1985a, 1985b). This element maintains a delicate balancebetween promoting growth, which has a stimulatory effecton light production, and repressing bioluminescence. Ac-cordingly, the P. phosphoreum bioassay showed that biolu-minescence and cell concentration decreased for lower Feconcentrations (10�8–10�6 M) and increased for higherconcentrations (10�5–10�4 M). This pattern was not ob-served for the Microtox� bioassay strain. In fact, the effectof Fe was the opposite of that on the wild-type strain, withbioluminescence decreasing for higher concentrations of themetal.
Toxicity Depends on the Cell Concentration of the Bac-teria. The P. phosphoreum bioassay showed that metalsaffected bacterial bioluminescence as well as growth. ForAg, the decrease in bioluminescence was simultaneous withthe decrease in cell concentration. However, in general,bioluminescence was a more sensitive indicator than growthand decreased prior to the decrease in cell concentration, asobserved for Cd, Cu, Hg, and Zn. The relation between cellconcentration and bioluminescence in P. phosphoreum issupported by an elaborate physiological coupling (Hastingsand Nealson, 1977; Haygood and Nealson, 1985b) thatsuggests consideration of both parameters simultaneously.Bacteria could indeed reach optimal bioluminescence andgrowth in responses to changes in the medium if allowedsufficient time.
This study showed that on exposure to Al, biolumines-cence decreased throughout the 2-h duration of the Micro-tox� bioassay, corresponding to the cell generation time(Bulich and Bailey, 1995; Bulich and Huynh, 1995). For theP. phosphoreum bioassay, bioluminescence decreased andcell concentration increased for the first 2 h of metal expo-sure; however, the trend was reversed after 3 h of exposure,with an increase in bioluminescence and decrease in cellconcentration, suggesting reduced Al toxicity for chronicexposure. Such variation of effects with time of exposure(viz., cell division rate) was also observed for Pb, U, and Zn.The use of long-term exposure to contaminants has beensuggested as a way to better assess toxicity when usingbacteria (Dillon, 1993; Thomulka et al., 1993; Newman andMcCloskey, 1996; Thomulka et al., 1996; Backhaus et al.,1997; Froehner et al., 2000). Such a long-term exposureMicrotox�-based bioassay has been developed, the Micro-tox� Chronic Toxicity test (Bulich and Bailey, 1995; Bulichand Huynh, 1995; Johnson, 1998; see also http://www.azurenv.com); the disadvantage of this bioassay is that itinvolves more time, expense, and specific skills for micro-bial work than the original Microtox� Acute Toxicity test.
The Microtox� Bioassay Can Overestimate Toxicity ofMarine Samples. Free-metal-ion concentration can be com-pared for various media, including a freshwater medium
174 DEHEYN, BENCHEIKH-LATMANI, AND LATZ

(McCloskey et al., 1996), the Microtox� bioassay medium(Newman and McCloskey, 1996), and an artificial seawatermedium (the latter two used in this study). The proportion offree ions in the medium (ratio of free-ion concentration tototal unspeciated concentration) followed the sequence:freshwater � Microtox� � artificial seawater. For mostmetals free-metal-ion concentration was about 1–2 timesgreater in freshwater than in the Microtox� bioassay me-dium; but it was, 10 times greater for Cd and 108 timesgreater for Hg. The free-metal-ion concentration of mostmetals was about 4 times greater in the Microtox� bioassaymedium than in artificial seawater, except it was 40 timesgreater for Fe, 100 times greater for U, and 200 timesgreater for Al. Free-metal-ion concentration values calcu-lated in this study for the Microtox� bioassay were similarto (only about 1.2 times higher) previous values for thesame metals and bioassay (Newman and McCloskey, 1996),indicating that the speciation calculations were accurate.Chemical speciation of metals in solution is affected byionic strength and other physicochemical parameters likesalinity, pH, and calcium concentration of the medium(Brezonik et al., 1991; Ho et al., 1999; Cook et al., 2000).Therefore, assuming that toxicity is related to metal specia-tion, a toxicity assessment of a freshwater or marine samplemight be biased when using the Microtox� bioassay, whichhas a NaCl-based medium (Villaescusa et al., 1996). Thisbioassay is known to overestimate the toxicity of metalsmore than do seawater-based nonmicrobial bioassays(Becerro et al., 1995; Ghosh et al., 1996). This could bebecause of the difference in speciation (i.e., fewer com-plexes in the Microtox� bioassay medium), but it also couldbe a result of the inherent sensitivity of Microtox� cells tometals. In addition, the Microtox� bioassay underestimatesthe toxicity of metals in freshwater relative to freshwater-based nonmicrobial bioassays (Ankley et al., 1990; Georgeet al., 1995; Pardos et al., 1999; Radix et al., 2000). Thisalso could be because of the difference in speciation (i.e.,fewer complexes in freshwater).
Metal toxicity depends on multiple factors that cannot beintegrated into a single bioassay, so it is generally acceptedthat a battery of assays should be used to better assess metaleffects and cover the array of toxicity factors (Codina et al.,1993; Cronin and Dearden, 1993; Ross, 1993; Thomulka etal., 1996). Because of speciation issues as well as theinherent sensitivity of the Microtox� bioassay strain, itappears that it is not appropriate to use the Microtox�bioassay for assessing natural conditions of contaminationand toxicity for metazoans (Dutka and Kwan, 1981; Radixet al., 2000).
The Photocyte Bioassay, Which Belongs to the CatalyticGroup, Allows Assessment of the Physiological Effect ofMetals Under Realistic Marine Conditions. The photocytebioassay uses isolated light-producing cells from an osmo-conforming invertebrate. Seawater is therefore the best me-dium in which photocytes can be maintained (Deheyn et al.,
2000a). The artificial seawater medium used in this studyapproaches the salt composition and physicochemical prop-erties of natural seawater, which has an average ionicstrength of 0.611 (0.511–0.650 range; 0.61 in the bioassay;Turner et al., 1981; Atkinson and Bingman, 1997).
Of the 11 metals tested, the photocyte bioassay showedtoxicity for Cd, Cu, and Hg. These metals are also known toaffect sea urchin fertilization and embryonic development atcomparable concentrations (Kennish, 1997). The elementsCr, Zn, Al, and Fe inhibit sea urchin embryonic develop-ment (Pagano et al., 1996; Kennish, 1997) at concentrationsthat had no effect on photocytes. As the echinoderm em-bryonic development bioassay belongs to the noncatalyticgroup of toxicity assays, the photocyte–embryonic devel-opment toxicity discrepancy does not necessarily indicatethe photocyte bioassay is the least sensitive; rather, it im-plies a difference in sensitivity for those metals between thepre- and post-metamorphic stages of development in echi-noderms. Unfortunately, there are no published metal tox-icity data for postmetamorphic echinoderms to allow appro-priate comparison with the photocyte bioassay.
Metals are known to affect bioluminescence capacity ineukaryotic organisms (Okamoto et al., 1999; Deheyn et al.,2000b; Sudhaharan and Reddy, 2000), yet bioluminescencehas been used as a proxy for metal toxicity only fordinoflagellates (Lapota et al., 1993; Heimann et al., 2002)and brittlestars (present study). The photocyte bioassay wasmore than 30 times less sensitive to Cd and Cu than thebioluminescence bioassay using the dinoflagellate Pyrocys-tis lunula, yet the two bioassays showed similar sensitivityto Pb (Heimann et al., 2002). In contrast, the photocytebioassay showed sensitivity to Cu and Zn similar to that ofthe bioluminescence bioassay when using the dinoflagellateLingulodinium polyedrum (formerly Gonyaulax polyedra;Lapota et al., 1993). Therefore, the photocyte bioassay hasa sensitivity range comparable to that of other biolumines-cence-based bioassays using eukaryotic cells.
CONCLUSIONS
The metal speciation in the original environment of thesample must be preserved in the bioassay to avoid over- orunderestimation of toxicity. The use of specific strains ofmicroorganisms is useful to detect low levels of a givenelement potentially bioavailable in the environment, buttoxicity established by a strain may not extrapolate to tox-icity for other biological systems.
We thank N. Schulte–Pelkum and B. Marchione for valuablehelp in performing the bioassays and L. Blankenship for statisticaladvice. The wild strain of Photobacterium phosphoreum waskindly provided by M. Haygood. We thank M. Haygood, B. Tebo,and members of their research group for technical assistance.
SPECIATION AND TOXICITY OF METALS 175

REFERENCES
Ankley GT, Peterson GS, Amato JR, Jenson JJ. 1990. Evaluationof sucrose as an alternative to sodium chloride in the Microtoxassay—comparison to fish and cladoceran tests with freshwatereffluents. Environ Toxicol Chem 9:1305–1310.
Atay NZ, Robinson BH. 1999. Kinetic studies of metal ion com-plexation in glycerol-in-oil microemulsions. Langmuir15:5056–5064.
Atay NZ, Varnali T. 2000. A computational study on metal ion/PADA complexation in water and in glycerol. Theochem-J MolStruct 507:137–143.
Atkinson MJ, Bingman C. 1997. Elemental composition of com-mercial seasalts. J Aquaric Aquat Sci 8:39–43.
AZUR Environmental Limited. 1992. User manuals. Workingham,UK: AZUR Environmental.
Backhaus T, Froehner K, Altenburger R, Grimme LH. 1997.Toxicity testing with Vibrio fischeri: A comparison between thelong term (24 h) and the short term (30 min) bioassay. Chemo-sphere 35:2925–2938.
Becerro MA, Uriz MJ, Turon X. 1995. Measuring toxicity inmarine environments: critical appraisal of three commonly usedmethods. Experientia 51:414–418.
Bienvenue E, Boudou A, Desmazes JP, Gavach C, GeorgescauldD, Sandeaux J, Seta P. 1984. Transport of mercury compoundsacross bimolecular lipid membranes: effect of lipid composition,pH and chloride concentration. Chem-Biochem Interact 48:91–101.
Brezonik Pl, King SO, Mach CE. 1991. The influence of waterchemistry on trace metal bioavailibility and toxicity to aquaticorganisms. In: Newman MC, McIntosh AW, editors. Metalecotoxicology: concepts & applications. Chelsea, MI: LewisPublishers. p 1–31.
Bulich AA, Bailey G. 1995. Environmental toxicity assessmentusing luminescent bacteria. In: Richardson M, editor. Environ-mental toxicology assessment. London: Taylor and Francis. p29–40.
Bulich AA, Huynh H. 1995. Measuring chronic toxicity usingluminescent bacteria. Can Tech Rep Fish Aquat Sci 2050:23.
Bulich AA, Isenberg DL. 1980. Use of the luminescent bacterialsystem for the rapid assessment of aquatic toxicity. Adv Instrum35:35–39.
Byrne RH, Kump LR, Cantrell KJ. 1988. The influence of tem-perature and pH on trace metal speciation in seawater. MarChem 25:163–181.
Campbell PGC, Tessier A. 1996. Ecotoxicology of metals in theaquatic environment: geochemical aspects. In: Newman MC,Jagoe CH, editors. Ecotoxicology. A hierarchical treatment.Boca Raton, FL: CRC Press. p 11–58.
Clark RB. 1997. Marine pollution. Oxford, UK: Oxford UniversityPress. 161 p.
Codina JC, Perez-Garcia A, Romero P, De Vicente A. 1993. Acomparison of microbial bioassays for the detection of metaltoxicity. Arch Environ Contam toxicol 25:250–254.
Cook SV, Chu A, Goodman RH. 2000. Influence of salinity on
Vibrio fischeri and lux-modified Pseudomonas fluorescens tox-icity bioassays. Environ Toxicol Chem 19:2474–2477.
Costan G, Bermingham N, Blaise C, Ferard JF. 1993. PotentialEcotoxic Effects Probe (Peep)—a novel index to assess andcompare the toxic potential of industrial effluents. EnvironToxic Water Qual 8:115–140.
Cronin MTD, Dearden JC. 1993. The comparative toxicology ofthe Microtox test. In: Richardson ML, editor. Ecotoxicologymonitoring. New York: VCH Verlagsgesellschaft. p 213–223.
Crosby DG. 1998. Environmental toxicology and chemistry.Bricks JW, editor. New York: Oxford University Press. 336 p.
Danilov VS, Ismailov AD, Baranova NA. 1985. The inhibition ofbacterial bioluminescence by xenobiotics. Xenobiotica 15:271–276.
Deheyn D, Mallefet J, Jangoux M. 2000a. Cytological changesduring bioluminescence production in dissociated photocytesfrom the ophiuroid Amphipholis squamata (Echinodermata).Cell Tiss Res 299:115–128.
Deheyn D, Jangoux M, Warnau M. 2000b. Alteration of biolumi-nescence in Amphipholis squamata (Ophiuroidea: Echinoder-mata) by heavy metals contamination: a field study. Sci TotEnviron 247:41–49.
Dillon TM. 1993. Developing chronic sublethal sediment bioas-says: a challenge to the scientific community. In: RichardsonML, editor. Ecotoxicology monitoring. New York: VCH Ver-lagsgesellschaft. p 623–639.
Dizer H, Wittekindt E, Fischer B, Hansen PD. 2002. The cytotoxicand genotoxic potential of surface water and wastewater efflu-ents as determined by bioluminescence, umu-assays and se-lected biomarkers. Chemosphere 46:225–233.
Dutka BJ, Kwan KK. 1981. Comparison of three microbial toxicityscreening tests with the Microtox test. Bull Environ ContamToxicol 27:753–757.
Froehner K, Backhaus T, Grimme LH. 2000. Bioassays withVibrio fischeri for the assessment of delayed toxicity. Chemo-sphere 40:821–828.
Froehner K, Meyer W, Grimme LH. 2002. Time-dependent tox-icity in the long-term inhibition assay with Vibrio fischeri.Chemosphere 46:987–997.
Gellert G, Stommel A, Trujillano AB. 1999. Development of anoptimal bacterial medium based on the growth inhibition assaywith Vibrio fischeri. Chemosphere 39:467–476.
George DB, Berk SG, Adams VD, Ting RS, Roberts RO, ParksLH, Lott RC. 1995. Toxicity of Alum sludge extracts to afreshwater alga, protozoan, fish, and marine bacterium. ArchEnviron Contam Toxicol 29:149–158.
Ghosh SK, Doctor PB, Kulkarni PK. 1996. Toxicity of zinc inthree microbial test systems. Environ Toxicol Water Qual 11:13–19.
Hall LW, Anderson RD. 1995. The influence of salinity on thetoxicity of various classes of chemicals to aquatic biota. CritRev Toxicol 25:281–346.
Hall LW, Ziegenfuss MC, Anderson RD, Lewis BL. 1995a. Theeffect of salinity on the acute toxicity of total and free cadmiumto a Chesapeake Bay copepod and fish. Mar Pollut Bull 30:376–384.
176 DEHEYN, BENCHEIKH-LATMANI, AND LATZ
Hall LW, Ziegenfuss MC, Anderson RD, Tierney DP. 1995b. Theinfluence of salinity on the chronic toxicity of atrazine to anestuarine copepod: Implications for development of an estuarinechronic criterion. Arch Environ Contam Toxicol 28:344–348.
Hastings WJ, Nealson KH. 1977. Bacterial bioluminescence. AnnRev Microbiol 31:549–595.
Haygood MG, Nealson KH. 1984. Effects of iron on bacterialgrowth and luminescence: ecological implications. In: Klug MJ,Reddy CA, editors. Current perspectives in microbial ecology.Washington DC: American Society for Microbiology. p 56–61.
Haygood MG, Nealson KH. 1985a. Mechanisms of iron regulationof luminescence in Vibrio fischeri. J Bacteriol 162:209–216.
Haygood MG, Nealson KH. 1985b. The effect of iron on thegrowth and luminescence of the symbiotic bacterium Vibriofischeri. Symbiosis 1:39–51.
Heimann K, Matuszewski JM, Klerks PL. 2002. Effects of metalsand organic contaminants on the recovery of bioluminescence inthe marine dinoflagellate Pyrocystis lunula (Dinophyceae). JPhycol 38:482–492.
Ho KT, Kuhn A, Pelletier MC, Hendricks TL, Helmstetter A.1999. pH dependent toxicity of five metals to three marineorganisms. Environ Toxicol 14:235–240.
Hollis RP, Killham K, Glover LA. 2000. Design and application ofa biosensor for monitoring toxicity of compounds to eukaryotes.Appl Environ Microbiol 66:1676–1679.
Johnson BT. 1998. Microtox� toxicity test systems—New devel-opments and applications. In: Wells PG, Lee K, Blaise C,editors. Microscale testing in aquatic toxicology: Advances,techniques, and practice. Boca Raton, Florida: CRC Press. p201–218.
Kennish MJ. 1997. Practical handbook of estuarine and marinepollution. Kennish MJ, Lutz PL, editors. Boca Raton: CRCPress. 524 p.
Kudryasheva N, Kratasyuk V, Esimbekova E, Vetrova E, Nemt-seva E, Kudinova I. 1998. Development of bioluminescentbioindicators for analysis of environmental pollution. Field AnalChem Technol 2:277–280.
Kuroshima R, Kimura S, Date K, Yamamoto Y. 1993. Kineticanalysis of cadmium toxicity to red sea bream, Pagrus major.Ecotoxicol Environ Saf 25:300–314.
Lapota D, Moskowitz GJ, Rosenberger DE, Grovhoug JGG. 1993.The use of stimulable bioluminescence from marine dinoflagel-lates as a means of detecting toxicity in the marine environment.In: Gorsuch JW, Dwyer FJ, Ingersoll CG, La Point TW, editors.Environmental toxicology and risk assessment. Philadelphia:American Society for Testing and Materials. p 3–18.
Mallefet J, Vanhoutte P, Baguet F. 1992. Study of Amphipholissquamata luminescence. In: Scalera-Liaci L, Canicatti C, edi-tors. Echinoderm research. Rotterdam: Balkema, A. A. p 125–130.
Martell AE, Smith RM. 1974. Critical stability constants. NewYork: Plenum Press.
Martell AE, Smith RM, Motekaitis RJ. 1993. NIST criticallyselected stability constants for metal complexes database, NISTStandard Reference Data (electronic). Texas A&M University:College Station, TX.
McCloskey JT, Newman MC, Clark SB. 1996. Predicting the
relative toxicity of metal ions using ion characteristics: Micro-tox bioluminescence assay. Environ Toxicol Chem 15:1730–1737.
Millero FJ, Hawke DJ. 1992. Ionic interactions of divalent metalsin natural waters. Mar Chem 40:19–48.
Millero FJ, Schreiber DR. 1982. Use of the ion pairing model toestimate activity coefficients of the ionic components of naturalwaters. Am J Sci 282:1508–1540.
Morel FMM, Hering JG. 1993. Principles and applications ofaquatic chemistry. New York: John Wiley & Sons. 588 p.
Morin JG. 1983. Coastal bioluminescence: patterns and functions.Bull Mar Sci 33:787–817.
Motulsky H. 1995. Intuitive biostatistics. New York: Oxford Uni-versity Press. 386 p.
Nealson KH. 1978. Isolation, identification, and purification ofluminous bacteria. In: DeLuca MA, editor. Methods in enzy-mology. San Francisco: Academic Press. p 153–166.
Newman MC, McCloskey JT. 1996. Predicting relative toxicityand interactions of divalent metal ions: Microtox biolumines-cence assay. Environ Toxicol Chem 15:275–281.
Okamoto OK, Shao LM, Hastings JW, Colepicolo P. 1999. Acuteand chronic effects of toxic metals on viability, encystment andbioluminescence in the dinoflagellate Gonyaulax polyedra.Comp Biochem Physiol C 123:75–83.
Pagano G, His E, Beiras R, DeBiase A, Korkina LG, Iaccarino M,Oral R, Quiniou F, Warnau M, Trieff NM. 1996. Cytogenetic,developmental, and biochemical effects of aluminum, iron, andtheir mixture in sea urchins and mussels. Arch Environ ContamToxicol 31:466–474.
Papelis C, Hayes KF, Leckie JO. 1988. HYDRAQL: A programfor the computation of chemical equilibrium composition ofaqueous batch systems including surface-complexation model-ing of ion adsorption at the oxide/solution interface. Stanford,CA: Stanford University. Report No. 306. 130 p.
Pardos M, Benninghoff C, Gueguen C, Thomas R, Dobrowolski J,Dominik J. 1999. Acute toxicity assessment of Polish (waste)water with a microplate-based Hydra attenuata assay: A com-parison with the Microtox� test. Sci Tot Environ:141–148.
Parent L, Twiss MR, Campbell PGC. 1996. Influences of naturaldissolved organic matter on the interaction of aluminum withthe microalga Chlorella: A test of the free-ion model of tracemetal toxicity. Environ Sci Technol 30:1713–1720.
Porter KG, Feig YS. 1980. The use of 4�6 di amidino-2-phenylindole for identifying and counting aquatic micro flora. LimnolOceanogr 25:943–948.
Radix P, Leonard M, Papantoniou C, Roman G, Saouter E, Gal-lotti-Schmitt S, Thiebaud H, Vasseur P. 2000. Comparison offour chronic toxicity tests using algae, bacteria, and inverte-brates assessed with sixteen chemicals. Ecotoxicol Environ Saf47:186–194.
Ramamoorthy S, Kushner DJ. 1975. Binding of mercuric and otherheavy metal ions by microbial growth media. Microb Ecol2:162–176.
Richardson ML. 1993. Epilogue. In: Richardson ML, editor. Eco-toxicology monitoring. New York: VCH Verlagsgesellschaft. p335–343.
SPECIATION AND TOXICITY OF METALS 177
Ross P. 1993. The use of bacterial luminescence systems in aquatictoxicity testing. In: Richardson ML, editor. Ecotoxicology mon-itoring. New York: VCH Verlagsgesellschaft. p 185–195.
Sarin C, Hall JM, Cotter-Howells J, Killham K, Cresser MS. 2000.Influence of complexation with chloride on the responses of alux-marked bacteria bioassay to cadmium, copper, lead, andmercury. Environ Toxicol Chem 19:259–264.
Simkiss K, Taylor MG. 2001. Trace element speciation at cellmembranes: aqueous, solid and lipid phase effects. J EnvironMonit 3:15–21.
Slob W. 2002. Dose-response modeling of continuous endpoints.Toxicol Sci 66:298–312.
Smith DC, Steward GF, Long RA, Azam F. 1995. Bacterialmediation of carbon fluxes during a diatom bloom in a meso-cosm. Deep-Sea Res II 42:75–97.
Stumm W, Morgan JJ. 1995. Aquatic chemistry: chemical equi-libria and rates in natural waters. New York: John Wiley &Sons. 1022 p.
Sudhaharan T, Reddy AR. 2000. Metal ion mediated inhibition offirefly bioluminescence: a possibility via a quaternary complex.Ind J Biochem Biophys 37:256–267.
Thomulka KW, Abbas CG, Young DA, Lange JH. 1996. Evalu-ating median effective concentrations of chemicals with biolu-minescent bacteria. Bull Environ Contam Toxicol 56:446–452.
Thomulka KW, McGee DJ, Lange JH. 1993. Detection of biohaz-ardous materials in water by measuring bioluminescence reduc-tion with the marine organism Vibrio harveyi. J Environ SciHealth A 28:2153–2166.
Turner DR, Whitfield M, Dickson AG. 1981. The equilibriumspeciation of dissolved components in freshwater and seawaterat 25°C and 1 atm pressure. 45:855–881.
Van Der Lelie D, Corbisier P, Baeyens W, Wuertz S, Diels L,Mergeay M. 1994. The use of biosensors for environmentalmonitoring. Res Microbiol 145:67–74.
Villaescusa I, Martinez M, Pilar M, Murat JC, Hosta C. 1996.Toxicity of cadmium species on luminescent bacteria. FreseniusJ Anal Chem 354:566–570.
Wood KV, Gruber MG. 1996. Transduction in microbial biosen-sors using multiplexed bioluminescence. Biosens Bioelectron11:207–214.
Zar JH. 1996. Biostatistical analysis. Upper Saddle River, NJ:Prentice-Hall. 662 p.
178 DEHEYN, BENCHEIKH-LATMANI, AND LATZ