chemical contaminant and … shue research and technology directorate chemical contaminant and...
TRANSCRIPT

CHEMICAL CONTAMINANT AND DECONTAMINANT TEST METHODOLOGY SOURCE DOCUMENT
SECOND EDITION
ECBC-TR-980
Teri Lalain Brent Mantooth
Matthew Shue Shawn Pusey
RESEARCH AND TECHNOLOGY DIRECTORATE
Diane Wylie
SCIENCE APPLICATIONS
INTERNATIONAL CORPORATION Gunpowder, MD 21010-0068
July 2012
Approved for public release; distribution is unlimited.
Disclaimer
The findings in this report are not to be construed as an official Department of the Army position unless so designated by other authorizing documents.
Teri Lalain Brent Mantooth
Matthew Shue Shawn Pusey
RESEARCH AND TECHNOLOGY DIRECTORATE
Diane Wylie
SCIENCE APPLICATIONS INTERNATIONAL CORPORATION
Gunpowder, MD 21010-0068
REPORT DOCUMENTATION PAGE Form Approved
OMB No. 0704-0188 Public reporting burden for this collection of information is estimated to average 1 h per response, including the time for reviewing instructions, searching existing data sources, gathering and maintaining the data needed, and completing and reviewing this collection of information. Send comments regarding this burden estimate or any other aspect of this collection of information, including suggestions for reducing this burden to Department of Defense, Washington Headquarters Services, Directorate for Information Operations and Reports (0704-0188), 1215 Jefferson Davis Highway, Suite 1204, Arlington, VA 22202-4302. Respondents should be aware that notwithstanding any other provision of law, no person shall be subject to any penalty for failing to comply with a collection of information if it does not display a currently valid OMB control number. PLEASE DO NOT RETURN YOUR FORM TO THE ABOVE ADDRESS.
1. REPORT DATE (DD-MM-YYYY)
XX-07-2012 2. REPORT TYPE
Final 3. DATES COVERED (From - To)
Oct 2008 - Aug 2011
4. TITLE AND SUBTITLE
Chemical Contaminant and Decontaminant Test Methodology Source
Document
Second Edition
5a. CONTRACT NUMBER
5b. GRANT NUMBER
5c. PROGRAM ELEMENT NUMBER
6. AUTHOR(S)
Lalain, Teri; Mantooth, Brent; Shue, Matthew; Pusey, Shawn (ECBC); and
Wylie, Diane (SAIC)
5d. PROJECT NUMBER
CA08DEC420 5e. TASK NUMBER
5f. WORK UNIT NUMBER
7. PERFORMING ORGANIZATION NAME(S) AND ADDRESS(ES)
DIR, ECBC, ATTN: RDCB-DRP-D, APG, MD 21010-5424
SAIC, P.O. Box 68, Gunpowder, MD 21010-0068
8. PERFORMING ORGANIZATION REPORT NUMBER
ECBC-TR-980
9. SPONSORING / MONITORING AGENCY NAME(S) AND ADDRESS(ES)
Defense Threat Reduction Agency, 8725 John J. Kingman Road, MSC 6201,
Fort Belvoir, VA 22060-6201
10. SPONSOR/MONITOR’S ACRONYM(S)
DTRA 11. SPONSOR/MONITOR’S REPORT NUMBER(S)
12. DISTRIBUTION / AVAILABILITY STATEMENT
Approved for public release; distribution is unlimited.
13. SUPPLEMENTARY NOTES 14. ABSTRACT:
The development of the 2007 Source Document and the updated Chemical Contaminant and Decontaminant Test
Methodology Source Document, Second Edition, provides the chemical biological defense community with robust test
methodologies for the determination of the amount of chemical contaminant after a treatment process. The most common
post-treatment evaluations available in the Source Document methods are the total remaining contaminant, chemical agent
detector paper response, contact transfer, and vapor emission tests. This report describes the publication of the Chemical
Contaminant and Decontaminant Test Methodology Source Document, Second Edition.
15. SUBJECT TERMS
Contact test Decontaminant Hazard mitigation Residual contaminant
Vapor test Panel testing Decontaminant performance Test methodology
Vapor emission
16. SECURITY CLASSIFICATION OF:
17. LIMITATION OF ABSTRACT
18. NUMBER OF PAGES
19a. NAME OF RESPONSIBLE PERSON
Renu B. Rastogi a. REPORT b. ABSTRACT c. THIS PAGE 19b. TELEPHONE NUMBER (include area code)
U U U SAR 262 (410) 436-7545 Standard Form 298 (Rev. 8-98)
Prescribed by ANSI Std. Z39.18

ii
Blank
iii
PREFACE
The work described in this report was authorized under Defense Threat Reduction
Agency Joint Science and Technology Office (DTRA JSTO) project CA08DEC420. The work was
started in October 2008 and completed in August 2011.
This report was published through the Technical Releases Office; however, it was edited
and prepared by the Decontamination Sciences Branch, Research and Technology Directorate, U.S. Army
Edgewood Chemical Biological Center (ECBC).
The use of either trade or manufacturers’ names in this report does not constitute an
official endorsement of any commercial products. This report may not be cited for purposes of
advertisement.
This report has been approved for public release.
Acknowledgments
A program cannot be successfully completed without the contributions of a good team of
people. The authors thank the following individuals for their hard work and assistance with the execution
of this technical program.
Dr. John Weimaster, Dr. Charles Bass, and Dr. Glenn Lawson (DTRA, Fort Belvoir, VA) and
Mark Morgan from (Computer Services Corporation, Falls Church, VA) for their interest in
improving the hazard mitigation methodology and their support for the development of the
updated methodology.
Mark Mueller (Defense Intelligence Agency, Charlottesville, VA) for support for the
development of the updated methodology.
Mike Diederen and Dr. Dan Rowe from (Joint Research and Development, Stafford, VA) at the
Joint Program Executive Office for Chemical and Biological Defense. Joint Program Manager
for Protection office for constructive comments and continued support for the development of the
updated methodology.
Pamela Humphreys (ECBC) for providing quality system considerations and assistance with the
development of the test criteria.
The hazard mitigation community, especially the participants at the user workshop, for
constructive feedback for the enhancement of the methodology for this edition.
The ECBC Decontamination Sciences Branch for attention to detail in the development and
demonstration of the methodology.

iv
Blank
v
CONTENTS
1. PURPOSE OF THE SOURCE DOCUMENT ................................................................... 1
2. DEVELOPMENT AND RELEASE OF THE 2007 SD .................................................... 1
3. DEVELOPMENT OF THE SD SECOND EDITION ....................................................... 2
4. CHEMICAL CONTAMINANT AND DECONTAMINANT TEST
METHODOLOGY SOURCE DOCUMENT SECOND EDITION .................................. 4
LITERATURE CITED ...................................................................................................... 5
APPENDIX: THE CHEMICAL CONTAMINANT AND DECONTAMINANT
TEST METHODOLOGY SOURCE DOCUMENT SECOND EDITION .................. A-1

vi
Blank
1
CHEMICAL CONTAMINANT AND DECONTAMINANT
TEST METHODOLOGY SOURCE DOCUMENT,
SECOND EDITION
1. PURPOSE OF THE SOURCE DOCUMENT
The Chemical Decontaminant Performance Evaluation Source Document (SD) is a
collection of updated procedures and the final product for DTRA projects BA06DEC414 and
CA08DED420. The Source Document received its name based on the intended use of the document by
the test and evaluation (T&E) community to either formally update Test Operating Procedure (TOP) 8-2-
0611 or generate a new TOP specific to the evaluation of decontaminant performance on various materials
of interest.
One of the original program requests by DTRA was to have a collection of procedures
that could be distributed to laboratories, based on the targeted information needed from the testing. These
methods would support testing a wide range of technologies, materials, and contaminants; provide context
regarding data utilization especially for assessing risk; and enable test-to-test and lab-to-lab data
comparisons. When properly utilized, the improved methods would generate higher fidelity data, which
would be presented in an appropriate context. The data generated from these updated methods enhanced
all components of the decontaminant lifecycle, including research and development (R&D), science and
technology (S&T), T&E, and developmental and operational testing (DT/OT) activities, technology
readiness assessments (TRA) to determine technology readiness level (TRL), technology comparisons,
risk assessments and milestone decisions.
2. DEVELOPMENT AND RELEASE OF THE 2007 SD
To fulfill the need for robust hazard mitigation test methodology, the original SD, titled
2007 Chemical Decontaminant Source Document was developed by the U.S. Army Edgewood Chemical
Biological Center (ECBC) Decontamination Sciences Branch. The 2007 SD contained contact and vapor
test methodology that was updated from the TOP 8-2-061 document. During development, the core tests
for determining remaining contaminant, contact, and vapor tests underwent major transformations.
The 2007 SD utilized a textbook chapter and section structure focusing on specific topics
such the contact test method, vapor test method, etc. Each chapter was divided into individual test
methods specific to that topic, such the core tests, positive and negative control tests, and sample analysis.
Each test method used a basic research procedure outline that included reagents, materials, test
procedures, calculations, and reporting. The basic foundation was augmented by incorporating the
elements required by ISO-17025 and ASTM methods, such as procedure summary, terminology,
reporting criteria, quality assurance, quality control, and test acceptance criteria. This format facilitated
individual method insertion into a performing laboratory’s quality system. Each test section carried
relevant terminology; references, calculations, and quality assurance/quality control requirements so that
each chapter subsection could be used as an independent method.
In the 2007 SD, the contact test method had minimal updates to the general procedure for
performing the standard two-touch test, but the procedure was expanded to provide greater detail for test
consistency and additional rigor for key variables. The contact test included specific methodology for
determining the remaining agent and performing the contact test, in addition to providing guidance for
chromatographic analysis. The test procedures contained options allowing test modifications and
guidance on how those modifications could impact data calculations. The contact test chapter contained

2
detailed data calculations which were further divided into calculated, approximated, or inferred
calculations. These divisions were based on the availability of required data and indicated the degree of
rigor used to calculate the final test result.
The vapor test underwent a major transformation for the 2007 SD, resulting in a
significant improvement to vapor sampling and data analysis as part of this effort. The vapor test method
was updated to include the key variables associated with vapor sampling and a vapor-emitting item. The
method for calculating whether a vapor risk was present was historically based on the vapor concentration
measured in the vapor chamber. The measured chamber vapor concentration does not correspond to the
vapor concentration to which unprotected personnel would be exposed. The result is often an
overestimation of the risk. Overestimating the resulting risk can impact decontamination development,
resulting in greater logistical requirements and increased potential for material incompatibilities. In
addition, comparing a test chamber vapor concentration to a requirement to determine the occurrence of a
toxicological response was not correct. The documented methods were now aligned with the DoD-
accepted method for the determination of a vapor exposure using a toxic-load calculation. The new
calculations involved the characterization of the emission source. This characterization enabled scale up,
specific scenarios calculations, and trade space analyses, further enhancing operational considerations and
risk assessments. In order to teach this new calculation procedure, the 2007 SD contained example data
to enable the method user to practice and check their calculations.
The 2007 SD test methodology contained sufficient rigor for the control, measurement,
and reporting of the key process variables, which enabled comparison of test data. The methodology
incorporated options to enable testing at different conditions and using different technologies. Detailed
data calculation approaches were also developed. The 2007 SD was successfully updated with the core
panel test methodology. The improved test methodology procedures were released in 2007 and formally
published in ECBC-TR-671.2
3. DEVELOPMENT OF THE SD SECOND EDITION
The development of the updated Chemical Contaminant and Decontaminant Test
Methodology Source Document, Second Edition (SD2ED) continued after the 2007 SD release and
through summer 2011. The primary objective, which was similar to the original document, was to
continue the development and documentation of robust test methodologies for chemical decontamination.
The 2007 SD release retained a broad scope, similar to the original TOP 8-2-061,
providing panel testing, and material compatibility test guidance. Placeholders were left in the structure
of the document for future updates for reaction testing and other lower Technology Readiness Level
(TRL) studies originally in TOP 8-2-061. However, after implementation of the 2007 SD, it became
apparent that the need for this broader scope had been surpassed. Instead, the need to expand the current
range of decontamination technologies and materials, based on the initiation of acquisition programs such
as the Decontamination Family of Systems (DFoS), became a more pressing goal. For example, DTRA
and its stakeholders were interested in adding testing using complex panels to the Source Document panel
testing procedure. This complex panel procedure has been incorporated into the SD2ED. The project
objective was updated to focus on the test methodology specifically associated with panel testing to
evaluate contaminant and decontaminant of materials.
As the SD2ED was being created, several technology transition agreements (TTA) were
developed for emerging decontamination technologies. Research projects were initiated to collect data
demonstrating technology performance compared with the TTA exit criteria. Some of these documents
required demonstration of a negative chemical agent detector paper response after decontamination. As a
result, a chemical agent detector paper response test was developed and incorporated into the SD2ED.
3
Feedback from the user workshop and from those who used the 2007 SD methodology
and data was collected and incorporated into the updated SD2ED methodology. Two examples of
updates based on user feedback included the addition of a pre-rinse step and procedures for reporting test
results in units of mass and mass-per-unit area.
A new addition to the vapor methodology analysis technique called the vapor composite
system calculation (VCSC) was incorporated into the SD2ED. The VCSC is a scaling method that
utilizes laboratory panel data to calculate the vapor emission rate and resulting vapor concentration,
generated from decontaminated full-scale assets. The VCSC method strengthens the capability to
characterize decontaminants and decontaminant performance, and bridges the gap between individual
material testing in the laboratory and full-scale asset testing. Application of this method at the research
and development stages enables the evaluation of performance and cost-benefit analysis before
committing resources toward moving a technology forward. By calculating the potential exposure of
unprotected personnel to an agent vapor-emitting asset in a specified environment, the VCSC enables
targeted exposure and risk assessment. In addition, VCSC enables an exposure assessment that evaluates
whether or not toxicological exposure limits (i.e., requirements) have been exceeded for any specified
scenario. The VCSC method extends the use and value of laboratory data to perform risk assessments
with live agent data, but without the requirement to physically test all physical assets or all scenarios.
The Source Document test methodologies illustrated the importance of specifying a
scenario to determine vapor concentrations and the resulting vapor exposure using toxic load. The focus
of the vapor exposure was to compare to requirements levels, which are typically defined as the mild
effects level in 1 or 16% of the male military population. Toxicity values for severe and lethal effects and
for different population percentages (e.g., general population) are available. Comparison of the scenario-
specific toxic-load values to the range of available toxicity values enables the assessment of “how bad” a
given exposure scenario may be, rather than the binary indication of “meets requirements” or not. The
SD2ED illustrates how the exposure assessment can be used to indicate the severity of a given exposure
ranging from mild effects to severe and lethal effects.
A new addition to the SD2ED is the procedure to calculate a relative performance metric.
Relative performance-metric calculations are used to determine if a hazard mitigation technology
provides an improvement compared to a specified reference (e.g., positive control, reference technology,
or alternate treatment condition). Performance metrics can be calculated without the specification of a
scenario. For example, this calculation can indicate if and by how much a hazard mitigation technology
may produce lower potential contact exposure when compared with another technology. The output of
the relative performance calculation is a log-difference and performance-factor value, and an indication
whether the difference is statistically significant. The log-difference relative performance metric is a
normalized value that enables many types of performance analysis across multiple materials and
contaminants.
The contact test method underwent minimal changes for the SD2ED. The standard
contact test, used in TOP 8-2-061 and the 2007 SD, uses a two-touch configuration to determine the mass
transferred to a contact sampler. An additional configuration, called a contact test variation, has been
added that allows different touch configurations to be performed. A discussion regarding the comparison
of contact test results to health-based toxicity values has been added to clarify how to perform an
exposure and risk assessment.
The SD2ED streamlined the 2007 SD core tests for remaining contaminant, contact, and
vapor into a single method. This enhancement increases readability, reduces repetition, and enables
easier quality system implementation. The core test method procedures used to perform contact and
vapor tests have not been changed, but they have been updated with additional test options. The updated
4
vapor analysis methodology enables a greater level of accuracy for characterizing the emission rate of a
contaminated item. Furthermore, the methodology identifies key variables that influence the vapor
emission response, and are critical to enabling an accurate prediction of vapor health hazard scenarios.
The SD2ED provides additional procedures for using chemical agent detector paper, complex panels
testing, and updated guidance on sample analysis.
4. CHEMICAL CONTAMINANT AND DECONTAMINANT TEST
METHODOLOGY SOURCE DOCUMENT SECOND EDITION
The development of the Chemical Contaminant and Decontaminant Test Methodology
Source Document, Second Edition was performed by the Decontamination Sciences Branch laboratories
at ECBC, Aberdeen Proving Ground, MD. The development involved input from DTRA; stakeholders;
and research and testing communities. The second edition is published in the report appendix.

5
LITERATURE CITED
1. CSTE-DTC-TT-M Test Operations Procedure (TOP) 8-2-061 Chemical and
Biological Decontamination Testing; West Desert Test Center: Dugway Proving Ground, UT, 19
November 2002; UNCLASSIFIED Report (AD-A409 136).
2. Lalain, T.; Mantooth, B.; Lynn, T.; Zander, Z.; Humphreys, P. Development of
the 2007 Chemical Decontaminant Source Document; ECBC-TR-671; U.S. Army Edgewood Chemical
Biological Center: Aberdeen Proving Ground, MD, 2009; UNCLASSIFIED Report (AD-A511 356).

6
Blank
7
APPENDIX
CHEMICAL CONTAMINANT AND
DECONTAMINANT TEST METHODOLOGY SOURCE DOCUMENT
SECOND EDITION

8
Blank
A-1
A. APPENDIX A
Chemical Contaminant and Decontaminant
Test Methodology Source Document
Second Edition

A-2
Blank
A-3
CONTENTS
Introduction ......................................................................................................................... A-11
Overview ........................................................................................................................... A-11 Panel Treatment ................................................................................................................ A-12 Post-Treatment Evaluations .............................................................................................. A-13
Post-Treatment Evaluation for Total Remaining Contaminant ........................................ A-14 Post-Treatment Evaluation for Chemical Agent Detector Paper Response and Residual Contaminant .................................................................................................... A-15 Post-Treatment Evaluation for Contact Transfer and Residual Contaminant .................. A-17 Post-Treatment Evaluation for Vapor Test and Residual Contaminant ........................... A-19 Samples Generated by Post-Treatment Evaluations ...................................................... A-21
Preparation of the Laboratory to Perform These Procedures ............................................. A-23 Test Development ............................................................................................................... A-23
Overview ........................................................................................................................... A-23 Develop a Test Objective ................................................................................................... A-23 Identify the Required Calculations ..................................................................................... A-23 Develop the Test Approach and Select the Test Parameters ............................................. A-24 Standard Options, if Test Sponsor Guidance is Not Available............................................ A-26 Identification of Control Samples ....................................................................................... A-28 Consider the Test Context ................................................................................................. A-31 Thoroughly Document the Findings ................................................................................... A-33
Reagents .............................................................................................................................. A-35 Panel Treatment Reagents ................................................................................................ A-35 Post-Treatment Evaluation for Total Remaining Contaminant, Contact Sampler, and Residual Contaminant Extractions ..................................................................................... A-36 Post-Treatment Evaluation for Chemical Agent Detector Paper Response ........................ A-37 Post-Treatment Evaluation for Contact Transfer ................................................................ A-37 Post-Treatment Evaluation for Vapor Emission ................................................................. A-37
Test Materials ...................................................................................................................... A-39 Laboratory Materials, Tools, and Equipment .................................................................... A-43
General Laboratory Materials ............................................................................................ A-43 Panel Treatment Laboratory Materials, Tools, and Equipment........................................... A-44
Panel Treatment Laboratory Items ................................................................................. A-44 Contaminant Delivery Tools ........................................................................................... A-45 Environmental Chamber ................................................................................................ A-46 Contaminated Area Measurement ................................................................................. A-47 Pre- and Post-Rinse Delivery Tools ............................................................................... A-47 Decontaminant Delivery Tools ....................................................................................... A-48
Post-Treatment Evaluation for Total Remaining Contaminant, Contact Sampler, and Residual Contaminant Extractions ..................................................................................... A-51 Post-Treatment Evaluation for Chemical Agent Detector Paper Response ........................ A-52 Post-Treatment Evaluation for Contact Transfer ................................................................ A-53 Post-Treatment Evaluation for Vapor Emission ................................................................. A-53 Sample Dilution and Analytical Standard Preparation Tools .............................................. A-54 Analytical Chromatography Equipment .............................................................................. A-54 Data Analysis Tools ........................................................................................................... A-56
A-4
Pre-Requisite Tasks for Post-Treatment Evaluation Using Chemical Agent Detector Paper .................................................................................................................... A-57
Overview ........................................................................................................................... A-57 Determination of Decontaminant Compatibility with Chemical Agent Detector Paper ........ A-57 Determination of Chemical Agent Detector Paper Sensitivity to Contaminant Drop Volumes Used in Testing ................................................................................................... A-58
Prerequisite Tasks for Post-Treatment Evaluation for Vapor Emission ......................... A-59 Overview ........................................................................................................................... A-59 Dynamic Vapor Chamber .................................................................................................. A-59 Determination of Analyte Breakthrough ............................................................................. A-60 Develop the Vapor-Sampling Plan ..................................................................................... A-62
Determination of Chamber Free-Air Volume .................................................................. A-62 Vapor-Sampling Plan Development ............................................................................... A-62
Prerequisite Tasks for Confident Analysis of Liquid and Vapor Samples ...................... A-67 Overview ........................................................................................................................... A-67 Introduction ........................................................................................................................ A-67 Calibration Curve-Fitting Guidance .................................................................................... A-69
Coefficient of Determination ........................................................................................... A-70 Analyzing Error in the Calibration Model ........................................................................ A-71
Detection Limits ................................................................................................................. A-76 Quality Control Samples and Sample Queues ................................................................... A-77
Types of Quality Control Samples .................................................................................. A-77 Verifying Instrument Performance .................................................................................. A-78 Concentrations for Quality Control Samples .................................................................. A-78 Preparation of Samples for Analysis .............................................................................. A-79 Organizing a Sample Queue .......................................................................................... A-80 Continuing Calibration Verification (CCV) Blocks ........................................................... A-80 Determining the Sample Order ...................................................................................... A-81
Vapor Solid-Sorbent Tube Guidance ................................................................................. A-83 Analytical Interference Evaluations .................................................................................... A-84 Solvent Recovery Determination ....................................................................................... A-85 Data Reporting .................................................................................................................. A-86
Procedure 1: Treatment ...................................................................................................... A-87 Overview ........................................................................................................................... A-87 Test Preparation ................................................................................................................ A-87 Condition Panels to Desired Environment ......................................................................... A-88 Contaminate Panels .......................................................................................................... A-90 Contaminant-Material Interaction Aging Period .................................................................. A-97 Pre-Decontamination Rinse of Panels ............................................................................. A-100 Decontaminate Panels..................................................................................................... A-103 Post-Decontamination Rinse of Panels ............................................................................ A-108 Completion of Treatment Process ................................................................................... A-112
Procedure 2: Post-Treatment Evaluation for Chemical Agent Detector Paper Response ........................................................................................................................... A-113
Overview ......................................................................................................................... A-113 Performing the Chemical Agent Detector Paper Response Test ...................................... A-113 Performing the Residual Contaminant Measurement (Optional) ...................................... A-114 Analyzing the Residual Contaminant Samples ................................................................ A-115 Calculations ..................................................................................................................... A-116
Procedure to Determine the Mass Delivered ................................................................ A-116
A-5
Calculation Procedure for Residual Contaminant ......................................................... A-117 Procedure 3: Post-Treatment Evaluation for Total Remaining Contaminant ................ A-119
Overview ......................................................................................................................... A-119 Performing the Total Remaining Contaminant Test ......................................................... A-119 Analyzing the Remaining Contaminant Samples ............................................................. A-119 Calculations ..................................................................................................................... A-120
Determine the Mass Delivered ..................................................................................... A-120 Prepare and Report Results for Test Samples ............................................................. A-121 Calculation of Decontaminant Relative Performance ................................................... A-122 Overview for the Percent Efficacy and Reduction in Starting Challenge Calculations... A-122 Percent Efficacy Calculation ........................................................................................ A-123 Reduction in Starting Challenge Calculations............................................................... A-124
Procedure 4: Post-Treatment Evaluation for Contact Transfer ..................................... A-127 Overview ......................................................................................................................... A-127 Performing the Standard Contact Test ............................................................................. A-127 Performing a Contact Test Variation ................................................................................ A-129 Analyzing the Contact Test Samples ............................................................................... A-132 Calculations ..................................................................................................................... A-133
Determine the Mass Delivered ..................................................................................... A-133 Prepare and Report Results for Test Samples ............................................................. A-134
Contact Transfer Calculations Background ...................................................................... A-135 Legacy Contact Calculation ............................................................................................. A-136
Procedure 5: Post-Treatment Calculation of Decontaminant Relative Performance ... A-139 Overview ......................................................................................................................... A-139 Calculation of Decontaminant Relative Performance ....................................................... A-139
Procedure 6: Post-Treatment Evaluation for Vapor Emission ....................................... A-157 Overview ......................................................................................................................... A-157 Performing the Vapor Emission Test ............................................................................... A-157 Analyzing the Vapor Samples .......................................................................................... A-158 Calculation Procedure to Determine the Mass Delivered ................................................. A-158 Calculation Procedure for Vapor Testing ......................................................................... A-159
Calculation of Chamber Vapor Concentration .............................................................. A-159 Calculation of Emission Factor and Selection of a Best-Fit Emission Factor Function .. A-163 Calculation of Emitted Mass ......................................................................................... A-183 Calculation of Scenario Vapor Concentration Resulting from Single Material Emission ...................................................................................................................... A-184 Calculation of Scenario-Specific Vapor Exposures ...................................................... A-188
Procedure for the Vapor Composite Systems Calculation ................................................ A-193 Overview ...................................................................................................................... A-193 Definition of the Composite System ............................................................................. A-194 Calculation of the Contaminated Surface Area for Each Material ................................. A-194 Definition of the Scenario ............................................................................................. A-196 Calculation of the Composite Emission Rate................................................................ A-196 Calculation of the Uncertainty in the Composite Emission Rate ................................... A-197 Calculation of the Scenario Vapor Concentration ......................................................... A-198 Calculation of an Asset’s Emitted Vapor Mass ............................................................. A-198 Scientific Discussion and Reporting Guidance ............................................................. A-199
Calculation Procedure to Determine the Mass Delivered ................................................. A-201 Calculation Procedure for Residual Contaminant............................................................. A-202
A-6
Vapor Calculation Variations for Determining Trade Space, Multiple Asset and Other Risk Scenarios from Vapor Emission Data ...................................................................... A-203
Procedure 7: Data Acceptance......................................................................................... A-205 Overview ......................................................................................................................... A-205 Introduction ...................................................................................................................... A-205 Data Verification .............................................................................................................. A-205
Data Verification to Procedural and Contractual Requirements .................................... A-205 Data Verification to Method Specification ..................................................................... A-206
Data Validation ................................................................................................................ A-211 Data Validation of Chromatography Data ........................................................................ A-212 Data Validation of Other Quantitative Data ...................................................................... A-213 Data Acceptance ............................................................................................................. A-214
Procedure 8: Test Reporting ............................................................................................ A-215 Overview ......................................................................................................................... A-215 Documentation of Test Objectives and Supporting Rationale .......................................... A-215 Information for Reporting Reagents, Materials, Tools, and Equipment ............................ A-215 Reporting Information from the Specific Test Procedures ................................................ A-221 Reporting Information for Data ......................................................................................... A-224 Reporting Information for Data Qualifiers ......................................................................... A-226 Additional Information Recommended for Technical Reports .......................................... A-227
Acronyms .......................................................................................................................... A-228 Glossary ............................................................................................................................ A-231 Revision History ................................................................................................................ A-237 References ........................................................................................................................ A-239
A-7
Figures
Figure 1. Illustration of the panel treatment process. ............................................................. A-13 Figure 2. Illustration of the treatment process followed by the total remaining
contaminant test............................................................................................. A-15 Figure 3. Illustration of the treatment process, followed by the chemical agent detector
paper response test process with the residual contaminant measurement. .... A-17 Figure 4. Illustration of the treatment process, followed by the contact transfer test
process using the standard two-touch sampling pattern with the residual contaminant measurement. ............................................................................ A-19
Figure 5. Illustration of the treatment process, followed by the vapor emission test process with the residual contaminant measurement. .................................... A-20
Figure 6. Illustration of the samples generated by the SD2ED methodology. ........................ A-22 Figure 7. Breakthrough test, Tube 1, and Tube 2 representation. ......................................... A-61 Figure 8. VX calibration curve with linear plot. ....................................................................... A-70 Figure 9. Log-log scale VX calibration model. ....................................................................... A-71 Figure 10. Standard deviation of calibration standards replicates versus concentration. ....... A-74 Figure 11. Calibration weighting factor comparison for seven replicate analyte
calibrations. .................................................................................................... A-76 Figure 12. Example analytical queue with QC samples. ........................................................ A-82 Figure 13. Tukey-Kramer HSD graph for organic CARC. .................................................... A-149 Figure 14. Tukey-Kramer HSD graph for silicone. ............................................................... A-150 Figure 15. Example graph for LD and CI from example test data. ....................................... A-154 Figure 16. Chamber concentrations for VX on PE with a decontamination treatment,
linear scale. .................................................................................................. A-162 Figure 17. Chamber concentrations for VX on PE with a decontamination treatment, log
scale. ........................................................................................................... A-163 Figure 18. Illustration of prediction bounds half-widths. ....................................................... A-173 Figure 19. Numerically calculated emission factors for VX on PE with a decontamination
treatment, linear scale. ................................................................................. A-176 Figure 20. Numerically calculated emission factors for VX on PE with a decontamination
treatment, log scale. ..................................................................................... A-176 Figure 21. Best-fit emission factor functions for VX on PE with a decontamination
treatment, log scale. ..................................................................................... A-181 Figure 22. Chamber concentrations using best-fit models for VX on PE with a
decontamination treatment, log scale. .......................................................... A-182 Figure 23. Example vapor concentration graph for placing the material in different
scenarios. .................................................................................................... A-188 Figure 24. Example toxic-load graph for an item in different scenarios. ............................... A-191
A-8
Tables
Table 1. Example worksheet for determining test parameters for treatment and post-
treatment evaluations. .................................................................................... A-25 Table 2. Standard test process, if no guidance is provided from the test sponsor. ................ A-27 Table 3. Illustration of positive and negative control samples compared to the test panel
treatment process. ......................................................................................... A-29 Table 4. Illustration of process control samples compared to the test panel treatment
process. ......................................................................................................... A-30 Table 5. Test context considerations. .................................................................................... A-31 Table 6. General test reagents and contaminants. ................................................................ A-35 Table 7. General test reagents and decontaminants. ............................................................ A-36 Table 8. Remaining contaminant, contact sampler, and residual contaminant extraction
procedure reagents. ....................................................................................... A-36 Table 9. Vapor emission procedure reagents. ....................................................................... A-37 Table 10. Test materials and items. ...................................................................................... A-39 Table 11. Priority eight test materials for hazard mitigation evaluations released in June
2008. .............................................................................................................. A-40 Table 12. Material listings from TOP 8-2-061 released in 2001. ............................................ A-41 Table 13. General laboratory materials, tools, and equipment used in these procedures. ..... A-43 Table 14. Panel treatment procedure laboratory materials, tools, and equipment. ................ A-45 Table 15. Quantitative contaminant delivery tools. ................................................................ A-46 Table 16. Pre- and post-rinse delivery tools. ......................................................................... A-47 Table 17. Decontaminant delivery tools................................................................................. A-49 Table 18. Remaining contaminant, contact sampler, and residual contaminant extraction
procedure laboratory materials. ...................................................................... A-51 Table 19. Extraction solvent delivery tools. ........................................................................... A-52 Table 20. Chemical agent detector paper procedure laboratory materials, tools, and
equipment. ..................................................................................................... A-52 Table 21. Contact transfer procedure laboratory materials, tools, and equipment. ................ A-53 Table 22. Vapor emission procedure laboratory materials, tools, and equipment. ................. A-54 Table 23. Sample dilution and analytical standard preparation tools. .................................... A-54 Table 24. Analytical instrumentation with demonstrated sensitivity and detection
capabilities for their typical use. ..................................................................... A-55 Table 25. Decontamination test options. ............................................................................... A-57 Table 26. Example data set midpoint time values. ................................................................ A-64 Table 27. Example data set midpoint and total pull time values. ........................................... A-65 Table 28. Example data set sampling time values. ................................................................ A-66 Table 29. Method listing from ECBC-TR-883 for liquid extract samples. ............................... A-69 Table 30. Method listing from ECBC-TR-883 for vapor solid-sorbent tube samples. ............. A-69 Table 31. RPD values for a linear regression with VX standards on LCE. ............................. A-73 Table 32. Regression of an analyte calibration using a quadratic calibration model with
different weighting. ......................................................................................... A-75 Table 33. Environmental condition options for material conditioning. .................................... A-88 Table 34. Contaminant-material interaction observation options. .......................................... A-90 Table 35. Contamination options for standard test panels. .................................................... A-91 Table 36. Contamination options for complex test panels in the complex panel test
fixture. ............................................................................................................ A-95 Table 37. Contaminant-material interaction aging period timing options. ............................... A-98
A-9
Table 38. Environmental condition options for the contaminant-material interaction aging period. ............................................................................................................ A-99
Table 39. Test options for applying pre-rinse to standard test panels. ................................. A-100 Table 40. Test options for applying pre-rinse to complex test panels. ................................. A-102 Table 41. Decontamination test options. ............................................................................. A-104 Table 42. Additional decontamination procedures. .............................................................. A-106 Table 43. Environmental condition options for panel decontamination. ............................... A-107 Table 44. Decontaminant-contaminant-material interaction period timing options. .............. A-108 Table 45. Test options for applying post-rinse to standard test panels. ............................... A-109 Table 46. Test options for applying post-rinse to complex test panels. ................................ A-110 Table 47. Panel drying options after post-rinse. .................................................................. A-111 Table 48. Chemical agent detector paper responses summary. .......................................... A-114 Table 49. Conversion between log difference and PF. ........................................................ A-140 Table 50. Demonstration data for the contact performance calculation. .............................. A-143 Table 51. Summary statistics for contact test performance calculation example data. ........ A-144 Table 52. Conditions to be compared using the relative performance calculation. ............... A-144 Table 53. Pair-wise list of all comparisons to be performed and their output. ...................... A-145 Table 54. Example data calculation demonstrating the MT+RE calculation and log
transformation of the data. ........................................................................... A-147 Table 55. Summary statistics for the log-transformed MT+RE results. ................................ A-148 Table 56. Connecting-letters report for organic CARC. ....................................................... A-149 Table 57. Connecting-letters report for silicone. .................................................................. A-150 Table 58. Calculation of LD for each combination. .............................................................. A-151 Table 59. Calculation of the LD CI for each combination. .................................................... A-152 Table 60. Calculation of the PF for each combination. ........................................................ A-153 Table 61. Conceptual data demonstrating a multimaterial, multicontaminant LD analysis. .. A-155 Table 62. Midpoint time for VX on PE with a decontamination treatment............................. A-160 Table 63. Pull time for VX on PE with a decontamination treatment. ................................... A-160 Table 64. Sampling flow for VX on PE with a decontamination treatment. ........................... A-160 Table 65. Mass on tube for VX on PE with a decontamination treatment. ........................... A-161 Table 66. Chamber vapor concentrations for VX on PE with a decontamination
treatment. .................................................................................................... A-161 Table 67. Microchamber settings for VX on PE with a decontamination treatment. ............. A-165 Table 68. Loading factor results for VX on PE with a decontamination treatment. ............... A-166 Table 69. Example data for nonlinear regression model fits. ............................................... A-170 Table 70. Numerical emission factor (mg m-2 min-1) for VX on PE with a decontamination
treatment. .................................................................................................... A-175 Table 71. Example Data for three-point approximation model fits........................................ A-177 Table 72. Model rankings for VX on PE with a decontamination treatment. ......................... A-180 Table 73. Model coefficients for VX on PE with a decontamination treatment. .................... A-181 Table 74. Mass emitted from samples for the 720.1 min test duration, for VX on PE with
a decontamination treatment. ....................................................................... A-184 Table 75. Scenario parameters of conference room scenario with the average as-tested
relative surface coverage, for VX on PE with a decontamination treatment. .................................................................................................... A-185
Table 76. Toxic-load exponents used by FM 3-11.9 and by USACHPPM. ......................... A-189 Table 77. Toxicity values (Ct) for inhalation/ocular exposures as a function of
contaminant, severity, and population percentage, adapted from Table E-4 of USACHPPM 47-EM-5863-04.27 ............................................................. A-192
A-10
Table 78. Toxicity values (toxic load) for inhalation/ocular exposures, as a function of contaminant, severity, and population percentage. ...................................... A-192
Table 79. Results for the conference room scenario with the average as-tested relative surface coverage, for the agent VX (TLE =2.0) with an exposure duration of 720 min (12.0 h), for VX on PE with a decontamination treatment............ A-193
Table 80. Asset materials of construction and contamination estimates for a HMMWV. ...... A-195 Table 81. Acceptance criteria for test parameters associated with panel treatment. ............ A-207 Table 82. Acceptance criteria for test settings specific to the contact test. .......................... A-209 Table 83. Acceptance criteria for test settings specific to the vapor test. ............................. A-211 Table 84. Data validation parameters to assess data quality in chromatography results. .... A-213 Table 85. Information for reporting test panels or items. ...................................................... A-215 Table 86. Information for reporting reagent, materials, tools, and equipment used for
panel treatment contamination and contaminant-material interaction aging period procedures. ....................................................................................... A-216
Table 87. Information for reporting reagent, materials, tools, and equipment used for panel treatment decontamination procedure. ............................................... A-217
Table 88. Information for reporting reagents, materials, tools, and equipment used for panel treatment pre- and post-decontamination rinsing procedures. ............ A-218
Table 89. Information for reporting materials used for post-treatment evaluation for chemical agent detector paper response procedure. .................................... A-219
Table 90. Information for reporting reagents, materials, tools, and equipment used for post-treatment evaluation of total remaining contaminant, contact transfer and residual contaminant procedures. ......................................................... A-219
Table 91. Information for reporting reagents, materials, tools, and equipment used for post-treatment evaluation of vapor emission. ............................................... A-220
Table 92. Information for reporting the test summary. ......................................................... A-221 Table 93. Information for reporting test events. ................................................................... A-221 Table 94. Information for reporting analytical and calculated results. .................................. A-225 Table 95. Recommended information for reporting data qualifiers....................................... A-226 Table 96. Additional information recommended for test reports. .......................................... A-227 Table 97. SD2ED revision history based on major releases. ............................................... A-237
Chemical Contaminant and Decontaminant Test Methodology Source Document, Second Edition
A-11
Chemical Contaminant and Decontaminant
Test Methodology Source Document —
Second Edition
Introduction
Overview
The Chemical Contaminant and Decontaminant Test Methodology Source Document — Second Edition (SD2ED) is a series of procedures used for hazard mitigation evaluations involving chemical contaminants and decontamination processes, which are applied to materials of interest. These procedures were designed to provide robust data in support of a wide range of hazard mitigation evaluation stages ranging from early research and development (R&D), to technology optimization and maturation, to technology readiness assessment (TRA) performance evaluations for milestone B transition and through developmental testing.
Decontamination, in its simplest form, is the process of reducing contamination from a material of interest. FM 3-11.5 specifies that decontamination can be accomplished by neutralization, physical removal, and weathering.1 The SD2ED methods are customizable to enable evaluation of a wide range of decontamination technologies including reactive liquids; solids and vapors; liquid and solid physical removal technologies; and accelerated weathering processes. These technologies can be evaluated with or without pre- and post-decontamination rinse processes. Chemical warfare agents, chemical warfare agent simulants, and any other chemical contaminant can be used with these methods. Test panels of individual materials, multiple materials, and complex materials can be used with these methods. Hazard mitigation evaluations of full items should be performed using the small-item vapor test and contact test methodologies.2-3
The SD2ED procedures capture the key variables associated with the contaminant-material-decontaminant interactions affecting decontamination performance. The variables called out in these procedures should be controlled, measured, and documented as specified. The SD2ED is a single method comprised of multiple procedures providing information for test development; a listing of the reagents, materials, and equipment required; the pre-requisite tasks prior to testing; the procedure panel treatment; and the four standard post-treatment evaluations.
Chemical Contaminant and Decontaminant Test Methodology Source Document, Second Edition
A-12
Panel Treatment
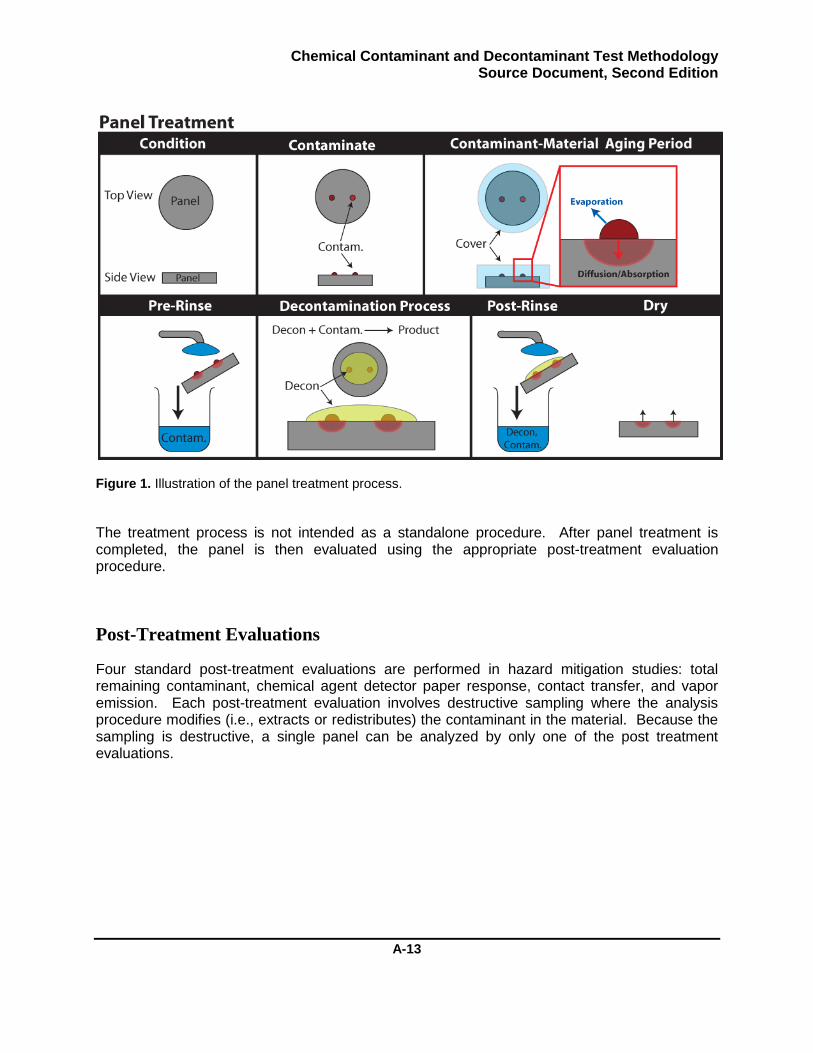
Panel treatment is a series of actions that are performed on a material as part of the test. The SD2ED panel treatment procedure is made up of the following major actions, which are associated with hazard mitigation of a surface and are illustrated in Figure 1.
Condition materials to the desired environment: Panel conditioning is the process of equilibrating the material surface to the desired environmental conditions for the test prior to contamination.
Contaminate materials: Contamination is the process of applying the contaminant to the test material. The process can encompass a wide range of contaminant starting challenges, which are applied using varying deposition patterns and drop volumes. The contamination procedure includes the preparation of dose-confirmation samples (DCS). The DCS are used as a quality check to provide a quantitative measurement of the amount of analyte applied in the test session.
Contaminant-material interaction aging period: The contaminant-material interaction aging period is the amount of time that the contaminant resides on the test material until the next action on the panel action begins. The next action to be performed on the panel can be the pre-decontamination rinse, the application of decontaminant, or a post-treatment evaluation. This period is often referred to as the aging period. Mass transport processes, such as agent absorption and diffusion into and evaporation from the material, occur during the aging period. Temperature and time are two key variables that can affect the mass transport of a contaminant. These key variables are addressed in the SD2ED through the aging of panels at specified environmental conditions for a predetermined time. In addition, visual documentation of this interaction is performed during this period. Visual documentation can be quantified to provide a contaminated area, which is required for the vapor emission test.
Pre-decontamination rinse: Some decontamination efforts use a pre-decontamination rinse to remove dirt and other field contaminants from the item to be decontaminated. A pre-cleaning step can be effective for reducing the material contamination. The SD2ED provides steps that can be used to conduct a range of pre-decontamination rinse processes.
Decontamination: Decontamination is an action applied in an effort to reduce the amount of contaminant retained by a material. This document provides steps used to perform a wide range of decontamination actions including reactive and physical removal types of decontaminants in the form of liquids, solids, vaporous, or environmental weathering.
Post-decontamination rinse: Some decontamination efforts use a post-decontamination rinse to remove reactive or potentially corrosive residues from the surface. A post-decontamination rinse also facilitates the removal of contaminant reaction products. Steps are provided for conducting a range of post-decontamination rinse processes.
Chemical Contaminant and Decontaminant Test Methodology Source Document, Second Edition
A-13
Figure 1. Illustration of the panel treatment process.
The treatment process is not intended as a standalone procedure. After panel treatment is completed, the panel is then evaluated using the appropriate post-treatment evaluation procedure.
Post-Treatment Evaluations
Four standard post-treatment evaluations are performed in hazard mitigation studies: total remaining contaminant, chemical agent detector paper response, contact transfer, and vapor emission. Each post-treatment evaluation involves destructive sampling where the analysis procedure modifies (i.e., extracts or redistributes) the contaminant in the material. Because the sampling is destructive, a single panel can be analyzed by only one of the post treatment evaluations.

Chemical Contaminant and Decontaminant Test Methodology Source Document, Second Edition
A-14
Post-Treatment Evaluation for Total Remaining Contaminant
The remaining contaminant test measures the amount of contaminant present in and on the test material immediately after the treatment process is completed. The remaining contaminant test is recommended for early R&D studies where the focus is on the technology’s capability to significantly remove and/or reduce the contaminant from the material through physical removal and/or chemical reaction.
After panel treatment is complete, the remaining contaminant test is performed by placing the panel in solvent to extract the contaminant from the material. An aliquot of the extraction solvent is then analyzed using the appropriate chromatographic technique. The remaining contaminant test provides the total mass of contaminant in nanograms. This mass can be used to calculate decontaminant performance, percent efficacy, and reduction in starting challenge. If the appropriate analytical methods are used, this test may also provide the mass of contaminant byproducts in nanograms recovered from the panel. An illustration of the treatment process followed by the total remaining contaminant test is shown in Figure 2.
Because of the size or type of material, some test materials may not be able to be placed in solvent. For these materials, the remaining contaminant test is performed using the swabbing method in the small-item contact test methodology.2

Chemical Contaminant and Decontaminant Test Methodology Source Document, Second Edition
A-15
Figure 2. Illustration of the treatment process followed by the total remaining contaminant test.
Post-Treatment Evaluation for Chemical Agent Detector Paper Response and
Residual Contaminant
The chemical agent detector paper response test indicates whether the contaminant present in or on the test material after the treatment process would result in a colorimetric response (i.e., positive response). M8 and M9 chemical agent detector papers are qualitative, surface-sampling techniques that provide a colorimetric response when the paper comes in contact with liquid chemical agent. A negative chemical agent detector paper response is typically a performance criterion in technology transition agreements and requirement documents.

Chemical Contaminant and Decontaminant Test Methodology Source Document, Second Edition
A-16
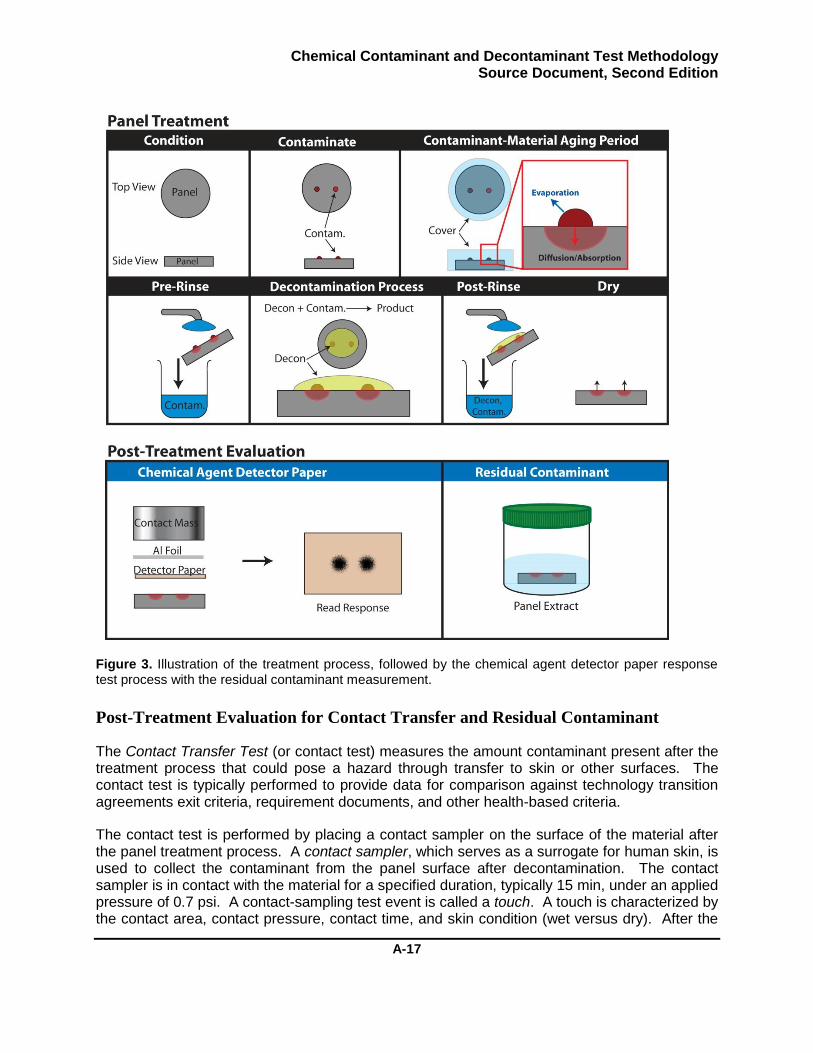
After panel treatment is complete, the chemical agent detector paper response test is performed by placing a piece of chemical agent detector paper on the surface of the material after the treatment process. The paper is in contact with the material for 15 s under an applied force of 0.7 psi. The paper is then removed and the response (positive or negative) is reported.
A residual contaminant measurement can then be performed. The residual contaminant test measures the amount of contaminant present in and on the test material, after the treatment process and post-treatment evaluation. The residual contaminant test is performed by placing the panel in solvent to extract the contaminant from the material. An aliquot of the extraction solvent is analyzed using the appropriate chromatographic technique. The residual contaminant test, applied after the chemical agent detector paper response test, provides a measurement of the amount of contaminant still present on or in the material that was not transferred to the detector paper. The residual contaminant measurement provides context regarding the quantity of contaminant that may be present in the material, whether or not the detector paper indicates contaminant.
An illustration of the treatment process, followed by the chemical agent detector paper response test process with the residual contaminant measurement, is shown in Figure 3.
Chemical Contaminant and Decontaminant Test Methodology Source Document, Second Edition
A-17
Figure 3. Illustration of the treatment process, followed by the chemical agent detector paper response test process with the residual contaminant measurement.
Post-Treatment Evaluation for Contact Transfer and Residual Contaminant
The Contact Transfer Test (or contact test) measures the amount contaminant present after the treatment process that could pose a hazard through transfer to skin or other surfaces. The contact test is typically performed to provide data for comparison against technology transition agreements exit criteria, requirement documents, and other health-based criteria.
The contact test is performed by placing a contact sampler on the surface of the material after the panel treatment process. A contact sampler, which serves as a surrogate for human skin, is used to collect the contaminant from the panel surface after decontamination. The contact sampler is in contact with the material for a specified duration, typically 15 min, under an applied pressure of 0.7 psi. A contact-sampling test event is called a touch. A touch is characterized by the contact area, contact pressure, contact time, and skin condition (wet versus dry). After the
Chemical Contaminant and Decontaminant Test Methodology Source Document, Second Edition
A-18
touch is performed, the contact sampler is placed in solvent to extract the contaminant from the contact sampler. An aliquot of the extraction solvent is analyzed using the appropriate chromatographic technique. The standard contact test uses a two-touch sampling pattern. The first touch is in contact with the material for 15 min immediately after treatment. The second touch is in contact with the material for 15 min, starting 45 min after treatment. The residual contaminant measurement is performed after all touches have been completed.
The contact test provides the total mass of contaminant, in nanograms, collected from each touch and the material. These results can be used to calculate decontaminant performance and the legacy contact transfer value.
An illustration of the treatment process, followed by the contact transfer test process using the standard two-touch sampling pattern with the residual contaminant measurement, is provided in Figure 4.

Chemical Contaminant and Decontaminant Test Methodology Source Document, Second Edition
A-19
Figure 4. Illustration of the treatment process, followed by the contact transfer test process using the standard two-touch sampling pattern with the residual contaminant measurement.
Post-Treatment Evaluation for Vapor Test and Residual Contaminant
The Vapor Emission Test (or vapor test) characterizes the emission of contaminant after the treatment process to determine a contaminant emission function. This emission function can be used to determine the potential risk to unprotected personnel. The vapor test is typically performed to provide data for comparison against technology transition agreements exit criteria, requirement documents, and other health-based criteria.
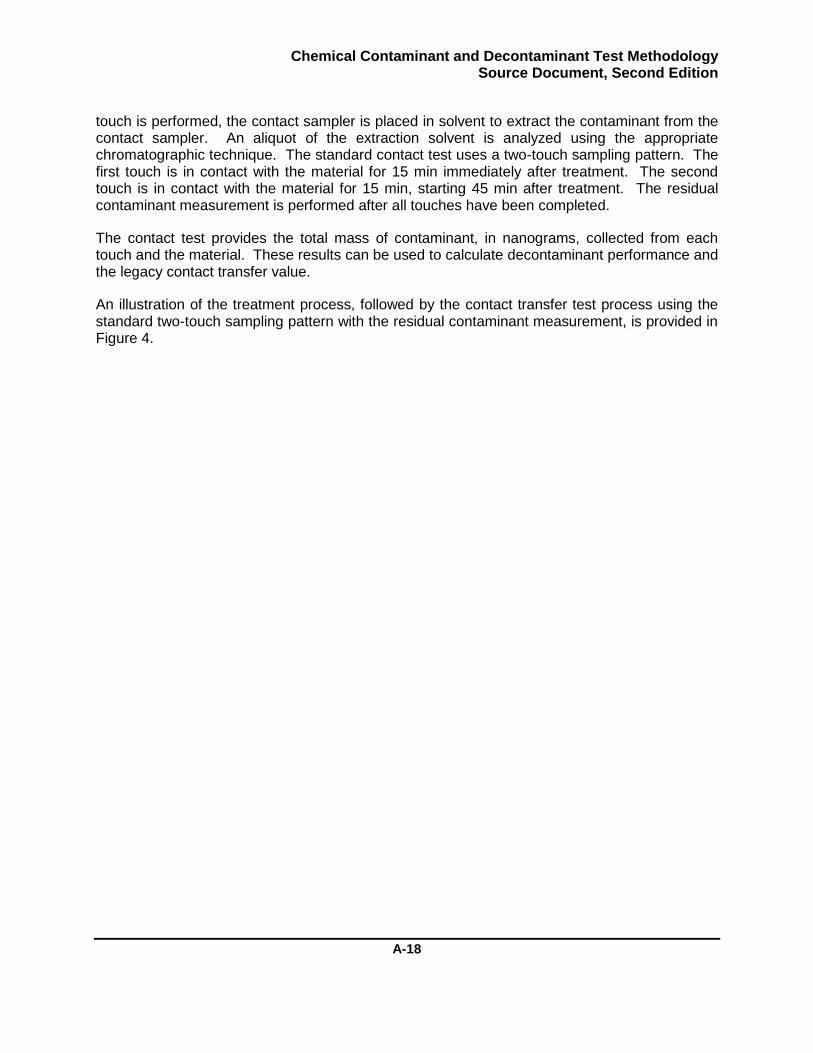
After panel treatment is complete, the vapor test is performed by placing the material in a dynamic vapor chamber for a specified vapor-sampling period after the treatment process. Using solid-sorbent tubes, the contaminant emission is collected at specific time intervals over the duration of the vapor-sampling period. The solid-sorbent tubes are analyzed using the
Chemical Contaminant and Decontaminant Test Methodology Source Document, Second Edition
A-20
appropriate chromatographic technique to determine the amount of contaminant emitted by the panels and collected in the tubes. The residual contaminant measurement is performed after vapor sampling is completed to identify the presence of residual contaminant that may pose a future vapor emission. An illustration of the treatment process, followed by the vapor emission test process with the residual contaminant measurement, is provided in Figure 5.
The calculation procedures enable determination of vapor concentration, emitted contaminant mass, vapor dose, and toxic load for as-tested and specified scenarios. The residual contaminant measurement provides context as to whether a potential future hazard may be present.
Figure 5. Illustration of the treatment process, followed by the vapor emission test process with the residual contaminant measurement.
Chemical Contaminant and Decontaminant Test Methodology Source Document, Second Edition
A-21
Samples Generated by Post-Treatment Evaluations
The post-treatment evaluations for total remaining contaminant, contact transfer, vapor emission and residual contaminant produce quantitative results regarding the amount of contaminant present after a treatment process. In addition, the treatment process provides a quantitative result from the dose confirmation sample. These quantitative results are obtained from the analysis of liquid and vapor samples generated as part of the test. These quantitative samples are identified on the treatment and post-treatment illustrations shown in Figure 6.

Chemical Contaminant and Decontaminant Test Methodology Source Document, Second Edition
A-22
Figure 6. Illustration of the samples generated by the SD2ED methodology.
Panel Treatment Potential Method Output • • • i I I o. II
TopView . SAMPLE • Dose l
Confirmation erl - \
SideView~
Detector Paper
Panel Extract
Contam.
\ -
SAMPLE Panel
Extract
Read Response
Contact t Sampler #1 Sampler 1 Foil Extract
DCSsamples
+ _LSJiMPLE
~ ":::;:.::.~.: .•. Pre-rinse samples Post-rinse samples
Contact Sample r 2
Panel Extract Detector paper images Residual contaminant (RE) sample
Remaining contaminant (RAJ sample (this is the only test that can generate an RA sam ple)
b SAMPLE Panel
Extract
Panel Extract
.. . .
Panel Extract
SAMPLE Panel
Extract
Contact transfer samples Residual contaminant (RE) sample
Vapor samples Residual contaminant (RE) sample
Chemical Contaminant and Decontaminant Test Methodology Source Document, Second Edition
A-23
Preparation of the Laboratory to Perform These Procedures
This document does not claim to address all of the safety concerns associated with chemical decontaminant testing because the requirements may vary on the basis of the contaminant used, facility, state, and other regulatory requirements. It is the responsibility of the performing laboratory to establish the appropriate environmental, health, and safety practices for using this method, handling the waste generated, and complying with applicable regulations for their facility prior to use. Users of this method should conduct the testing in the appropriate facilities, follow proper laboratory practices, and include the use of appropriate personal protective equipment and material safety data sheets.
The procedure specifies the sample handling, measurement, and reporting tasks. Additional steps for moving samples between workspaces (i.e., sample containment and transfer between engineering controls/hoods), sample decontamination, requirements for working with specific contaminants, and waste disposal steps are not presented here. Those steps should be added as appropriate, based on the performing laboratory’s facility safety and regulatory requirements.
Test Development
Overview
Most hazard mitigation evaluations involve the determination of performance to reduce contamination. The hazard mitigation evaluations described in the SD2ED procedures focus on the reduction of chemical contamination from materials and items of interest. Successful execution of a hazard mitigation evaluation requires the development of a robust test. This section provides some general guidance for developing a hazard mitigation study.
Develop a Test Objective
The first step is to develop the test objective. In general, a test objective is a clearly stated question (or goal) that is answered by evaluation of the data. For example, the objective for a candidate hazard mitigation technology study may be: “The test objective is to determine if the candidate hazard mitigation technology provides a measurable (>15%) reduction in agent contamination compared with a reference technology.”
Identify the Required Calculations
Once the question has been identified, determine what data is needed and the calculations that will be used to answer the test design question. Then design the test matrix and identify the appropriate controls. Finally, check that the data obtained will enable the performance of the selected calculation and uphold the conclusions. Most often, the samples to indisputably defend the results are positive and negative controls.
Chemical Contaminant and Decontaminant Test Methodology Source Document, Second Edition
A-24
Develop the Test Approach and Select the Test Parameters
Once the test objective is identified, the procedures should be reviewed to develop the approach that best addresses the objective.
The test approach should include the appropriate control studies. For example, evaluation of a candidate hazard mitigation technology should consider a comparative control to enable the calculation of the improvement that could be gained using the candidate hazard mitigation technology. Once the test approach has been identified, the test parameters for treatment and post-treatment evaluations can be selected. An example table to facilitate test parameter selection is provided in Table 1.
Once the test parameters are selected, the test sessions can be designed. Program managers and test designers should keep in mind that certain test parameters can act as blocking variables, which can require separate test sessions for execution. For example, temperature is often a blocking variable. Adjusting the temperature in the environmental enclosures may take several hours before the environment reaches stabilization. The execution of a study evaluating the effect of temperature at 20, 40, and 60 °C may require three test sessions to complete.
The number of statistical replicates must be considered in the test design. Five statistical replicates are recommended for most studies. No fewer than three should be performed if standard statistical analyses are to be applied. Some contaminant-material pairs may require more replicates because of effects such as sample variability. Design of Experiment (DoE) test designs may use differing numbers of statistical replicates on the basis of the design.
The SD2ED procedures can be applied to multiple panels during a single test session. A single test session may include panels that are treated using different process conditions, evaluated using different post-treatment procedures, or are considered statistical replicates. In a multiple panel test, it is important to have an accurate and reproducible panel test event timeline for each panel. The use of timing charts to stagger contamination, decontamination, rinse, and contact test times is strongly encouraged because subtle differences in panel treatment may contribute to significant data scatter.
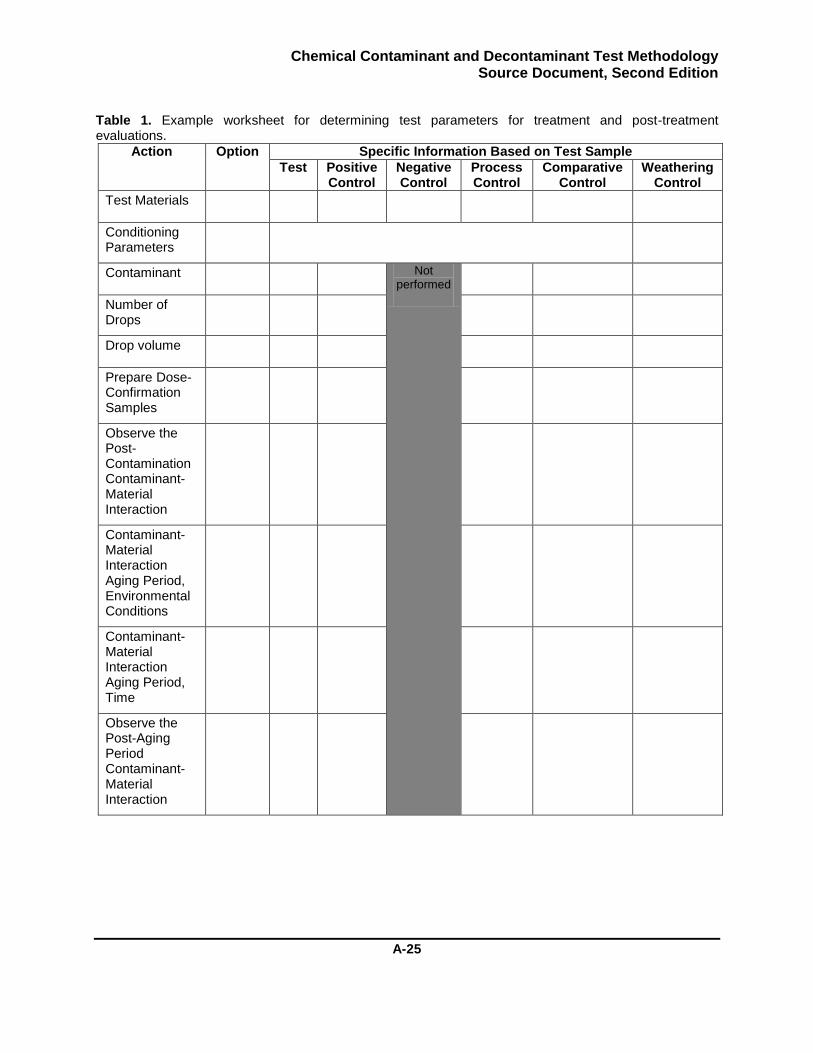
Chemical Contaminant and Decontaminant Test Methodology Source Document, Second Edition
A-25
Table 1. Example worksheet for determining test parameters for treatment and post-treatment evaluations.
Action Option Specific Information Based on Test Sample
Test Positive Control
Negative Control
Process Control
Comparative Control
Weathering Control
Test Materials
Conditioning Parameters
Contaminant Not performed
Number of Drops
Drop volume
Prepare Dose-Confirmation Samples
Observe the Post-Contamination Contaminant-Material Interaction
Contaminant-Material Interaction Aging Period, Environmental Conditions
Contaminant-Material Interaction Aging Period, Time
Observe the Post-Aging Period Contaminant-Material Interaction
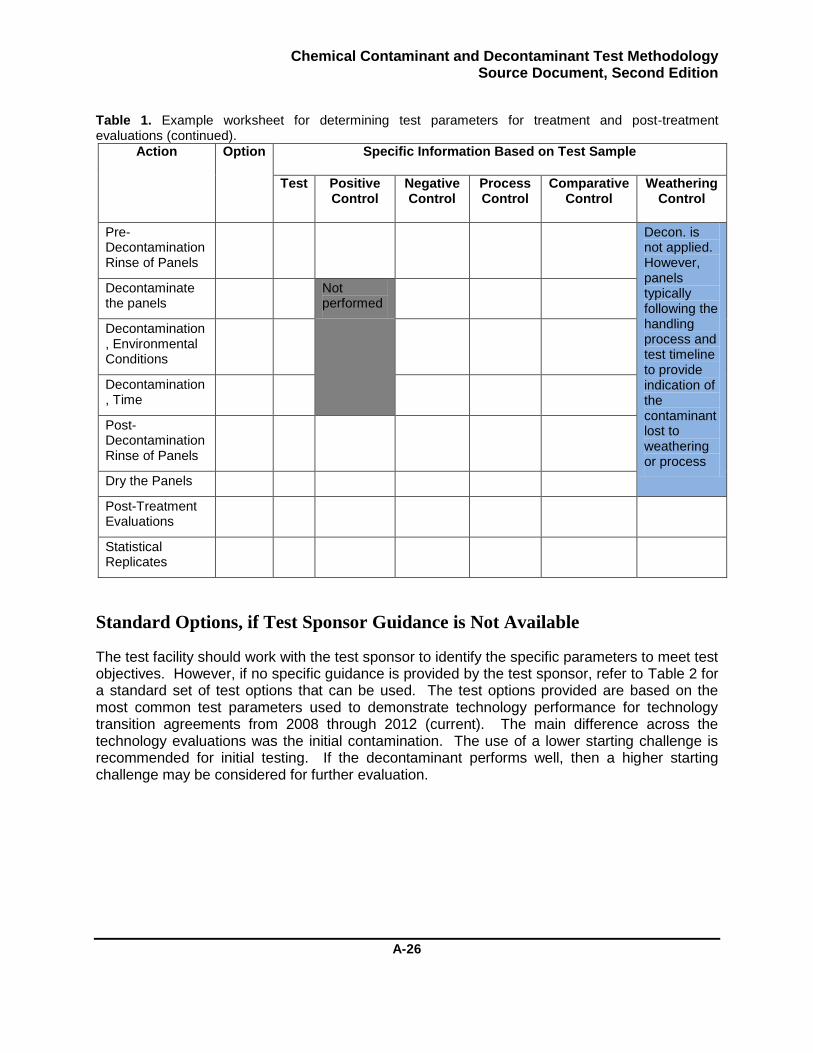
Chemical Contaminant and Decontaminant Test Methodology Source Document, Second Edition
A-26
Table 1. Example worksheet for determining test parameters for treatment and post-treatment evaluations (continued).
Action Option Specific Information Based on Test Sample
Test Positive Control
Negative Control
Process Control
Comparative Control
Weathering Control
Pre-Decontamination Rinse of Panels
Decon. is not applied. However, panels typically following the handling process and test timeline to provide indication of the contaminant lost to weathering or process
Decontaminate the panels
Not performed
Decontamination, Environmental Conditions
Decontamination, Time
Post-Decontamination Rinse of Panels
Dry the Panels
Post-Treatment Evaluations
Statistical Replicates
Standard Options, if Test Sponsor Guidance is Not Available
The test facility should work with the test sponsor to identify the specific parameters to meet test objectives. However, if no specific guidance is provided by the test sponsor, refer to Table 2 for a standard set of test options that can be used. The test options provided are based on the most common test parameters used to demonstrate technology performance for technology transition agreements from 2008 through 2012 (current). The main difference across the technology evaluations was the initial contamination. The use of a lower starting challenge is recommended for initial testing. If the decontaminant performs well, then a higher starting challenge may be considered for further evaluation.
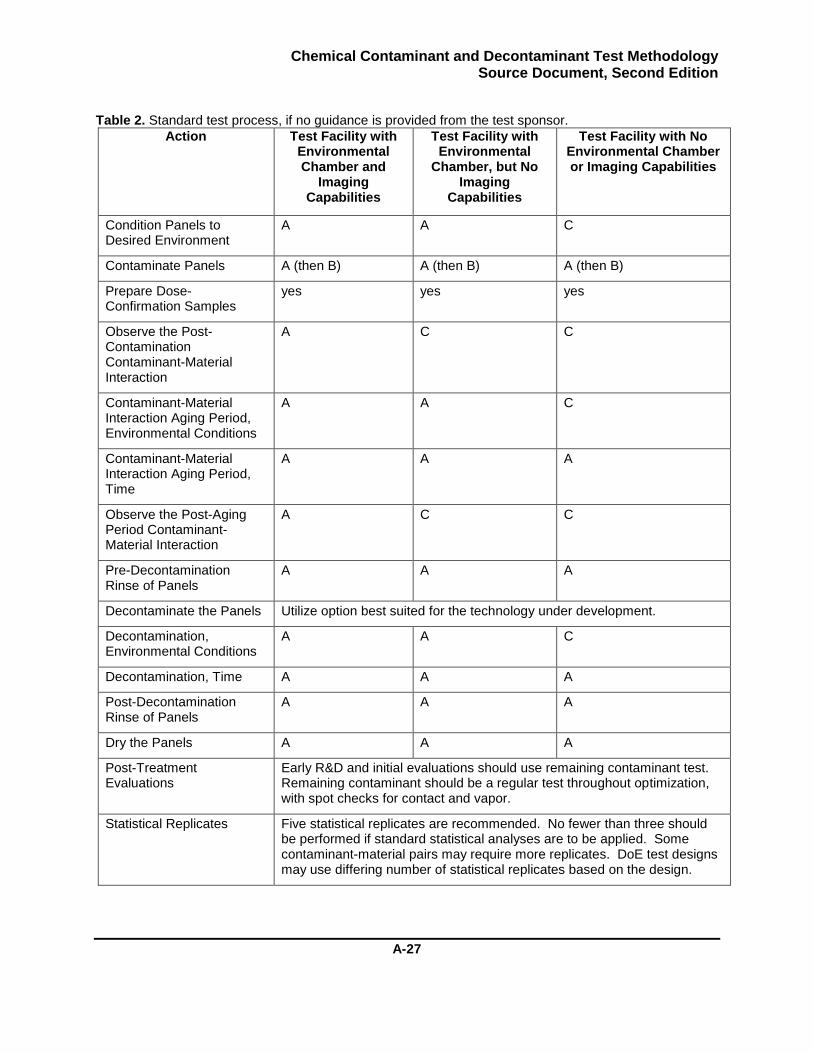
Chemical Contaminant and Decontaminant Test Methodology Source Document, Second Edition
A-27
Table 2. Standard test process, if no guidance is provided from the test sponsor.
Action Test Facility with Environmental Chamber and
Imaging Capabilities
Test Facility with Environmental
Chamber, but No Imaging
Capabilities
Test Facility with No Environmental Chamber or Imaging Capabilities
Condition Panels to Desired Environment
A A C
Contaminate Panels A (then B) A (then B) A (then B)
Prepare Dose-Confirmation Samples
yes yes yes
Observe the Post-Contamination Contaminant-Material Interaction
A C C
Contaminant-Material Interaction Aging Period, Environmental Conditions
A A C
Contaminant-Material Interaction Aging Period, Time
A A A
Observe the Post-Aging Period Contaminant-Material Interaction
A C C
Pre-Decontamination Rinse of Panels
A A A
Decontaminate the Panels Utilize option best suited for the technology under development.
Decontamination, Environmental Conditions
A A C
Decontamination, Time A A A
Post-Decontamination Rinse of Panels
A A A
Dry the Panels A A A
Post-Treatment Evaluations
Early R&D and initial evaluations should use remaining contaminant test. Remaining contaminant should be a regular test throughout optimization, with spot checks for contact and vapor.
Statistical Replicates Five statistical replicates are recommended. No fewer than three should be performed if standard statistical analyses are to be applied. Some contaminant-material pairs may require more replicates. DoE test designs may use differing number of statistical replicates based on the design.
Chemical Contaminant and Decontaminant Test Methodology Source Document, Second Edition
A-28
Identification of Control Samples
Test designs should include control samples to demonstrate that the test is performing as expected and to provide reference values for data analysis. Table 3 identifies the standard positive and negative control samples that may be used in hazard mitigation evaluations. The standard positive and negative controls can be applied to all post-treatment evaluations.
The positive control samples provide vital information regarding the ability to recover contaminant and information regarding any contaminant losses because of process and/or weathering. Positive control samples receive the same treatment as the test panel, with the exception of the decontamination steps. The positive control result, compared to the test panel results, provides an indication of decontaminant’s contribution to the reduction of the contaminant from the material.
Negative control samples provide vital information regarding the material-decontaminant interaction. Negative controls should be performed to confirm that the material-decontaminant pair does not affect the ability to measure contaminant post-treatment. For example, an aggressive decontaminant solution may extract chemicals from the test material that may interfere with the analytical detection. These matrix interferences could result in over- or under-quantification of the amount of contaminant resulting in an inaccurate determination of performance and risk. Negative control samples receive the same treatment as the test panel with the exception of the steps specific to contamination. This negative control should result in no detection of contaminant upon analysis. The analysis of negative control samples with and without contaminant post-spiking is often performed as prerequisite interference evaluation. Interference evaluations are used to ensure that the sample matrix does not affect the ability to confidently quantify the contaminant.
The standard positive and negative control samples are particularly important for the chemical contaminant detector paper response test and should be performed. The positive control samples ensure that the contaminant can be detected on the material with chemical agent detector paper. If the contaminant cannot be detected, then a false negative response would be observed. The negative control samples ensure that the decontamination process does not result in a false positive response with the detector paper. These controls are important for reporting an accurate test panel result.

Chemical Contaminant and Decontaminant Test Methodology Source Document, Second Edition
A-29
Table 3. Illustration of positive and negative control samples compared to the test panel treatment process.
Action Test Positive Control Negative Control
Condition Panels to Desired Environment
Contaminate Panels
Contaminant is not applied.
Prepare Dose-Confirmation Samples
Steps associated with contamination are not performed.
Observe the Post-Contamination Contaminant-Material Interaction
Contaminant-Material Interaction Aging Period
Observe the Post-Aging Period Contaminant-Material Interaction
Pre-Decontamination Rinse of Panels
Decontaminate the Panels
Decontaminant not applied. Post-rinse and dry are not performed. Panel waits duration of decontamination process.
Post-Decontamination Rinse of Panels
Dry the Panels
Post-Treatment Evaluations
Process control samples are used to isolate the contribution a specific treatment process may have on the reduction of the contaminant from the material. Some examples of process control samples are listed in Table 4.
Example 1 provides the treatment process that could be used to verify that the solvent extraction of contaminant is effective after the specified contaminant-material interaction aging period.
Pre-rinse can be effective at the removal of gross liquid contamination from materials. The greater decontamination challenge is the removal of contaminant that is adsorbed and/or absorbed by the material and is, therefore, not easily removed by a rinse process. Example 2 provides the treatment process that could be used to determine the amount of contaminant not easily removed by rinsing at the onset of the decontamination process. This type of control is
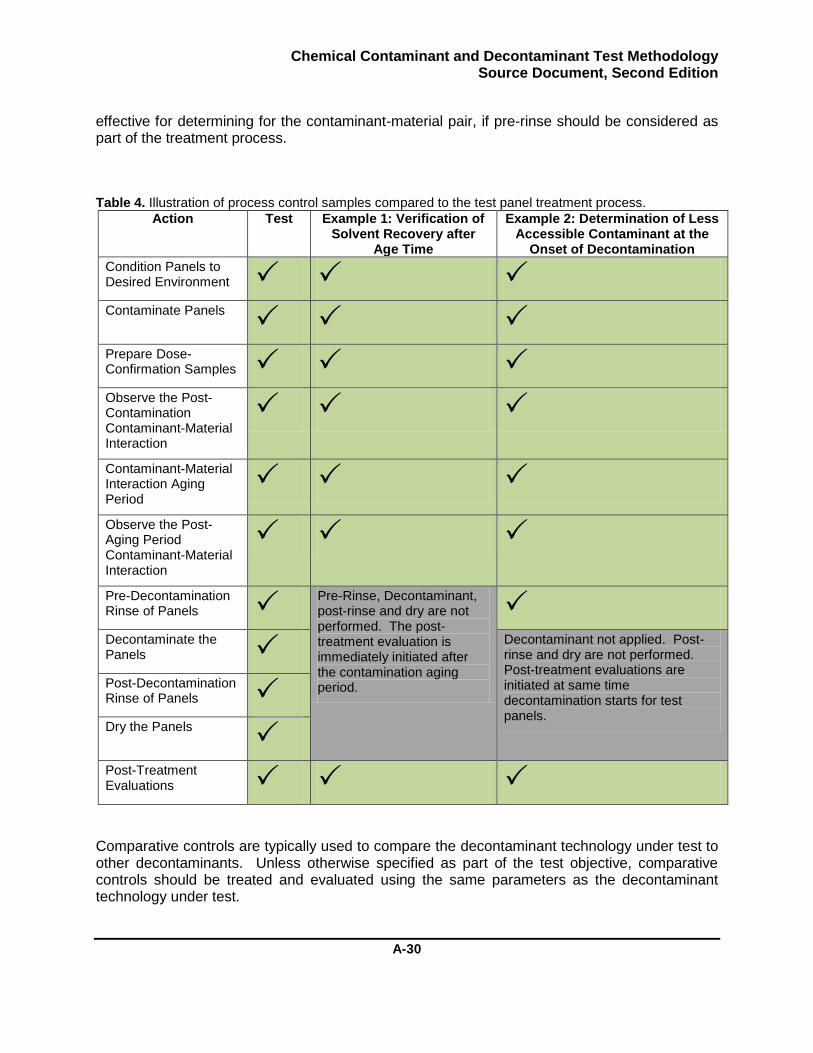
Chemical Contaminant and Decontaminant Test Methodology Source Document, Second Edition
A-30
effective for determining for the contaminant-material pair, if pre-rinse should be considered as part of the treatment process.
Table 4. Illustration of process control samples compared to the test panel treatment process.
Action Test Example 1: Verification of Solvent Recovery after
Age Time
Example 2: Determination of Less Accessible Contaminant at the
Onset of Decontamination
Condition Panels to Desired Environment
Contaminate Panels
Prepare Dose- Confirmation Samples
Observe the Post-Contamination Contaminant-Material Interaction
Contaminant-Material Interaction Aging Period
Observe the Post-Aging Period Contaminant-Material Interaction
Pre-Decontamination Rinse of Panels
Pre-Rinse, Decontaminant, post-rinse and dry are not performed. The post-treatment evaluation is immediately initiated after the contamination aging period.
Decontaminate the Panels
Decontaminant not applied. Post-rinse and dry are not performed. Post-treatment evaluations are initiated at same time decontamination starts for test panels.
Post-Decontamination Rinse of Panels
Dry the Panels
Post-Treatment Evaluations
Comparative controls are typically used to compare the decontaminant technology under test to other decontaminants. Unless otherwise specified as part of the test objective, comparative controls should be treated and evaluated using the same parameters as the decontaminant technology under test.
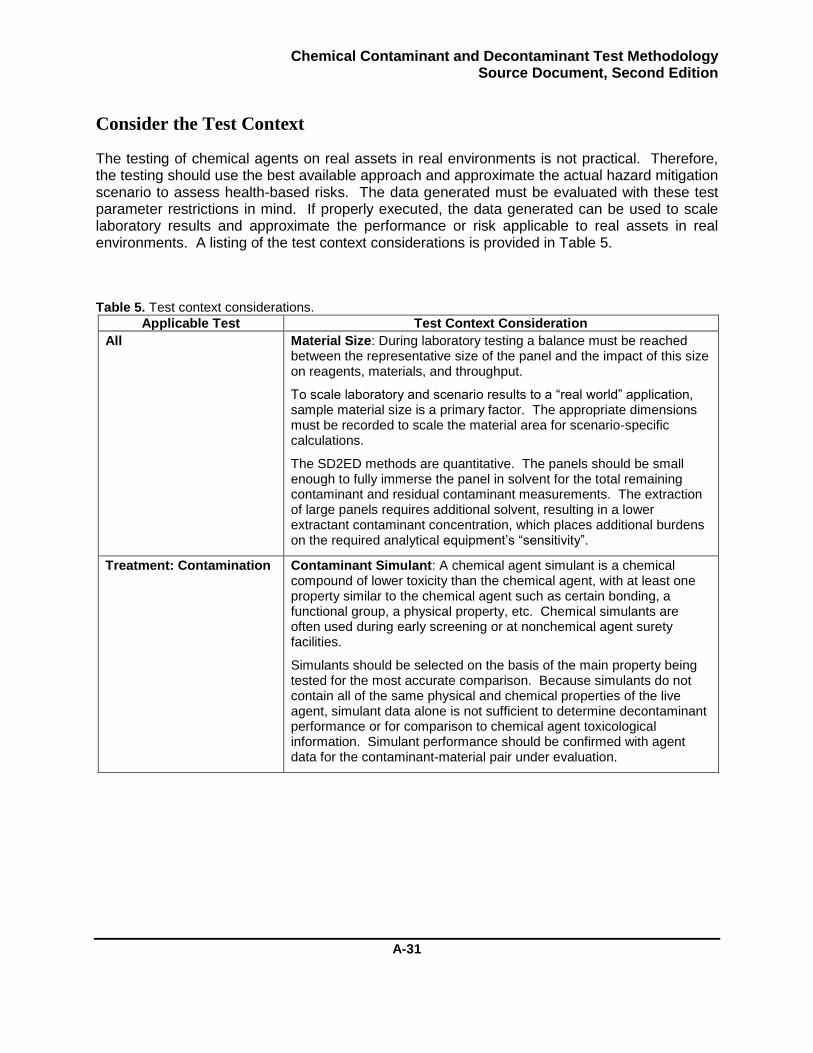
Chemical Contaminant and Decontaminant Test Methodology Source Document, Second Edition
A-31
Consider the Test Context
The testing of chemical agents on real assets in real environments is not practical. Therefore, the testing should use the best available approach and approximate the actual hazard mitigation scenario to assess health-based risks. The data generated must be evaluated with these test parameter restrictions in mind. If properly executed, the data generated can be used to scale laboratory results and approximate the performance or risk applicable to real assets in real environments. A listing of the test context considerations is provided in Table 5.
Table 5. Test context considerations.
Applicable Test Test Context Consideration
All Material Size: During laboratory testing a balance must be reached between the representative size of the panel and the impact of this size on reagents, materials, and throughput.
To scale laboratory and scenario results to a “real world” application, sample material size is a primary factor. The appropriate dimensions must be recorded to scale the material area for scenario-specific calculations.
The SD2ED methods are quantitative. The panels should be small enough to fully immerse the panel in solvent for the total remaining contaminant and residual contaminant measurements. The extraction of large panels requires additional solvent, resulting in a lower extractant contaminant concentration, which places additional burdens on the required analytical equipment’s “sensitivity”.
Treatment: Contamination Contaminant Simulant: A chemical agent simulant is a chemical compound of lower toxicity than the chemical agent, with at least one property similar to the chemical agent such as certain bonding, a functional group, a physical property, etc. Chemical simulants are often used during early screening or at nonchemical agent surety facilities.
Simulants should be selected on the basis of the main property being tested for the most accurate comparison. Because simulants do not contain all of the same physical and chemical properties of the live agent, simulant data alone is not sufficient to determine decontaminant performance or for comparison to chemical agent toxicological information. Simulant performance should be confirmed with agent data for the contaminant-material pair under evaluation.
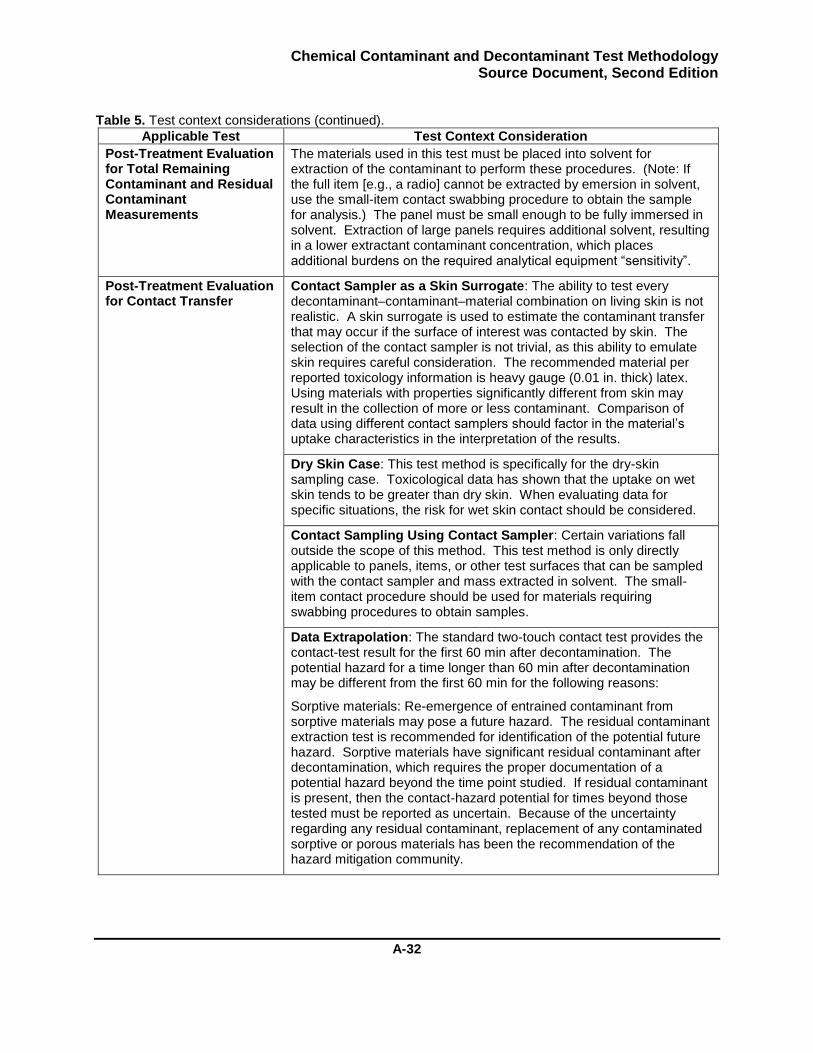
Chemical Contaminant and Decontaminant Test Methodology Source Document, Second Edition
A-32
Table 5. Test context considerations (continued).
Applicable Test Test Context Consideration
Post-Treatment Evaluation for Total Remaining Contaminant and Residual Contaminant Measurements
The materials used in this test must be placed into solvent for extraction of the contaminant to perform these procedures. (Note: If the full item [e.g., a radio] cannot be extracted by emersion in solvent, use the small-item contact swabbing procedure to obtain the sample for analysis.) The panel must be small enough to be fully immersed in solvent. Extraction of large panels requires additional solvent, resulting in a lower extractant contaminant concentration, which places additional burdens on the required analytical equipment “sensitivity”.
Post-Treatment Evaluation for Contact Transfer
Contact Sampler as a Skin Surrogate: The ability to test every decontaminant–contaminant–material combination on living skin is not realistic. A skin surrogate is used to estimate the contaminant transfer that may occur if the surface of interest was contacted by skin. The selection of the contact sampler is not trivial, as this ability to emulate skin requires careful consideration. The recommended material per reported toxicology information is heavy gauge (0.01 in. thick) latex. Using materials with properties significantly different from skin may result in the collection of more or less contaminant. Comparison of data using different contact samplers should factor in the material’s uptake characteristics in the interpretation of the results.
Dry Skin Case: This test method is specifically for the dry-skin sampling case. Toxicological data has shown that the uptake on wet skin tends to be greater than dry skin. When evaluating data for specific situations, the risk for wet skin contact should be considered.
Contact Sampling Using Contact Sampler: Certain variations fall outside the scope of this method. This test method is only directly applicable to panels, items, or other test surfaces that can be sampled with the contact sampler and mass extracted in solvent. The small-item contact procedure should be used for materials requiring swabbing procedures to obtain samples.
Data Extrapolation: The standard two-touch contact test provides the contact-test result for the first 60 min after decontamination. The potential hazard for a time longer than 60 min after decontamination may be different from the first 60 min for the following reasons:
Sorptive materials: Re-emergence of entrained contaminant from sorptive materials may pose a future hazard. The residual contaminant extraction test is recommended for identification of the potential future hazard. Sorptive materials have significant residual contaminant after decontamination, which requires the proper documentation of a potential hazard beyond the time point studied. If residual contaminant is present, then the contact-hazard potential for times beyond those tested must be reported as uncertain. Because of the uncertainty regarding any residual contaminant, replacement of any contaminated sorptive or porous materials has been the recommendation of the hazard mitigation community.
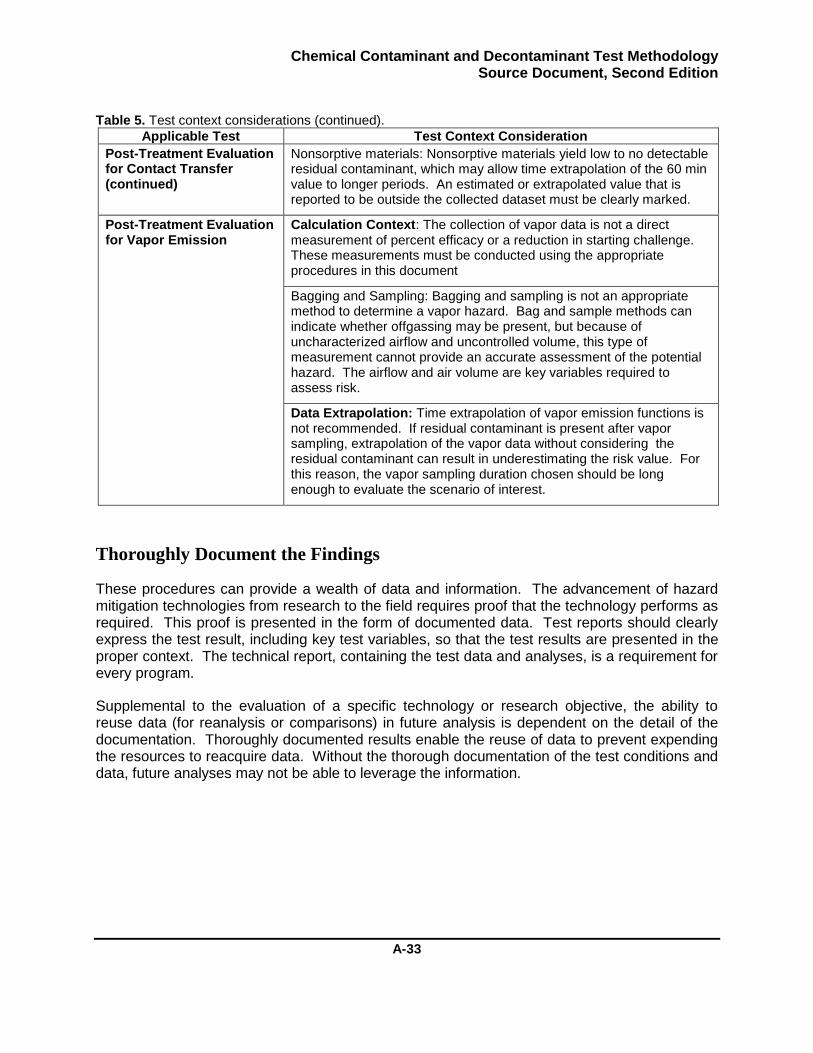
Chemical Contaminant and Decontaminant Test Methodology Source Document, Second Edition
A-33
Table 5. Test context considerations (continued).
Applicable Test Test Context Consideration
Post-Treatment Evaluation for Contact Transfer (continued)
Nonsorptive materials: Nonsorptive materials yield low to no detectable residual contaminant, which may allow time extrapolation of the 60 min value to longer periods. An estimated or extrapolated value that is reported to be outside the collected dataset must be clearly marked.
Post-Treatment Evaluation for Vapor Emission
Calculation Context: The collection of vapor data is not a direct measurement of percent efficacy or a reduction in starting challenge. These measurements must be conducted using the appropriate procedures in this document
Bagging and Sampling: Bagging and sampling is not an appropriate method to determine a vapor hazard. Bag and sample methods can indicate whether offgassing may be present, but because of uncharacterized airflow and uncontrolled volume, this type of measurement cannot provide an accurate assessment of the potential hazard. The airflow and air volume are key variables required to assess risk.
Data Extrapolation: Time extrapolation of vapor emission functions is not recommended. If residual contaminant is present after vapor sampling, extrapolation of the vapor data without considering the residual contaminant can result in underestimating the risk value. For this reason, the vapor sampling duration chosen should be long enough to evaluate the scenario of interest.
Thoroughly Document the Findings
These procedures can provide a wealth of data and information. The advancement of hazard mitigation technologies from research to the field requires proof that the technology performs as required. This proof is presented in the form of documented data. Test reports should clearly express the test result, including key test variables, so that the test results are presented in the proper context. The technical report, containing the test data and analyses, is a requirement for every program.
Supplemental to the evaluation of a specific technology or research objective, the ability to reuse data (for reanalysis or comparisons) in future analysis is dependent on the detail of the documentation. Thoroughly documented results enable the reuse of data to prevent expending the resources to reacquire data. Without the thorough documentation of the test conditions and data, future analyses may not be able to leverage the information.

Chemical Contaminant and Decontaminant Test Methodology Source Document, Second Edition
A-34
Blank
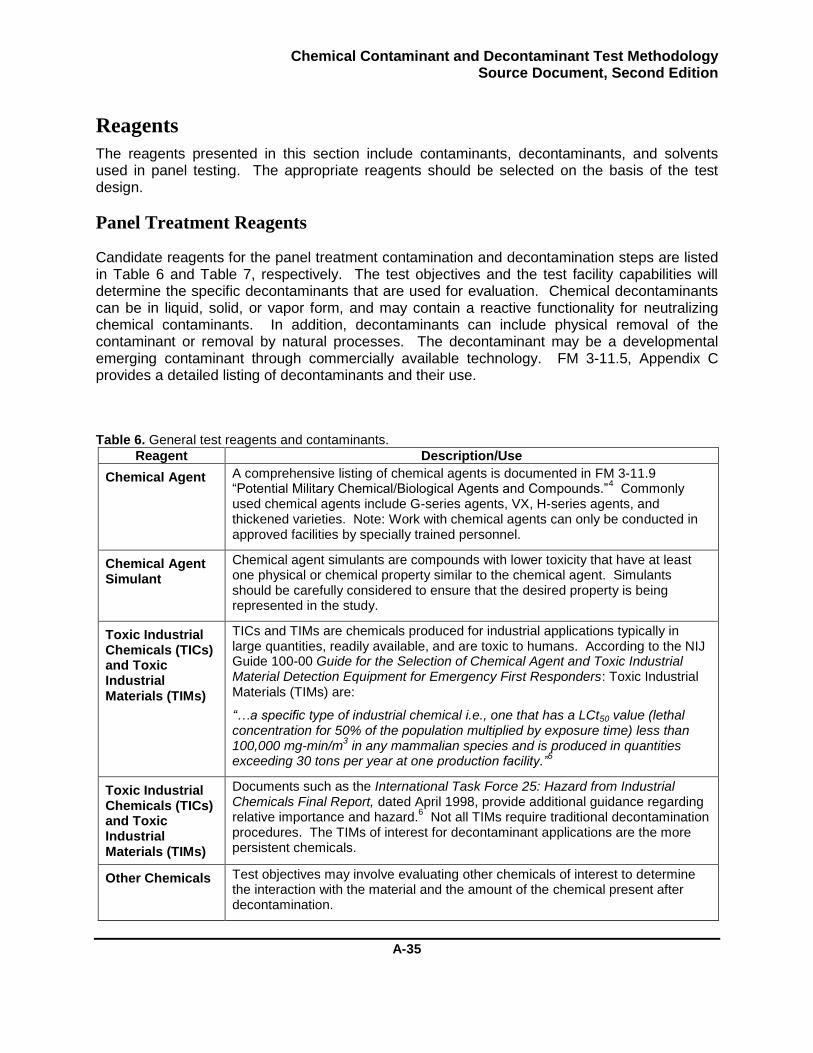
Chemical Contaminant and Decontaminant Test Methodology Source Document, Second Edition
A-35
Reagents
The reagents presented in this section include contaminants, decontaminants, and solvents used in panel testing. The appropriate reagents should be selected on the basis of the test design.
Panel Treatment Reagents
Candidate reagents for the panel treatment contamination and decontamination steps are listed in Table 6 and Table 7, respectively. The test objectives and the test facility capabilities will determine the specific decontaminants that are used for evaluation. Chemical decontaminants can be in liquid, solid, or vapor form, and may contain a reactive functionality for neutralizing chemical contaminants. In addition, decontaminants can include physical removal of the contaminant or removal by natural processes. The decontaminant may be a developmental emerging contaminant through commercially available technology. FM 3-11.5, Appendix C provides a detailed listing of decontaminants and their use.
Table 6. General test reagents and contaminants.
Reagent Description/Use
Chemical Agent A comprehensive listing of chemical agents is documented in FM 3-11.9 “Potential Military Chemical/Biological Agents and Compounds.”
4 Commonly
used chemical agents include G-series agents, VX, H-series agents, and thickened varieties. Note: Work with chemical agents can only be conducted in approved facilities by specially trained personnel.
Chemical Agent Simulant
Chemical agent simulants are compounds with lower toxicity that have at least one physical or chemical property similar to the chemical agent. Simulants should be carefully considered to ensure that the desired property is being represented in the study.
Toxic Industrial Chemicals (TICs) and Toxic Industrial Materials (TIMs)
TICs and TIMs are chemicals produced for industrial applications typically in large quantities, readily available, and are toxic to humans. According to the NIJ Guide 100-00 Guide for the Selection of Chemical Agent and Toxic Industrial Material Detection Equipment for Emergency First Responders: Toxic Industrial Materials (TIMs) are:
“…a specific type of industrial chemical i.e., one that has a LCt50 value (lethal concentration for 50% of the population multiplied by exposure time) less than 100,000 mg-min/m
3 in any mammalian species and is produced in quantities
exceeding 30 tons per year at one production facility.”5
Toxic Industrial Chemicals (TICs) and Toxic Industrial Materials (TIMs)
Documents such as the International Task Force 25: Hazard from Industrial Chemicals Final Report, dated April 1998, provide additional guidance regarding relative importance and hazard.
6 Not all TIMs require traditional decontamination
procedures. The TIMs of interest for decontaminant applications are the more persistent chemicals.
Other Chemicals Test objectives may involve evaluating other chemicals of interest to determine the interaction with the material and the amount of the chemical present after decontamination.
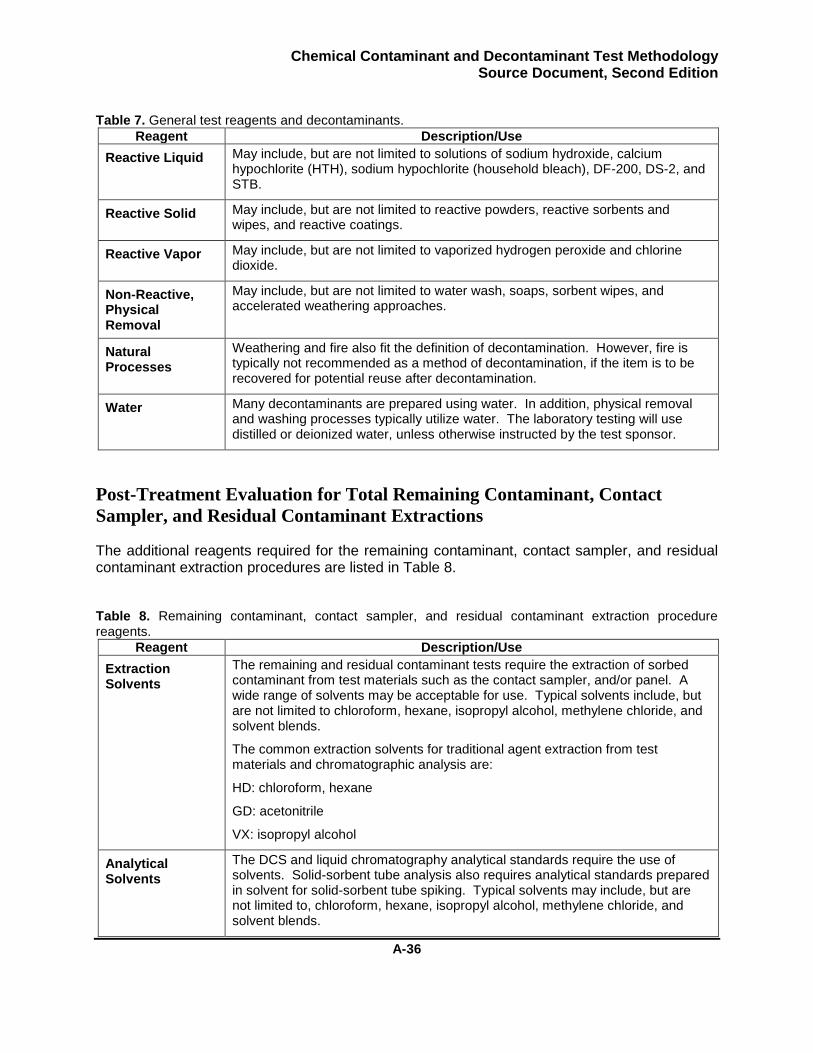
Chemical Contaminant and Decontaminant Test Methodology Source Document, Second Edition
A-36
Table 7. General test reagents and decontaminants.
Reagent Description/Use
Reactive Liquid May include, but are not limited to solutions of sodium hydroxide, calcium hypochlorite (HTH), sodium hypochlorite (household bleach), DF-200, DS-2, and STB.
Reactive Solid May include, but are not limited to reactive powders, reactive sorbents and wipes, and reactive coatings.
Reactive Vapor May include, but are not limited to vaporized hydrogen peroxide and chlorine dioxide.
Non-Reactive, Physical Removal
May include, but are not limited to water wash, soaps, sorbent wipes, and accelerated weathering approaches.
Natural Processes
Weathering and fire also fit the definition of decontamination. However, fire is typically not recommended as a method of decontamination, if the item is to be recovered for potential reuse after decontamination.
Water Many decontaminants are prepared using water. In addition, physical removal and washing processes typically utilize water. The laboratory testing will use distilled or deionized water, unless otherwise instructed by the test sponsor.
Post-Treatment Evaluation for Total Remaining Contaminant, Contact
Sampler, and Residual Contaminant Extractions
The additional reagents required for the remaining contaminant, contact sampler, and residual contaminant extraction procedures are listed in Table 8.
Table 8. Remaining contaminant, contact sampler, and residual contaminant extraction procedure reagents.
Reagent Description/Use
Extraction Solvents
The remaining and residual contaminant tests require the extraction of sorbed contaminant from test materials such as the contact sampler, and/or panel. A wide range of solvents may be acceptable for use. Typical solvents include, but are not limited to chloroform, hexane, isopropyl alcohol, methylene chloride, and solvent blends.
The common extraction solvents for traditional agent extraction from test materials and chromatographic analysis are:
HD: chloroform, hexane
GD: acetonitrile
VX: isopropyl alcohol
Analytical Solvents
The DCS and liquid chromatography analytical standards require the use of solvents. Solid-sorbent tube analysis also requires analytical standards prepared in solvent for solid-sorbent tube spiking. Typical solvents may include, but are not limited to, chloroform, hexane, isopropyl alcohol, methylene chloride, and solvent blends.
Chemical Contaminant and Decontaminant Test Methodology Source Document, Second Edition
A-37
Post-Treatment Evaluation for Chemical Agent Detector Paper Response
No additional reagents required for the chemical agent detector paper procedure.
Post-Treatment Evaluation for Contact Transfer
No additional reagents required for the contact transfer procedure.
Post-Treatment Evaluation for Vapor Emission
The additional reagents required for the vapor emission procedure are listed in Table 9.
Table 9. Vapor emission procedure reagents.
Reagent Description/Use
Solid-Sorbent Tube Spiking Solutions
Tube spiking is the process of preparing vapor tubes as analytical calibration and/or verification samples for vapor analysis. Tube spiking is performed by introducing a specific volume of a known concentration of liquid chemical contaminant standard, prepared in high purity solvent, with a microliter (µL) syringe onto the sorbent material of a vapor tube.

Chemical Contaminant and Decontaminant Test Methodology Source Document, Second Edition
A-38
Blank
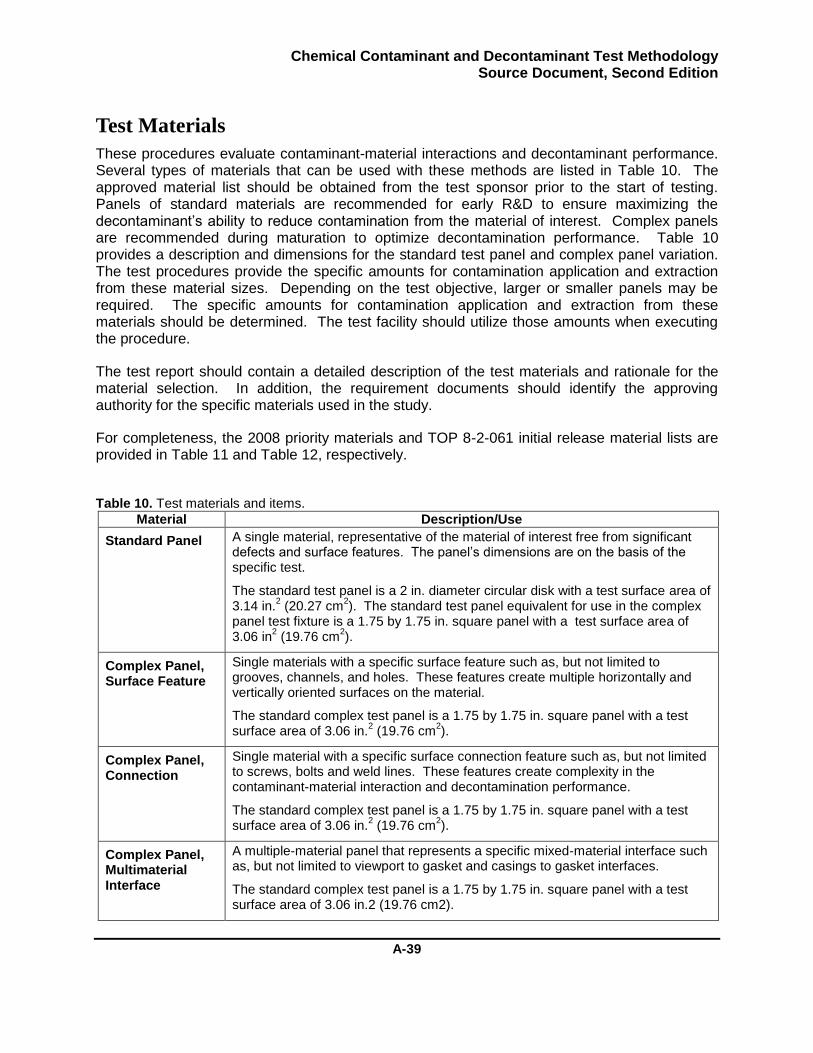
Chemical Contaminant and Decontaminant Test Methodology Source Document, Second Edition
A-39
Test Materials
These procedures evaluate contaminant-material interactions and decontaminant performance. Several types of materials that can be used with these methods are listed in Table 10. The approved material list should be obtained from the test sponsor prior to the start of testing. Panels of standard materials are recommended for early R&D to ensure maximizing the decontaminant’s ability to reduce contamination from the material of interest. Complex panels are recommended during maturation to optimize decontamination performance. Table 10 provides a description and dimensions for the standard test panel and complex panel variation. The test procedures provide the specific amounts for contamination application and extraction from these material sizes. Depending on the test objective, larger or smaller panels may be required. The specific amounts for contamination application and extraction from these materials should be determined. The test facility should utilize those amounts when executing the procedure.
The test report should contain a detailed description of the test materials and rationale for the material selection. In addition, the requirement documents should identify the approving authority for the specific materials used in the study.
For completeness, the 2008 priority materials and TOP 8-2-061 initial release material lists are provided in Table 11 and Table 12, respectively.
Table 10. Test materials and items.
Material Description/Use
Standard Panel A single material, representative of the material of interest free from significant defects and surface features. The panel’s dimensions are on the basis of the specific test.
The standard test panel is a 2 in. diameter circular disk with a test surface area of 3.14 in.
2 (20.27 cm
2). The standard test panel equivalent for use in the complex
panel test fixture is a 1.75 by 1.75 in. square panel with a test surface area of 3.06 in
2 (19.76 cm
2).
Complex Panel, Surface Feature
Single materials with a specific surface feature such as, but not limited to grooves, channels, and holes. These features create multiple horizontally and vertically oriented surfaces on the material.
The standard complex test panel is a 1.75 by 1.75 in. square panel with a test surface area of 3.06 in.
2 (19.76 cm
2).
Complex Panel, Connection
Single material with a specific surface connection feature such as, but not limited to screws, bolts and weld lines. These features create complexity in the contaminant-material interaction and decontamination performance.
The standard complex test panel is a 1.75 by 1.75 in. square panel with a test surface area of 3.06 in.
2 (19.76 cm
2).
Complex Panel, Multimaterial Interface
A multiple-material panel that represents a specific mixed-material interface such as, but not limited to viewport to gasket and casings to gasket interfaces.
The standard complex test panel is a 1.75 by 1.75 in. square panel with a test surface area of 3.06 in.2 (19.76 cm2).
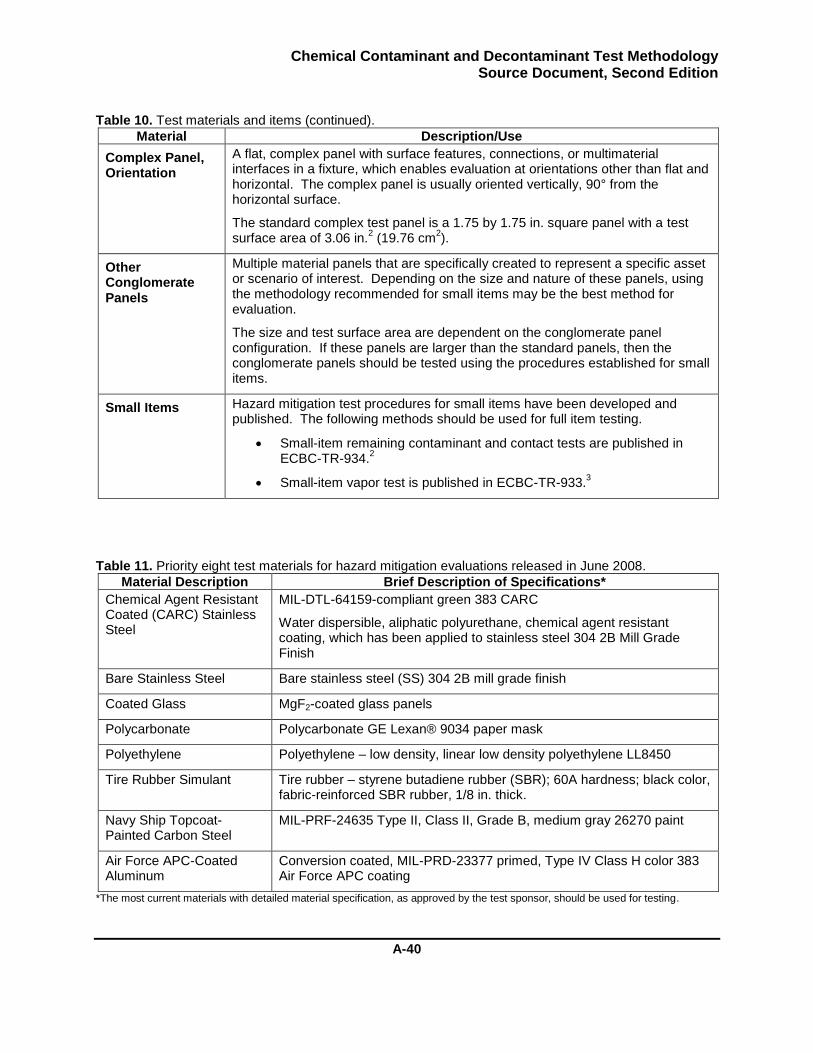
Chemical Contaminant and Decontaminant Test Methodology Source Document, Second Edition
A-40
Table 10. Test materials and items (continued).
Material Description/Use
Complex Panel, Orientation
A flat, complex panel with surface features, connections, or multimaterial interfaces in a fixture, which enables evaluation at orientations other than flat and horizontal. The complex panel is usually oriented vertically, 90° from the horizontal surface.
The standard complex test panel is a 1.75 by 1.75 in. square panel with a test surface area of 3.06 in.
2 (19.76 cm
2).
Other Conglomerate Panels
Multiple material panels that are specifically created to represent a specific asset or scenario of interest. Depending on the size and nature of these panels, using the methodology recommended for small items may be the best method for evaluation.
The size and test surface area are dependent on the conglomerate panel configuration. If these panels are larger than the standard panels, then the conglomerate panels should be tested using the procedures established for small items.
Small Items Hazard mitigation test procedures for small items have been developed and published. The following methods should be used for full item testing.
Small-item remaining contaminant and contact tests are published in ECBC-TR-934.
2
Small-item vapor test is published in ECBC-TR-933.3
Table 11. Priority eight test materials for hazard mitigation evaluations released in June 2008.
Material Description Brief Description of Specifications*
Chemical Agent Resistant Coated (CARC) Stainless Steel
MIL-DTL-64159-compliant green 383 CARC
Water dispersible, aliphatic polyurethane, chemical agent resistant coating, which has been applied to stainless steel 304 2B Mill Grade Finish
Bare Stainless Steel Bare stainless steel (SS) 304 2B mill grade finish
Coated Glass MgF2-coated glass panels
Polycarbonate Polycarbonate GE Lexan® 9034 paper mask
Polyethylene Polyethylene – low density, linear low density polyethylene LL8450
Tire Rubber Simulant Tire rubber – styrene butadiene rubber (SBR); 60A hardness; black color, fabric-reinforced SBR rubber, 1/8 in. thick.
Navy Ship Topcoat-Painted Carbon Steel
MIL-PRF-24635 Type II, Class II, Grade B, medium gray 26270 paint
Air Force APC-Coated Aluminum
Conversion coated, MIL-PRD-23377 primed, Type IV Class H color 383 Air Force APC coating
*The most current materials with detailed material specification, as approved by the test sponsor, should be used for testing.

Chemical Contaminant and Decontaminant Test Methodology Source Document, Second Edition
A-41
Table 12. Material listings from TOP 8-2-061 released in 2001.
List Materials
A (a) Chemical agent resistant coating (CARC) (tactical vehicles)
(b) Aircraft topcoat paint (aircraft)
(c) Low-infrared (IR) paints (aircraft & ships)
(d) Ship deck anti-skid
(e) Polyurethane, epoxy, and alkyd paints (commercial vehicles)
(f) Aluminum alloy forged and cast (aircraft surfaces & structural members)
(g) Aluminum, oxidized aluminum (vehicle substrate surface)
(h) Stainless and high strength steel alloys (aircraft and engine structural members)
(i) Nickel-based and other superalloys (aircraft and engine structural members)
(j) Carbon/stainless steels (vehicle, munitions substrate surface)
(k) Brass/bronze/copper and nickel alloys (munitions substrate surface)
(l) Composite and laminate materials (aircraft surface and structural members)
(m) Aircraft composites (aircraft)
(n) Tire rubber (aircraft, vehicles)
(o) Polycarbonates/Lexan® (aircraft canopy/window materials, tactical vehicles)
(p) Glass (commercial vehicles, tactical vehicles)
(q) Asphalt (runways and parking areas)
(r) Concrete (runways and parking areas)
(s) Standard tent, soft shelter material
B (a) Joint Service Lightweight Integrated Suit Technology (JSLIST)
(b) Battle dress overgarment
(c) Butyl rubber (mask, gloves/boots)
(d) Silicon rubber (M40 mask)
(e) Cotton, polyester materials (uniform materials)
(f) Collective protection, soft shelter material

Chemical Contaminant and Decontaminant Test Methodology Source Document, Second Edition
A-42
Blank

Chemical Contaminant and Decontaminant Test Methodology Source Document, Second Edition
A-43
Laboratory Materials, Tools, and Equipment
The required materials, tools, and equipment presented in this section include tools for delivering contaminant, maintaining environmental control, and preparing analytical samples. Several options are available, which differ in accuracy and complexity. The appropriate tools and equipment should be selected on the basis of the test requirements and acceptable measurement uncertainty. The equipment listed is based on commercial items with known accuracy, precision, and/or repeatability. Other equipment may be used, but should be evaluated to determine the effect on test measurement uncertainty. All equipment should be calibrated regularly and calibration records must be maintained.
General Laboratory Materials
The materials and small equipment listed in this section are common to all test procedures. The items required for the testing are found in Table 13.
Table 13. General laboratory materials, tools, and equipment used in these procedures.
Material Description/Use
Sample Tray An optional item for the handling and movement of panels during testing.
Decontaminant Bath
Used to collect spent disposable test items (e.g., pipette tips, panels, analytical vials, caps, etc.) in a solution that will neutralize any contaminant left on the item. For most chemical agents, this bath contains a volume of household bleach large enough to allow submersion of the items.
General Laboratory Items
Items may include glassware (vials, flasks, cylinders, bottles, beakers, jars, etc.), paper towels, beakers, pipette bulks, vials, spatulas, parafilm, etc.
Sample-Handling Tools
The tools used to handle samples during testing may include forceps, tweezers, or tongs.
Standard Laboratory Record-Keeping Items
Record-keeping items may include a computer, data test forms, laboratory notebooks, and writing utensils.
Timing Device(s)
The test method requires accurate timing of key steps. Digital timers that report in minutes and seconds are preferred.
Transfer Pipettes
A device used to transfer small volumes of liquid.
Aluminum Foil Aluminum foil is typically used to line the work area and prevent breakthrough from a contaminated to an uncontaminated surface.
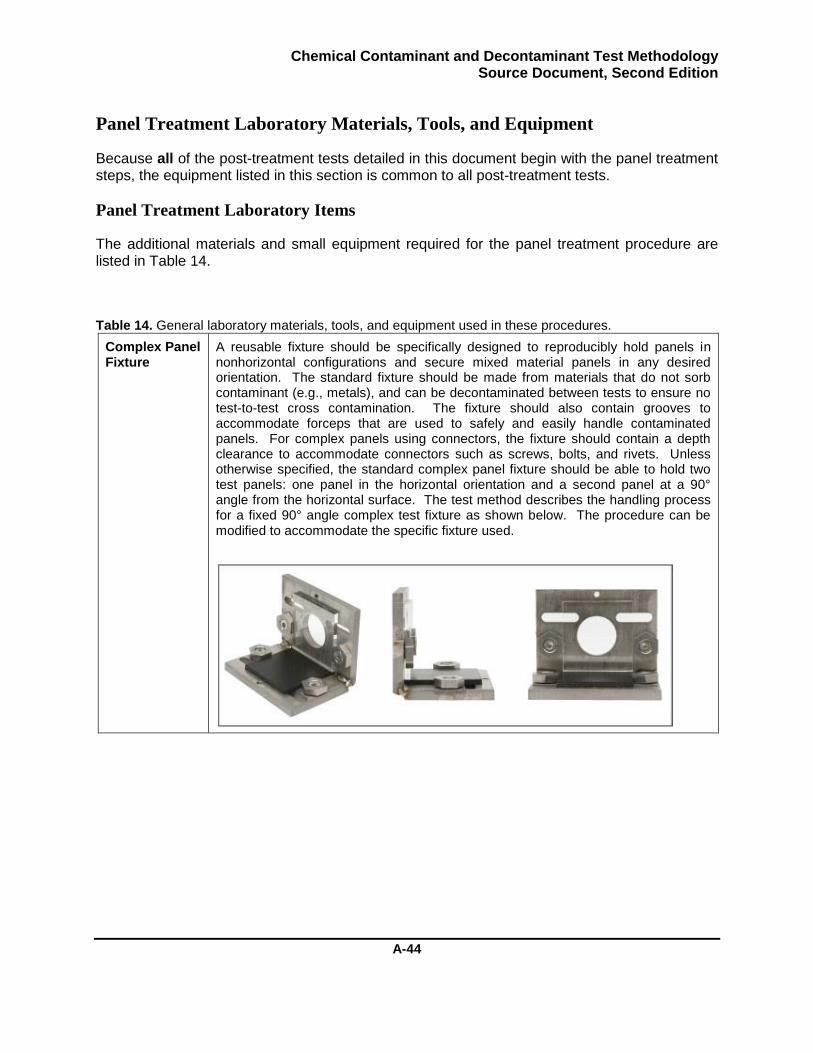
Chemical Contaminant and Decontaminant Test Methodology Source Document, Second Edition
A-44
Panel Treatment Laboratory Materials, Tools, and Equipment
Because all of the post-treatment tests detailed in this document begin with the panel treatment steps, the equipment listed in this section is common to all post-treatment tests.
Panel Treatment Laboratory Items
The additional materials and small equipment required for the panel treatment procedure are listed in Table 14.
Table 14. General laboratory materials, tools, and equipment used in these procedures.
Complex Panel Fixture
A reusable fixture should be specifically designed to reproducibly hold panels in nonhorizontal configurations and secure mixed material panels in any desired orientation. The standard fixture should be made from materials that do not sorb contaminant (e.g., metals), and can be decontaminated between tests to ensure no test-to-test cross contamination. The fixture should also contain grooves to accommodate forceps that are used to safely and easily handle contaminated panels. For complex panels using connectors, the fixture should contain a depth clearance to accommodate connectors such as screws, bolts, and rivets. Unless otherwise specified, the standard complex panel fixture should be able to hold two test panels: one panel in the horizontal orientation and a second panel at a 90° angle from the horizontal surface. The test method describes the handling process for a fixed 90° angle complex test fixture as shown below. The procedure can be modified to accommodate the specific fixture used.
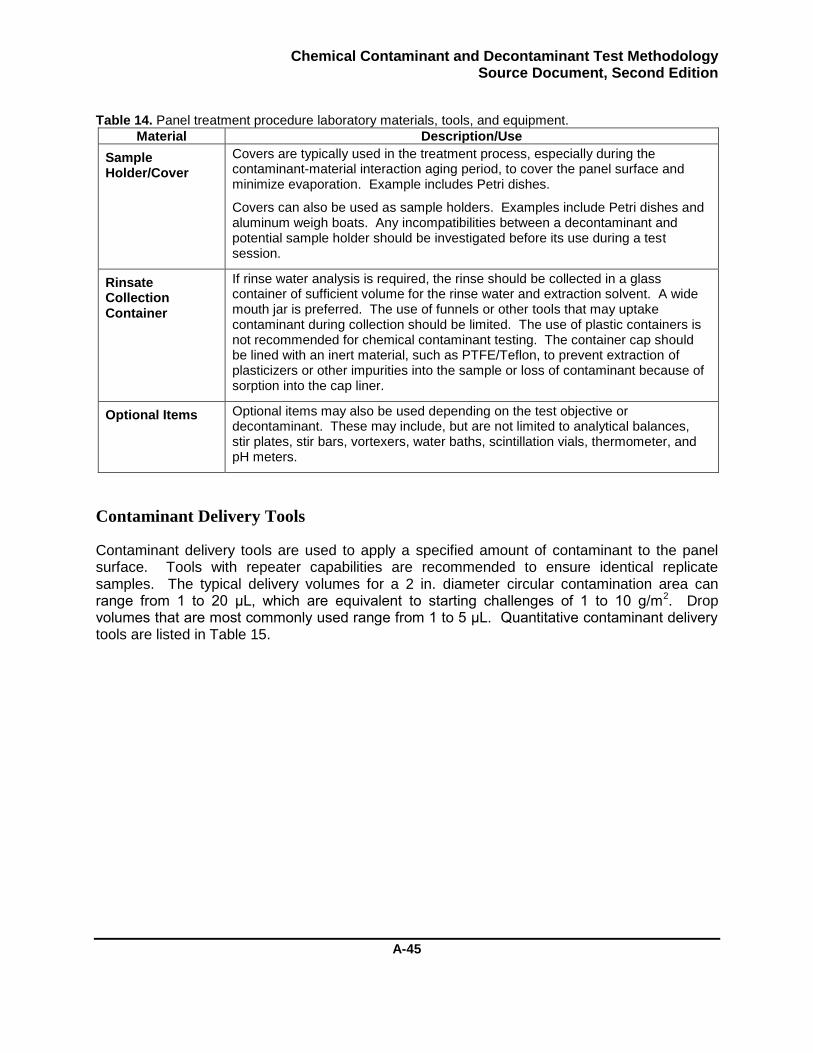
Chemical Contaminant and Decontaminant Test Methodology Source Document, Second Edition
A-45
Table 14. Panel treatment procedure laboratory materials, tools, and equipment.
Material Description/Use
Sample Holder/Cover
Covers are typically used in the treatment process, especially during the contaminant-material interaction aging period, to cover the panel surface and minimize evaporation. Example includes Petri dishes.
Covers can also be used as sample holders. Examples include Petri dishes and aluminum weigh boats. Any incompatibilities between a decontaminant and potential sample holder should be investigated before its use during a test session.
Rinsate Collection Container
If rinse water analysis is required, the rinse should be collected in a glass container of sufficient volume for the rinse water and extraction solvent. A wide mouth jar is preferred. The use of funnels or other tools that may uptake contaminant during collection should be limited. The use of plastic containers is not recommended for chemical contaminant testing. The container cap should be lined with an inert material, such as PTFE/Teflon, to prevent extraction of plasticizers or other impurities into the sample or loss of contaminant because of sorption into the cap liner.
Optional Items Optional items may also be used depending on the test objective or decontaminant. These may include, but are not limited to analytical balances, stir plates, stir bars, vortexers, water baths, scintillation vials, thermometer, and pH meters.
Contaminant Delivery Tools
Contaminant delivery tools are used to apply a specified amount of contaminant to the panel surface. Tools with repeater capabilities are recommended to ensure identical replicate samples. The typical delivery volumes for a 2 in. diameter circular contamination area can range from 1 to 20 μL, which are equivalent to starting challenges of 1 to 10 g/m2. Drop volumes that are most commonly used range from 1 to 5 μL. Quantitative contaminant delivery tools are listed in Table 15.
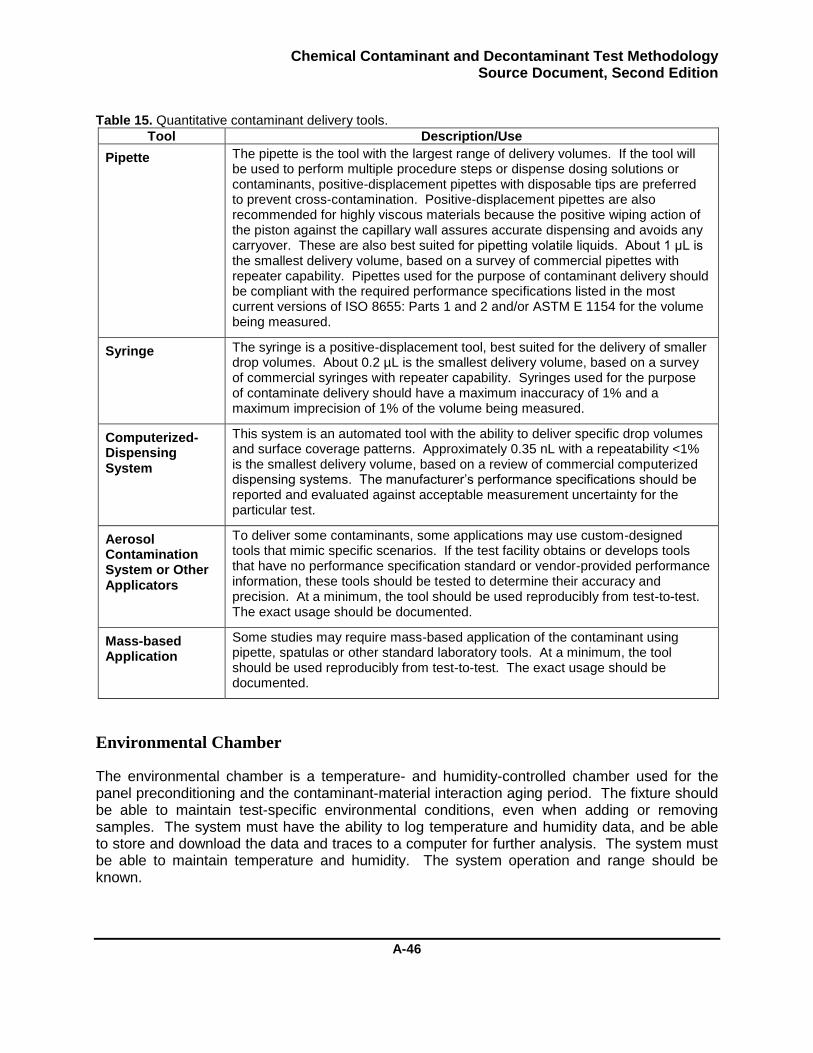
Chemical Contaminant and Decontaminant Test Methodology Source Document, Second Edition
A-46
Table 15. Quantitative contaminant delivery tools.
Tool Description/Use
Pipette The pipette is the tool with the largest range of delivery volumes. If the tool will be used to perform multiple procedure steps or dispense dosing solutions or contaminants, positive-displacement pipettes with disposable tips are preferred to prevent cross-contamination. Positive-displacement pipettes are also recommended for highly viscous materials because the positive wiping action of the piston against the capillary wall assures accurate dispensing and avoids any carryover. These are also best suited for pipetting volatile liquids. About 1 μL is the smallest delivery volume, based on a survey of commercial pipettes with repeater capability. Pipettes used for the purpose of contaminant delivery should be compliant with the required performance specifications listed in the most current versions of ISO 8655: Parts 1 and 2 and/or ASTM E 1154 for the volume being measured.
Syringe The syringe is a positive-displacement tool, best suited for the delivery of smaller drop volumes. About 0.2 µL is the smallest delivery volume, based on a survey of commercial syringes with repeater capability. Syringes used for the purpose of contaminate delivery should have a maximum inaccuracy of 1% and a maximum imprecision of 1% of the volume being measured.
Computerized-Dispensing System
This system is an automated tool with the ability to deliver specific drop volumes and surface coverage patterns. Approximately 0.35 nL with a repeatability <1% is the smallest delivery volume, based on a review of commercial computerized dispensing systems. The manufacturer’s performance specifications should be reported and evaluated against acceptable measurement uncertainty for the particular test.
Aerosol Contamination System or Other Applicators
To deliver some contaminants, some applications may use custom-designed tools that mimic specific scenarios. If the test facility obtains or develops tools that have no performance specification standard or vendor-provided performance information, these tools should be tested to determine their accuracy and precision. At a minimum, the tool should be used reproducibly from test-to-test. The exact usage should be documented.
Mass-based Application
Some studies may require mass-based application of the contaminant using pipette, spatulas or other standard laboratory tools. At a minimum, the tool should be used reproducibly from test-to-test. The exact usage should be documented.
Environmental Chamber
The environmental chamber is a temperature- and humidity-controlled chamber used for the panel preconditioning and the contaminant-material interaction aging period. The fixture should be able to maintain test-specific environmental conditions, even when adding or removing samples. The system must have the ability to log temperature and humidity data, and be able to store and download the data and traces to a computer for further analysis. The system must be able to maintain temperature and humidity. The system operation and range should be known.

Chemical Contaminant and Decontaminant Test Methodology Source Document, Second Edition
A-47
Contaminated Area Measurement
To visually capture the contamination surface area coverage after contamination, after the contaminant-material interaction aging period, or after any other critical steps in the decontamination process, use a fixed-site (i.e., not hand-held) photographic setup. The minimum recommended photographic resolution is 9 pixels per droplet for the surface area calculation. Appropriate tools include a digital camera on a fixed stand or an automated imaging station, which should both meet the photographic resolution requirement.
Image calibration may be achieved for fixed-site photographic setup using a calibration target such as Max-Levy autograph dot target (DA040), which has 1.000, 0.750, and 0.500 in. diameter circular targets that are accurate to ±1 μm.
Pre- and Post-Rinse Delivery Tools
To remove contaminant and/or decontaminant, use a water rinse delivery tool to apply specific volumes of water to the panel surface. A repeater tool is recommended because multiple panel replicates are typically performed in each test. The chosen tool should have the recommended ability to control flow rate in order to reduce operator-to-operator variations. The typical delivery volume for a 2 in. diameter circular contamination area range is 60 mL. Rinse tools are listed in Table 16.
Table 16. Pre- and post-rinse delivery tools.
Tool Description/Use
Bottle-Top Dispenser
These tools are precision liquid dispensers that can be connected to solvent and rinse water bottles, and are available in different configurations, depending on the liquid to be dispensed. A tool for dispensing organic solvents should be used. Bottle-top dispensers to be used for solvent delivery should be compliant with the required performance specifications listed in the most current versions of ISO 8655: Parts 1 and 5, and/or ASTM E 1154 for the volume being measured. (Examples: Dispensette and Brinkman brands.)
Pump Pumps can include other precision liquid-dispensing systems. The manufacturer’s performance specifications should be reported and evaluated against acceptable measurement uncertainty for the particular test. If the test facility obtains or develops tools that have no performance specification standard or vendor-provided performance information, these tools should be tested to determine their accuracy and precision. At a minimum, the tool should be used reproducibly from test-to-test and the exact usage should be documented.
Pump (continued)
An acceptable performance range should be defined for any pump, and a method of documentation, such as performance charts, should be implemented. Performance charts are graphs that are used when a tool or instrument has a defined and fixed acceptable performance range. Once the performance range has been defined, evaluate the pump prior to each test and record the results then compare them to the acceptable performance range.
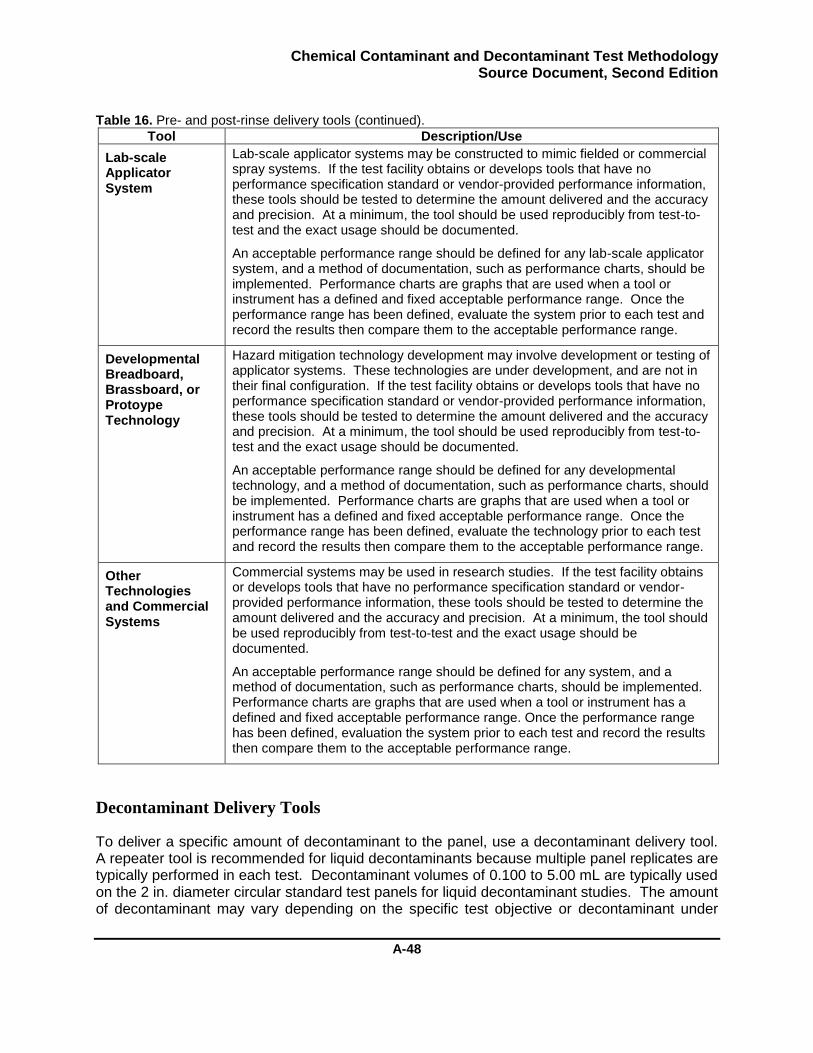
Chemical Contaminant and Decontaminant Test Methodology Source Document, Second Edition
A-48
Table 16. Pre- and post-rinse delivery tools (continued).
Tool Description/Use
Lab-scale Applicator System
Lab-scale applicator systems may be constructed to mimic fielded or commercial spray systems. If the test facility obtains or develops tools that have no performance specification standard or vendor-provided performance information, these tools should be tested to determine the amount delivered and the accuracy and precision. At a minimum, the tool should be used reproducibly from test-to-test and the exact usage should be documented.
An acceptable performance range should be defined for any lab-scale applicator system, and a method of documentation, such as performance charts, should be implemented. Performance charts are graphs that are used when a tool or instrument has a defined and fixed acceptable performance range. Once the performance range has been defined, evaluate the system prior to each test and record the results then compare them to the acceptable performance range.
Developmental Breadboard, Brassboard, or Protoype Technology
Hazard mitigation technology development may involve development or testing of applicator systems. These technologies are under development, and are not in their final configuration. If the test facility obtains or develops tools that have no performance specification standard or vendor-provided performance information, these tools should be tested to determine the amount delivered and the accuracy and precision. At a minimum, the tool should be used reproducibly from test-to-test and the exact usage should be documented.
An acceptable performance range should be defined for any developmental technology, and a method of documentation, such as performance charts, should be implemented. Performance charts are graphs that are used when a tool or instrument has a defined and fixed acceptable performance range. Once the performance range has been defined, evaluate the technology prior to each test and record the results then compare them to the acceptable performance range.
Other Technologies and Commercial Systems
Commercial systems may be used in research studies. If the test facility obtains or develops tools that have no performance specification standard or vendor-provided performance information, these tools should be tested to determine the amount delivered and the accuracy and precision. At a minimum, the tool should be used reproducibly from test-to-test and the exact usage should be documented.
An acceptable performance range should be defined for any system, and a method of documentation, such as performance charts, should be implemented. Performance charts are graphs that are used when a tool or instrument has a defined and fixed acceptable performance range. Once the performance range has been defined, evaluation the system prior to each test and record the results then compare them to the acceptable performance range.
Decontaminant Delivery Tools
To deliver a specific amount of decontaminant to the panel, use a decontaminant delivery tool. A repeater tool is recommended for liquid decontaminants because multiple panel replicates are typically performed in each test. Decontaminant volumes of 0.100 to 5.00 mL are typically used on the 2 in. diameter circular standard test panels for liquid decontaminant studies. The amount of decontaminant may vary depending on the specific test objective or decontaminant under
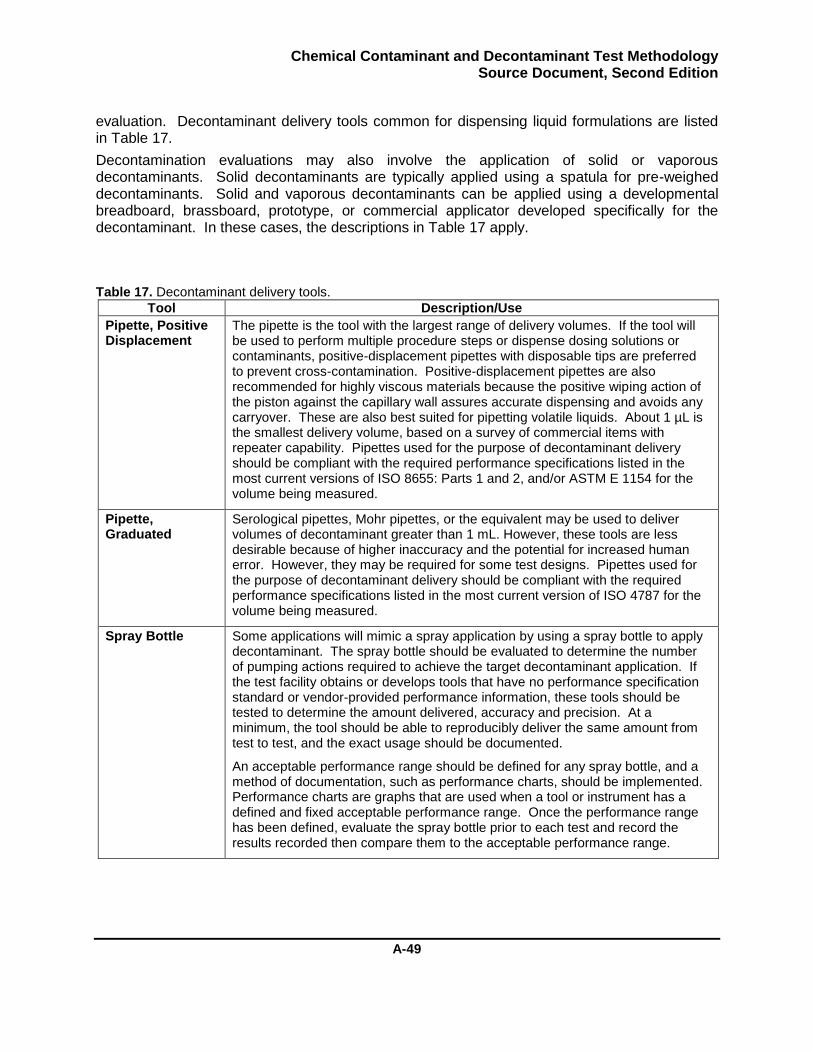
Chemical Contaminant and Decontaminant Test Methodology Source Document, Second Edition
A-49
evaluation. Decontaminant delivery tools common for dispensing liquid formulations are listed in Table 17.
Decontamination evaluations may also involve the application of solid or vaporous decontaminants. Solid decontaminants are typically applied using a spatula for pre-weighed decontaminants. Solid and vaporous decontaminants can be applied using a developmental breadboard, brassboard, prototype, or commercial applicator developed specifically for the decontaminant. In these cases, the descriptions in Table 17 apply.
Table 17. Decontaminant delivery tools.
Tool Description/Use
Pipette, Positive Displacement
The pipette is the tool with the largest range of delivery volumes. If the tool will be used to perform multiple procedure steps or dispense dosing solutions or contaminants, positive-displacement pipettes with disposable tips are preferred to prevent cross-contamination. Positive-displacement pipettes are also recommended for highly viscous materials because the positive wiping action of the piston against the capillary wall assures accurate dispensing and avoids any carryover. These are also best suited for pipetting volatile liquids. About 1 µL is the smallest delivery volume, based on a survey of commercial items with repeater capability. Pipettes used for the purpose of decontaminant delivery should be compliant with the required performance specifications listed in the most current versions of ISO 8655: Parts 1 and 2, and/or ASTM E 1154 for the volume being measured.
Pipette, Graduated
Serological pipettes, Mohr pipettes, or the equivalent may be used to deliver volumes of decontaminant greater than 1 mL. However, these tools are less desirable because of higher inaccuracy and the potential for increased human error. However, they may be required for some test designs. Pipettes used for the purpose of decontaminant delivery should be compliant with the required performance specifications listed in the most current version of ISO 4787 for the volume being measured.
Spray Bottle Some applications will mimic a spray application by using a spray bottle to apply decontaminant. The spray bottle should be evaluated to determine the number of pumping actions required to achieve the target decontaminant application. If the test facility obtains or develops tools that have no performance specification standard or vendor-provided performance information, these tools should be tested to determine the amount delivered, accuracy and precision. At a minimum, the tool should be able to reproducibly deliver the same amount from test to test, and the exact usage should be documented.
An acceptable performance range should be defined for any spray bottle, and a method of documentation, such as performance charts, should be implemented. Performance charts are graphs that are used when a tool or instrument has a defined and fixed acceptable performance range. Once the performance range has been defined, evaluate the spray bottle prior to each test and record the results recorded then compare them to the acceptable performance range.
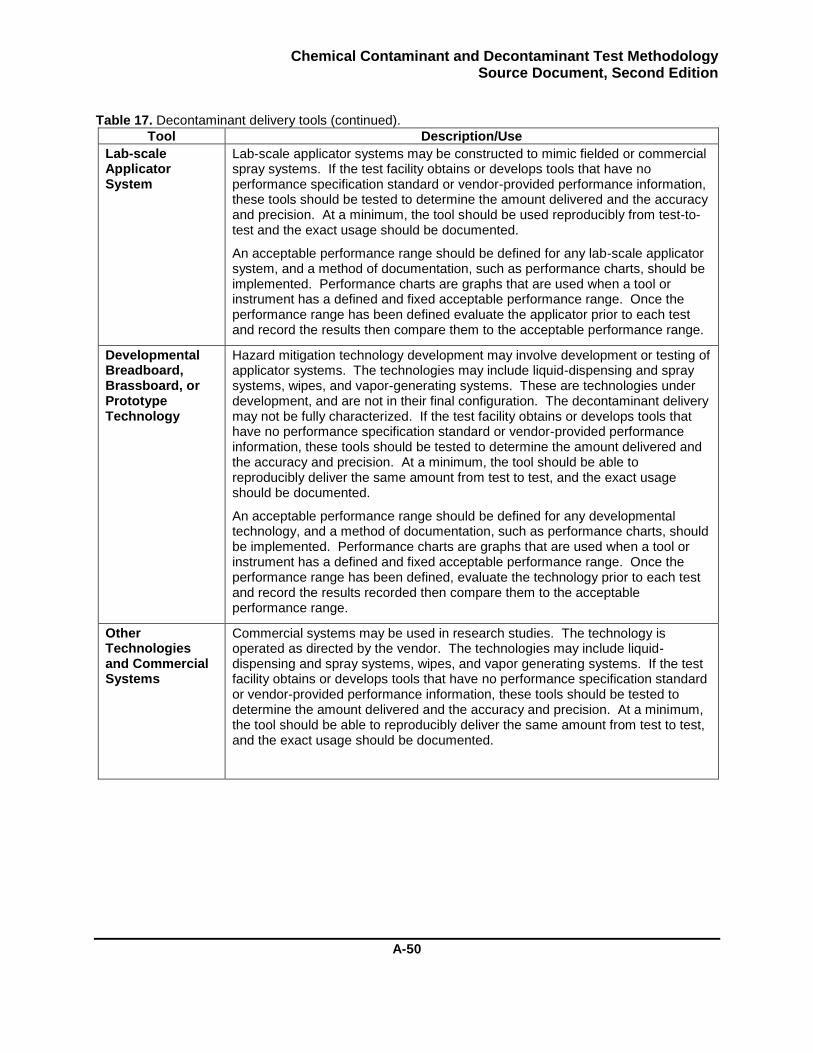
Chemical Contaminant and Decontaminant Test Methodology Source Document, Second Edition
A-50
Table 17. Decontaminant delivery tools (continued).
Tool Description/Use
Lab-scale Applicator System
Lab-scale applicator systems may be constructed to mimic fielded or commercial spray systems. If the test facility obtains or develops tools that have no performance specification standard or vendor-provided performance information, these tools should be tested to determine the amount delivered and the accuracy and precision. At a minimum, the tool should be used reproducibly from test-to-test and the exact usage should be documented.
An acceptable performance range should be defined for any lab-scale applicator system, and a method of documentation, such as performance charts, should be implemented. Performance charts are graphs that are used when a tool or instrument has a defined and fixed acceptable performance range. Once the performance range has been defined evaluate the applicator prior to each test and record the results then compare them to the acceptable performance range.
Developmental Breadboard, Brassboard, or Prototype Technology
Hazard mitigation technology development may involve development or testing of applicator systems. The technologies may include liquid-dispensing and spray systems, wipes, and vapor-generating systems. These are technologies under development, and are not in their final configuration. The decontaminant delivery may not be fully characterized. If the test facility obtains or develops tools that have no performance specification standard or vendor-provided performance information, these tools should be tested to determine the amount delivered and the accuracy and precision. At a minimum, the tool should be able to reproducibly deliver the same amount from test to test, and the exact usage should be documented.
An acceptable performance range should be defined for any developmental technology, and a method of documentation, such as performance charts, should be implemented. Performance charts are graphs that are used when a tool or instrument has a defined and fixed acceptable performance range. Once the performance range has been defined, evaluate the technology prior to each test and record the results recorded then compare them to the acceptable performance range.
Other Technologies and Commercial Systems
Commercial systems may be used in research studies. The technology is operated as directed by the vendor. The technologies may include liquid-dispensing and spray systems, wipes, and vapor generating systems. If the test facility obtains or develops tools that have no performance specification standard or vendor-provided performance information, these tools should be tested to determine the amount delivered and the accuracy and precision. At a minimum, the tool should be able to reproducibly deliver the same amount from test to test, and the exact usage should be documented.
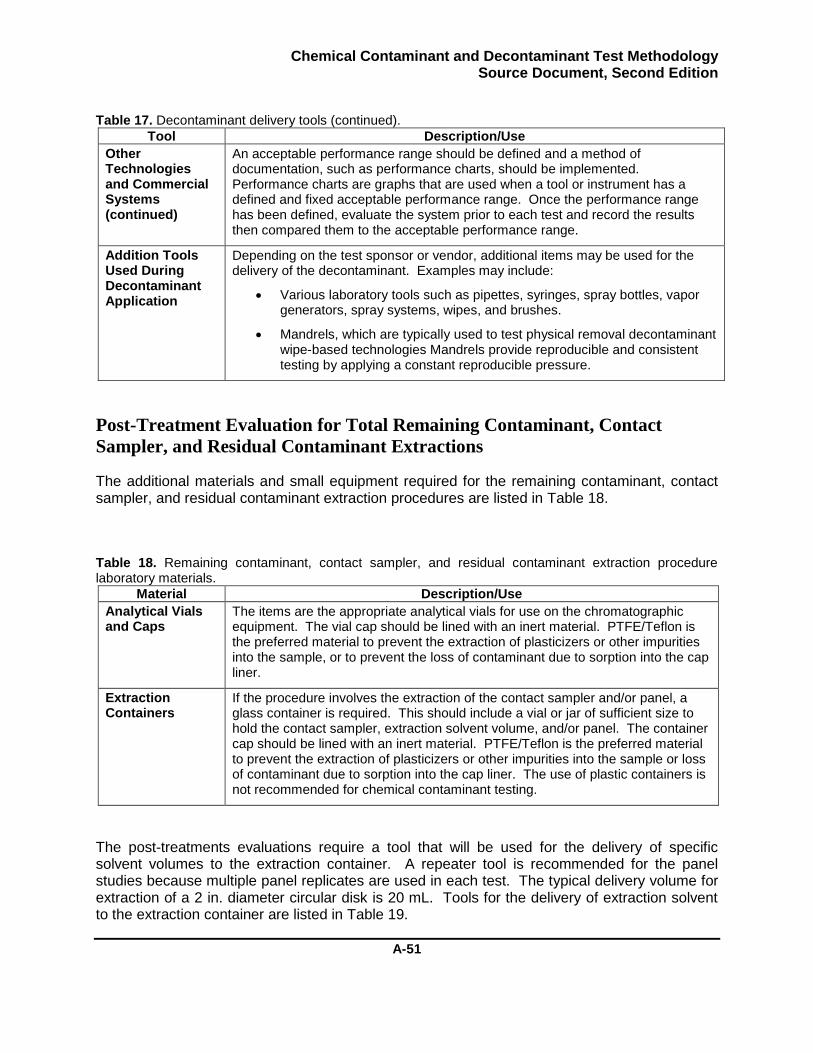
Chemical Contaminant and Decontaminant Test Methodology Source Document, Second Edition
A-51
Table 17. Decontaminant delivery tools (continued).
Tool Description/Use
Other Technologies and Commercial Systems (continued)
An acceptable performance range should be defined and a method of documentation, such as performance charts, should be implemented. Performance charts are graphs that are used when a tool or instrument has a defined and fixed acceptable performance range. Once the performance range has been defined, evaluate the system prior to each test and record the results then compared them to the acceptable performance range.
Addition Tools Used During Decontaminant Application
Depending on the test sponsor or vendor, additional items may be used for the delivery of the decontaminant. Examples may include:
Various laboratory tools such as pipettes, syringes, spray bottles, vapor generators, spray systems, wipes, and brushes.
Mandrels, which are typically used to test physical removal decontaminant wipe-based technologies Mandrels provide reproducible and consistent testing by applying a constant reproducible pressure.
Post-Treatment Evaluation for Total Remaining Contaminant, Contact
Sampler, and Residual Contaminant Extractions
The additional materials and small equipment required for the remaining contaminant, contact sampler, and residual contaminant extraction procedures are listed in Table 18.
Table 18. Remaining contaminant, contact sampler, and residual contaminant extraction procedure laboratory materials.
Material Description/Use
Analytical Vials and Caps
The items are the appropriate analytical vials for use on the chromatographic equipment. The vial cap should be lined with an inert material. PTFE/Teflon is the preferred material to prevent the extraction of plasticizers or other impurities into the sample, or to prevent the loss of contaminant due to sorption into the cap liner.
Extraction Containers
If the procedure involves the extraction of the contact sampler and/or panel, a glass container is required. This should include a vial or jar of sufficient size to hold the contact sampler, extraction solvent volume, and/or panel. The container cap should be lined with an inert material. PTFE/Teflon is the preferred material to prevent the extraction of plasticizers or other impurities into the sample or loss of contaminant due to sorption into the cap liner. The use of plastic containers is not recommended for chemical contaminant testing.
The post-treatments evaluations require a tool that will be used for the delivery of specific solvent volumes to the extraction container. A repeater tool is recommended for the panel studies because multiple panel replicates are used in each test. The typical delivery volume for extraction of a 2 in. diameter circular disk is 20 mL. Tools for the delivery of extraction solvent to the extraction container are listed in Table 19.
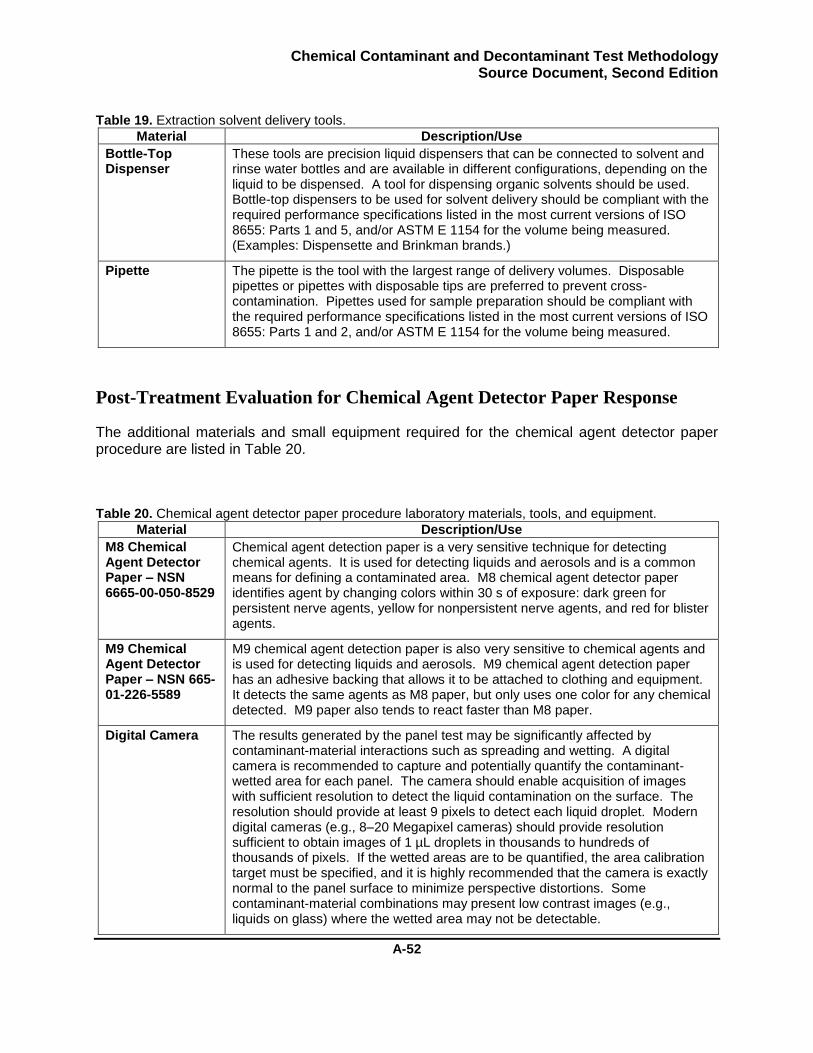
Chemical Contaminant and Decontaminant Test Methodology Source Document, Second Edition
A-52
Table 19. Extraction solvent delivery tools.
Material Description/Use
Bottle-Top Dispenser
These tools are precision liquid dispensers that can be connected to solvent and rinse water bottles and are available in different configurations, depending on the liquid to be dispensed. A tool for dispensing organic solvents should be used. Bottle-top dispensers to be used for solvent delivery should be compliant with the required performance specifications listed in the most current versions of ISO 8655: Parts 1 and 5, and/or ASTM E 1154 for the volume being measured. (Examples: Dispensette and Brinkman brands.)
Pipette The pipette is the tool with the largest range of delivery volumes. Disposable pipettes or pipettes with disposable tips are preferred to prevent cross-contamination. Pipettes used for sample preparation should be compliant with the required performance specifications listed in the most current versions of ISO 8655: Parts 1 and 2, and/or ASTM E 1154 for the volume being measured.
Post-Treatment Evaluation for Chemical Agent Detector Paper Response
The additional materials and small equipment required for the chemical agent detector paper procedure are listed in Table 20.
Table 20. Chemical agent detector paper procedure laboratory materials, tools, and equipment.
Material Description/Use
M8 Chemical Agent Detector Paper – NSN 6665-00-050-8529
Chemical agent detection paper is a very sensitive technique for detecting chemical agents. It is used for detecting liquids and aerosols and is a common means for defining a contaminated area. M8 chemical agent detector paper identifies agent by changing colors within 30 s of exposure: dark green for persistent nerve agents, yellow for nonpersistent nerve agents, and red for blister agents.
M9 Chemical Agent Detector Paper – NSN 665-01-226-5589
M9 chemical agent detection paper is also very sensitive to chemical agents and is used for detecting liquids and aerosols. M9 chemical agent detection paper has an adhesive backing that allows it to be attached to clothing and equipment. It detects the same agents as M8 paper, but only uses one color for any chemical detected. M9 paper also tends to react faster than M8 paper.
Digital Camera The results generated by the panel test may be significantly affected by contaminant-material interactions such as spreading and wetting. A digital camera is recommended to capture and potentially quantify the contaminant-wetted area for each panel. The camera should enable acquisition of images with sufficient resolution to detect the liquid contamination on the surface. The resolution should provide at least 9 pixels to detect each liquid droplet. Modern digital cameras (e.g., 8–20 Megapixel cameras) should provide resolution sufficient to obtain images of 1 µL droplets in thousands to hundreds of thousands of pixels. If the wetted areas are to be quantified, the area calibration target must be specified, and it is highly recommended that the camera is exactly normal to the panel surface to minimize perspective distortions. Some contaminant-material combinations may present low contrast images (e.g., liquids on glass) where the wetted area may not be detectable.
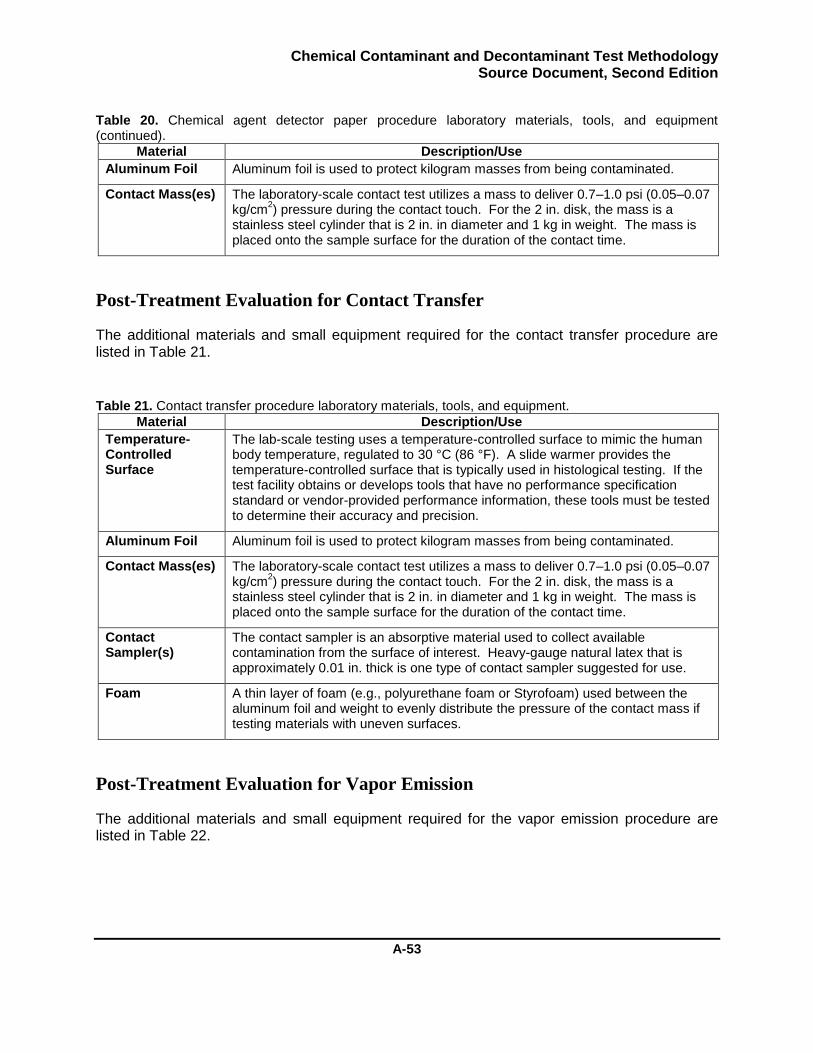
Chemical Contaminant and Decontaminant Test Methodology Source Document, Second Edition
A-53
Table 20. Chemical agent detector paper procedure laboratory materials, tools, and equipment (continued).
Material Description/Use
Aluminum Foil Aluminum foil is used to protect kilogram masses from being contaminated.
Contact Mass(es) The laboratory-scale contact test utilizes a mass to deliver 0.7–1.0 psi (0.05–0.07 kg/cm
2) pressure during the contact touch. For the 2 in. disk, the mass is a
stainless steel cylinder that is 2 in. in diameter and 1 kg in weight. The mass is placed onto the sample surface for the duration of the contact time.
Post-Treatment Evaluation for Contact Transfer
The additional materials and small equipment required for the contact transfer procedure are listed in Table 21.
Table 21. Contact transfer procedure laboratory materials, tools, and equipment.
Material Description/Use
Temperature- Controlled Surface
The lab-scale testing uses a temperature-controlled surface to mimic the human body temperature, regulated to 30 °C (86 °F). A slide warmer provides the temperature-controlled surface that is typically used in histological testing. If the test facility obtains or develops tools that have no performance specification standard or vendor-provided performance information, these tools must be tested to determine their accuracy and precision.
Aluminum Foil Aluminum foil is used to protect kilogram masses from being contaminated.
Contact Mass(es) The laboratory-scale contact test utilizes a mass to deliver 0.7–1.0 psi (0.05–0.07 kg/cm
2) pressure during the contact touch. For the 2 in. disk, the mass is a
stainless steel cylinder that is 2 in. in diameter and 1 kg in weight. The mass is placed onto the sample surface for the duration of the contact time.
Contact Sampler(s)
The contact sampler is an absorptive material used to collect available contamination from the surface of interest. Heavy-gauge natural latex that is approximately 0.01 in. thick is one type of contact sampler suggested for use.
Foam A thin layer of foam (e.g., polyurethane foam or Styrofoam) used between the aluminum foil and weight to evenly distribute the pressure of the contact mass if testing materials with uneven surfaces.
Post-Treatment Evaluation for Vapor Emission
The additional materials and small equipment required for the vapor emission procedure are listed in Table 22.
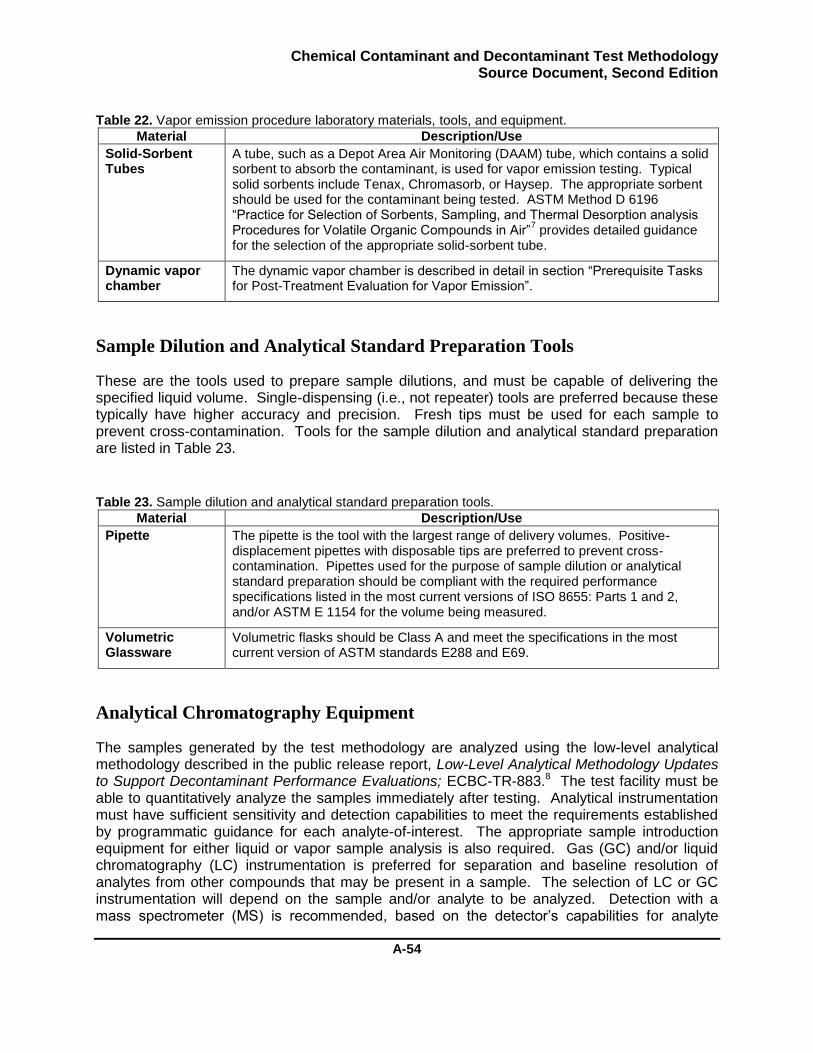
Chemical Contaminant and Decontaminant Test Methodology Source Document, Second Edition
A-54
Table 22. Vapor emission procedure laboratory materials, tools, and equipment.
Material Description/Use
Solid-Sorbent Tubes
A tube, such as a Depot Area Air Monitoring (DAAM) tube, which contains a solid sorbent to absorb the contaminant, is used for vapor emission testing. Typical solid sorbents include Tenax, Chromasorb, or Haysep. The appropriate sorbent should be used for the contaminant being tested. ASTM Method D 6196 “Practice for Selection of Sorbents, Sampling, and Thermal Desorption analysis Procedures for Volatile Organic Compounds in Air”
7 provides detailed guidance
for the selection of the appropriate solid-sorbent tube.
Dynamic vapor chamber
The dynamic vapor chamber is described in detail in section “Prerequisite Tasks for Post-Treatment Evaluation for Vapor Emission”.
Sample Dilution and Analytical Standard Preparation Tools
These are the tools used to prepare sample dilutions, and must be capable of delivering the specified liquid volume. Single-dispensing (i.e., not repeater) tools are preferred because these typically have higher accuracy and precision. Fresh tips must be used for each sample to prevent cross-contamination. Tools for the sample dilution and analytical standard preparation are listed in Table 23.
Table 23. Sample dilution and analytical standard preparation tools.
Material Description/Use
Pipette The pipette is the tool with the largest range of delivery volumes. Positive-displacement pipettes with disposable tips are preferred to prevent cross-contamination. Pipettes used for the purpose of sample dilution or analytical standard preparation should be compliant with the required performance specifications listed in the most current versions of ISO 8655: Parts 1 and 2, and/or ASTM E 1154 for the volume being measured.
Volumetric Glassware
Volumetric flasks should be Class A and meet the specifications in the most current version of ASTM standards E288 and E69.
Analytical Chromatography Equipment
The samples generated by the test methodology are analyzed using the low-level analytical methodology described in the public release report, Low-Level Analytical Methodology Updates to Support Decontaminant Performance Evaluations; ECBC-TR-883.8 The test facility must be able to quantitatively analyze the samples immediately after testing. Analytical instrumentation must have sufficient sensitivity and detection capabilities to meet the requirements established by programmatic guidance for each analyte-of-interest. The appropriate sample introduction equipment for either liquid or vapor sample analysis is also required. Gas (GC) and/or liquid chromatography (LC) instrumentation is preferred for separation and baseline resolution of analytes from other compounds that may be present in a sample. The selection of LC or GC instrumentation will depend on the sample and/or analyte to be analyzed. Detection with a mass spectrometer (MS) is recommended, based on the detector’s capabilities for analyte
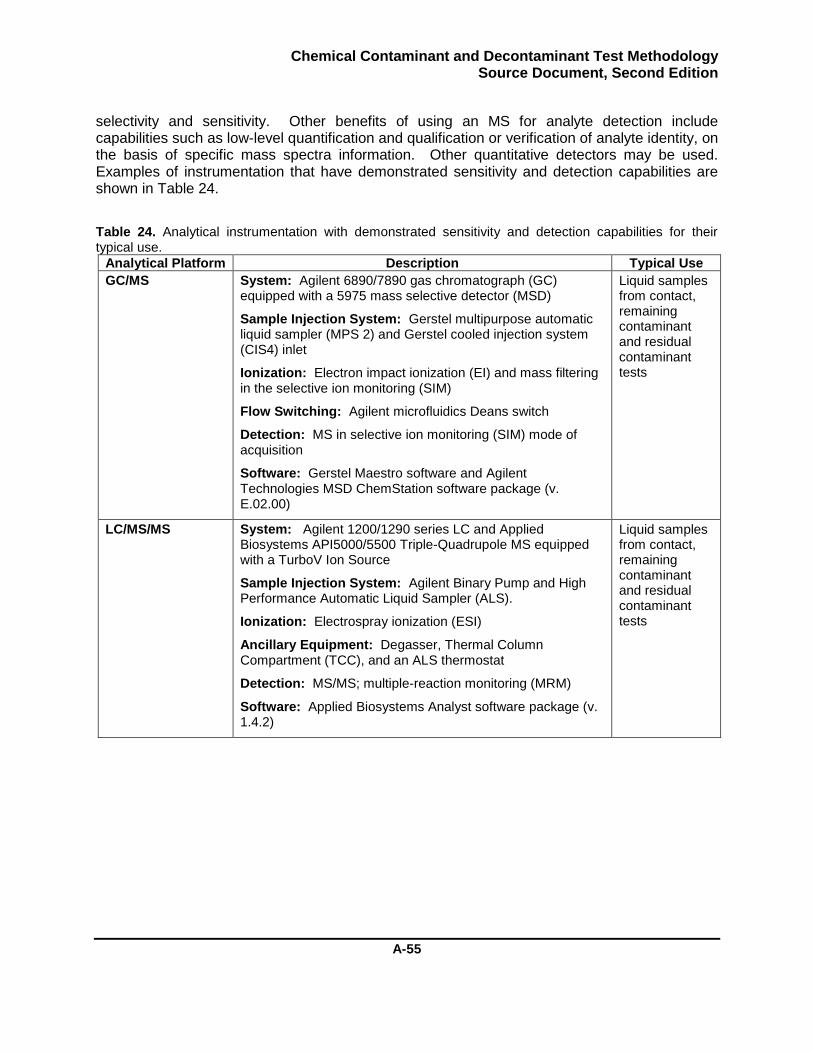
Chemical Contaminant and Decontaminant Test Methodology Source Document, Second Edition
A-55
selectivity and sensitivity. Other benefits of using an MS for analyte detection include capabilities such as low-level quantification and qualification or verification of analyte identity, on the basis of specific mass spectra information. Other quantitative detectors may be used. Examples of instrumentation that have demonstrated sensitivity and detection capabilities are shown in Table 24.
Table 24. Analytical instrumentation with demonstrated sensitivity and detection capabilities for their typical use.
Analytical Platform Description Typical Use
GC/MS System: Agilent 6890/7890 gas chromatograph (GC) equipped with a 5975 mass selective detector (MSD)
Sample Injection System: Gerstel multipurpose automatic liquid sampler (MPS 2) and Gerstel cooled injection system (CIS4) inlet
Ionization: Electron impact ionization (EI) and mass filtering in the selective ion monitoring (SIM)
Flow Switching: Agilent microfluidics Deans switch
Detection: MS in selective ion monitoring (SIM) mode of acquisition
Software: Gerstel Maestro software and Agilent Technologies MSD ChemStation software package (v. E.02.00)
Liquid samples from contact, remaining contaminant and residual contaminant tests
LC/MS/MS System: Agilent 1200/1290 series LC and Applied Biosystems API5000/5500 Triple-Quadrupole MS equipped with a TurboV Ion Source
Sample Injection System: Agilent Binary Pump and High Performance Automatic Liquid Sampler (ALS).
Ionization: Electrospray ionization (ESI)
Ancillary Equipment: Degasser, Thermal Column Compartment (TCC), and an ALS thermostat
Detection: MS/MS; multiple-reaction monitoring (MRM)
Software: Applied Biosystems Analyst software package (v. 1.4.2)
Liquid samples from contact, remaining contaminant and residual contaminant tests
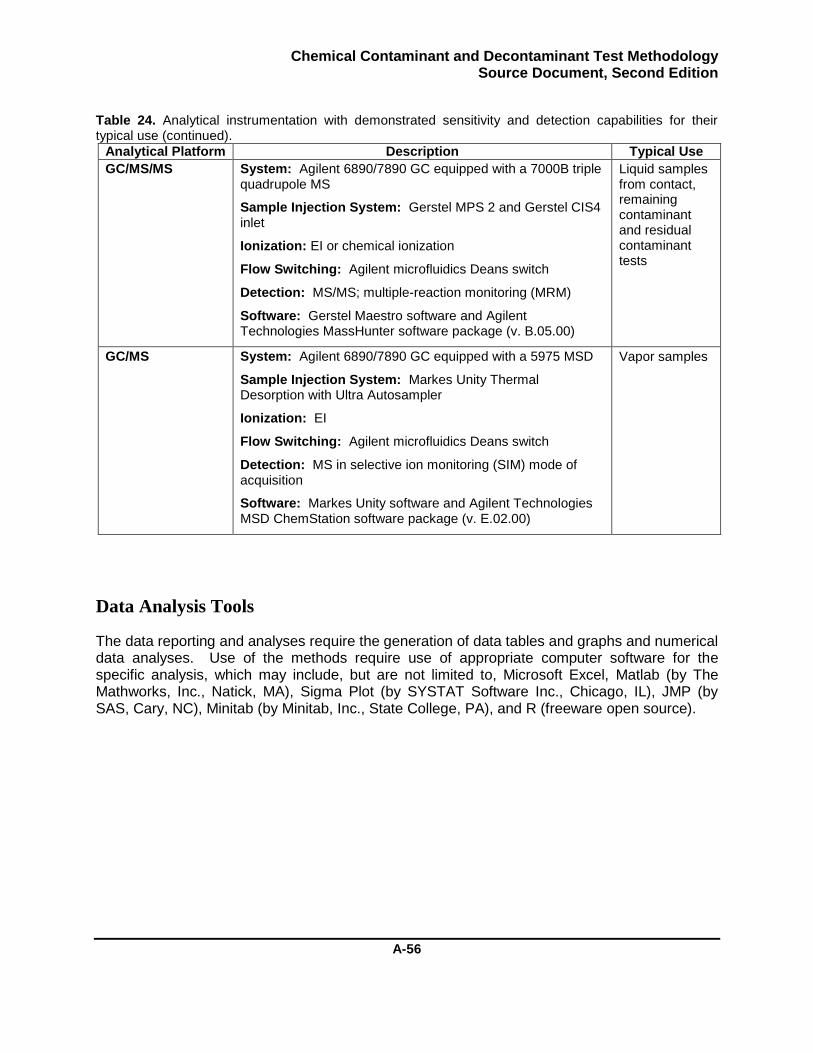
Chemical Contaminant and Decontaminant Test Methodology Source Document, Second Edition
A-56
Table 24. Analytical instrumentation with demonstrated sensitivity and detection capabilities for their typical use (continued).
Analytical Platform Description Typical Use
GC/MS/MS System: Agilent 6890/7890 GC equipped with a 7000B triple quadrupole MS
Sample Injection System: Gerstel MPS 2 and Gerstel CIS4 inlet
Ionization: EI or chemical ionization
Flow Switching: Agilent microfluidics Deans switch
Detection: MS/MS; multiple-reaction monitoring (MRM)
Software: Gerstel Maestro software and Agilent Technologies MassHunter software package (v. B.05.00)
Liquid samples from contact, remaining contaminant and residual contaminant tests
GC/MS System: Agilent 6890/7890 GC equipped with a 5975 MSD
Sample Injection System: Markes Unity Thermal Desorption with Ultra Autosampler
Ionization: EI
Flow Switching: Agilent microfluidics Deans switch
Detection: MS in selective ion monitoring (SIM) mode of acquisition
Software: Markes Unity software and Agilent Technologies MSD ChemStation software package (v. E.02.00)
Vapor samples
Data Analysis Tools
The data reporting and analyses require the generation of data tables and graphs and numerical data analyses. Use of the methods require use of appropriate computer software for the specific analysis, which may include, but are not limited to, Microsoft Excel, Matlab (by The Mathworks, Inc., Natick, MA), Sigma Plot (by SYSTAT Software Inc., Chicago, IL), JMP (by SAS, Cary, NC), Minitab (by Minitab, Inc., State College, PA), and R (freeware open source).
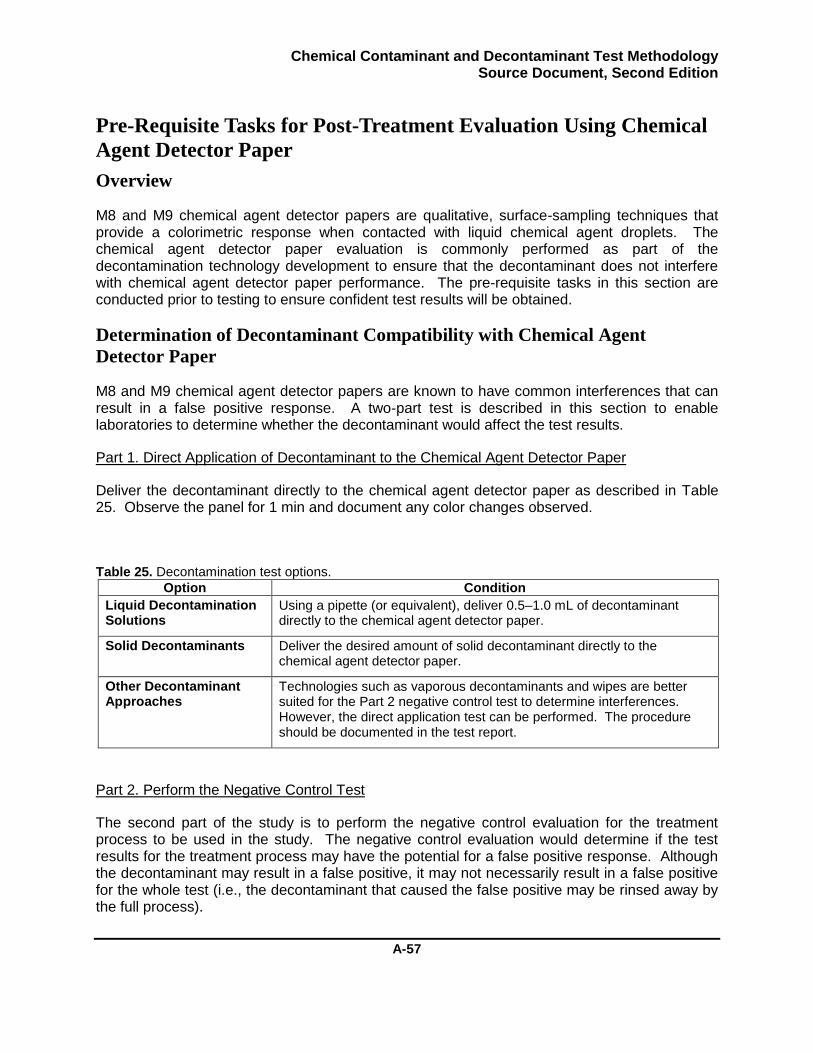
Chemical Contaminant and Decontaminant Test Methodology Source Document, Second Edition
A-57
Pre-Requisite Tasks for Post-Treatment Evaluation Using Chemical
Agent Detector Paper
Overview
M8 and M9 chemical agent detector papers are qualitative, surface-sampling techniques that provide a colorimetric response when contacted with liquid chemical agent droplets. The chemical agent detector paper evaluation is commonly performed as part of the decontamination technology development to ensure that the decontaminant does not interfere with chemical agent detector paper performance. The pre-requisite tasks in this section are conducted prior to testing to ensure confident test results will be obtained.
Determination of Decontaminant Compatibility with Chemical Agent
Detector Paper
M8 and M9 chemical agent detector papers are known to have common interferences that can result in a false positive response. A two-part test is described in this section to enable laboratories to determine whether the decontaminant would affect the test results.
Part 1. Direct Application of Decontaminant to the Chemical Agent Detector Paper
Deliver the decontaminant directly to the chemical agent detector paper as described in Table 25. Observe the panel for 1 min and document any color changes observed.
Table 25. Decontamination test options.
Option Condition
Liquid Decontamination Solutions
Using a pipette (or equivalent), deliver 0.5–1.0 mL of decontaminant directly to the chemical agent detector paper.
Solid Decontaminants Deliver the desired amount of solid decontaminant directly to the chemical agent detector paper.
Other Decontaminant Approaches
Technologies such as vaporous decontaminants and wipes are better suited for the Part 2 negative control test to determine interferences. However, the direct application test can be performed. The procedure should be documented in the test report.
Part 2. Perform the Negative Control Test
The second part of the study is to perform the negative control evaluation for the treatment process to be used in the study. The negative control evaluation would determine if the test results for the treatment process may have the potential for a false positive response. Although the decontaminant may result in a false positive, it may not necessarily result in a false positive for the whole test (i.e., the decontaminant that caused the false positive may be rinsed away by the full process).
Chemical Contaminant and Decontaminant Test Methodology Source Document, Second Edition
A-58
Determination of Chemical Agent Detector Paper Sensitivity to Contaminant
Drop Volumes Used in Testing
Test development should establish whether the chemical agent detector paper responds to the drop volumes used in testing.
Part 1. Direct Application of Contaminant to the Chemical Agent Detector Paper
Using the drop volumes planned for testing, deliver multiple drops of contaminant directly onto the chemical agent detector paper. Apply multiple drops that do not touch, if possible. Observe the detector paper for 1 min then document any color changes observed.
Part 2. Direct Application of Contaminant to a Nonsorptive, Nonspreading Material
Using the drop volume(s) planned for testing, deliver multiple drops of contaminant directly to the panel, making sure that the drops do not touch each other. Perform the post-treatment evaluation for chemical agent detector paper response. Document any color changes observed.
Chemical Contaminant and Decontaminant Test Methodology Source Document, Second Edition
A-59
Prerequisite Tasks for Post-Treatment Evaluation for Vapor
Emission
Overview
The post-treatment evaluation for vapor emission is routinely used to determine the amount of contaminant emitted as vapor after a treatment process. The vapor emission test characterizes the emission of contaminant vapor from a panel. The vapor test is conducted by placing the test panel into a dynamic vapor chamber and collecting vapor samples over a specified time. This prerequisite task provides guidance regarding the dynamic vapor chamber requirements and confident sample collection activities that are required to execute the post-treatment evaluation for the vapor emission procedure.
Dynamic Vapor Chamber
The vapor chamber used should be an enclosed structure of a size sufficient to completely contain the panel/test article, and should meet the requirements detailed in this section. General guidance for vapor chamber construction can be located in ASTM D 5116-06 “Standard Guide for Small-Scale Environmental Chamber Determinations of Organic Emissions from Indoor Materials/Products.”9
A vapor chamber to be used for decontaminant evaluations should have the following characteristics:
The chamber should be constructed of inert materials.
The chamber should ideally run under positive pressure to minimize contamination inside the chamber.
The vapor chamber must have a clean air supply with tight control of the chamber’s airflow rate (±5% minimum).
o Mass flow controllers or mass flow meters are preferred over volumetric flow meters because the volumetric flow meters require standard temperature and pressure (STP) correction.
The chamber should have the ability to measure temperature and humidity. Providing control over the temperature and humidity is ideal.
o Vapor emission is a result of mass transport of contaminant out of the material. Most mass transport processes (e.g., vapor emission) are influenced by temperature and some material-contaminant combinations may be influenced more than others. Usually, higher temperatures increase the vapor pressures and transport/diffusivity rates, which results in higher emissions (and higher vapor concentrations). Choose a temperature for the test that is as close to that of the scenario as reasonable.
The chamber should provide a well-mixed environment. Air mixing: Good air mixing inside the chamber is vital to accurately measure the vapor concentration and calculate the emission rates. Chamber mixing is a function of chamber geometry, item geometry, and internal air velocity. Depending on the size of the chamber, the internal air velocity may be controlled by variable speed fans located inside the chamber. Higher fan speeds usually generate turbulent flow conditions that provide good mixing. If the vapor emission
Chemical Contaminant and Decontaminant Test Methodology Source Document, Second Edition
A-60
mechanism is evaporative, the air velocity may affect emission rates and higher air velocity may produce more emission. For this reason, the air velocity should be balanced so that it is similar to the expected scenario (typical indoor scenarios range from 0.05 to 0.2 cm/s) and provides good mixing.
o Panel testing typically uses small-scale panels, which enable the use of vapor microchambers (chambers with a volume approximately 10-6 m3). These chambers may use single-pass airflow configurations or have very small free air volumes, resulting in very high air change rates (>10 h-1). This chamber configuration tends to provide sufficient mixing.
The volume of the chamber must be known. The volume of the test chamber is inversely proportional to the observed concentration for the evaluation of the same item. Larger chambers will result in lower concentrations (higher/poorer detection limits). The smallest chamber that accommodates the test item should be selected. The chamber must have an exhaust port to enable collection of vapor samples.
The sampling airflow rate must be known.
The chamber must be cleaned between tests.
Determination of Analyte Breakthrough
The determination of analyte breakthrough is a prerequisite task required for “Procedure 6: Post-Treatment Evaluation for Vapor Emission.”
Breakthrough is the result of weak interaction between the analyte and sorbent that, as a function of air volume, temperature, and flow rate, could result in a loss of analyte in the sorbent. When collecting samples for a vapor test, it is extremely important to avoid the use of samples that may experience breakthrough. The use of such samples could result in an underestimation of the vapor concentration (and ultimately lead to underestimating the hazard). Even when strong analyte-sorbent interactions are present, breakthrough can occur as a function of the temperature, airflow rate, and air volume passed through the solid-sorbent tube.
Using the same sampling method, the breakthrough determination procedure should be conducted for each analyte-sorbent pair of interest. It would be best to conduct the test using the harshest conditions (e.g., highest temperature and flow rate) chosen for study. If breakthrough does not occur at the harshest condition, then breakthrough should not occur at the ambient conditions.
This procedure only needs to be repeated when using new analytes, different sorbents, or different sampling methods (e.g., air volume, airflow rate, and higher temperatures). This procedure will identify the Safe Sample Volume (SSV), which indicates the maximum volume of air that should be sampled during an experiment. A single-sample evaluation is presented in this section. Multiple sampling times can be used and the results can be analyzed using linear regression.
Refer to the following documents for detailed background and guidance regarding breakthrough determinations. A general procedure is provided in this section, which is specific to typical decontaminant vapor testing.
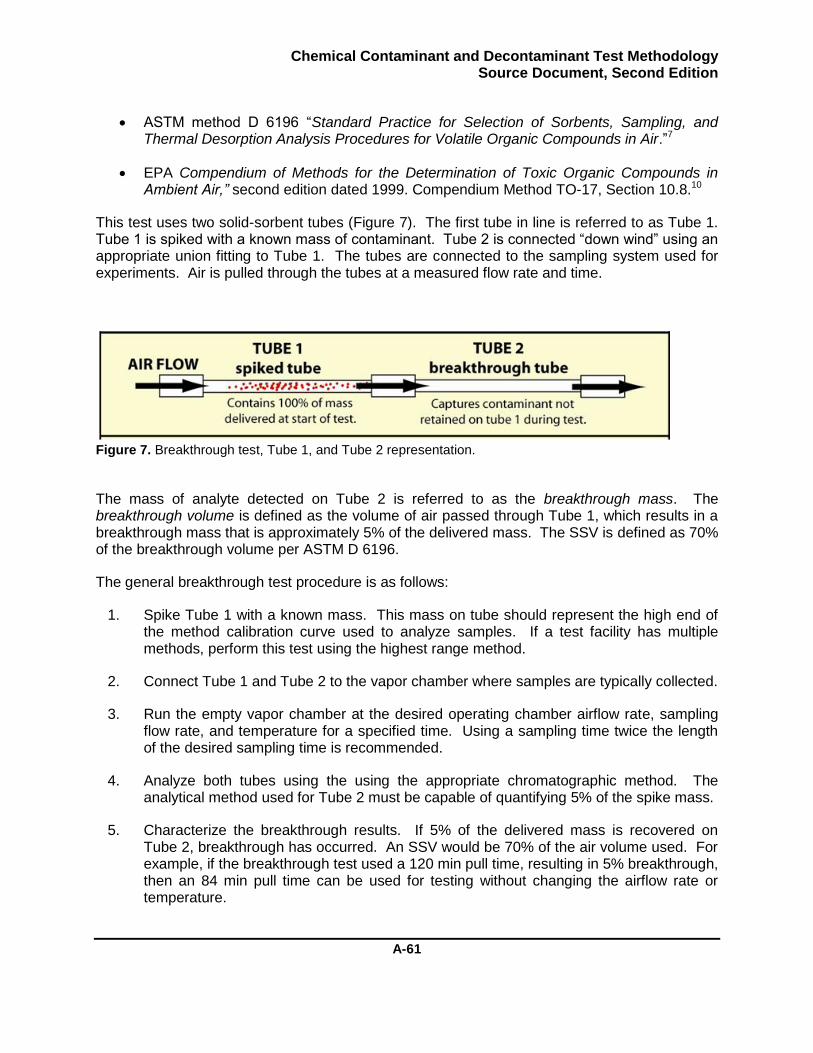
Chemical Contaminant and Decontaminant Test Methodology Source Document, Second Edition
A-61
ASTM method D 6196 “Standard Practice for Selection of Sorbents, Sampling, and Thermal Desorption Analysis Procedures for Volatile Organic Compounds in Air.”7
EPA Compendium of Methods for the Determination of Toxic Organic Compounds in Ambient Air,” second edition dated 1999. Compendium Method TO-17, Section 10.8.10
This test uses two solid-sorbent tubes (Figure 7). The first tube in line is referred to as Tube 1. Tube 1 is spiked with a known mass of contaminant. Tube 2 is connected “down wind” using an appropriate union fitting to Tube 1. The tubes are connected to the sampling system used for experiments. Air is pulled through the tubes at a measured flow rate and time.
Figure 7. Breakthrough test, Tube 1, and Tube 2 representation.
The mass of analyte detected on Tube 2 is referred to as the breakthrough mass. The breakthrough volume is defined as the volume of air passed through Tube 1, which results in a breakthrough mass that is approximately 5% of the delivered mass. The SSV is defined as 70% of the breakthrough volume per ASTM D 6196.
The general breakthrough test procedure is as follows:
1. Spike Tube 1 with a known mass. This mass on tube should represent the high end of the method calibration curve used to analyze samples. If a test facility has multiple methods, perform this test using the highest range method.
2. Connect Tube 1 and Tube 2 to the vapor chamber where samples are typically collected.
3. Run the empty vapor chamber at the desired operating chamber airflow rate, sampling flow rate, and temperature for a specified time. Using a sampling time twice the length of the desired sampling time is recommended.
4. Analyze both tubes using the using the appropriate chromatographic method. The analytical method used for Tube 2 must be capable of quantifying 5% of the spike mass.
5. Characterize the breakthrough results. If 5% of the delivered mass is recovered on Tube 2, breakthrough has occurred. An SSV would be 70% of the air volume used. For example, if the breakthrough test used a 120 min pull time, resulting in 5% breakthrough, then an 84 min pull time can be used for testing without changing the airflow rate or temperature.
Chemical Contaminant and Decontaminant Test Methodology Source Document, Second Edition
A-62
NOTE: If greater than 5% breakthrough is observed, the safe-sampling volume will be less than 70% of the air volume used. A second test, with adjusted parameters, would then be required to determine which parameters generated a 5% breakthrough so that the SSV could be determined.
NOTE: Breakthrough should be a linear function of the sampled air volume. Multiple sampling volumes may be tested, and a regression of the breakthrough mass as a function of sampling volume may be determined. The linear regression can be used to determine the sampling volume that would generate 5% breakthrough.
6. If the SSV is significantly small, the following guidance should be considered to enable decontaminant vapor testing and emission factor calculations:
Consider a different sorbent.
Consider a lower tube loading (i.e., less mass on tube).
7. Perform a final test, at the desired pull time, to ensure that breakthrough has not occurred at the final airflow rate, air volume, and temperature-operating conditions.
Develop the Vapor-Sampling Plan
The vapor-sampling plan is required for “Procedure 6: Post-Treatment Evaluation for Vapor Emission”. The vapor-sampling plan involves multiple calculations to ensure the test is successfully and accurately executed.
Determination of Chamber Free-Air Volume
The chamber free-air volume is required for the data calculations to determine the air-change rate and loading factor. The chamber free-air volume is calculated as the chamber total interior volume minus the volume of test panels. For example, typical dynamic vapor chambers specific to standard panel testing (e.g., microchambers) may have an internal volume of 2 x 10⁻⁵ m3 with no other hardware inside the chamber. A standard test panel that is 2.0 in. in diameter and 0.125 in. thick panel would have a volume of Vpanel = π r2 h = 6.435 x 10⁻⁶ m3, producing a free air volume of Vchamber – Vpanel = 1.35 x 10⁻⁵ m3.
Vapor-Sampling Plan Development
The vapor-sampling plan is the schedule for when and how long a vapor sample is collected during the vapor test. The vapor-sampling plan’s goal is to provide a sampling schedule that will load each tube with an analyte mass that can be detected without saturating the detector during long sampling times, or without resulting in mass loading below the analytical method during short sample times. The selection of tube midpoint times and tube pull times is a combination of the following items:
Vapor chamber operating parameters (e.g., airflow rate, air volume, and temperature)
Safe-sample volume (determined by the breakthrough test)
Chemical Contaminant and Decontaminant Test Methodology Source Document, Second Edition
A-63
Sample under investigation
Analytical method calibration range
The vapor test solid-sorbent tube results are used to calculate the emission value, which varies as a function of time. Sample collection timing is determined by the emission characteristics, which can vary for different materials. Sampling duration is determined by the item vapor off-gassing concentration, solid-sorbent tube SSV, and the dynamic range of the analytical method.
The planning process requires a bit of trial-and-error. The steps provided are general guidance that can be used to determine the system schedule. Constructing a test outside of requirements could severely affect test results and may result in invalidation.
The following procedure provides guidance for the construction of a successful sampling plan using an example panel evaluation of VX that was applied to a panel of polyethylene. After the 60 min contaminant-material interaction period, a liquid decontaminant was applied and then the surface was brushed.
1. Determine vapor test airflow settings to include the air-change rate and loading factor.
The air-change rate is the ratio of the chamber airflow rate to the chamber free-air volume, reported in units of 1/time. Some facts regarding air-change rate selection are detailed in the following list.
Air-change rates are inversely proportional to vapor concentration; doubling the air-change rate will decrease vapor concentration by a factor of two.
Large air-change rates provide “dilution” that will generate lower vapor concentrations (high/poor detection limits), but the rate of change of the emission factor can be well characterized. Most microchambers will use large air-change rates of 10 min-1 or higher.
Small air-change rates will increase vapor concentrations (enabling lower/better detection limits), at the expense of the ability to characterize how the emission rate changes as a function of time.
2. Determine the test duration.
The test duration should be aligned with scenario of interest. If no scenario is available, the recommended test duration is 12 h. Test durations should not be shorter than 6 h because the use of extremely short experiments could limit the ability to properly characterize the emission source.
3. Determine the number of solid-sorbent tubes.
Characterization of the emission source should use no less than six solid-sorbent tubes.
4. Determine the midpoint times (tm) for all tubes.
The initial sampling should start no sooner than 2.3 per air-change rate or 5 min, whichever is greater. This allows the chamber to mix and produce a measurable concentration. The last tube should be sampled at the end of the test duration. Most
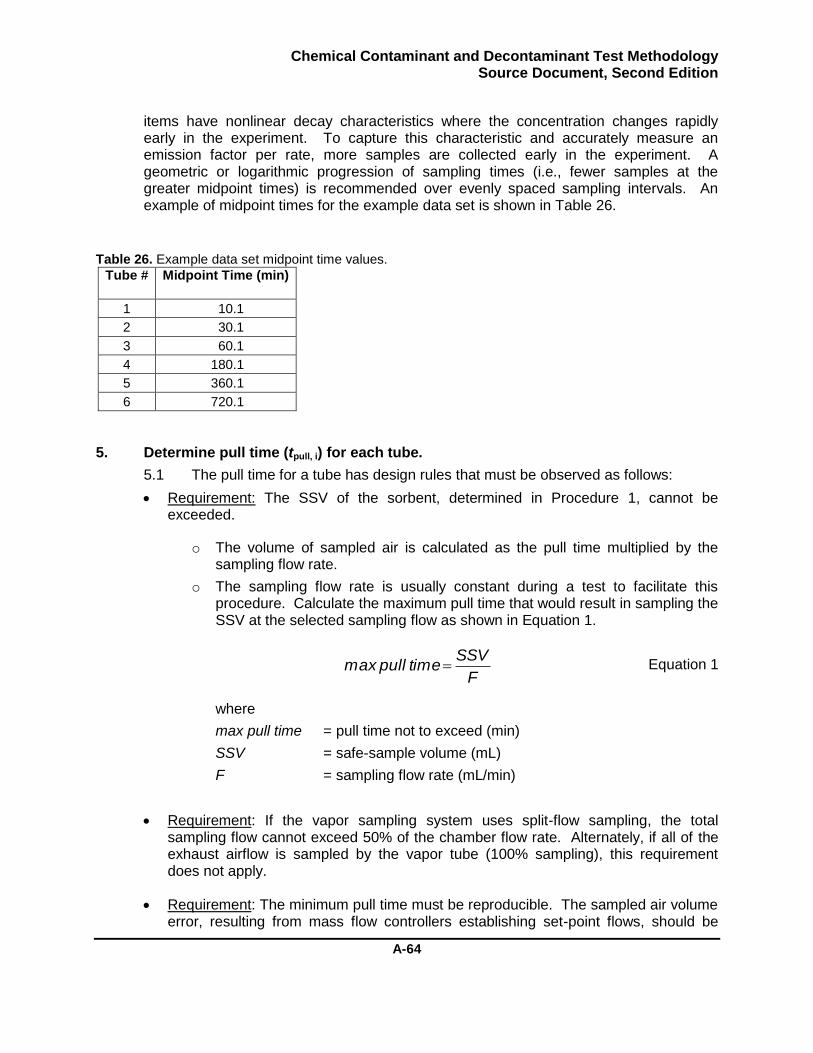
Chemical Contaminant and Decontaminant Test Methodology Source Document, Second Edition
A-64
items have nonlinear decay characteristics where the concentration changes rapidly early in the experiment. To capture this characteristic and accurately measure an emission factor per rate, more samples are collected early in the experiment. A geometric or logarithmic progression of sampling times (i.e., fewer samples at the greater midpoint times) is recommended over evenly spaced sampling intervals. An example of midpoint times for the example data set is shown in Table 26.
Table 26. Example data set midpoint time values.
Tube # Midpoint Time (min)
1 10.1
2 30.1
3 60.1
4 180.1
5 360.1
6 720.1
5. Determine pull time (tpull, i) for each tube.
5.1 The pull time for a tube has design rules that must be observed as follows:
Requirement: The SSV of the sorbent, determined in Procedure 1, cannot be exceeded.
o The volume of sampled air is calculated as the pull time multiplied by the sampling flow rate.
o The sampling flow rate is usually constant during a test to facilitate this procedure. Calculate the maximum pull time that would result in sampling the SSV at the selected sampling flow as shown in Equation 1.
Equation 1
where
max pull time = pull time not to exceed (min)
SSV = safe-sample volume (mL)
F = sampling flow rate (mL/min)
Requirement: If the vapor sampling system uses split-flow sampling, the total sampling flow cannot exceed 50% of the chamber flow rate. Alternately, if all of the exhaust airflow is sampled by the vapor tube (100% sampling), this requirement does not apply.
Requirement: The minimum pull time must be reproducible. The sampled air volume error, resulting from mass flow controllers establishing set-point flows, should be
F
SSVtime pull max
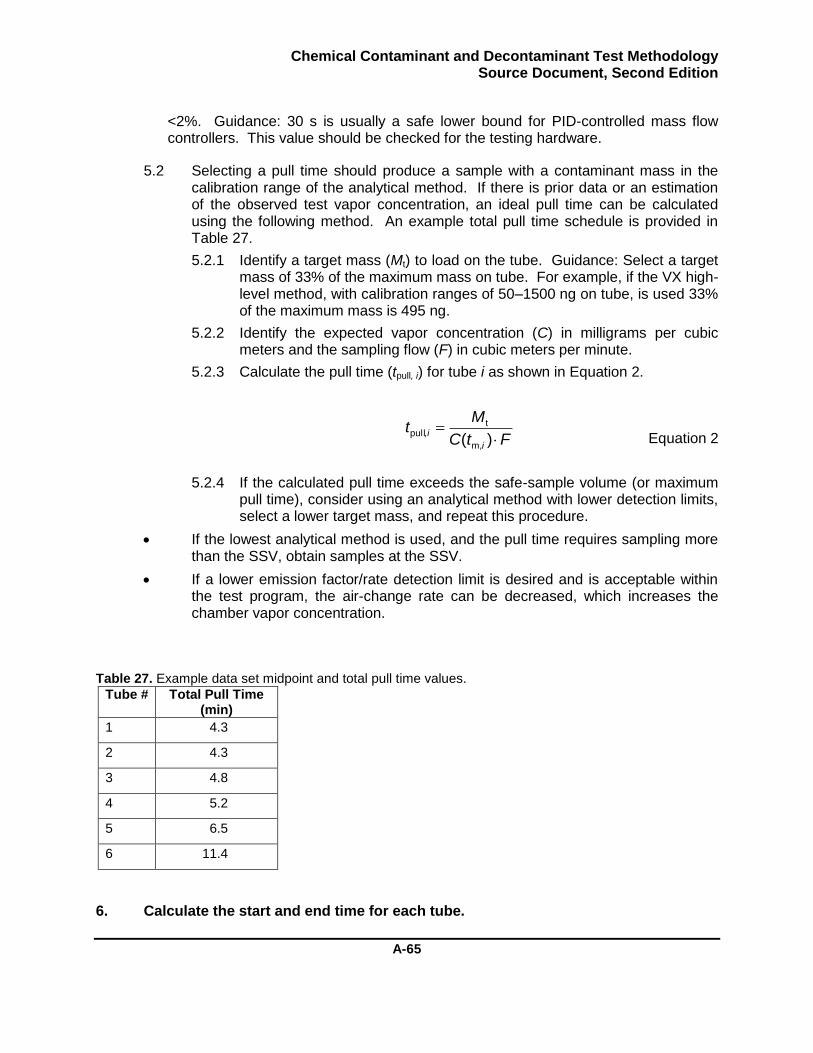
Chemical Contaminant and Decontaminant Test Methodology Source Document, Second Edition
A-65
<2%. Guidance: 30 s is usually a safe lower bound for PID-controlled mass flow controllers. This value should be checked for the testing hardware.
5.2 Selecting a pull time should produce a sample with a contaminant mass in the calibration range of the analytical method. If there is prior data or an estimation of the observed test vapor concentration, an ideal pull time can be calculated using the following method. An example total pull time schedule is provided in Table 27.
5.2.1 Identify a target mass (Mt) to load on the tube. Guidance: Select a target mass of 33% of the maximum mass on tube. For example, if the VX high-level method, with calibration ranges of 50–1500 ng on tube, is used 33% of the maximum mass is 495 ng.
5.2.2 Identify the expected vapor concentration (C) in milligrams per cubic meters and the sampling flow (F) in cubic meters per minute.
5.2.3 Calculate the pull time (tpull, i) for tube i as shown in Equation 2.
Equation 2
5.2.4 If the calculated pull time exceeds the safe-sample volume (or maximum pull time), consider using an analytical method with lower detection limits, select a lower target mass, and repeat this procedure.
If the lowest analytical method is used, and the pull time requires sampling more than the SSV, obtain samples at the SSV.
If a lower emission factor/rate detection limit is desired and is acceptable within the test program, the air-change rate can be decreased, which increases the chamber vapor concentration.
Table 27. Example data set midpoint and total pull time values.
Tube # Total Pull Time (min)
1 4.3
2 4.3
3 4.8
4 5.2
5 6.5
6 11.4
6. Calculate the start and end time for each tube.
FtC
Mt
i
,i
)( m,
tpull

Chemical Contaminant and Decontaminant Test Methodology Source Document, Second Edition
A-66
6.1 The start time for each tube is calculated using Equation 3.
Equation 3
6.2 The end time for each tube is calculated using Equation 4.
Equation 4
6.3 Ensure that the start and end times do not overlap between tubes. If there is overlap, consider increasing the sampling flow rate to decrease pull time. An example pull schedule is provided in Table 28.
Table 28. Example data set sampling time values.
Tube # Total Pull Time (min)
Midpoint Time (min)
Start Time (min)
End Time (min)
1 4.3 10.1 8.0 12.3
2 4.3 30.1 28.0 32.3
3 4.8 60.1 57.7 62.5
4 5.2 180.1 177.5 182.7
5 6.5 360.1 356.9 363.4
6 11.4 720.1 714.4 725.8
7. Document the sampling plan in the test report.
2
ttime start
,pull
,i
i
imt
2
ttime end
,pull
,i
i
imt
Chemical Contaminant and Decontaminant Test Methodology Source Document, Second Edition
A-67
Prerequisite Tasks for Confident Analysis of Liquid and Vapor
Samples
Overview
The post-treatment evaluations for total remaining contaminant, contact transfer, and vapor emission produce quantitative results regarding the amount of contaminant present after a treatment process. In addition, the treatment process provides a quantitative result from the DCS. These quantitative results are obtained from the analysis of liquid and solid-sorbent tube samples generated as part of the test. This prerequisite task provides guidance regarding the confident analysis of liquid and vapor samples from the SD2ED procedures.
Introduction
Program CA06DEC407 was a DTRA-funded effort designed to address the challenges associated with quantifying low-level residual contaminant to support decontaminant contact- and vapor-test evaluations. The program had three main objectives:
The primary program objective was to develop improved analytical methods to enable the confident detection of low levels of the chemical agents VX, HD, and GD at published requirement levels for testing using 2 in. diameter circular panels.
o At the time of this program, the lowest requirements used to establish the required detection limits were the Joint Platform Interior Decontamination (JPID) program 2003 and the Joint Service Sensitive Equipment Decontamination (JSSED) program 2005 requirement documents.
The secondary program objective was to establish methods for the detection of common contaminant byproducts that could form during decontaminant testing.
The tertiary program objective was to make the new methods available to establish uniformity in test procedures across testing locations.
The methods were written for analysis using a chromatographic platform (gas or liquid) equipped with an MS for analyte detection. MS were chosen to increase confidence that the reported data was for the analyte of interest and not for an interferent product or other analyte. Other detection methods can be used, although MS are recommended.
The improved analytical methods are formally documented in ECBC-TR-883.8 Each method is documented as an individual method. The methods are constructed using standardized fields with all pertinent information. The “Analyte Concentration Range” section provides an overview of the method target, the calibration range, calibration curve-fitting model and weighting, limit of detection (LOD), limit of quantitation (LOQ), solvent, and quantitation ion(s). The methods are identified as quantitative or qualitative.
The LOD and LOQ are calculated on the basis of the laboratory evaluation of the final method. Each test facility should recalculate these values on the basis of their method performance. LOD and LOQ are functions of instrument sensitivity, which can decay over time/use.

Chemical Contaminant and Decontaminant Test Methodology Source Document, Second Edition
A-68
Instrument sensitivity can often be restored by regularly scheduled maintenance, thus illustrating the need for a regular maintenance schedule. A test facility can achieve the appearance of a better LOD and LOQ, especially for new equipment or following instrument maintenance. These values should be calculated over time to determine the test facility performance. The “Apparatus” section details the analytical equipment and standard preparation tools. The “Method Parameters” section provides a complete list of instrumentation settings for the method. The secondary program objective was byproduct identification. The byproduct methods as presented are qualitative. All qualitative methods in this document can also be quantitative, if a set of calibration standards of the byproduct are prepared from a known starting material and analyzed
The methods are established on the instrumentation software and configurations described in this document. These parameters may be used on similar GC/MS and/or LC/MS platforms, and are comprehensive enough to serve as a guide for establishing low-level methods.
Similar results should be obtained if methods transferred to instruments are set up as described. However, if different parameters are applied to instrumentation, the same results may not be produced. Method verification procedures must be performed to include analyzing solvent blanks, chemical contaminant standards, and byproduct standards to verify instrument specific performance and method optimization.
The liquid extraction methods for HD, VX and GD, detailed in the report titled Low-Level Analytical Methodology Updates to Support Decontaminant Performance Evaluations, ECBC-TR-883,8 have been improved further by incorporating the usage of internal standards. Internal standards are utilized in analytical analysis to improve accuracy and precision in reported values. This is accomplished through the addition of a known concentration of internal standard to all calibration standards and samples prior to analysis. An internal standard is a compound that is similar to the analyte in both chemical and physical properties so that it behaves the same as the analyte in a common sample matrix. The ideal internal standard is a labeled form of the analyte. For example, a deuterated analog of the analyte in which one or more hydrogen atoms (1H or H) are replaced with a deuterium atom (2H or D) would serve as an acceptable internal standard. As a result, the internal standard is distinguishable by one or more atomic mass units, but ionizes in the same fashion as the analyte of interest. When added in a known concentration to a sample, the analytical result is calculated on the basis of the response ratio between analyte and internal standard. Therefore, the internal standard compound normalizes the analytical results for the analyte that can occur throughout an analytical sample queue. A typical sample queue may consist of over 100 samples and may require greater than 24 h for analysis. Given the analysis conditions, slight variation in analyte response is not uncommon. An internal standard can help normalize the variation caused by:
Sample-to-sample matrix effects
Instrument response drift
Loss of instrument sensitivity
Evaporation of extraction solvent
Subtle variations in injection volume
The inclusion of an internal standard in sample analysis is a powerful analytical tool that further increases the confidence of low-level analyte detection and the overall analytical results.
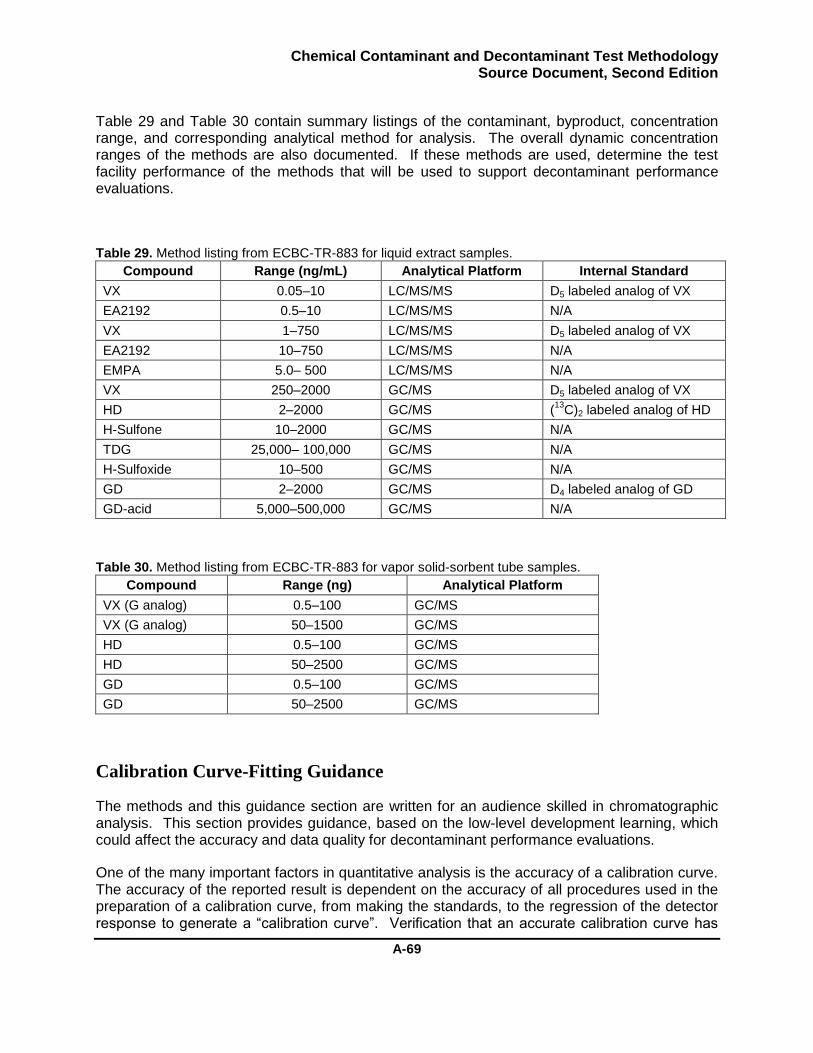
Chemical Contaminant and Decontaminant Test Methodology Source Document, Second Edition
A-69
Table 29 and Table 30 contain summary listings of the contaminant, byproduct, concentration range, and corresponding analytical method for analysis. The overall dynamic concentration ranges of the methods are also documented. If these methods are used, determine the test facility performance of the methods that will be used to support decontaminant performance evaluations.
Table 29. Method listing from ECBC-TR-883 for liquid extract samples.
Compound Range (ng/mL) Analytical Platform Internal Standard
VX 0.05–10 LC/MS/MS D5 labeled analog of VX
EA2192 0.5–10 LC/MS/MS N/A
VX 1–750 LC/MS/MS D5 labeled analog of VX
EA2192 10–750 LC/MS/MS N/A
EMPA 5.0– 500 LC/MS/MS N/A
VX 250–2000 GC/MS D5 labeled analog of VX
HD 2–2000 GC/MS (13
C)2 labeled analog of HD
H-Sulfone 10–2000 GC/MS N/A
TDG 25,000– 100,000 GC/MS N/A
H-Sulfoxide 10–500 GC/MS N/A
GD 2–2000 GC/MS D4 labeled analog of GD
GD-acid 5,000–500,000 GC/MS N/A
Table 30. Method listing from ECBC-TR-883 for vapor solid-sorbent tube samples.
Compound Range (ng) Analytical Platform
VX (G analog) 0.5–100 GC/MS
VX (G analog) 50–1500 GC/MS
HD 0.5–100 GC/MS
HD 50–2500 GC/MS
GD 0.5–100 GC/MS
GD 50–2500 GC/MS
Calibration Curve-Fitting Guidance
The methods and this guidance section are written for an audience skilled in chromatographic analysis. This section provides guidance, based on the low-level development learning, which could affect the accuracy and data quality for decontaminant performance evaluations.
One of the many important factors in quantitative analysis is the accuracy of a calibration curve. The accuracy of the reported result is dependent on the accuracy of all procedures used in the preparation of a calibration curve, from making the standards, to the regression of the detector response to generate a “calibration curve”. Verification that an accurate calibration curve has
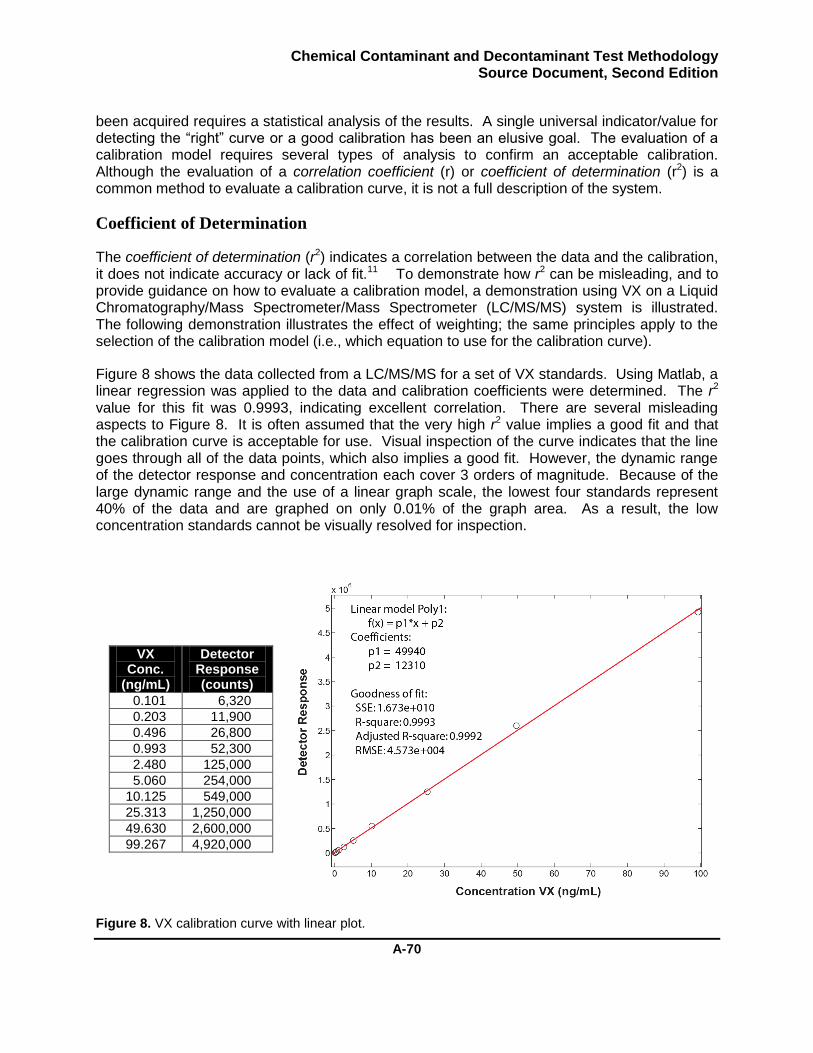
Chemical Contaminant and Decontaminant Test Methodology Source Document, Second Edition
A-70
been acquired requires a statistical analysis of the results. A single universal indicator/value for detecting the “right” curve or a good calibration has been an elusive goal. The evaluation of a calibration model requires several types of analysis to confirm an acceptable calibration. Although the evaluation of a correlation coefficient (r) or coefficient of determination (r2) is a common method to evaluate a calibration curve, it is not a full description of the system.
Coefficient of Determination
The coefficient of determination (r2) indicates a correlation between the data and the calibration, it does not indicate accuracy or lack of fit.11 To demonstrate how r2 can be misleading, and to provide guidance on how to evaluate a calibration model, a demonstration using VX on a Liquid Chromatography/Mass Spectrometer/Mass Spectrometer (LC/MS/MS) system is illustrated. The following demonstration illustrates the effect of weighting; the same principles apply to the selection of the calibration model (i.e., which equation to use for the calibration curve).
Figure 8 shows the data collected from a LC/MS/MS for a set of VX standards. Using Matlab, a linear regression was applied to the data and calibration coefficients were determined. The r2 value for this fit was 0.9993, indicating excellent correlation. There are several misleading aspects to Figure 8. It is often assumed that the very high r2 value implies a good fit and that the calibration curve is acceptable for use. Visual inspection of the curve indicates that the line goes through all of the data points, which also implies a good fit. However, the dynamic range of the detector response and concentration each cover 3 orders of magnitude. Because of the large dynamic range and the use of a linear graph scale, the lowest four standards represent 40% of the data and are graphed on only 0.01% of the graph area. As a result, the low concentration standards cannot be visually resolved for inspection.
VX Conc.
(ng/mL)
Detector Response (counts)
0.101 6,320
0.203 11,900
0.496 26,800
0.993 52,300
2.480 125,000
5.060 254,000
10.125 549,000
25.313 1,250,000
49.630 2,600,000
99.267 4,920,000
Figure 8. VX calibration curve with linear plot.

Chemical Contaminant and Decontaminant Test Methodology Source Document, Second Edition
A-71
To compensate for the compression of the x and y axes when using a linear scale, the same data should be plotted on a log-log scale, as seen in Figure 9. From this graph it is immediately apparent that the calibration model does not pass through the low concentration standards. The deviation of the calibration model from the standards imparts a substantial bias to the results. Keep in mind; the r2 value for this fit was 0.9993, even with a poor fit at low concentrations. The compression of the linear-scale graph did not enable this deviation to be readily observed.
Figure 9. Log-log scale VX calibration model.
Analyzing Error in the Calibration Model
Another issue to consider is the amount of error that may be present in the calibration. Several methods can be applied to assess the error in the calibration model, including residual analysis. Residual analysis is presented in the goodness-of-fit (GOF) parameters in Figure 8 as the Sum of the Square of the Errors (SSE) and Root Mean Square Error (RMSE). The SSE and RMSE values are calculated from the difference between the detector response and the calibration model response (y value), at the tested concentrations. For both SSE and RMSE, a smaller value represents a better fit. However, these values are not normalized—a good fit for one instrument could produce SSE values that are orders of magnitude different from another instrument, but are still acceptable. RMSE and SSE are excellent indicators for comparison of different models for the same data, where the smaller value indicates the better fit.
Another method to analyze error in the calibration model is to calculate the concentration (x) of a standard based on its detector response (y) from the calibration model and compare it to the known concentration. For example, applying the calibration model to the response (549,000) of the 10.125 ng/mL results in a concentration of:
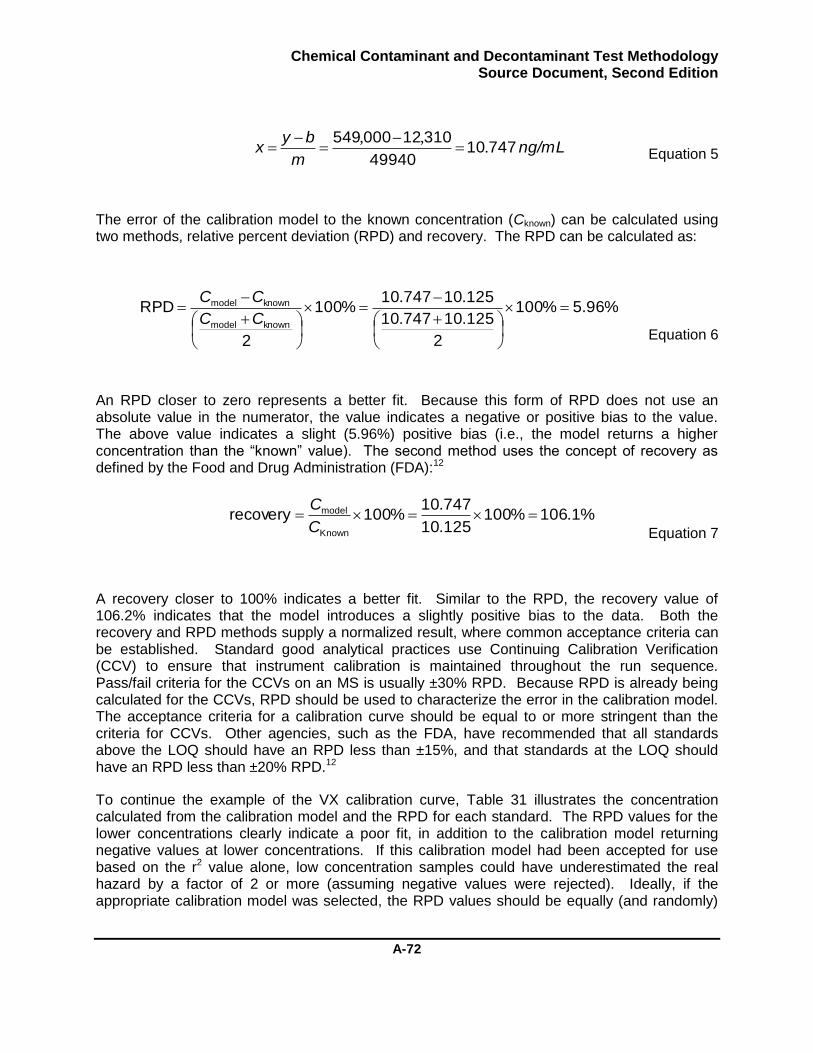
Chemical Contaminant and Decontaminant Test Methodology Source Document, Second Edition
A-72
Equation 5
The error of the calibration model to the known concentration (Cknown) can be calculated using two methods, relative percent deviation (RPD) and recovery. The RPD can be calculated as:
Equation 6
An RPD closer to zero represents a better fit. Because this form of RPD does not use an absolute value in the numerator, the value indicates a negative or positive bias to the value. The above value indicates a slight (5.96%) positive bias (i.e., the model returns a higher concentration than the “known” value). The second method uses the concept of recovery as defined by the Food and Drug Administration (FDA):12
Equation 7
A recovery closer to 100% indicates a better fit. Similar to the RPD, the recovery value of 106.2% indicates that the model introduces a slightly positive bias to the data. Both the recovery and RPD methods supply a normalized result, where common acceptance criteria can be established. Standard good analytical practices use Continuing Calibration Verification (CCV) to ensure that instrument calibration is maintained throughout the run sequence. Pass/fail criteria for the CCVs on an MS is usually ±30% RPD. Because RPD is already being calculated for the CCVs, RPD should be used to characterize the error in the calibration model. The acceptance criteria for a calibration curve should be equal to or more stringent than the criteria for CCVs. Other agencies, such as the FDA, have recommended that all standards above the LOQ should have an RPD less than ±15%, and that standards at the LOQ should have an RPD less than ±20% RPD.12
To continue the example of the VX calibration curve, Table 31 illustrates the concentration calculated from the calibration model and the RPD for each standard. The RPD values for the lower concentrations clearly indicate a poor fit, in addition to the calibration model returning negative values at lower concentrations. If this calibration model had been accepted for use based on the r2 value alone, low concentration samples could have underestimated the real hazard by a factor of 2 or more (assuming negative values were rejected). Ideally, if the appropriate calibration model was selected, the RPD values should be equally (and randomly)
ng/mL m
byx 74710
49940
31012000549.
,,
%96.5%100
2
125.10747.10
125.10747.10%100
2
RPDknownmodel
knownmodel
CC
CC
%1.106%100125.10
747.10%100recovery
Known
model C
C
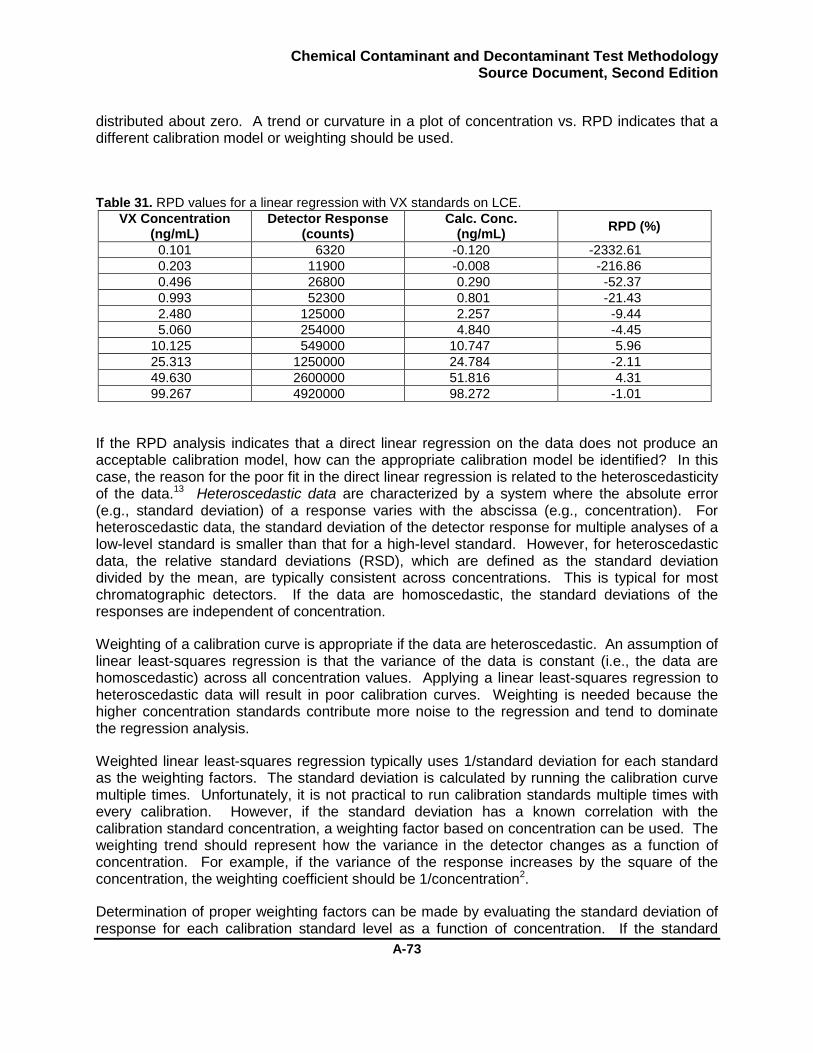
Chemical Contaminant and Decontaminant Test Methodology Source Document, Second Edition
A-73
distributed about zero. A trend or curvature in a plot of concentration vs. RPD indicates that a different calibration model or weighting should be used.
Table 31. RPD values for a linear regression with VX standards on LCE.
VX Concentration (ng/mL)
Detector Response (counts)
Calc. Conc. (ng/mL)
RPD (%)
0.101 6320 -0.120 -2332.61
0.203 11900 -0.008 -216.86
0.496 26800 0.290 -52.37
0.993 52300 0.801 -21.43
2.480 125000 2.257 -9.44
5.060 254000 4.840 -4.45
10.125 549000 10.747 5.96
25.313 1250000 24.784 -2.11
49.630 2600000 51.816 4.31
99.267 4920000 98.272 -1.01
If the RPD analysis indicates that a direct linear regression on the data does not produce an acceptable calibration model, how can the appropriate calibration model be identified? In this case, the reason for the poor fit in the direct linear regression is related to the heteroscedasticity of the data.13 Heteroscedastic data are characterized by a system where the absolute error (e.g., standard deviation) of a response varies with the abscissa (e.g., concentration). For heteroscedastic data, the standard deviation of the detector response for multiple analyses of a low-level standard is smaller than that for a high-level standard. However, for heteroscedastic data, the relative standard deviations (RSD), which are defined as the standard deviation divided by the mean, are typically consistent across concentrations. This is typical for most chromatographic detectors. If the data are homoscedastic, the standard deviations of the responses are independent of concentration.
Weighting of a calibration curve is appropriate if the data are heteroscedastic. An assumption of linear least-squares regression is that the variance of the data is constant (i.e., the data are homoscedastic) across all concentration values. Applying a linear least-squares regression to heteroscedastic data will result in poor calibration curves. Weighting is needed because the higher concentration standards contribute more noise to the regression and tend to dominate the regression analysis.
Weighted linear least-squares regression typically uses 1/standard deviation for each standard as the weighting factors. The standard deviation is calculated by running the calibration curve multiple times. Unfortunately, it is not practical to run calibration standards multiple times with every calibration. However, if the standard deviation has a known correlation with the calibration standard concentration, a weighting factor based on concentration can be used. The weighting trend should represent how the variance in the detector changes as a function of concentration. For example, if the variance of the response increases by the square of the concentration, the weighting coefficient should be 1/concentration2.
Determination of proper weighting factors can be made by evaluating the standard deviation of response for each calibration standard level as a function of concentration. If the standard

Chemical Contaminant and Decontaminant Test Methodology Source Document, Second Edition
A-74
deviation of the detector response is a constant for all concentration levels, the variance of the data is constant and, therefore no weighting is required. However, if the standard deviation is not constant, weighting is required. In the following example, seven replicate calibrations were analyzed for an analyte where the number of replicates allows statistical confidence in the calculations. After analysis, the standard deviation of detector response was calculated for each calibration standard. Standard deviation of the standard replicates versus standard concentration is plotted in Figure 10.
Analyte Conc.
(ng/mL)
Standard Deviation of
Detector Response
0.05 0.000347
0.1 0.000350
0.2 0.000653
0.5 0.000669
1 0.000674
2.5 0.001715
5 0.010718
10 0.006413
25 0.053840
50 0.058409
100 0.179615
Figure 10. Standard deviation of calibration standards replicates versus concentration.
From this example, it is clear that the variance of the calibration data changes with the concentration of the calibration levels demonstrating the heteroscedasticity of the data; therefore, curve weighting is appropriate. Using the data from analysis of seven replicate calibrations, the plotted data (standard deviation vs. concentration) reveals that a quadratic model fits the data; therefore, a 1/concentration2 weighting model is selected.
The techniques to implement weighted regressions for instrument calibration are available in the literature.14-15 The effect of weighting on the calculated concentration and RPD for the analyte example is shown in Table 32. The 1/x2 notation corresponds to 1/concentration2 for this data. An additional term is introduced in the GOF parameters, which is the sum of the absolute value of the RPD for all standards. Much like SSE, this value is not normalized, and a smaller number indicates a better fit. The sum of the absolute value of the RPD is a gauge for the performance of the fit across all data points. It is not optimal to select a calibration model based on the RPD for a particular standard, but rather, based on the model that best represents all standards. For example: If the weighting was selected by the lowest level standard only (0.05 ng/mL), the 1/x2
y = 7E-06x2 + 0.0011x + 0.0011
y = 0.0017x - 0.0017
-0.02
0
0.02
0.04
0.06
0.08
0.1
0.12
0.14
0.16
0.18
0.2
0.01 0.1 1 10 100
Stan
dar
d D
evi
atio
n o
f R
esp
on
se R
atio
Concentration (ng/mL)
Stdev
Poly. (Stdev)
Linear (Stdev)
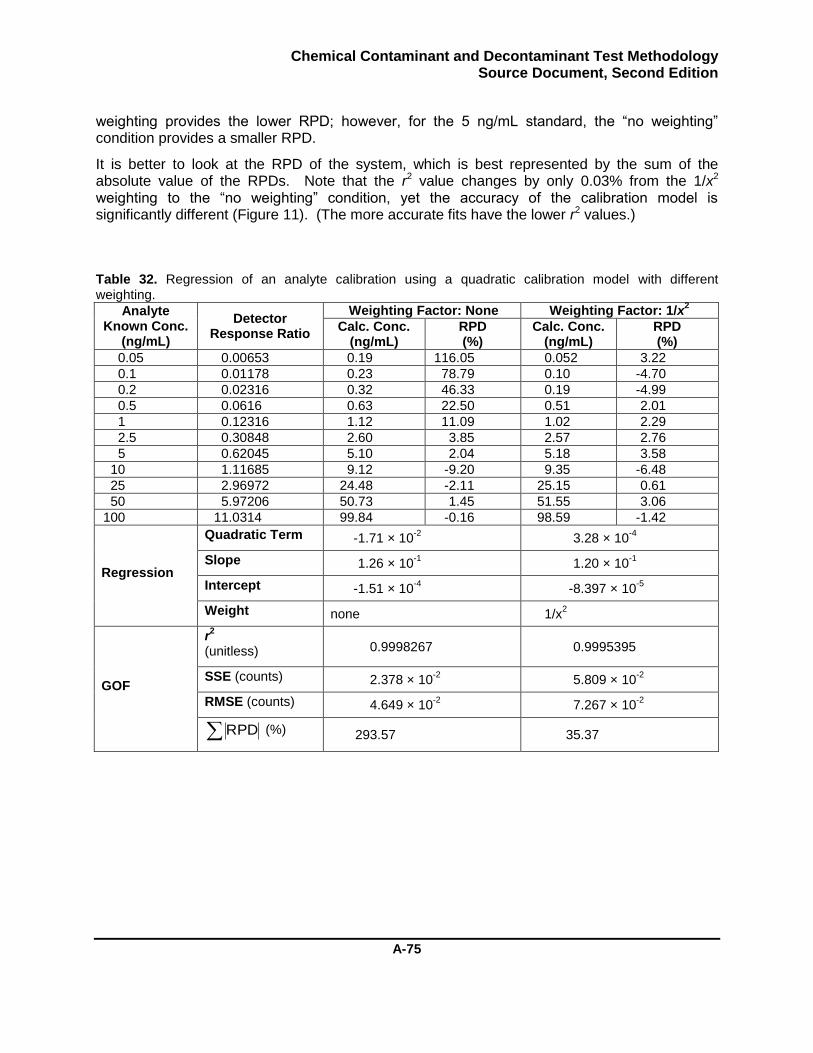
Chemical Contaminant and Decontaminant Test Methodology Source Document, Second Edition
A-75
weighting provides the lower RPD; however, for the 5 ng/mL standard, the “no weighting” condition provides a smaller RPD.
It is better to look at the RPD of the system, which is best represented by the sum of the absolute value of the RPDs. Note that the r2 value changes by only 0.03% from the 1/x2 weighting to the “no weighting” condition, yet the accuracy of the calibration model is significantly different (Figure 11). (The more accurate fits have the lower r2 values.)
Table 32. Regression of an analyte calibration using a quadratic calibration model with different weighting.
Analyte Known Conc.
(ng/mL)
Detector Response Ratio
Weighting Factor: None Weighting Factor: 1/x2
Calc. Conc. (ng/mL)
RPD (%)
Calc. Conc. (ng/mL)
RPD (%)
0.05 0.00653 0.19 116.05 0.052 3.22
0.1 0.01178 0.23 78.79 0.10 -4.70
0.2 0.02316 0.32 46.33 0.19 -4.99
0.5 0.0616 0.63 22.50 0.51 2.01
1 0.12316 1.12 11.09 1.02 2.29
2.5 0.30848 2.60 3.85 2.57 2.76
5 0.62045 5.10 2.04 5.18 3.58
10 1.11685 9.12 -9.20 9.35 -6.48
25 2.96972 24.48 -2.11 25.15 0.61
50 5.97206 50.73 1.45 51.55 3.06
100 11.0314 99.84 -0.16 98.59 -1.42
Regression
Quadratic Term -1.71 × 10⁻²
3.28 × 10⁻⁴
Slope 1.26 × 10⁻¹
1.20 × 10⁻¹
Intercept -1.51 × 10⁻⁴
-8.397 × 10⁻⁵
Weight none 1/x2
GOF
r2
(unitless) 0.9998267 0.9995395
SSE (counts) 2.378 × 10⁻²
5.809 × 10⁻²
RMSE (counts) 4.649 × 10⁻²
7.267 × 10⁻²
RPD (%) 293.57 35.37
Chemical Contaminant and Decontaminant Test Methodology Source Document, Second Edition
A-76
Figure 11. Calibration weighting factor comparison for seven replicate analyte calibrations.
Based on the results in Table 32 and Figure 11, the 1/x2 weighted regression provides the best fit. There are statistical tests that can be used to evaluate calibration curves, such as the F-test or a Mandel-Fitting Test. However, caution should be used when applying these tests because equal weighting is assumed for all data points, and will likely indicate the unweighted model as the better fit.
Detection Limits
Analytical methodologies have limits related to the ability of the instrumentation to detect an analyte of interest. To characterize these limits, an LOD and LOQ may be calculated. These values give confidence in the reported concentrations at the very low end of the calibration range and characterize the detection and quantification abilities of the instrument for a particular sample queue. There are multiple approaches to determine these values including, but not limited to: estimation using the lowest calibration standard concentration, determination through analytical evaluation of analyte signal to baseline noise ratios, and calculation based on calibration curve performance as described in “A Statistical Overview on Univariate Calibration, Inverse Regression, and Detection Limits: Application to Gas Chromatography/Mass Spectrometry Technique”.14 Determine the LOD/LOQ values and present them with the analytical data for context to the data user as the confidence in the measured value.
If any of the measured concentrations are below the analytical detection limits, the appropriate detection limit concentration should be used in the subsequent calculations (e.g., detected concentration times extraction volume for the calculation of mass extracted). A value of zero

Chemical Contaminant and Decontaminant Test Methodology Source Document, Second Edition
A-77
should never be used to report a data value—analytical methods can only indicate that some quantity less than the detection limit may be present.16 The methodology to determine LOD and/or LOQ values should be documented in addition to the substitution methods used to report these values (e.g., LOD or LOD divided by 2).
Quality Control Samples and Sample Queues
Even with the acquisition of an acceptable calibration curve, there is the possibility that the instrument calibration could drift or change during the analysis of samples. The best way to prevent these issues is to keep the instrument well maintained; however, even a properly maintained instrument may drift during an analysis. To ensure confidence that accurate results are generated, quality control samples should be analyzed during a run. The order in which the standards, analytical samples, and Quality Control (QC) samples are run is referred to as the sample sequence or sample queue (used interchangeably). Most often, the instrument control software calls this order a sequence. Logic should be applied in the organization of the sample queue because effects such as carryover, interferents, or instrument drift could invalidate large sets of data. The following guidance discusses what each type of QC sample is, what it indicates, how it is used, and finally how the QC samples should be integrated into the sample queue.
Types of Quality Control Samples
Quality control samples are used to ensure confidence in the reported analytical value. The QC samples enable trend analysis, determination of bias in sample analysis, detection of instrument drift and carryover, and provide information on the error in the reported analytical value. Initial calibration (concentration) verification (ICV), CCV, and blank samples are included in the QC samples. If the QC samples do not meet the performance criteria, a problem may exist and must be corrected to ensure confidence in the analytical data.
The ICVs are used to verify that a standard of known concentration is accurately determined by the instrument and calibration model. Although not required, an ICV should not be a standard that was used to generate the calibration curve. If a unique sample is not used, the ICVs run immediately after the calibration standards may be the same standards and standard concentrations used for the CCV evaluations. The accuracy of the ICV sample(s) can be calculated using a relative percent deviation (RPD) as defined by:
Equation 8
where
CCalc = concentration/mass calculated from the calibration model
Cknown = known concentration/mass of sample
%100
2knownCalc
knownCalcICV
CC
CCRPD
Chemical Contaminant and Decontaminant Test Methodology Source Document, Second Edition
A-78
Acceptance criteria for the ICV(s) should be established. Typical values would be in the range of ±15–30% RPD. An ICV having an RPD within the acceptance criteria indicates a successful calibration. Failure to meet the ICV acceptance criteria indicates low confidence in the calibration curve, and thus low confidence in the data produced from the calibration. ICV samples are typically run shortly after the calibration standards in the queue, which is discussed later in this document.
Verifying Instrument Performance
The sensitivity of an analytical instrument can change over time for various reasons including:
build-up of sample matrix components in the sample pathway
presence of interferent from samples
cleanliness of critical surfaces in a MS
maintenance on an instrument, such as changing an injection port liner, conditioning, or replacement of the column
Use CCV samples to confirm that the performance of the system does not change during a sequence (i.e., the calibration changed or drifted). A CCV sample is often a rerun of a standard to confirm that the measured concentration has not changed and that the instrument is performing consistently. This can be accomplished by determining the RPD of the CCV sample (RPDCCV) using the calculated concentration (CCalc) and the known concentration (Cknown) as follows
Equation 9
Acceptance criteria are established to determine if a CCV indicates an acceptance or failure to hold calibration. Typically a value of greater than ±30% RPD is used as failure criteria for an MS such as an Agilent 5975 Mass Selective Detector (MSD). The variation in concentration/mass of CCV samples is a result of errors from both systematic and random sources. The 30% performance criterion is a commonly accepted standard. If a failure is detected, corrective actions must be taken to return the instrument to calibration (e.g., instrument maintenance, rerun standards, etc.). Samples acquired before or after a failed CCV will be suspect and will need to be rerun, as discussed later in this document.
Concentrations for Quality Control Samples
For methods that have an overall dynamic concentration range that spans multiple orders of magnitude, more than one concentration should be tested as a CCV. The selection of appropriate concentrations to use depends on the objective of the experiment. In general, the CCV concentration should correspond to the concentrations expected from the test. Most decontamination tests will attempt to meet a requirement. Therefore, including one CCV near the requirement concentration and one CCV at a mid- to high-end of calibration is advisable. Other government organizations, such as the FDA, recommend three values, which correspond
%100
2
RPDknownCalc
kCalcCCV
CC
CC nown
Chemical Contaminant and Decontaminant Test Methodology Source Document, Second Edition
A-79
to approximately three times the LOQ, midrange, and high range concentrations for CCVs.12 The quality sample and acceptance methods used by a test facility should be documented in the final report because there are several guides and methods that can be utilized.
The last type of QC sample discussed here is the use of blanks. A blank sample is a sample containing only the extract solvent (or uncontaminated vapor tube). A blank should not elicit a detector response at the expected retention time for the analyte of interest. Blanks are an effective way to evaluate baseline performance and confirm there is no analyte carryover in the system. Analyte carryover is the detection of an analyte in one sample that was the result of the analysis of a previous sample. The result of analyte carryover is a positive bias in a sample, present mostly in low concentration/mass samples. When running a solvent blank, a detector response noted at the expected retention time can be indicative of carryover from high concentration/mass samples, interferences, a dirty system, or other problem that may affect the identification and quantitation of the analyte of interest. Blank samples are included in the sample queue at regular intervals to check for carryover, as discussed later. The acceptance criterion for the blank or solvent-only sample is that the reported concentration must be below the LOD for the analysis method. This criterion was established to ensure that any carryover would not appreciably affect the results of the sample analyzed next in the sequence.
The acquisition of a successful calibration model indicates an instrument that is calibrated under ideal conditions. As samples are analyzed over a long period (sample queues can last from 1 to 36+ hours and include from 1 to 100+ samples), changes in the analytical system can affect the instrument sensitivity and performance, as previously discussed. For this reason, QC samples must be run at regular intervals during the sample queue to confirm that the analytical instrument is performing within specifications.
Preparation of Samples for Analysis
The decontamination test process generates samples for analytical analysis. The analysis of these samples generates data that are used to represent the test process and answer research questions associated with a program. Prior to sample analysis, it is prudent to ensure that a sample is prepared and handled appropriately.
Proper sample preparation ensures that the sample will be analyzed with confidence, within the calibration range, and without introducing bias because of sample matrix interference. Preparation should include all required actions to allow successful analytical analysis. For example, compare the expected concentration of a sample, if known, to the dynamic range of the method calibration. If the expected concentration is above the range of the calibration, sample dilution is required. Perform dilution with the appropriate laboratory tools into the high purity solvent required by the analysis method. It is also important to account for any sample preparation requirements determined by preliminary studies such as interference evaluations. For example, an interference evaluation may determine a minimum dilution factor required to mitigate known matrix effects for a specific sample. One final step of sample preparation, just prior to analysis, is the introduction of an internal standard, if utilized.
After preparation, analyze a sample as soon as possible to limit sample degradation. If a sample cannot be analyzed immediately, store it properly (e.g., refrigerate at 4 °C). A representative sample (i.e., “hold” sample) should also be stored for analysis later, in case challenges arise with the original sample (e.g., samples outside the calibration range or failed
Chemical Contaminant and Decontaminant Test Methodology Source Document, Second Edition
A-80
quality samples). This allows the re-analysis of a sample from a fresh preparation of the representative hold sample. The length of time a sample may be stored before degradation occurs should be evaluated for confidence that the hold sample continues to be representative of the test condition from which it was generated.
After preparing a set of analysis samples, organize into them into a sample queue as described in the following section.
Organizing a Sample Queue
A sample queue can be organized in the following order: (1) a series of blanks, (2) the QC standards, (3) another blank, (4) an ICV and/or CCV block, (5) samples with iterations of (6) CCV blocks and samples until the queue is complete, terminating with (7) a CCV block.
Figure 12 provides an example sample queue.
Run the first blank to ensure that the system is warmed up and flushed out. Run the second blank to verify the system is clean and there is no carry over from previous runs.
Run the QC standards from lowest to highest concentration (minimizing the effect of any potential carryover).
The blank run after the highest standard is primarily used to detect any carryover in the system. Because this blank follows the highest concentration in this sequence, if carryover occurs, it will be reflected in this sample.
If used, run an ICV sample to confirm that an acceptable calibration was acquired.
The next sample begins a CCV block. In this example, a CCV block consists of a blank, a low-level CCV (0.5 ng/mL), a mid-level CCV (5.0 ng/mL), and a high-level CCV (25 ng/mL).
After a CCV block, run a set of samples followed by another CCV block.
Continuing Calibration Verification (CCV) Blocks
The CCVs surrounding the samples are said to “bracket” the samples. For a set of samples to be accepted, both bracketing CCV blocks must meet acceptance criteria. If a QC sample fails to meet an acceptance criteria (e.g., blank detecting carryover or CCV > 30% RPD), the samples preceding and following the CCV block are suspect, and should be re-analyzed. It is not possible to identify when the instrument failed to meet specifications, thus all samples between the last passing QC sample and the failing sample should be re-analyzed. In addition to this guidance, other documents such as Chapter 9 of the U.S. Army Engineering Manual EM 200-1-1017 can be used to accept or reject data.
Determining the frequency of CCV blocks depends on a balance of instrument run time and confidence in instrument performance. For example, with a frequency of nine samples per CCV block, the failure of one CCV block indicates that 18 samples should be re-analyzed (the

Chemical Contaminant and Decontaminant Test Methodology Source Document, Second Edition
A-81
samples before and after the failing CCV block). Selecting a large number of samples between CCV blocks results in a shorter total queue run time; however, a CCV block failure results in a significant number of samples to re-analyze. Conversely, running a CCV block between every sample is also not practical. Typical intervals for CCV blocks are 5–20 samples. If particular samples are expected to cause instrumentation problems or extra confidence is desired, CCV blocks can be analyzed more often.
Determining the Sample Order
Consideration should be applied to the order that the samples are analyzed. Factors that affect the sample order can include the following:
Concentration: In decontamination testing some samples may have concentrations that are significantly different (e.g., the contact test for a bare metal vs. an elastomer).
Carryover: If there is any carryover in a system, a very high concentration sample followed by a low concentration sample could yield a false high (i.e., positive bias) concentration in the low concentration sample. For this reason, it is advisable to use best judgment in the organization of samples to prevent this situation.
Cleanliness: In addition to the sample concentration, some samples are “cleaner” than others. For example, the contact test involves the extraction of a contact sampler that has been rinsed with acetone to remove impurities. This extraction is relatively clean because the only compounds likely to be in the extract solution are the contaminant and possibly some contaminant reaction byproducts. By comparison, in some cases the residual contaminant extractions are not “clean” because the extraction process may have removed other compounds from the panel (e.g., plasticizers extracted from elastomers like silicone). Some interferents extracted from the panels may alter the performance of the analytical instrumentation (e.g., interferents coating the column). This could be detected by failing CCVs or positive blanks. To minimize re-analyzing large numbers of samples, put samples that are “dirty” or likely to contain impurities together at the end of a queue. If the interferents are significant enough, sample clean-up procedures (e.g., solid phase extraction) may be needed to accurately analyze the samples and prevent damaging the analytical instrumentation (e.g., destroying the column).
In summary, it is best to run the cleanest samples first then order the samples from anticipated lowest concentration to highest concentration. An example sample queue setup is provided in Figure 12.
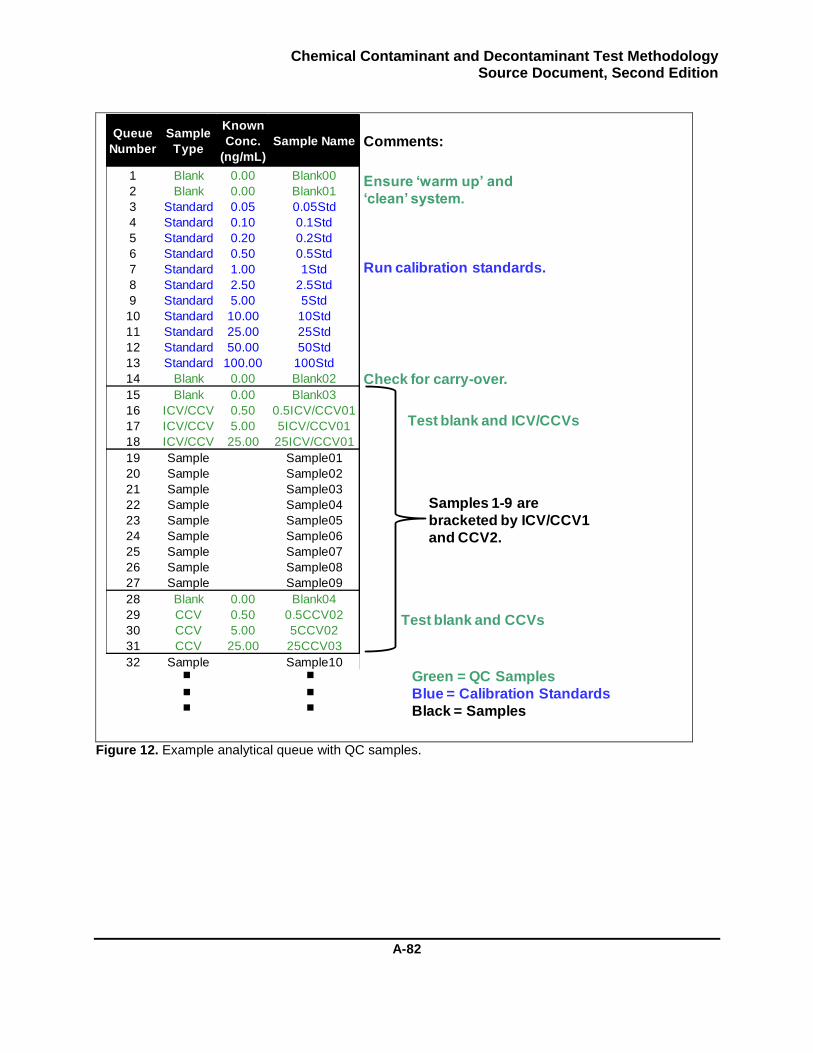
Chemical Contaminant and Decontaminant Test Methodology Source Document, Second Edition
A-82
Figure 12. Example analytical queue with QC samples.
Queue
Number
Sample
Type
Known
Conc.
(ng/mL)
Sample Name
1 Blank 0.00 Blank00
2 Blank 0.00 Blank01
3 Standard 0.05 0.05Std
4 Standard 0.10 0.1Std
5 Standard 0.20 0.2Std
6 Standard 0.50 0.5Std
7 Standard 1.00 1Std
8 Standard 2.50 2.5Std
9 Standard 5.00 5Std
10 Standard 10.00 10Std
11 Standard 25.00 25Std
12 Standard 50.00 50Std
13 Standard 100.00 100Std
14 Blank 0.00 Blank02
15 Blank 0.00 Blank03
16 ICV/CCV 0.50 0.5ICV/CCV01
17 ICV/CCV 5.00 5ICV/CCV01
18 ICV/CCV 25.00 25ICV/CCV01
19 Sample Sample01
20 Sample Sample02
21 Sample Sample03
22 Sample Sample04
23 Sample Sample05
24 Sample Sample06
25 Sample Sample07
26 Sample Sample08
27 Sample Sample09
28 Blank 0.00 Blank04
29 CCV 0.50 0.5CCV02
30 CCV 5.00 5CCV02
31 CCV 25.00 25CCV03
32 Sample Sample10
Comments:
Ensure ‘warm up’ and
‘clean’ system.
Run calibration standards.
Check for carry-over.
Test blank and ICV/CCVs
Samples 1-9 are
bracketed by ICV/CCV1
and CCV2.
Green = QC Samples
Blue = Calibration Standards
Black = Samples
Test blank and CCVs
Chemical Contaminant and Decontaminant Test Methodology Source Document, Second Edition
A-83
Vapor Solid-Sorbent Tube Guidance
Vapor sample queues should also consider the amount of contaminant on the solid-sorbent tubes. The chance for sample carryover is greater with vapor solid-sorbent tube analyses. The solid-sorbent tubes containing a low mass of contaminant should be analyzed first in a sample queue to minimize positive bias in case a solid-sorbent tube with a higher mass of contaminant results in carryover. Sample tubes that are expected to contain a higher mass of contaminant should be analyzed later in the sample queue, if possible. If there is concern that selected samples may result in carryover, then blank tubes can be placed between those samples to determine whether carryover occurred.
The use of solid-sorbent tubes should be used and analyzed in accordance with manufacturer instructions to ensure optimum performance. Some considerations for successful decontaminant performance evaluations are provided in this section.
New solid-sorbent tube receipt: Most manufacturers recommend an initial conditioning process to remove any contaminants from the sorbent materials as a result of the manufacturing or shipment process prior to first use.
Tube spiking: Tube spiking is the process of making analytical calibration samples for vapor analysis. A known volume of a particular concentration of liquid chemical contaminant standard, prepared in high purity solvent, is introduced into the tube using a microliter (µL) syringe onto the sorbent material of a tube. Tube spiking should be performed on tubes that have been conditioned and verified as clean. The tube must have airflow to pull the standard onto the sorbent bed and to aspirate away the solvent that delivered the standard. Tube spiking, sample collection, and sample analysis desorption are always done on the same end of the tube.
Tube conditioning: According to the manufacturer, solid-sorbent tubes are typically reusable for about 100 heating cycles. Because they are reused, one challenge is to ensure that reused tubes are “clean” before being placed back into circulation. If the sorbent material has retained any contaminant from the previous sampling/desorption cycle, it will induce a positive bias in the results of the next sample. To prevent carryover from interfering with the next sample/analysis cycle, the tubes are conditioned or cleaned. To verify that the tubes have been cleaned, a representative sampling of the total number of conditioned tubes are re-analyzed and verified as blank. Commercial hardware is available to condition and clean tubes between uses. Tube conditioners typically heat the tubes to a specified temperature (usually above the desorption temperature for most analytes, but below the breakdown temperature of the sorbent). Nitrogen or air is then purged through the tube to desorb any residual analytes.
Chromatographic confirmation of conditioning: To ensure that the solid-sorbent tubes are clean enough to be used when generating instrument calibration curves or for sample collection, they must be checked after cleaning. Checking each solid-sorbent tube individually would be labor intensive. The American National Standard Z 1.4 Sampling Procedures and Tables for Inspection by Attributes provides sampling plans that can provide a high level of confidence that batches of solid-
Chemical Contaminant and Decontaminant Test Methodology Source Document, Second Edition
A-84
sorbent tubes are clean and ready for use, without requiring the analysis of each individual tube. The sampling plans in the standard were designed so that the more “defects or items failing the acceptance criteria” that a batch or lot contains, the more likely it is to be rejected.18 In this case, if a batch of solid-sorbent tubes fails to meet the acceptance criteria, the batch of solid-sorbent tubes would undergo a second cleaning.
Analytical Interference Evaluations
This section provides guidance for evaluating the effect of sample composition on chromatographic analysis and the process for establishing confidence in analytical results from samples generated during decontamination testing. Confidence in a measured value depends on the ability of the analytical instrumentation to selectively detect and quantify the analyte of interest. Selective detection and quantification is required to ensure that the analyte or contaminant, is being detected without bias caused by other compounds or components present within a sample. The presence of these bias-inducing additional components in a sample is referred to as interference. Interference testing is a proactive approach to determine if the standard experimental extraction solvents are compatible with the program materials and decontaminants prior to testing. In a typical liquid sample generated from decontamination testing, the sample composition or matrix may consist of the extraction solvent containing the contaminant, plus any additional compounds that may have been pulled from the test material or decontaminant during the extraction process. Interference evaluations are conducted prior to decontamination testing for all matrices that may be generated from any combination of contaminant, material, and/or decontaminant to ensure that all contaminants can be detected with confidence.
There are many considerations when evaluating samples for interference. Solution extraction matrices generated for interference testing should be evaluated with and without the contaminant. This provides a thorough characterization of the matrix for the presence of compounds that may interfere with confident analytical analysis of the contaminant of interest. Interference evaluation recommendations include, but are not limited to:
Matrix generation: Each unique matrix (e.g., solvent, material, decontaminant combination) should be prepared and evaluated. The matrix should be representative of the analytical sample produced from the decontamination test process. The matrix generated for interference evaluation should not contain the compound of interest.
o The matrix blank evaluation: Evaluate the matrix blank (matrix without the compound of interest) to ensure that no compounds are detected that may interfere with the detection of the compound of interest. The blank sample should be evaluated to establish acceptance criteria. Because the matrix blank contains no contaminant, there should be no detector response above that of the lowest calibration standard. If a matrix blank produces a detector response, the matrix interferes with the confident detection of analyte and may require further sample preparation (e.g., matrix dilution, solid phase extraction, etc.) for confident analysis.
Chemical Contaminant and Decontaminant Test Methodology Source Document, Second Edition
A-85
o Post-spiked matrix evaluation: Evaluation of the matrix extract with a known quantity of analyte spiked in the solution can be used to indicate suppression or enhancement of the analyte signal in the sample matrix. Multiple levels of post-spiking standard solutions with known analyte concentrations are prepared. These solutions are then spiked into aliquots of the matrix solution for analysis. Evaluating the matrix at multiple concentration levels allows the determination of analytical confidence across a method’s dynamic range. If a post-spiked sample produces a concentration different from the spiked concentration, the matrix interferes with the confident detection of analyte and may require further sample preparation (e.g., matrix dilution, solid phase extraction, etc.) for confident analysis.
o DCS prepared from post-spiking solutions: DCS are prepared in high-purity extraction solvent using the same post-spiking scheme as the matrix samples. The DCS are controls that represent the true, or actual, concentration of the post-spiked sample matrices since no interference is expected with high-purity solvent. Multiple replicates of DCS are prepared at corresponding concentration levels used for post-spiked matrices to reinforce confidence in the expected concentration value. The average response for replicate DCS serves as a reference concentration for sample matrices post-spiked at corresponding levels.
Each unique matrix (e.g., contaminant, solvent, and material combination) is evaluated visually and analytically for interference. Visual inspection of the sample matrix prior to analysis determines its suitability for analytical testing. Matrices that show visible signs of interference (e.g., turbid or colored solutions) may not be suitable for analysis and may require additional sample preparation prior to analysis. Matrices without visual interference are analyzed on state-of-the-art analytical instrumentation such as an LC or GC, equipped with an MS, for analyte detection. Interference evaluation is conducted in accordance with established acceptance criteria. For example, acceptable results require that the recovery value for the post-spiked sample matrices must be 1.0 ± 0.2, compared with the corresponding DCS reference concentration. Further interference testing is performed for matrices that do not meet acceptance criteria. Standard analytical techniques, such as matrix dilution, are used to minimize interference effects noted upon analytical quantitation of the analyte. Matrices may be diluted prior to initial analysis due to visual interferences or observations from previous testing. Based on analytical results, a minimum dilution factor recommendation is generated for each combination of contaminant, material, and/or decontaminant tested. This dilution factor is then applied to all subsequent analyses of the matrix. Interference results and recommendations generated for each evaluated matrix should be summarized in test reports.
Solvent Recovery Determination
Many post-treatment evaluations used with decontaminant testing require a solvent extraction to generate samples for analytical analysis. To perform solvent extraction a test material is placed into an organic solvent for a period of time to transfer the analyte of interest from the material into the extraction solvent. Using solvent extraction to successfully recover an analyte from a material depends on many factors including, but not limited to, the material characteristics,
Chemical Contaminant and Decontaminant Test Methodology Source Document, Second Edition
A-86
analyte-material interactions, analyte-environment interactions (e.g., evaporation), the ability of a solvent to penetrate into a material, the affinity of the analyte for the solvent, etc.
When extraction of an analyte from a test material is required, the ability of the extraction solvent to reproducibly recover the analyte of interest from the material should be determined. Solvent recovery should be evaluated at multiple levels of contamination to establish a comprehensive view of contaminant recovery across a dynamic range. Points to consider in a solvent recovery evaluation can include, but are not limited to:
Establishment of solvent recovery acceptance criteria
Evaluation of multiple contaminant levels
Inclusion of appropriate controls
Documentation of process
Determination of solvent recovery and evaluation of findings for acceptance
Assessment of assignable cause for poor recovery, if appropriate (e.g., evaporation of volatile compounds from nonporous materials such as bare metals and uncoated glass).
Calculation of correction factor, if needed
Unknown solvent recovery may bias the analytical measurement if the solvent recovery is incomplete. If solvent recovery determination finds that analyte recovery is complete and all analyte is accounted for, no data correction is required. If solvent recovery is determined to be incomplete, further investigation may be warranted to account for the analyte. For example, a different solvent may have better solvent recovery for specific analyte-material pairs. In some cases, the characterization of solvent recovery may result in a correction factor that will be applied to the affected data. The solvent recovery determination will affect the final data output by allowing the confident reporting of final extracted mass of analyte from a test material.
Data Reporting
It is important to properly report data in full context. Data qualifiers or flags can be used to provide an assessment of the data. Comprehensive data reporting includes all measurement traceability information including the process, test conditions, and analysis conditions under which the data was collected, and the use of this data to make decisions. Data verification, data validation, and data quality assessment are discussed in Procedure 7. Data qualifiers and reporting requirements are discussed in Procedure 8.
Chemical Contaminant and Decontaminant Test Methodology Source Document, Second Edition
A-87
Procedure 1: Treatment
Overview
Panel treatment is the series of processes performed to the test material which may include, but not limited to, contamination and decontamination. This procedure contains the basic steps for test material contamination, contaminant-material interaction period, pre- and post-decontamination rinsing, and decontamination. The treatment process is not intended as a standalone procedure. After panel treatment is completed, the panel is then evaluated using the appropriate post-treatment test.
Test Preparation
The method user should ensure that all necessary equipment, materials, reagents, and analytical capabilities are available and operational for the procedures to be performed. Preparation tasks for the SD2ED procedures may include, but is not limited to:
Identify the calculation desired: Review the calculation section of the test procedure and select the appropriate test methods and options within a test method to ensure the necessary data is collected. (e.g., Contact test calculations might involve contact-hazard, percent efficacy, or reduction in starting challenge.)
Turn on the equipment that will need to thermally equilibrate (i.e., slidewarmer and environmental chamber).
Complete test area setup, labeling (i.e., vials, trays, jars), and other associated tasks that can be performed prior to the start of testing.
Clean (if required) and inspect all panels to remove any unacceptable specimens prior to the start of testing.
NOTE: Always handle panels with gloved hands. Panels may be washed as part of test preparation to remove dust, debris, or oils resulting from panel fabrication or handling. If soap or surfactants are used to wash the panels, ensure that the panels are thoroughly rinsed because trace quantities of surfactants on the panel may significantly influence contaminant spreading and the final results of the post-treatment evaluations.
Prepare the decontaminant.
Conduct pre-test measurements.
o Perform panel measurements, which may include, but not limited to, film thickness, surface roughness, and moisture content.
o Perform decontaminant measurements, which may include, but not limited to, active component titer, and pH.
Fill vials (such as scintillation vials for the DCS) with extraction solvent.
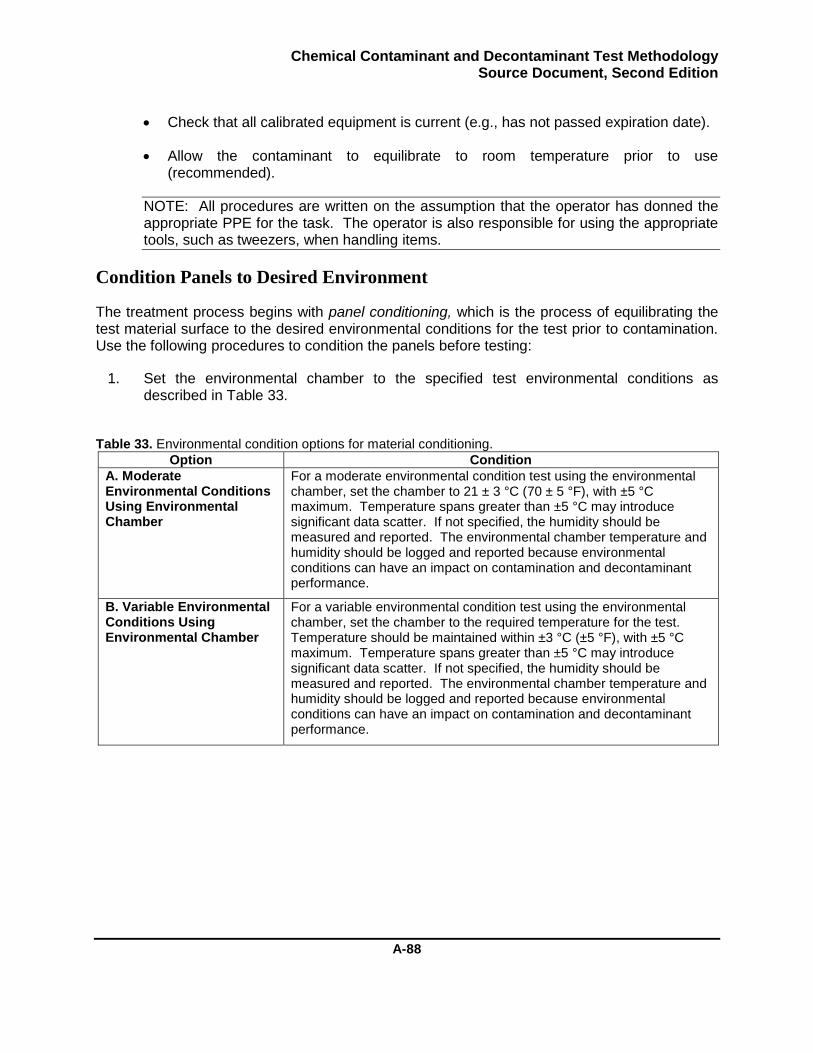
Chemical Contaminant and Decontaminant Test Methodology Source Document, Second Edition
A-88
Check that all calibrated equipment is current (e.g., has not passed expiration date).
Allow the contaminant to equilibrate to room temperature prior to use (recommended).
NOTE: All procedures are written on the assumption that the operator has donned the appropriate PPE for the task. The operator is also responsible for using the appropriate tools, such as tweezers, when handling items.
Condition Panels to Desired Environment
The treatment process begins with panel conditioning, which is the process of equilibrating the test material surface to the desired environmental conditions for the test prior to contamination. Use the following procedures to condition the panels before testing:
1. Set the environmental chamber to the specified test environmental conditions as described in Table 33.
Table 33. Environmental condition options for material conditioning.
Option Condition
A. Moderate Environmental Conditions Using Environmental Chamber
For a moderate environmental condition test using the environmental chamber, set the chamber to 21 ± 3 °C (70 ± 5 °F), with ±5 °C maximum. Temperature spans greater than ±5 °C may introduce significant data scatter. If not specified, the humidity should be measured and reported. The environmental chamber temperature and humidity should be logged and reported because environmental conditions can have an impact on contamination and decontaminant performance.
B. Variable Environmental Conditions Using Environmental Chamber
For a variable environmental condition test using the environmental chamber, set the chamber to the required temperature for the test. Temperature should be maintained within ±3 °C (±5 °F), with ±5 °C maximum. Temperature spans greater than ±5 °C may introduce significant data scatter. If not specified, the humidity should be measured and reported. The environmental chamber temperature and humidity should be logged and reported because environmental conditions can have an impact on contamination and decontaminant performance.
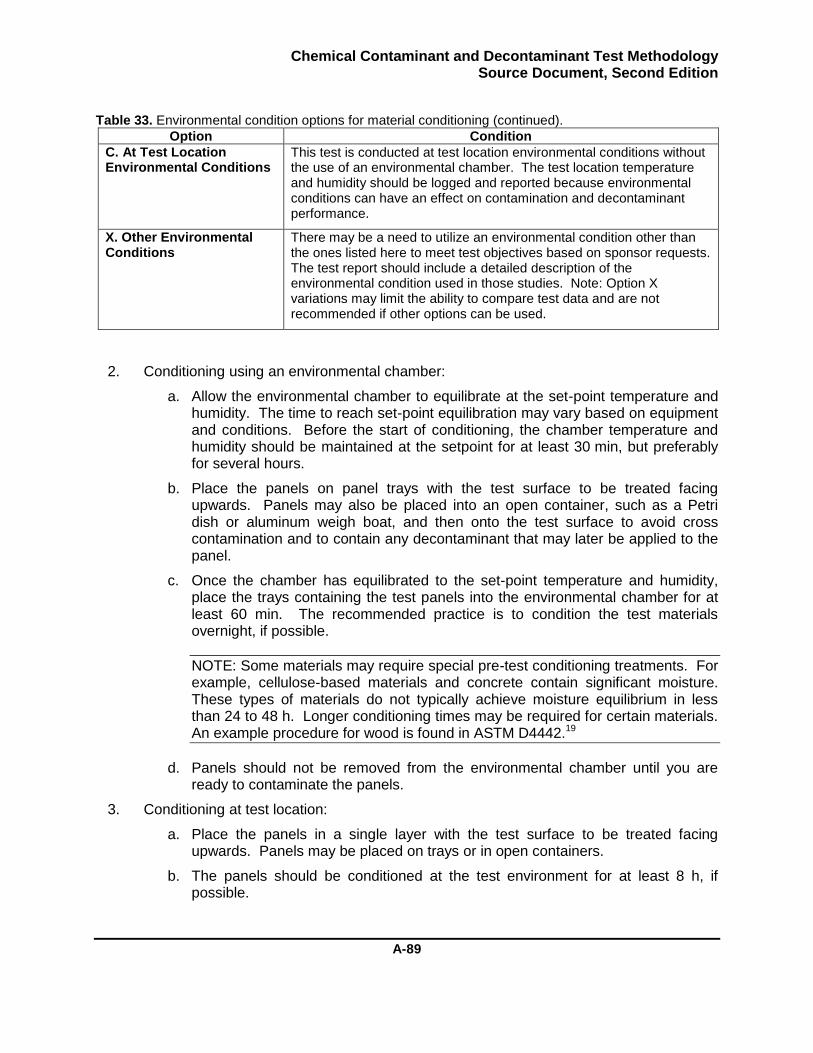
Chemical Contaminant and Decontaminant Test Methodology Source Document, Second Edition
A-89
Table 33. Environmental condition options for material conditioning (continued).
Option Condition
C. At Test Location Environmental Conditions
This test is conducted at test location environmental conditions without the use of an environmental chamber. The test location temperature and humidity should be logged and reported because environmental conditions can have an effect on contamination and decontaminant performance.
X. Other Environmental Conditions
There may be a need to utilize an environmental condition other than the ones listed here to meet test objectives based on sponsor requests. The test report should include a detailed description of the environmental condition used in those studies. Note: Option X variations may limit the ability to compare test data and are not recommended if other options can be used.
2. Conditioning using an environmental chamber:
a. Allow the environmental chamber to equilibrate at the set-point temperature and humidity. The time to reach set-point equilibration may vary based on equipment and conditions. Before the start of conditioning, the chamber temperature and humidity should be maintained at the setpoint for at least 30 min, but preferably for several hours.
b. Place the panels on panel trays with the test surface to be treated facing upwards. Panels may also be placed into an open container, such as a Petri dish or aluminum weigh boat, and then onto the test surface to avoid cross contamination and to contain any decontaminant that may later be applied to the panel.
c. Once the chamber has equilibrated to the set-point temperature and humidity, place the trays containing the test panels into the environmental chamber for at least 60 min. The recommended practice is to condition the test materials overnight, if possible.
NOTE: Some materials may require special pre-test conditioning treatments. For example, cellulose-based materials and concrete contain significant moisture. These types of materials do not typically achieve moisture equilibrium in less than 24 to 48 h. Longer conditioning times may be required for certain materials. An example procedure for wood is found in ASTM D4442.19
d. Panels should not be removed from the environmental chamber until you are ready to contaminate the panels.
3. Conditioning at test location:
a. Place the panels in a single layer with the test surface to be treated facing upwards. Panels may be placed on trays or in open containers.
b. The panels should be conditioned at the test environment for at least 8 h, if possible.
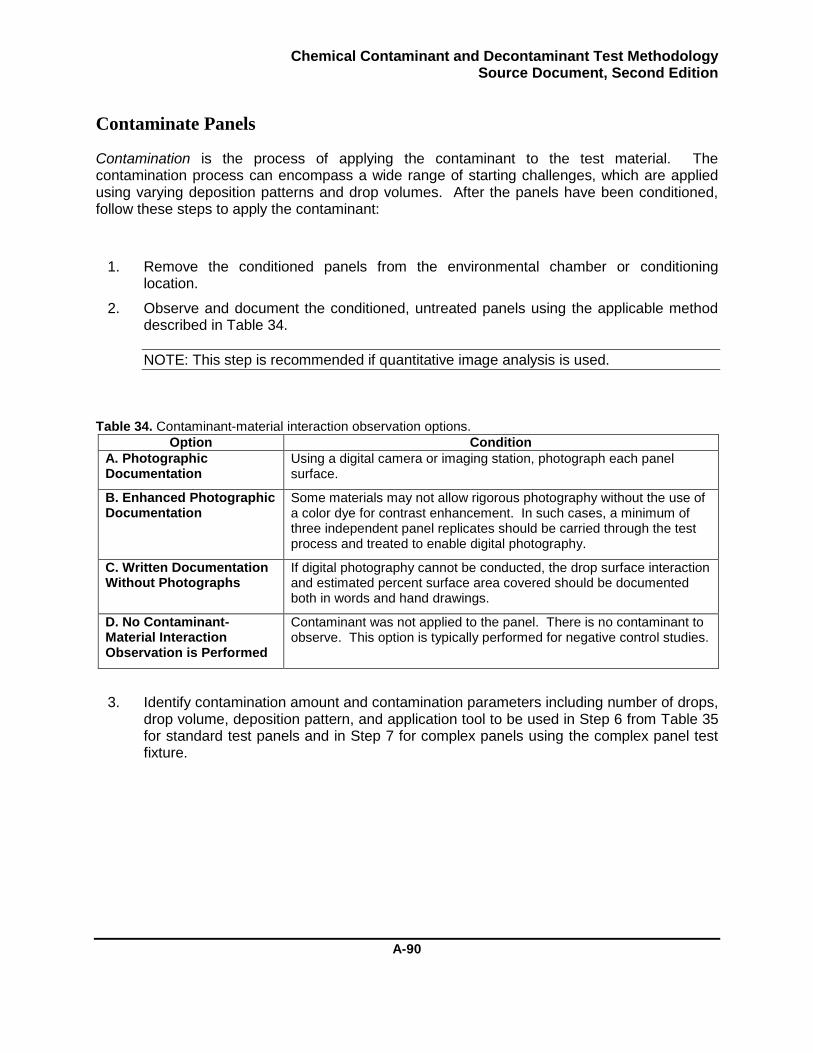
Chemical Contaminant and Decontaminant Test Methodology Source Document, Second Edition
A-90
Contaminate Panels
Contamination is the process of applying the contaminant to the test material. The contamination process can encompass a wide range of starting challenges, which are applied using varying deposition patterns and drop volumes. After the panels have been conditioned, follow these steps to apply the contaminant:
1. Remove the conditioned panels from the environmental chamber or conditioning location.
2. Observe and document the conditioned, untreated panels using the applicable method described in Table 34.
NOTE: This step is recommended if quantitative image analysis is used.
Table 34. Contaminant-material interaction observation options.
Option Condition
A. Photographic Documentation
Using a digital camera or imaging station, photograph each panel surface.
B. Enhanced Photographic Documentation
Some materials may not allow rigorous photography without the use of a color dye for contrast enhancement. In such cases, a minimum of three independent panel replicates should be carried through the test process and treated to enable digital photography.
C. Written Documentation Without Photographs
If digital photography cannot be conducted, the drop surface interaction and estimated percent surface area covered should be documented both in words and hand drawings.
D. No Contaminant-Material Interaction Observation is Performed
Contaminant was not applied to the panel. There is no contaminant to observe. This option is typically performed for negative control studies.
3. Identify contamination amount and contamination parameters including number of drops, drop volume, deposition pattern, and application tool to be used in Step 6 from Table 35 for standard test panels and in Step 7 for complex panels using the complex panel test fixture.
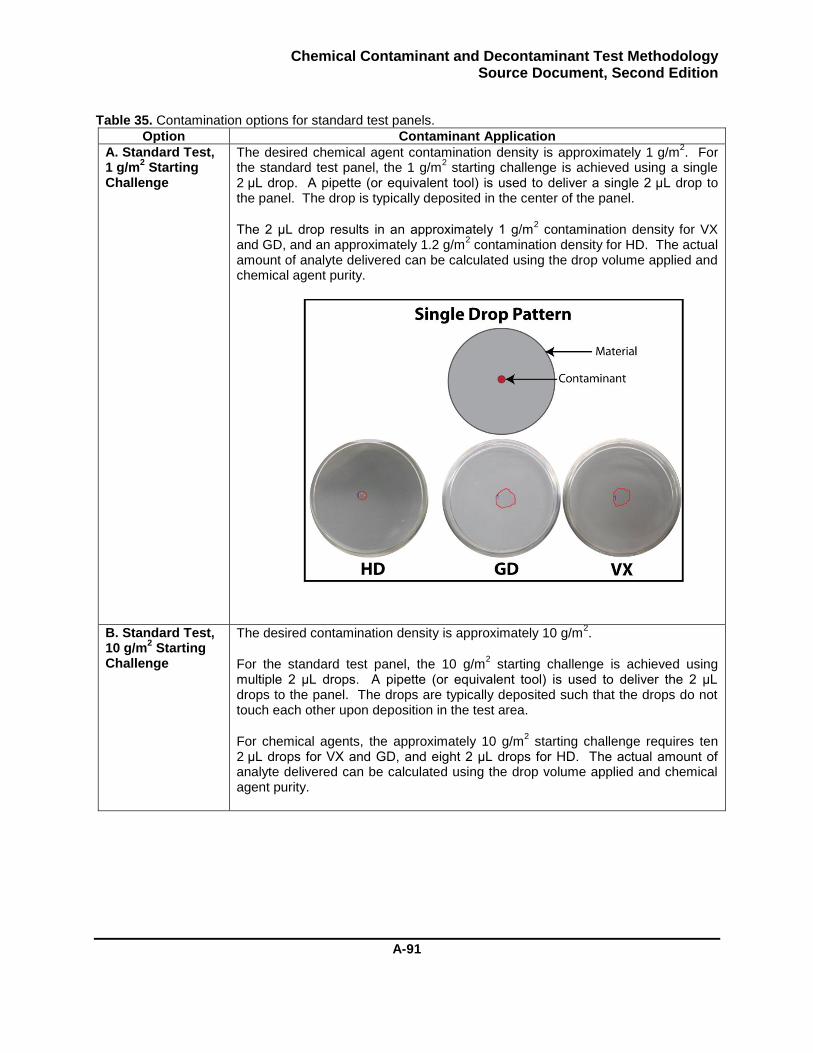
Chemical Contaminant and Decontaminant Test Methodology Source Document, Second Edition
A-91
Table 35. Contamination options for standard test panels.
Option Contaminant Application
A. Standard Test, 1 g/m
2 Starting
Challenge
The desired chemical agent contamination density is approximately 1 g/m2. For
the standard test panel, the 1 g/m2 starting challenge is achieved using a single
2 μL drop. A pipette (or equivalent tool) is used to deliver a single 2 μL drop to the panel. The drop is typically deposited in the center of the panel.
The 2 μL drop results in an approximately 1 g/m2 contamination density for VX
and GD, and an approximately 1.2 g/m2 contamination density for HD. The actual
amount of analyte delivered can be calculated using the drop volume applied and chemical agent purity.
B. Standard Test, 10 g/m
2 Starting
Challenge
The desired contamination density is approximately 10 g/m2.
For the standard test panel, the 10 g/m2 starting challenge is achieved using
multiple 2 μL drops. A pipette (or equivalent tool) is used to deliver the 2 μL drops to the panel. The drops are typically deposited such that the drops do not touch each other upon deposition in the test area.
For chemical agents, the approximately 10 g/m2 starting challenge requires ten
2 μL drops for VX and GD, and eight 2 μL drops for HD. The actual amount of analyte delivered can be calculated using the drop volume applied and chemical agent purity.
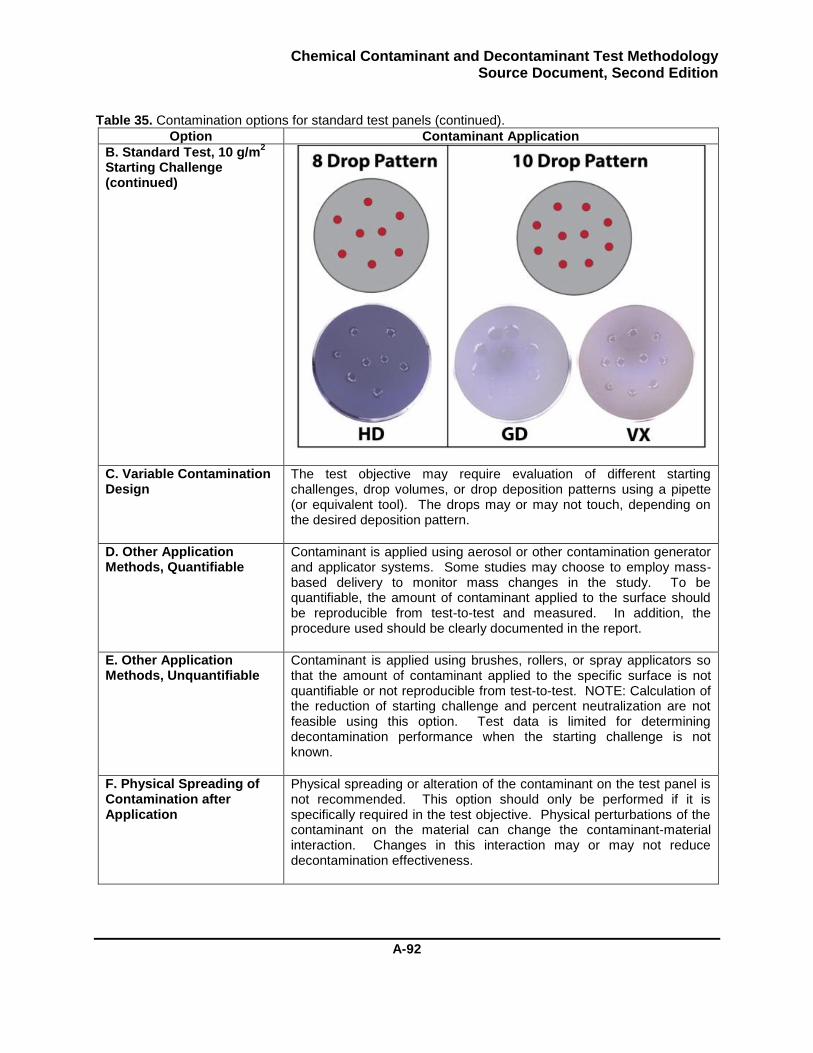
Chemical Contaminant and Decontaminant Test Methodology Source Document, Second Edition
A-92
Table 35. Contamination options for standard test panels (continued).
Option Contaminant Application
B. Standard Test, 10 g/m2
Starting Challenge (continued)
C. Variable Contamination Design
The test objective may require evaluation of different starting challenges, drop volumes, or drop deposition patterns using a pipette (or equivalent tool). The drops may or may not touch, depending on the desired deposition pattern.
D. Other Application Methods, Quantifiable
Contaminant is applied using aerosol or other contamination generator and applicator systems. Some studies may choose to employ mass-based delivery to monitor mass changes in the study. To be quantifiable, the amount of contaminant applied to the surface should be reproducible from test-to-test and measured. In addition, the procedure used should be clearly documented in the report.
E. Other Application Methods, Unquantifiable
Contaminant is applied using brushes, rollers, or spray applicators so that the amount of contaminant applied to the specific surface is not quantifiable or not reproducible from test-to-test. NOTE: Calculation of the reduction of starting challenge and percent neutralization are not feasible using this option. Test data is limited for determining decontamination performance when the starting challenge is not known.
F. Physical Spreading of Contamination after Application
Physical spreading or alteration of the contaminant on the test panel is not recommended. This option should only be performed if it is specifically required in the test objective. Physical perturbations of the contaminant on the material can change the contaminant-material interaction. Changes in this interaction may or may not reduce decontamination effectiveness.
Chemical Contaminant and Decontaminant Test Methodology Source Document, Second Edition
A-93
Table 35. Contamination options for standard test panels (continued).
Option Contaminant Application
F. Physical Spreading of Contamination after Application (continued)
Physical perturbations of the contaminant should use a material that does not sorb contaminant because this may change the starting challenge. The tool used to perform the spreading should be placed in solvent and the amount of contaminant transferred to the spreading tool should be determined and reported. This loss of contaminant may be needed for some data analyses and for full context of the test results.
G. No Contaminant is Applied.
Contaminant is not applied to the panel. This option is typically performed for negative control studies.
NOTE: Starting challenge is typically defined as 1 g/m2 of liquid. The specification is relevant to the mass of liquid applied to the panel, not necessarily to the mass of analyte/contaminant. The mass of liquid times the contaminant purity indicates the mass of contaminant analyte applied to the panel.
2. Set the tool to appropriate drop volume.
NOTE: The pipette volume should not be changed within a set of procedures. Tests have shown that changing the tool’s dispensing volumes can affect the accuracy and precision of the delivered mass. If changes must be made, DCS must be prepared after each change.
3. Fit the pipettor with a clean, appropriate pipette tip.
4. Load the contaminant delivery tool in accordance with manufacturer’s directions.
5. If using pipettes or syringes to deliver contaminant, prepare the initial DCS. At least three replicate samples are recommended.
a. Uncap the vial.
b. Deliver the appropriate number of drops to a scintillation vial containing 20 mL of extraction solvent to achieve the contamination density.
c. Cap the scintillation vial.
d. Thoroughly mix contents by inverting the vial three times.
NOTE: Steps 5e, 5f, and 5g may be performed later in the test when samples are diluted and prepared for analysis. This delay in steps 5e and 5f typically occurs with tests using a large number of panels, enabling completion of the staggered timing chart. The samples should be prepared for analysis on the same day as the test. Samples should be run as soon as possible after the end of the test to reduce potential issues due to sample degradation.
e. Uncap the scintillation vial.
Chemical Contaminant and Decontaminant Test Methodology Source Document, Second Edition
A-94
f. Using a clean, disposable pipette, load the analytical vial with an aliquot of extractant solution.
g. Cap the analytical and scintillation vials.
6. Remove the cover from the holder containing a conditioned panel, if a cover was used.
7. Contaminate the standard test panels (if used and contaminated in the test) by delivering the appropriate number of drops to the panel surface to achieve the desired contamination density. Reload the tool and repeat as needed for the total number of panels. The start of the contaminant-material interaction aging period (age time equals zero) for each panel is defined as the time when the first contaminant droplet is applied to the panel. The use of timing charts for multiple samples is recommended.
NOTE: If the repeater pipette is at rest for more than a few seconds, the pipette should be primed by dispensing a drop onto a rejected panel, adsorbent paper (M8 paper for surety tests), waste container, or equivalent. Solvent and contaminant evaporation can occur in the tip, affecting the next dose from the tool.
8. Contaminate complex test panels (if used and contaminated in the test) using the appropriate process in Table 36. Reload the tool and repeat as needed for the total number of panels. The start of the contaminant-material interaction aging period (age time equals zero) for each panel is defined as the time when the first contaminant droplet is applied to the panel. The use of timing charts for multiple samples is recommended.
NOTE: If the repeater pipette is at rest for more than a few seconds, the pipette should be primed by dispensing a drop onto a rejected panel, adsorbent paper (M8 paper for surety tests), waste container, or equivalent. Solvent and contaminant evaporation can occur in the tip, affecting the next dose from the tool.
NOTE: Two options are provided for the contamination of vertical orientation panels because it may be difficult to safely and reproducibly contaminate materials in the vertical orientation. Pipettes often provide poor accuracy and reproducibility, if not held in a vertical orientation during dispensing. The Option A configuration facilitates the vertical orientation of pipettes for the contamination process. The Option B configuration can be used if the vertical panel cannot be tilted.
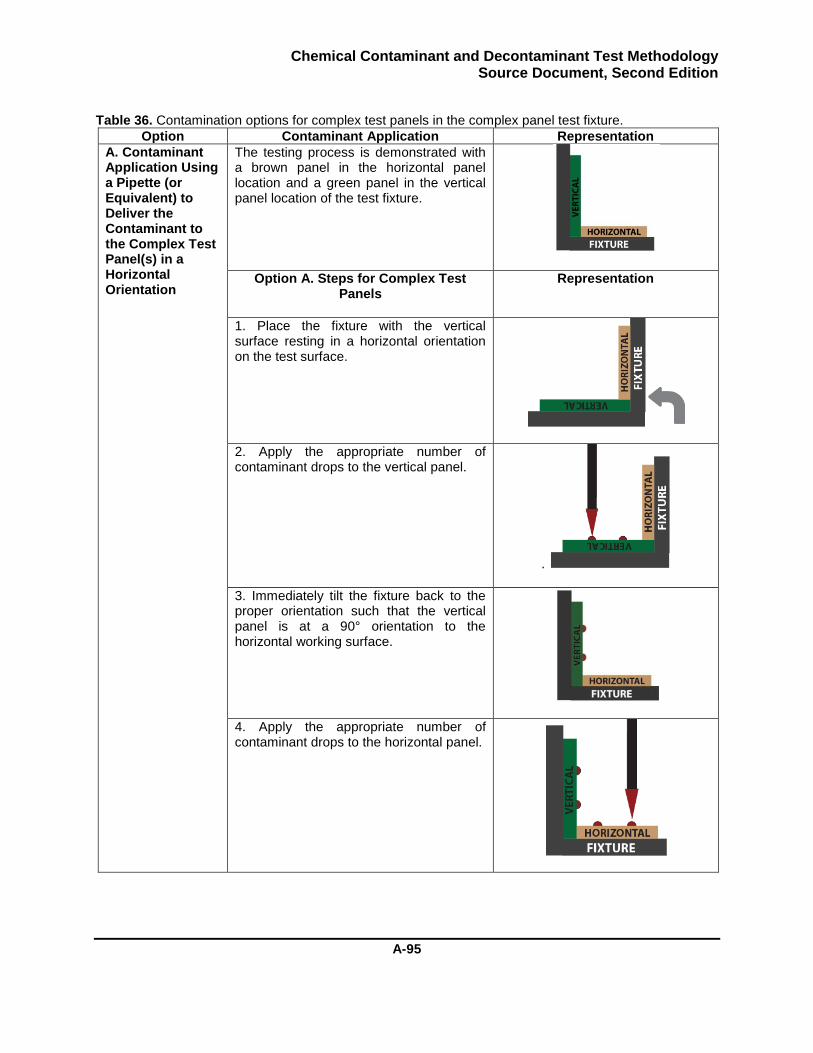
Chemical Contaminant and Decontaminant Test Methodology Source Document, Second Edition
A-95
Table 36. Contamination options for complex test panels in the complex panel test fixture.
Option Contaminant Application Representation
A. Contaminant Application Using a Pipette (or Equivalent) to Deliver the Contaminant to the Complex Test Panel(s) in a Horizontal Orientation
The testing process is demonstrated with a brown panel in the horizontal panel location and a green panel in the vertical panel location of the test fixture.
Option A. Steps for Complex Test Panels
Representation
1. Place the fixture with the vertical surface resting in a horizontal orientation on the test surface.
2. Apply the appropriate number of contaminant drops to the vertical panel.
.
3. Immediately tilt the fixture back to the proper orientation such that the vertical panel is at a 90° orientation to the horizontal working surface.
4. Apply the appropriate number of contaminant drops to the horizontal panel.
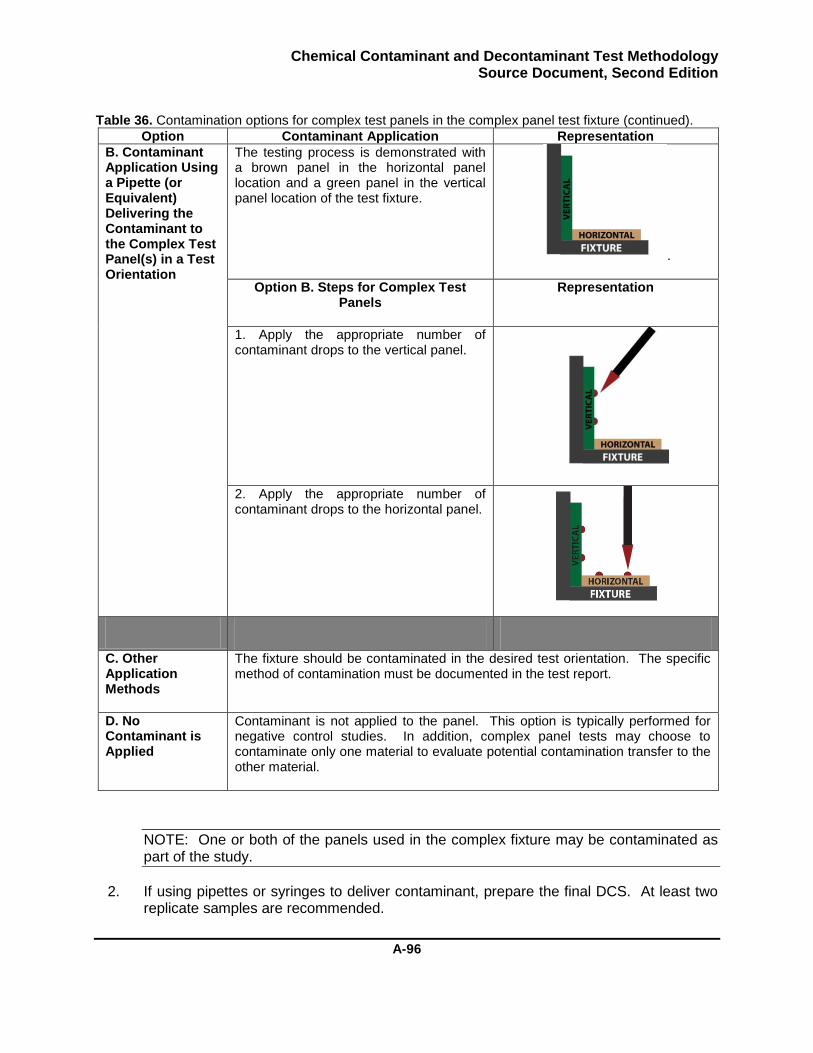
Chemical Contaminant and Decontaminant Test Methodology Source Document, Second Edition
A-96
Table 36. Contamination options for complex test panels in the complex panel test fixture (continued).
Option Contaminant Application Representation
B. Contaminant Application Using a Pipette (or Equivalent) Delivering the Contaminant to the Complex Test Panel(s) in a Test Orientation
The testing process is demonstrated with a brown panel in the horizontal panel location and a green panel in the vertical panel location of the test fixture.
.
Option B. Steps for Complex Test Panels
Representation
1. Apply the appropriate number of contaminant drops to the vertical panel.
2. Apply the appropriate number of contaminant drops to the horizontal panel.
C. Other Application Methods
The fixture should be contaminated in the desired test orientation. The specific method of contamination must be documented in the test report.
D. No Contaminant is Applied
Contaminant is not applied to the panel. This option is typically performed for negative control studies. In addition, complex panel tests may choose to contaminate only one material to evaluate potential contamination transfer to the other material.
NOTE: One or both of the panels used in the complex fixture may be contaminated as part of the study.
2. If using pipettes or syringes to deliver contaminant, prepare the final DCS. At least two replicate samples are recommended.
Chemical Contaminant and Decontaminant Test Methodology Source Document, Second Edition
A-97
a. Uncap the vial.
b. Deliver the appropriate number of drops to a scintillation vial containing 20 mL of extraction solvent to achieve the contamination density.
c. Cap the scintillation vial.
d. Thoroughly mix contents by inverting the vial three times.
NOTE: Steps 2e, 2f, and 2g may be performed later in the test when samples are diluted and prepared for analysis. This delay in steps 2e and 2f typically occurs in tests using a large number of panels, enabling completion of the staggered timing chart. The samples should be prepared for analysis on the same day as the test. Samples should be run as soon as possible after the end of the test to reduce potential issues due to sample degradation.
e. Uncap the scintillation vial.
f. Using a clean, disposable pipette, load the analytical vial with an aliquot of extractant solution.
g. Cap the analytical and scintillation vials.
Contaminant-Material Interaction Aging Period
The contaminant-material interaction aging period is the amount of time that the contaminant resides on the test material until the next action on the panel action begins. The next action to be performed on the panel can be the pre-decontamination rinse, the application of decontaminant, or a post-treatment evaluation. The time when the next panel action begins defines the end of the contaminant-material interaction aging period. After the panels have been contaminated, follow these steps for the contaminant-material interaction aging period:
NOTE: The contaminant-material interaction aging period determines the agent distribution in the material. Mass transport processes such as agent absorption into and evaporation from the material occur during the aging period. Temperature and time are two key variables that can affect the mass transport of a contaminant. Therefore, the timing of this process must be accurately controlled, and the panels should kept at the setpoint temperature by spending as little time outside of temperature controlled environments as possible.
1. Allow the contaminated panels to age for a specified period of time ±10% (or up to 30 s, whichever is longer) according to the applicable guideline in Table 37. During the aging period steps 3-5 may be performed, if applicable, and step 6 must be performed.
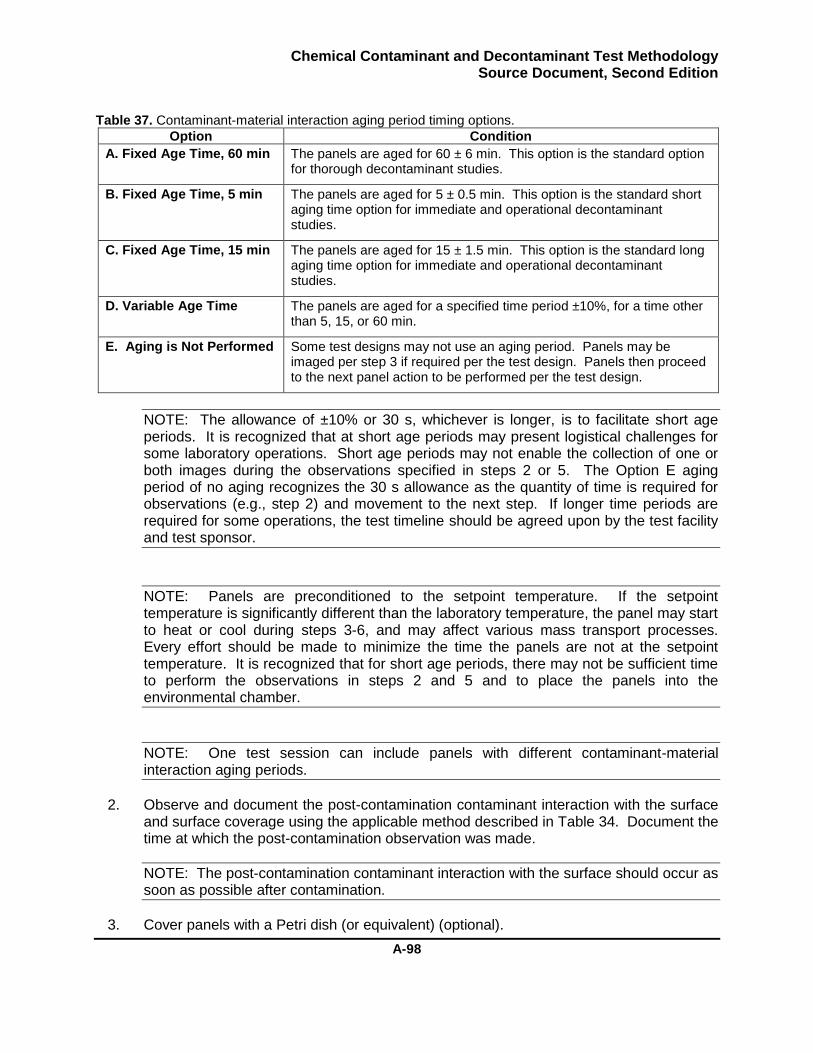
Chemical Contaminant and Decontaminant Test Methodology Source Document, Second Edition
A-98
Table 37. Contaminant-material interaction aging period timing options.
Option Condition
A. Fixed Age Time, 60 min The panels are aged for 60 ± 6 min. This option is the standard option for thorough decontaminant studies.
B. Fixed Age Time, 5 min The panels are aged for 5 ± 0.5 min. This option is the standard short aging time option for immediate and operational decontaminant studies.
C. Fixed Age Time, 15 min The panels are aged for 15 ± 1.5 min. This option is the standard long aging time option for immediate and operational decontaminant studies.
D. Variable Age Time The panels are aged for a specified time period ±10%, for a time other than 5, 15, or 60 min.
E. Aging is Not Performed Some test designs may not use an aging period. Panels may be imaged per step 3 if required per the test design. Panels then proceed to the next panel action to be performed per the test design.
NOTE: The allowance of ±10% or 30 s, whichever is longer, is to facilitate short age periods. It is recognized that at short age periods may present logistical challenges for some laboratory operations. Short age periods may not enable the collection of one or both images during the observations specified in steps 2 or 5. The Option E aging period of no aging recognizes the 30 s allowance as the quantity of time is required for observations (e.g., step 2) and movement to the next step. If longer time periods are required for some operations, the test timeline should be agreed upon by the test facility and test sponsor.
NOTE: Panels are preconditioned to the setpoint temperature. If the setpoint temperature is significantly different than the laboratory temperature, the panel may start to heat or cool during steps 3-6, and may affect various mass transport processes. Every effort should be made to minimize the time the panels are not at the setpoint temperature. It is recognized that for short age periods, there may not be sufficient time to perform the observations in steps 2 and 5 and to place the panels into the environmental chamber.
NOTE: One test session can include panels with different contaminant-material interaction aging periods.
2. Observe and document the post-contamination contaminant interaction with the surface and surface coverage using the applicable method described in Table 34. Document the time at which the post-contamination observation was made.
NOTE: The post-contamination contaminant interaction with the surface should occur as soon as possible after contamination.
3. Cover panels with a Petri dish (or equivalent) (optional).
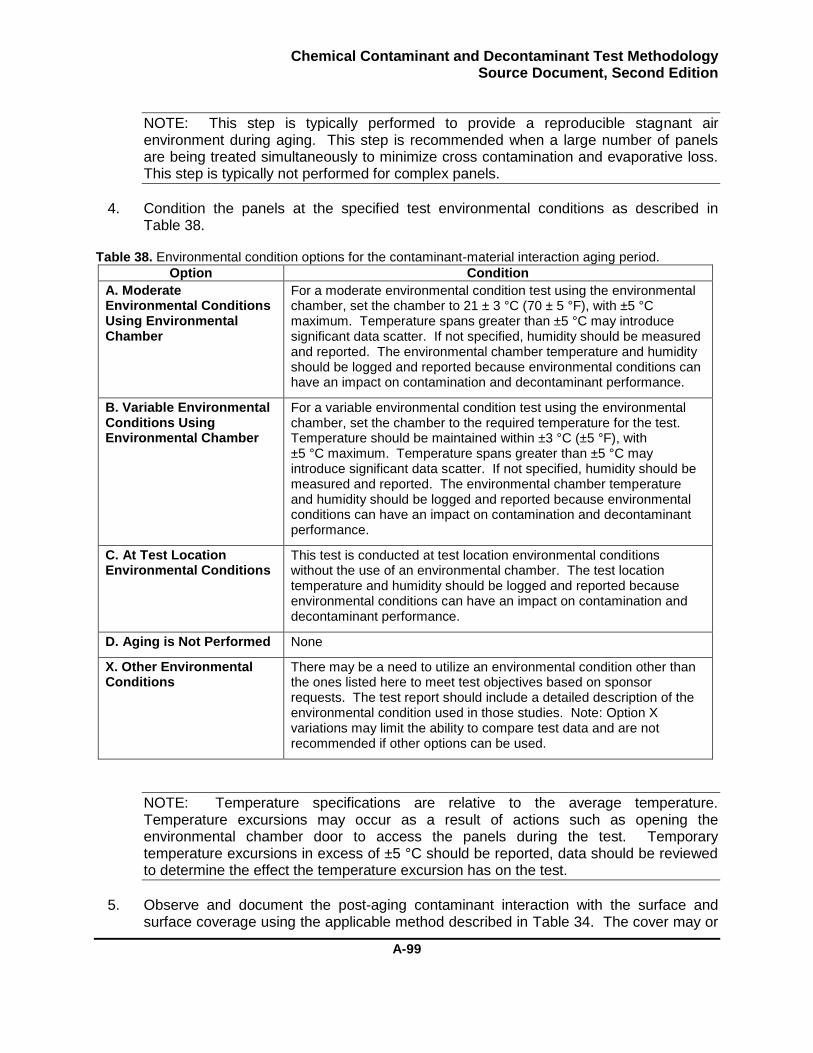
Chemical Contaminant and Decontaminant Test Methodology Source Document, Second Edition
A-99
NOTE: This step is typically performed to provide a reproducible stagnant air environment during aging. This step is recommended when a large number of panels are being treated simultaneously to minimize cross contamination and evaporative loss. This step is typically not performed for complex panels.
4. Condition the panels at the specified test environmental conditions as described in Table 38.
Table 38. Environmental condition options for the contaminant-material interaction aging period.
Option Condition
A. Moderate Environmental Conditions Using Environmental Chamber
For a moderate environmental condition test using the environmental chamber, set the chamber to 21 ± 3 °C (70 ± 5 °F), with ±5 °C maximum. Temperature spans greater than ±5 °C may introduce significant data scatter. If not specified, humidity should be measured and reported. The environmental chamber temperature and humidity should be logged and reported because environmental conditions can have an impact on contamination and decontaminant performance.
B. Variable Environmental Conditions Using Environmental Chamber
For a variable environmental condition test using the environmental chamber, set the chamber to the required temperature for the test. Temperature should be maintained within ±3 °C (±5 °F), with ±5 °C maximum. Temperature spans greater than ±5 °C may introduce significant data scatter. If not specified, humidity should be measured and reported. The environmental chamber temperature and humidity should be logged and reported because environmental conditions can have an impact on contamination and decontaminant performance.
C. At Test Location Environmental Conditions
This test is conducted at test location environmental conditions without the use of an environmental chamber. The test location temperature and humidity should be logged and reported because environmental conditions can have an impact on contamination and decontaminant performance.
D. Aging is Not Performed None
X. Other Environmental Conditions
There may be a need to utilize an environmental condition other than the ones listed here to meet test objectives based on sponsor requests. The test report should include a detailed description of the environmental condition used in those studies. Note: Option X variations may limit the ability to compare test data and are not recommended if other options can be used.
NOTE: Temperature specifications are relative to the average temperature. Temperature excursions may occur as a result of actions such as opening the environmental chamber door to access the panels during the test. Temporary temperature excursions in excess of ±5 °C should be reported, data should be reviewed to determine the effect the temperature excursion has on the test.
5. Observe and document the post-aging contaminant interaction with the surface and surface coverage using the applicable method described in Table 34. The cover may or
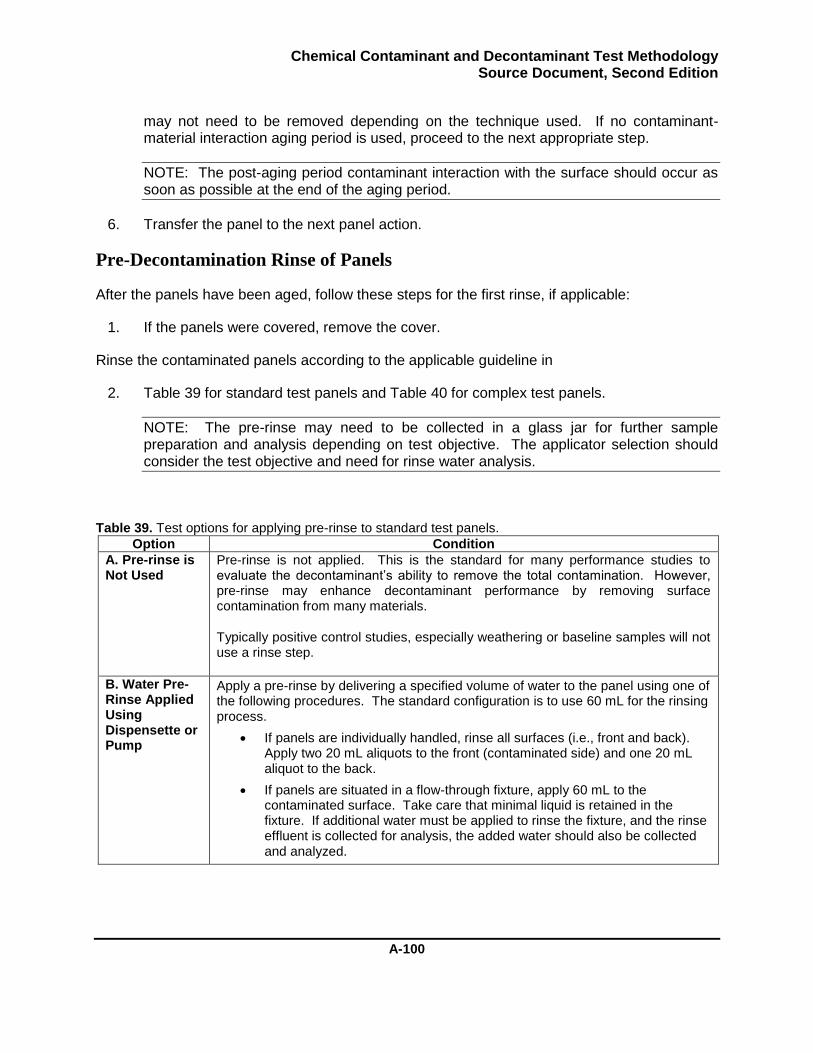
Chemical Contaminant and Decontaminant Test Methodology Source Document, Second Edition
A-100
may not need to be removed depending on the technique used. If no contaminant-material interaction aging period is used, proceed to the next appropriate step.
NOTE: The post-aging period contaminant interaction with the surface should occur as soon as possible at the end of the aging period.
6. Transfer the panel to the next panel action.
Pre-Decontamination Rinse of Panels
After the panels have been aged, follow these steps for the first rinse, if applicable:
1. If the panels were covered, remove the cover.
Rinse the contaminated panels according to the applicable guideline in
2. Table 39 for standard test panels and Table 40 for complex test panels.
NOTE: The pre-rinse may need to be collected in a glass jar for further sample preparation and analysis depending on test objective. The applicator selection should consider the test objective and need for rinse water analysis.
Table 39. Test options for applying pre-rinse to standard test panels.
Option Condition
A. Pre-rinse is Not Used
Pre-rinse is not applied. This is the standard for many performance studies to evaluate the decontaminant’s ability to remove the total contamination. However, pre-rinse may enhance decontaminant performance by removing surface contamination from many materials.
Typically positive control studies, especially weathering or baseline samples will not use a rinse step.
B. Water Pre-Rinse Applied Using Dispensette or Pump
Apply a pre-rinse by delivering a specified volume of water to the panel using one of the following procedures. The standard configuration is to use 60 mL for the rinsing process.
If panels are individually handled, rinse all surfaces (i.e., front and back). Apply two 20 mL aliquots to the front (contaminated side) and one 20 mL aliquot to the back.
If panels are situated in a flow-through fixture, apply 60 mL to the contaminated surface. Take care that minimal liquid is retained in the fixture. If additional water must be applied to rinse the fixture, and the rinse effluent is collected for analysis, the added water should also be collected and analyzed.
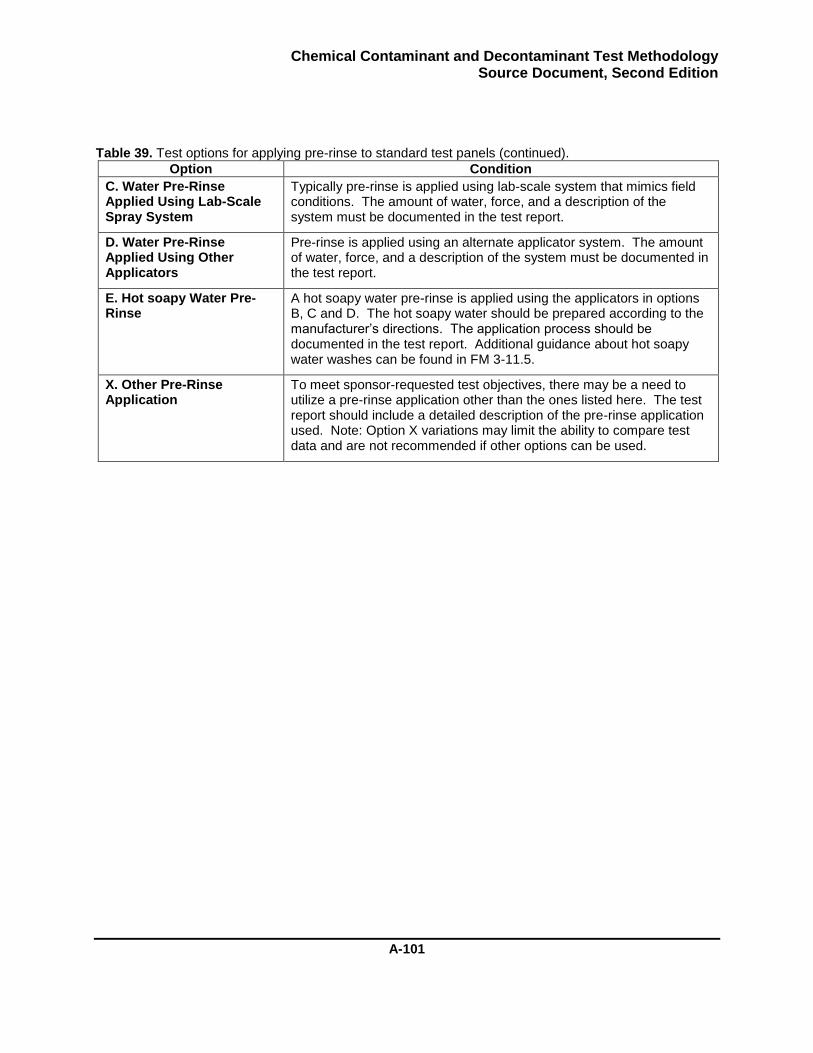
Chemical Contaminant and Decontaminant Test Methodology Source Document, Second Edition
A-101
Table 39. Test options for applying pre-rinse to standard test panels (continued).
Option Condition
C. Water Pre-Rinse Applied Using Lab-Scale Spray System
Typically pre-rinse is applied using lab-scale system that mimics field conditions. The amount of water, force, and a description of the system must be documented in the test report.
D. Water Pre-Rinse Applied Using Other Applicators
Pre-rinse is applied using an alternate applicator system. The amount of water, force, and a description of the system must be documented in the test report.
E. Hot soapy Water Pre-Rinse
A hot soapy water pre-rinse is applied using the applicators in options B, C and D. The hot soapy water should be prepared according to the manufacturer’s directions. The application process should be documented in the test report. Additional guidance about hot soapy water washes can be found in FM 3-11.5.
X. Other Pre-Rinse Application
To meet sponsor-requested test objectives, there may be a need to utilize a pre-rinse application other than the ones listed here. The test report should include a detailed description of the pre-rinse application used. Note: Option X variations may limit the ability to compare test data and are not recommended if other options can be used.

Chemical Contaminant and Decontaminant Test Methodology Source Document, Second Edition
A-102
Table 40. Test options for applying pre-rinse to complex test panels.
Option Condition
A. Pre-rinse is Not Used Pre-rinse is not applied. This is the standard for many performance studies to evaluate the decontaminant’s ability to remove the total contamination. However, pre-rinse may enhance decontaminant performance by removing surface contamination from many materials.
Typically positive control studies, especially weathering or baseline samples will not use a rinse step.
B1. Water Pre-Rinse Applied Using Dispensette or Pump with Panels in Fixture
Apply a pre-rinse by delivering a specified volume of water to the panels in the fixture. The standard configuration is to use 120 mL for the rinsing process. The rinse effluent can be collected for further analysis.
Apply a total of 60 mL to the panel in the vertical orientation. The rinsing process should minimize water flow onto the horizontal panel.
Apply a total of 60 mL to the panel in the horizontal orientation. The rinsing process should minimize water flow onto the vertical panel.
Take care that minimal liquid is retained in the fixture. If additional water must be applied to rinse the fixture and the rinse effluent is collected for analysis, that water should also be collected and analyzed.
B2. Water Pre-Rinse Applied Using Dispensette or Pump with panels Removed from the Fixture.
This option is less preferred for the pre-rinse because changes that affect rinsing may also have an effect on contaminant transfer. In addition, this step requires additional time to remove and then reinstall the panels into the test fixture.
Remove the vertical panel from the fixture.
Apply two 20 mL aliquots to the front (contaminated side) and one 20 mL aliquot to the back.
Place the vertical panel onto a lined test tray (or working surface) with the contaminated surface facing upwards.
Repeat the process for the horizontal panel.
Reassemble the panels into the complex fixture.
NOTE: Disassembly of the vertical and horizontal panels eliminates the vertical-horizontal interface, which may retain contaminant. The disassembled case (Option B2) is more likely to rinse away any liquid now on the edge of the panels.
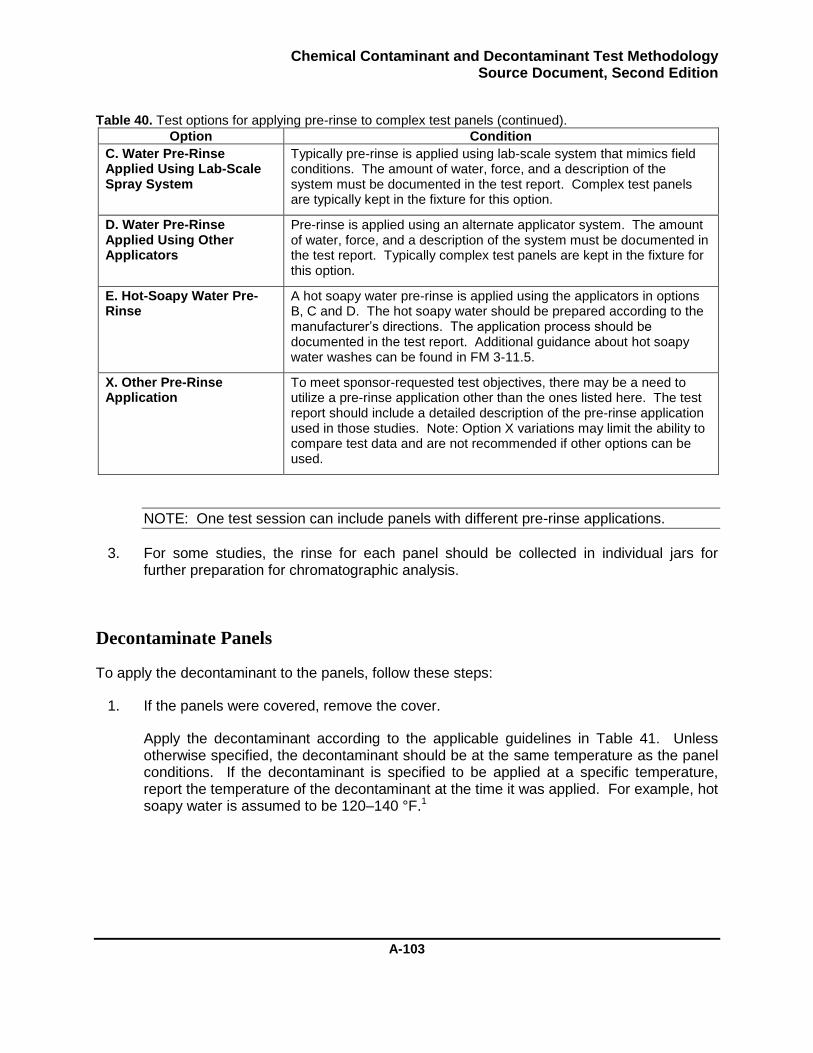
Chemical Contaminant and Decontaminant Test Methodology Source Document, Second Edition
A-103
Table 40. Test options for applying pre-rinse to complex test panels (continued).
Option Condition
C. Water Pre-Rinse Applied Using Lab-Scale Spray System
Typically pre-rinse is applied using lab-scale system that mimics field conditions. The amount of water, force, and a description of the system must be documented in the test report. Complex test panels are typically kept in the fixture for this option.
D. Water Pre-Rinse Applied Using Other Applicators
Pre-rinse is applied using an alternate applicator system. The amount of water, force, and a description of the system must be documented in the test report. Typically complex test panels are kept in the fixture for this option.
E. Hot-Soapy Water Pre-Rinse
A hot soapy water pre-rinse is applied using the applicators in options B, C and D. The hot soapy water should be prepared according to the manufacturer’s directions. The application process should be documented in the test report. Additional guidance about hot soapy water washes can be found in FM 3-11.5.
X. Other Pre-Rinse Application
To meet sponsor-requested test objectives, there may be a need to utilize a pre-rinse application other than the ones listed here. The test report should include a detailed description of the pre-rinse application used in those studies. Note: Option X variations may limit the ability to compare test data and are not recommended if other options can be used.
NOTE: One test session can include panels with different pre-rinse applications.
3. For some studies, the rinse for each panel should be collected in individual jars for further preparation for chromatographic analysis.
Decontaminate Panels
To apply the decontaminant to the panels, follow these steps:
1. If the panels were covered, remove the cover.
Apply the decontaminant according to the applicable guidelines in Table 41. Unless otherwise specified, the decontaminant should be at the same temperature as the panel conditions. If the decontaminant is specified to be applied at a specific temperature, report the temperature of the decontaminant at the time it was applied. For example, hot soapy water is assumed to be 120–140 °F.1
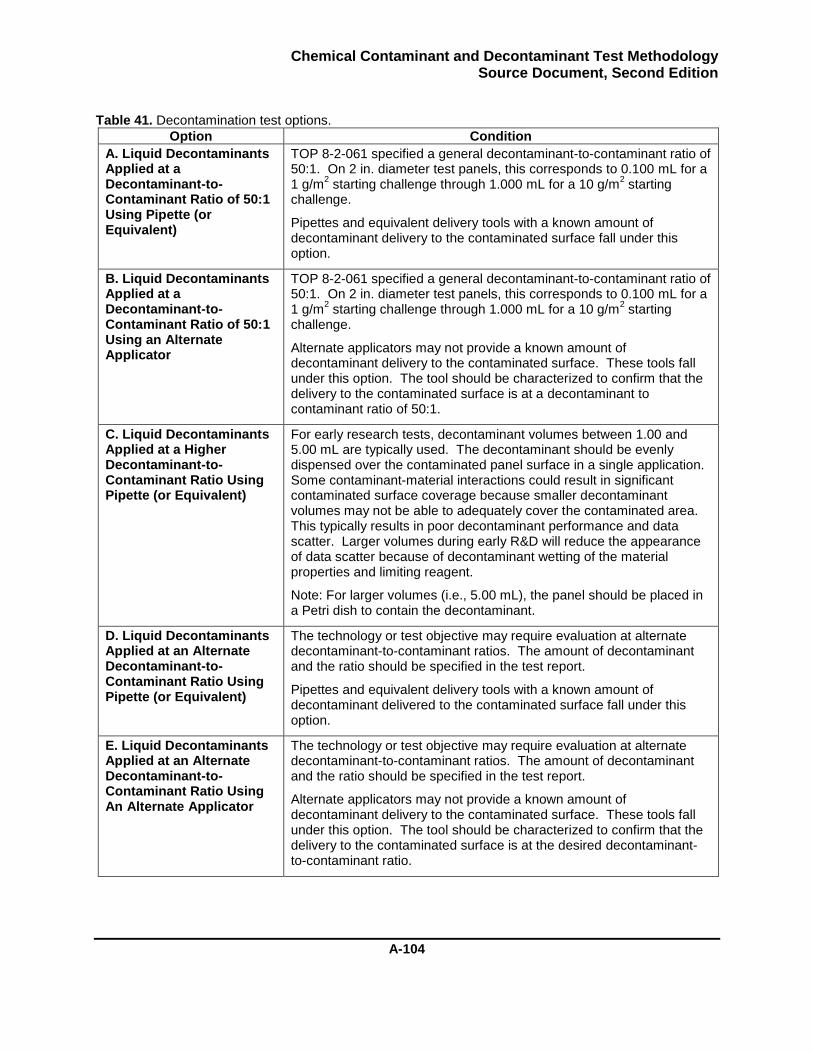
Chemical Contaminant and Decontaminant Test Methodology Source Document, Second Edition
A-104
Table 41. Decontamination test options.
Option Condition
A. Liquid Decontaminants Applied at a Decontaminant-to-Contaminant Ratio of 50:1 Using Pipette (or Equivalent)
TOP 8-2-061 specified a general decontaminant-to-contaminant ratio of 50:1. On 2 in. diameter test panels, this corresponds to 0.100 mL for a 1 g/m
2 starting challenge through 1.000 mL for a 10 g/m
2 starting
challenge.
Pipettes and equivalent delivery tools with a known amount of decontaminant delivery to the contaminated surface fall under this option.
B. Liquid Decontaminants Applied at a Decontaminant-to-Contaminant Ratio of 50:1 Using an Alternate Applicator
TOP 8-2-061 specified a general decontaminant-to-contaminant ratio of 50:1. On 2 in. diameter test panels, this corresponds to 0.100 mL for a 1 g/m
2 starting challenge through 1.000 mL for a 10 g/m
2 starting
challenge.
Alternate applicators may not provide a known amount of decontaminant delivery to the contaminated surface. These tools fall under this option. The tool should be characterized to confirm that the delivery to the contaminated surface is at a decontaminant to contaminant ratio of 50:1.
C. Liquid Decontaminants Applied at a Higher Decontaminant-to-Contaminant Ratio Using Pipette (or Equivalent)
For early research tests, decontaminant volumes between 1.00 and 5.00 mL are typically used. The decontaminant should be evenly dispensed over the contaminated panel surface in a single application. Some contaminant-material interactions could result in significant contaminated surface coverage because smaller decontaminant volumes may not be able to adequately cover the contaminated area. This typically results in poor decontaminant performance and data scatter. Larger volumes during early R&D will reduce the appearance of data scatter because of decontaminant wetting of the material properties and limiting reagent.
Note: For larger volumes (i.e., 5.00 mL), the panel should be placed in a Petri dish to contain the decontaminant.
D. Liquid Decontaminants Applied at an Alternate Decontaminant-to-Contaminant Ratio Using Pipette (or Equivalent)
The technology or test objective may require evaluation at alternate decontaminant-to-contaminant ratios. The amount of decontaminant and the ratio should be specified in the test report.
Pipettes and equivalent delivery tools with a known amount of decontaminant delivered to the contaminated surface fall under this option.
E. Liquid Decontaminants Applied at an Alternate Decontaminant-to-Contaminant Ratio Using An Alternate Applicator
The technology or test objective may require evaluation at alternate decontaminant-to-contaminant ratios. The amount of decontaminant and the ratio should be specified in the test report.
Alternate applicators may not provide a known amount of decontaminant delivery to the contaminated surface. These tools fall under this option. The tool should be characterized to confirm that the delivery to the contaminated surface is at the desired decontaminant-to-contaminant ratio.
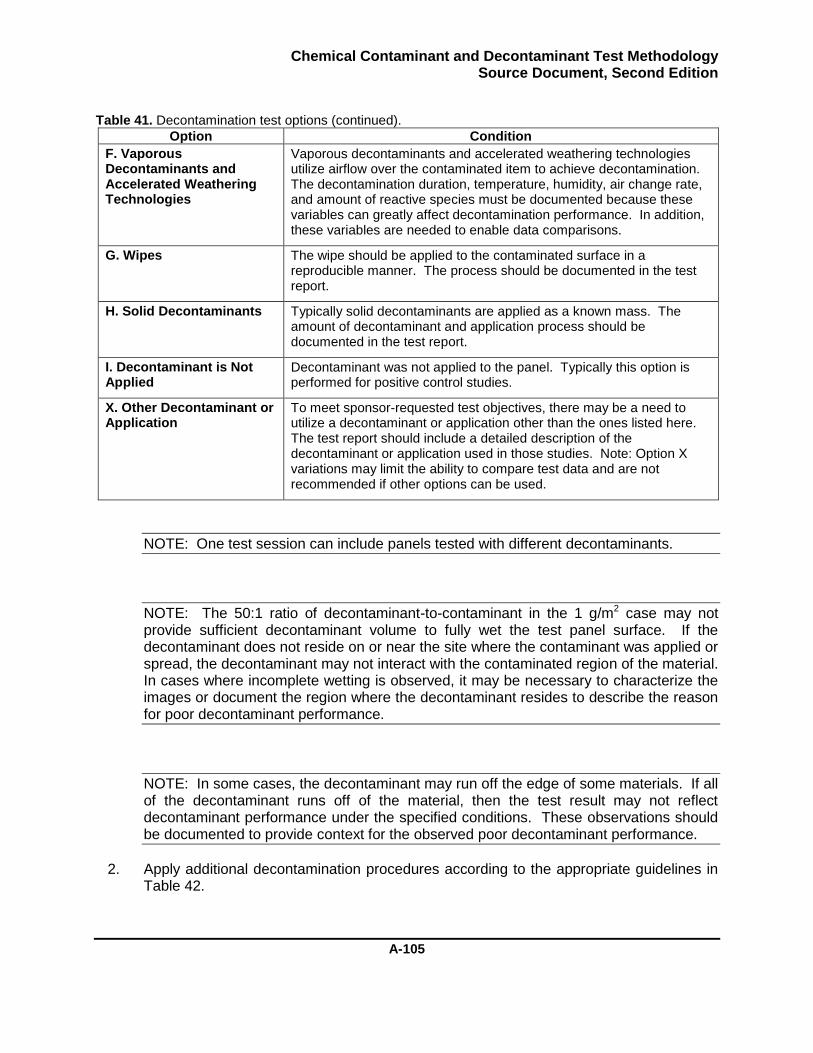
Chemical Contaminant and Decontaminant Test Methodology Source Document, Second Edition
A-105
Table 41. Decontamination test options (continued).
Option Condition
F. Vaporous Decontaminants and Accelerated Weathering Technologies
Vaporous decontaminants and accelerated weathering technologies utilize airflow over the contaminated item to achieve decontamination. The decontamination duration, temperature, humidity, air change rate, and amount of reactive species must be documented because these variables can greatly affect decontamination performance. In addition, these variables are needed to enable data comparisons.
G. Wipes The wipe should be applied to the contaminated surface in a reproducible manner. The process should be documented in the test report.
H. Solid Decontaminants Typically solid decontaminants are applied as a known mass. The amount of decontaminant and application process should be documented in the test report.
I. Decontaminant is Not Applied
Decontaminant was not applied to the panel. Typically this option is performed for positive control studies.
X. Other Decontaminant or Application
To meet sponsor-requested test objectives, there may be a need to utilize a decontaminant or application other than the ones listed here. The test report should include a detailed description of the decontaminant or application used in those studies. Note: Option X variations may limit the ability to compare test data and are not recommended if other options can be used.
NOTE: One test session can include panels tested with different decontaminants.
NOTE: The 50:1 ratio of decontaminant-to-contaminant in the 1 g/m2 case may not provide sufficient decontaminant volume to fully wet the test panel surface. If the decontaminant does not reside on or near the site where the contaminant was applied or spread, the decontaminant may not interact with the contaminated region of the material. In cases where incomplete wetting is observed, it may be necessary to characterize the images or document the region where the decontaminant resides to describe the reason for poor decontaminant performance.
NOTE: In some cases, the decontaminant may run off the edge of some materials. If all of the decontaminant runs off of the material, then the test result may not reflect decontaminant performance under the specified conditions. These observations should be documented to provide context for the observed poor decontaminant performance.
2. Apply additional decontamination procedures according to the appropriate guidelines in Table 42.
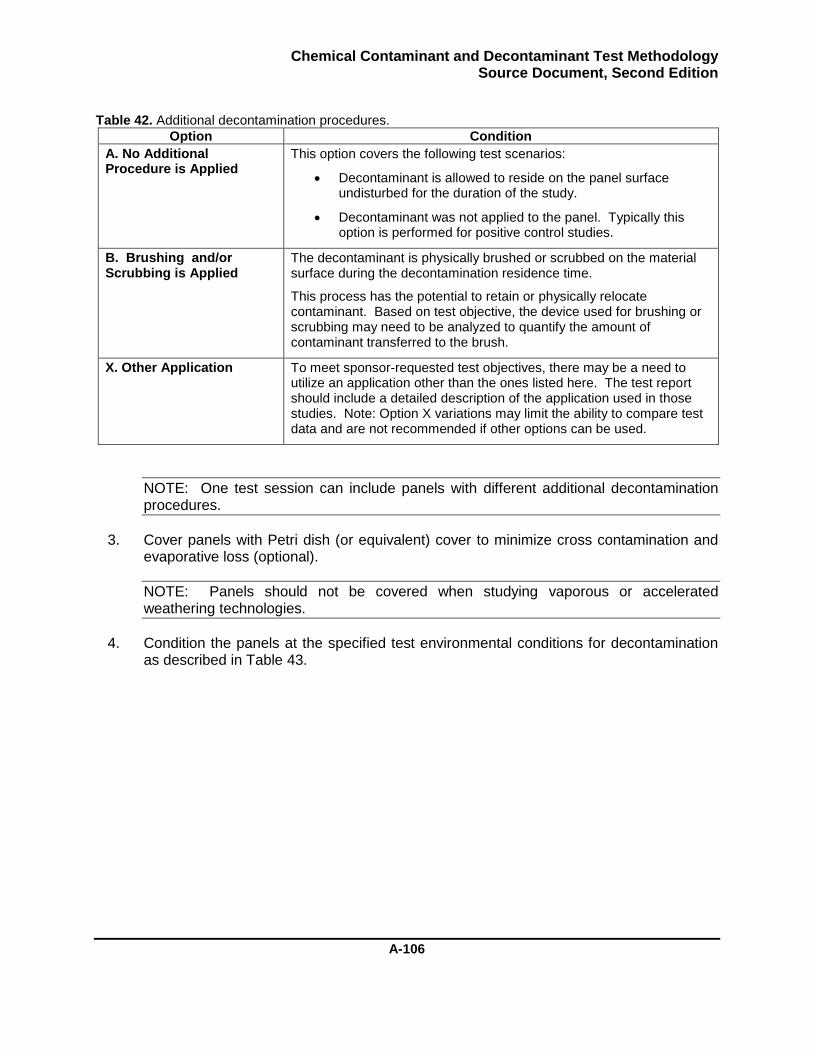
Chemical Contaminant and Decontaminant Test Methodology Source Document, Second Edition
A-106
Table 42. Additional decontamination procedures.
Option Condition
A. No Additional Procedure is Applied
This option covers the following test scenarios:
Decontaminant is allowed to reside on the panel surface undisturbed for the duration of the study.
Decontaminant was not applied to the panel. Typically this option is performed for positive control studies.
B. Brushing and/or Scrubbing is Applied
The decontaminant is physically brushed or scrubbed on the material surface during the decontamination residence time.
This process has the potential to retain or physically relocate contaminant. Based on test objective, the device used for brushing or scrubbing may need to be analyzed to quantify the amount of contaminant transferred to the brush.
X. Other Application To meet sponsor-requested test objectives, there may be a need to utilize an application other than the ones listed here. The test report should include a detailed description of the application used in those studies. Note: Option X variations may limit the ability to compare test data and are not recommended if other options can be used.
NOTE: One test session can include panels with different additional decontamination procedures.
3. Cover panels with Petri dish (or equivalent) cover to minimize cross contamination and evaporative loss (optional).
NOTE: Panels should not be covered when studying vaporous or accelerated weathering technologies.
4. Condition the panels at the specified test environmental conditions for decontamination as described in Table 43.
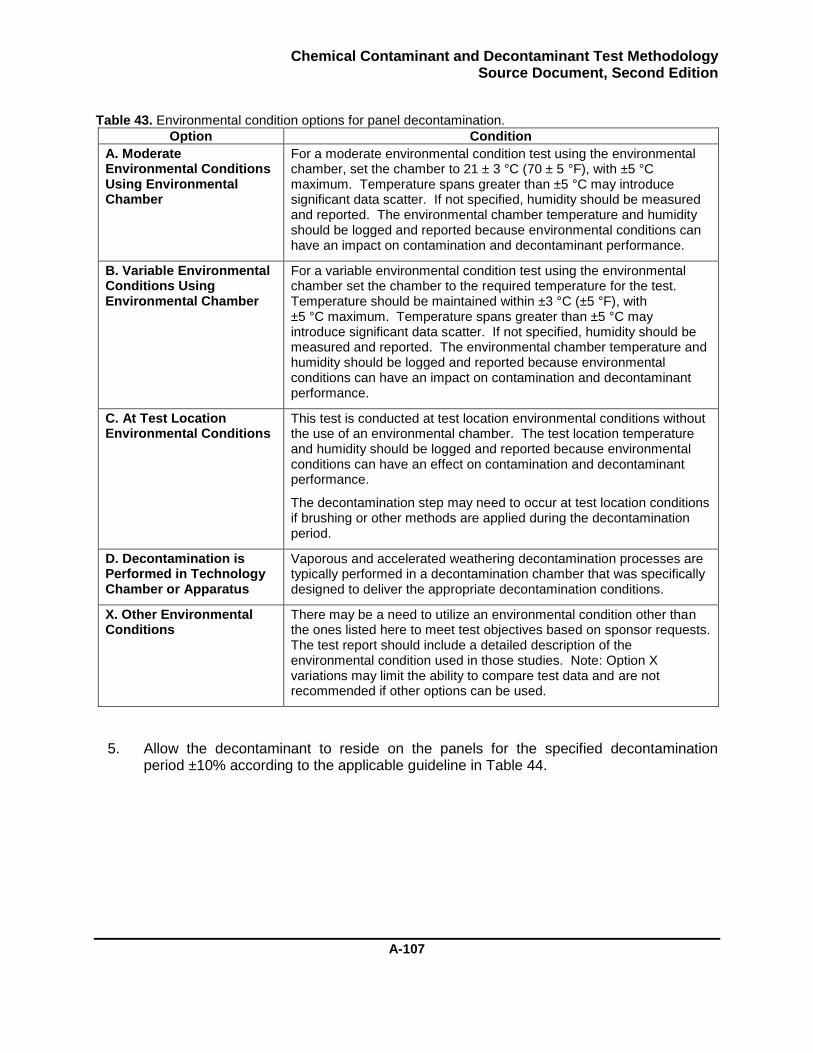
Chemical Contaminant and Decontaminant Test Methodology Source Document, Second Edition
A-107
Table 43. Environmental condition options for panel decontamination.
Option Condition
A. Moderate Environmental Conditions Using Environmental Chamber
For a moderate environmental condition test using the environmental chamber, set the chamber to 21 ± 3 °C (70 ± 5 °F), with ±5 °C maximum. Temperature spans greater than ±5 °C may introduce significant data scatter. If not specified, humidity should be measured and reported. The environmental chamber temperature and humidity should be logged and reported because environmental conditions can have an impact on contamination and decontaminant performance.
B. Variable Environmental Conditions Using Environmental Chamber
For a variable environmental condition test using the environmental chamber set the chamber to the required temperature for the test. Temperature should be maintained within ±3 °C (±5 °F), with ±5 °C maximum. Temperature spans greater than ±5 °C may introduce significant data scatter. If not specified, humidity should be measured and reported. The environmental chamber temperature and humidity should be logged and reported because environmental conditions can have an impact on contamination and decontaminant performance.
C. At Test Location Environmental Conditions
This test is conducted at test location environmental conditions without the use of an environmental chamber. The test location temperature and humidity should be logged and reported because environmental conditions can have an effect on contamination and decontaminant performance.
The decontamination step may need to occur at test location conditions if brushing or other methods are applied during the decontamination period.
D. Decontamination is Performed in Technology Chamber or Apparatus
Vaporous and accelerated weathering decontamination processes are typically performed in a decontamination chamber that was specifically designed to deliver the appropriate decontamination conditions.
X. Other Environmental Conditions
There may be a need to utilize an environmental condition other than the ones listed here to meet test objectives based on sponsor requests. The test report should include a detailed description of the environmental condition used in those studies. Note: Option X variations may limit the ability to compare test data and are not recommended if other options can be used.
5. Allow the decontaminant to reside on the panels for the specified decontamination period ±10% according to the applicable guideline in Table 44.
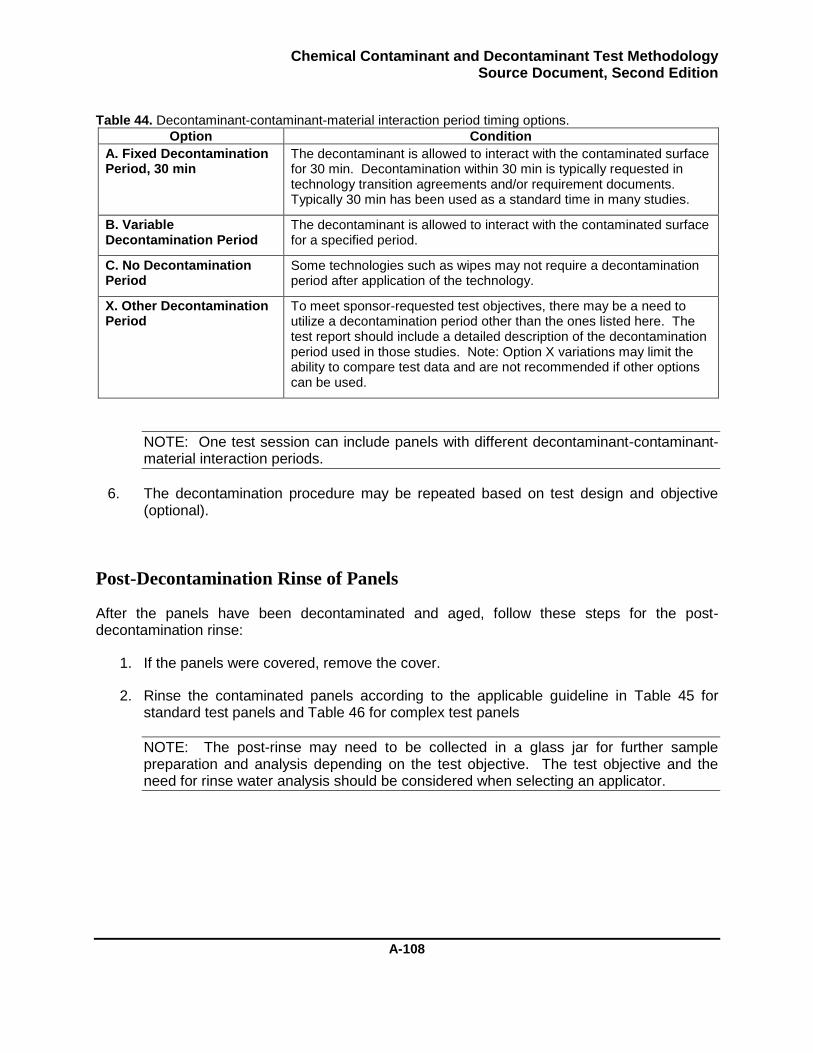
Chemical Contaminant and Decontaminant Test Methodology Source Document, Second Edition
A-108
Table 44. Decontaminant-contaminant-material interaction period timing options.
Option Condition
A. Fixed Decontamination Period, 30 min
The decontaminant is allowed to interact with the contaminated surface for 30 min. Decontamination within 30 min is typically requested in technology transition agreements and/or requirement documents. Typically 30 min has been used as a standard time in many studies.
B. Variable Decontamination Period
The decontaminant is allowed to interact with the contaminated surface for a specified period.
C. No Decontamination Period
Some technologies such as wipes may not require a decontamination period after application of the technology.
X. Other Decontamination Period
To meet sponsor-requested test objectives, there may be a need to utilize a decontamination period other than the ones listed here. The test report should include a detailed description of the decontamination period used in those studies. Note: Option X variations may limit the ability to compare test data and are not recommended if other options can be used.
NOTE: One test session can include panels with different decontaminant-contaminant-material interaction periods.
6. The decontamination procedure may be repeated based on test design and objective (optional).
Post-Decontamination Rinse of Panels
After the panels have been decontaminated and aged, follow these steps for the post-decontamination rinse:
1. If the panels were covered, remove the cover.
2. Rinse the contaminated panels according to the applicable guideline in Table 45 for standard test panels and Table 46 for complex test panels
NOTE: The post-rinse may need to be collected in a glass jar for further sample preparation and analysis depending on the test objective. The test objective and the need for rinse water analysis should be considered when selecting an applicator.
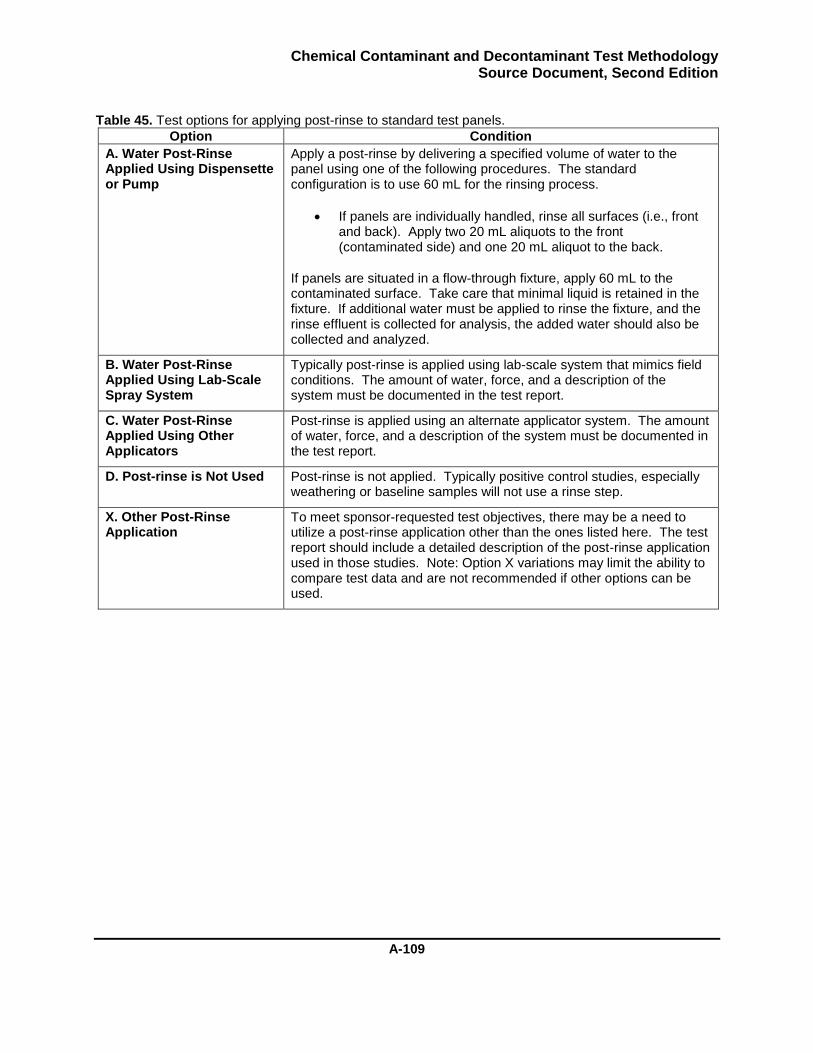
Chemical Contaminant and Decontaminant Test Methodology Source Document, Second Edition
A-109
Table 45. Test options for applying post-rinse to standard test panels.
Option Condition
A. Water Post-Rinse Applied Using Dispensette or Pump
Apply a post-rinse by delivering a specified volume of water to the panel using one of the following procedures. The standard configuration is to use 60 mL for the rinsing process.
If panels are individually handled, rinse all surfaces (i.e., front and back). Apply two 20 mL aliquots to the front (contaminated side) and one 20 mL aliquot to the back.
If panels are situated in a flow-through fixture, apply 60 mL to the contaminated surface. Take care that minimal liquid is retained in the fixture. If additional water must be applied to rinse the fixture, and the rinse effluent is collected for analysis, the added water should also be collected and analyzed.
B. Water Post-Rinse Applied Using Lab-Scale Spray System
Typically post-rinse is applied using lab-scale system that mimics field conditions. The amount of water, force, and a description of the system must be documented in the test report.
C. Water Post-Rinse Applied Using Other Applicators
Post-rinse is applied using an alternate applicator system. The amount of water, force, and a description of the system must be documented in the test report.
D. Post-rinse is Not Used Post-rinse is not applied. Typically positive control studies, especially weathering or baseline samples will not use a rinse step.
X. Other Post-Rinse Application
To meet sponsor-requested test objectives, there may be a need to utilize a post-rinse application other than the ones listed here. The test report should include a detailed description of the post-rinse application used in those studies. Note: Option X variations may limit the ability to compare test data and are not recommended if other options can be used.
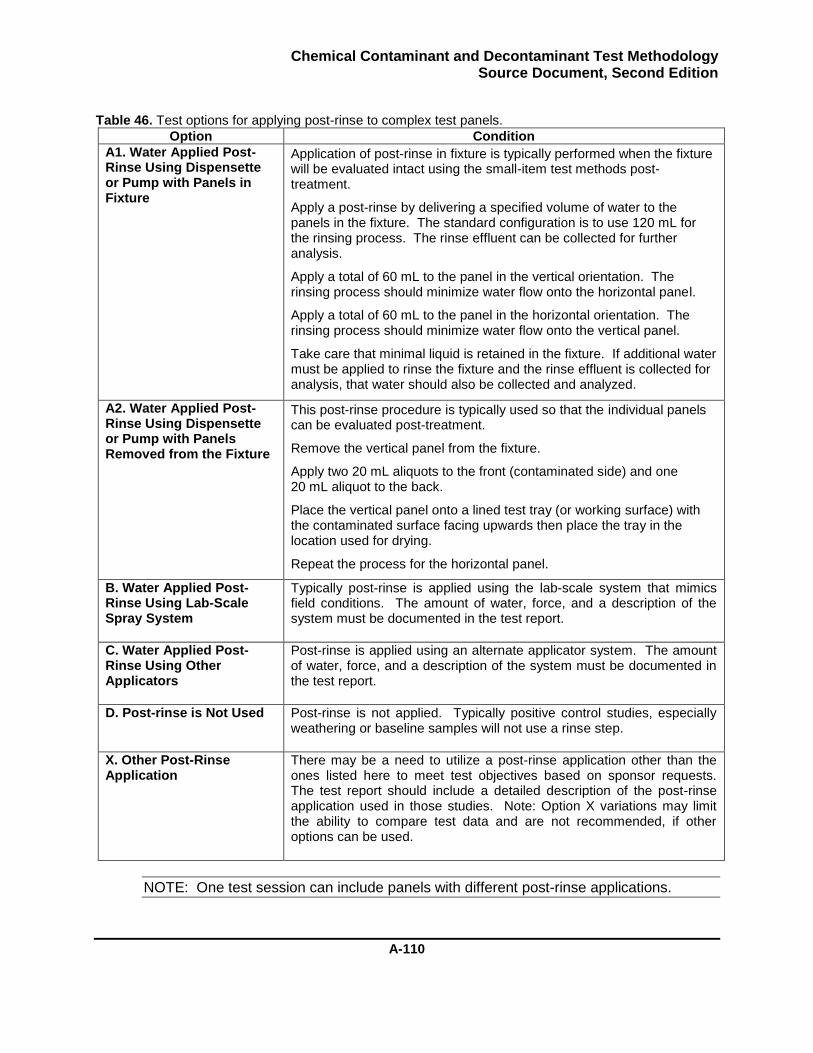
Chemical Contaminant and Decontaminant Test Methodology Source Document, Second Edition
A-110
Table 46. Test options for applying post-rinse to complex test panels.
Option Condition
A1. Water Applied Post-Rinse Using Dispensette or Pump with Panels in Fixture
Application of post-rinse in fixture is typically performed when the fixture will be evaluated intact using the small-item test methods post-treatment.
Apply a post-rinse by delivering a specified volume of water to the panels in the fixture. The standard configuration is to use 120 mL for the rinsing process. The rinse effluent can be collected for further analysis.
Apply a total of 60 mL to the panel in the vertical orientation. The rinsing process should minimize water flow onto the horizontal panel.
Apply a total of 60 mL to the panel in the horizontal orientation. The rinsing process should minimize water flow onto the vertical panel.
Take care that minimal liquid is retained in the fixture. If additional water must be applied to rinse the fixture and the rinse effluent is collected for analysis, that water should also be collected and analyzed.
A2. Water Applied Post-Rinse Using Dispensette or Pump with Panels Removed from the Fixture
This post-rinse procedure is typically used so that the individual panels can be evaluated post-treatment.
Remove the vertical panel from the fixture.
Apply two 20 mL aliquots to the front (contaminated side) and one 20 mL aliquot to the back.
Place the vertical panel onto a lined test tray (or working surface) with the contaminated surface facing upwards then place the tray in the location used for drying.
Repeat the process for the horizontal panel.
B. Water Applied Post-Rinse Using Lab-Scale Spray System
Typically post-rinse is applied using the lab-scale system that mimics field conditions. The amount of water, force, and a description of the system must be documented in the test report.
C. Water Applied Post-Rinse Using Other Applicators
Post-rinse is applied using an alternate applicator system. The amount of water, force, and a description of the system must be documented in the test report.
D. Post-rinse is Not Used Post-rinse is not applied. Typically positive control studies, especially weathering or baseline samples will not use a rinse step.
X. Other Post-Rinse Application
There may be a need to utilize a post-rinse application other than the ones listed here to meet test objectives based on sponsor requests. The test report should include a detailed description of the post-rinse application used in those studies. Note: Option X variations may limit the ability to compare test data and are not recommended, if other options can be used.
NOTE: One test session can include panels with different post-rinse applications.
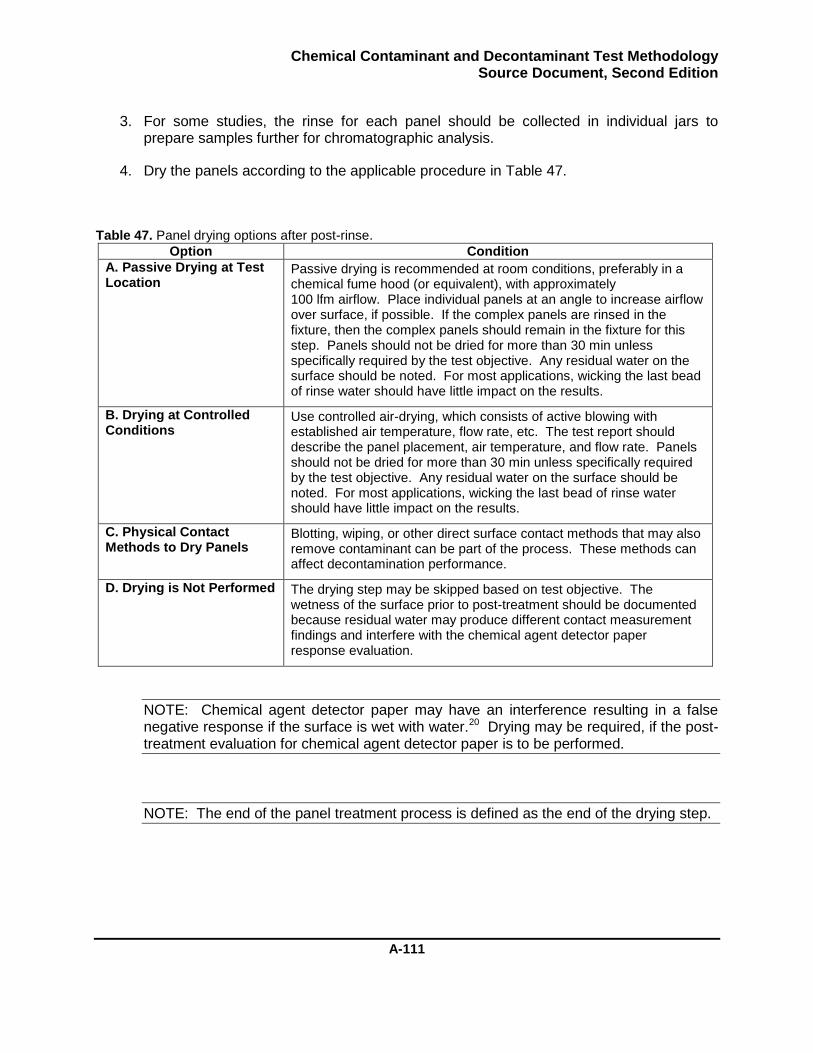
Chemical Contaminant and Decontaminant Test Methodology Source Document, Second Edition
A-111
3. For some studies, the rinse for each panel should be collected in individual jars to prepare samples further for chromatographic analysis.
4. Dry the panels according to the applicable procedure in Table 47.
Table 47. Panel drying options after post-rinse.
Option Condition
A. Passive Drying at Test Location
Passive drying is recommended at room conditions, preferably in a chemical fume hood (or equivalent), with approximately 100 lfm airflow. Place individual panels at an angle to increase airflow over surface, if possible. If the complex panels are rinsed in the fixture, then the complex panels should remain in the fixture for this step. Panels should not be dried for more than 30 min unless specifically required by the test objective. Any residual water on the surface should be noted. For most applications, wicking the last bead of rinse water should have little impact on the results.
B. Drying at Controlled Conditions
Use controlled air-drying, which consists of active blowing with established air temperature, flow rate, etc. The test report should describe the panel placement, air temperature, and flow rate. Panels should not be dried for more than 30 min unless specifically required by the test objective. Any residual water on the surface should be noted. For most applications, wicking the last bead of rinse water should have little impact on the results.
C. Physical Contact Methods to Dry Panels
Blotting, wiping, or other direct surface contact methods that may also remove contaminant can be part of the process. These methods can affect decontamination performance.
D. Drying is Not Performed The drying step may be skipped based on test objective. The wetness of the surface prior to post-treatment should be documented because residual water may produce different contact measurement findings and interfere with the chemical agent detector paper response evaluation.
NOTE: Chemical agent detector paper may have an interference resulting in a false negative response if the surface is wet with water.20 Drying may be required, if the post-treatment evaluation for chemical agent detector paper is to be performed.
NOTE: The end of the panel treatment process is defined as the end of the drying step.
Chemical Contaminant and Decontaminant Test Methodology Source Document, Second Edition
A-112
Completion of Treatment Process
Once the panels have been processed using the previous steps, complete the treatment as follows:
1. For tests conducted with the complex panel fixture: If the assembled complex fixture is to be analyzed with the small-item methods, proceed directly to step 2 without removing the panels from the fixture. If the panels in the complex fixture are to be individually evaluated, remove the panels from the fixture as follows.
a. Remove the vertical panel from the complex panel test fixture.
b. Place the vertical panel flat on a lined test tray (or working surface) with the contaminated surface facing upwards.
c. Remove the horizontal panel from the complex panel test fixture.
d. Place the horizontal panel flat on a lined test tray (or working surface) with the contaminated surface facing upwards
2. Complete the required reporting for this section per Procedure 8.
3. Proceed to the appropriate post-treatment evaluation procedure(s).
Chemical Contaminant and Decontaminant Test Methodology Source Document, Second Edition
A-113
Procedure 2: Post-Treatment Evaluation for Chemical Agent
Detector Paper Response
Overview
The chemical agent detector paper response test indicates whether the contaminant present in and on the test material after the treatment process would result in a colorimetric response (i.e., positive response). This procedure contains the basic steps for performing the chemical agent detector paper response test, analyzing the samples, and performing data calculations
Performing the Chemical Agent Detector Paper Response Test
Use the following procedures to perform the test with chemical agent detector paper:
1. Label the chemical agent detector paper with the sample identification code. Use label tape to affix the sample name in a corner of the chemical agent detector paper surface for traceability of the paper through testing and photographic documentation.
2. Ensure that the panel is positioned flat on the working surface with the contaminated area facing up.
3. Apply the chemical agent detector paper to the panel
a. Place the chemical agent detector paper face side down onto the test surface of the panel.
b. Place a piece of aluminum foil on top of the chemical agent detector paper. The aluminum foil prevents contaminant breakthrough to the contact mass.
c. For uneven or rough surfaces, place a thin foam layer on the aluminum foil.
d. Place a contact mass onto the foam/aluminum foil layer.
e. Wait 15 s.
f. Remove the contact mass, foam (if used) and foil at the end of the sampling period. Place the foam and foil in the appropriate decontaminant bath.
g. Peel the detector paper off the panel and turn the paper face up.
h. Observe or document the detector paper response as soon as possible using the applicable method described in Table 34. Record the time that has elapsed between the removal of the contact mass and the observation.
4. Evaluate the chemical agent detector paper response as follows:
a. The chemical agent detector paper response is reviewed to determine if a positive response was observed. Positive responses are based on any color change that can be observed by the operator in the laboratory. A summary of
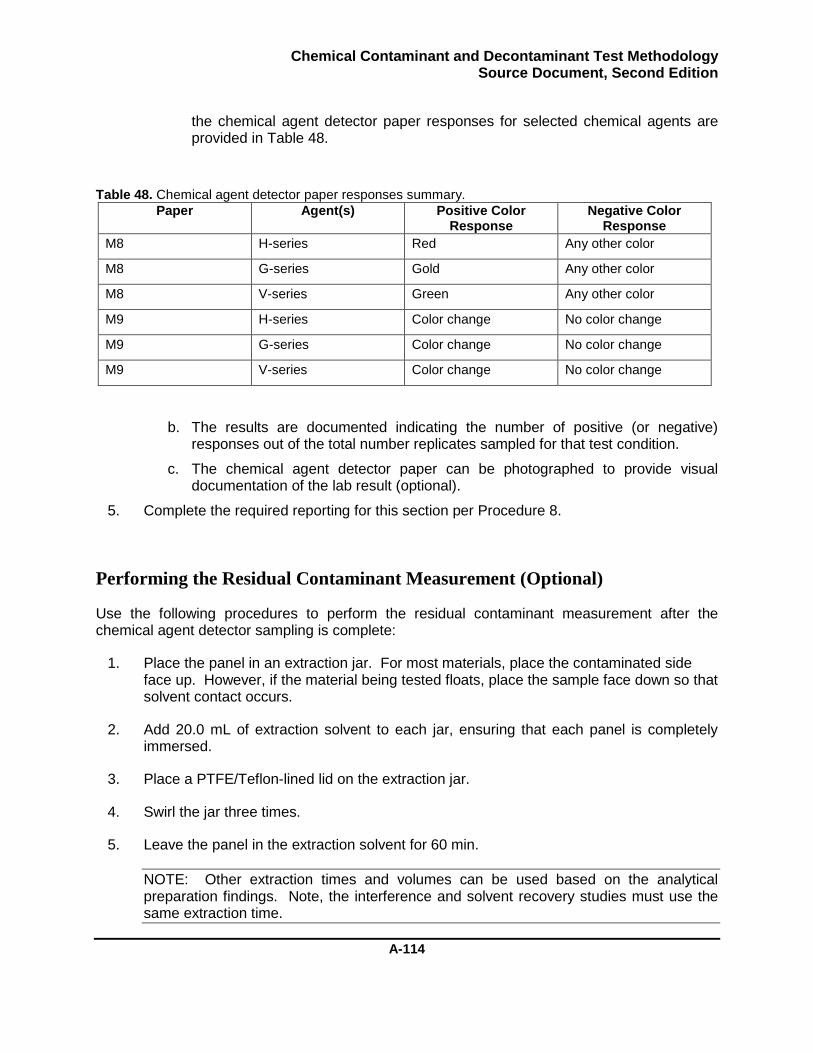
Chemical Contaminant and Decontaminant Test Methodology Source Document, Second Edition
A-114
the chemical agent detector paper responses for selected chemical agents are provided in Table 48.
Table 48. Chemical agent detector paper responses summary.
Paper Agent(s) Positive Color Response
Negative Color Response
M8 H-series Red Any other color
M8 G-series Gold Any other color
M8 V-series Green Any other color
M9 H-series Color change No color change
M9 G-series Color change No color change
M9 V-series Color change No color change
b. The results are documented indicating the number of positive (or negative) responses out of the total number replicates sampled for that test condition.
c. The chemical agent detector paper can be photographed to provide visual documentation of the lab result (optional).
5. Complete the required reporting for this section per Procedure 8.
Performing the Residual Contaminant Measurement (Optional)
Use the following procedures to perform the residual contaminant measurement after the chemical agent detector sampling is complete:
1. Place the panel in an extraction jar. For most materials, place the contaminated side face up. However, if the material being tested floats, place the sample face down so that solvent contact occurs.
2. Add 20.0 mL of extraction solvent to each jar, ensuring that each panel is completely immersed.
3. Place a PTFE/Teflon-lined lid on the extraction jar.
4. Swirl the jar three times.
5. Leave the panel in the extraction solvent for 60 min.
NOTE: Other extraction times and volumes can be used based on the analytical preparation findings. Note, the interference and solvent recovery studies must use the same extraction time.
Chemical Contaminant and Decontaminant Test Methodology Source Document, Second Edition
A-115
6. Obtain the appropriate number of clean analytical vials.
7. Wait until the end of the panel extraction period then swirl the jar again. Open the vial. Using a clean pipette tip, place a 1–2 mL sample into an analytical vial for analysis.
8. Complete the required reporting for this section per Procedure 8.
9. Analyze the extract as directed in the next section.
Analyzing the Residual Contaminant Samples
After the extract from the panels has been collected in sample vials, the solution will be analyzed on a chromatograph based on the guidance provided in “Prerequisite Tasks for Confident Analysis of Liquid and Vapor Samples” and the following guidelines:
1. Obtain the sample vials containing the extract collected during the contact test.
2. Sample dilution may be required for samples to be within the analytical method calibration range. This is typically true for the DCS.
3. Analyze the samples using the appropriate chromatographic method. This test generates the following types of samples for analysis:
Dose confirmation
Panel extract for residual contaminant
4. Obtain a list of analytical results in nanograms per milliliter, accounting for any additional dilutions.
5. If any of the measured concentrations are below the analytical detection limits, the appropriate detection limit concentration should be used in all subsequent calculations.
6. Complete the required reporting for this section per Procedure 8.
7. Perform a data review for data acceptance as described in Procedure 7 to ensure usability of the data.
8. Perform the calculation procedure for residual contaminant.
Chemical Contaminant and Decontaminant Test Methodology Source Document, Second Edition
A-116
Calculations
Procedure to Determine the Mass Delivered
Perform the following calculations to determine the mass of contaminant delivered in the test.
1. Obtain the chromatography data, in nanograms per milliliter, for the DCS (DCE) that have been corrected for any dilutions performed between sample collection and analysis.
2. Calculate the contaminant mass delivered (DelM) from the DCS.
For each DCS extract, convert the analytical results, in nanograms per milliliter, to mass results, in nanograms, by multiplying the extraction solvent volume (EV), in milliliters. For the method as written, the extraction solvent volume is 20 mL.
Equation 10
3. The results can be tested for data outliers using the ASTM Standard E 178, “Standard Practice for Dealing with Outlying Observations”.21 Data points identified as outliers should be marked with a data qualifier (i.e., data flag such as an asterisk) with a corresponding footnote that the data point was a statistical outlier. Data points identified as outliers should not be rejected from the data set without an assignable cause.
4. Hazard mitigation requirements typically specify the initial amount of contaminant in units of mass per area (grams per square meter). Convert DelM to contaminant mass delivered in units of mass per unit area (DelSC):
Equation11
where
CA = test area (m2)
5. Report the final test results with average and standard deviation in mass (nanograms) and starting challenge (grams per square meter) units for the analyte applied.
DelM = DCE x EV
DelSC = DelM /(CA x 109)
Chemical Contaminant and Decontaminant Test Methodology Source Document, Second Edition
A-117
Calculation Procedure for Residual Contaminant
Perform the following calculations to determine the residual contaminant after testing.
1. Obtain the panel extract chromatography data (in nanograms per milliliter) for the residual contaminant (REE) and the DCS (DCE) that have been corrected for any dilutions performed between the sample collection and analysis.
2. Convert the panel extraction result from mass in solution (REE) to mass (REM).
For each contact sampler extract, convert the analytical results, in nanograms per milliliter, to mass results, in nanograms, by multiplying the extraction solvent volume (EV), in milliliters. For the method, as written, the extraction solvent volume is 20 mL.
Equation 12
3. Correct the test results (if required) for solvent recovery to generate the measured residual contaminant mass corrected for solvent recovery (REM,C).
4. The results can be tested for data outliers using the ASTM Standard E 178, “Standard Practice for Dealing with Outlying Observations”. Data points identified as outliers should be marked with a data qualifier (i.e., data flag such as an asterisk) with a corresponding footnote that the data point was a statistical outlier. Data points identified as outliers should not be rejected from the data set without an assignable cause. Some decontamination processes and material inhomogeneity can result in wider distribution of test results. These real effects should be considered when making risk determinations from test data.
5. Report the final test results with average and standard deviation.
REM = REE x EV
Chemical Contaminant and Decontaminant Test Methodology Source Document, Second Edition
A-118
Blank

Chemical Contaminant and Decontaminant Test Methodology Source Document, Second Edition
A-119
Procedure 3: Post-Treatment Evaluation for Total Remaining
Contaminant
Overview
The remaining contaminant test measures the amount of contaminant present in and on the test material, immediately after the treatment process is complete (i.e., no other post-treatment evaluations such as contact or vapor testing are performed). This procedure contains the basic steps for performing the total remaining contaminant test, analyzing the samples, and performing data calculations.
Performing the Total Remaining Contaminant Test
Follow these steps to conduct the total remaining contaminant test:
1. Place the pretreated panel in an extraction jar. For most materials, place the contaminated side face up. However, if the material being tested floats, place the sample face down so that solvent contact occurs.
2. Add 20.0 mL of extraction solvent to each jar, ensuring that each panel is completely immersed.
3. Place a PTFE/Teflon-lined lid on the extraction jar.
4. Swirl the jar three times.
5. Leave the panel in the extraction solvent for 60 min.
NOTE: Other extraction times and volumes can be used based on the analytical preparation findings. Note: The interference and solvent recovery studies must use the same extraction time.
6. Obtain the appropriate number of clean analytical vials.
7. Wait until the end of the panel extraction period then swirl the jar three times again.
8. Remove the lid from the jar. Using a clean pipette tip, transfer approximately 1 to 2 mL into an analytical vial for analysis. Cap the vial and jar.
9. Complete the required reporting for this section per Procedure 8.
10. Analyze the extract as directed in the next section.
Analyzing the Remaining Contaminant Samples
After the extract from the decontaminated panels has been collected in sample vials, the solution will be analyzed on a chromatograph based on the guidance provided in “Prerequisite Tasks for Confident Analysis of Liquid and Vapor Samples” and the following guidelines:
Chemical Contaminant and Decontaminant Test Methodology Source Document, Second Edition
A-120
1. Obtain the sample vials containing the extract collected during the remaining contaminant test.
2. Sample dilution may be required for samples to be within the analytical method calibration range. This is typically true for the DCS.
3. Analyze the samples using the appropriate chromatographic method. This test generates the following types of samples for analysis:
Dose confirmation
Panel extract for remaining contaminant
4. Obtain a list of analytical results in nanograms per millilter, accounting for any additional dilutions.
5. If any of the measured concentrations are below the analytical detection limits, the appropriate detection limit concentration should be used in all subsequent calculations.
6. Complete the required reporting for this section per Procedure 8.
7. Perform a data review for data acceptance as described in Procedure 7 to ensure usability of the data.
8. Perform the appropriate calculations as directed in the next section.
Calculations
Perform the following calculations to determine the mass of contaminant delivered in the test.
Determine the Mass Delivered
1. Obtain the chromatography data, in nanograms per milliliter, for the DCS (DCE) that have been corrected for any dilutions performed between sample collection and analysis.
2. Calculate the contaminant mass delivered (DelM) from DCS.
For each DCS extract, convert the analytical results, in nanograms per milliliter, to mass results, in nanograms, by multiplying by the extraction solvent volume (EV), in milliliters. For the method as written, the extraction solvent volume is 20 mL.
Equation 13
3. The results can be tested for data outliers using the ASTM Standard E 178, “Standard Practice for Dealing with Outlying Observations”. Data points identified as outliers
DelM = DCE x EV
Chemical Contaminant and Decontaminant Test Methodology Source Document, Second Edition
A-121
should be marked with a data qualifier (i.e., data flag such as an asterisk) with a corresponding footnote that the data point was a statistical outlier. Data points identified as outliers should not be rejected from the data set without an assignable cause.
4. Hazard mitigation requirements typically specify the initial amount of contaminant in units of mass per area (grams per square meter). Convert DelM to contaminant mass delivered in units of mass per unit area (DelSC):
Equation14
where
CA = panel area (m2)
5. Report the final test results with average and standard deviation in mass (nanograms) and starting challenge (grams per square meter) units for the analyte applied.
Prepare and Report Results for Test Samples
This section is a series of steps to prepare analytical samples to obtain each measured remaining contaminant (RA) result in mass units. For the following calculations variables, noted with a subscript E, denote that the data is the concentration of the extract solution. Variables that do not have a subscript E represent the total mass extracted from a contact sampler or panel. The total mass-extracted variables are used in the subsequent calculations.
1. Obtain the panel extract chromatography data (in nanograms per milliliter) for the remaining contaminant (RAE) samples that have been corrected for any dilutions performed between the sample collection and analysis.
2. Convert the panel remaining contaminant extraction result from concentration in solution (RAE) to mass (RA). Convert the analytical results, in nanograms per milliliter, to mass results, in nanograms, by multiplying by the extraction solvent volume (EV), in milliliters. For the method, as written, the standard extraction solvent volume is 20 mL.
Equation 15
3. Correct the test results (if required) for solvent recovery to generate the measured remaining contaminant mass corrected for solvent recovery (RA).
4. The results can be tested for data outliers using the ASTM Standard E 178, “Standard Practice for Dealing with Outlying Observations”. Data points identified as outliers should be marked with a data qualifier (i.e., data flag such as an asterisk) with a corresponding footnote that the data point was a statistical outlier. Data points identified
DelSC = DelM /(CA x 109)
RA = RAE x EV
Chemical Contaminant and Decontaminant Test Methodology Source Document, Second Edition
A-122
as outliers should not be rejected from the data set without an assignable cause. Some decontamination processes and material inhomogeneity can result in wider distributions of test results. These real effects should be considered when making risk determinations from test data.
5. Report the final test results with average and standard deviation.
6. Select and perform the appropriate calculations based on the test objective. Available calculations include decontaminant relative performance, mass transferred per contacted area, and the legacy calculation of mass transferred per material area.
Calculation of Decontaminant Relative Performance
Relative performance metric calculations are used to determine if a hazard mitigation technology provides an improvement compared with a specified reference (e.g., positive control, reference technology, or alternate treatment condition). Performance metrics can be calculated without the specification of a scenario. For example, this calculation can indicate if and by how much a hazard mitigation technology may produce lower potential contact exposure than another technology. The detailed procedure for the calculation of relative performance is provided in Procedure 5.
Overview for the Percent Efficacy and Reduction in Starting Challenge Calculations
Basic calculation procedures for the reporting of percent efficacy and reduction in starting challenge are provided in this section. Advanced data analysis using log-10 transformed data and more advanced statistical evaluations are encouraged for detailed data analyses.
Many configurations and options are available in these tests methods, which can influence the test results. Test execution details and measured variables can determine which calculation should be used and the confidence in the calculated value. To allow for the variations that can occur in the testing process, a notation to designate the degree of rigor in a calculation has been created. The terms calculated and inferred are used to indicate the level of confidence in a calculation based on the available data.
NOTE: Each calculation option indicates the specific test method used to generate the data for the calculation.
Calculated values indicate the highest level of confidence and include using the optimal test configuration and measuring all pertinent values. Variable names that correspond to this level of confidence carry a subscript “C”.
Inferred values indicate a lower confidence calculation. Gross assumptions are made regarding some variables used in the calculation. Variable names that correspond to inferred values carry a subscript “I”.
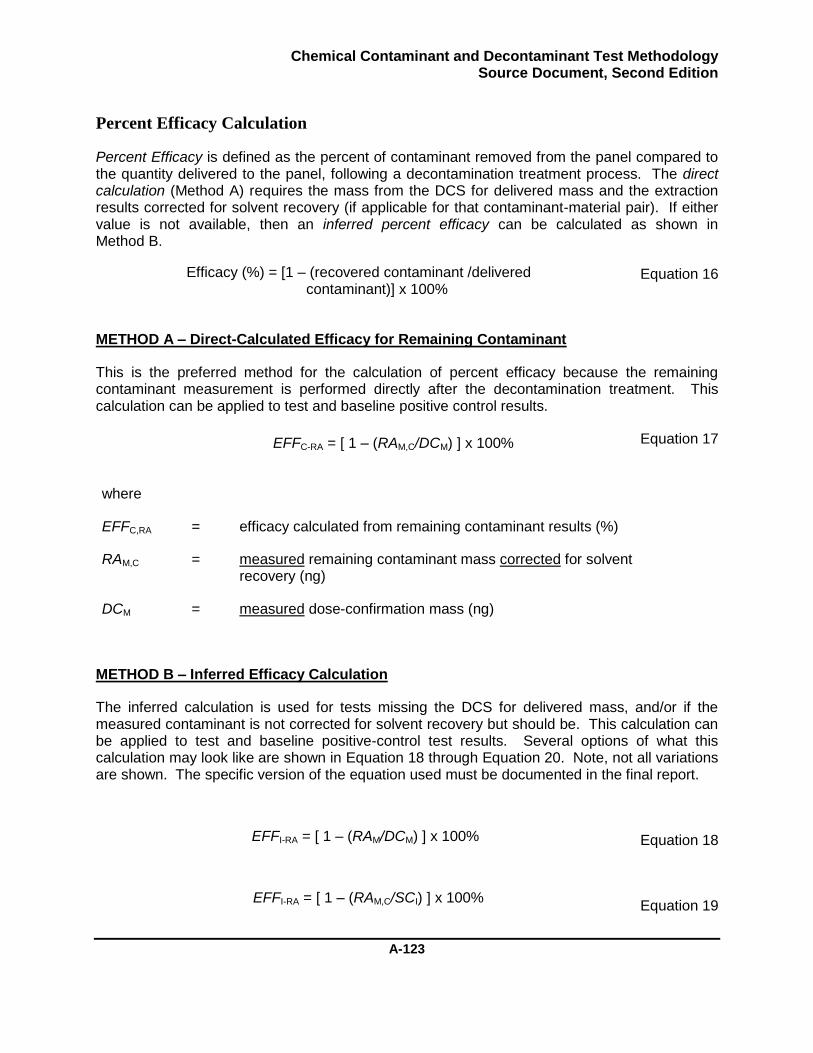
Chemical Contaminant and Decontaminant Test Methodology Source Document, Second Edition
A-123
Percent Efficacy Calculation
Percent Efficacy is defined as the percent of contaminant removed from the panel compared to the quantity delivered to the panel, following a decontamination treatment process. The direct calculation (Method A) requires the mass from the DCS for delivered mass and the extraction results corrected for solvent recovery (if applicable for that contaminant-material pair). If either value is not available, then an inferred percent efficacy can be calculated as shown in Method B.
Equation 16
METHOD A – Direct-Calculated Efficacy for Remaining Contaminant
This is the preferred method for the calculation of percent efficacy because the remaining contaminant measurement is performed directly after the decontamination treatment. This calculation can be applied to test and baseline positive control results.
Equation 17
where
EFFC,RA = efficacy calculated from remaining contaminant results (%)
RAM,C = measured remaining contaminant mass corrected for solvent recovery (ng)
DCM = measured dose-confirmation mass (ng)
METHOD B – Inferred Efficacy Calculation
The inferred calculation is used for tests missing the DCS for delivered mass, and/or if the measured contaminant is not corrected for solvent recovery but should be. This calculation can be applied to test and baseline positive-control test results. Several options of what this calculation may look like are shown in Equation 18 through Equation 20. Note, not all variations are shown. The specific version of the equation used must be documented in the final report.
Equation 18
Equation 19
Efficacy (%) = [1 – (recovered contaminant /delivered contaminant)] x 100%
EFFC-RA = [ 1 – (RAM,C/DCM) ] x 100%
EFFI-RA = [ 1 – (RAM/DCM) ] x 100%
EFFI-RA = [ 1 – (RAM,C/SCI) ] x 100%
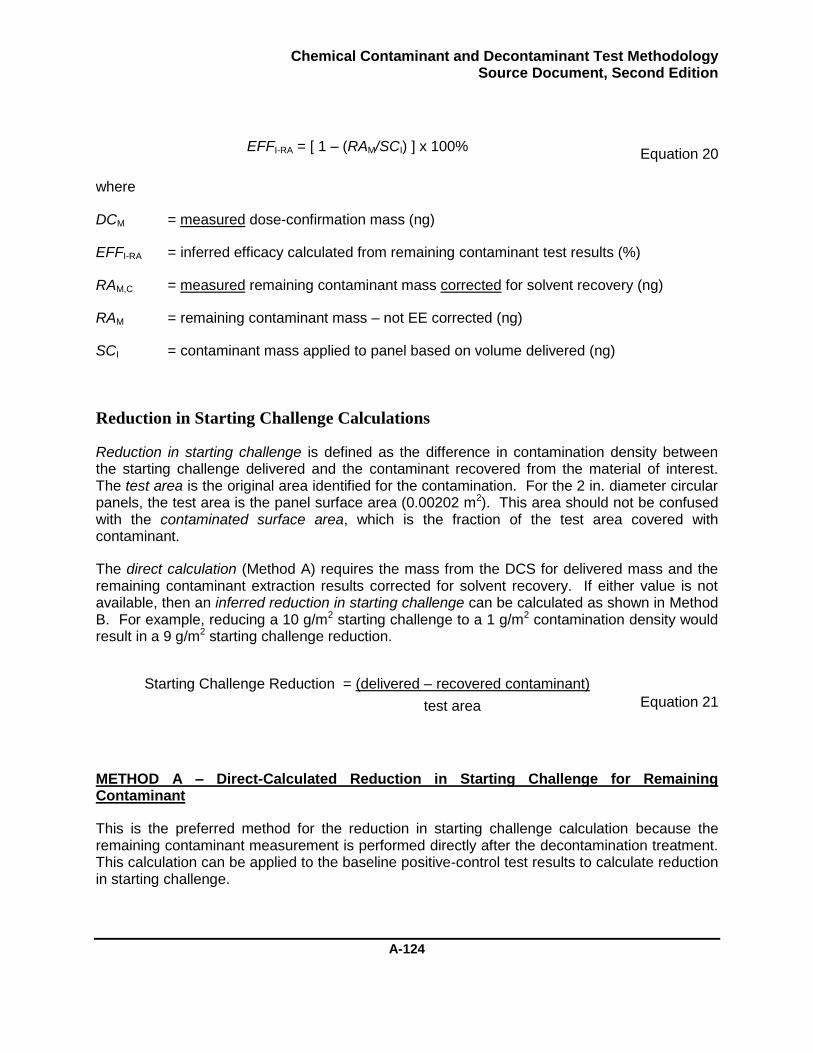
Chemical Contaminant and Decontaminant Test Methodology Source Document, Second Edition
A-124
Equation 20
where
DCM = measured dose-confirmation mass (ng)
EFFI-RA = inferred efficacy calculated from remaining contaminant test results (%)
RAM,C = measured remaining contaminant mass corrected for solvent recovery (ng)
RAM = remaining contaminant mass – not EE corrected (ng)
SCI = contaminant mass applied to panel based on volume delivered (ng)
Reduction in Starting Challenge Calculations
Reduction in starting challenge is defined as the difference in contamination density between the starting challenge delivered and the contaminant recovered from the material of interest. The test area is the original area identified for the contamination. For the 2 in. diameter circular panels, the test area is the panel surface area (0.00202 m2). This area should not be confused with the contaminated surface area, which is the fraction of the test area covered with contaminant.
The direct calculation (Method A) requires the mass from the DCS for delivered mass and the remaining contaminant extraction results corrected for solvent recovery. If either value is not available, then an inferred reduction in starting challenge can be calculated as shown in Method B. For example, reducing a 10 g/m2 starting challenge to a 1 g/m2 contamination density would result in a 9 g/m2 starting challenge reduction.
Equation 21
METHOD A – Direct-Calculated Reduction in Starting Challenge for Remaining Contaminant
This is the preferred method for the reduction in starting challenge calculation because the remaining contaminant measurement is performed directly after the decontamination treatment. This calculation can be applied to the baseline positive-control test results to calculate reduction in starting challenge.
EFFI-RA = [ 1 – (RAM/SCI) ] x 100%
Starting Challenge Reduction = (delivered – recovered contaminant)
test area
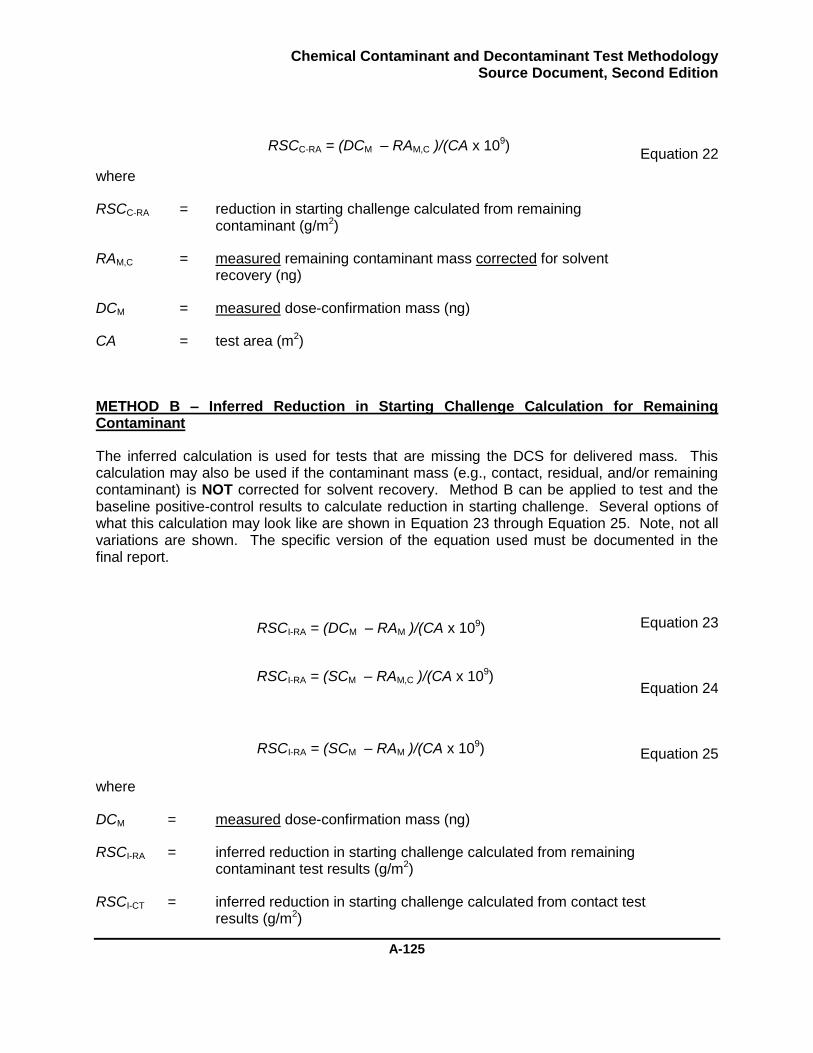
Chemical Contaminant and Decontaminant Test Methodology Source Document, Second Edition
A-125
Equation 22
where
RSCC-RA = reduction in starting challenge calculated from remaining contaminant (g/m2)
RAM,C = measured remaining contaminant mass corrected for solvent recovery (ng)
DCM = measured dose-confirmation mass (ng)
CA = test area (m2)
METHOD B – Inferred Reduction in Starting Challenge Calculation for Remaining Contaminant
The inferred calculation is used for tests that are missing the DCS for delivered mass. This calculation may also be used if the contaminant mass (e.g., contact, residual, and/or remaining contaminant) is NOT corrected for solvent recovery. Method B can be applied to test and the baseline positive-control results to calculate reduction in starting challenge. Several options of what this calculation may look like are shown in Equation 23 through Equation 25. Note, not all variations are shown. The specific version of the equation used must be documented in the final report.
Equation 23
Equation 24
Equation 25
where
DCM = measured dose-confirmation mass (ng)
RSCI-RA = inferred reduction in starting challenge calculated from remaining contaminant test results (g/m2)
RSCI-CT = inferred reduction in starting challenge calculated from contact test results (g/m2)
RSCC-RA = (DCM – RAM,C )/(CA x 109)
RSCI-RA = (DCM – RAM )/(CA x 109)
RSCI-RA = (SCM – RAM,C )/(CA x 109)
RSCI-RA = (SCM – RAM )/(CA x 109)
Chemical Contaminant and Decontaminant Test Methodology Source Document, Second Edition
A-126
RAM,C = measured remaining contaminant mass corrected for solvent recovery (ng)
RAM = measured remaining contaminant mass (ng)
SCM = starting challenge mass divided by the panel surface area (ng)
Chemical Contaminant and Decontaminant Test Methodology Source Document, Second Edition
A-127
Procedure 4: Post-Treatment Evaluation for Contact Transfer
Overview
The contact transfer test measures the amount contaminant present after the treatment process that could pose a risk to unprotected personnel through transfer to skin or other surfaces. This procedure contains the basic steps for performing the contact transfer test, analyzing the samples, and performing data calculations.
Performing the Standard Contact Test
A contact test event is called a touch. A touch is characterized by the contact area, contact pressure, contact time duration, and skin condition (wet versus dry). The contact test is the process of applying the contact sampler to the panel surface for a specified duration of time. The number of contact sampling periods is referred to as the number of touches”,
The standard contact test used in hazard mitigation evaluations utilizes a two-touch pattern, with a first touch that is 15 min in duration, occurring immediately after the treatment process is completed. The second touch is a 15 min duration touch, occurring 30 min after the end of the first touch.
NOTE: Accurate timing is important in contact sampling. Use of a timing device is suggested.
1. Conduct the first touch as follows:
a. Place the panel flat on the temperature-controlled surface with the contaminated area facing up. Set the temperature to the preferred value of 30 °C (86 °F). The temperature should be maintained preferably within ±5 °C (9 °F), with a maximum of ±10 °C (18 °F). If the value is greater than ±10 °C, this must be clearly reported.
b. Place the contact sampler on the panel surface.
c. Place a 2 in. diameter, circular piece of aluminum foil on the contact sampler. The aluminum foil prevents contaminant breakthrough to the contact mass.
d. For uneven or rough surfaces, place a thin foam layer on the aluminum foil.
e. Place a contact mass onto the foam/aluminum foil layer.
f. Wait for 15 min (this is the contact time duration for the first touch).
g. Remove the contact mass and foam (if used) at the end of the sampling period, and immediately begin timing the 30 min period until the next touch.
2. Prepare the extract for the first touch as soon as possible after the touch is complete.
a. Using the tweezers to roll up both pieces, place the contact sampler and aluminum foil into a scintillation vial (or equivalent glass container). Extract the aluminum foil with the contact sampler to ensure that any breakthrough mass is collected.

Chemical Contaminant and Decontaminant Test Methodology Source Document, Second Edition
A-128
b. Cover the panel with a fresh Petri dish to minimize cross contamination and evaporative loss.
c. Add 20.0 mL of extraction solvent to the scintillation vial.
d. Place the PTFE/Teflon-lined lid on extraction scintillation vial.
e. Thoroughly mix the contents of the vial by inverting it three times.
f. Begin timing the extraction process. The contact sampler/aluminum will be left in the extraction solvent for 60 min before proceeding to step 2g. If another touch is required, go on to step 3 in the meantime.
NOTE: Other extraction times and volumes can be used based on the analytical preparation findings. The interference and solvent recovery studies must use the same extraction time.
g. Wait until the end of the extraction period then thoroughly mix the contents of the vial by inverting it three times.
h. Using a clean pipette, place a sample of approximately 1 to 2 mL into an analytical vial for analysis.
3. Conduct the second touch as follows:
a. Place a new contact sampler on the same panel surface used for the first touch.
b. Place a 2 in. diameter, circular piece of aluminum foil on the contact sampler. The aluminum foil prevents contaminant breakthrough to the contact mass.
c. For uneven or rough surfaces, place a thin foam layer on the aluminum foil.
d. Place a contact mass onto the foam/aluminum foil layer.
e. Wait for 15 min (this is the contact time duration for the second touch).
f. Remove the contact mass and foam (if used) at the end of the sampling period, and immediately begin timing the 30 min period until the next touch.
4. Prepare the extract for the second touch as soon as possible after the touch is complete.
a. Using the tweezers to roll up both pieces, place the contact sampler and aluminum foil into a scintillation vial (or equivalent glass container). Extract the aluminum foil with the contact sampler to ensure that any breakthrough mass is collected.
b. Cover the panel with a fresh Petri dish to minimize cross contamination and evaporative loss.
c. Add 20.0 mL of extraction solvent to the scintillation vial.
d. Place the PTFE/Teflon-lined lid on extraction scintillation vial.
e. Thoroughly mix the contents of the vial by inverting it three times.
Chemical Contaminant and Decontaminant Test Methodology Source Document, Second Edition
A-129
f. Begin timing the extraction process. The contact sampler/aluminum will be left in the extraction solvent for 60 min before proceeding to step 4g. Proceed to step 5 in the meantime.
NOTE: Other extraction times and volumes can be used based on the analytical preparation findings. Note, the interference and solvent recovery studies must use the same extraction time.
g. Wait until the end of the extraction period then thoroughly mix the contents of the vial by inverting it three times.
h. Using a clean pipette, place a 1–2 mL sample into an analytical vial for analysis.
5. After the last touch is complete, extract the panel for residual contaminant.
a. Place the pretreated panel in an extraction jar. For most materials, place the contaminated side face up. However, if the material being tested floats, place the sample face down so that solvent contact occurs.
b. Add 20.0 mL of extraction solvent to each jar, ensuring that each panel is completely immersed.
c. Place a PTFE/Teflon-lined lid on the extraction jar.
d. Swirl the jar three times.
e. Leave the panel in the extraction solvent for 60 min.
NOTE: Other extraction times and volumes can be used based on the analytical preparation findings. The interference and solvent recovery studies must use the same extraction time.
f. Obtain the appropriate number of clean analytical vials.
g. Wait until the end of the panel extraction period then swirl the jar again. Open the vial. Using a clean pipette tip, place a 1–2 mL sample into an analytical vial for analysis.
6. Complete the required reporting for this section per Procedure 8.
7. Analyze the extract as directed in the section “Analyzing the Contact Test Samples” on page A-132.
Performing a Contact Test Variation
A contact test event is called a touch. A touch is characterized by the contact area, contact pressure, contact time duration, and skin condition (wet versus dry). The contact test is the process of applying the contact sampler to the panel surface for a specified duration of time. The number of contact sampling periods is referred to as the number of touches.
Chemical Contaminant and Decontaminant Test Methodology Source Document, Second Edition
A-130
The contact test variation enables the method user to adjust the touch parameters as needed to meet test objective.
NOTE: Accurate timing is important in contact sampling. Use of a timing device is suggested.
1. Develop a contact sampling plan that identifies the start- and end-time post decontamination and the total contact time duration for each touch.
2. Conduct the first touch as follows:
a. Place the panel flat on the temperature-controlled surface with the contaminated area facing up. Set the temperature to the preferred value of 30 °C (86 °F). The temperature should be maintained preferably within ±5 °C (9 °F), with a maximum of ±10 °C (18 °F). If the value is greater than ±10 °C, this must be clearly reported
b. Place the contact sampler on the panel surface.
c. Place a 2 in. diameter, circular piece of aluminum foil on the contact sampler. The aluminum foil prevents contaminant breakthrough to the contact mass.
d. For uneven or rough surfaces, place a thin foam layer on the aluminum foil.
e. Place a contact mass onto the foam/aluminum foil layer.
f. Wait the specified contact time duration for the first touch per the contact sampling plan.
g. Remove the contact mass and foam (if used) at the end of the sampling period.
3. Prepare the extract for the first touch as soon as possible after the touch is complete.
a. Using the tweezers to roll up both pieces, place the contact sampler and aluminum foil into a scintillation vial (or equivalent glass container). Extract the aluminum foil with the contact sampler to ensure that any breakthrough mass is collected.
b. Cover the panel with a fresh Petri dish to minimize cross contamination and evaporative loss.
c. Add 20.0 mL of extraction solvent to the scintillation vial.
d. Place the PTFE/Teflon-lined lid on extraction scintillation vial.
e. Thoroughly mix the contents of the vial by inverting it three times.
f. Begin timing the extraction process. The contact sampler/aluminum will be left in the extraction solvent for 60 min before proceeding to step 3g. Proceed to step 4 in the meantime.
NOTE: Other extraction times and volumes can be used based on the analytical preparation findings. The interference and solvent recovery studies must use the same extraction time.
Chemical Contaminant and Decontaminant Test Methodology Source Document, Second Edition
A-131
g. Wait until the end of the extraction period then thoroughly mix the contents of the vial by inverting it three times.
h. Using a clean pipette, place a 1–2 mL sample into an analytical vial for analysis.
4. If no other touches are desired, then proceed to step 8.
5. Performing additional touches:
a. Place a new contact sampler on the same panel surface used in the previous steps, at the appropriate start time according to the contact-sampling plan.
b. Place a 2 in. diameter, circular piece of aluminum foil on the contact sampler. The aluminum foil prevents contaminant breakthrough to the contact mass.
c. For uneven or rough surfaces, place a thin foam layer on the aluminum foil.
d. Place a contact mass onto the foam/aluminum foil layer.
e. Wait the specified contact time duration for this touch according to the contact-sampling plan.
f. Remove the contact mass and foam (if used) at the end of the sampling period, and immediately begin timing the 30 min period until the next touch.
6. Prepare the extract for additional touches as soon as possible after the touch is complete.
a. Using the tweezers to roll up both pieces, place the contact sampler and aluminum foil into a scintillation vial (or equivalent glass container). Extract the aluminum foil with the contact sampler to ensure that any breakthrough mass is collected.
b. Cover the panel with a fresh Petri dish to minimize cross contamination and evaporative loss.
c. Add 20.0 mL of extraction solvent to the scintillation vial.
d. Place the PTFE/Teflon-lined lid on extraction scintillation vial.
e. Thoroughly mix the contents of the vial by inverting it three times.
f. Begin timing the extraction process. The contact sampler/aluminum will be left in the extraction solvent for 60 min before proceeding to step 6g. Proceed to step 7 in the meantime.
NOTE: Other extraction times and volumes can be used based on the analytical preparation findings. The interference and solvent recovery studies must use the same extraction time.
g. Wait until the end of the extraction period then thoroughly mix the contents of the vial by inverting it three times.
h. Using a clean pipette, place a 1–2 mL sample into an analytical vial for analysis.
7. Repeat steps 5 and 6 until the contact-sampling plan has been completed.
Chemical Contaminant and Decontaminant Test Methodology Source Document, Second Edition
A-132
8. After the last touch is complete, extract the panel for residual contaminant.
a. Place the pretreated panel in an extraction jar. For most materials, place the contaminated side face up. However, if the material being tested floats, place the sample face down so that solvent contact occurs.
b. Add 20.0 mL of extraction solvent to each jar, ensuring that each panel is completely immersed.
c. Place a PTFE/Teflon-lined lid on the extraction jar.
d. Swirl the jar three times.
e. Leave the panel in the extraction solvent for 60 min.
NOTE: Other extraction times and volumes can be used based on the analytical preparation findings. The interference and solvent recovery studies must use the same extraction time.
f. Obtain the appropriate number of clean analytical vials.
g. Wait until the end of the panel extraction period then swirl the jar again. Open the vial and, using a clean pipette tip, place a 1–2 mL sample into an analytical vial for analysis.
9. Document the contact-sampling plan, including the start and end time post decontamination for each touch and the total contact time duration.
10. Complete the required reporting for this section per Procedure 8.
11. Analyze the extract as directed in the next section “Analyzing the Contact Test Samples”.
Analyzing the Contact Test Samples
After the extract from the panels has been collected in sample vials, the solution will be analyzed on a chromatograph based on the guidance provided in “Prerequisite Tasks for Confident Analysis of Liquid and Vapor Samples” and the following guidelines:
1. Obtain the sample vials containing the extract collected during the contact test.
2. Sample dilution may be required for samples to be within the analytical method calibration range. This is typically true for the DCS.
3. Analyze the samples using the appropriate chromatographic method. This test generates the following types of samples for analysis:
Dose confirmation
Contact sampler extract for contact test
Panel extract for residual contaminant
Chemical Contaminant and Decontaminant Test Methodology Source Document, Second Edition
A-133
4. Obtain a list of analytical results in nanograms per milliliter, accounting for any additional dilutions.
5. If any of the measured concentrations are below the analytical detection limits, the appropriate detection limit concentration should be used in all subsequent calculations.
6. Complete the required reporting for this section per Procedure 8.
7. Perform a data review for data acceptance as described in Procedure 7 to ensure usability of the data.
8. Perform the appropriate calculations as directed in the next section.
Calculations
Perform the following calculations to determine the mass of contaminant delivered in the test.
Determine the Mass Delivered
1. Obtain the chromatography data (in nanograms per milliliter) for the DCS (DCE) that have been corrected for any dilutions performed between sample collection and analysis.
2. Calculate the contaminant mass delivered (DelM) from DCS.
For each DCS extract, convert the analytical results, in nanograms per milliliter, to mass results, in nanograms, by multiplying the extraction solvent volume (EV), in milliliters. For the method as written, the extraction solvent volume is 20 mL.
Equation 26
3. The results can be tested for data outliers using the ASTM Standard E 178, “Standard Practice for Dealing with Outlying Observations”. Data points identified as outliers should be marked with a data qualifier (i.e., data flag such as an asterisk) with a corresponding footnote that the data point was a statistical outlier. Data points identified as outliers should not be rejected from the data set without an assignable cause.
4. Hazard mitigation requirements typically specify the initial amount of contaminant in units of mass per area (grams per square meter). Convert DelM to contaminant mass delivered in units of mass per unit area (DelSC):
Equation27
DelM = DCE x EV
DelSC = DelM /(CA x 109)
Chemical Contaminant and Decontaminant Test Methodology Source Document, Second Edition
A-134
where
CA = panel area (m2)
5. Report the final test results with average and standard deviation in mass (nanograms) and starting challenge (grams per square meter) units for the amount of analyte applied.
Prepare and Report Results for Test Samples
This section is a series of steps to prepare analytical samples to obtain each measured result in mass units. The output includes contact-transferred mass for each touch (Ti) where i indicates the touch number, and the residual contaminant (RE). The following calculations may also be used for the remaining contaminant (RA) test where the panel is extracted without collecting contact transfer samples. For the following calculations, variables noted with a subscript E denote that the data is the concentration of the extract solution. Variables that do not have a subscript E represent the total mass extracted from a contact sampler or panel. The total mass-extracted variables are used in the subsequent calculations.
1. Obtain the panel extract chromatography data (in nanograms per milliliter) for the remaining contaminant (RAE) or the contact transfer (TiE) and residual contaminant samples (REE) that have been corrected for any dilutions performed between the sample collection and analysis.
2. For each contact sampler collected, convert the contact sampler extraction result from concentration in solution (TiE) to mass (Ti).
Convert the analytical results, in nanograms per milliliter, to mass results, in nanograms, by multiplying the extraction solvent volume (EV), in milliliters. For the method, as written, the standard extraction solvent volume is 20 mL.
Equation 28
3. Correct the test results (if required) for solvent recovery to generate the measured remaining contaminant mass corrected for solvent recovery (Ti).
4. Convert the panel residual contaminant extraction result from concentration in solution (REE) to mass (RE). For the method, as written, the standard extraction solvent volume is 20 mL.
Equation 29
5. Correct the test results (if required) for solvent recovery to generate the measured remaining contaminant mass corrected for solvent recovery (RE).
Ti = TiE x EV
RE = REE x EV
Chemical Contaminant and Decontaminant Test Methodology Source Document, Second Edition
A-135
6. The results can be tested for data outliers using the ASTM Standard E 178, “Standard Practice for Dealing with Outlying Observations”. Data points identified as outliers should be marked with a data qualifier (i.e., data flag such as an asterisk) with a corresponding footnote that the data point was a statistical outlier. Data points identified as outliers should not be rejected from the data set without an assignable cause. Some decontamination processes and material inhomogeneity can result in wider distribution of test results. These real effects should be considered when making risk determinations from test data.
7. Report the final test results with average and standard deviation.
8. Select and perform the appropriate calculations based on the test objective. Available calculations include decontaminant relative performance, mass transferred per contacted area, and the legacy calculation of mass transferred per material area.
Contact Transfer Calculations Background
The contact test measures the mass of contaminant transferred from a material to a contact sampler. Each of the transferred mass results contributes to the dose that may be experienced by unprotected personnel contacting the material. Decontamination efficacy requirements are often specified using health-based requirements for contact exposure to evaluate whether the specified risk level is met. Health-based requirements are specified using toxicity values. The risk levels are determined by performing an exposure assessment that identifies the quantity of contaminant transferred to unprotected personnel (i.e., the dose), and comparing the dose to the specified toxicity value.22-25 If the exposure dose is greater than the toxicity value, the specified risk level has been exceeded.
An exposure assessment for contact transfer requires the specification of the object being contacted and an explicit characterization of how unprotected personnel interact with the object.26 Ideally, the contact test results would be used to scale the panel results to the object, and the contact transfer results would be scaled to the touch scenario (e.g., number of touches, touch area, touch duration, etc.). The dose calculated from an exposure assessment is only as accurate as the assumptions used to define the object and interaction of personnel with the object. At the time this method was written, there were no defined objects or contact-transfer scenarios, nor was there an accepted method to accurately calculate or approximate an acute contact-transferred dose (i.e., scale the touch scenario).
Performance metrics provide the capability to determine improvements between technologies. Exposure dose is highly correlated with decontaminant performance. A decontaminant technology that performs 10 times better than another technology should produce an exposure dose of approximately 10 times lower. An interim calculation is provided to indicate decontaminant performance (the ability of one decontaminant to remove more or less contaminant than another decontaminant). The calculation is a performance metric using the ratio of mass transferred for one or more touches between two technologies. The calculation, application, and interpretation of these values are discussed in their respective sections.
Chemical Contaminant and Decontaminant Test Methodology Source Document, Second Edition
A-136
There has been a long-standing common misinterpretation of contact hazard levels in the decontamination community. The documents that provide contact toxicity values provide the data in the format of dose, typically expressed as mass of contaminant per 70 kg male that would induce a toxicological response.4, 27 A footnote for Table 4-10 of the USACHPPM report27 indicates that the dose can be expressed in units of milligrams per square meter by dividing the dose value by the total skin area, 1.8 m2, for an average 70 kg military male. The resulting value indicates that if the resulting skin surface concentration was applied to the total skin area of a person, that person would receive a dose equivalent to the toxicity value. There are several problems with this approach. First, nerve agents are systemic toxins. The potential for negative health effects is related to the total dose (i.e., mass) of contaminant, not to a skin surface concentration. Vesicant agents, such as mustard, are localized-effect toxins. The local skin concentration is likely to induce toxic responses rather than a distribution of agent over the full body skin surface area. For example, it has been reported that a localized skin concentration of 34 µg/cm2 may produce blisters on the volar forearm.28
The decontamination community has misinterpreted the skin surface area calculation as a material surface area. For example, it has been incorrectly interpreted that if the mass per unit of material area is less than the specified toxicity value in units of milligrams per square meter, the contact hazard criteria has been met. This interpretation is incorrect and leads to conclusions that may over or underestimate the actual contact transfer risk by many orders of magnitude. The only method to accurately determine contact hazards is to perform a contact-exposure assessment. Until this methodology is fully developed and approved, two interim calculation approaches are provided here: calculation of a relative performance metric and the legacy contact calculation.
Another common misinterpretation regarding contact hazards concerns how to use multiple touch data. Whether the toxin is systemic or localized, the risk is associated with the total accumulated dose. The total accumulated dose is dependent on the contact exposure, which is related to the number of touches. Therefore, analysis of a single touch assumes that unprotected personnel would touch the material only once. The resulting risk assessment would be specific to the single-touch scenario. This leads to the concept of the bioavailability of a contaminant in a decontaminated material. To produce a dose, the contaminant must be able to be transported from the contaminated material to the contacting material. Many factors determine when and how much of the contaminant in a material may be bioavailable. Because of the number of factors, it is more accurate to assume that all contaminant mass may become bioavailable. Therefore, data analysis should consider the sum of the contact transfer results and the residual agent measurements associated with extraction of the panel after contact sampling.
The SD2ED provides a detailed performance calculation in Procedure 5. The legacy contact calculation using contact sampled mass is provided in the following section.
Legacy Contact Calculation
Contact calculations, used in evaluations conducted before the development of SD2ED, reported contact-transfer values using a mass per material area. Extreme caution must be used, if this value is compared to “contact hazard requirements” that are specified in units of
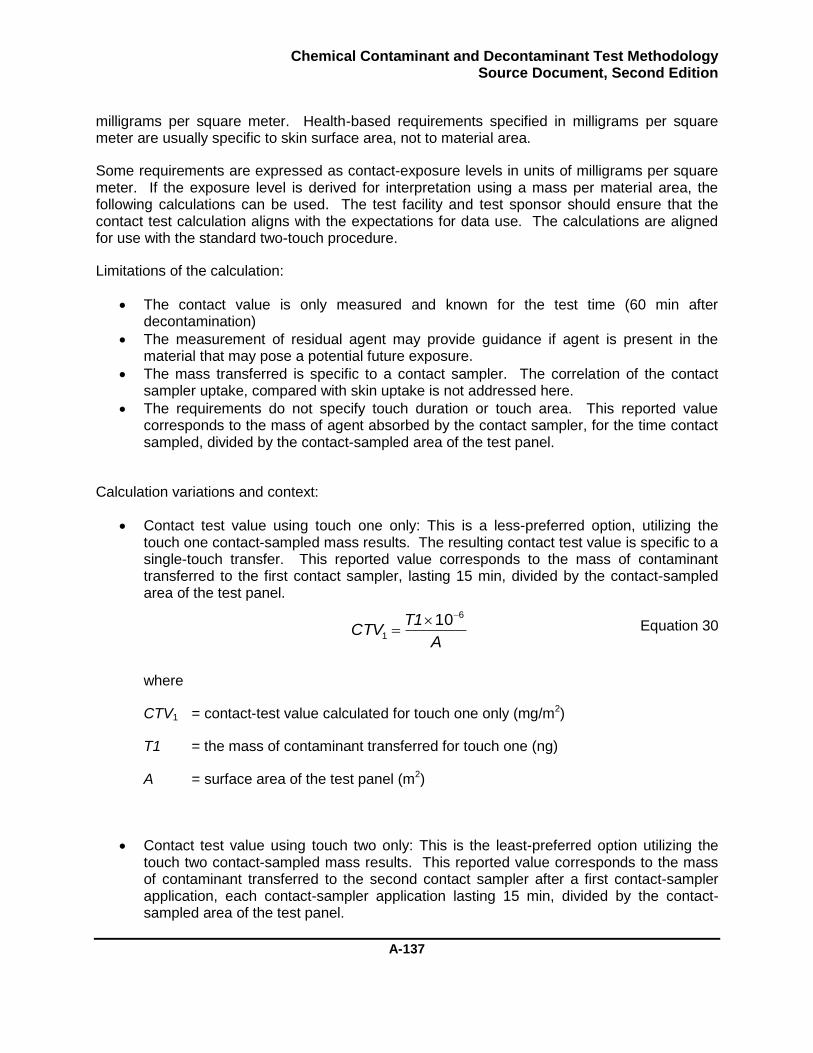
Chemical Contaminant and Decontaminant Test Methodology Source Document, Second Edition
A-137
milligrams per square meter. Health-based requirements specified in milligrams per square meter are usually specific to skin surface area, not to material area.
Some requirements are expressed as contact-exposure levels in units of milligrams per square meter. If the exposure level is derived for interpretation using a mass per material area, the following calculations can be used. The test facility and test sponsor should ensure that the contact test calculation aligns with the expectations for data use. The calculations are aligned for use with the standard two-touch procedure.
Limitations of the calculation:
The contact value is only measured and known for the test time (60 min after decontamination)
The measurement of residual agent may provide guidance if agent is present in the material that may pose a potential future exposure.
The mass transferred is specific to a contact sampler. The correlation of the contact sampler uptake, compared with skin uptake is not addressed here.
The requirements do not specify touch duration or touch area. This reported value corresponds to the mass of agent absorbed by the contact sampler, for the time contact sampled, divided by the contact-sampled area of the test panel.
Calculation variations and context:
Contact test value using touch one only: This is a less-preferred option, utilizing the touch one contact-sampled mass results. The resulting contact test value is specific to a single-touch transfer. This reported value corresponds to the mass of contaminant transferred to the first contact sampler, lasting 15 min, divided by the contact-sampled area of the test panel.
Equation 30
where
CTV1 = contact-test value calculated for touch one only (mg/m2)
T1 = the mass of contaminant transferred for touch one (ng)
A = surface area of the test panel (m2)
Contact test value using touch two only: This is the least-preferred option utilizing the touch two contact-sampled mass results. This reported value corresponds to the mass of contaminant transferred to the second contact sampler after a first contact-sampler application, each contact-sampler application lasting 15 min, divided by the contact-sampled area of the test panel.
A
T1CTV
6
1
10

Chemical Contaminant and Decontaminant Test Methodology Source Document, Second Edition
A-138
Equation 31
where
CTV2 = contact test value calculated for touch two only (mg/m2)
T2 = the mass of contaminant transferred for touch two (ng)
Contact test value using sum of two touches: This is the more-preferred option utilizing a sum of the contact-sampled masses. This reported value corresponds to the mass of contaminant transferred to the contact sampler for two touches, each lasting 15 min, divided by the contact-sampled area of the test panel.
Equation 32
where
CTV1,2 = contact-test value calculated for T1+T2 (mg/m2)
Contact test value using sum of two touches and residual contaminant value: This is the most-preferred option, utilizing a sum of the contact-sampled masses and residual contaminant. This reported value corresponds to the mass of contaminant transferred to the contact sampler for two touches, each lasting 15 min, in addition to the residual contaminant divided by the contact-sampled area of the test panel.
Equation 33
where
CTV1,2,R = contact test value calculated for the sum of touch one, touch two, and residual contaminant (mg/m2)
RE = the residual contaminant extracted from the panel (ng)
A
T2T1CTV
6
2,1
10)(
A
T2CTV
6
2
10
A
RET2T1CTV
6
R,2,1
10
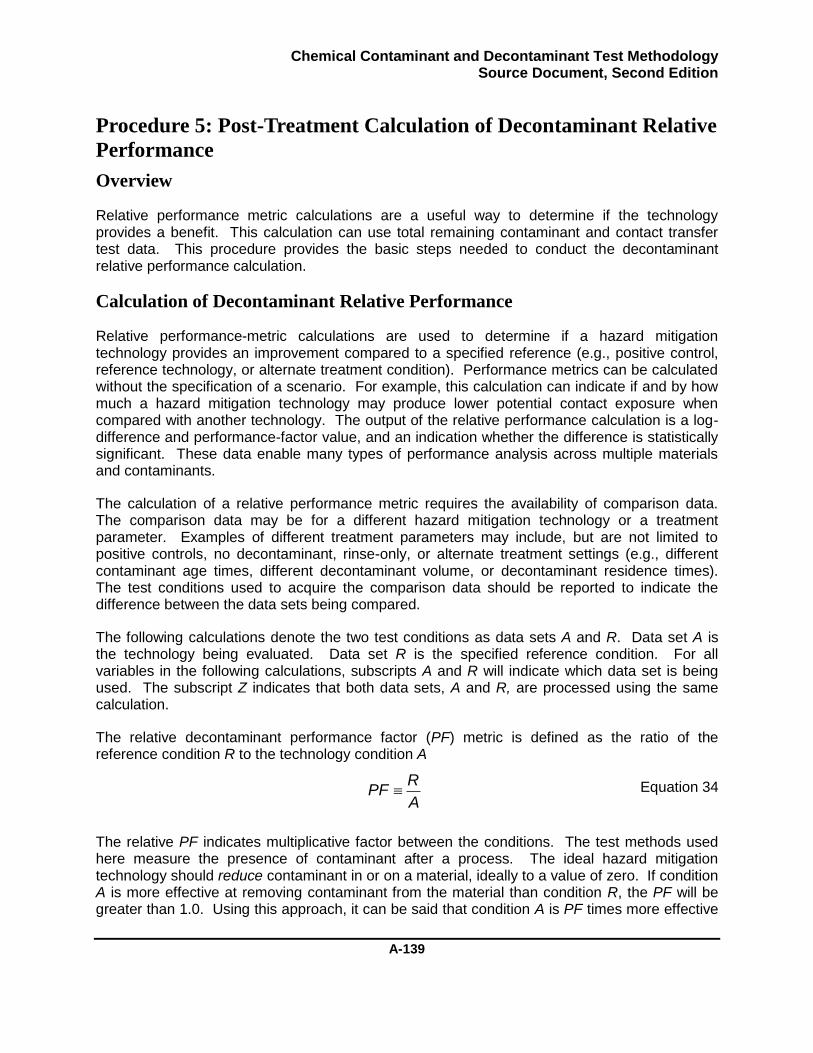
Chemical Contaminant and Decontaminant Test Methodology Source Document, Second Edition
A-139
Procedure 5: Post-Treatment Calculation of Decontaminant Relative
Performance
Overview
Relative performance metric calculations are a useful way to determine if the technology provides a benefit. This calculation can use total remaining contaminant and contact transfer test data. This procedure provides the basic steps needed to conduct the decontaminant relative performance calculation.
Calculation of Decontaminant Relative Performance
Relative performance-metric calculations are used to determine if a hazard mitigation technology provides an improvement compared to a specified reference (e.g., positive control, reference technology, or alternate treatment condition). Performance metrics can be calculated without the specification of a scenario. For example, this calculation can indicate if and by how much a hazard mitigation technology may produce lower potential contact exposure when compared with another technology. The output of the relative performance calculation is a log-difference and performance-factor value, and an indication whether the difference is statistically significant. These data enable many types of performance analysis across multiple materials and contaminants.
The calculation of a relative performance metric requires the availability of comparison data. The comparison data may be for a different hazard mitigation technology or a treatment parameter. Examples of different treatment parameters may include, but are not limited to positive controls, no decontaminant, rinse-only, or alternate treatment settings (e.g., different contaminant age times, different decontaminant volume, or decontaminant residence times). The test conditions used to acquire the comparison data should be reported to indicate the difference between the data sets being compared.
The following calculations denote the two test conditions as data sets A and R. Data set A is the technology being evaluated. Data set R is the specified reference condition. For all variables in the following calculations, subscripts A and R will indicate which data set is being used. The subscript Z indicates that both data sets, A and R, are processed using the same calculation.
The relative decontaminant performance factor (PF) metric is defined as the ratio of the reference condition R to the technology condition A
Equation 34
The relative PF indicates multiplicative factor between the conditions. The test methods used here measure the presence of contaminant after a process. The ideal hazard mitigation technology should reduce contaminant in or on a material, ideally to a value of zero. If condition A is more effective at removing contaminant from the material than condition R, the PF will be greater than 1.0. Using this approach, it can be said that condition A is PF times more effective
A
RPF

Chemical Contaminant and Decontaminant Test Methodology Source Document, Second Edition
A-140
than condition R. If PF is less than 1.0, condition A is less effective than condition R, by a factor of 1/PF.
The data collected from these test methods are left-censored (i.e., mass detected must be greater than zero). The data used in a performance calculation may also differ by many orders of magnitude. The use of a log transform ensures the left-censored characteristic of the data is maintained and simplifies the data interpretation. Equation 34 is log-transformed to present the relative PF as a log difference (LD)
Equation 35
Using this approach, an LD of 0.0 indicates that condition A and condition R are equivalent. If LD is greater than 0.0, condition A is LD orders of magnitude more effective than condition R. If LD is less than 0.0, condition A is LD orders of magnitude less effective than condition R. The LD calculation does not require the inverse operation to interpret the PF, if values are greater than or less than 1.0. Table 49 illustrates the relationship between LD and PF and provides an interpretation of the data.
Table 49. Conversion between log difference and PF.
LD (LD=log10[PF])
PF (PF=10
LD)
Interpretation
5 100,000
Condition A is 5 orders of magnitude more effective than condition R.
The condition A is 100,000 (PF) times more effective (i.e., the data mean is 100,000 times less) than condition R.
For example, Decon X (Condition A) was 100,000 times better than rinsing alone (Condition R)
4 10,000 Condition A is 4 orders of magnitude more effective than condition R.
3 1,000 Condition A is 3 orders of magnitude more effective than condition R.
2 100 Condition A is 2 orders of magnitude more effective than condition R.
1 10 Condition A is 1 order of magnitude more effective than condition R.
0.5 3.16 Condition A is 0.5 orders of magnitude more effective than condition R.
0 1
Condition A had a 0.0 log difference compared to condition R.
The effectiveness of condition A is equivalent to the effectiveness of condition R.
For example, Decon X (Condition A) was equivalent to rinsing alone (Condition R)
ARA
RPF 10101010 loglogloglogLD
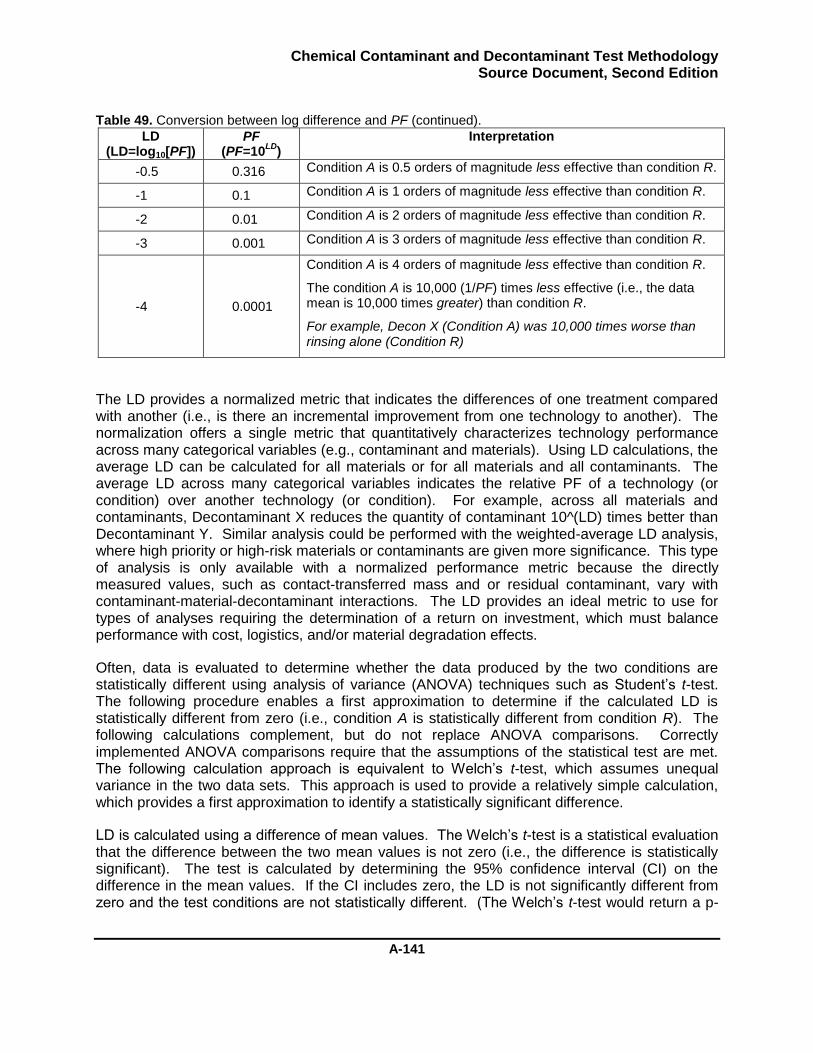
Chemical Contaminant and Decontaminant Test Methodology Source Document, Second Edition
A-141
Table 49. Conversion between log difference and PF (continued).
LD (LD=log10[PF])
PF (PF=10
LD)
Interpretation
-0.5 0.316 Condition A is 0.5 orders of magnitude less effective than condition R.
-1 0.1 Condition A is 1 orders of magnitude less effective than condition R.
-2 0.01 Condition A is 2 orders of magnitude less effective than condition R.
-3 0.001 Condition A is 3 orders of magnitude less effective than condition R.
-4 0.0001
Condition A is 4 orders of magnitude less effective than condition R.
The condition A is 10,000 (1/PF) times less effective (i.e., the data mean is 10,000 times greater) than condition R.
For example, Decon X (Condition A) was 10,000 times worse than rinsing alone (Condition R)
The LD provides a normalized metric that indicates the differences of one treatment compared with another (i.e., is there an incremental improvement from one technology to another). The normalization offers a single metric that quantitatively characterizes technology performance across many categorical variables (e.g., contaminant and materials). Using LD calculations, the average LD can be calculated for all materials or for all materials and all contaminants. The average LD across many categorical variables indicates the relative PF of a technology (or condition) over another technology (or condition). For example, across all materials and contaminants, Decontaminant X reduces the quantity of contaminant 10^(LD) times better than Decontaminant Y. Similar analysis could be performed with the weighted-average LD analysis, where high priority or high-risk materials or contaminants are given more significance. This type of analysis is only available with a normalized performance metric because the directly measured values, such as contact-transferred mass and or residual contaminant, vary with contaminant-material-decontaminant interactions. The LD provides an ideal metric to use for types of analyses requiring the determination of a return on investment, which must balance performance with cost, logistics, and/or material degradation effects.
Often, data is evaluated to determine whether the data produced by the two conditions are statistically different using analysis of variance (ANOVA) techniques such as Student’s t-test. The following procedure enables a first approximation to determine if the calculated LD is statistically different from zero (i.e., condition A is statistically different from condition R). The following calculations complement, but do not replace ANOVA comparisons. Correctly implemented ANOVA comparisons require that the assumptions of the statistical test are met. The following calculation approach is equivalent to Welch’s t-test, which assumes unequal variance in the two data sets. This approach is used to provide a relatively simple calculation, which provides a first approximation to identify a statistically significant difference.
LD is calculated using a difference of mean values. The Welch’s t-test is a statistical evaluation that the difference between the two mean values is not zero (i.e., the difference is statistically significant). The test is calculated by determining the 95% confidence interval (CI) on the difference in the mean values. If the CI includes zero, the LD is not significantly different from zero and the test conditions are not statistically different. (The Welch’s t-test would return a p-
Chemical Contaminant and Decontaminant Test Methodology Source Document, Second Edition
A-142
value greater than 0.05.) The calculation methodology provides the procedures and interpretation to identify whether the LD is statistically significant.
The LD relative performance calculations can be performed on multiple groupings of data. The following procedures provide options on how to group the data for use in the LD calculations. The options include: single-touch comparisons, multiple-touch comparisons, and total contaminant comparisons. Each option utilizes the equations described in the derivation of LD and the CI. For clarity in reporting, the LD value will carry a subscript that describes the data used for the calculation. The individual data groupings indicate different aspects of system performance and are discussed in the respective option definitions. The subscript notation is described in the definition for each option.
Example Data
The calculations are demonstrated at each step of the procedure using example data. The example data are composed of two materials—organic CARC and silicone. Each material was treated with three processes. The materials were contaminated with two 1.0 µL droplets of HD, aged for 60 min, and treated with three conditions. The conditions included decontamination with Decon X and Decon Y and a rinse-only process. The decontaminant resided on the material for 30 min followed by the rinse process. The samples were then analyzed using the standard two-touch contact test. The demonstration data is presented in Table 50 where the results have been converted from measured concentrations to mass-extracted, according to the guidance in the section “Prepare and Report Results for Test Samples”. The procedure is demonstrated for the Step 1 Option 3 configuration, analyzing the mass transferred (MT) plus the residual contaminant (RE) data, which is also referred to as the total mass (MT+RE). There are three conditions presented; therefore, multiple combinations of A and R performance evaluations can be performed.
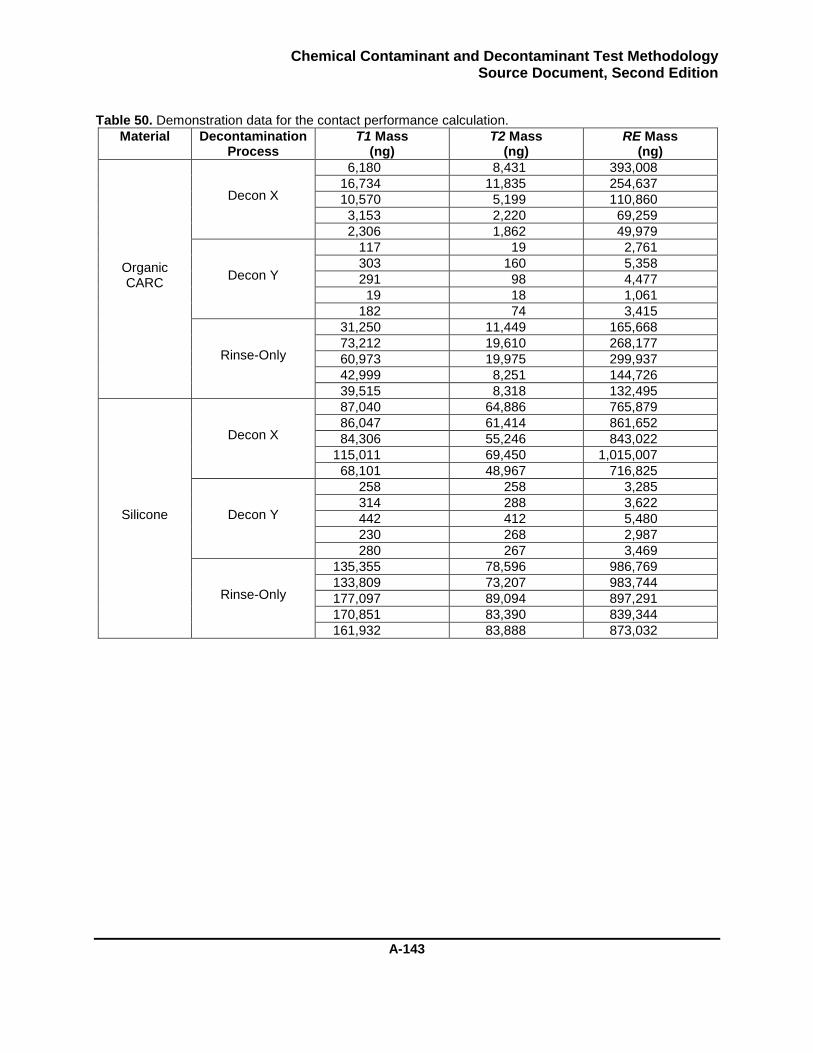
Chemical Contaminant and Decontaminant Test Methodology Source Document, Second Edition
A-143
Table 50. Demonstration data for the contact performance calculation.
Material Decontamination Process
T1 Mass (ng)
T2 Mass (ng)
RE Mass (ng)
Organic CARC
Decon X
6,180 8,431 393,008
16,734 11,835 254,637
10,570 5,199 110,860
3,153 2,220 69,259
2,306 1,862 49,979
Decon Y
117 19 2,761
303 160 5,358
291 98 4,477
19 18 1,061
182 74 3,415
Rinse-Only
31,250 11,449 165,668
73,212 19,610 268,177
60,973 19,975 299,937
42,999 8,251 144,726
39,515 8,318 132,495
Silicone
Decon X
87,040 64,886 765,879
86,047 61,414 861,652
84,306 55,246 843,022
115,011 69,450 1,015,007
68,101 48,967 716,825
Decon Y
258 258 3,285
314 288 3,622
442 412 5,480
230 268 2,987
280 267 3,469
Rinse-Only
135,355 78,596 986,769
133,809 73,207 983,744
177,097 89,094 897,291
170,851 83,390 839,344
161,932 83,888 873,032
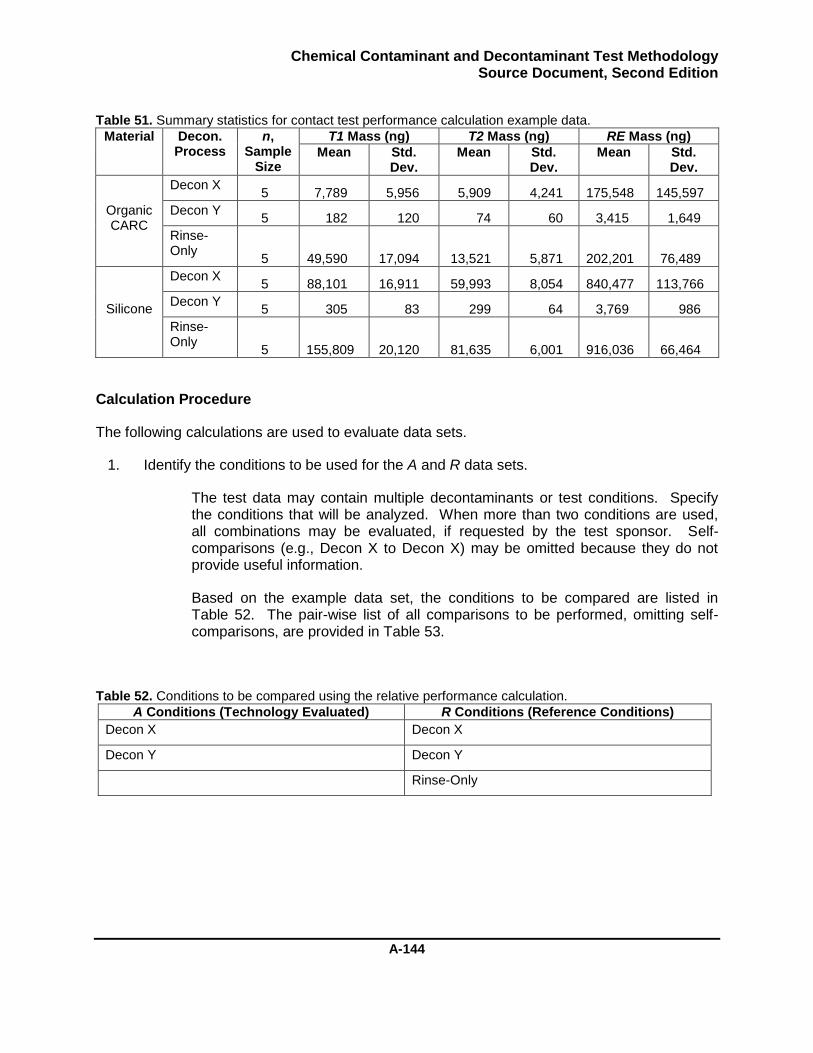
Chemical Contaminant and Decontaminant Test Methodology Source Document, Second Edition
A-144
Table 51. Summary statistics for contact test performance calculation example data.
Material Decon. Process
n, Sample
Size
T1 Mass (ng) T2 Mass (ng) RE Mass (ng)
Mean Std. Dev.
Mean Std. Dev.
Mean Std. Dev.
Organic CARC
Decon X 5 7,789 5,956 5,909 4,241 175,548 145,597
Decon Y 5 182 120 74 60 3,415 1,649
Rinse-Only
5 49,590 17,094 13,521 5,871 202,201 76,489
Silicone
Decon X 5 88,101 16,911 59,993 8,054 840,477 113,766
Decon Y 5 305 83 299 64 3,769 986
Rinse- Only
5 155,809 20,120 81,635 6,001 916,036 66,464
Calculation Procedure
The following calculations are used to evaluate data sets.
1. Identify the conditions to be used for the A and R data sets.
The test data may contain multiple decontaminants or test conditions. Specify the conditions that will be analyzed. When more than two conditions are used, all combinations may be evaluated, if requested by the test sponsor. Self-comparisons (e.g., Decon X to Decon X) may be omitted because they do not provide useful information.
Based on the example data set, the conditions to be compared are listed in Table 52. The pair-wise list of all comparisons to be performed, omitting self-comparisons, are provided in Table 53.
Table 52. Conditions to be compared using the relative performance calculation.
A Conditions (Technology Evaluated) R Conditions (Reference Conditions)
Decon X Decon X
Decon Y Decon Y
Rinse-Only
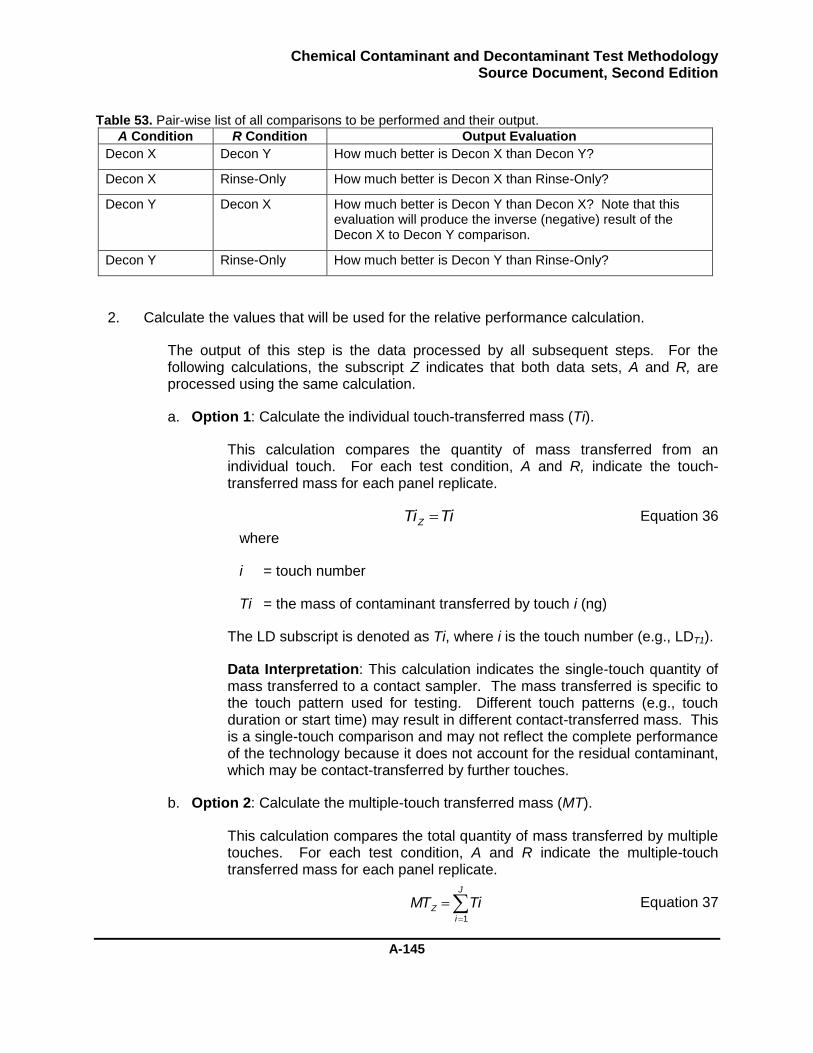
Chemical Contaminant and Decontaminant Test Methodology Source Document, Second Edition
A-145
Table 53. Pair-wise list of all comparisons to be performed and their output.
A Condition R Condition Output Evaluation
Decon X Decon Y How much better is Decon X than Decon Y?
Decon X Rinse-Only How much better is Decon X than Rinse-Only?
Decon Y Decon X How much better is Decon Y than Decon X? Note that this evaluation will produce the inverse (negative) result of the Decon X to Decon Y comparison.
Decon Y Rinse-Only How much better is Decon Y than Rinse-Only?
2. Calculate the values that will be used for the relative performance calculation.
The output of this step is the data processed by all subsequent steps. For the following calculations, the subscript Z indicates that both data sets, A and R, are processed using the same calculation.
a. Option 1: Calculate the individual touch-transferred mass (Ti).
This calculation compares the quantity of mass transferred from an individual touch. For each test condition, A and R, indicate the touch-transferred mass for each panel replicate.
Equation 36
where
i = touch number
Ti = the mass of contaminant transferred by touch i (ng)
The LD subscript is denoted as Ti, where i is the touch number (e.g., LDT1).
Data Interpretation: This calculation indicates the single-touch quantity of mass transferred to a contact sampler. The mass transferred is specific to the touch pattern used for testing. Different touch patterns (e.g., touch duration or start time) may result in different contact-transferred mass. This is a single-touch comparison and may not reflect the complete performance of the technology because it does not account for the residual contaminant, which may be contact-transferred by further touches.
b. Option 2: Calculate the multiple-touch transferred mass (MT).
This calculation compares the total quantity of mass transferred by multiple touches. For each test condition, A and R indicate the multiple-touch transferred mass for each panel replicate.
Equation 37
TiTiZ
J
i
Z TiMT1
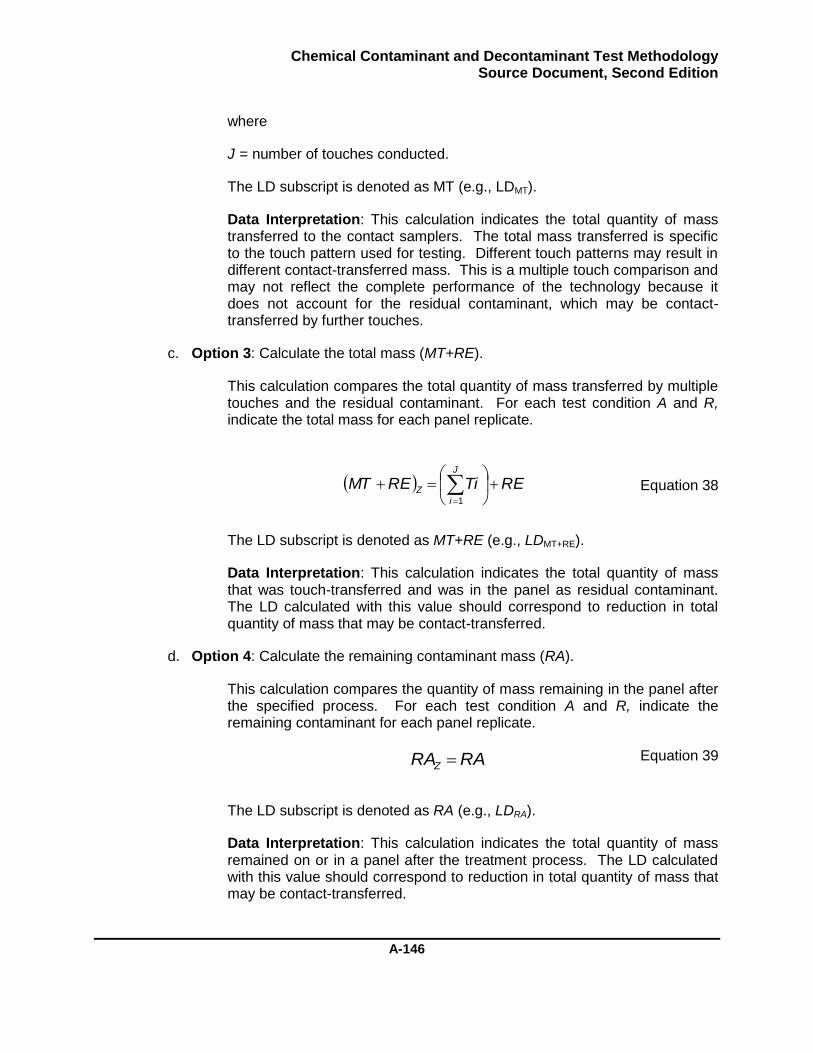
Chemical Contaminant and Decontaminant Test Methodology Source Document, Second Edition
A-146
where
J = number of touches conducted.
The LD subscript is denoted as MT (e.g., LDMT).
Data Interpretation: This calculation indicates the total quantity of mass transferred to the contact samplers. The total mass transferred is specific to the touch pattern used for testing. Different touch patterns may result in different contact-transferred mass. This is a multiple touch comparison and may not reflect the complete performance of the technology because it does not account for the residual contaminant, which may be contact-transferred by further touches.
c. Option 3: Calculate the total mass (MT+RE).
This calculation compares the total quantity of mass transferred by multiple touches and the residual contaminant. For each test condition A and R, indicate the total mass for each panel replicate.
Equation 38
The LD subscript is denoted as MT+RE (e.g., LDMT+RE).
Data Interpretation: This calculation indicates the total quantity of mass that was touch-transferred and was in the panel as residual contaminant. The LD calculated with this value should correspond to reduction in total quantity of mass that may be contact-transferred.
d. Option 4: Calculate the remaining contaminant mass (RA).
This calculation compares the quantity of mass remaining in the panel after the specified process. For each test condition A and R, indicate the remaining contaminant for each panel replicate.
Equation 39
The LD subscript is denoted as RA (e.g., LDRA).
Data Interpretation: This calculation indicates the total quantity of mass remained on or in a panel after the treatment process. The LD calculated with this value should correspond to reduction in total quantity of mass that may be contact-transferred.
RETiREMTJ
i
Z
1
RARAZ
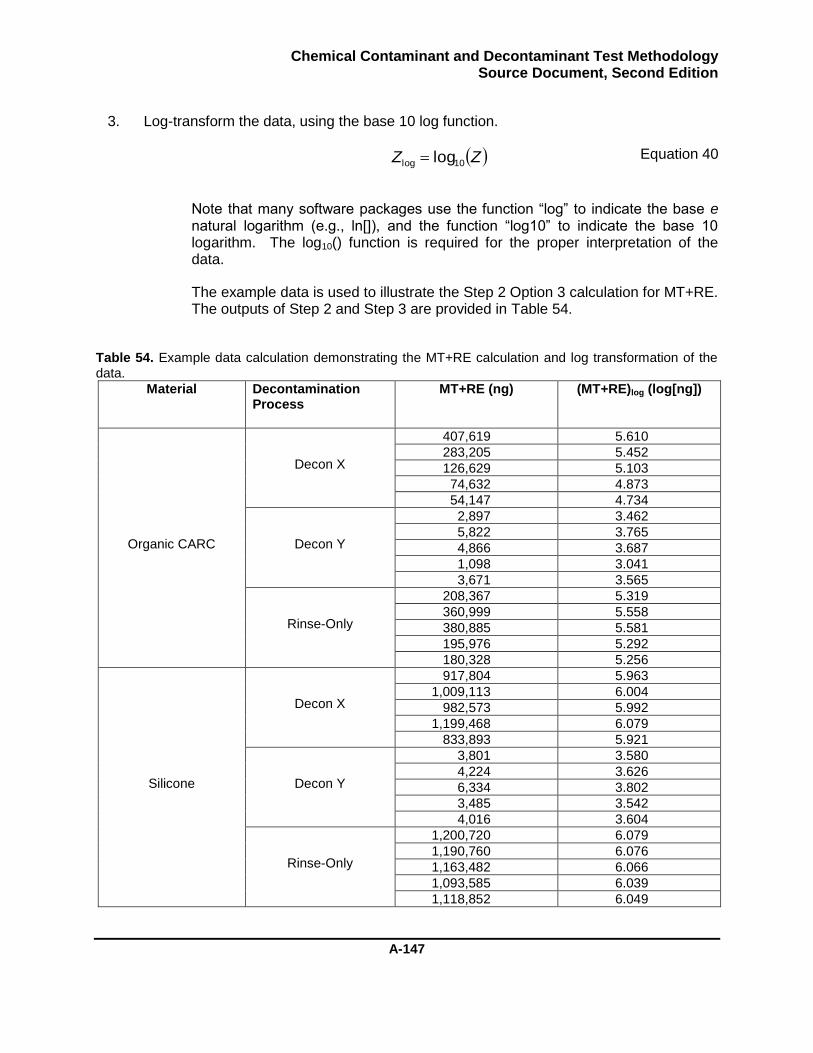
Chemical Contaminant and Decontaminant Test Methodology Source Document, Second Edition
A-147
3. Log-transform the data, using the base 10 log function.
Equation 40
Note that many software packages use the function “log” to indicate the base e natural logarithm (e.g., ln[]), and the function “log10” to indicate the base 10 logarithm. The log10() function is required for the proper interpretation of the data.
The example data is used to illustrate the Step 2 Option 3 calculation for MT+RE. The outputs of Step 2 and Step 3 are provided in Table 54.
Table 54. Example data calculation demonstrating the MT+RE calculation and log transformation of the data.
Material Decontamination Process
MT+RE (ng) (MT+RE)log (log[ng])
Organic CARC
Decon X
407,619 5.610
283,205 5.452
126,629 5.103
74,632 4.873
54,147 4.734
Decon Y
2,897 3.462
5,822 3.765
4,866 3.687
1,098 3.041
3,671 3.565
Rinse-Only
208,367 5.319
360,999 5.558
380,885 5.581
195,976 5.292
180,328 5.256
Silicone
Decon X
917,804 5.963
1,009,113 6.004
982,573 5.992
1,199,468 6.079
833,893 5.921
Decon Y
3,801 3.580
4,224 3.626
6,334 3.802
3,485 3.542
4,016 3.604
Rinse-Only
1,200,720 6.079
1,190,760 6.076
1,163,482 6.066
1,093,585 6.039
1,118,852 6.049
ZZ 10log log
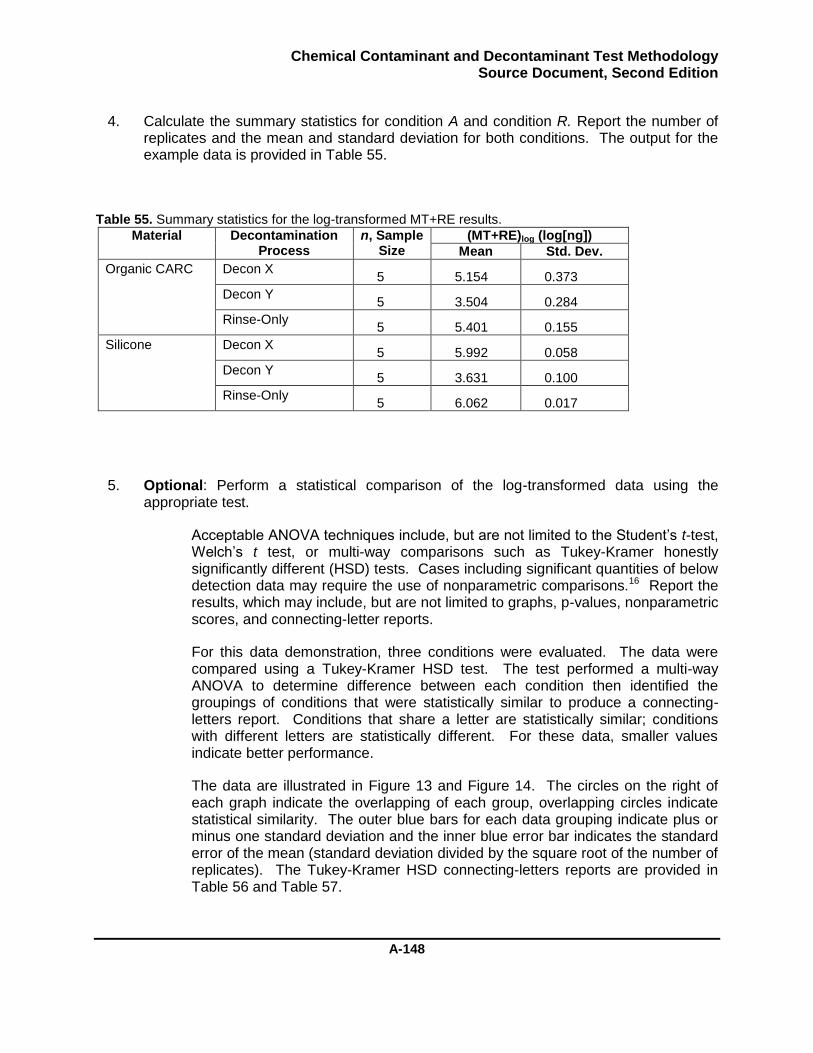
Chemical Contaminant and Decontaminant Test Methodology Source Document, Second Edition
A-148
4. Calculate the summary statistics for condition A and condition R. Report the number of replicates and the mean and standard deviation for both conditions. The output for the example data is provided in Table 55.
Table 55. Summary statistics for the log-transformed MT+RE results.
Material Decontamination Process
n, Sample Size
(MT+RE)log (log[ng])
Mean Std. Dev.
Organic CARC Decon X 5 5.154 0.373
Decon Y 5 3.504 0.284
Rinse-Only 5 5.401 0.155
Silicone Decon X 5 5.992 0.058
Decon Y 5 3.631 0.100
Rinse-Only 5 6.062 0.017
5. Optional: Perform a statistical comparison of the log-transformed data using the appropriate test.
Acceptable ANOVA techniques include, but are not limited to the Student’s t-test, Welch’s t test, or multi-way comparisons such as Tukey-Kramer honestly significantly different (HSD) tests. Cases including significant quantities of below detection data may require the use of nonparametric comparisons.16 Report the results, which may include, but are not limited to graphs, p-values, nonparametric scores, and connecting-letter reports.
For this data demonstration, three conditions were evaluated. The data were compared using a Tukey-Kramer HSD test. The test performed a multi-way ANOVA to determine difference between each condition then identified the groupings of conditions that were statistically similar to produce a connecting-letters report. Conditions that share a letter are statistically similar; conditions with different letters are statistically different. For these data, smaller values indicate better performance.
The data are illustrated in Figure 13 and Figure 14. The circles on the right of each graph indicate the overlapping of each group, overlapping circles indicate statistical similarity. The outer blue bars for each data grouping indicate plus or minus one standard deviation and the inner blue error bar indicates the standard error of the mean (standard deviation divided by the square root of the number of replicates). The Tukey-Kramer HSD connecting-letters reports are provided in Table 56 and Table 57.
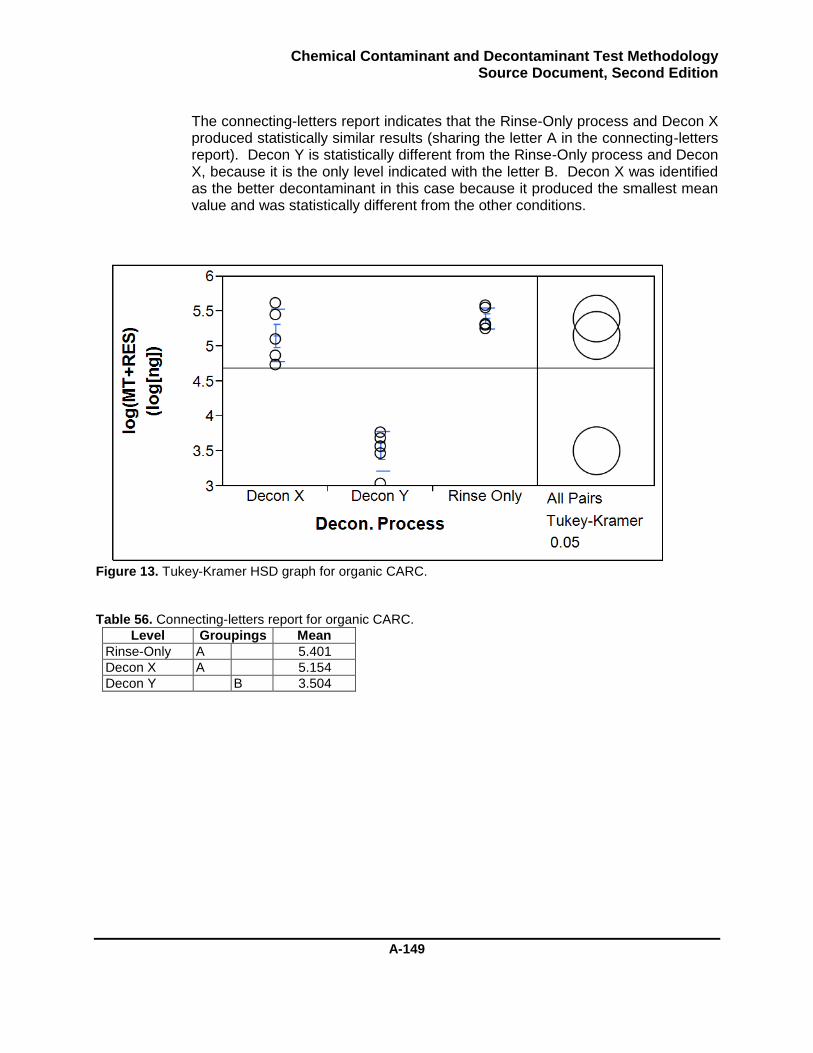
Chemical Contaminant and Decontaminant Test Methodology Source Document, Second Edition
A-149
The connecting-letters report indicates that the Rinse-Only process and Decon X produced statistically similar results (sharing the letter A in the connecting-letters report). Decon Y is statistically different from the Rinse-Only process and Decon X, because it is the only level indicated with the letter B. Decon X was identified as the better decontaminant in this case because it produced the smallest mean value and was statistically different from the other conditions.
Figure 13. Tukey-Kramer HSD graph for organic CARC.
Table 56. Connecting-letters report for organic CARC.
Level Groupings Mean
Rinse-Only A 5.401
Decon X A 5.154
Decon Y B 3.504
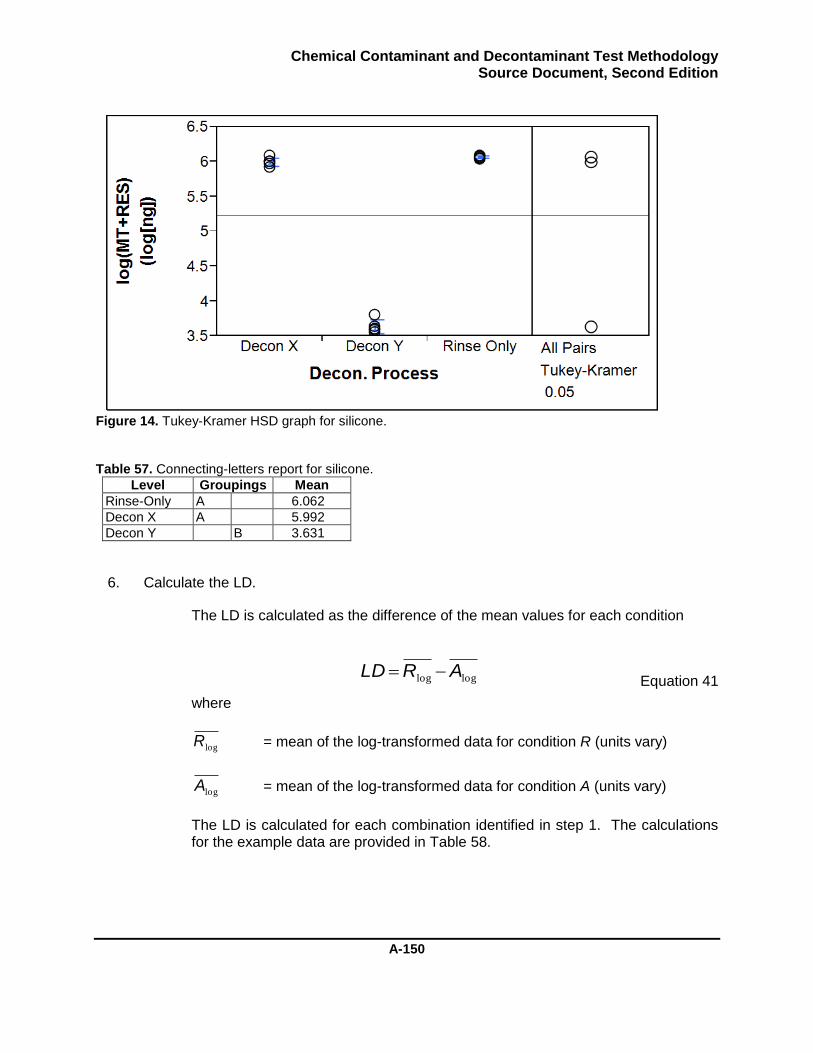
Chemical Contaminant and Decontaminant Test Methodology Source Document, Second Edition
A-150
Figure 14. Tukey-Kramer HSD graph for silicone.
Table 57. Connecting-letters report for silicone.
Level Groupings Mean
Rinse-Only A 6.062
Decon X A 5.992
Decon Y B 3.631
6. Calculate the LD.
The LD is calculated as the difference of the mean values for each condition
Equation 41
where
logR = mean of the log-transformed data for condition R (units vary)
logA = mean of the log-transformed data for condition A (units vary)
The LD is calculated for each combination identified in step 1. The calculations for the example data are provided in Table 58.
loglog ARLD
Chemical Contaminant and Decontaminant Test Methodology Source Document, Second Edition
A-151
Table 58. Calculation of LD for each combination.
Material A Data Level R Data Level LDMT+RES
Organic CARC
Decon X Decon Y -1.650
Decon X Rinse-Only 0.247
Decon Y Decon X 1.650
Decon Y Rinse-Only 1.897
Silicone
Decon X Decon Y -2.361
Decon X Rinse-Only 0.070
Decon Y Decon X 2.361
Decon Y Rinse-Only 2.431
7. Calculate the CI for the LD.
The 95% CI for the difference of the means is used to determine if the LD is statistically different from zero. The 95% CI is expressed as29
Equation 42
where
Equation 43
Equation 44
Equation 45
where
CI = confidence interval for LD (units vary)
t = t value (unitless)
α = probability level (unitless)
DF = degrees of freedom (unitless)
nR = number of replicates for condition R (unitless)
A
A
R
R
n
s
n
sSE
22
loglog
SEtCI DF ),2/(
CILD
11
2222
222
loglog
loglog
AAARRR
AARR
nnsnns
nsnsDF
Chemical Contaminant and Decontaminant Test Methodology Source Document, Second Edition
A-152
nA = number of replicates for condition A (unitless)
SE = standard error of the difference of the means (units vary)
logRs = standard deviation of the log-transformed data for condition R
(units vary)
logAs = standard deviation of the log-transformed data for condition A
(units vary)
Confidence intervals can be calculated for different probability levels, expressed as 1-α. In this case, to calculate a 95% CI, α = 0.05. The t value is a function of α and the degrees of freedom (DF) in the system. The t value can be obtained from statistical lookup tables29 or it can be obtained from commercial software packages. For example, the Microsoft Excel function, TINV, can be used to provide the t value. Note that the Excel function will truncate the DF to the lowest integer and the alpha input is divided by two inside the function. For example, the t value for a 95% confidence interval with 8.25 DF is calculated with Excel as TINV(0.05,8.25) which will return a t value of 2.306. This is the expected result as the DF was truncated to the integer value of 8. This is the standard approach used by most commercial software packages to calculate t values.
The calculation of LD and the corresponding CI enable the characterization of the performance between two conditions. When the CI is greater than LD then the CI bounds include zero. If the CI includes zero then the conditions are statistically similar and the LD does not indicate a confident difference in performance, in this case the LD can be considered as zero. If CI is less than LD (the CI does not include zero), then the two conditions have significantly different performances as described by LD.
Table 59. Calculation of the LD CI for each combination.
Material A Data Level R Data Level LDMT+RES LDMT+RES
Confidence Interval
LDMT+RES is Statistically Different
from Zero
Organic CARC
Decon X Decon Y -1.650 0.495 Yes
Decon X Rinse Only 0.247 0.464 No
Decon Y Decon X 1.650 0.495 Yes
Decon Y Rinse Only 1.897 0.354 Yes
Silicone
Decon X Decon Y -2.361 0.127 Yes
Decon X Rinse Only 0.070 0.076 No
Decon Y Decon X 2.361 0.127 Yes
Decon Y Rinse Only 2.431 0.127 Yes
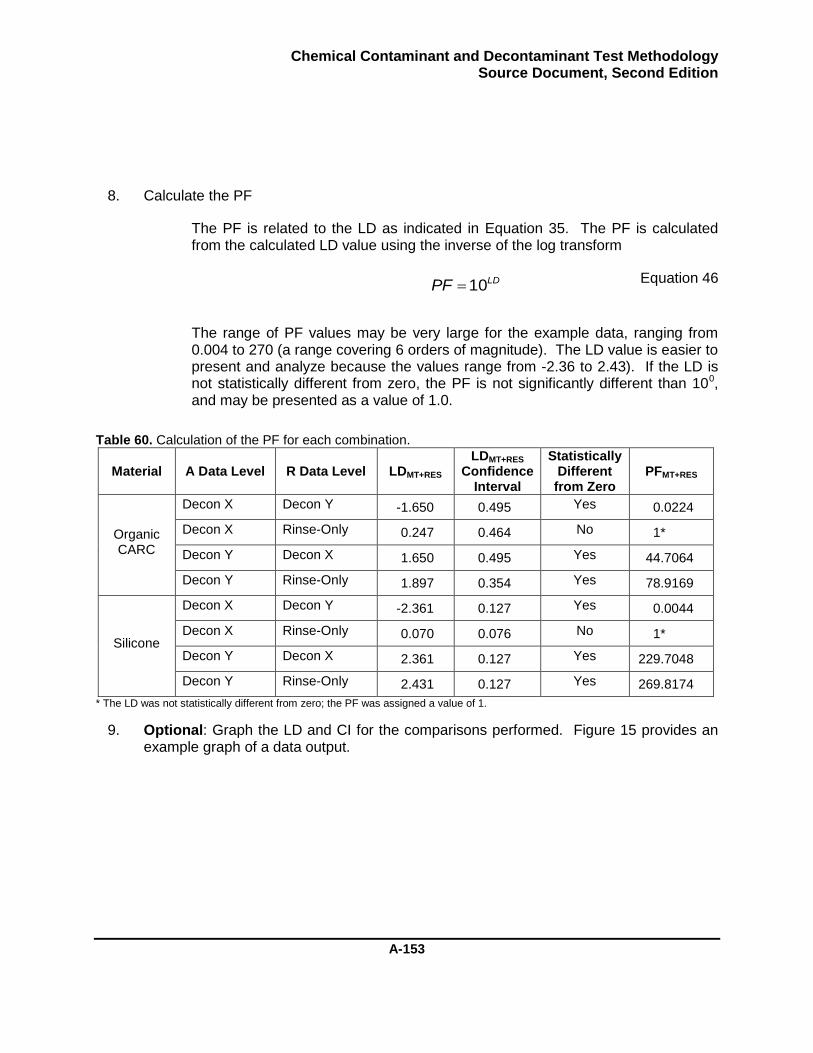
Chemical Contaminant and Decontaminant Test Methodology Source Document, Second Edition
A-153
8. Calculate the PF
The PF is related to the LD as indicated in Equation 35. The PF is calculated from the calculated LD value using the inverse of the log transform
Equation 46
The range of PF values may be very large for the example data, ranging from 0.004 to 270 (a range covering 6 orders of magnitude). The LD value is easier to present and analyze because the values range from -2.36 to 2.43). If the LD is not statistically different from zero, the PF is not significantly different than 100, and may be presented as a value of 1.0.
Table 60. Calculation of the PF for each combination.
Material A Data Level R Data Level LDMT+RES LDMT+RES
Confidence Interval
Statistically Different from Zero
PFMT+RES
Organic CARC
Decon X Decon Y -1.650 0.495 Yes 0.0224
Decon X Rinse-Only 0.247 0.464 No 1*
Decon Y Decon X 1.650 0.495 Yes 44.7064
Decon Y Rinse-Only 1.897 0.354 Yes 78.9169
Silicone
Decon X Decon Y -2.361 0.127 Yes 0.0044
Decon X Rinse-Only 0.070 0.076 No 1*
Decon Y Decon X 2.361 0.127 Yes 229.7048
Decon Y Rinse-Only 2.431 0.127 Yes 269.8174
* The LD was not statistically different from zero; the PF was assigned a value of 1.
9. Optional: Graph the LD and CI for the comparisons performed. Figure 15 provides an example graph of a data output.
LDPF 10

Chemical Contaminant and Decontaminant Test Methodology Source Document, Second Edition
A-154
Figure 15. Example graph for LD and CI from example test data.
10. Optional: Extended analysis of LD across multiple materials and multiple contaminants.
LD and the associated PF are normalized performance metrics that enable comparisons across categorical variables such as material and contaminant. Table 61 provides conceptual data for Decon Y compared to Decon X on multiple materials, with multiple contaminants (i.e., HD, GD, and VX), to illustrate how LD values can be used. The LD values can be averaged across materials and/or contaminants. The average PF value is calculated as 10^(average LD value). When averaging LD values across categorical variables, conditions that produce a LD that is not significantly different than zero should set the LD value to 0.0 to prevent biasing the calculated average.
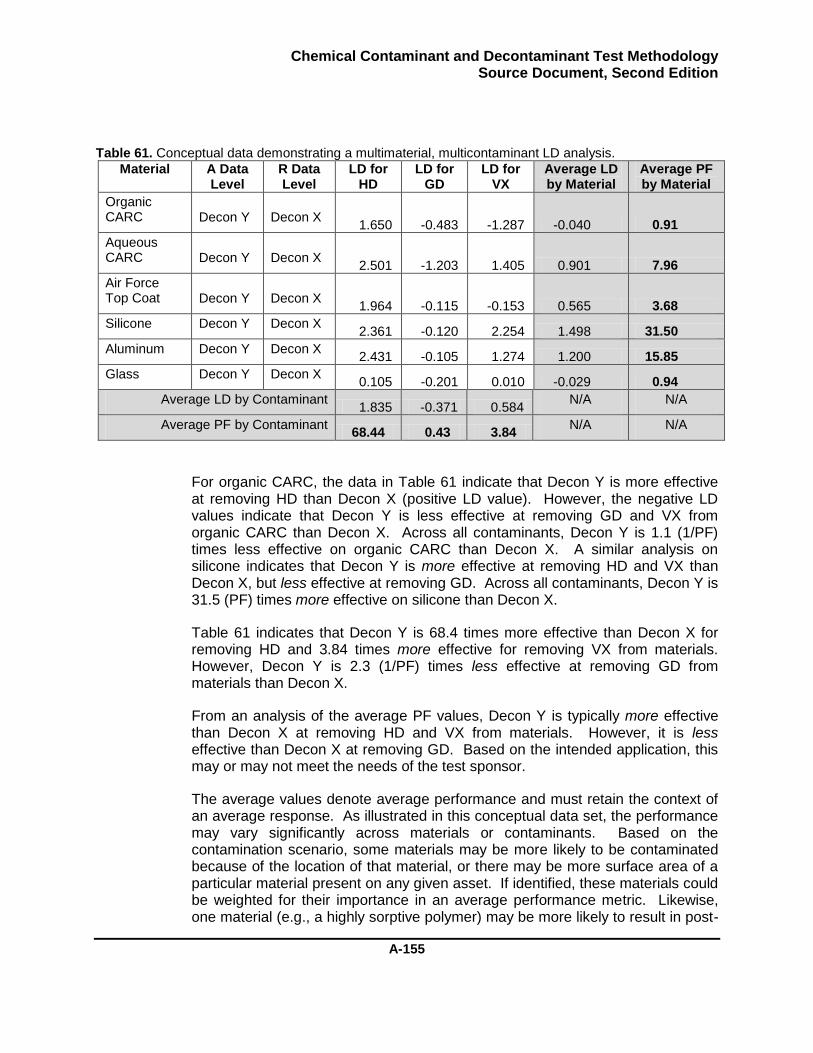
Chemical Contaminant and Decontaminant Test Methodology Source Document, Second Edition
A-155
Table 61. Conceptual data demonstrating a multimaterial, multicontaminant LD analysis.
Material A Data Level
R Data Level
LD for HD
LD for GD
LD for VX
Average LD by Material
Average PF by Material
Organic CARC Decon Y Decon X
1.650 -0.483 -1.287 -0.040 0.91
Aqueous CARC Decon Y Decon X
2.501 -1.203 1.405 0.901 7.96
Air Force Top Coat Decon Y Decon X
1.964 -0.115 -0.153 0.565 3.68
Silicone Decon Y Decon X 2.361 -0.120 2.254 1.498 31.50
Aluminum Decon Y Decon X 2.431 -0.105 1.274 1.200 15.85
Glass Decon Y Decon X 0.105 -0.201 0.010 -0.029 0.94
Average LD by Contaminant 1.835 -0.371 0.584
N/A N/A
Average PF by Contaminant 68.44 0.43 3.84
N/A N/A
For organic CARC, the data in Table 61 indicate that Decon Y is more effective at removing HD than Decon X (positive LD value). However, the negative LD values indicate that Decon Y is less effective at removing GD and VX from organic CARC than Decon X. Across all contaminants, Decon Y is 1.1 (1/PF) times less effective on organic CARC than Decon X. A similar analysis on silicone indicates that Decon Y is more effective at removing HD and VX than Decon X, but less effective at removing GD. Across all contaminants, Decon Y is 31.5 (PF) times more effective on silicone than Decon X.
Table 61 indicates that Decon Y is 68.4 times more effective than Decon X for removing HD and 3.84 times more effective for removing VX from materials. However, Decon Y is 2.3 (1/PF) times less effective at removing GD from materials than Decon X.
From an analysis of the average PF values, Decon Y is typically more effective than Decon X at removing HD and VX from materials. However, it is less effective than Decon X at removing GD. Based on the intended application, this may or may not meet the needs of the test sponsor.
The average values denote average performance and must retain the context of an average response. As illustrated in this conceptual data set, the performance may vary significantly across materials or contaminants. Based on the contamination scenario, some materials may be more likely to be contaminated because of the location of that material, or there may be more surface area of a particular material present on any given asset. If identified, these materials could be weighted for their importance in an average performance metric. Likewise, one material (e.g., a highly sorptive polymer) may be more likely to result in post-
Chemical Contaminant and Decontaminant Test Methodology Source Document, Second Edition
A-156
decontamination exposure to unprotected personnel than a “hard” (i.e., nonsorptive) material such as glass. In this case, a higher level of performance may be required on some materials than others.
Given the broad range of agent-material-decontaminant interactions it is unlikely that any single decontaminant will provide consistently high performance across all contaminants and materials. Using these factors, facilitates the identification of the ideal decontaminant for a specific task, or identifies where a decontaminant needs to improve performance through future formulation/development efforts.
Chemical Contaminant and Decontaminant Test Methodology Source Document, Second Edition
A-157
Procedure 6: Post-Treatment Evaluation for Vapor Emission
Overview
The vapor emission test characterizes the emission of contaminant, after the treatment process, to determine a contaminant emission function, which can be used to evaluate the potential risk to unprotected personnel. This procedure contains the basic steps for performing the vapor emission test, analyzing the samples, and using data to calculate results.
Performing the Vapor Emission Test
After treatment is completed, follow the steps below to conduct the vapor test.
1. Load the panel into the chamber in accordance with the chamber operating instructions.
NOTE: Vapor chambers from different manufacturers will have different operating instructions. The chamber should be operated IAW those procedures.
2. Initiate the airflow to the appropriate experimental settings, including chamber- and sampling-airflow, temperature, and humidity.
3. Record the vapor-collection start time as “time zero”.
4. Collect the tubes according to the vapor-sampling plan, ensuring that the SSV is not exceeded.
5. Extract the panels for residual contaminant as follows:
a. Place the panel in an extraction jar. For most materials, place the contaminated side face up. However, if the material being tested floats, place the sample face down so that solvent contact occurs.
b. Add 20.0 mL of extraction solvent to each jar, ensuring that each panel is completely immersed.
c. Place the PTFE/Teflon-lined lid on extraction jar.
d. Swirl the jar three times.
e. Leave the panel in the extraction solvent for 60 min.
NOTE: Other extraction times and volumes can be used based on the analytical preparation findings. The interference and solvent recovery studies must use the same extraction time.
f. Obtain the appropriate number of clean analytical vials.
g. Wait until the end of the panel extraction period then swirl the jar again. Open the vial and, using a clean pipette tip, transfer approximately 1 to 2 mL of sample into an analytical vial for analysis.
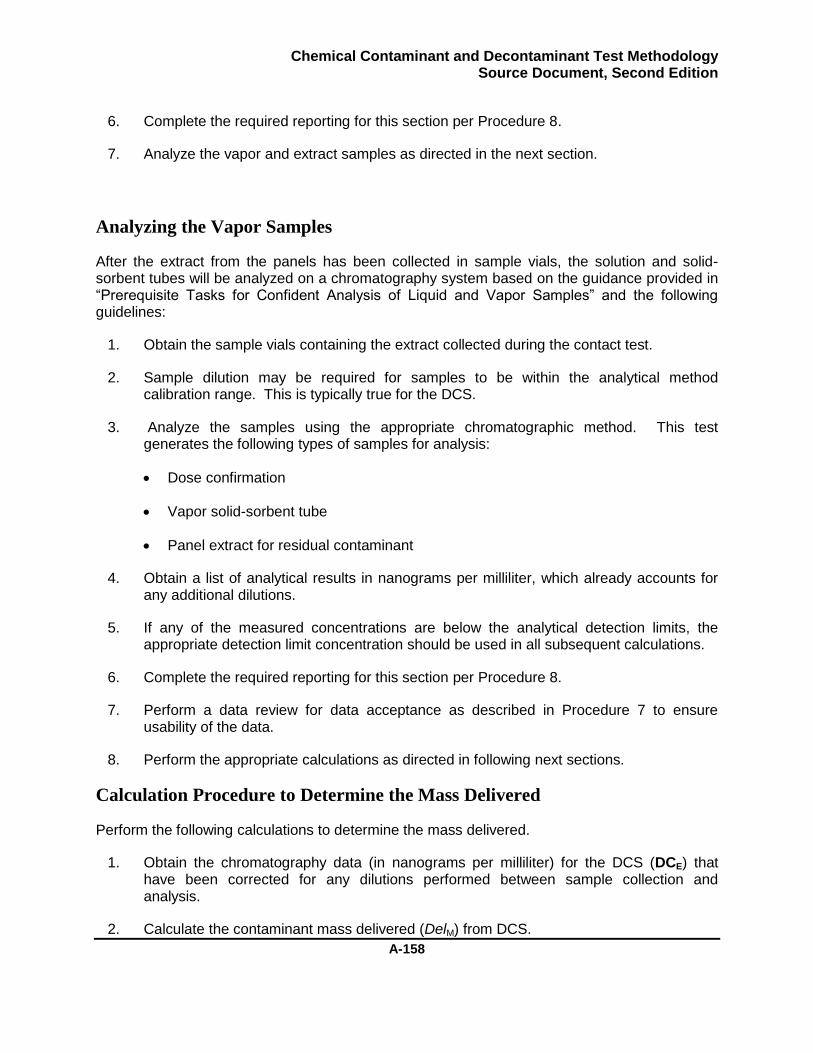
Chemical Contaminant and Decontaminant Test Methodology Source Document, Second Edition
A-158
6. Complete the required reporting for this section per Procedure 8.
7. Analyze the vapor and extract samples as directed in the next section.
Analyzing the Vapor Samples
After the extract from the panels has been collected in sample vials, the solution and solid-sorbent tubes will be analyzed on a chromatography system based on the guidance provided in “Prerequisite Tasks for Confident Analysis of Liquid and Vapor Samples” and the following guidelines:
1. Obtain the sample vials containing the extract collected during the contact test.
2. Sample dilution may be required for samples to be within the analytical method calibration range. This is typically true for the DCS.
3. Analyze the samples using the appropriate chromatographic method. This test generates the following types of samples for analysis:
Dose confirmation
Vapor solid-sorbent tube
Panel extract for residual contaminant
4. Obtain a list of analytical results in nanograms per milliliter, which already accounts for any additional dilutions.
5. If any of the measured concentrations are below the analytical detection limits, the appropriate detection limit concentration should be used in all subsequent calculations.
6. Complete the required reporting for this section per Procedure 8.
7. Perform a data review for data acceptance as described in Procedure 7 to ensure usability of the data.
8. Perform the appropriate calculations as directed in following next sections.
Calculation Procedure to Determine the Mass Delivered
Perform the following calculations to determine the mass delivered.
1. Obtain the chromatography data (in nanograms per milliliter) for the DCS (DCE) that have been corrected for any dilutions performed between sample collection and analysis.
2. Calculate the contaminant mass delivered (DelM) from DCS.
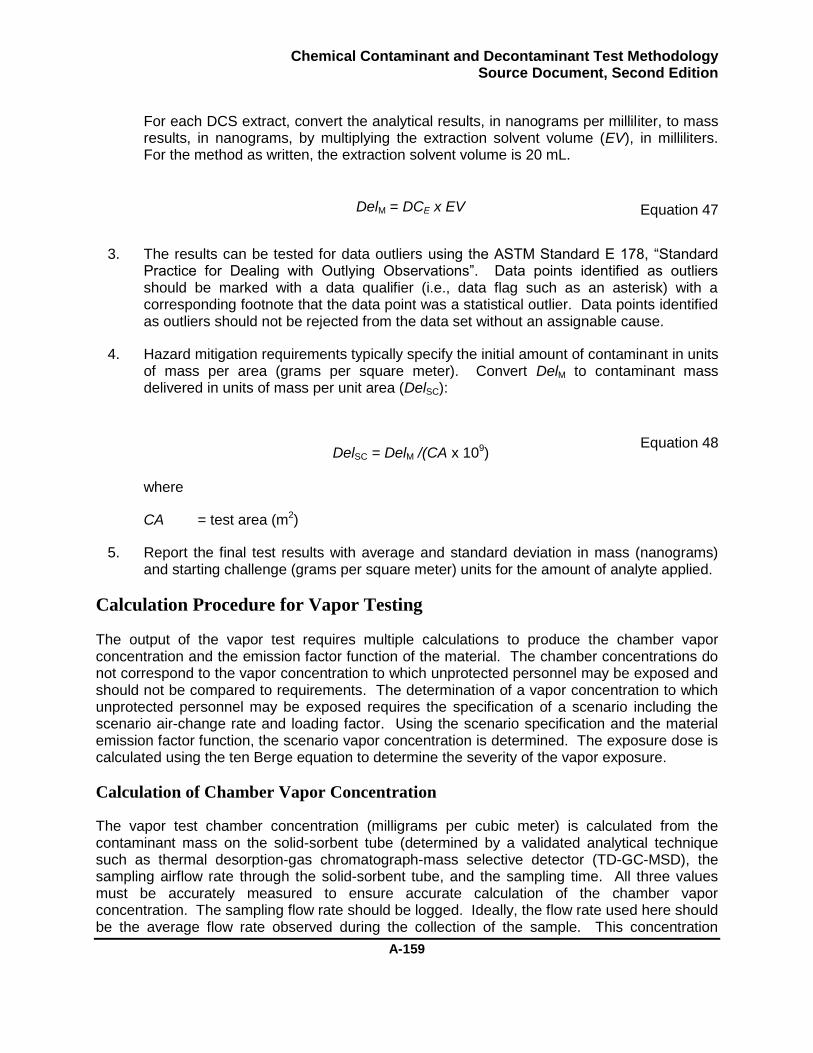
Chemical Contaminant and Decontaminant Test Methodology Source Document, Second Edition
A-159
For each DCS extract, convert the analytical results, in nanograms per milliliter, to mass results, in nanograms, by multiplying the extraction solvent volume (EV), in milliliters. For the method as written, the extraction solvent volume is 20 mL.
Equation 47
3. The results can be tested for data outliers using the ASTM Standard E 178, “Standard Practice for Dealing with Outlying Observations”. Data points identified as outliers should be marked with a data qualifier (i.e., data flag such as an asterisk) with a corresponding footnote that the data point was a statistical outlier. Data points identified as outliers should not be rejected from the data set without an assignable cause.
4. Hazard mitigation requirements typically specify the initial amount of contaminant in units of mass per area (grams per square meter). Convert DelM to contaminant mass delivered in units of mass per unit area (DelSC):
Equation 48
where
CA = test area (m2)
5. Report the final test results with average and standard deviation in mass (nanograms) and starting challenge (grams per square meter) units for the amount of analyte applied.
Calculation Procedure for Vapor Testing
The output of the vapor test requires multiple calculations to produce the chamber vapor concentration and the emission factor function of the material. The chamber concentrations do not correspond to the vapor concentration to which unprotected personnel may be exposed and should not be compared to requirements. The determination of a vapor concentration to which unprotected personnel may be exposed requires the specification of a scenario including the scenario air-change rate and loading factor. Using the scenario specification and the material emission factor function, the scenario vapor concentration is determined. The exposure dose is calculated using the ten Berge equation to determine the severity of the vapor exposure.
Calculation of Chamber Vapor Concentration
The vapor test chamber concentration (milligrams per cubic meter) is calculated from the contaminant mass on the solid-sorbent tube (determined by a validated analytical technique such as thermal desorption-gas chromatograph-mass selective detector (TD-GC-MSD), the sampling airflow rate through the solid-sorbent tube, and the sampling time. All three values must be accurately measured to ensure accurate calculation of the chamber vapor concentration. The sampling flow rate should be logged. Ideally, the flow rate used here should be the average flow rate observed during the collection of the sample. This concentration
DelM = DCE x EV
DelSC = DelM /(CA x 109)
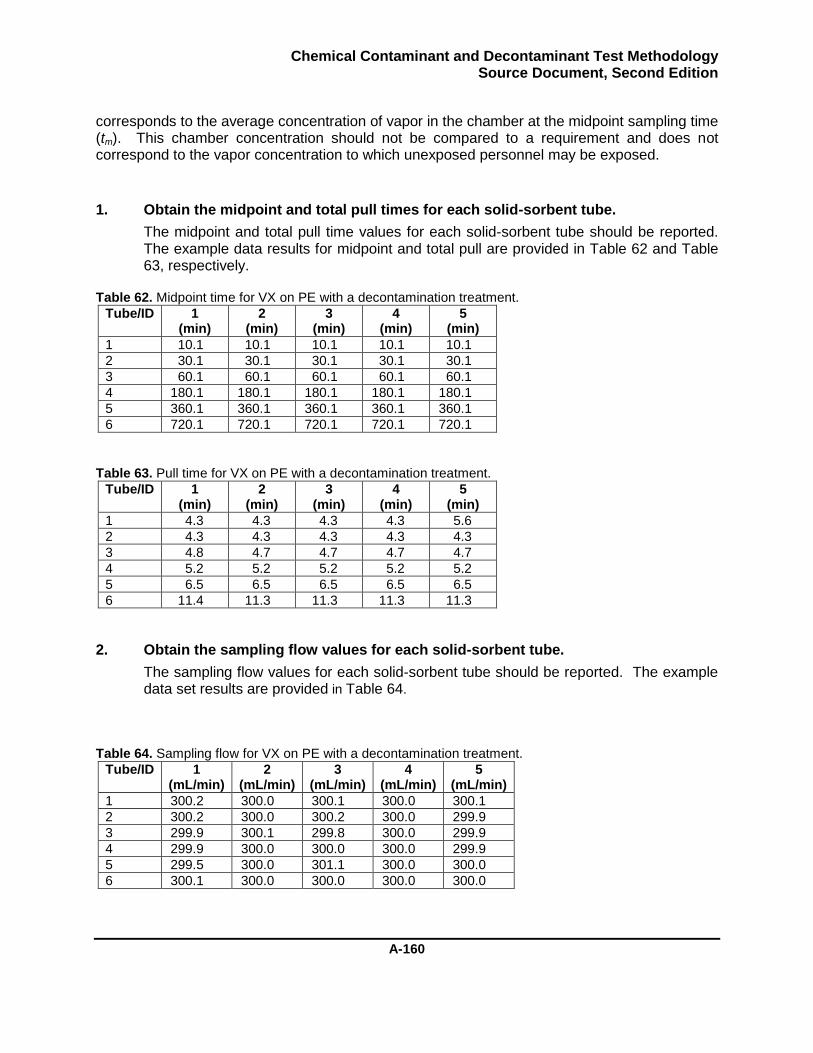
Chemical Contaminant and Decontaminant Test Methodology Source Document, Second Edition
A-160
corresponds to the average concentration of vapor in the chamber at the midpoint sampling time (tm). This chamber concentration should not be compared to a requirement and does not correspond to the vapor concentration to which unexposed personnel may be exposed.
1. Obtain the midpoint and total pull times for each solid-sorbent tube.
The midpoint and total pull time values for each solid-sorbent tube should be reported. The example data results for midpoint and total pull are provided in Table 62 and Table 63, respectively.
Table 62. Midpoint time for VX on PE with a decontamination treatment.
Tube/ID 1 (min)
2 (min)
3 (min)
4 (min)
5 (min)
1 10.1 10.1 10.1 10.1 10.1
2 30.1 30.1 30.1 30.1 30.1
3 60.1 60.1 60.1 60.1 60.1
4 180.1 180.1 180.1 180.1 180.1
5 360.1 360.1 360.1 360.1 360.1
6 720.1 720.1 720.1 720.1 720.1
Table 63. Pull time for VX on PE with a decontamination treatment.
Tube/ID 1 (min)
2 (min)
3 (min)
4 (min)
5 (min)
1 4.3 4.3 4.3 4.3 5.6
2 4.3 4.3 4.3 4.3 4.3
3 4.8 4.7 4.7 4.7 4.7
4 5.2 5.2 5.2 5.2 5.2
5 6.5 6.5 6.5 6.5 6.5
6 11.4 11.3 11.3 11.3 11.3
2. Obtain the sampling flow values for each solid-sorbent tube.
The sampling flow values for each solid-sorbent tube should be reported. The example data set results are provided in Table 64.
Table 64. Sampling flow for VX on PE with a decontamination treatment.
Tube/ID 1 (mL/min)
2 (mL/min)
3 (mL/min)
4 (mL/min)
5 (mL/min)
1 300.2 300.0 300.1 300.0 300.1
2 300.2 300.0 300.2 300.0 299.9
3 299.9 300.1 299.8 300.0 299.9
4 299.9 300.0 300.0 300.0 299.9
5 299.5 300.0 301.1 300.0 300.0
6 300.1 300.0 300.0 300.0 300.0
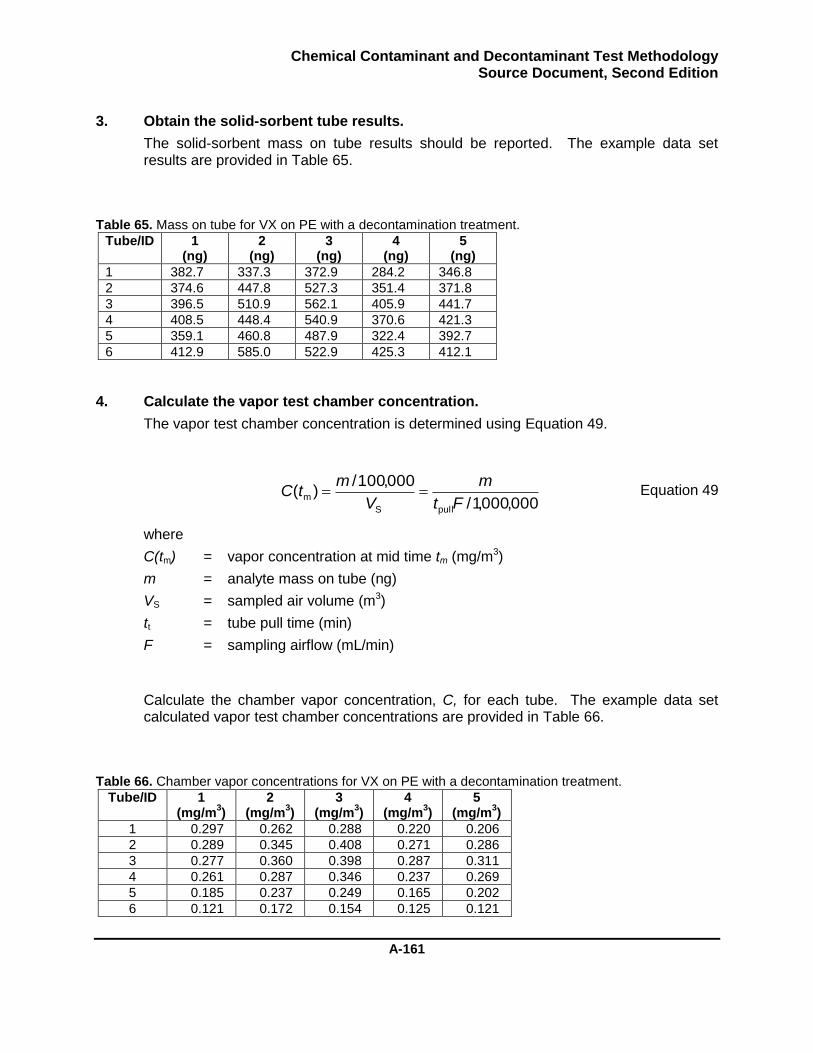
Chemical Contaminant and Decontaminant Test Methodology Source Document, Second Edition
A-161
3. Obtain the solid-sorbent tube results.
The solid-sorbent mass on tube results should be reported. The example data set results are provided in Table 65.
Table 65. Mass on tube for VX on PE with a decontamination treatment.
Tube/ID 1 (ng)
2 (ng)
3 (ng)
4 (ng)
5 (ng)
1 382.7 337.3 372.9 284.2 346.8
2 374.6 447.8 527.3 351.4 371.8
3 396.5 510.9 562.1 405.9 441.7
4 408.5 448.4 540.9 370.6 421.3
5 359.1 460.8 487.9 322.4 392.7
6 412.9 585.0 522.9 425.3 412.1
4. Calculate the vapor test chamber concentration.
The vapor test chamber concentration is determined using Equation 49.
Equation 49
where
C(tm) = vapor concentration at mid time tm (mg/m3)
m = analyte mass on tube (ng)
VS = sampled air volume (m3)
tt = tube pull time (min)
F = sampling airflow (mL/min)
Calculate the chamber vapor concentration, C, for each tube. The example data set calculated vapor test chamber concentrations are provided in Table 66.
Table 66. Chamber vapor concentrations for VX on PE with a decontamination treatment.
Tube/ID 1 (mg/m
3)
2 (mg/m
3)
3 (mg/m
3)
4 (mg/m
3)
5 (mg/m
3)
1 0.297 0.262 0.288 0.220 0.206
2 0.289 0.345 0.408 0.271 0.286
3 0.277 0.360 0.398 0.287 0.311
4 0.261 0.287 0.346 0.237 0.269
5 0.185 0.237 0.249 0.165 0.202
6 0.121 0.172 0.154 0.125 0.121
000,000,1/
000,100/)(
pullS
mFt
m
V
mtC
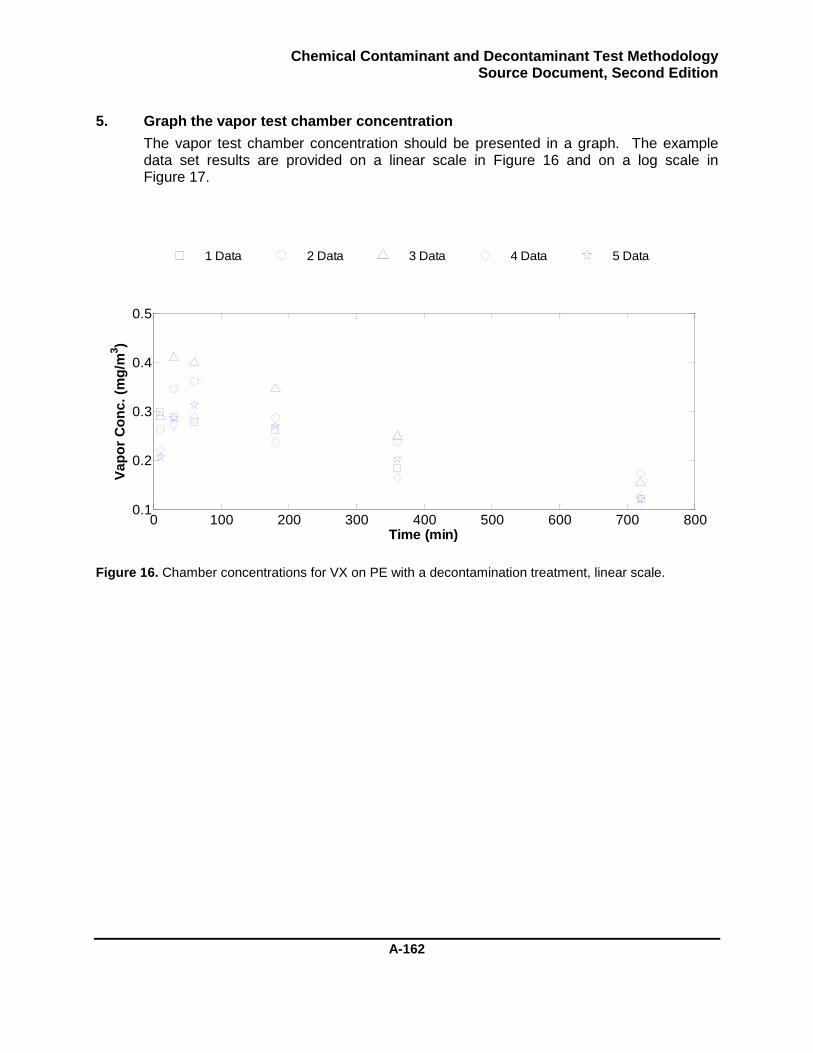
Chemical Contaminant and Decontaminant Test Methodology Source Document, Second Edition
A-162
5. Graph the vapor test chamber concentration
The vapor test chamber concentration should be presented in a graph. The example data set results are provided on a linear scale in Figure 16 and on a log scale in Figure 17.
Figure 16. Chamber concentrations for VX on PE with a decontamination treatment, linear scale.
1 Data 2 Data 3 Data 4 Data 5 Data
0 100 200 300 400 500 600 700 8000.1
0.2
0.3
0.4
0.5
Time (min)
Va
po
r C
on
c.
(mg
/m3)
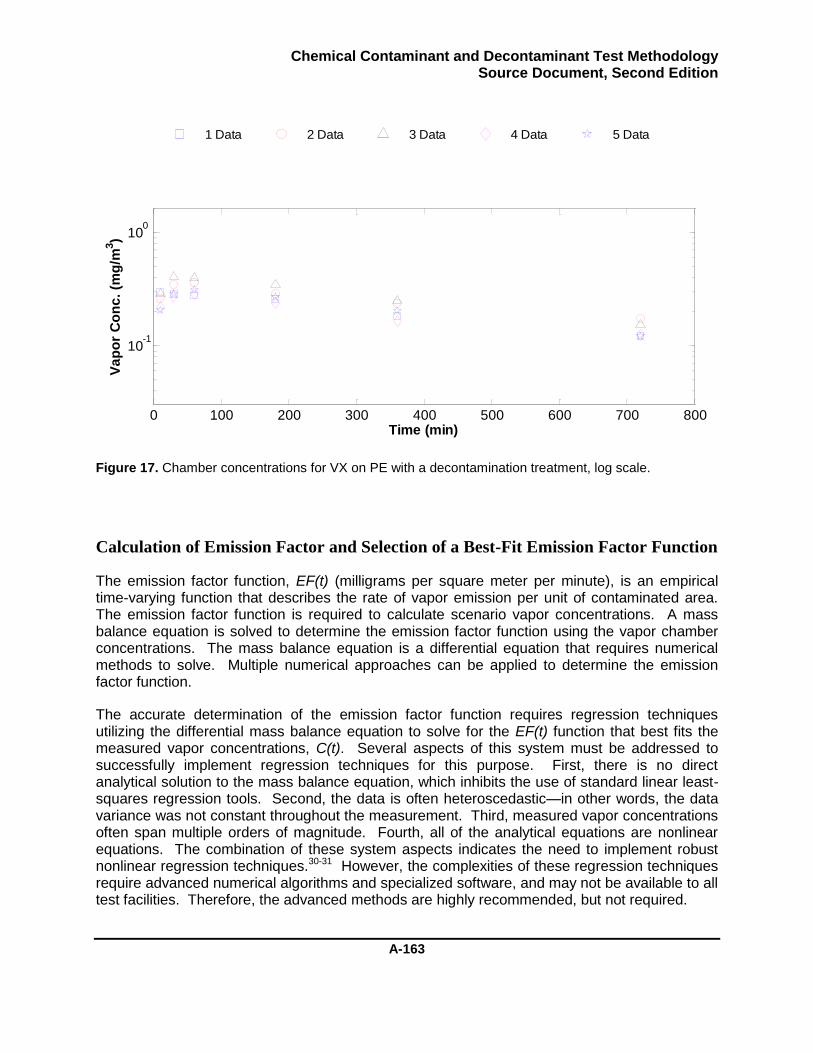
Chemical Contaminant and Decontaminant Test Methodology Source Document, Second Edition
A-163
Figure 17. Chamber concentrations for VX on PE with a decontamination treatment, log scale.
Calculation of Emission Factor and Selection of a Best-Fit Emission Factor Function
The emission factor function, EF(t) (milligrams per square meter per minute), is an empirical time-varying function that describes the rate of vapor emission per unit of contaminated area. The emission factor function is required to calculate scenario vapor concentrations. A mass balance equation is solved to determine the emission factor function using the vapor chamber concentrations. The mass balance equation is a differential equation that requires numerical methods to solve. Multiple numerical approaches can be applied to determine the emission factor function.
The accurate determination of the emission factor function requires regression techniques utilizing the differential mass balance equation to solve for the EF(t) function that best fits the measured vapor concentrations, C(t). Several aspects of this system must be addressed to successfully implement regression techniques for this purpose. First, there is no direct analytical solution to the mass balance equation, which inhibits the use of standard linear least-squares regression tools. Second, the data is often heteroscedastic—in other words, the data variance was not constant throughout the measurement. Third, measured vapor concentrations often span multiple orders of magnitude. Fourth, all of the analytical equations are nonlinear equations. The combination of these system aspects indicates the need to implement robust nonlinear regression techniques.30-31 However, the complexities of these regression techniques require advanced numerical algorithms and specialized software, and may not be available to all test facilities. Therefore, the advanced methods are highly recommended, but not required.
1 Data 2 Data 3 Data 4 Data 5 Data
0 100 200 300 400 500 600 700 800
10-1
100
Time (min)
Va
po
r C
on
c.
(mg
/m3)
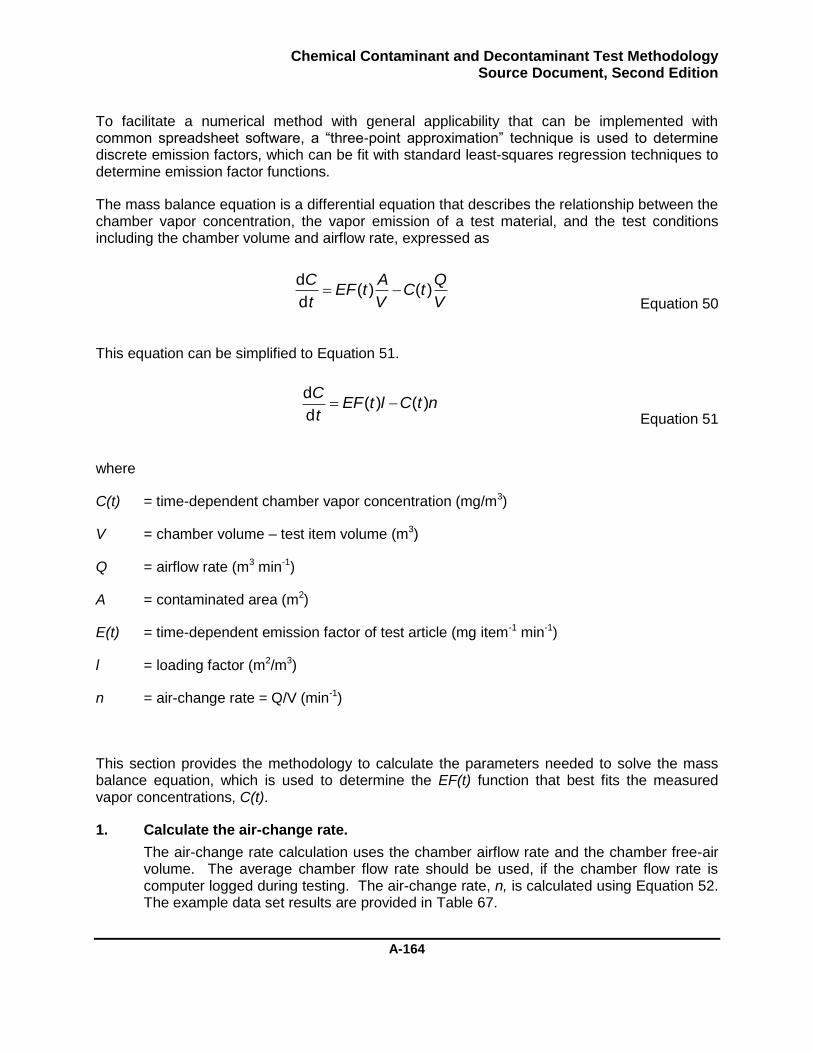
Chemical Contaminant and Decontaminant Test Methodology Source Document, Second Edition
A-164
To facilitate a numerical method with general applicability that can be implemented with common spreadsheet software, a “three-point approximation” technique is used to determine discrete emission factors, which can be fit with standard least-squares regression techniques to determine emission factor functions.
The mass balance equation is a differential equation that describes the relationship between the chamber vapor concentration, the vapor emission of a test material, and the test conditions including the chamber volume and airflow rate, expressed as
Equation 50
This equation can be simplified to Equation 51.
Equation 51
where
C(t) = time-dependent chamber vapor concentration (mg/m3)
V = chamber volume – test item volume (m3)
Q = airflow rate (m3 min-1)
A = contaminated area (m2)
E(t) = time-dependent emission factor of test article (mg item-1 min-1)
l = loading factor (m2/m3)
n = air-change rate = Q/V (min-1)
This section provides the methodology to calculate the parameters needed to solve the mass balance equation, which is used to determine the EF(t) function that best fits the measured vapor concentrations, C(t).
1. Calculate the air-change rate.
The air-change rate calculation uses the chamber airflow rate and the chamber free-air volume. The average chamber flow rate should be used, if the chamber flow rate is computer logged during testing. The air-change rate, n, is calculated using Equation 52. The example data set results are provided in Table 67.
V
QtC
V
AtEF
t
C)()(
d
d
ntCltEFt
C)()(
d
d
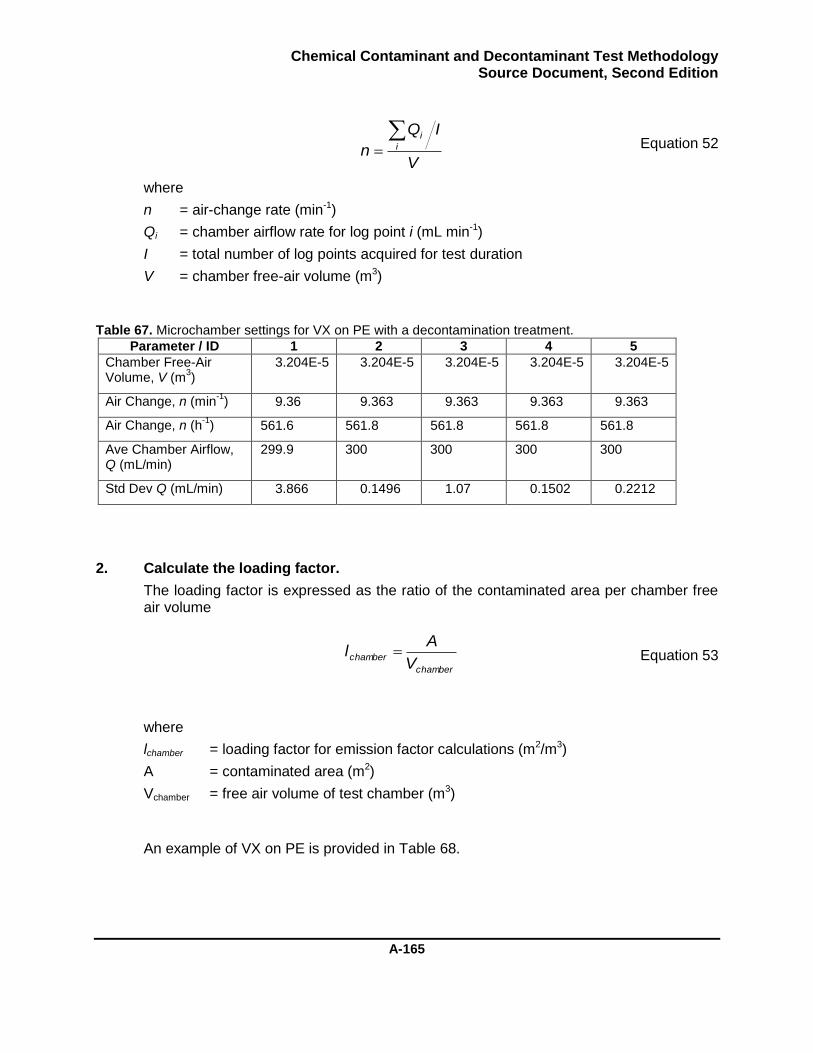
Chemical Contaminant and Decontaminant Test Methodology Source Document, Second Edition
A-165
Equation 52
where
n = air-change rate (min-1)
Qi = chamber airflow rate for log point i (mL min-1)
I = total number of log points acquired for test duration
V = chamber free-air volume (m3)
Table 67. Microchamber settings for VX on PE with a decontamination treatment.
Parameter / ID 1 2 3 4 5
Chamber Free-Air Volume, V (m
3)
3.204E-5 3.204E-5 3.204E-5 3.204E-5 3.204E-5
Air Change, n (min-1
) 9.36 9.363 9.363 9.363 9.363
Air Change, n (h-1
) 561.6 561.8 561.8 561.8 561.8
Ave Chamber Airflow, Q (mL/min)
299.9 300 300 300 300
Std Dev Q (mL/min) 3.866 0.1496 1.07 0.1502 0.2212
2. Calculate the loading factor.
The loading factor is expressed as the ratio of the contaminated area per chamber free air volume
Equation 53
where
lchamber = loading factor for emission factor calculations (m2/m3)
A = contaminated area (m2)
Vchamber = free air volume of test chamber (m3)
An example of VX on PE is provided in Table 68.
V
IQ
n i
i
chamber
chamberV
Al
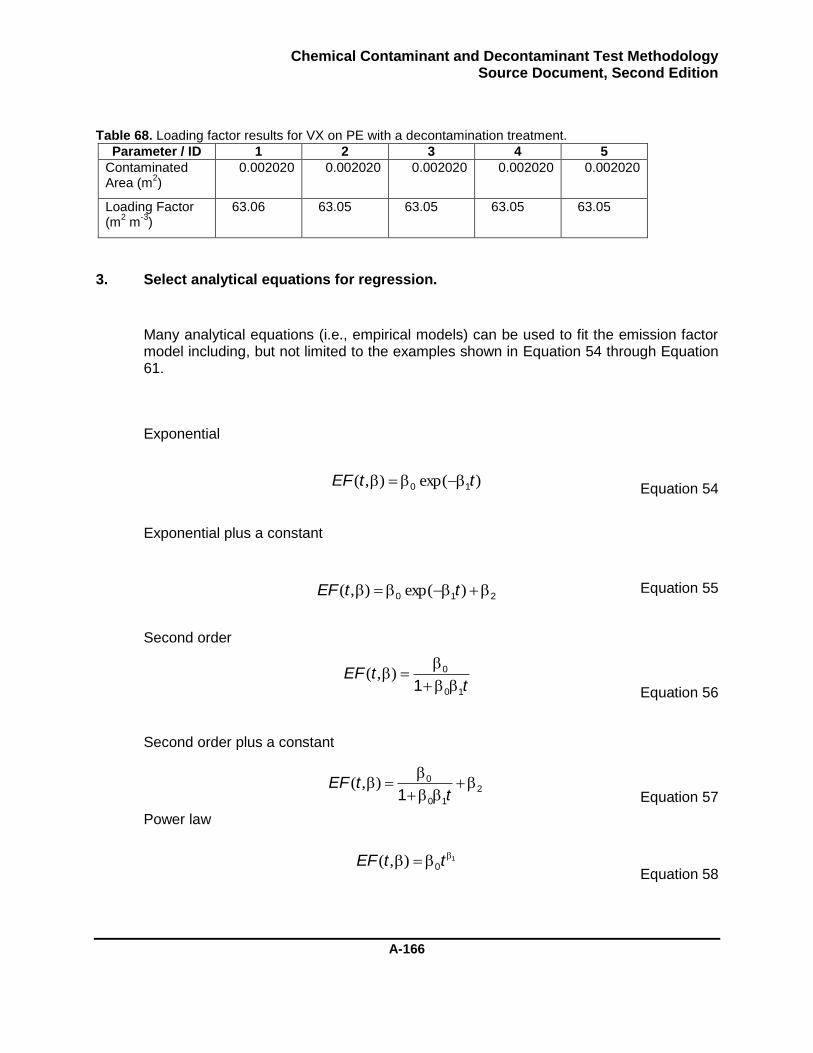
Chemical Contaminant and Decontaminant Test Methodology Source Document, Second Edition
A-166
Table 68. Loading factor results for VX on PE with a decontamination treatment.
Parameter / ID 1 2 3 4 5
Contaminated Area (m
2)
0.002020 0.002020 0.002020 0.002020 0.002020
Loading Factor (m
2 m
-3)
63.06 63.05 63.05 63.05 63.05
3. Select analytical equations for regression.
Many analytical equations (i.e., empirical models) can be used to fit the emission factor model including, but not limited to the examples shown in Equation 54 through Equation 61.
Exponential
Equation 54
Exponential plus a constant
Equation 55
Second order
Equation 56
Second order plus a constant
Equation 57
Power law
Equation 58
)exp(),( ttEF 10
210 )exp(),( ttEF
ttEF
10
0
1
),(
1
0
ttEF ),(
2
10
0
1
ttEF ),(
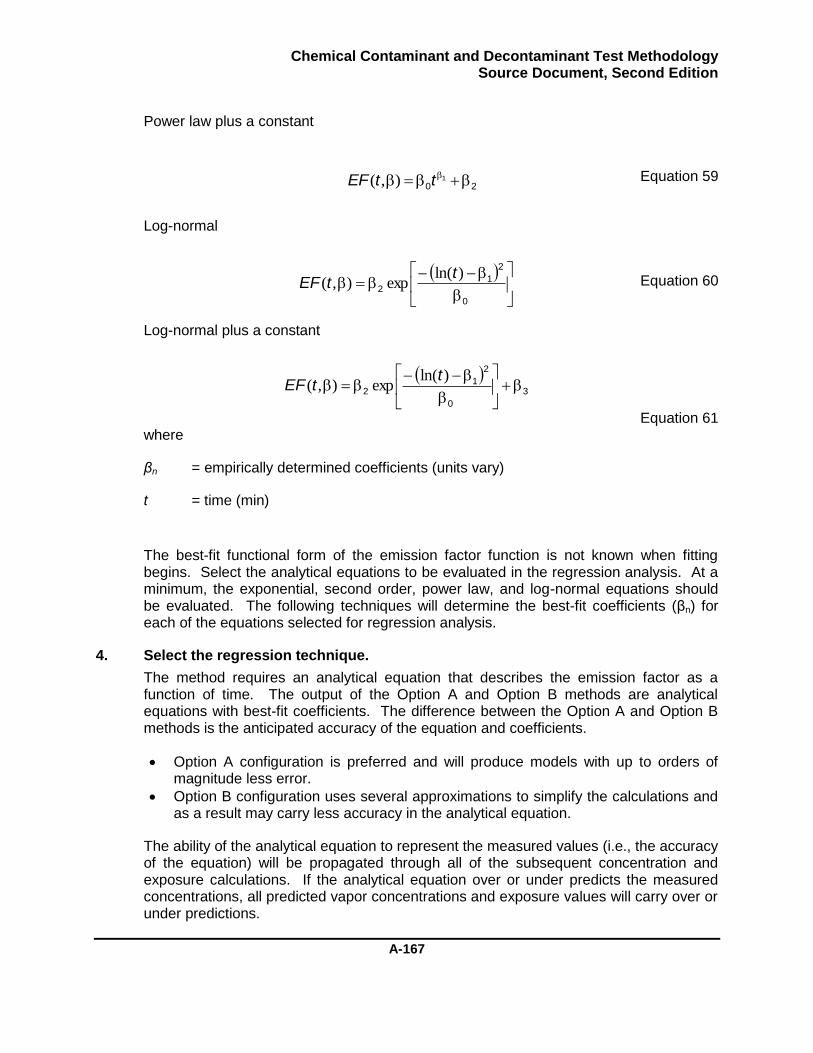
Chemical Contaminant and Decontaminant Test Methodology Source Document, Second Edition
A-167
Power law plus a constant
Equation 59
Log-normal
Equation 60
Log-normal plus a constant
Equation 61 where
βn = empirically determined coefficients (units vary)
t = time (min)
The best-fit functional form of the emission factor function is not known when fitting begins. Select the analytical equations to be evaluated in the regression analysis. At a minimum, the exponential, second order, power law, and log-normal equations should be evaluated. The following techniques will determine the best-fit coefficients (βn) for each of the equations selected for regression analysis.
4. Select the regression technique.
The method requires an analytical equation that describes the emission factor as a function of time. The output of the Option A and Option B methods are analytical equations with best-fit coefficients. The difference between the Option A and Option B methods is the anticipated accuracy of the equation and coefficients.
Option A configuration is preferred and will produce models with up to orders of magnitude less error.
Option B configuration uses several approximations to simplify the calculations and as a result may carry less accuracy in the analytical equation.
The ability of the analytical equation to represent the measured values (i.e., the accuracy of the equation) will be propagated through all of the subsequent concentration and exposure calculations. If the analytical equation over or under predicts the measured concentrations, all predicted vapor concentrations and exposure values will carry over or under predictions.
201 ttEF ),(
3
0
2
12
)ln(exp),(
ttEF
0
2
12
)ln(exp),(
ttEF
Chemical Contaminant and Decontaminant Test Methodology Source Document, Second Edition
A-168
The Option A and B methods can be performed in two configurations: individual panel replicate characterization (one emission model per panel replicate) or grouped replicate characterization (one emission model for all panel replicates of similar test conditions). There are advantages and disadvantages to each of these approaches.
The individual fitting of a model to each panel replicate is a simpler process because each model is capable of producing vapor outputs including the mass emitted as a vapor, scenario vapor concentrations, and vapor exposure values, such as toxic load. The output from each replicate produces a value that can be used for statistical comparisons. The disadvantages include the overhead in managing a model for each sample replicate and the number of degrees of freedom in the model. The degrees of freedom in a model are the number of data points used in the regression compared to the number of model coefficients. Larger degrees of freedom typically increase the confidence (and accuracy) in the coefficients determined by the regression. For individual fitting, only one panel’s worth of data is used to determine the coefficient for a model.
The group-fitting approach uses all vapor concentration measurements from all replicates for similar experimental conditions to fit one emission model. This approach significantly increases the degrees of freedom in the regression. The result is a single model that represents all of the acquired data. This single model can be used to produce vapor outputs including the mass emitted as a vapor, scenario vapor concentrations, and vapor exposure values, such as toxic load. However, the model represents the mean value of all responses. To determine the range of values that may be observed requires the characterization and propagation of uncertainty of the emission model prediction bounds, which may not be available from all regression software packages. Where individual fitting includes overhead for managing multiple models, group fitting requires management of the uncertainty with prediction bounds.
Individual fitting is less complex than grouped fitting, and can be implemented using software that does not provide confidence bound outputs. Grouped fitting offers many potential advantages over individual fitting for the accuracy and prediction capabilities, at the expense of some complexity. However, implementation of the Vapor Composite System Calculation (VCSC) methodology requires the grouped-fitting approach. The equations required to manage the error bounds of the grouped-fitting approach are provided for the Option A and Option B regression techniques.
Option A: Advanced Nonlinear Regression Technique
The accurate determination of the βn coefficients for each analytical equation requires regression techniques utilizing the differential mass balance equation to solve for the EF(t) function that best fits the measured vapor concentrations, C(t). Several aspects of this system must be addressed to successfully implement regression techniques for this purpose. First, there is no direct analytical solution to the mass balance equation, which inhibits the use of standard linear least-squares regression tools. Second, vapor data is usually heteroscedastic. Third, in some cases, the measured vapor concentrations may span multiple orders of magnitude. Fourth, all of the analytical equations are nonlinear
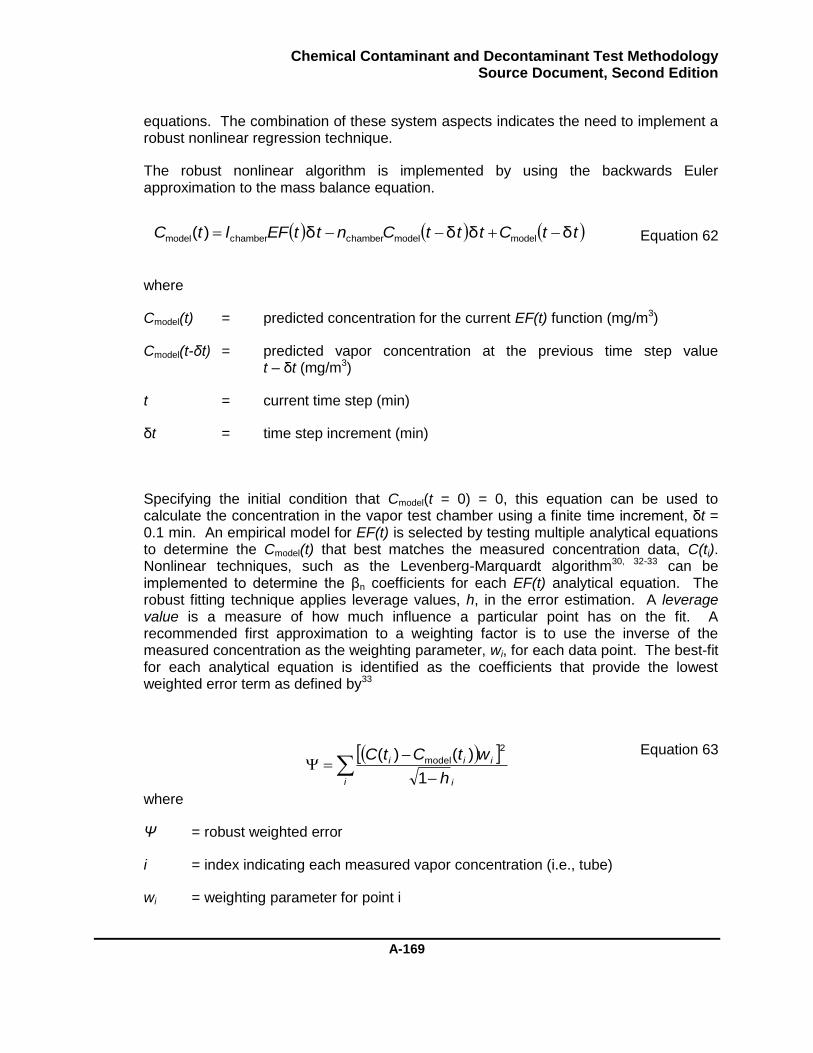
Chemical Contaminant and Decontaminant Test Methodology Source Document, Second Edition
A-169
equations. The combination of these system aspects indicates the need to implement a robust nonlinear regression technique.
The robust nonlinear algorithm is implemented by using the backwards Euler approximation to the mass balance equation.
Equation 62
where
Cmodel(t) = predicted concentration for the current EF(t) function (mg/m3)
Cmodel(t-δt) = predicted vapor concentration at the previous time step value t – δt (mg/m3)
t = current time step (min)
δt = time step increment (min)
Specifying the initial condition that Cmodel(t = 0) = 0, this equation can be used to calculate the concentration in the vapor test chamber using a finite time increment, δt = 0.1 min. An empirical model for EF(t) is selected by testing multiple analytical equations to determine the Cmodel(t) that best matches the measured concentration data, C(ti). Nonlinear techniques, such as the Levenberg-Marquardt algorithm30, 32-33 can be implemented to determine the βn coefficients for each EF(t) analytical equation. The robust fitting technique applies leverage values, h, in the error estimation. A leverage value is a measure of how much influence a particular point has on the fit. A recommended first approximation to a weighting factor is to use the inverse of the measured concentration as the weighting parameter, wi, for each data point. The best-fit for each analytical equation is identified as the coefficients that provide the lowest weighted error term as defined by33
Equation 63
where
Ψ = robust weighted error
i = index indicating each measured vapor concentration (i.e., tube)
wi = weighting parameter for point i
ttCtttCnttEFltC δδδδ)( modelmodelchamberchambermodel
i i
iii
h
wtCtC
1
)()(2
model
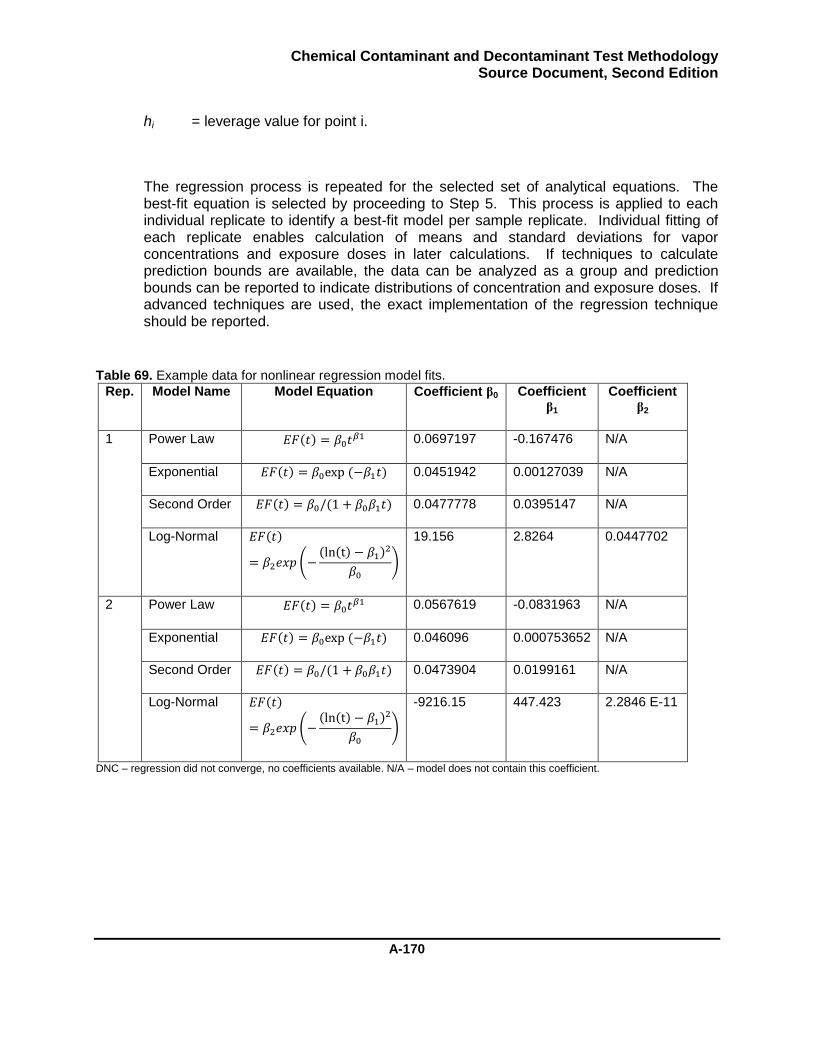
Chemical Contaminant and Decontaminant Test Methodology Source Document, Second Edition
A-170
hi = leverage value for point i.
The regression process is repeated for the selected set of analytical equations. The best-fit equation is selected by proceeding to Step 5. This process is applied to each individual replicate to identify a best-fit model per sample replicate. Individual fitting of each replicate enables calculation of means and standard deviations for vapor concentrations and exposure doses in later calculations. If techniques to calculate prediction bounds are available, the data can be analyzed as a group and prediction bounds can be reported to indicate distributions of concentration and exposure doses. If advanced techniques are used, the exact implementation of the regression technique should be reported.
Table 69. Example data for nonlinear regression model fits.
Rep. Model Name Model Equation Coefficient β0 Coefficient β1
Coefficient β2
1 Power Law 0.0697197 -0.167476 N/A
Exponential 0.0451942 0.00127039 N/A
Second Order 0.0477778 0.0395147 N/A
Log-Normal
19.156 2.8264 0.0447702
2 Power Law 0.0567619 -0.0831963 N/A
Exponential 0.046096 0.000753652 N/A
Second Order 0.0473904 0.0199161 N/A
Log-Normal
-9216.15 447.423 2.2846 E-11
DNC – regression did not converge, no coefficients available. N/A – model does not contain this coefficient.

Chemical Contaminant and Decontaminant Test Methodology Source Document, Second Edition
A-171
Table 69. Example data for nonlinear regression model fits (continued).
Rep. Model Name Model Equation Coefficient β0 Coefficient β1
Coefficient β2
3 Power Law 0.068024 -0.112246 N/A
Exponential 0.0532321 0.00101533 N/A
Second Order 0.0542012 0.0247245 N/A
Log-Normal
7.4645 3.91474 0.060897
4 Power Law 0.0547569 -0.107499 N/A
Exponential 0.03979 0.000967581 N/A
Second Order -1.1587 E+10 1.97506 N/A
Log-Normal
5.58293 4.08325 0.0438473
5 Power Law 0.0469955 -0.00115915 N/A
Exponential 0.0375561 0.000888 N/A
Second Order -9.74612 E+12
2.01974 N/A
Log-Normal
7.15734 4.02558 0.0466397
DNC – regression did not converge, no coefficients available. N/A – model does not contain this coefficient.
If the grouped fitting approach was used, the CI half-width term must be determined. The CI half-width term is based on the fitted model and the covariance matrix. Therefore, the prediction bounds do not have analytical expressions. The CI half-width is the difference between the mean value of the model and the prediction upper bound, as illustrated in Figure 18. The upper prediction bound or the half-width term should be available as an output from advanced regression software. Prediction bounds are typically available in two types including prediction interval on the mean and prediction interval on future observations. The following analysis focuses on prediction on the mean, which is equivalent to the 95% confidence bounds on the mean value.
Chemical Contaminant and Decontaminant Test Methodology Source Document, Second Edition
A-172
The analysis in the Option A approach fit the concentration data, therefore the half-width term is specific to the vapor concentration, δCmodel, type(t). The prediction bounds for the modeled vapor concentration, would then be
Equation 64
Equation 65
where
Cumodel, mean(t) = concentration upper prediction bound (mg m-3)
Clmodel, mean(t) = concentration lower prediction bound (mg m-3)
δCmodel, mean(t) = prediction bound half-width (mg m-3)
)()()( type model,modeltype model, tCtCtCu
)()()( type model,modeltypemodel, tCtCtCl
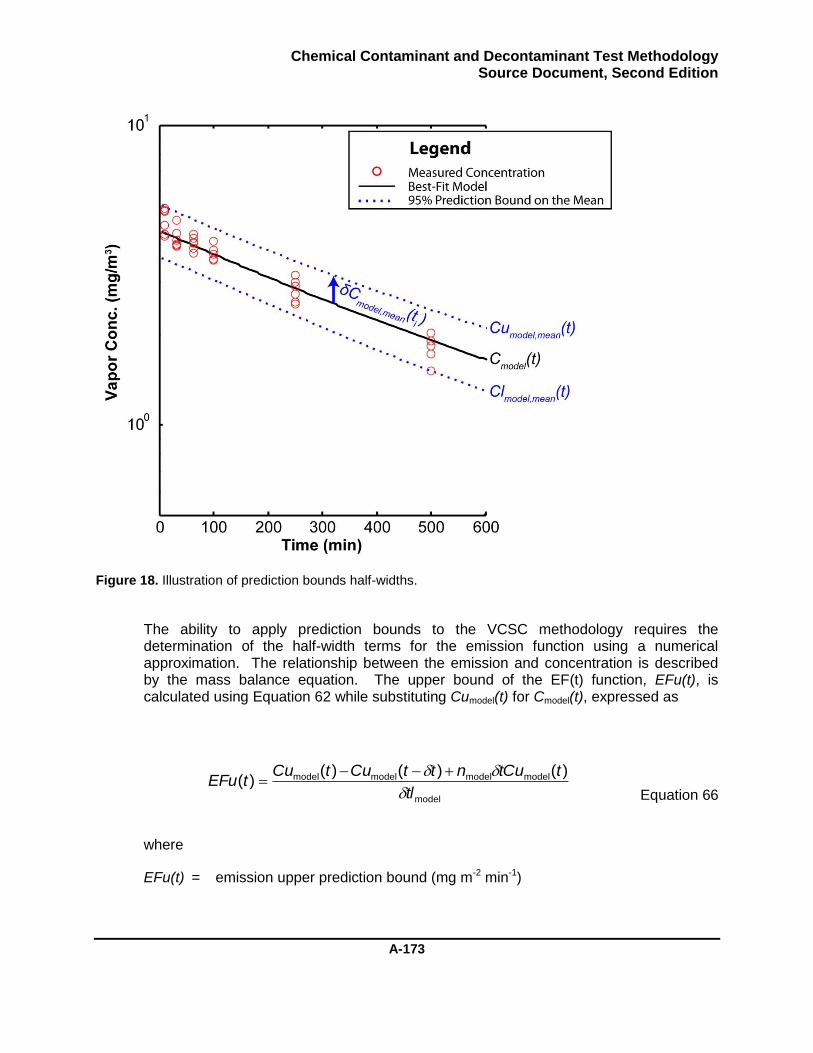
Chemical Contaminant and Decontaminant Test Methodology Source Document, Second Edition
A-173
Figure 18. Illustration of prediction bounds half-widths.
The ability to apply prediction bounds to the VCSC methodology requires the determination of the half-width terms for the emission function using a numerical approximation. The relationship between the emission and concentration is described by the mass balance equation. The upper bound of the EF(t) function, EFu(t), is calculated using Equation 62 while substituting Cumodel(t) for Cmodel(t), expressed as
Equation 66
where
EFu(t) = emission upper prediction bound (mg m-2 min-1)
model
modelmodelmodelmodel )()()()(
tl
ttCunttCutCutEFu
Chemical Contaminant and Decontaminant Test Methodology Source Document, Second Edition
A-174
The half-width of the emission function is calculated as
Equation 67
where
δEF(t) = CI half-width for the emission factor (mg m-2 min-1)
The half-width of the emission function is required to perform the uncertainty calculations in the VCSC method. The measured data is often heteroscedastic. The variance in the measured values is proportional to the magnitude of the measurement. Further, the measurement of vapor concentration presents a left-censored data domain. The concentration must be a positive number because negative vapor concentration is not physically realistic. A common mathematical technique to deal with these types of data is to use a log transformation.29, 34-37 Therefore, the lower bound of the emission factor is calculated as
Equation 68
where
EFl(t) = emission lower prediction bound (mg m-2 min-1)
Option B: Three-Point Approximation Technique
B.1 Three-Point Approximation to Determine Emission Factor
The emission factor is calculated using a three-point approximation technique similar to that used in other industrial standard test methods.9 This technique calculates the dC/dt term of the mass balance equation using three of the vapor concentration measurements to calculate one emission factor value as specified in Equation 69 and Equation 70.
Equation 69
l
nCt
C
tEm
m
m
m
)(
)()()( tEFtEFutEF
)(
)(1ln)(lnexp)(
tEF
tEFtEFtEFl

Chemical Contaminant and Decontaminant Test Methodology Source Document, Second Edition
A-175
Equation 70
where
E(tm) = the emission rate at time tm (mg m-2 min-1)
Cm = the vapor concentration at tm (mg m-3)
tm = midpoint tube pull time for concentration measurement (min)
This calculation is performed for each of the vapor concentration measurements to produce x-2 emission factor values, where x is the number of vapor concentration measurements acquired. This is one of the reasons that no less than six vapor concentration measurements should be acquired during testing.
The three-point approximation is required to enable the use of standard least-squares fitting techniques, but does include several limitations that must be recognized. The calculation of ΔC/Δt for time tm references time tm-1 and tm+1. Therefore, an emission rate cannot be calculated for the first or for the last concentration measurements. If x chamber vapor concentrations are collected, only x-2 emission rates can be calculated. The three-point approximation for the ΔC/Δt term involves a linear approximation to the dC/dt slope, which is often a nonlinear function. Lastly, the error in any measurement (mass on tube, midpoint time, or pull time) can accumulate in the ΔC/Δt calculation, amplifying the noise and potentially influencing the emission factor values.
Report the emission factor, EF(t), (milligrams per square meter per minute) and the time for which the emission factor was calculated, tm (minutes). The calculated emission factor, vapor concentration, and midpoint sample times shown in Table 70 should be included as a report appendix to enable re-evaluation of the data if needed.
Table 70. Numerical emission factor (mg m-2
min-1
) for VX on PE with a decontamination treatment.
Tube/ID 1 2 3 4 5
1–3 0.04283 0.05123 0.06062 0.04033 0.04255
2–4 0.04117 0.05344 0.05905 0.04262 0.04622
3–5 0.03877 0.04256 0.05133 0.03517 0.04000
4–6 0.02746 0.03514 0.03693 0.02450 0.02998
21
1
1
1
mm
mm
mm
mm
m
m tt
CC
tt
CC
t
C
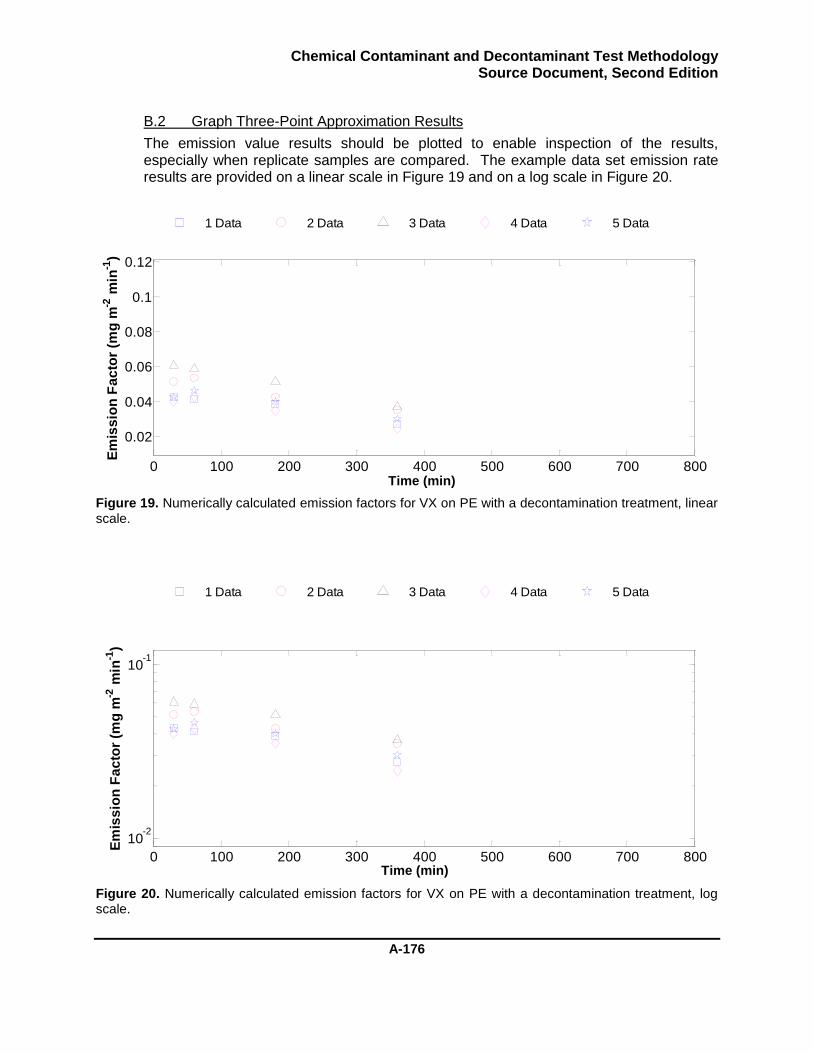
Chemical Contaminant and Decontaminant Test Methodology Source Document, Second Edition
A-176
B.2 Graph Three-Point Approximation Results
The emission value results should be plotted to enable inspection of the results, especially when replicate samples are compared. The example data set emission rate results are provided on a linear scale in Figure 19 and on a log scale in Figure 20.
Figure 19. Numerically calculated emission factors for VX on PE with a decontamination treatment, linear scale.
Figure 20. Numerically calculated emission factors for VX on PE with a decontamination treatment, log scale.
0 100 200 300 400 500 600 700 800
0.02
0.04
0.06
0.08
0.1
0.12
Time (min.)
Em
iss
ion
Fa
cto
r (m
g m
-2 m
in-1
)
0 100 200 300 400 500 600 700 800
10-2
10-1
Time (min.)
Em
iss
ion
Fa
cto
r (m
g m
-2 m
in-1
)
1 Data 2 Data 3 Data 4 Data 5 Data
1 Data 2 Data 3 Data 4 Data 5 Data
Time (min)
Time (min)
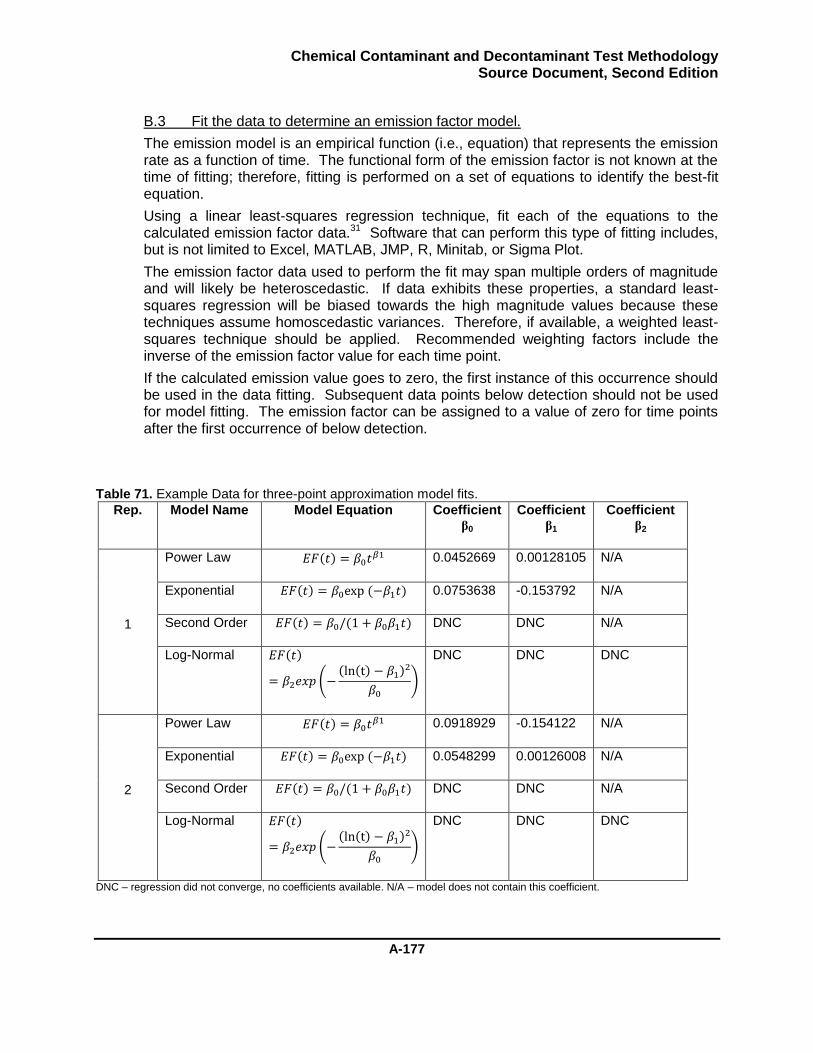
Chemical Contaminant and Decontaminant Test Methodology Source Document, Second Edition
A-177
B.3 Fit the data to determine an emission factor model.
The emission model is an empirical function (i.e., equation) that represents the emission rate as a function of time. The functional form of the emission factor is not known at the time of fitting; therefore, fitting is performed on a set of equations to identify the best-fit equation.
Using a linear least-squares regression technique, fit each of the equations to the calculated emission factor data.31 Software that can perform this type of fitting includes, but is not limited to Excel, MATLAB, JMP, R, Minitab, or Sigma Plot.
The emission factor data used to perform the fit may span multiple orders of magnitude and will likely be heteroscedastic. If data exhibits these properties, a standard least-squares regression will be biased towards the high magnitude values because these techniques assume homoscedastic variances. Therefore, if available, a weighted least-squares technique should be applied. Recommended weighting factors include the inverse of the emission factor value for each time point.
If the calculated emission value goes to zero, the first instance of this occurrence should be used in the data fitting. Subsequent data points below detection should not be used for model fitting. The emission factor can be assigned to a value of zero for time points after the first occurrence of below detection.
Table 71. Example Data for three-point approximation model fits.
Rep. Model Name Model Equation Coefficient β0
Coefficient β1
Coefficient β2
1
Power Law 0.0452669 0.00128105 N/A
Exponential 0.0753638 -0.153792 N/A
Second Order DNC DNC N/A
Log-Normal
DNC DNC DNC
2
Power Law 0.0918929 -0.154122 N/A
Exponential 0.0548299 0.00126008 N/A
Second Order DNC DNC N/A
Log-Normal
DNC DNC DNC
DNC – regression did not converge, no coefficients available. N/A – model does not contain this coefficient.

Chemical Contaminant and Decontaminant Test Methodology Source Document, Second Edition
A-178
Table 71. Example Data for three-point approximation model fits (continued).
Rep. Model Name Model Equation Coefficient β0
Coefficient β1
Coefficient β2
3
Power Law 0.117825 -0.180658 N/A
Exponential 0.0645018 0.00148579 N/A
Second Order DNC DNC N/A
Log-Normal
DNC DNC DNC
4
Power Law 0.0821138 -0.185265 N/A
Exponential 0.0447493 0.00158385 N/A
Second Order DNC DNC N/A
Log-Normal
DNC DNC DNC
5
Power Law 0.0720609 -0.131967 N/A
Exponential 0.0469955 0.00115915 N/A
Second Order DNC DNC N/A
Log-Normal
DNC DNC DNC
DNC – regression did not converge, no coefficients available. N/A – model does not contain this coefficient.
If the grouped fitting approach was used, the CI half-width term must be determined. The CI half-width term is based on the fitted model and the covariance matrix. Therefore, the prediction bounds do not have analytical expressions. The analysis in the Option B approach fits the calculated emission factor data; therefore, the half-width term output by the regression software is specific to each emission factor, δEF (t). The lower bound of the emission rate can be calculated using Equation 68.
5. Determine the best-fit emission factor model.
The best-fit emission factor model produces a calculated concentration that best represents the measured vapor concentration data. The following calculations apply to the analytical equations determined by either the Option A or B regression techniques.
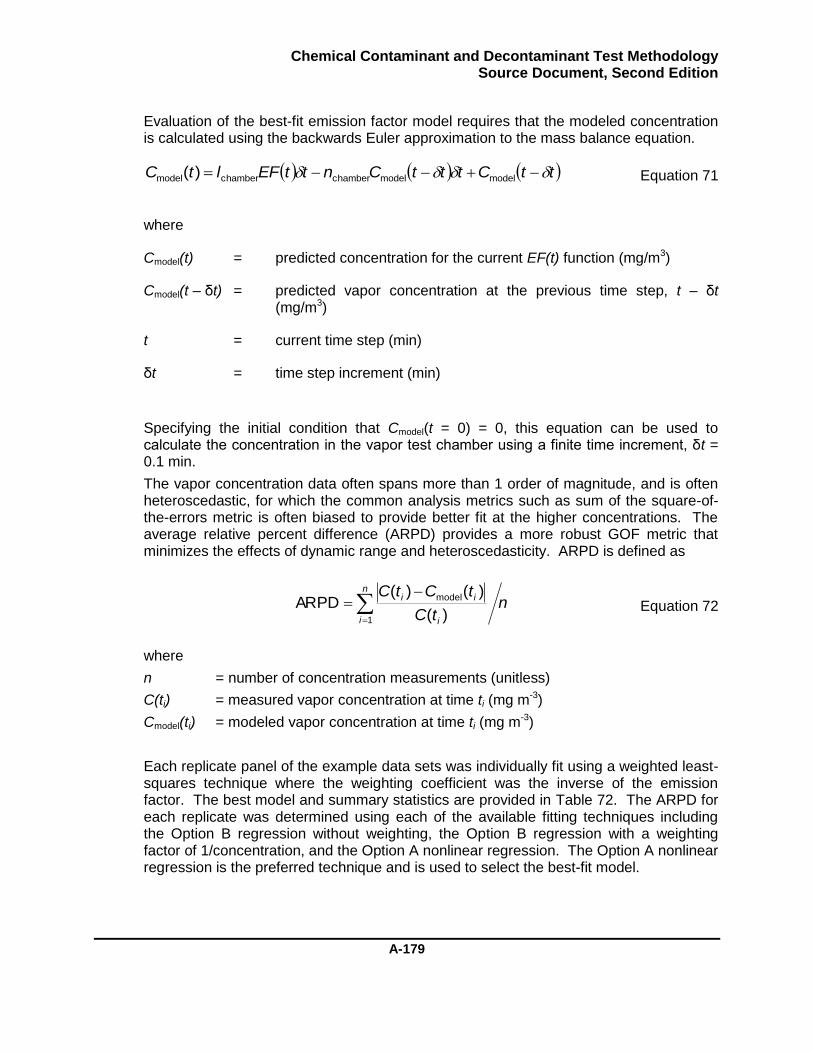
Chemical Contaminant and Decontaminant Test Methodology Source Document, Second Edition
A-179
Evaluation of the best-fit emission factor model requires that the modeled concentration is calculated using the backwards Euler approximation to the mass balance equation.
Equation 71
where
Cmodel(t) = predicted concentration for the current EF(t) function (mg/m3)
Cmodel(t – δt) = predicted vapor concentration at the previous time step, t – δt (mg/m3)
t = current time step (min)
δt = time step increment (min)
Specifying the initial condition that Cmodel(t = 0) = 0, this equation can be used to calculate the concentration in the vapor test chamber using a finite time increment, δt = 0.1 min.
The vapor concentration data often spans more than 1 order of magnitude, and is often heteroscedastic, for which the common analysis metrics such as sum of the square-of-the-errors metric is often biased to provide better fit at the higher concentrations. The average relative percent difference (ARPD) provides a more robust GOF metric that minimizes the effects of dynamic range and heteroscedasticity. ARPD is defined as
Equation 72
where
n = number of concentration measurements (unitless)
C(ti) = measured vapor concentration at time ti (mg m-3)
Cmodel(ti) = modeled vapor concentration at time ti (mg m-3)
Each replicate panel of the example data sets was individually fit using a weighted least-squares technique where the weighting coefficient was the inverse of the emission factor. The best model and summary statistics are provided in Table 72. The ARPD for each replicate was determined using each of the available fitting techniques including the Option B regression without weighting, the Option B regression with a weighting factor of 1/concentration, and the Option A nonlinear regression. The Option A nonlinear regression is the preferred technique and is used to select the best-fit model.
ntC
tCtCn
i i
ii
1
model
)(
)()(ARPD
ttCtttCnttEFltC modelmodelchamberchambermodel )(
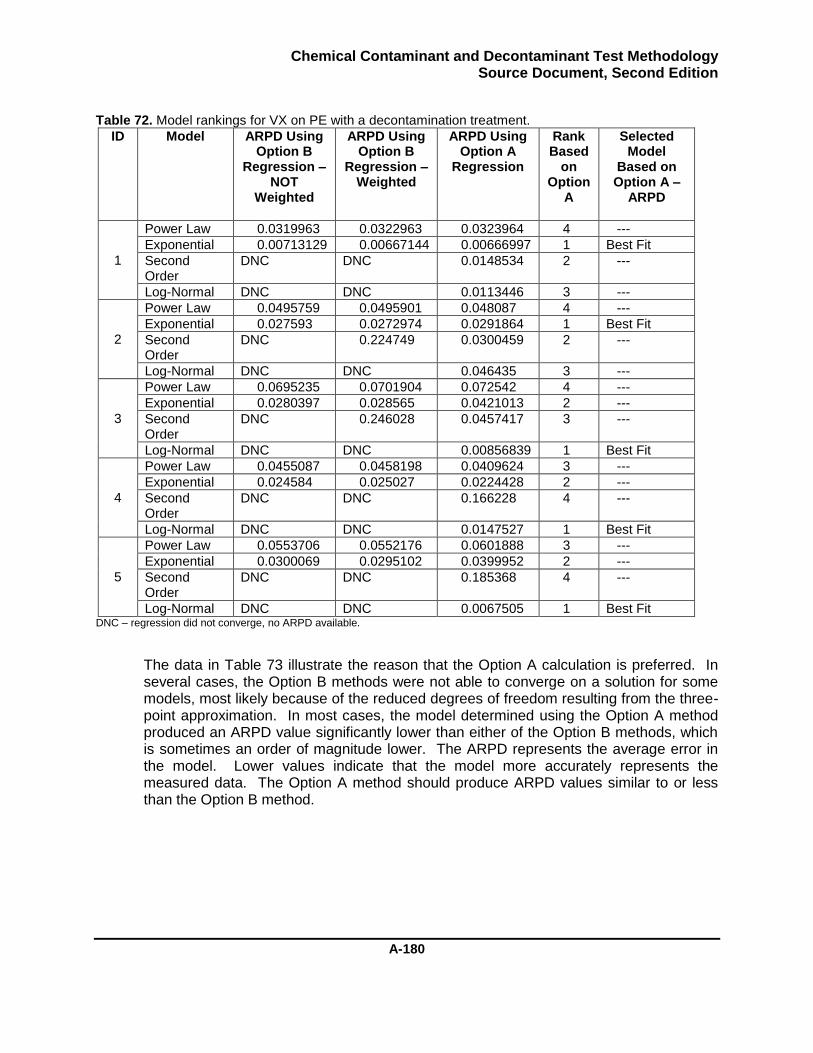
Chemical Contaminant and Decontaminant Test Methodology Source Document, Second Edition
A-180
Table 72. Model rankings for VX on PE with a decontamination treatment.
ID
Model
ARPD Using Option B
Regression – NOT
Weighted
ARPD Using Option B
Regression – Weighted
ARPD Using Option A
Regression
Rank Based
on Option
A
Selected Model
Based on Option A –
ARPD
1
Power Law 0.0319963 0.0322963 0.0323964 4 ---
Exponential 0.00713129 0.00667144 0.00666997 1 Best Fit
Second Order
DNC DNC 0.0148534 2 ---
Log-Normal DNC DNC 0.0113446 3 ---
2
Power Law 0.0495759 0.0495901 0.048087 4 ---
Exponential 0.027593 0.0272974 0.0291864 1 Best Fit
Second Order
DNC 0.224749 0.0300459 2 ---
Log-Normal DNC DNC 0.046435 3 ---
3
Power Law 0.0695235 0.0701904 0.072542 4 ---
Exponential 0.0280397 0.028565 0.0421013 2 ---
Second Order
DNC 0.246028 0.0457417 3 ---
Log-Normal DNC DNC 0.00856839 1 Best Fit
4
Power Law 0.0455087 0.0458198 0.0409624 3 ---
Exponential 0.024584 0.025027 0.0224428 2 ---
Second Order
DNC DNC 0.166228 4 ---
Log-Normal DNC DNC 0.0147527 1 Best Fit
5
Power Law 0.0553706 0.0552176 0.0601888 3 ---
Exponential 0.0300069 0.0295102 0.0399952 2 ---
Second Order
DNC DNC 0.185368 4 ---
Log-Normal DNC DNC 0.0067505 1 Best Fit DNC – regression did not converge, no ARPD available.
The data in Table 73 illustrate the reason that the Option A calculation is preferred. In several cases, the Option B methods were not able to converge on a solution for some models, most likely because of the reduced degrees of freedom resulting from the three-point approximation. In most cases, the model determined using the Option A method produced an ARPD value significantly lower than either of the Option B methods, which is sometimes an order of magnitude lower. The ARPD represents the average error in the model. Lower values indicate that the model more accurately represents the measured data. The Option A method should produce ARPD values similar to or less than the Option B method.
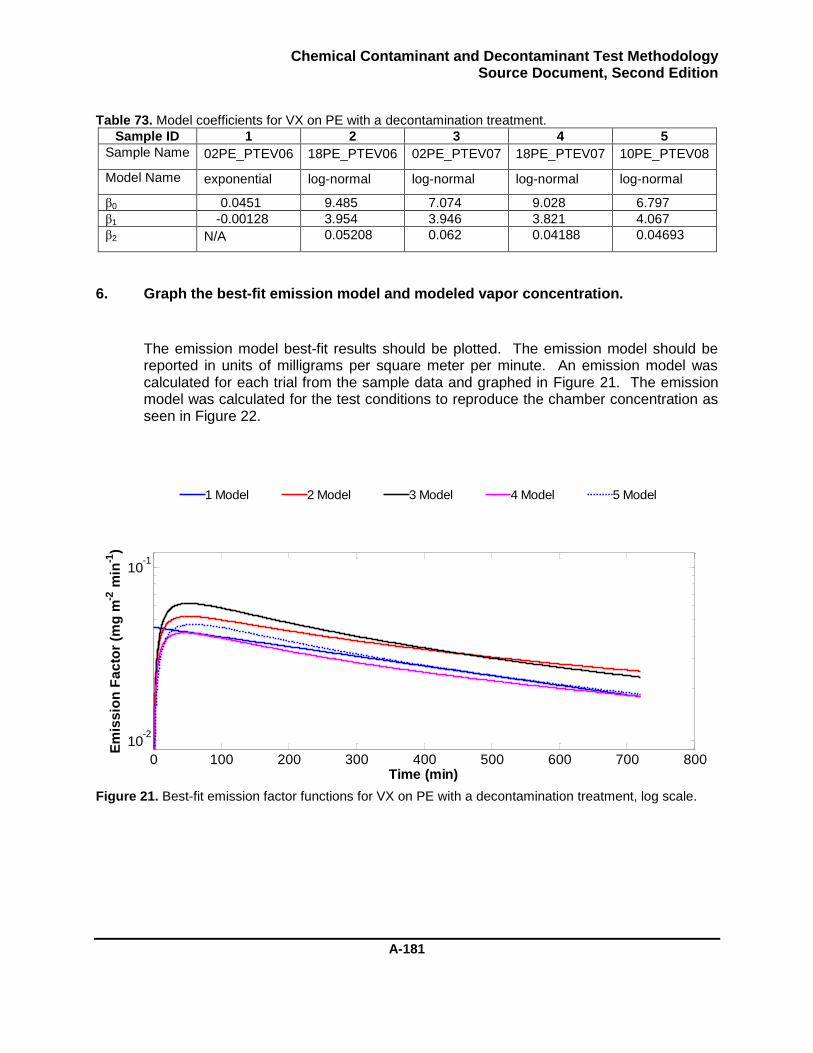
Chemical Contaminant and Decontaminant Test Methodology Source Document, Second Edition
A-181
Table 73. Model coefficients for VX on PE with a decontamination treatment.
Sample ID 1 2 3 4 5
Sample Name 02PE_PTEV06 18PE_PTEV06 02PE_PTEV07 18PE_PTEV07 10PE_PTEV08
Model Name exponential log-normal log-normal log-normal log-normal
β0 0.0451 9.485 7.074 9.028 6.797
β1 -0.00128 3.954 3.946 3.821 4.067
β2 N/A 0.05208 0.062 0.04188 0.04693
6. Graph the best-fit emission model and modeled vapor concentration.
The emission model best-fit results should be plotted. The emission model should be reported in units of milligrams per square meter per minute. An emission model was calculated for each trial from the sample data and graphed in Figure 21. The emission model was calculated for the test conditions to reproduce the chamber concentration as seen in Figure 22.
Figure 21. Best-fit emission factor functions for VX on PE with a decontamination treatment, log scale.
1 Model 2 Model 3 Model 4 Model 5 Model
0 100 200 300 400 500 600 700 800
10-2
10-1
Time (min)
Em
iss
ion
Fa
cto
r (m
g m
-2 m
in-1
)
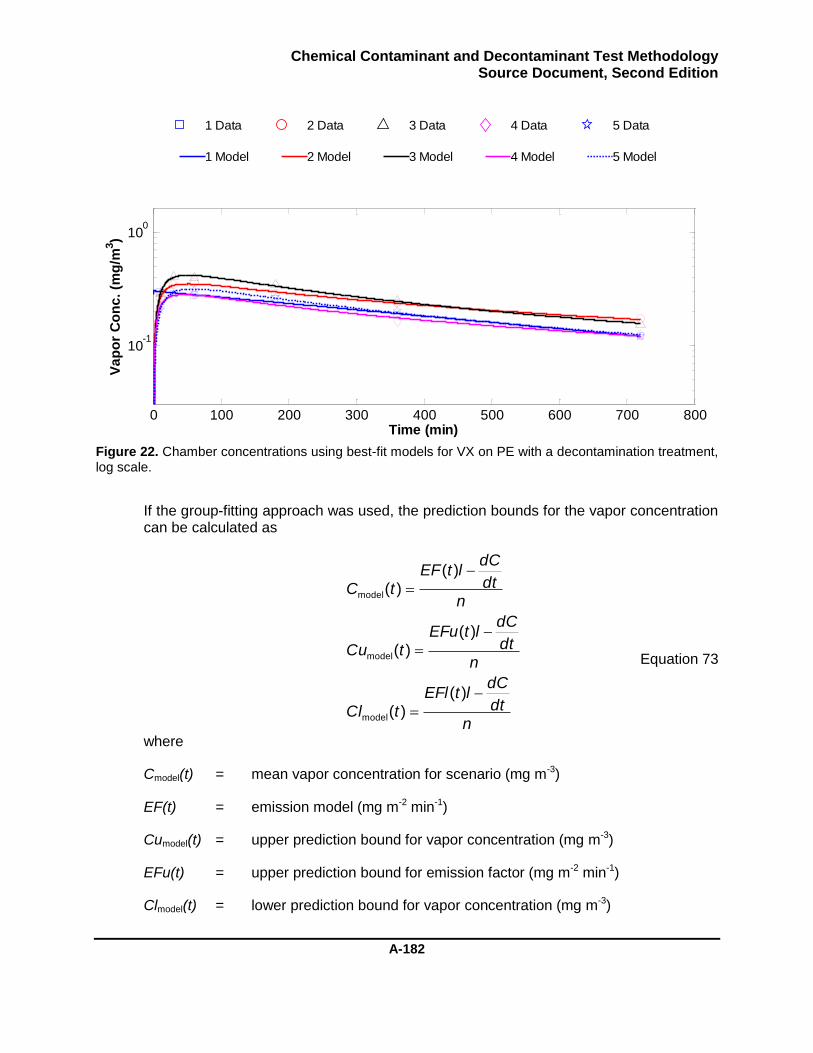
Chemical Contaminant and Decontaminant Test Methodology Source Document, Second Edition
A-182
Figure 22. Chamber concentrations using best-fit models for VX on PE with a decontamination treatment, log scale.
If the group-fitting approach was used, the prediction bounds for the vapor concentration can be calculated as
Equation 73
where
Cmodel(t) = mean vapor concentration for scenario (mg m-3)
EF(t) = emission model (mg m-2 min-1)
Cumodel(t) = upper prediction bound for vapor concentration (mg m-3)
EFu(t) = upper prediction bound for emission factor (mg m-2 min-1)
Clmodel(t) = lower prediction bound for vapor concentration (mg m-3)
1 Data 2 Data 3 Data 4 Data 5 Data
1 Model 2 Model 3 Model 4 Model 5 Model
0 100 200 300 400 500 600 700 800
10-1
100
Time (min)
Va
po
r C
on
c.
(mg
/m3)
ndt
dCltEFl
tCl
ndt
dCltEFu
tCu
ndt
dCltEF
tC
)()(
)()(
)()(
model
model
model
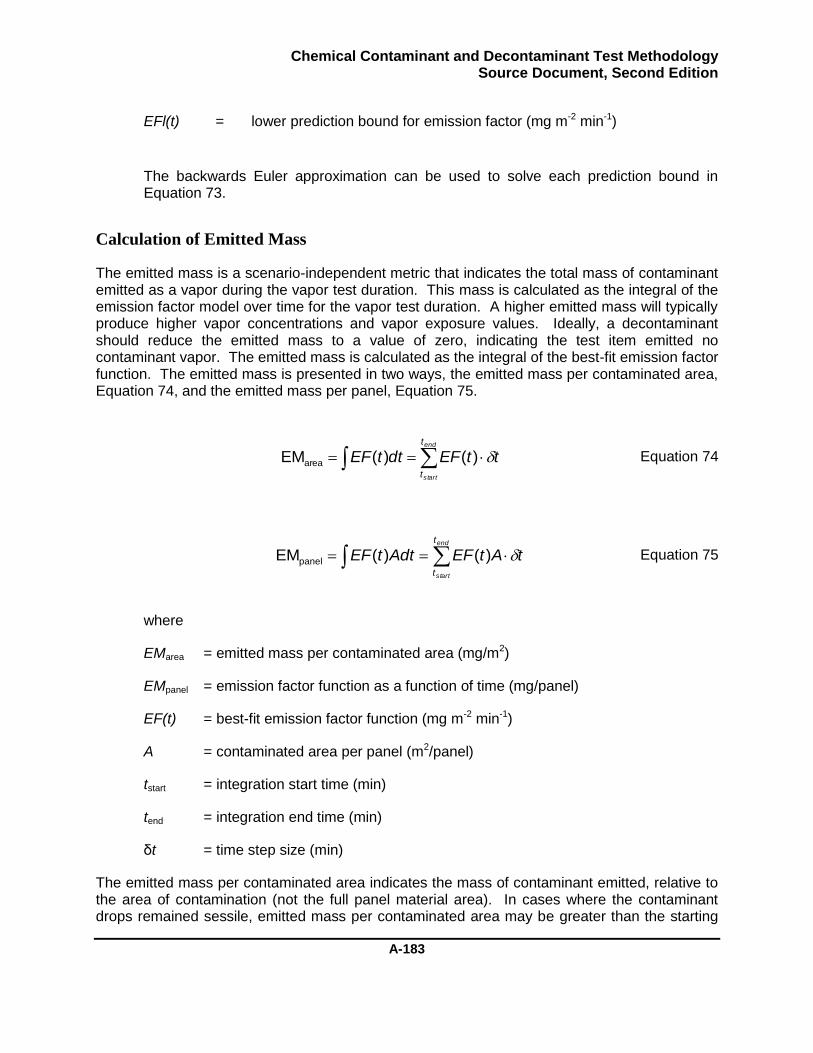
Chemical Contaminant and Decontaminant Test Methodology Source Document, Second Edition
A-183
EFl(t) = lower prediction bound for emission factor (mg m-2 min-1)
The backwards Euler approximation can be used to solve each prediction bound in Equation 73.
Calculation of Emitted Mass
The emitted mass is a scenario-independent metric that indicates the total mass of contaminant emitted as a vapor during the vapor test duration. This mass is calculated as the integral of the emission factor model over time for the vapor test duration. A higher emitted mass will typically produce higher vapor concentrations and vapor exposure values. Ideally, a decontaminant should reduce the emitted mass to a value of zero, indicating the test item emitted no contaminant vapor. The emitted mass is calculated as the integral of the best-fit emission factor function. The emitted mass is presented in two ways, the emitted mass per contaminated area, Equation 74, and the emitted mass per panel, Equation 75.
Equation 74
Equation 75
where
EMarea = emitted mass per contaminated area (mg/m2)
EMpanel = emission factor function as a function of time (mg/panel)
EF(t) = best-fit emission factor function (mg m-2 min-1)
A = contaminated area per panel (m2/panel)
tstart = integration start time (min)
tend = integration end time (min)
δt = time step size (min)
The emitted mass per contaminated area indicates the mass of contaminant emitted, relative to the area of contamination (not the full panel material area). In cases where the contaminant drops remained sessile, emitted mass per contaminated area may be greater than the starting
end
start
t
t
ttEFdttEF )()(EMarea
end
start
t
t
tAtEFAdttEF )()(EMpanel
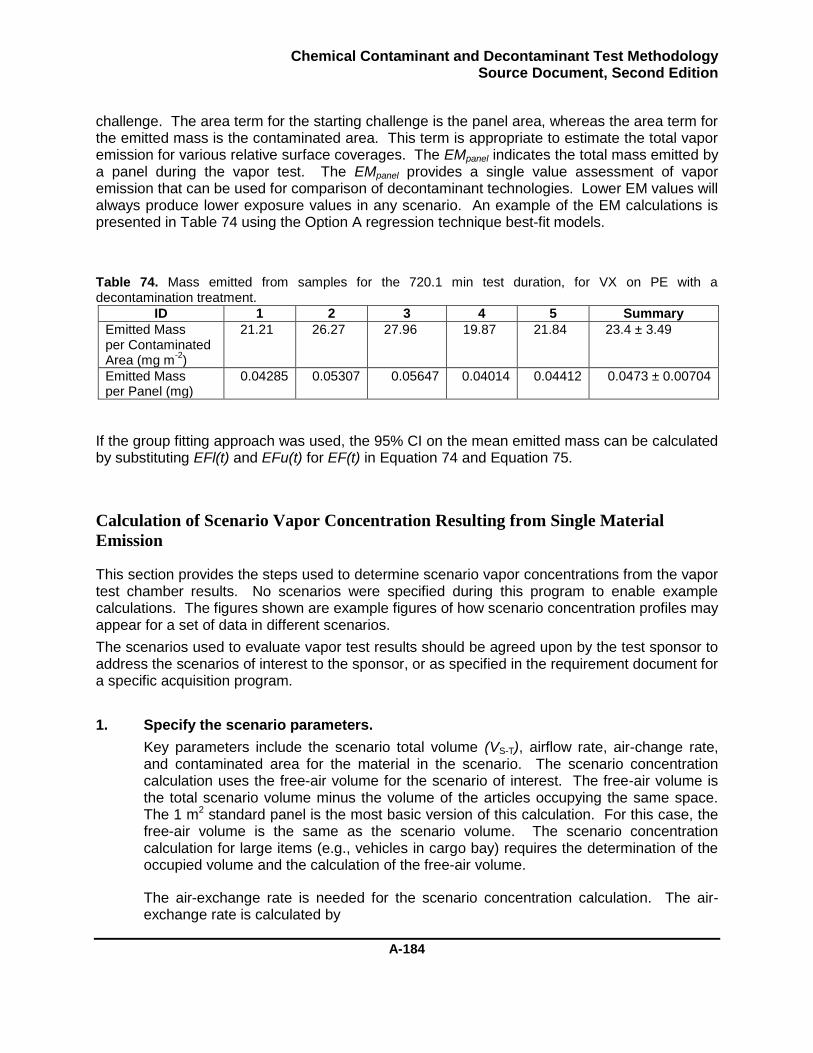
Chemical Contaminant and Decontaminant Test Methodology Source Document, Second Edition
A-184
challenge. The area term for the starting challenge is the panel area, whereas the area term for the emitted mass is the contaminated area. This term is appropriate to estimate the total vapor emission for various relative surface coverages. The EMpanel indicates the total mass emitted by a panel during the vapor test. The EMpanel provides a single value assessment of vapor emission that can be used for comparison of decontaminant technologies. Lower EM values will always produce lower exposure values in any scenario. An example of the EM calculations is presented in Table 74 using the Option A regression technique best-fit models.
Table 74. Mass emitted from samples for the 720.1 min test duration, for VX on PE with a decontamination treatment.
ID 1 2 3 4 5 Summary
Emitted Mass per Contaminated Area (mg m
-2)
21.21 26.27 27.96 19.87 21.84 23.4 ± 3.49
Emitted Mass per Panel (mg)
0.04285 0.05307 0.05647 0.04014 0.04412 0.0473 ± 0.00704
If the group fitting approach was used, the 95% CI on the mean emitted mass can be calculated by substituting EFl(t) and EFu(t) for EF(t) in Equation 74 and Equation 75.
Calculation of Scenario Vapor Concentration Resulting from Single Material
Emission
This section provides the steps used to determine scenario vapor concentrations from the vapor test chamber results. No scenarios were specified during this program to enable example calculations. The figures shown are example figures of how scenario concentration profiles may appear for a set of data in different scenarios.
The scenarios used to evaluate vapor test results should be agreed upon by the test sponsor to address the scenarios of interest to the sponsor, or as specified in the requirement document for a specific acquisition program.
1. Specify the scenario parameters.
Key parameters include the scenario total volume (VS-T), airflow rate, air-change rate, and contaminated area for the material in the scenario. The scenario concentration calculation uses the free-air volume for the scenario of interest. The free-air volume is the total scenario volume minus the volume of the articles occupying the same space. The 1 m2 standard panel is the most basic version of this calculation. For this case, the free-air volume is the same as the scenario volume. The scenario concentration calculation for large items (e.g., vehicles in cargo bay) requires the determination of the occupied volume and the calculation of the free-air volume.
The air-exchange rate is needed for the scenario concentration calculation. The air-exchange rate is calculated by

Chemical Contaminant and Decontaminant Test Methodology Source Document, Second Edition
A-185
Equation 76
where
nscenario = scenario specific air-change rate (min-1)
Qscenario = scenario airflow rate (m3/min)
Vscenario = scenario free air volume (m3)
2. Calculate the loading factor.
The scenario loading factor, lscenario, is calculated by
Equation 77
where
lscenario = scenario loading factor (m2/m3)
A = contaminated surface area of material in the scenario (m2)
Describe the parameters that were used to construct the scenario.
Table 75. Scenario parameters of conference room scenario with the average as-tested relative surface coverage, for VX on PE with a decontamination treatment.
Parameter/Scenario Conference Room Scenario With The Average As-Tested Relative Surface
Coverage Free-Air Volume (m
3) 280
Material Area (m2) 0.250
Contaminated Area (m2) 0.250
Relative Surface Coverage (%)
100
Loading Factor (m2 m
-3) 0.000893
Air-Change Rate (min-1
) 0.0607 Air-Change Rate (h
-1) 3.64
Exposure Duration (min) 720.1
3. Calculate the scenario vapor concentration
The scenario vapor concentration is calculated using the mass balance equation, with consideration for the assumptions and limitations of the equation in this application. The
scenario
scenarioscenario
V
Qn
scenario
scenarioV
Al
Chemical Contaminant and Decontaminant Test Methodology Source Document, Second Edition
A-186
mass balance equation provides the ability to calculate vapor concentrations for real world indoor scenarios with the following assumptions:
The emission-factor model data was collected for a period equal to or longer than the scenario duration. Time extrapolation of the emission-factor model is not recommended.
o Caveat: If the emission factor diminishes to a zero value, zeros can be extrapolated in time, if the residual contaminant measurements indicate no residual contaminant is present.
The initial vapor concentration in a scenario is assigned to C(t = 0) = 0 mg/m3; the initial environment is “clean”. The initial concentration could be set to any other value if needed.
If the mass transport mechanism is evaporative, these calculations do not account for the effect of air velocity or concentration gradients that may affect the emission factor. Test conditions (air velocity) should match the scenario to ensure proper scaling of evaporative emission.
The following calculations apply to enclosed volumes (”indoor” environments), modeling outdoor environments requires dispersion models [e.g., SCIPUFF, VLSTRACK, Computed Flow Dynamics (CFD)].
The enclosed volume is well mixed.
The presented model does not account for “sinks” existing in real world scenarios that would absorb vapor and decrease the actual vapor concentration and exposure.
The model does not account for changes in emission factors as a function of temperature—the scenario temperature is the same as the test data temperature generated.
Calculation of the scenario vapor concentrations uses a backwards Euler approximation to the mass balance equation specified as
Equation 78
where
Cscenario(t) = vapor concentration for the scenario at time t (mg/m3)
Cscenario(t – δt) = vapor concentration for the scenario at the previous time step value, t – δt (mg/m3)
t = current time step (min)
ttCtttCnttEFltC scenarioscenarioscenarioscenarioscenario )(
Chemical Contaminant and Decontaminant Test Methodology Source Document, Second Edition
A-187
δt = time step increment (min)
EF(t) = emission-factor model for the material (mg m-2 min-1)
This equation is solved numerically by calculating the concentration for discrete time steps. The δt, value should be 0.1 min (if erratic jumps in vapor concentrations are observed smaller, δt values should be used). The initial concentration Cscenario(t = 0) should be set to 0 mg/m3 and the calculation should be carried out for the duration of a scenario.
If the group-fitting approach was used, the upper and lower prediction bounds can be calculated using the scenario air-change rate and loading factor applied to Equation 73.
The application of the mass balance equation to calculate scenario vapor concentrations assumes a well-mixed environment. This is a valid assumption for test conditions in vapor chambers. However, as room volumes increase and airflow patterns become more complex, this assumption may not hold, which decreases the accuracy of the predicted vapor concentrations and the resulting exposure assessment. The advantage of the mass balance equation is the simplicity of calculating a first approximation of the vapor concentration and resulting vapor exposure. In many cases, this first approximation may be good enough to make initial decisions about risk or help identify the scenarios that require more advanced modeling. Advanced vapor transport models have been developed to address outdoor and indoor (poorly mixed) scenarios. These techniques use the emission factor for input as a source term. The implementation of advanced modeling techniques to calculate scenario vapor concentrations are beyond the scope of this method.
4. Graph the scenario vapor concentration.
Plot the calculated Cs(t) as a function of time. This corresponds to the vapor concentration to which unprotected personnel in the scenario would be exposed. An example calculation for placing the material in multiple scenarios may resemble the example provided in Figure 23. The resulting concentration depends on the scenario properties.
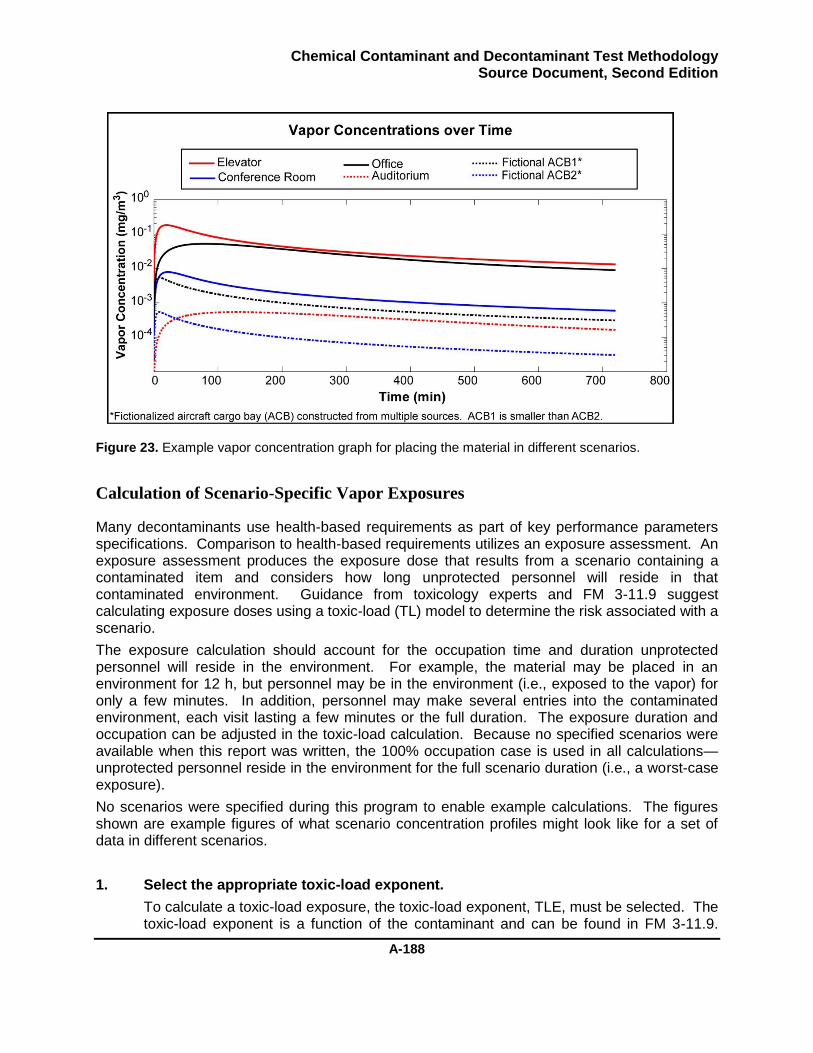
Chemical Contaminant and Decontaminant Test Methodology Source Document, Second Edition
A-188
Figure 23. Example vapor concentration graph for placing the material in different scenarios.
Calculation of Scenario-Specific Vapor Exposures
Many decontaminants use health-based requirements as part of key performance parameters specifications. Comparison to health-based requirements utilizes an exposure assessment. An exposure assessment produces the exposure dose that results from a scenario containing a contaminated item and considers how long unprotected personnel will reside in that contaminated environment. Guidance from toxicology experts and FM 3-11.9 suggest calculating exposure doses using a toxic-load (TL) model to determine the risk associated with a scenario.
The exposure calculation should account for the occupation time and duration unprotected personnel will reside in the environment. For example, the material may be placed in an environment for 12 h, but personnel may be in the environment (i.e., exposed to the vapor) for only a few minutes. In addition, personnel may make several entries into the contaminated environment, each visit lasting a few minutes or the full duration. The exposure duration and occupation can be adjusted in the toxic-load calculation. Because no specified scenarios were available when this report was written, the 100% occupation case is used in all calculations—unprotected personnel reside in the environment for the full scenario duration (i.e., a worst-case exposure).
No scenarios were specified during this program to enable example calculations. The figures shown are example figures of what scenario concentration profiles might look like for a set of data in different scenarios.
1. Select the appropriate toxic-load exponent.
To calculate a toxic-load exposure, the toxic-load exponent, TLE, must be selected. The toxic-load exponent is a function of the contaminant and can be found in FM 3-11.9.
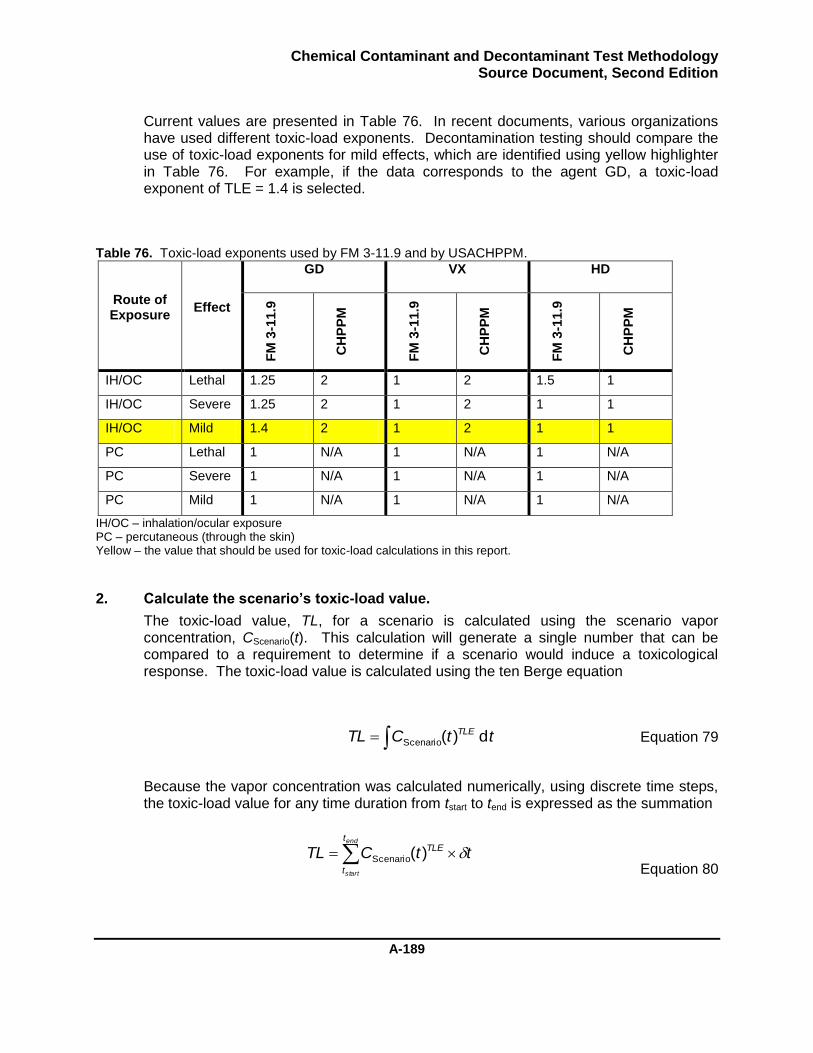
Chemical Contaminant and Decontaminant Test Methodology Source Document, Second Edition
A-189
Current values are presented in Table 76. In recent documents, various organizations have used different toxic-load exponents. Decontamination testing should compare the use of toxic-load exponents for mild effects, which are identified using yellow highlighter in Table 76. For example, if the data corresponds to the agent GD, a toxic-load exponent of TLE = 1.4 is selected.
Table 76. Toxic-load exponents used by FM 3-11.9 and by USACHPPM.
Route of Exposure
Effect
GD VX HD F
M 3
-11.9
CH
PP
M
FM
3-1
1.9
CH
PP
M
FM
3-1
1.9
CH
PP
M
IH/OC Lethal 1.25 2 1 2 1.5 1
IH/OC Severe 1.25 2 1 2 1 1
IH/OC Mild 1.4 2 1 2 1 1
PC Lethal 1 N/A 1 N/A 1 N/A
PC Severe 1 N/A 1 N/A 1 N/A
PC Mild 1 N/A 1 N/A 1 N/A
IH/OC – inhalation/ocular exposure PC – percutaneous (through the skin) Yellow – the value that should be used for toxic-load calculations in this report.
2. Calculate the scenario’s toxic-load value.
The toxic-load value, TL, for a scenario is calculated using the scenario vapor concentration, CScenario(t). This calculation will generate a single number that can be compared to a requirement to determine if a scenario would induce a toxicological response. The toxic-load value is calculated using the ten Berge equation
Equation 79
Because the vapor concentration was calculated numerically, using discrete time steps, the toxic-load value for any time duration from tstart to tend is expressed as the summation
Equation 80
ttCTL TLE d)(Scenario
end
start
t
t
TLE ttCTL )(Scenario
Chemical Contaminant and Decontaminant Test Methodology Source Document, Second Edition
A-190
Using a notation similar to the numerical method to calculate the vapor concentration, and setting the initial conditions of tstart = 0 and TL(tstart) = 0, the toxic-load value can be calculated as
Equation 81
where
TL(t) = toxic-load value at time t [(mg/m3)TLE min]
TL(t – δt) = toxic-load value at the previous time step
CScenario(t) = scenario vapor concentration at time t (mg/m3)
TLE = toxic-load exponent (unitless)
tstart = integration start time (min)
tend = integration end time (min)
δt = time step size (min)
The end time should correspond to the scenario duration (tscenario). The time step size, δt, must be the same as that used to calculate the scenario vapor concentration. The quantity CScenario(t)
TLEδt corresponds to the toxic-load exposure for a time step. The toxic-load value for the scenario duration, TL(tscenario), should be compared to a requirement value.
This calculation can be used to determine scenario toxic-load values for specific time intervals within the scenario duration by adjusting Equation 79 and Equation 80 using the start and end times of interest. This variation is recommended to determine risk to personnel that may not be in the scenario with the offgassing item for the entire scenario duration.
If group fitting was performed, the toxic load is calculated for the upper and lower prediction bounds on the concentration calculated from Equation 73.
3. Graph the scenario toxic-load value
Plot the calculated toxic-load value as a function of time. An example calculation for a material in multiple scenarios may resemble the example provided in Figure 24. The resulting concentration is dependent on the scenario properties.
ttCttTLtTL TLE
Scenario )()()(
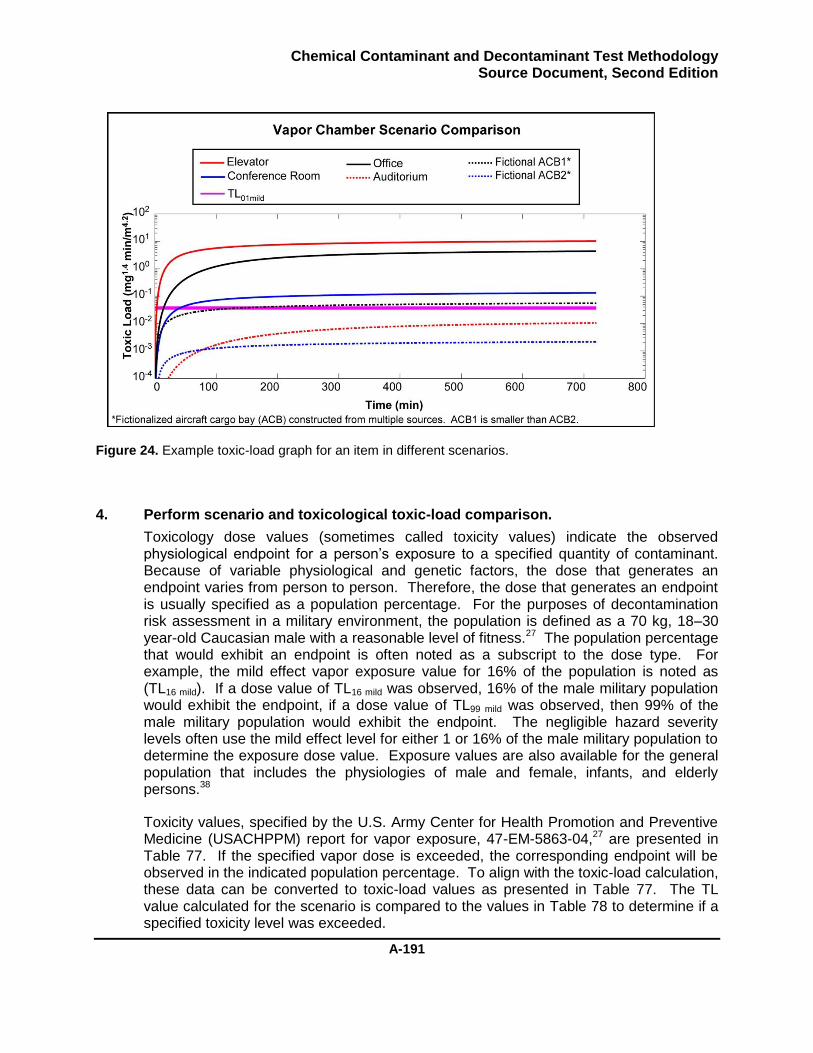
Chemical Contaminant and Decontaminant Test Methodology Source Document, Second Edition
A-191
Figure 24. Example toxic-load graph for an item in different scenarios.
4. Perform scenario and toxicological toxic-load comparison.
Toxicology dose values (sometimes called toxicity values) indicate the observed physiological endpoint for a person’s exposure to a specified quantity of contaminant. Because of variable physiological and genetic factors, the dose that generates an endpoint varies from person to person. Therefore, the dose that generates an endpoint is usually specified as a population percentage. For the purposes of decontamination risk assessment in a military environment, the population is defined as a 70 kg, 18–30 year-old Caucasian male with a reasonable level of fitness.27 The population percentage that would exhibit an endpoint is often noted as a subscript to the dose type. For example, the mild effect vapor exposure value for 16% of the population is noted as (TL16 mild). If a dose value of TL16 mild was observed, 16% of the male military population would exhibit the endpoint, if a dose value of TL99 mild was observed, then 99% of the male military population would exhibit the endpoint. The negligible hazard severity levels often use the mild effect level for either 1 or 16% of the male military population to determine the exposure dose value. Exposure values are also available for the general population that includes the physiologies of male and female, infants, and elderly persons.38
Toxicity values, specified by the U.S. Army Center for Health Promotion and Preventive Medicine (USACHPPM) report for vapor exposure, 47-EM-5863-04,27 are presented in Table 77. If the specified vapor dose is exceeded, the corresponding endpoint will be observed in the indicated population percentage. To align with the toxic-load calculation, these data can be converted to toxic-load values as presented in Table 77. The TL value calculated for the scenario is compared to the values in Table 78 to determine if a specified toxicity level was exceeded.
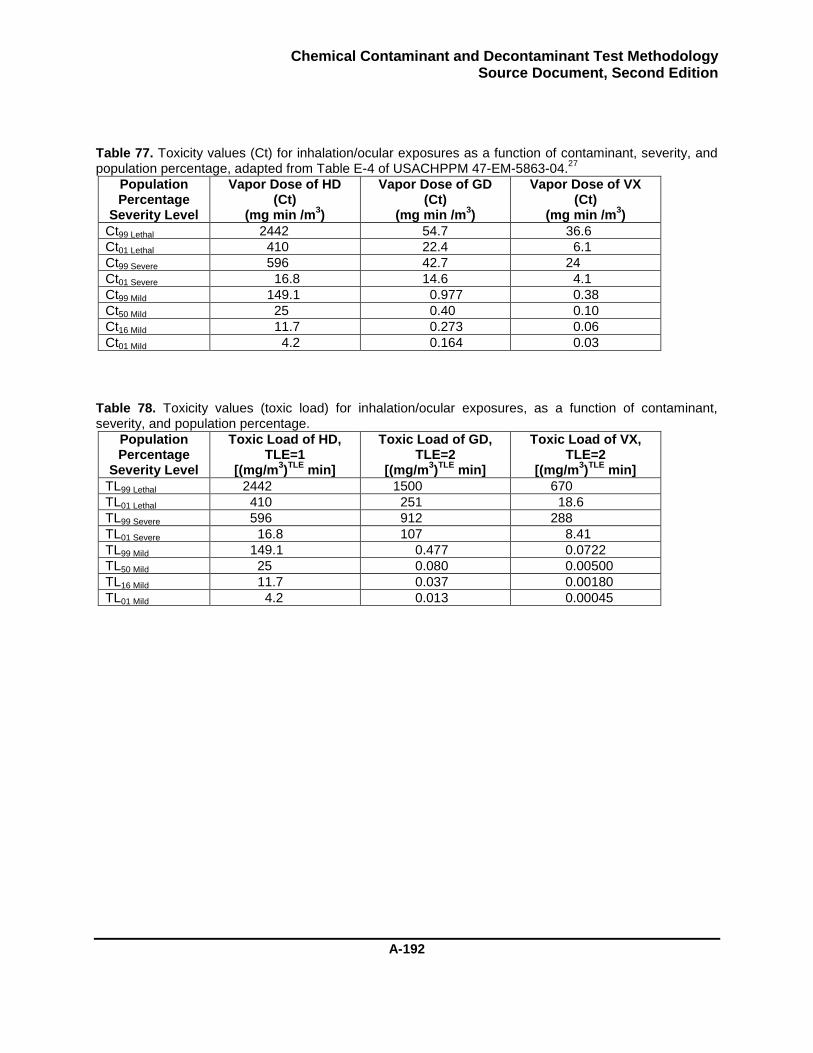
Chemical Contaminant and Decontaminant Test Methodology Source Document, Second Edition
A-192
Table 77. Toxicity values (Ct) for inhalation/ocular exposures as a function of contaminant, severity, and population percentage, adapted from Table E-4 of USACHPPM 47-EM-5863-04.
27
Population Percentage
Severity Level
Vapor Dose of HD (Ct)
(mg min /m3)
Vapor Dose of GD (Ct)
(mg min /m3)
Vapor Dose of VX (Ct)
(mg min /m3)
Ct99 Lethal 2442 54.7 36.6
Ct01 Lethal 410 22.4 6.1
Ct99 Severe 596 42.7 24
Ct01 Severe 16.8 14.6 4.1
Ct99 Mild 149.1 0.977 0.38
Ct50 Mild 25 0.40 0.10
Ct16 Mild 11.7 0.273 0.06
Ct01 Mild 4.2 0.164 0.03
Table 78. Toxicity values (toxic load) for inhalation/ocular exposures, as a function of contaminant, severity, and population percentage.
Population Percentage
Severity Level
Toxic Load of HD, TLE=1
[(mg/m3)TLE
min]
Toxic Load of GD, TLE=2
[(mg/m3)TLE
min]
Toxic Load of VX, TLE=2
[(mg/m3)TLE
min]
TL99 Lethal 2442 1500 670
TL01 Lethal 410 251 18.6
TL99 Severe 596 912 288
TL01 Severe 16.8 107 8.41
TL99 Mild 149.1 0.477 0.0722
TL50 Mild 25 0.080 0.00500
TL16 Mild 11.7 0.037 0.00180
TL01 Mild 4.2 0.013 0.00045

Chemical Contaminant and Decontaminant Test Methodology Source Document, Second Edition
A-193
Table 79. Results for the conference room scenario with the average as-tested relative surface coverage, for the agent VX (TLE =2.0) with an exposure duration of 720 min (12.0 h), for VX on PE with a decontamination treatment.
ID Toxic-Load Value [(mg m
-3)TLE
min] Health Effect
Level
1 0.000140 Below TL01 Mild
2 0.000213 Below TL01 Mild
3 0.000251 Below TL01 Mild
4 0.000117 Below TL01 Mild
5 0.000126 Below TL01 Mild
Summary 0.000170 ± 0.0000594 Below TL01 Mild
Procedure for the Vapor Composite Systems Calculation
Overview
The VCSC is a scaling method that utilizes emission factors determined from laboratory panel data to calculate the vapor emission rate, the scenario-specific vapor concentration, and vapor exposure values generated from decontaminated full-scale assets. The emission rate can be used to calculate emitted mass and exposure values that enable comparison to health-based requirements.
The determination of a vapor emission factor evaluates materials on an individual basis (e.g., painted metal, glass, and tire rubber), rather than as a collective system of multiple materials (e.g., whole vehicle). The risk presented to unprotected personnel is a result of exposure to full-scale assets in specific scenarios. The ability to assess the risk associated with a decontaminant technology should evaluate the exposure resulting from a full-scale asset.
The VCSC presents a powerful tool that can utilize the live-agent laboratory panel data, generated for Milestone B evaluations, to predict performance in Development and Operation Testing (DT/OT) testing and in the field, where live contaminant testing with full-scale assets may not be practical. The VCSC method enables risk assessments without the requirement to physically test all physical assets or all scenarios.
The basis of the VCSC is that the whole is equal to the sum of its parts. A composite system emission rate corresponds to the sum of emission rates for all emitting sources in a chamber. The total vapor emission rate from an asset is equal to the sum of the emission rates of each contaminated material contained in the asset. The emission rate for each material corresponds to the emission factor of the material times the contaminated area.
The following procedure defines how to combine multiple material emission factors to simulate the emission rate of a full-scale asset. The emission rate is then used to calculate scenario-specific vapor concentration and exposure values.
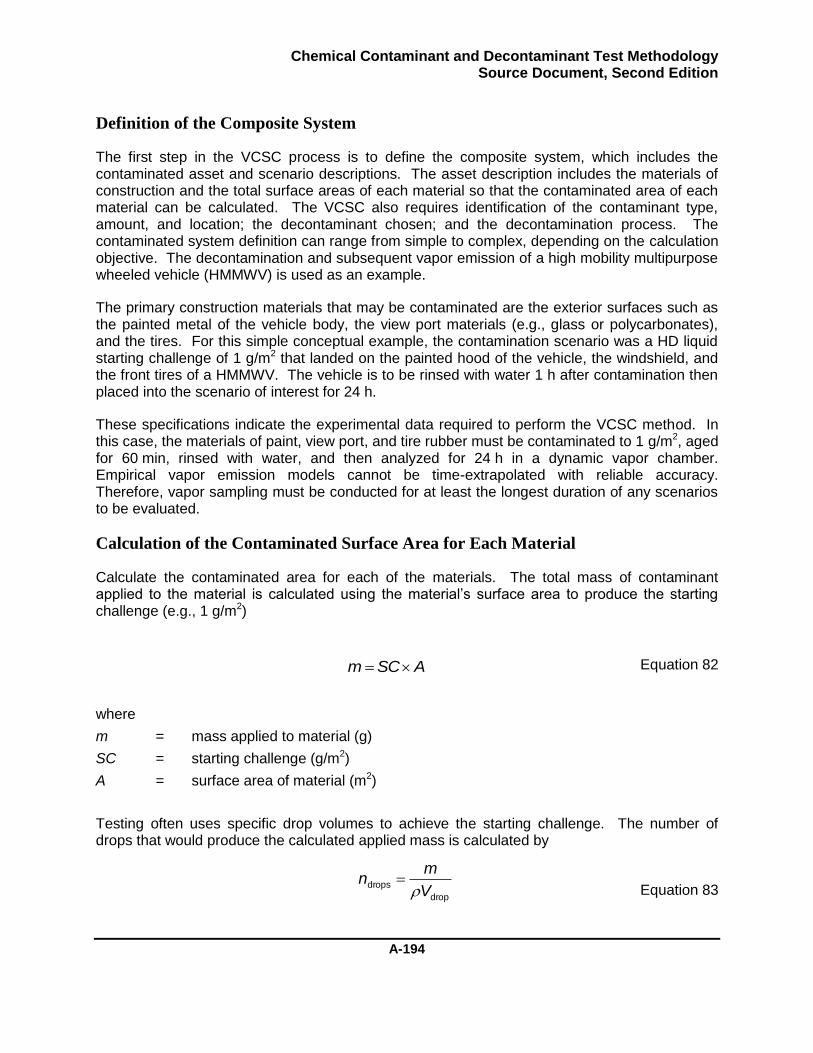
Chemical Contaminant and Decontaminant Test Methodology Source Document, Second Edition
A-194
Definition of the Composite System
The first step in the VCSC process is to define the composite system, which includes the contaminated asset and scenario descriptions. The asset description includes the materials of construction and the total surface areas of each material so that the contaminated area of each material can be calculated. The VCSC also requires identification of the contaminant type, amount, and location; the decontaminant chosen; and the decontamination process. The contaminated system definition can range from simple to complex, depending on the calculation objective. The decontamination and subsequent vapor emission of a high mobility multipurpose wheeled vehicle (HMMWV) is used as an example.
The primary construction materials that may be contaminated are the exterior surfaces such as the painted metal of the vehicle body, the view port materials (e.g., glass or polycarbonates), and the tires. For this simple conceptual example, the contamination scenario was a HD liquid starting challenge of 1 g/m2 that landed on the painted hood of the vehicle, the windshield, and the front tires of a HMMWV. The vehicle is to be rinsed with water 1 h after contamination then placed into the scenario of interest for 24 h.
These specifications indicate the experimental data required to perform the VCSC method. In this case, the materials of paint, view port, and tire rubber must be contaminated to 1 g/m2, aged for 60 min, rinsed with water, and then analyzed for 24 h in a dynamic vapor chamber. Empirical vapor emission models cannot be time-extrapolated with reliable accuracy. Therefore, vapor sampling must be conducted for at least the longest duration of any scenarios to be evaluated.
Calculation of the Contaminated Surface Area for Each Material
Calculate the contaminated area for each of the materials. The total mass of contaminant applied to the material is calculated using the material’s surface area to produce the starting challenge (e.g., 1 g/m2)
Equation 82
where
m = mass applied to material (g)
SC = starting challenge (g/m2)
A = surface area of material (m2)
Testing often uses specific drop volumes to achieve the starting challenge. The number of drops that would produce the calculated applied mass is calculated by
Equation 83
ASCm
drop
dropsV
mn

Chemical Contaminant and Decontaminant Test Methodology Source Document, Second Edition
A-195
where
ndrops = number of drops applied to material (unitless)
ρ = density of contaminant (g/mL)
Vdrop = volume of each droplet (mL)
Each contaminant-material combination may have different surface-wetting characteristics that produce different contaminated areas. Using previous test data, the contaminated area per 2 µL droplet is determined then multiplied by the number of droplets to produce an estimated contaminated surface area as calculated by
Equation 84
where
Amaterial = estimated total contaminated area for a material (m2)
AVolume = final wetted area for a drop of specified volume on a specific contaminant-material combination (m2)
An example of this calculation for the HMMWV contaminated with HD (ρ = 1.28 g/mL) is illustrated in Table 80. The material surface areas are listed as a conceptual example and should not be used as a default scenario. The identification of the materials that would be contaminated and the corresponding contaminated surface areas provide the data necessary for the asset description of the VCSC.
Table 80. Asset materials of construction and contamination estimates for a HMMWV.
Asset Description
Asset Material
Material Surface
Area (m
2)
Mass of Contaminant
for 1 g/m2
(g)
Estimated Number of
2 µL Droplets
Contaminated Area per 2 µL Contaminant
Droplet* (m
2/droplet)
Estimated Contam. Surface
Area (m2)
Vehicle Engine Hood
Paint 3.9 3.9 1806 1.26 x 10⁻⁵
0.02275
Windshield Poly- carbo-nate
1.2 1.2 469 1.46 x 10⁻⁵
0.006844
Vehicle Tire (2 front tires)
Rubber 1.0 1.0 391 9.62 x 10⁻⁶
0.003758
* Area per 2 µL drop obtained from previous testing.
dropsVolumematerial nAA
Chemical Contaminant and Decontaminant Test Methodology Source Document, Second Edition
A-196
Definition of the Scenario
The description of the asset’s surroundings (scenario) during the vapor emission period includes key parameters such as the loading factor and air-change rate. The necessary parameters to define the scenario include the number of assets in the scenario (Z), the free air volume of the scenario (V), the airflow rate into the scenario (Q), and the duration of the scenario.
The scenario description may also include the environmental temperature and humidity, which may or may not change the emission factors for each material. The emission factor models used here are empirical models that are specific to the test conditions used to generate the model. The VCSC calculations predict the scenario vapor concentrations for the same temperature and humidity as that used to acquire the emission factor test data.
The identification of the scenario must include where the asset will reside and the resulting environmental properties such as the loading factor, air change rate, and the duration in the scenario. Potential scenarios for the HMMWV could include the transportation of one or more vehicles in an aircraft cargo bay for a specified time (e.g., 8 h), one or more vehicles parked inside a maintenance facility for a specified time (e.g., 12 h), or many other scenarios relevant to post-decontamination activities. Each of these scenarios would produce different vapor concentrations and potential exposures to unprotected personnel. As an extension to the scenario definitions, the vapor exposure resulting for parking the vehicle outside for a specified time could be evaluated, if dispersion models were applied to the calculation.
The exposure calculation should account for the occupation time and duration (i.e., when and for how long) unprotected personnel reside in the environment. For example, the vehicle may be parked in the maintenance facility for 12 h, but personnel may be in the environment (i.e., exposed to the vapor) for only a few minutes. In addition, personnel may make several entries into the contaminated environment, each lasting a few minutes or the full duration. The exposure duration and occupation can be adjusted in the toxic-load calculation as specified in Section 2 “Calculate the scenario’s toxic-load value” on page A-189. Because no specified scenarios were available when this method was written, all examples use the 100% occupation case—unprotected personnel reside in the environment for the full scenario duration (i.e., a worst-case exposure).
Calculation of the Composite Emission Rate
The asset’s vapor emission rate (total emission rate) is composed of the emission rate of all materials in the system. Each material emits contaminant vapor at a rate of the emission factor times the contaminated area. Therefore, the asset’s emission rate is the sum of the individual material emission factors times the contaminated area of each material, expressed as
Equation 85
where
ER(t) = the asset’s composite emission rate function (mg min-1)
material
)()(i
ii AtEFtER
Chemical Contaminant and Decontaminant Test Methodology Source Document, Second Edition
A-197
i = indexed list of all materials used to construct emission rate (unitless)
EFi(t) = the emission factor function for material i (mg min-1 m-2)
Ai = the total contaminated area of material i (m2)
Calculate the emission rate of the specified asset.
Applying Equation 85 to the example HMMWV asset, the emission rate function is calculated as
Equation 86
Calculation of the Uncertainty in the Composite Emission Rate
There is uncertainty associated with all of the terms in Equation 85. The propagation of uncertainty with each material is expressed as39
Equation 87
where
δERi(t) = prediction bound half-width of the emission rate of material i (mg min-1)
δEFi(t) = prediction bound half-width of the emission factor from material i (mg m-2 min-1)
δAi = uncertainty (standard deviation) of the contaminated area of material i (m2)
The value of δEFi(t) is obtained from the regression technique. The uncertainty of the aggregate emission rate is expressed as
Equation 88
where
δERasset(t) = prediction bound half-width of the asset’s VCSC emission rate (mg min-1)
The upper prediction bounds for the contaminated asset’s emission rate are calculated as
Equation 89
RubberRubberPortView PortView PaintPaint )()()()( AtEFAtEFAtEFtER
2122
i
i
i
iiii
A
A
tEF
tEFAtEFtER
)(
)()()(
2/1
material
2
asset )()(
i
i tERtER
)()()( assetassetasset tERtERtERu
Chemical Contaminant and Decontaminant Test Methodology Source Document, Second Edition
A-198
where
ERuasset(t) = upper prediction bound of the contaminated asset’s emission rate (mg min-1)
Similar to the emission model lower bounds (Equation 68), the lower prediction-bound calculation uses a log transformation specified as
Equation 90
where
ERlasset(t) = lower prediction bound of the contaminated asset’s emission rate (mg min-1)
Calculation of the Scenario Vapor Concentration
The mass balance equation must be modified to account for the units of emission rate. The area term previously used to define the contaminated area is switched to Z, which is the number of assets in the environment, yielding the equation
Equation 91
where Z = number of assets in the system (unitless)
For a given system, the ratio of Z/V is a fixed constant that represents the number (or quantity) of assets emitting vapor per unit volume. Similar to the area to volume ratio, the asset per unit volume ratio is also referred to as the loading factor, l , in cubic meters.
From this point, all vapor concentration calculations and exposure calculations are identical to those previously expressed for emission factors, except the emission rate and the asset-based loading factor are used. The upper and lower prediction bounds for vapor concentration are calculated using Equation 73 and associated toxic-load calculations are performed for the mean vapor concentration and the upper and lower prediction-bound vapor concentrations.
Calculation of an Asset’s Emitted Vapor Mass
The emitted mass is a scenario-independent metric that indicates the total mass of contaminant that was emitted from the asset as a vapor during the vapor test duration. This mass is calculated as the integral of the emission rate model over time for the vapor test duration. A higher emitted mass will produce higher vapor concentrations and vapor exposure values. The emitted mass from the asset is calculated as
V
QtC
V
ZtER
t
C)()(
d
d
)(
)(1ln)(lnexp)(
asset
assetassetasset
tER
tERtERtERl
Chemical Contaminant and Decontaminant Test Methodology Source Document, Second Edition
A-199
Equation 92
where
EMasset = emitted mass per contaminated area (mg/m2)
ER(t) = VCSC emission rate function (mg min-1)
The 95% CI on the mean emitted mass can be calculated by substituting ERlasset(t) and ERuasset(t) for ER(t) in Equation 92.
Scientific Discussion and Reporting Guidance
Vapor testing is primarily performed to assess the risk associated with placing a contaminated, vapor-emitting asset into a specified environment. Vapor exposure calculation requires the determination of the vapor concentration to which unprotected personnel would be exposed. This calculation is highly dependent on the environment containing the decontaminated asset.
A common domestic example that demonstrates the link between vapor exposure and vapor emission sources is the use of perfume or cologne as an example contaminant. Applying the perfume is the contamination event. The degree of contamination is determined by the number of pumps used to dispense the perfume. As the perfume-contaminated person resides in various environments, perfume vapor is emitted, generating a vapor concentration of contaminant. The longer the perfume-contaminated person resides in the environment, the higher the vapor concentration may become. The vapor concentration of the contaminant is dependent on the strength of the vapor source (e.g., the degree of contamination) and properties of the environment (e.g., room volume and airflow rates). The vapor concentration and resulting exposure that could result from interacting with the perfume-wearing person in an elevator vs. a conference room would be vastly different. If there were one, two, or ten perfume-contaminated individuals in the environment, this would also greatly affect the vapor concentration. The same concepts apply to chemical contaminant vapor emission from materials.
Extending this example, what is the impact of a perfumed person entering a room minutes after applying the perfume vs. entering many hours or days after the contamination event? For both the perfume example and for post-decontaminated assets emitting contaminant, the vapor source often decays with time. To perform an accurate risk assessment, all of these factors must be addressed. Variations in these parameters can affect the exposure by multiple orders of magnitude ranging from negligible risk to lethal exposure.
Risk assessment uses the results of a vapor exposure evaluation to determine if a specified risk level has been exceeded. Evaluating the exposure of unprotected personnel to chemical contaminant vapors requires the specification of a scenario. At a minimum, the scenario is described by the air-change rate, a loading factor (i.e., how much contaminated material is in the scenario), and the emission rate of the material in the scenario. The vapor concentration
end
start
t
t
ttERdttER )()(EMasset
Chemical Contaminant and Decontaminant Test Methodology Source Document, Second Edition
A-200
and associated risk observed in each scenario is highly dependent on these variables. Vapor emission chamber test apparatus are scenarios that are specifically designed for high-sensitivity testing to measure emission factors. These scenarios do not correspond to the vapor concentration exposure of unprotected personnel. At the time this method was written, the decontaminant requirements documents specified toxicity values that must not be exceeded. However, no specified vapor scenarios were available for post-decontamination risk assessment. Accurately determining risk requires an accurate exposure assessment and specification of a scenario.
Exposure assessments identify how much, how often, how long, and through what route of exposure the chemical comes into contact with unprotected personnel to determine a dose. If the exposure dose is greater than the toxicity dose, the endpoint would be observed. As defined by USACHPPM, the acceptable risk level for thorough decontamination has been identified as negligible hazards.27 Therefore, if the exposure dose is less than the toxicological dose (e.g., the 16% mild effect level), the risk assessment can be classified as an acceptable risk.
The final decision on decontaminant technology evaluations is often based on the exposure values. Various scenario specifications or occupancy assumptions can result in severe over- or under-estimation of the exposure value. To ensure an accurate assessment of risk and the fair evaluation of a technology, the assumptions and data treatments for the determination of this value should be carefully evaluated.
The process needed to perform an exposure assessment is defined in various documents including those established by the EPA,22, 40-41 NRC,23, 42 and USACHPPM.43 As identified by the EPA,22 “Every exposure assessment is based upon certain explicit or implicit assumptions… [Further]…an exposure assessment cannot easily be regimented into a set format or protocol…rather a common set of questions must be answered.” The common considerations for contaminant exposure assessment, paraphrased from the EPA citation, include the following:
(1) Describing the purpose of the exposure assessment (e.g., to perform a risk assessment associated with the use of a specified decontamination technology).
(2) Defining the scope of the assessment including: what population is being exposed (e.g., male military population), the route of exposure (e.g., vapor inhalation/ocular, or dermal contact), the exposure media (i.e., the decontaminated materials/assets), where the asset is located, and the asset’s history regarding how the decontaminated asset was released to the unprotected personnel.
(3) Defining the desired detail needed in the assessment. Exposure assessments are usually used as support for making decisions. Refining the accuracy and detail of an assessment needs to be commensurate with the importance of the decision being made. The risk assessment will be as accurate as the assumptions used to construct the exposure scenario.
(4) Defining the approach used in the exposure assessment. The approach includes multiple aspects of the analysis, including the use of experimental data, calculations, or models. The exposure assessment includes the duration of the
Chemical Contaminant and Decontaminant Test Methodology Source Document, Second Edition
A-201
exposure. Thorough and operational decontamination are most concerned with acute exposures that could occur over the mission duration of 24 h. Clearance decontamination requirements are most concerned with long-term [chronic] exposures that may be on the scale of weeks to years. Lastly, the types of scenarios should be defined—“Is the scenario a ‘typical’ use scenario or a ‘worst- case’ scenario?”
Depending on the situation, exposure assessment can range from simple to complex. A simple scenario could be a single item in an enclosed room with unprotected personnel remaining in the room for the full exposure duration. Complex scenarios may involve many material systems in multiroom enclosures where personnel enter and exit throughout the emission duration. No specific situation or scenario for unprotected personnel interacting with a decontaminated asset has been defined at the time of this report for the performance of an exposure assessment. Because of the range of assets that may be decontaminated (e.g., sensitive equipment, vehicles, aircraft, fixed site facilities, mobile facilities, etc.), the scenarios for interaction of personnel with these assets are likely to be significantly different. Exposure assessment is not limited to chemical warfare agents. There is a large body of research and literature, which include examples regarding exposure assessment and how to perform assessments.22-23, 42, 44-46
The fundamental outputs of an exposure assessment are the vapor concentration and resulting exposure values affecting personnel in the specified scenario. There are multiple modeling methods and techniques to calculate the vapor concentration, depending on the type of scenario and the level of detail required. Scenarios can be broadly categorized into indoor (enclosed) or outdoor scenarios, which require different types of modeling approaches to determine vapor concentrations. This vapor test method provides an emission factor, or source term, that can be applied to indoor and outdoor modeling techniques to generate scenario-specific exposure assessments.
The ability to perform an accurate risk assessment associated with the used of post-decontaminated assets requires the identification of scenarios. The Chemical and Biological Defense (CBD) community needs to identify scenarios of interest for how the decontaminated assets are to be used. The accuracy of the risk assessment is only as accurate as the exposure assessment and the description of the scenario. If the exposure assessment does not reflect the actual use of the assets and the process to be carried out, including the contamination and decontamination of the asset, the risk assessment may significantly over- or under-estimate the actual risk.
Calculation Procedure to Determine the Mass Delivered
1. Obtain the chromatography data (in nanograms per milliliter) for the DCS (DCE) that were corrected for any dilutions performed between sample collection and analysis.
2. Calculate the contaminant mass delivered (DelM) from DCS.
For each DCS extract, convert the analytical results in nanograms per milliliter to mass results in nanograms by multiplying the extraction solvent volume (EV) in milliliter. For the method as written, the extraction solvent volume is 20 mL
Chemical Contaminant and Decontaminant Test Methodology Source Document, Second Edition
A-202
Equation 93
3. The results can be tested for data outliers using the ASTM Standard E 178, “Standard Practice for Dealing with Outlying Observations”. Data points identified as outliers should be marked with a data qualifier (i.e., data flag such as an asterisk) with a corresponding footnote that the data point was a statistical outlier. Data points identified as outliers should not be rejected from the data set without an assignable cause.
4. Hazard mitigation requirements typically specify the initial amount of contaminant in units of mass per area (grams per square meter). Convert DelM to contaminant mass delivered in units of mass per unit area (DelSC)
Equation 94
where CA = test area (m2)
5. Report the final test results with average and standard deviation in mass (nanograms) and starting challenge (grams per square meter) units.
Calculation Procedure for Residual Contaminant
1. Obtain the panel extract chromatography data (in nanograms per milliliter) for the residual contaminant (REE) samples that have been corrected for any dilutions performed between the sample collection and analysis.
2. Convert the panel extraction result from mass in solution (REE) to mass (REM).
For each contact sampler extract, convert the analytical results in nanograms per milliliter to mass results in ng by multiplying the extraction solvent volume (EV) in milliters. For the method, as written, the extraction solvent volume is 20 mL
Equation 95
3. Correct the test results (if required) for solvent recovery to generate the measured residual contaminant mass corrected for solvent recovery (REM,C).
4. The results can be tested for data outliers using the ASTM Standard E 178, “Standard Practice for Dealing with Outlying Observations”. Data points identified as outliers
REM = REE x EV
DelM = DCE x EV
DelSC = DelM /(CA x 109)
Chemical Contaminant and Decontaminant Test Methodology Source Document, Second Edition
A-203
should be marked with a data qualifier (i.e., data flag such as an asterisk) with a corresponding footnote that the data point was a statistical outlier. Data points identified as outliers should not be rejected from the data set without an assignable cause. Some decontamination processes and material inhomogeneity can result in wider distribution of test results. These real effects should be considered when making risk determinations from test data.
5. Report the final test results with average and standard deviation.
6. For full disclosure, any residual contaminant and potential that the contaminant could pose a future hazard should be discussed in the report. If residual contaminant is present, then the recommendation is that vapor data not be extrapolated beyond the time duration of the vapor sampling because the residual contaminant may present a future vapor emission.
Vapor Calculation Variations for Determining Trade Space, Multiple Asset
and Other Risk Scenarios from Vapor Emission Data
Trade space: The scenario-based evaluation offers greater context for the evaluation of decontaminant performance. The Concept of Operations (CONOPS) for various systems may significantly vary if personnel interact with a decontaminated item more in some situations than others. The exposure assessment should accurately reflect the intended use. If the exposure assessment does not accurately reflect the CONOPS, the assessment may be overprotecting (or rejecting a technology that is sufficient for the needs). Alternately, the exposure assessment could be used to adjust CONOPS. For example, the first hour typically presents significant risk because of high emission factors. If personnel remained in Mission-Oriented Protective Posture (MOPP) gear for the first hour, the remainder of the mission may present acceptable risk.
If protective equipment, such as a mask is put on or taken off during the scenario, the amount of vapor exposure for personnel can fluctuate greatly. The exposure duration and occupation can be adjusted by integrating the vapor dose only during the time for which personnel are in the environment. Because no specified scenarios were available when this method was written, all examples use the 100% occupation case—unprotected personnel reside in the environment for the full scenario duration (i.e., a worst-case exposure). If 100% occupation does not reflect the end scenario, the risk assessment will overestimate the potential exposure for the scenario.
The decontaminant treatment can be analyzed to determine the trade space for the decontaminant tested. The toxic load can be determined for the specific time that personnel may be present in the scenario. Alternatively, the scenario can be evaluated to determine when risk is low enough for personnel to enter by calculating the toxic load for specific time periods of interest.
Multiple off-gassing assets scenario: The vapor test calculation can also be used evaluate the potential toxic load for multiple items in a scenario. For example, what is the risk if personnel enter the cabin of a vehicle with multiple items that have been decontaminated? Could the collective post-decontamination vapor emission be great enough to pose a potential risk? These variations provide enhanced risk assessment capability to the community and enable

Chemical Contaminant and Decontaminant Test Methodology Source Document, Second Edition
A-204
updated ways to handling items and associated field procedures. This condition is addressed by the VCSC method where the number of assets in the environment is adjusted to the specified scenario.
Advanced modeling: The emission source characterization can be used as a source term in outdoor dispersion models or in other air quality models. There are well developed tools used to model contaminants in multiple domestic situations that are directly applicable to post-decontamination risk assessment.
Several refinements to the modeling algorithms were developed to enhance the accuracy and output capabilities of the VCSC, compared with the previous vapor methods. For example, all physical measurements carry some degree of uncertainty. The uncertainty originates from variances in the object being measured and the tools used to acquire the measurement. In the case of decontamination testing, variance in the measured vapor concentrations originate from minor variances in the testing processes (e.g., different droplet spreading on the material during contamination, heterogeneities in the material, etc.) and the accuracy of quantitation of test parameters (e.g., air change rate, loading factor, analytical measurement of vapor concentrations, etc.). As a result, the vapor emission rate at any point is not completely described by a single value, but rather by a distribution or range of values. The algorithms to characterize the emission factor models were refined to produce prediction bounds. Much like standard deviation and confidence bounds describe the distribution of measured values, the range of values that may be observed for an emission model is described by a prediction bound. The incorporation of prediction bounds in emission factor models enables the prediction of exposure value ranges that unprotected personnel may encounter.
Chemical Contaminant and Decontaminant Test Methodology Source Document, Second Edition
A-205
Procedure 7: Data Acceptance
Overview
Data acceptance is the process of verification and validation to ensure that the data being used for analyses are complete, correct, and fit for analysis. This procedure provides guidance to help laboratories establish the data verification and validation procedures specific to their capabilities for data acceptance.
Introduction
The decontamination panel test involves the evaluation of the contaminant–material-decontaminant interactions. Studies use a variety of test parameters to control specific interactions. All of these interactions have a foundation in mass transport involving competing transport processes that move the contaminant to various compartments of the system including evaporation (into the air), sorption (into the material), chemical reaction (anywhere in system), and physical removal (from the material). Because of the mass transfer processes, slight variations in test parameters may result in significantly different results. Verification and validation ensure that the test data conform to the specified test configurations (i.e., test parameters) and that the resulting data are fit for analysis.
The generation of robust data requires careful control, measurement, and reporting of test parameters. If data from multiple tests are compared, and the various parameters are different, the resulting analysis may produce biased results. This section contains data acceptance guidance including data verification and sample analysis validation. Laboratories performing these methods should develop and document their data acceptance process.
Data Verification
Data verification is the process of evaluating the completeness, correctness, and conformance/compliance of a specific data set against the method, procedural, or contractual requirements.47 This process evaluates whether the correct test settings were used. The goal of data verification is to ensure that the reported results reflect what was actually done. A comprehensive data package is necessary to perform data verification and must contain sufficient information to reconstruct the test configurations that were performed.
Data Verification to Procedural and Contractual Requirements
The test facility and the sponsor should establish the test parameters prior to testing. In general, the test sponsor/lead determines the contaminant, contaminant application parameters, test environmental conditions, event timing (duration of material conditioning, contaminated-material interaction period, decontaminant residence time, etc.), decontaminant application and post-treatment evaluations, and data requirements. These test parameter specifications are typically detailed in a project document such as a Statement of Work (SOW), Technology Transition Agreement (TTA), or test plan.
Chemical Contaminant and Decontaminant Test Methodology Source Document, Second Edition
A-206
Verifying the collected data directly with procedural and contractual requirements ensures that the proper test parameters were executed. If any specified test condition was not met, contact the test sponsor/lead and take one of the following resolutions:
If the test sponsor/lead accepts the test results under the conditions the test was run, then the acceptance of the test condition should be documented to enable verification of the data to procedural and contractual requirements.
If the test results are not accepted by the test sponsor/lead, then the test must be rerun.
Data Verification to Method Specification
Test tools, equipment, and data are compared with the method specifications for data verification. This verification is critical because the accuracy and precision of the tools and equipment used, and the test parameter control can affect the accuracy, precision, and conclusions for the reported data. Verification of test parameter control includes evaluating whether the test as performed conforms to the test setpoints. For example, the test setpoint temperature may be 21 °C, but the actual test average temperature may have been 22.7 °C. The following section identifies whether the actual test sufficiently conforms to the set point.
Laboratories should implement their tool, equipment, and method requirements based on experimental capabilities. This section provides guidance based on the SD2ED specifications. Some of the main inspections for verifying the data set with the method specifications include, but are not limited to, the following:
Verification of the tool conformance. Laboratories should document the tools used to perform the test. These tools should conform to the specifications provided in “Laboratory Materials, Tools and Equipment” on page A-43 of this document.
Many of the test treatment procedures correspond to an action performed on the panel at a specific time as part of the test process. The following tables provide the recommended test parameter specifications and supporting rationale.
o Table 81 provides test parameter specifications for panel treatment. o Table 82 provides test parameter specifications for the post-treatment evaluation
for contact transfer. o Table 83 provides test parameter specifications for the post-treatment evaluation
for vapor emission.
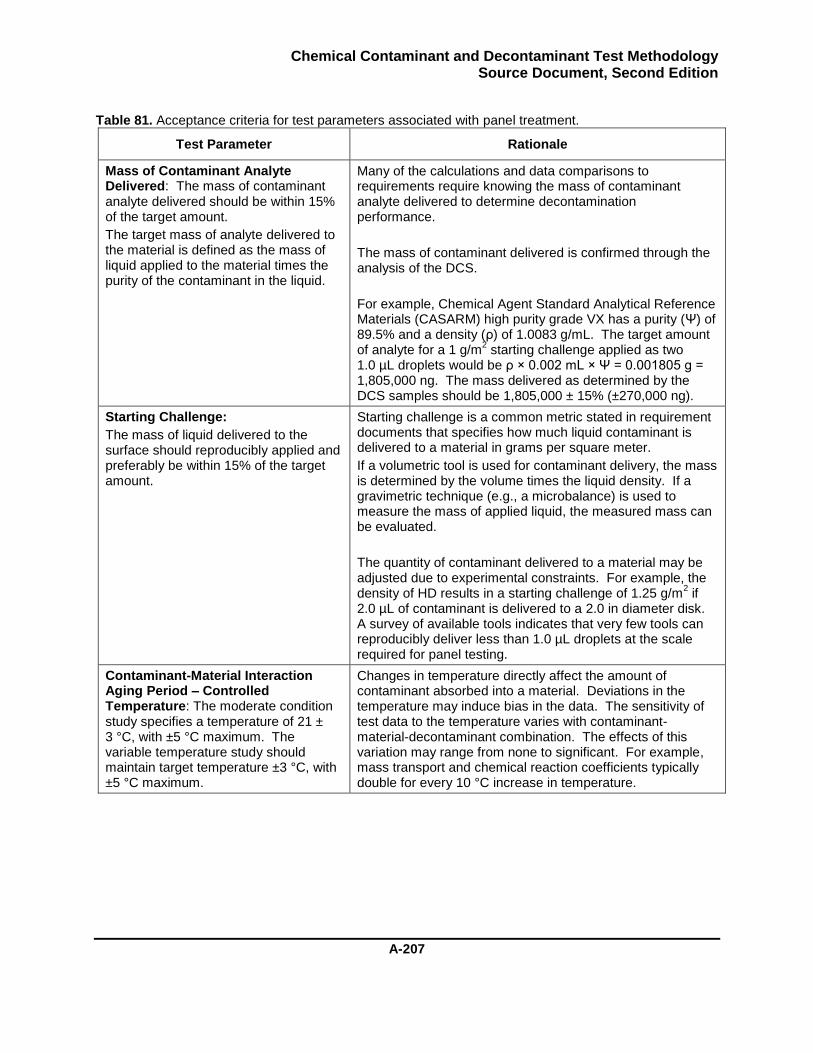
Chemical Contaminant and Decontaminant Test Methodology Source Document, Second Edition
A-207
Table 81. Acceptance criteria for test parameters associated with panel treatment.
Test Parameter Rationale
Mass of Contaminant Analyte Delivered: The mass of contaminant analyte delivered should be within 15% of the target amount.
The target mass of analyte delivered to the material is defined as the mass of liquid applied to the material times the purity of the contaminant in the liquid.
Many of the calculations and data comparisons to requirements require knowing the mass of contaminant analyte delivered to determine decontamination performance.
The mass of contaminant delivered is confirmed through the analysis of the DCS.
For example, Chemical Agent Standard Analytical Reference Materials (CASARM) high purity grade VX has a purity (Ψ) of 89.5% and a density (ρ) of 1.0083 g/mL. The target amount of analyte for a 1 g/m
2 starting challenge applied as two
1.0 µL droplets would be ρ × 0.002 mL × Ψ = 0.001805 g = 1,805,000 ng. The mass delivered as determined by the DCS samples should be 1,805,000 ± 15% (±270,000 ng).
Starting Challenge:
The mass of liquid delivered to the surface should reproducibly applied and preferably be within 15% of the target amount.
Starting challenge is a common metric stated in requirement documents that specifies how much liquid contaminant is delivered to a material in grams per square meter.
If a volumetric tool is used for contaminant delivery, the mass is determined by the volume times the liquid density. If a gravimetric technique (e.g., a microbalance) is used to measure the mass of applied liquid, the measured mass can be evaluated.
The quantity of contaminant delivered to a material may be adjusted due to experimental constraints. For example, the density of HD results in a starting challenge of 1.25 g/m
2 if
2.0 µL of contaminant is delivered to a 2.0 in diameter disk. A survey of available tools indicates that very few tools can reproducibly deliver less than 1.0 µL droplets at the scale required for panel testing.
Contaminant-Material Interaction Aging Period – Controlled Temperature: The moderate condition study specifies a temperature of 21 ± 3 °C, with ±5 °C maximum. The variable temperature study should maintain target temperature ±3 °C, with ±5 °C maximum.
Changes in temperature directly affect the amount of contaminant absorbed into a material. Deviations in the temperature may induce bias in the data. The sensitivity of test data to the temperature varies with contaminant-material-decontaminant combination. The effects of this variation may range from none to significant. For example, mass transport and chemical reaction coefficients typically double for every 10 °C increase in temperature.
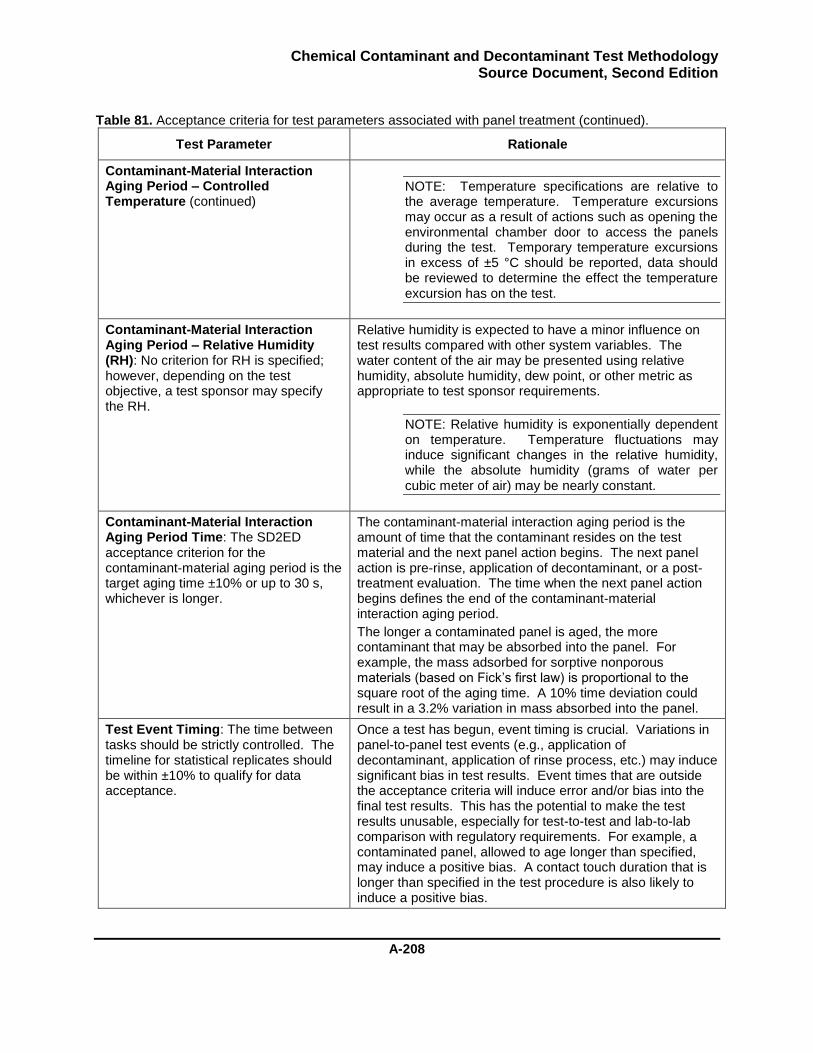
Chemical Contaminant and Decontaminant Test Methodology Source Document, Second Edition
A-208
Table 81. Acceptance criteria for test parameters associated with panel treatment (continued).
Test Parameter Rationale
Contaminant-Material Interaction Aging Period – Controlled Temperature (continued)
NOTE: Temperature specifications are relative to the average temperature. Temperature excursions may occur as a result of actions such as opening the environmental chamber door to access the panels during the test. Temporary temperature excursions in excess of ±5 °C should be reported, data should be reviewed to determine the effect the temperature excursion has on the test.
Contaminant-Material Interaction Aging Period – Relative Humidity (RH): No criterion for RH is specified; however, depending on the test objective, a test sponsor may specify the RH.
Relative humidity is expected to have a minor influence on test results compared with other system variables. The water content of the air may be presented using relative humidity, absolute humidity, dew point, or other metric as appropriate to test sponsor requirements.
NOTE: Relative humidity is exponentially dependent on temperature. Temperature fluctuations may induce significant changes in the relative humidity, while the absolute humidity (grams of water per cubic meter of air) may be nearly constant.
Contaminant-Material Interaction Aging Period Time: The SD2ED acceptance criterion for the contaminant-material aging period is the target aging time ±10% or up to 30 s, whichever is longer.
The contaminant-material interaction aging period is the amount of time that the contaminant resides on the test material and the next panel action begins. The next panel action is pre-rinse, application of decontaminant, or a post-treatment evaluation. The time when the next panel action begins defines the end of the contaminant-material interaction aging period.
The longer a contaminated panel is aged, the more contaminant that may be absorbed into the panel. For example, the mass adsorbed for sorptive nonporous materials (based on Fick’s first law) is proportional to the square root of the aging time. A 10% time deviation could result in a 3.2% variation in mass absorbed into the panel.
Test Event Timing: The time between tasks should be strictly controlled. The timeline for statistical replicates should be within ±10% to qualify for data acceptance.
Once a test has begun, event timing is crucial. Variations in panel-to-panel test events (e.g., application of decontaminant, application of rinse process, etc.) may induce significant bias in test results. Event times that are outside the acceptance criteria will induce error and/or bias into the final test results. This has the potential to make the test results unusable, especially for test-to-test and lab-to-lab comparison with regulatory requirements. For example, a contaminated panel, allowed to age longer than specified, may induce a positive bias. A contact touch duration that is longer than specified in the test procedure is also likely to induce a positive bias.
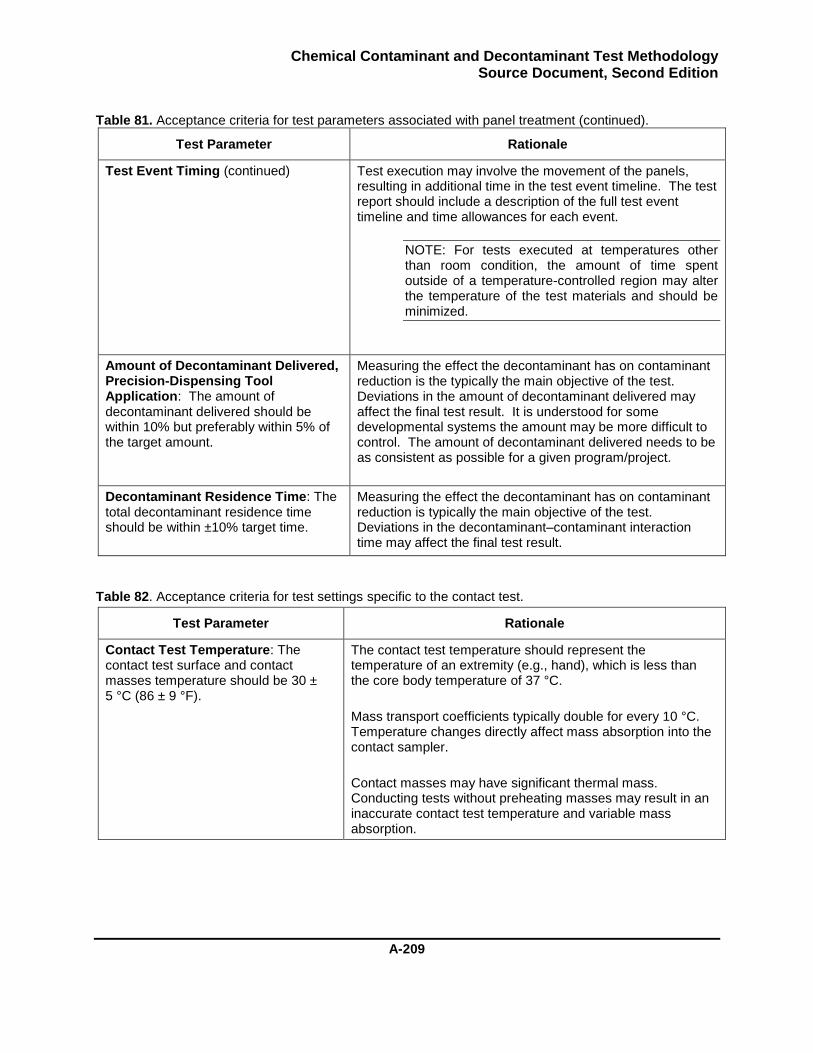
Chemical Contaminant and Decontaminant Test Methodology Source Document, Second Edition
A-209
Table 81. Acceptance criteria for test parameters associated with panel treatment (continued).
Test Parameter Rationale
Test Event Timing (continued)
Test execution may involve the movement of the panels, resulting in additional time in the test event timeline. The test report should include a description of the full test event timeline and time allowances for each event.
NOTE: For tests executed at temperatures other than room condition, the amount of time spent outside of a temperature-controlled region may alter the temperature of the test materials and should be minimized.
Amount of Decontaminant Delivered, Precision-Dispensing Tool Application: The amount of decontaminant delivered should be within 10% but preferably within 5% of the target amount.
Measuring the effect the decontaminant has on contaminant reduction is the typically the main objective of the test. Deviations in the amount of decontaminant delivered may affect the final test result. It is understood for some developmental systems the amount may be more difficult to control. The amount of decontaminant delivered needs to be as consistent as possible for a given program/project.
Decontaminant Residence Time: The total decontaminant residence time should be within ±10% target time.
Measuring the effect the decontaminant has on contaminant reduction is typically the main objective of the test. Deviations in the decontaminant–contaminant interaction time may affect the final test result.
Table 82. Acceptance criteria for test settings specific to the contact test.
Test Parameter Rationale
Contact Test Temperature: The contact test surface and contact masses temperature should be 30 ± 5 °C (86 ± 9 °F).
The contact test temperature should represent the temperature of an extremity (e.g., hand), which is less than the core body temperature of 37 °C.
Mass transport coefficients typically double for every 10 °C. Temperature changes directly affect mass absorption into the contact sampler.
Contact masses may have significant thermal mass. Conducting tests without preheating masses may result in an inaccurate contact test temperature and variable mass absorption.
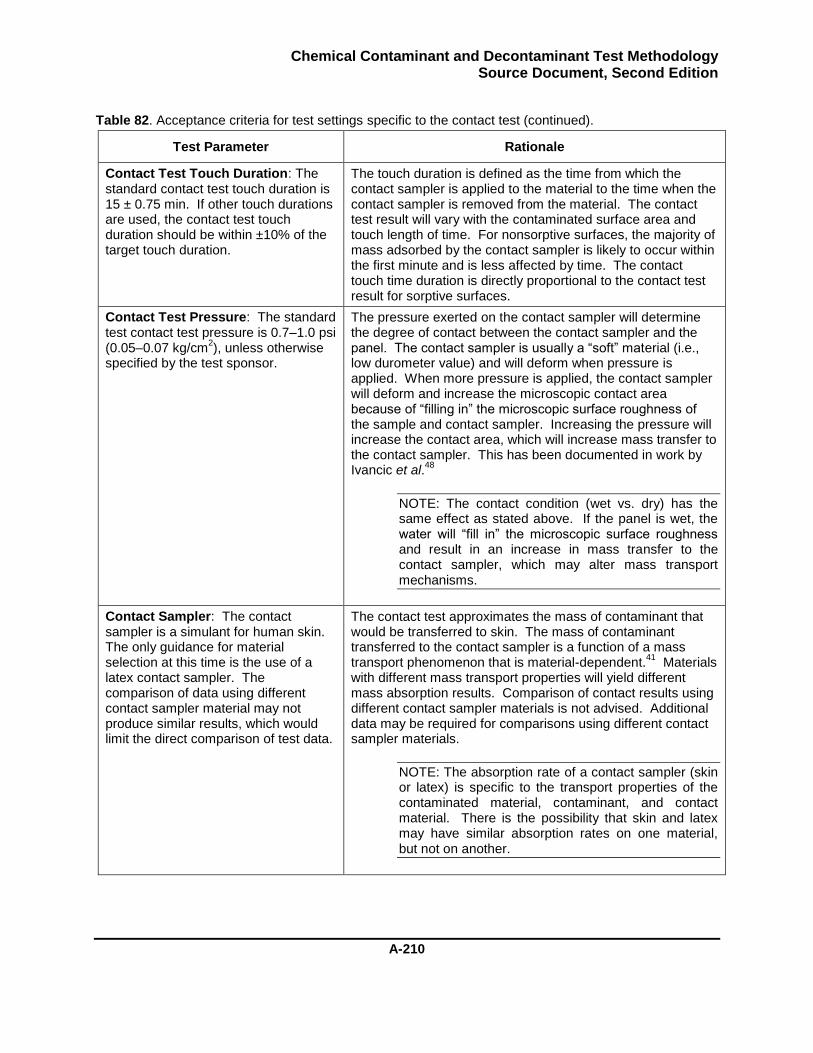
Chemical Contaminant and Decontaminant Test Methodology Source Document, Second Edition
A-210
Table 82. Acceptance criteria for test settings specific to the contact test (continued).
Test Parameter Rationale
Contact Test Touch Duration: The standard contact test touch duration is 15 ± 0.75 min. If other touch durations are used, the contact test touch duration should be within ±10% of the target touch duration.
The touch duration is defined as the time from which the contact sampler is applied to the material to the time when the contact sampler is removed from the material. The contact test result will vary with the contaminated surface area and touch length of time. For nonsorptive surfaces, the majority of mass adsorbed by the contact sampler is likely to occur within the first minute and is less affected by time. The contact touch time duration is directly proportional to the contact test result for sorptive surfaces.
Contact Test Pressure: The standard test contact test pressure is 0.7–1.0 psi (0.05–0.07 kg/cm
2), unless otherwise
specified by the test sponsor.
The pressure exerted on the contact sampler will determine the degree of contact between the contact sampler and the panel. The contact sampler is usually a “soft” material (i.e., low durometer value) and will deform when pressure is applied. When more pressure is applied, the contact sampler will deform and increase the microscopic contact area because of “filling in” the microscopic surface roughness of the sample and contact sampler. Increasing the pressure will increase the contact area, which will increase mass transfer to the contact sampler. This has been documented in work by Ivancic et al.
48
NOTE: The contact condition (wet vs. dry) has the same effect as stated above. If the panel is wet, the water will “fill in” the microscopic surface roughness and result in an increase in mass transfer to the contact sampler, which may alter mass transport mechanisms.
Contact Sampler: The contact sampler is a simulant for human skin. The only guidance for material selection at this time is the use of a latex contact sampler. The comparison of data using different contact sampler material may not produce similar results, which would limit the direct comparison of test data.
The contact test approximates the mass of contaminant that would be transferred to skin. The mass of contaminant transferred to the contact sampler is a function of a mass transport phenomenon that is material-dependent.
41 Materials
with different mass transport properties will yield different mass absorption results. Comparison of contact results using different contact sampler materials is not advised. Additional data may be required for comparisons using different contact sampler materials.
NOTE: The absorption rate of a contact sampler (skin or latex) is specific to the transport properties of the contaminated material, contaminant, and contact material. There is the possibility that skin and latex may have similar absorption rates on one material, but not on another.
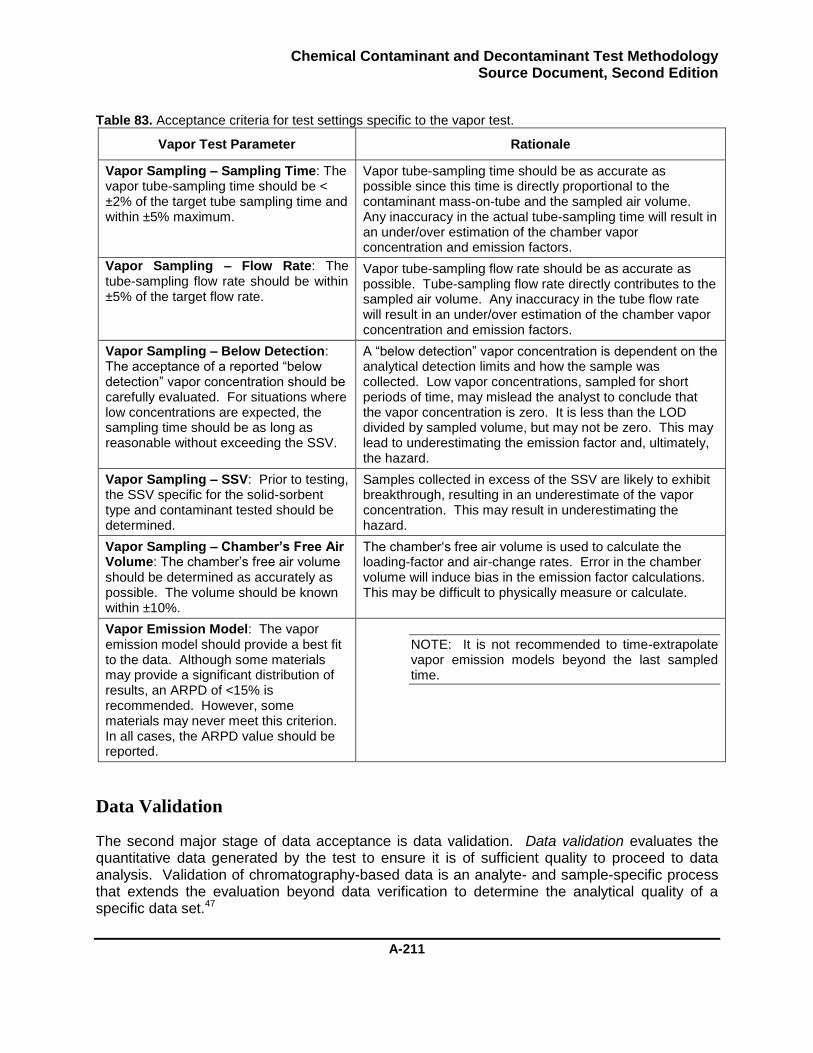
Chemical Contaminant and Decontaminant Test Methodology Source Document, Second Edition
A-211
Table 83. Acceptance criteria for test settings specific to the vapor test.
Vapor Test Parameter Rationale
Vapor Sampling – Sampling Time: The vapor tube-sampling time should be < ±2% of the target tube sampling time and within ±5% maximum.
Vapor tube-sampling time should be as accurate as possible since this time is directly proportional to the contaminant mass-on-tube and the sampled air volume. Any inaccuracy in the actual tube-sampling time will result in an under/over estimation of the chamber vapor concentration and emission factors.
Vapor Sampling – Flow Rate: The tube-sampling flow rate should be within ±5% of the target flow rate.
Vapor tube-sampling flow rate should be as accurate as possible. Tube-sampling flow rate directly contributes to the sampled air volume. Any inaccuracy in the tube flow rate will result in an under/over estimation of the chamber vapor concentration and emission factors.
Vapor Sampling – Below Detection: The acceptance of a reported “below detection” vapor concentration should be carefully evaluated. For situations where low concentrations are expected, the sampling time should be as long as reasonable without exceeding the SSV.
A “below detection” vapor concentration is dependent on the analytical detection limits and how the sample was collected. Low vapor concentrations, sampled for short periods of time, may mislead the analyst to conclude that the vapor concentration is zero. It is less than the LOD divided by sampled volume, but may not be zero. This may lead to underestimating the emission factor and, ultimately, the hazard.
Vapor Sampling – SSV: Prior to testing, the SSV specific for the solid-sorbent type and contaminant tested should be determined.
Samples collected in excess of the SSV are likely to exhibit breakthrough, resulting in an underestimate of the vapor concentration. This may result in underestimating the hazard.
Vapor Sampling – Chamber’s Free Air Volume: The chamber’s free air volume should be determined as accurately as possible. The volume should be known within ±10%.
The chamber‘s free air volume is used to calculate the loading-factor and air-change rates. Error in the chamber volume will induce bias in the emission factor calculations. This may be difficult to physically measure or calculate.
Vapor Emission Model: The vapor emission model should provide a best fit to the data. Although some materials may provide a significant distribution of results, an ARPD of <15% is recommended. However, some materials may never meet this criterion. In all cases, the ARPD value should be reported.
NOTE: It is not recommended to time-extrapolate vapor emission models beyond the last sampled time.
Data Validation
The second major stage of data acceptance is data validation. Data validation evaluates the quantitative data generated by the test to ensure it is of sufficient quality to proceed to data analysis. Validation of chromatography-based data is an analyte- and sample-specific process that extends the evaluation beyond data verification to determine the analytical quality of a specific data set.47
Chemical Contaminant and Decontaminant Test Methodology Source Document, Second Edition
A-212
Data Validation of Chromatography Data
Chromatography systems are used generate the vast majority of quantitative data produced by the use of the Source Document (SD2ED) methodology. Many factors contribute to the confident quantitative analysis of an analyte in a sample matrix. The process of chromatography data validation ensures that there is confidence in the reported value (i.e., the reported value accurately reflects the quantity of analyte in the sample).
Validating data requires review of all aspects of the analytical process in the acquisition of data. This review to ensure that the analytical processes were correct will validate and give confidence in the final data. Many components of data validation are addressed in the analytical guidance section “Prerequisite Tasks for Confident Analysis of Liquid and Vapor Samples” on page A-66. Prerequisite tasks such as interference evaluations, solvent recovery, time between sample generation and analysis, and the determination of calibration model and weighting for a particular chromatography platform all contribute to the ability to confidently quantify analyte in test samples.
Typically, data validation occurs for each set of data collected. There are many factors to consider when validating a set of data to ensure that each data point is valid. Table 84 provides a list of data validation parameters and the rationale for the specifications.
If the data validation process identifies parameters that may introduce doubt as to the quality of the data, an assignable cause may be investigated to determine if the deviation requires further action. Further actions may include rerunning the extraction sample on the chromatography platform or regenerating (e.g., rediluting) the sample from an original sample extract solution. The assignable cause investigation may find a clear indication as to the cause of the deviation and, depending on the scope of the deviation, may lead to such actions as sample re-analysis, data point exclusion, or data set failure. Sample analysis results should not be rejected without assignable cause. Therefore, if a sample result is identified as an outlying data point without assignable cause, it is noted and accepted. Once the data validation process is complete, the data is considered of sufficient quality for further use and for including in reports.
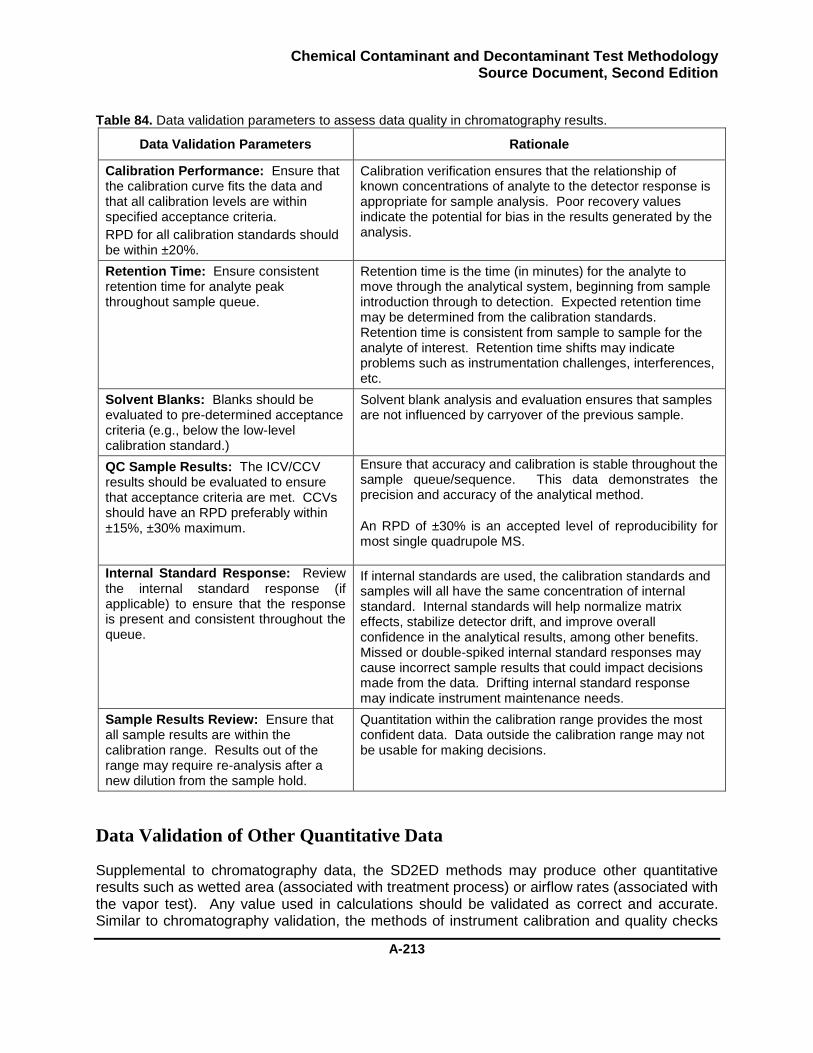
Chemical Contaminant and Decontaminant Test Methodology Source Document, Second Edition
A-213
Table 84. Data validation parameters to assess data quality in chromatography results.
Data Validation Parameters Rationale
Calibration Performance: Ensure that the calibration curve fits the data and that all calibration levels are within specified acceptance criteria.
RPD for all calibration standards should be within ±20%.
Calibration verification ensures that the relationship of known concentrations of analyte to the detector response is appropriate for sample analysis. Poor recovery values indicate the potential for bias in the results generated by the analysis.
Retention Time: Ensure consistent retention time for analyte peak throughout sample queue.
Retention time is the time (in minutes) for the analyte to move through the analytical system, beginning from sample introduction through to detection. Expected retention time may be determined from the calibration standards. Retention time is consistent from sample to sample for the analyte of interest. Retention time shifts may indicate problems such as instrumentation challenges, interferences, etc.
Solvent Blanks: Blanks should be evaluated to pre-determined acceptance criteria (e.g., below the low-level calibration standard.)
Solvent blank analysis and evaluation ensures that samples are not influenced by carryover of the previous sample.
QC Sample Results: The ICV/CCV results should be evaluated to ensure that acceptance criteria are met. CCVs should have an RPD preferably within ±15%, ±30% maximum.
Ensure that accuracy and calibration is stable throughout the sample queue/sequence. This data demonstrates the precision and accuracy of the analytical method.
An RPD of ±30% is an accepted level of reproducibility for most single quadrupole MS.
Internal Standard Response: Review the internal standard response (if applicable) to ensure that the response is present and consistent throughout the queue.
If internal standards are used, the calibration standards and samples will all have the same concentration of internal standard. Internal standards will help normalize matrix effects, stabilize detector drift, and improve overall confidence in the analytical results, among other benefits. Missed or double-spiked internal standard responses may cause incorrect sample results that could impact decisions made from the data. Drifting internal standard response may indicate instrument maintenance needs.
Sample Results Review: Ensure that all sample results are within the calibration range. Results out of the range may require re-analysis after a new dilution from the sample hold.
Quantitation within the calibration range provides the most confident data. Data outside the calibration range may not be usable for making decisions.
Data Validation of Other Quantitative Data
Supplemental to chromatography data, the SD2ED methods may produce other quantitative results such as wetted area (associated with treatment process) or airflow rates (associated with the vapor test). Any value used in calculations should be validated as correct and accurate. Similar to chromatography validation, the methods of instrument calibration and quality checks
Chemical Contaminant and Decontaminant Test Methodology Source Document, Second Edition
A-214
should be reviewed to ensure that measured values are correct and accurate before use in analysis or calculations.
Data Acceptance
Upon completion of data verification and validation, the data meeting the verification and validation requirements can be accepted as fit-for-use for further data calculations and reporting.
Some project documents may specify the desired test error (i.e., variance in the data). Industrial cases have been documented where a test method has a verified test error of <10%; however, when specific materials are tested, test errors >100% can be observed.49 The large test error is not always an indication of a poorly executed test, but may indicate that the material or process under test is highly variable. Large variances observed in decontaminant testing results should be evaluated to ensure the test was executed correctly and determine whether the variance is a result of material variability. If the test was executed incorrectly, the test should be repeated. If the large variance is determined to be material variability, the observation and supporting data should be reported.
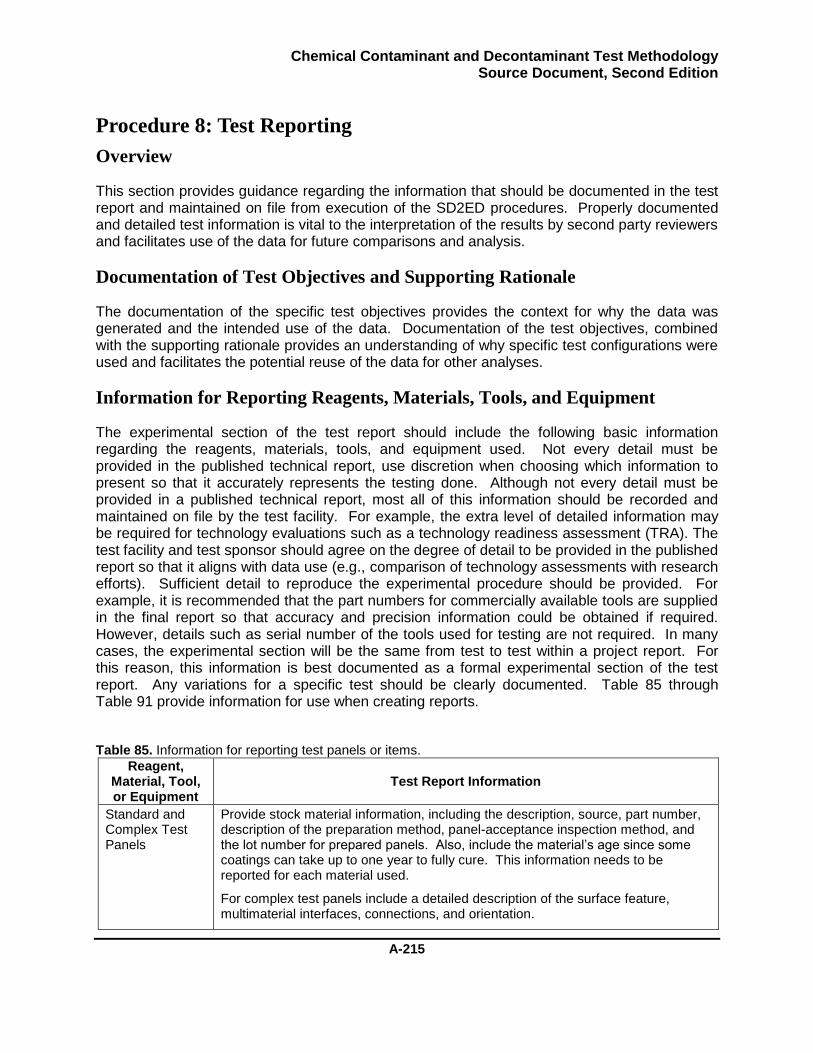
Chemical Contaminant and Decontaminant Test Methodology Source Document, Second Edition
A-215
Procedure 8: Test Reporting
Overview
This section provides guidance regarding the information that should be documented in the test report and maintained on file from execution of the SD2ED procedures. Properly documented and detailed test information is vital to the interpretation of the results by second party reviewers and facilitates use of the data for future comparisons and analysis.
Documentation of Test Objectives and Supporting Rationale
The documentation of the specific test objectives provides the context for why the data was generated and the intended use of the data. Documentation of the test objectives, combined with the supporting rationale provides an understanding of why specific test configurations were used and facilitates the potential reuse of the data for other analyses.
Information for Reporting Reagents, Materials, Tools, and Equipment
The experimental section of the test report should include the following basic information regarding the reagents, materials, tools, and equipment used. Not every detail must be provided in the published technical report, use discretion when choosing which information to present so that it accurately represents the testing done. Although not every detail must be provided in a published technical report, most all of this information should be recorded and maintained on file by the test facility. For example, the extra level of detailed information may be required for technology evaluations such as a technology readiness assessment (TRA). The test facility and test sponsor should agree on the degree of detail to be provided in the published report so that it aligns with data use (e.g., comparison of technology assessments with research efforts). Sufficient detail to reproduce the experimental procedure should be provided. For example, it is recommended that the part numbers for commercially available tools are supplied in the final report so that accuracy and precision information could be obtained if required. However, details such as serial number of the tools used for testing are not required. In many cases, the experimental section will be the same from test to test within a project report. For this reason, this information is best documented as a formal experimental section of the test report. Any variations for a specific test should be clearly documented. Table 85 through Table 91 provide information for use when creating reports.
Table 85. Information for reporting test panels or items.
Reagent, Material, Tool, or Equipment
Test Report Information
Standard and Complex Test Panels
Provide stock material information, including the description, source, part number, description of the preparation method, panel-acceptance inspection method, and the lot number for prepared panels. Also, include the material’s age since some coatings can take up to one year to fully cure. This information needs to be reported for each material used.
For complex test panels include a detailed description of the surface feature, multimaterial interfaces, connections, and orientation.

Chemical Contaminant and Decontaminant Test Methodology Source Document, Second Edition
A-216
Table 86. Information for reporting reagent, materials, tools, and equipment used for panel treatment contamination and contaminant-material interaction aging period procedures.
Reagent, Material, Tool, or Equipment
Test Report Information
Contaminant Provide the contaminant name, source, purity, and lot number for each contaminant used.
Contaminant Delivery Tool: Pipette, Syringe and Automated Liquid-dispensing Systems
Provide:
Tool identification, including manufacturer, model number, and volume-dispensing range.
Tool performance specifications, including accuracy and any other conformance specifications (e.g., ISO 8655 or ASTM E1154).
Calibration status, which may include a general description of the test facility process for ensuring that the tools used are calibrated or the due date of the next calibration (which should be maintained on file). The report should provide an overview of the test facility calibration practices.
Contaminant Delivery Tool: Aerosol-generation Systems and Other Applicators
For developmental items or tools without a performance specification standard, provide the following information: tool description, source, test facility-determined accuracy and precision, and a description of how tool reproducibility from test to test is ensured.
Environmental Chamber
Provide a description of the chamber including the manufacturer and model number for commercial items or a description for fabricated systems. If a data logger is used, include the data logging frequency.
Contaminated Area: Photographic Tool
Provide tool identification, including the manufacturer, model number, and camera resolution.
Contaminated Area: Quantitation Standard
Describe the area measurement calculation, use of calibration sources, and associated error with calculation, if known.
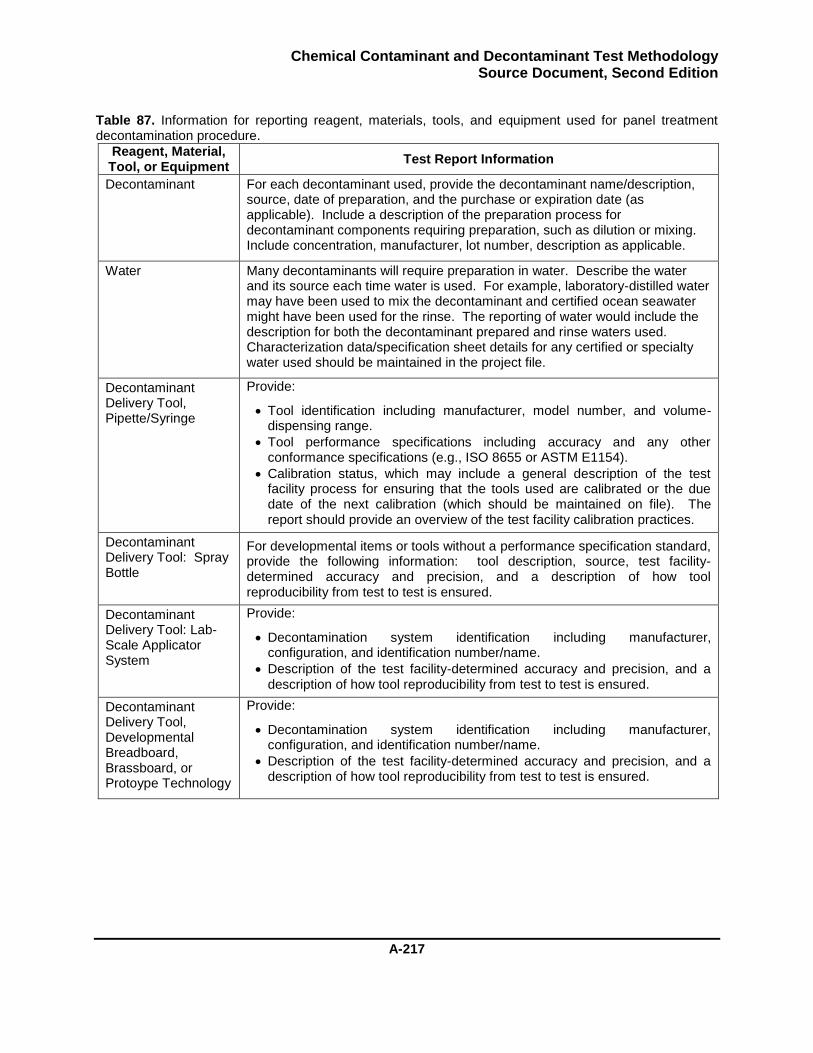
Chemical Contaminant and Decontaminant Test Methodology Source Document, Second Edition
A-217
Table 87. Information for reporting reagent, materials, tools, and equipment used for panel treatment decontamination procedure.
Reagent, Material, Tool, or Equipment
Test Report Information
Decontaminant For each decontaminant used, provide the decontaminant name/description, source, date of preparation, and the purchase or expiration date (as applicable). Include a description of the preparation process for decontaminant components requiring preparation, such as dilution or mixing. Include concentration, manufacturer, lot number, description as applicable.
Water Many decontaminants will require preparation in water. Describe the water and its source each time water is used. For example, laboratory-distilled water may have been used to mix the decontaminant and certified ocean seawater might have been used for the rinse. The reporting of water would include the description for both the decontaminant prepared and rinse waters used. Characterization data/specification sheet details for any certified or specialty water used should be maintained in the project file.
Decontaminant Delivery Tool, Pipette/Syringe
Provide:
Tool identification including manufacturer, model number, and volume-dispensing range.
Tool performance specifications including accuracy and any other conformance specifications (e.g., ISO 8655 or ASTM E1154).
Calibration status, which may include a general description of the test facility process for ensuring that the tools used are calibrated or the due date of the next calibration (which should be maintained on file). The report should provide an overview of the test facility calibration practices.
Decontaminant Delivery Tool: Spray Bottle
For developmental items or tools without a performance specification standard, provide the following information: tool description, source, test facility-determined accuracy and precision, and a description of how tool reproducibility from test to test is ensured.
Decontaminant Delivery Tool: Lab-Scale Applicator System
Provide:
Decontamination system identification including manufacturer, configuration, and identification number/name.
Description of the test facility-determined accuracy and precision, and a description of how tool reproducibility from test to test is ensured.
Decontaminant Delivery Tool, Developmental Breadboard, Brassboard, or Protoype Technology
Provide:
Decontamination system identification including manufacturer, configuration, and identification number/name.
Description of the test facility-determined accuracy and precision, and a description of how tool reproducibility from test to test is ensured.
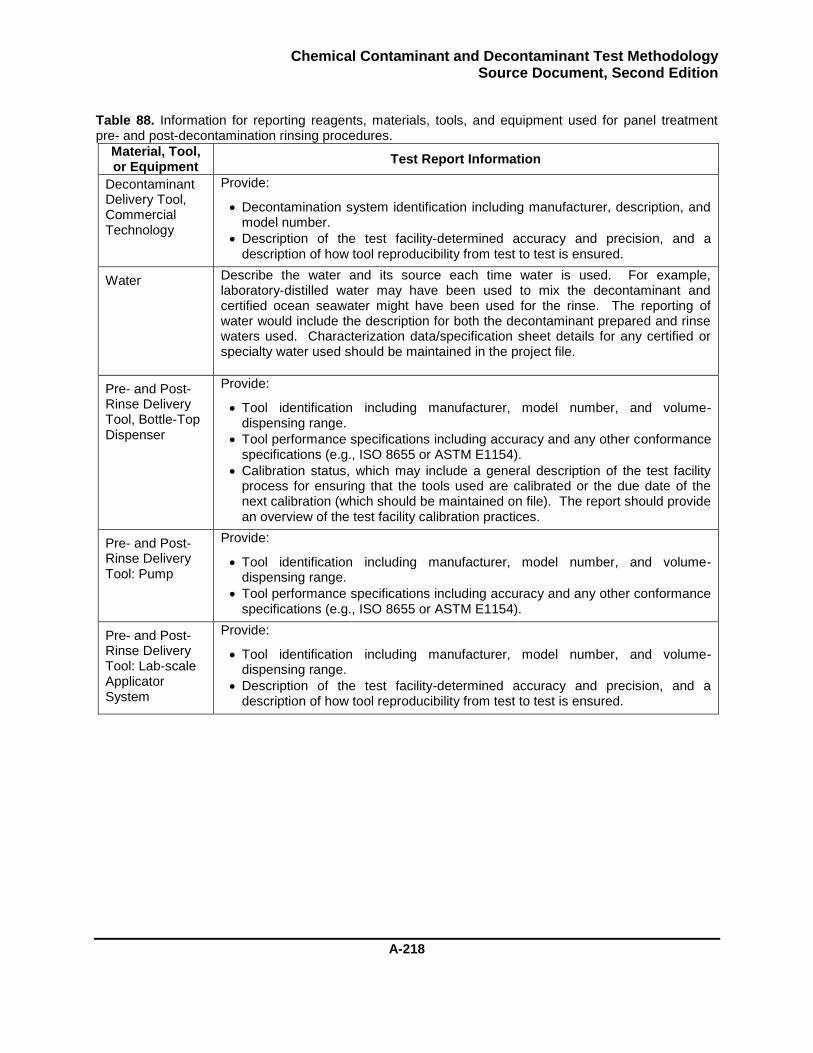
Chemical Contaminant and Decontaminant Test Methodology Source Document, Second Edition
A-218
Table 88. Information for reporting reagents, materials, tools, and equipment used for panel treatment pre- and post-decontamination rinsing procedures.
Material, Tool, or Equipment
Test Report Information
Decontaminant Delivery Tool, Commercial Technology
Provide:
Decontamination system identification including manufacturer, description, and model number.
Description of the test facility-determined accuracy and precision, and a description of how tool reproducibility from test to test is ensured.
Water Describe the water and its source each time water is used. For example, laboratory-distilled water may have been used to mix the decontaminant and certified ocean seawater might have been used for the rinse. The reporting of water would include the description for both the decontaminant prepared and rinse waters used. Characterization data/specification sheet details for any certified or specialty water used should be maintained in the project file.
Pre- and Post-Rinse Delivery Tool, Bottle-Top Dispenser
Provide:
Tool identification including manufacturer, model number, and volume-dispensing range.
Tool performance specifications including accuracy and any other conformance specifications (e.g., ISO 8655 or ASTM E1154).
Calibration status, which may include a general description of the test facility process for ensuring that the tools used are calibrated or the due date of the next calibration (which should be maintained on file). The report should provide an overview of the test facility calibration practices.
Pre- and Post-Rinse Delivery Tool: Pump
Provide:
Tool identification including manufacturer, model number, and volume-dispensing range.
Tool performance specifications including accuracy and any other conformance specifications (e.g., ISO 8655 or ASTM E1154).
Pre- and Post-Rinse Delivery Tool: Lab-scale Applicator System
Provide:
Tool identification including manufacturer, model number, and volume-dispensing range.
Description of the test facility-determined accuracy and precision, and a description of how tool reproducibility from test to test is ensured.
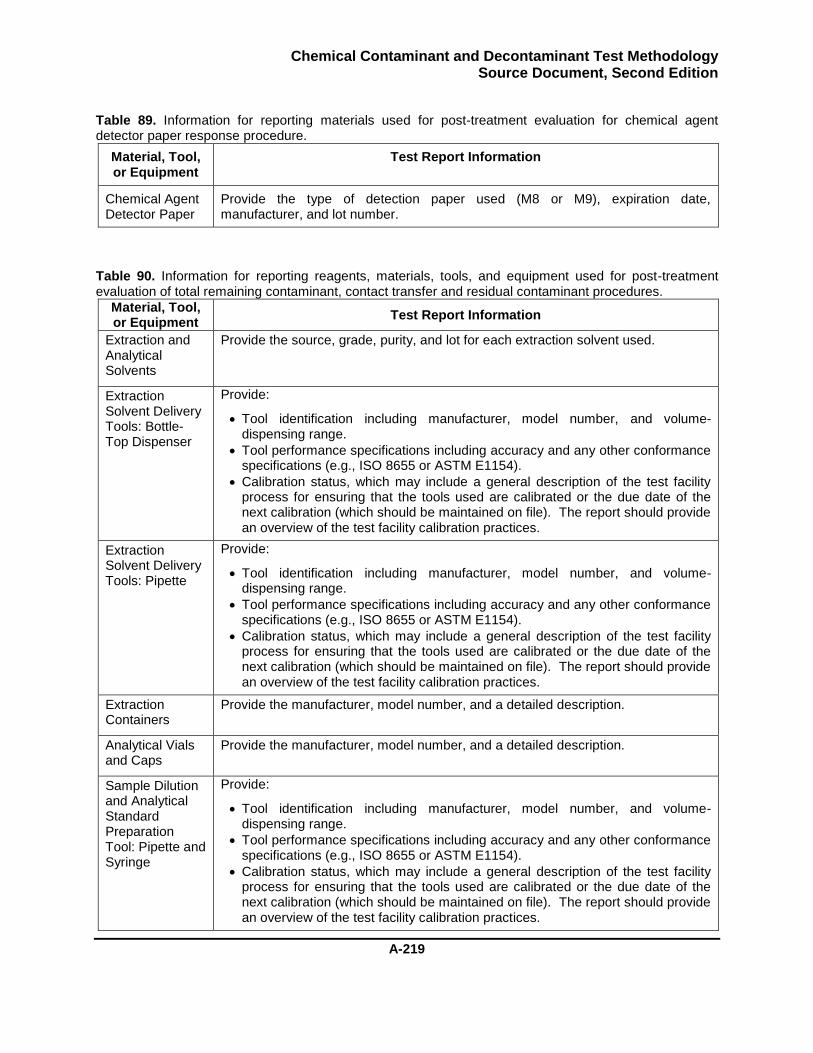
Chemical Contaminant and Decontaminant Test Methodology Source Document, Second Edition
A-219
Table 89. Information for reporting materials used for post-treatment evaluation for chemical agent detector paper response procedure.
Material, Tool, or Equipment
Test Report Information
Chemical Agent Detector Paper
Provide the type of detection paper used (M8 or M9), expiration date, manufacturer, and lot number.
Table 90. Information for reporting reagents, materials, tools, and equipment used for post-treatment evaluation of total remaining contaminant, contact transfer and residual contaminant procedures.
Material, Tool, or Equipment
Test Report Information
Extraction and Analytical Solvents
Provide the source, grade, purity, and lot for each extraction solvent used.
Extraction Solvent Delivery Tools: Bottle-Top Dispenser
Provide:
Tool identification including manufacturer, model number, and volume-dispensing range.
Tool performance specifications including accuracy and any other conformance specifications (e.g., ISO 8655 or ASTM E1154).
Calibration status, which may include a general description of the test facility process for ensuring that the tools used are calibrated or the due date of the next calibration (which should be maintained on file). The report should provide an overview of the test facility calibration practices.
Extraction Solvent Delivery Tools: Pipette
Provide:
Tool identification including manufacturer, model number, and volume-dispensing range.
Tool performance specifications including accuracy and any other conformance specifications (e.g., ISO 8655 or ASTM E1154).
Calibration status, which may include a general description of the test facility process for ensuring that the tools used are calibrated or the due date of the next calibration (which should be maintained on file). The report should provide an overview of the test facility calibration practices.
Extraction Containers
Provide the manufacturer, model number, and a detailed description.
Analytical Vials and Caps
Provide the manufacturer, model number, and a detailed description.
Sample Dilution and Analytical Standard Preparation Tool: Pipette and Syringe
Provide:
Tool identification including manufacturer, model number, and volume-dispensing range.
Tool performance specifications including accuracy and any other conformance specifications (e.g., ISO 8655 or ASTM E1154).
Calibration status, which may include a general description of the test facility process for ensuring that the tools used are calibrated or the due date of the next calibration (which should be maintained on file). The report should provide an overview of the test facility calibration practices.

Chemical Contaminant and Decontaminant Test Methodology Source Document, Second Edition
A-220
Table 90. Information for reporting reagents, materials, tools, and equipment used for post-treatment evaluation of total remaining contaminant, contact transfer and residual contaminant procedures (continued).
Material, Tool, or Equipment
Test Report Information
Sample Dilution and Analytical Standard Preparation Tool: Volumetric Glassware
Provide:
Tool identification including manufacturer, model number, and volume-dispensing range.
Tool performance specifications including accuracy and any other conformance specifications (e.g., ISO 8655 or ASTM E1154).
Analytical Chromatography Platform
Provide a description of the entire unit’s configuration including the description for major components (e.g., detector, injection system, etc.), manufacturer, and model number.
Temperature-Controlled Surface
Provide tool identification including the manufacturer and model number, and tool performance specifications, if available.
Contact Mass Provide the description including size, shape, material, and weight.
Contact Sampler Include the source, description (including nominal thickness), part number, lot, and any preparation or treatment performed (e.g., washing).
Optional Items Identify any optional items used in the testing including manufacturer and model number, and tool performance specifications and describe how the item was used in the studies.
Table 91. Information for reporting reagents, materials, tools, and equipment used for post-treatment evaluation of vapor emission.
Reagents, Material, Tool, or Equipment
Test Report Information
Solid-Sorbent Tubes
Include the source, description, part number, sorbent depth, sorbent mesh size, and sorbent type for the tubes used.
Solid-Sorbent Tube Spiking Solutions
Provide solution concentrations, contaminant, solvent-grade, lot number, and preparation method,
Dynamic Vapor Chamber
Provide a description of the chamber including the manufacturer and model number for commercial items or a description for fabricated systems.
Airflow Measurement
Provide a description of the hardware used to measure airflow including type of device (e.g., mass flow controller, rotameter, piston type flow meter, etc.), manufacturer, part number, and calibration range.
Optional Items Any optional items used in the testing should be identified including manufacturer and model number, tool performance specifications, and a description of how the item was used in the studies.

Chemical Contaminant and Decontaminant Test Methodology Source Document, Second Edition
A-221
Reporting Information from the Specific Test Procedures
The test-specific reporting requirements capture the information during the test that must be documented in the technical report or maintained on file. This information is best captured with the test results in the test report (see Table 92 through Table 95). For test programs where many parameters (e.g., option selection, drying process, etc.) may be identical from test to test, the repetitive information can be documented as part of the experimental section to conserve space.
Table 92. Information for reporting the test summary.
Action Test Report Information
Detailed test summary of sampling handling
Describe the overall process performed including the test location and any sample-transporting or other timing factors that could affect contaminant distribution and decontaminant performance. Experimental summary should provide processes used to ensure that panels were treated identically for multiple panel tests. All deviations from the published procedure must be documented for full data context.
Table 93. Information for reporting test events.
Action Test Report Information
Panel Preconditioning
Provide:
Option used.
Description of how the conditioning was performed.
Length of preconditioning time.
Temperature average with standard deviation, high, and low for conditioning period.
Humidity average with standard deviation, high, and low for conditioning period.
Identification and discussion of any temperature or humidity excursions to include excursion the value, duration, and suspected cause.
Contamination Procedure
Provide:
Option used.
Contamination density (in grams per square meter).
Total contaminant volume.
Contaminant drop volume size(s).
Description of the drop-deposition pattern for contamination using more than one applied drop. A drawing or photograph is recommended.
Description of the contaminant handling. For example, if the contaminant is applied “cold” or “warm”, provide a description of how the contaminant was chilled or warmed. If the contaminant was warmed to room temperature then applied, note as such.
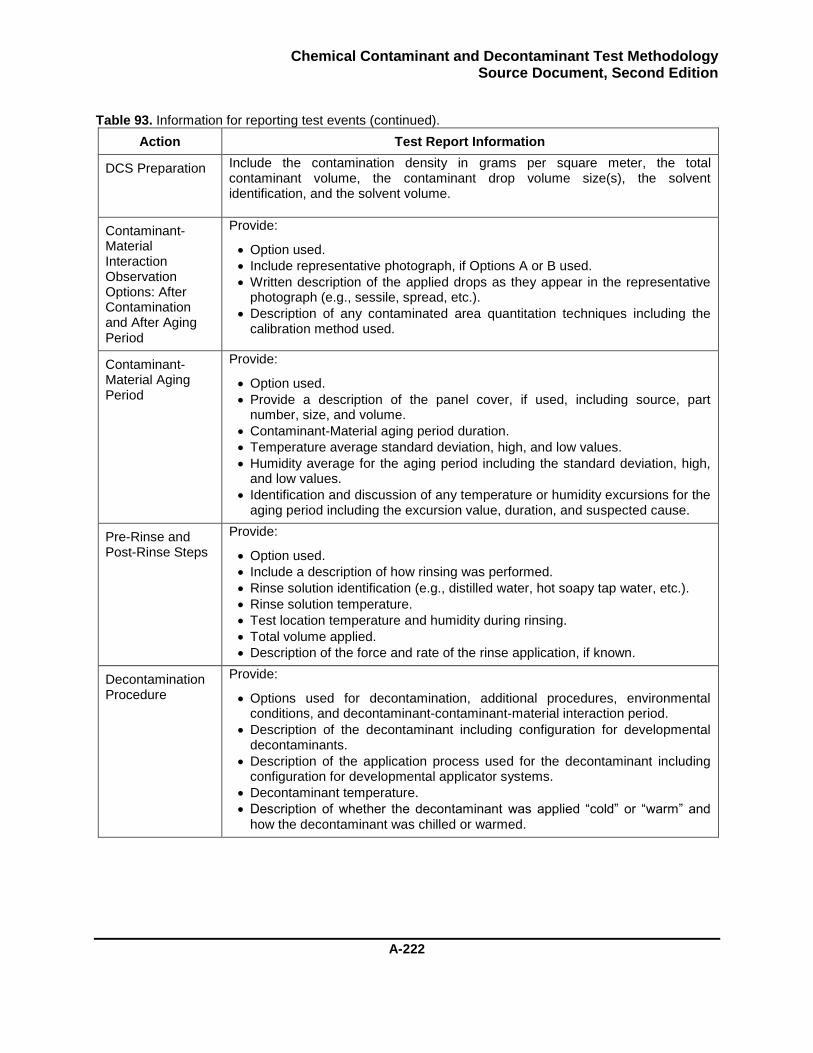
Chemical Contaminant and Decontaminant Test Methodology Source Document, Second Edition
A-222
Table 93. Information for reporting test events (continued).
Action Test Report Information
DCS Preparation Include the contamination density in grams per square meter, the total contaminant volume, the contaminant drop volume size(s), the solvent identification, and the solvent volume.
Contaminant-Material Interaction Observation Options: After Contamination and After Aging Period
Provide:
Option used.
Include representative photograph, if Options A or B used.
Written description of the applied drops as they appear in the representative photograph (e.g., sessile, spread, etc.).
Description of any contaminated area quantitation techniques including the calibration method used.
Contaminant-Material Aging Period
Provide:
Option used.
Provide a description of the panel cover, if used, including source, part number, size, and volume.
Contaminant-Material aging period duration.
Temperature average standard deviation, high, and low values.
Humidity average for the aging period including the standard deviation, high, and low values.
Identification and discussion of any temperature or humidity excursions for the aging period including the excursion value, duration, and suspected cause.
Pre-Rinse and Post-Rinse Steps
Provide:
Option used.
Include a description of how rinsing was performed.
Rinse solution identification (e.g., distilled water, hot soapy tap water, etc.).
Rinse solution temperature.
Test location temperature and humidity during rinsing.
Total volume applied.
Description of the force and rate of the rinse application, if known.
Decontamination Procedure
Provide:
Options used for decontamination, additional procedures, environmental conditions, and decontaminant-contaminant-material interaction period.
Description of the decontaminant including configuration for developmental decontaminants.
Description of the application process used for the decontaminant including configuration for developmental applicator systems.
Decontaminant temperature.
Description of whether the decontaminant was applied “cold” or “warm” and how the decontaminant was chilled or warmed.
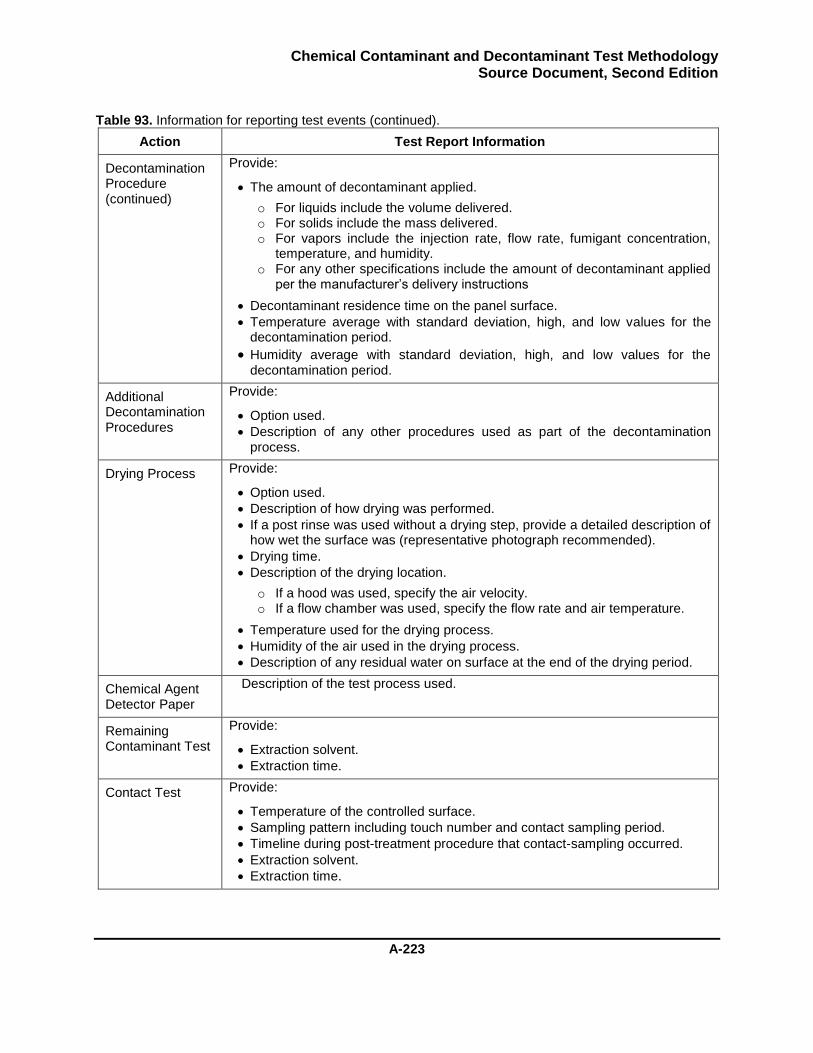
Chemical Contaminant and Decontaminant Test Methodology Source Document, Second Edition
A-223
Table 93. Information for reporting test events (continued).
Action Test Report Information
Decontamination Procedure (continued)
Provide:
The amount of decontaminant applied.
o For liquids include the volume delivered. o For solids include the mass delivered. o For vapors include the injection rate, flow rate, fumigant concentration,
temperature, and humidity. o For any other specifications include the amount of decontaminant applied
per the manufacturer’s delivery instructions
Decontaminant residence time on the panel surface.
Temperature average with standard deviation, high, and low values for the decontamination period.
Humidity average with standard deviation, high, and low values for the decontamination period.
Additional Decontamination Procedures
Provide:
Option used.
Description of any other procedures used as part of the decontamination process.
Drying Process Provide:
Option used.
Description of how drying was performed.
If a post rinse was used without a drying step, provide a detailed description of how wet the surface was (representative photograph recommended).
Drying time.
Description of the drying location.
o If a hood was used, specify the air velocity. o If a flow chamber was used, specify the flow rate and air temperature.
Temperature used for the drying process.
Humidity of the air used in the drying process.
Description of any residual water on surface at the end of the drying period.
Chemical Agent Detector Paper
Description of the test process used.
Remaining Contaminant Test
Provide:
Extraction solvent.
Extraction time.
Contact Test Provide:
Temperature of the controlled surface.
Sampling pattern including touch number and contact sampling period.
Timeline during post-treatment procedure that contact-sampling occurred.
Extraction solvent.
Extraction time.
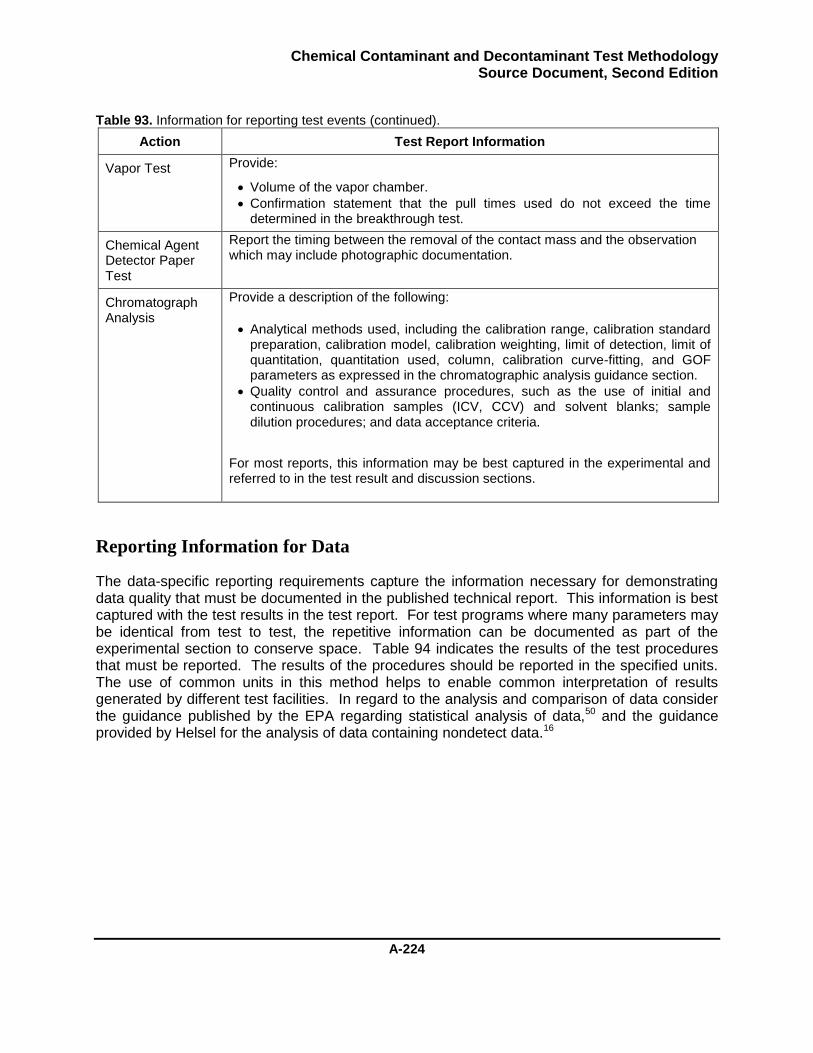
Chemical Contaminant and Decontaminant Test Methodology Source Document, Second Edition
A-224
Table 93. Information for reporting test events (continued).
Action Test Report Information
Vapor Test Provide:
Volume of the vapor chamber.
Confirmation statement that the pull times used do not exceed the time determined in the breakthrough test.
Chemical Agent Detector Paper Test
Report the timing between the removal of the contact mass and the observation which may include photographic documentation.
Chromatograph Analysis
Provide a description of the following:
Analytical methods used, including the calibration range, calibration standard preparation, calibration model, calibration weighting, limit of detection, limit of quantitation, quantitation used, column, calibration curve-fitting, and GOF parameters as expressed in the chromatographic analysis guidance section.
Quality control and assurance procedures, such as the use of initial and continuous calibration samples (ICV, CCV) and solvent blanks; sample dilution procedures; and data acceptance criteria.
For most reports, this information may be best captured in the experimental and referred to in the test result and discussion sections.
Reporting Information for Data
The data-specific reporting requirements capture the information necessary for demonstrating data quality that must be documented in the published technical report. This information is best captured with the test results in the test report. For test programs where many parameters may be identical from test to test, the repetitive information can be documented as part of the experimental section to conserve space. Table 94 indicates the results of the test procedures that must be reported. The results of the procedures should be reported in the specified units. The use of common units in this method helps to enable common interpretation of results generated by different test facilities. In regard to the analysis and comparison of data consider the guidance published by the EPA regarding statistical analysis of data,50 and the guidance provided by Helsel for the analysis of data containing nondetect data.16
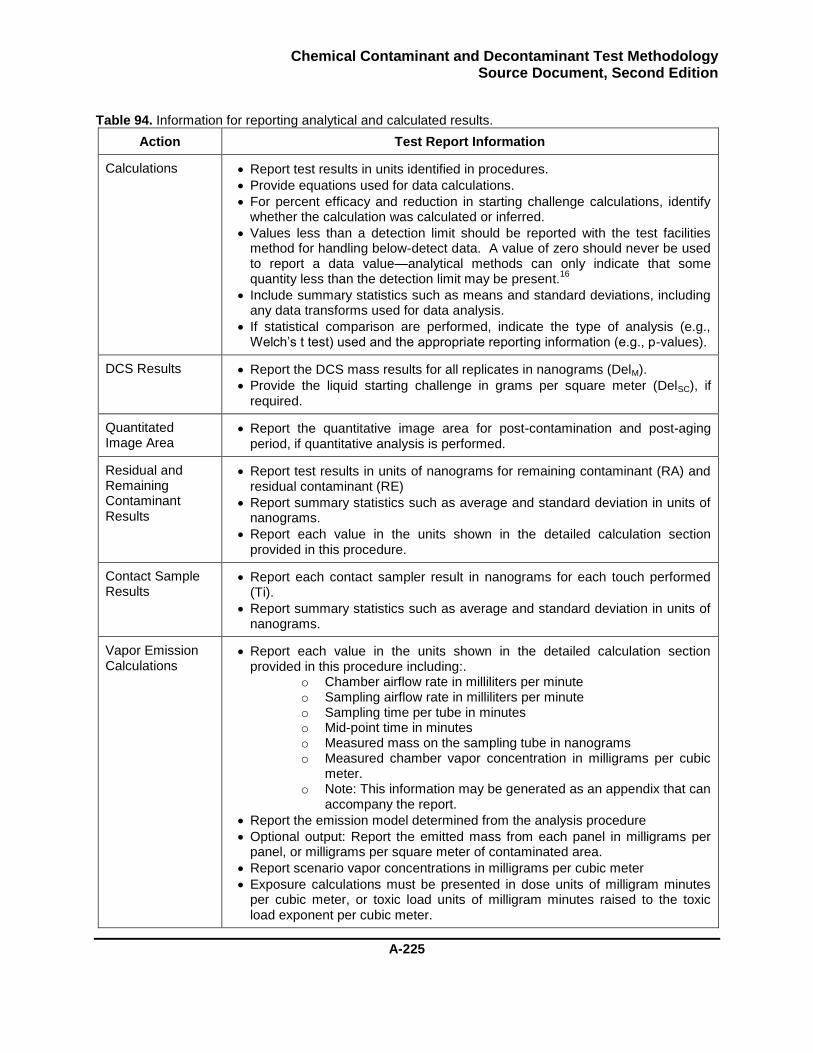
Chemical Contaminant and Decontaminant Test Methodology Source Document, Second Edition
A-225
Table 94. Information for reporting analytical and calculated results.
Action Test Report Information
Calculations Report test results in units identified in procedures.
Provide equations used for data calculations.
For percent efficacy and reduction in starting challenge calculations, identify whether the calculation was calculated or inferred.
Values less than a detection limit should be reported with the test facilities method for handling below-detect data. A value of zero should never be used to report a data value—analytical methods can only indicate that some quantity less than the detection limit may be present.
16 Include summary statistics such as means and standard deviations, including
any data transforms used for data analysis.
If statistical comparison are performed, indicate the type of analysis (e.g., Welch’s t test) used and the appropriate reporting information (e.g., p-values).
DCS Results Report the DCS mass results for all replicates in nanograms (DelM).
Provide the liquid starting challenge in grams per square meter (DelSC), if required.
Quantitated Image Area
Report the quantitative image area for post-contamination and post-aging period, if quantitative analysis is performed.
Residual and Remaining Contaminant Results
Report test results in units of nanograms for remaining contaminant (RA) and residual contaminant (RE)
Report summary statistics such as average and standard deviation in units of nanograms.
Report each value in the units shown in the detailed calculation section provided in this procedure.
Contact Sample Results
Report each contact sampler result in nanograms for each touch performed (Ti).
Report summary statistics such as average and standard deviation in units of nanograms.
Vapor Emission Calculations
Report each value in the units shown in the detailed calculation section provided in this procedure including:.
o Chamber airflow rate in milliliters per minute o Sampling airflow rate in milliliters per minute o Sampling time per tube in minutes o Mid-point time in minutes o Measured mass on the sampling tube in nanograms o Measured chamber vapor concentration in milligrams per cubic
meter. o Note: This information may be generated as an appendix that can
accompany the report.
Report the emission model determined from the analysis procedure
Optional output: Report the emitted mass from each panel in milligrams per panel, or milligrams per square meter of contaminated area.
Report scenario vapor concentrations in milligrams per cubic meter
Exposure calculations must be presented in dose units of milligram minutes per cubic meter, or toxic load units of milligram minutes raised to the toxic load exponent per cubic meter.
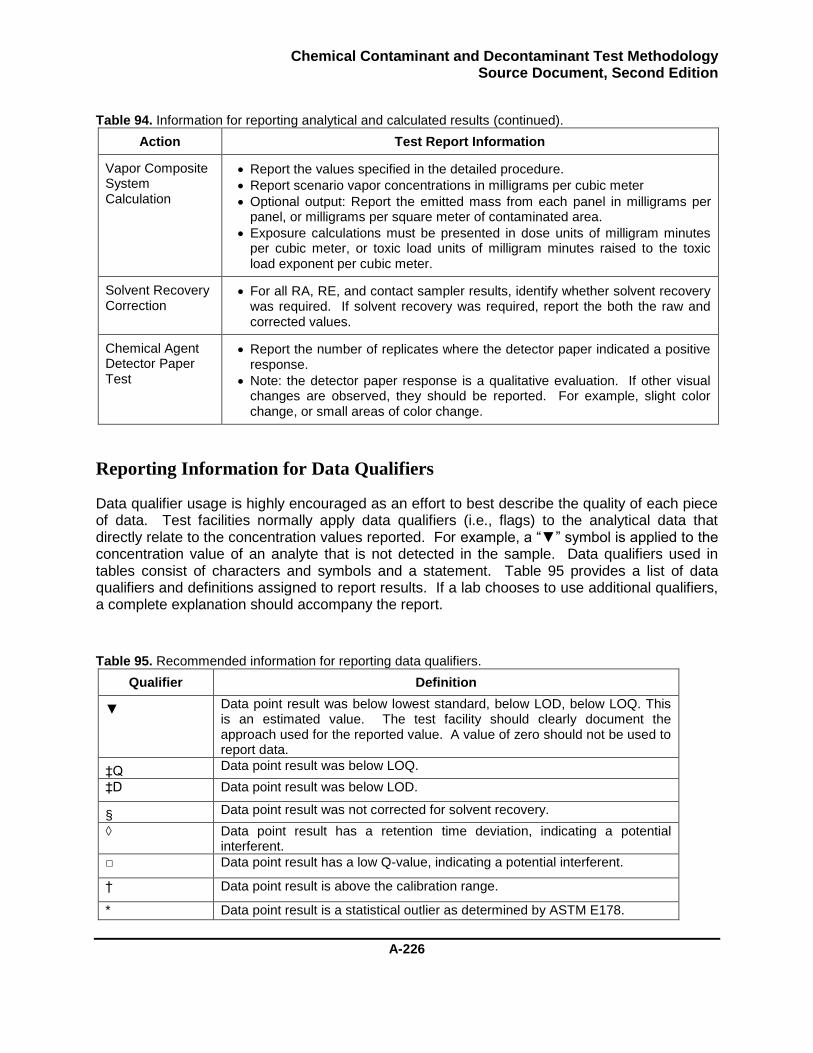
Chemical Contaminant and Decontaminant Test Methodology Source Document, Second Edition
A-226
Table 94. Information for reporting analytical and calculated results (continued).
Action Test Report Information
Vapor Composite System Calculation
Report the values specified in the detailed procedure.
Report scenario vapor concentrations in milligrams per cubic meter
Optional output: Report the emitted mass from each panel in milligrams per panel, or milligrams per square meter of contaminated area.
Exposure calculations must be presented in dose units of milligram minutes per cubic meter, or toxic load units of milligram minutes raised to the toxic load exponent per cubic meter.
Solvent Recovery Correction
For all RA, RE, and contact sampler results, identify whether solvent recovery was required. If solvent recovery was required, report the both the raw and corrected values.
Chemical Agent Detector Paper Test
Report the number of replicates where the detector paper indicated a positive response.
Note: the detector paper response is a qualitative evaluation. If other visual changes are observed, they should be reported. For example, slight color change, or small areas of color change.
Reporting Information for Data Qualifiers
Data qualifier usage is highly encouraged as an effort to best describe the quality of each piece of data. Test facilities normally apply data qualifiers (i.e., flags) to the analytical data that directly relate to the concentration values reported. For example, a “▼” symbol is applied to the concentration value of an analyte that is not detected in the sample. Data qualifiers used in tables consist of characters and symbols and a statement. Table 95 provides a list of data qualifiers and definitions assigned to report results. If a lab chooses to use additional qualifiers, a complete explanation should accompany the report.
Table 95. Recommended information for reporting data qualifiers.
Qualifier Definition
▼ Data point result was below lowest standard, below LOD, below LOQ. This is an estimated value. The test facility should clearly document the approach used for the reported value. A value of zero should not be used to report data.
‡Q Data point result was below LOQ.
‡D Data point result was below LOD.
§ Data point result was not corrected for solvent recovery.
◊ Data point result has a retention time deviation, indicating a potential interferent.
□ Data point result has a low Q-value, indicating a potential interferent.
† Data point result is above the calibration range.
* Data point result is a statistical outlier as determined by ASTM E178.
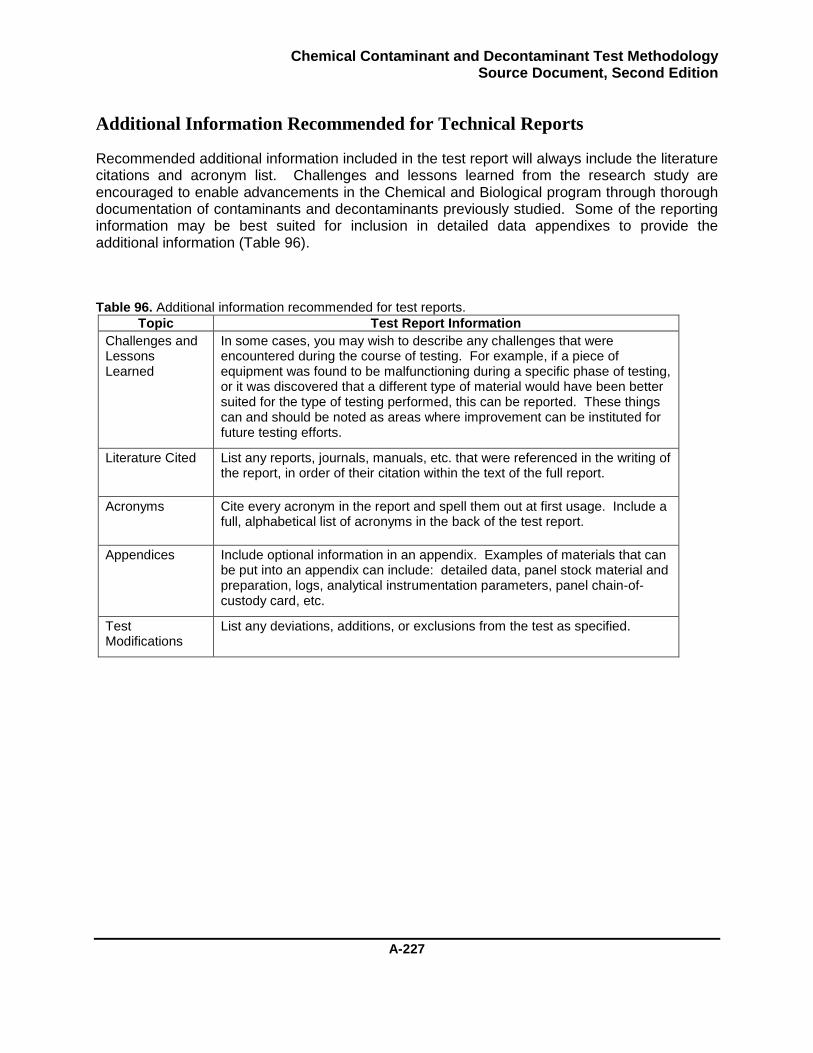
Chemical Contaminant and Decontaminant Test Methodology Source Document, Second Edition
A-227
Additional Information Recommended for Technical Reports
Recommended additional information included in the test report will always include the literature citations and acronym list. Challenges and lessons learned from the research study are encouraged to enable advancements in the Chemical and Biological program through thorough documentation of contaminants and decontaminants previously studied. Some of the reporting information may be best suited for inclusion in detailed data appendixes to provide the additional information (Table 96).
Table 96. Additional information recommended for test reports.
Topic Test Report Information
Challenges and Lessons Learned
In some cases, you may wish to describe any challenges that were encountered during the course of testing. For example, if a piece of equipment was found to be malfunctioning during a specific phase of testing, or it was discovered that a different type of material would have been better suited for the type of testing performed, this can be reported. These things can and should be noted as areas where improvement can be instituted for future testing efforts.
Literature Cited
List any reports, journals, manuals, etc. that were referenced in the writing of the report, in order of their citation within the text of the full report.
Acronyms
Cite every acronym in the report and spell them out at first usage. Include a full, alphabetical list of acronyms in the back of the test report.
Appendices
Include optional information in an appendix. Examples of materials that can be put into an appendix can include: detailed data, panel stock material and preparation, logs, analytical instrumentation parameters, panel chain-of-custody card, etc.
Test Modifications
List any deviations, additions, or exclusions from the test as specified.
Chemical Contaminant and Decontaminant Test Methodology Source Document, Second Edition
A-228
Acronyms
The acronyms and abbreviations used throughout this document for chemical decontaminant testing protocols are listed in this appendix. The acronyms and abbreviations are listed in alphabetical order. Laboratories using these methods should avoid using acronyms that overlap with document-specific acronyms. All laboratory-specific acronyms used in test documentation, but not listed in this appendix should be defined in the test plan and be reported at first usage.
Acronym Definition
ANOVA Analysis of Variance
APG Aberdeen Proving Grounds
AR Army Regulation
ARPD Average Relative Percent Difference
ASTM American Society for Testing and Materials
CARC Chemical Agent Resistant Coating
CASARM Chemical Agent Standard Analytical Reference Materials
CBD Chemical and Biological Defense
CCV Continuing Calibration Verification
CFD Computed Flow Dynamics
CI Confidence Interval
CONOPS Concept of Operations
CT Concentration Time (units: mg min/m3)
DCS Dose-Confirmation Sample
DF Degrees of Freedom
DT Developmental Testing
DT/OT Developmental and Operational Testing
DTRA Defense Threat Reduction Agency
ECBC Edgewood Chemical Biological Center
EI Electron Impact Ionization
EPA Environmental Protection Agency
ESI Electrospray Ionization
FM Field Manual
Chemical Contaminant and Decontaminant Test Methodology Source Document, Second Edition
A-229
Acronym Definition
GC Gas Chromatography
GC/MS Gas Chromatography/Mass Spectroscopy
GD Soman, non-persistent agent
GOF Goodness-of-Fit
HD distilled mustard, blister agent
HMMWV High Mobility Multipurpose Wheeled Vehicle
IAW In Accordance With
ICV Initial Calibration Verification
IR infrared
ISO International Standards Organization
JPID Joint Platform Interior Decontamination
JSLIST Joint Service Lightweight Integrated Suit Technology
JSSED Joint Service Sensitive Equipment Decontamination
LC Liquid Chromatography
LD Log Difference
LOD Limit of Detection
LOQ Limit of Quantitation
MIL-STD Military Standard
MRM Multiple-Reaction Monitoring
MOPP Mission-Oriented Protective Posture
MS Mass Spectrometer
MSD Mass Selective Detector
MT Mass Transferred
PF Performance Factor
PID Photoionization Detector
PPE Personal Protective Equipment
QA Quality Assurance
QC Quality Control
RA Remaining Contaminant
Chemical Contaminant and Decontaminant Test Methodology Source Document, Second Edition
A-230
Acronym Definition
R&D Research and Development
RE Residual Contaminant
RH Relative Humidity
RMSE Root Mean Square Error
RPD Relative Percent Deviation
RSC Relative Surface Coverage
RSD Relative Standard Deviation
SD Source Document (Original Release)
SD2ED Source Document Second Edition
SIM Selective Ion Monitoring
SOW Statement of Work
SSE Sum of the Square of the Error
SSV Safe Sample Volume
TCC Thermal Column Compartment
TD Thermal Desorption
TDG Thiodiglycol
TIM Toxic Industrial Material
TL Toxic Load
TRA Technology Readiness Assessments
TTA Technology Transition Agreement
USACHPPM U.S. Army Center for Health Promotion and Preventive Medicine
VX Methylphophonothioic acid, persistent nerve agent
Chemical Contaminant and Decontaminant Test Methodology Source Document, Second Edition
A-231
Glossary
Terminology specific to this document are listed alphabetically below.
Term Definition absorption The uptake of a liquid or gas contaminant into the mass of a solid material.
The contaminant must transport (permeate) through the surface, into the volume of the material.
adsorption (1) The formation of a layer of liquid or gas (contaminant) on the surface of a solid material. This does not include contaminant residing inside the material. (2) The adhesion of a contaminant on a material. This is limited to the surface of the material and does not include contaminant residing inside the material.
agent See chemical agent.
air-change rate The ratio of the airflow rate in an environment (e.g., vapor chamber, scenario), Q, to the free-air volume, V, of the environment. The air-change rate, n, is calculated as n = Q/V. Air-change rate is expressed using units of both min
-1
and h-1
.
airflow rate, chamber The rate that air flows through the vapor chamber during the experiment. Reported in milliliters per minute (mL/min).
airflow rate, sampling
The rate that air flows through the solid-sorbent tube during sample collection. Reported in milliliters per minute (mL/min). This rate may be different from the chamber airflow rate (above), depending on chamber configuration.
ambient temperature The temperature of the surrounding air (EPA). In this case, the surrounding air is defined as the temperature in the working environment (i.e., the laboratory/hood). This is the same as room condition.
analytical sample The liquid extract or vapor tube sample that is generated during testing. The sample is analyzed using chromatographic analysis (GC and/or LC) or other quantitative analytical techniques.
assignable cause An identifiable, specific cause of variation that is not random and does not occur by chance in a given process or measurement.
bioavailable In toxicology, the degree to which a substance enters the bloodstream and is circulated to specific organs or tissue after administration of a defined exposure. With regard to the contact test, the contaminant mass transferred to the contact sampler could be biologically available under appropriate conditions.
breadboard, brassboard, prototype
Technology, in differing degrees of configuration, which is still under development and is not in its final form. This can apply to test fixtures, formulations, and/or the decontamination system/applicator.
calculations, calculated
A calculation is described as calculated in cases where the optimal test was executed, and all pertinent values were measured. This type of calculation offers the highest level of confidence in the accuracy of the calculated value.
calculations, inferred A calculation is described as inferred if all variables were not measured, but the most pertinent data was collected. Inferred calculated values may not account for some forms of systematic loss (e.g., evaporative loss between touches in the contact test). However, the desired value can be determined with the specified assumptions or limitation of the calculation. It must be recognized that some degree of inaccuracy is inherent.
Chemical Contaminant and Decontaminant Test Methodology Source Document, Second Edition
A-232
Term Definition chamber vapor concentration
The concentration of vapor measured using the vapor chamber. Note: This concentration does not correspond to the vapor concentration unprotected personnel would be exposed to and should not be compared to the requirements documents or toxicity values.
chemical agent A toxic chemical for use in military operations. A comprehensive listing of chemical agents can be found in FM 3-11.9.
confidence interval For a data set, a calculated range that encompasses the most likely future results.
contact hazard The amount of contaminant remaining on the surface that could, based on toxicological human estimates, pose a threat to unprotected personnel touching the contaminated surface.
contact mass A uniform mass used to apply pressure during the contact test. The masses are typically prepared from stainless steel. The masses should evenly exert 0.7–1.0 psi (0.05–0.07 kg/cm
2) pressure on the panel surface. For the 2 in.
diameter disk, this is equivalent to a 2 in. diameter cylindrical mass weighing 1 kg.
contact sampler Material used in the contact test as a surrogate for human skin. The sampler sorbs the available surface contamination, which is then extracted to determine the mass of contaminant potentially bioavailable or available for contact transfer.
contact sampler transfer efficiency
Measurement of the contact sampler’s ability to collect contaminant from the test material (e.g., panel). More specifically, the contact sampler’s ability to sorb the analyte under the ideal case by using a nonsorptive material. Transfer efficiency may be different for material-contaminant combinations.
contact transfer The ability of a contaminant, present on a specific surface, to be moved to another surface or skin by contacting the contaminated surface.
contaminant A chemical compound with harmful effects to humans. In hazard mitigation, the contaminant is a chemical compound that must be removed and/or neutralized from a surface of interest. Typical contaminants include chemical agents, chemical agent simulants, toxic industrial chemicals, and toxic industrial materials.
contaminant simulant
Compounds that contain at least one property similar to the parent contaminant (e.g., live chemical agent), but have a lower toxicity.
contamination The deposition, adsorption, or absorption of contaminants on or by structures, areas, personnel, or objects. (Reference FM 3-11.9.)
contamination parameters
A specific density, drop volume, and deposition pattern combination used for dose confirmation. Deposition pattern only matters in a contamination set if the contaminant application uses more than one drop.
decontaminant For these procedures, a substance or process with the capability to remove and/or neutralize contaminants on/in surfaces of interest. The decontaminant can be liquid, solid (powders, wipes), or gas phase (fumigants, including aerosols).
decontamination process
The process of making any person, object, or area safe by absorbing, destroying, neutralizing, making harmless, or removing a contaminant. (Reference FM 3-11.9.) For these procedures, the decontamination process refers to a specific series of treatment tasks performed, which may include contaminating, aging, decontaminating, rinsing, and drying.
detection limit The lowest quantity of a substance that can be distinguished from the absence of that substance (a blank value), within a stated level of confidence.
Chemical Contaminant and Decontaminant Test Methodology Source Document, Second Edition
A-233
Term Definition dosage (Toxicology) The total mass of substance relative to some other quantity (e.g.,
milligrams per minute [mg/min], milligrams per area [mg/area], milligrams per body mass [mg/body mass]).
dose (Toxicology) The total mass of substance that is administered to a person.
dose-confirmation sample
A sample providing the mass of contaminant delivered during a test session. Contaminant delivery tools, such as pipettors and syringes, cannot always be assumed to perform at the manufacturer’s specifications, especially for viscous or highly volatile materials. The DCS is used to provide confidence in the amount of contaminant applied to the sample by the tool during that test session. This value is needed for calculations, such as reduction in starting challenge, which require accurate measurement of the starting contamination.
emission rate The flux of the contaminant from the item under test, expressed as mass emitted per minute (mg min
-1) from an item.
emission factor The flux of the contaminant from the material under test, expressed as mass emitted per unit area per minute (mg m
-2 min
-1)
extraction The separation of a component from a mixture through selective solubility.
foam A sponge-like material, used in the contact test to ensure that contact mass pressure is evenly applied to the test surface.
hazard A condition with the potential to cause injury, illness, or death of personnel; damage to or loss of equipment or property; or mission degradation. (Reference FM 3-11.9.)
hydrolysis The chemical reaction of a compound with water.
hydrophilic Having a strong affinity for water, tendency to dissolve, mix with, or be wetted by water. Water droplets on hydrophilic surfaces will tend to spread towards a thin film.
hydrophobic Lacking affinity for water. Tending to repel and not absorb, combine with, or dissolve in water. Water droplets on a hydrophobic surface will tend to bead and remain sessile.
internal standard An analyte of known concentration, added to all samples prior to analytical analysis, used to normalize sample matrix effects and instrument signal drift.
item Physical object, typically three-dimensional, made from multiple material types that can include assets and small items of sensitive equipment.
limit of detection LOD see detection limit.
limit of quantitation LOQ see quantitation limit.
loading factor For the determination of emission rates, the loading factor (l) is the ratio of the number of items, Z, in an environment to the free-air volume, V, of the environment; l=Z/V. For the determination of emission factors, the loading factor is the ratio of the (contaminated) surface area/volume of the environment; l = A/V.
moderate condition A test condition in the middle of the range of environmental conditions of interest in hazard mitigation evaluations for military scenarios. The standard indoor office/laboratory condition, at 19–21 °C and 50–60% relative humidity, is a moderate condition.
neutralization The act of altering chemical, physical, and toxicological properties to render the chemical contaminant ineffective for use as intended. (Reference FM 3-11.9.)
nonpersistent contaminant
A chemical contaminant that when released dissipates and/or loses its ability to cause casualties after 10 to 15 min. (Reference FM 3-11.9)
Chemical Contaminant and Decontaminant Test Methodology Source Document, Second Edition
A-234
Term Definition nonsorptive materials
A material that does not retain a significant amount of contaminant by absorption, although there may be a minute quantity of adsorption. Sorption is dependent on material-contaminant interactions. A material that is sorptive with one contaminant may or may not be sorptive with another contaminant. In general, bare metals and glass are nonsorptive materials for some agents.
operational decontamination
Decontamination carried out by an individual and/or a unit, and restricted to specific parts of operationally essential equipment, material, and/or working areas. Operational decontamination is done to minimize contact and transfer hazards and to sustain operations. This may include decontamination of the individual beyond the scope of immediate decontamination, as well as decontamination of mission-essential spares and limited terrain decontamination. (Reference FM 3-11.5.)
panel A piece of material prepared from the representation stock material of interest, in the dimensions required for testing.
panel, contaminated surface area
The portion of the test surface area of the panel that the contaminant covers. This evaluation is typically performed after contamination and again after the contaminant-material interaction period. Also referred to as wetted area.
panel, handling The actions the panel undergoes upon leaving inventory, panel treatment, post-treatment evaluations, and through disposal.
panel, test surface area
The area of the material identified as the test surface. (The test surface area for a 2 in. diameter disk is the top surface, which has an area of approximately 20.2 cm
2). This area does not account for microscopic surface roughness.
percent efficacy (and calculation)
The measurement of the amount of contaminant removed from the material of interest as a result of the decontamination process. This value can be reported as calculated or inferred.
porous materials Porous materials include void spaces (pores) inside the material such as cement or sand. Porous materials are sorptive for wetting liquids. Not all sorptive materials are porous (e.g., polymers may be sorptive but not porous).
pull schedule (vapor test)
The schedule that identifies when samples are collected. The pull schedule includes the midpoint times and pull times for each solid-sorbent tube used for vapor collection.
quantitation limit The lowest amount of analyte in a sample that can be quantitatively determined with suitable precision and accuracy.
quench compound Substance used to chemically halt/deactivate the decontaminant’s active component to stop further reaction.
reduction in starting challenge (and calculation)
The measurement of the mass of contaminant that has been removed from the material of interest. This calculation is most often employed for the evaluation of physical removal or pre-clean techniques. The value can be reported as calculated or inferred.
relative standard deviation (RSD)
The standard deviation of a data set divided by the mean of the data set. Also referred to as the coefficient of variation (CV).
remaining contaminant
The total amount of contaminant present in/on the material of interest after the decontamination process has been conducted. This value is different from the residual contaminant in that no mass has been removed from the panel post-treatment chemical agent detector paper, contact, or vapor sampling. This value cannot be used to calculate a contact or vapor hazard.
requirement levels The documented amount of permissible chemical contaminant remaining after a decontaminant process, typically expressed as a vapor concentration (milligrams per cubic meter [mg/m
3]) or a surface concentration (milligrams per
square meter [mg/m2]).
Chemical Contaminant and Decontaminant Test Methodology Source Document, Second Edition
A-235
Term Definition residual contaminant The amount of contaminant present in/on the material of interest after the
decontaminant process and post-treatment chemical agent detector paper, contact, or vapor sampling testing.
rinsate The rinse solution collected during the decontamination process. The rinse solution may include residual decontaminant, contaminant, and contaminant byproducts in water.
room condition The temperature and humidity of the test location on the specific test day.
scenario A postulated sequence of events that may include various locations and environments.
scenario, vapor concentration
The vapor concentration calculated based on a scenario using the emission models for all materials involved. This measurement corresponds to the vapor concentration to which unprotected personnel would be exposed, and can be compared to health-based requirements.
sessile drop A liquid droplet that is firmly attached to a surface. If the droplet significantly spreads across the surface, it is better described as a thin film.
skin surrogate Material used in the contact test to estimate the contaminant transfer that could occur if the surface of interest was contacted (i.e., touched) by an unprotected person.
solvent recovery For these procedures, a quantitative measurement of the solvent’s ability to selectively solubilize (i.e., remove) the contaminant from the test material (e.g., panel, contact sampler).
sorptive materials A material that absorbs or adsorbs a contaminant. Sorption is dependent on material-contaminant interactions. A material that is sorptive with one contaminant may or may not be sorptive with another contaminant.
surface coverage Usually used with regard to contamination, this is the contaminated surface area of the test area (panel surface).
test condition For a specific contaminant-material decontamination set, the combined contamination, aging, decontaminant and application process, environmental conditions, and post-treatment test sampling process variables (i.e., contact, vapor, remaining, or residual).
time, initial (vapor test)
The time representing the start of airflow (sample collection) for a solid-sorbent tube.
time, midpoint (vapor test)
The time representing sample collection, as calculated by initial tube time plus one-half the solid-sorbent tube pull time.
time, tube pulling (vapor test)
The length of time that air was flowing through a solid-sorbent tube.
touch (contact test) A contact test event is called a touch. A touch is characterized by the contact area, contact pressure, contact time duration, and skin condition (wet versus dry). For the panel test, the contact area is nominally the panel area. The pressure is 0.7–1.0 psi (0.05–0.07 kg/cm
2), which is equivalent to a 1 kg
cylindrical contact mass with a 2 in. diameter.
toxic industrial chemicals
Chemicals developed or manufactured for use in industrial operations or research by industry, government, or academia. These chemicals are not primarily manufactured for the specific purpose of producing human casualties or rendering equipment, facilities, or areas dangerous for human use (reference FM 3-11.9). These materials have an associated toxicity, which is less than chemical agents. However, these materials are typically produced in large quantities and readily available.
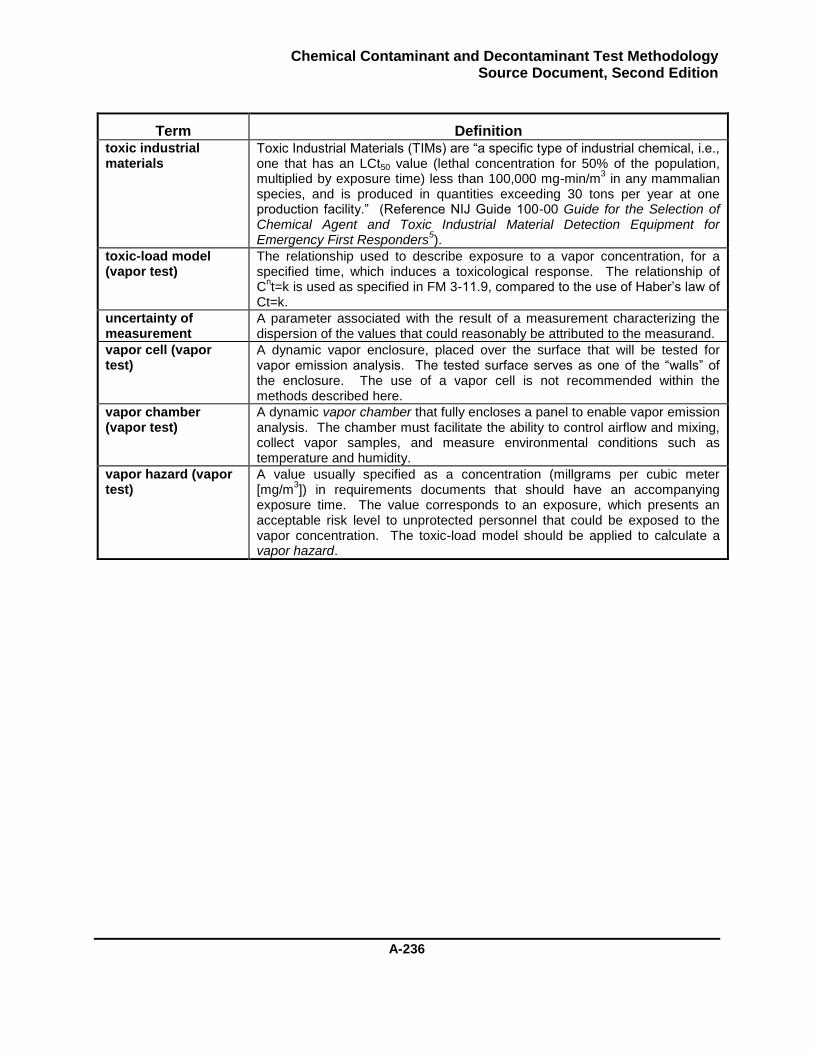
Chemical Contaminant and Decontaminant Test Methodology Source Document, Second Edition
A-236
Term Definition toxic industrial materials
Toxic Industrial Materials (TIMs) are “a specific type of industrial chemical, i.e., one that has an LCt50 value (lethal concentration for 50% of the population, multiplied by exposure time) less than 100,000 mg-min/m
3 in any mammalian
species, and is produced in quantities exceeding 30 tons per year at one production facility.” (Reference NIJ Guide 100-00 Guide for the Selection of Chemical Agent and Toxic Industrial Material Detection Equipment for Emergency First Responders
5).
toxic-load model (vapor test)
The relationship used to describe exposure to a vapor concentration, for a specified time, which induces a toxicological response. The relationship of C
nt=k is used as specified in FM 3-11.9, compared to the use of Haber’s law of
Ct=k.
uncertainty of measurement
A parameter associated with the result of a measurement characterizing the dispersion of the values that could reasonably be attributed to the measurand.
vapor cell (vapor test)
A dynamic vapor enclosure, placed over the surface that will be tested for vapor emission analysis. The tested surface serves as one of the “walls” of the enclosure. The use of a vapor cell is not recommended within the methods described here.
vapor chamber (vapor test)
A dynamic vapor chamber that fully encloses a panel to enable vapor emission analysis. The chamber must facilitate the ability to control airflow and mixing, collect vapor samples, and measure environmental conditions such as temperature and humidity.
vapor hazard (vapor test)
A value usually specified as a concentration (millgrams per cubic meter [mg/m
3]) in requirements documents that should have an accompanying
exposure time. The value corresponds to an exposure, which presents an acceptable risk level to unprotected personnel that could be exposed to the vapor concentration. The toxic-load model should be applied to calculate a vapor hazard.
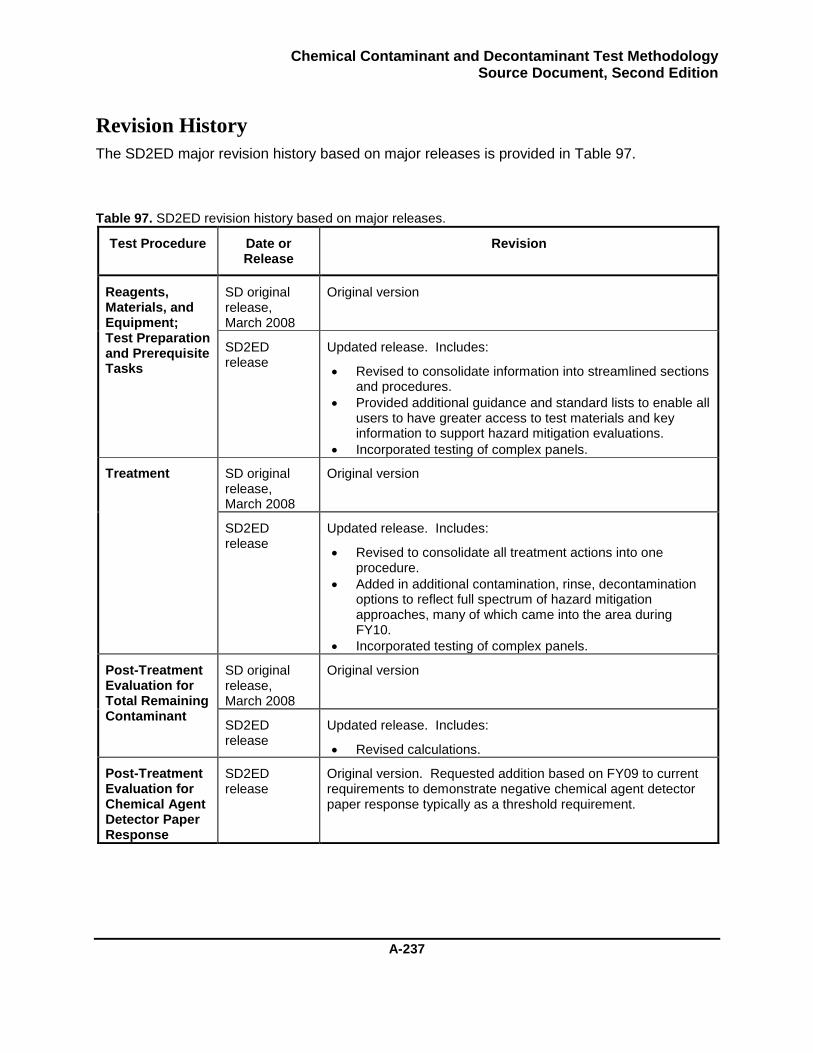
Chemical Contaminant and Decontaminant Test Methodology Source Document, Second Edition
A-237
Revision History
The SD2ED major revision history based on major releases is provided in Table 97.
Table 97. SD2ED revision history based on major releases.
Test Procedure Date or Release
Revision
Reagents, Materials, and Equipment; Test Preparation and Prerequisite Tasks
SD original release, March 2008
Original version
SD2ED release
Updated release. Includes:
Revised to consolidate information into streamlined sections and procedures.
Provided additional guidance and standard lists to enable all users to have greater access to test materials and key information to support hazard mitigation evaluations.
Incorporated testing of complex panels.
Treatment SD original release, March 2008
Original version
SD2ED release
Updated release. Includes:
Revised to consolidate all treatment actions into one procedure.
Added in additional contamination, rinse, decontamination options to reflect full spectrum of hazard mitigation approaches, many of which came into the area during FY10.
Incorporated testing of complex panels.
Post-Treatment Evaluation for Total Remaining Contaminant
SD original release, March 2008
Original version
SD2ED release
Updated release. Includes:
Revised calculations.
Post-Treatment Evaluation for Chemical Agent Detector Paper Response
SD2ED release
Original version. Requested addition based on FY09 to current requirements to demonstrate negative chemical agent detector paper response typically as a threshold requirement.
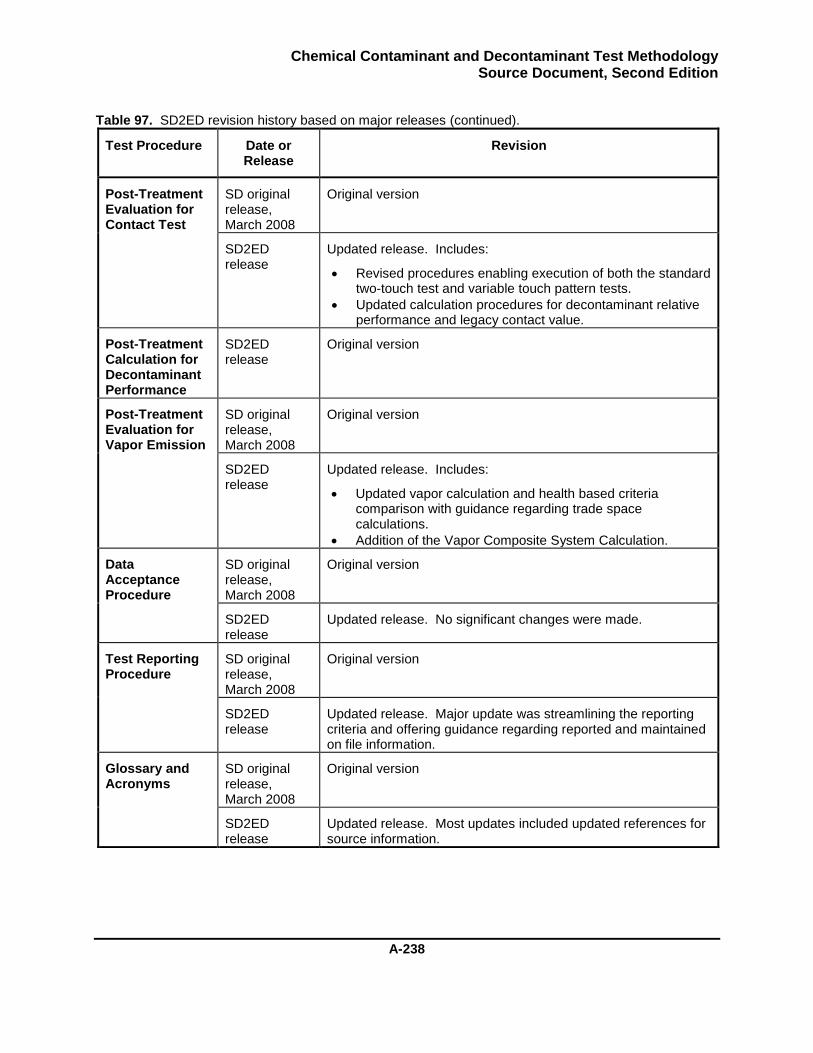
Chemical Contaminant and Decontaminant Test Methodology Source Document, Second Edition
A-238
Table 97. SD2ED revision history based on major releases (continued).
Test Procedure Date or Release
Revision
Post-Treatment Evaluation for Contact Test
SD original release, March 2008
Original version
SD2ED release
Updated release. Includes:
Revised procedures enabling execution of both the standard two-touch test and variable touch pattern tests.
Updated calculation procedures for decontaminant relative performance and legacy contact value.
Post-Treatment Calculation for Decontaminant Performance
SD2ED release
Original version
Post-Treatment Evaluation for Vapor Emission
SD original release, March 2008
Original version
SD2ED release
Updated release. Includes:
Updated vapor calculation and health based criteria comparison with guidance regarding trade space calculations.
Addition of the Vapor Composite System Calculation.
Data Acceptance Procedure
SD original release, March 2008
Original version
SD2ED release
Updated release. No significant changes were made.
Test Reporting Procedure
SD original release, March 2008
Original version
SD2ED release
Updated release. Major update was streamlining the reporting criteria and offering guidance regarding reported and maintained on file information.
Glossary and Acronyms
SD original release, March 2008
Original version
SD2ED release
Updated release. Most updates included updated references for source information.
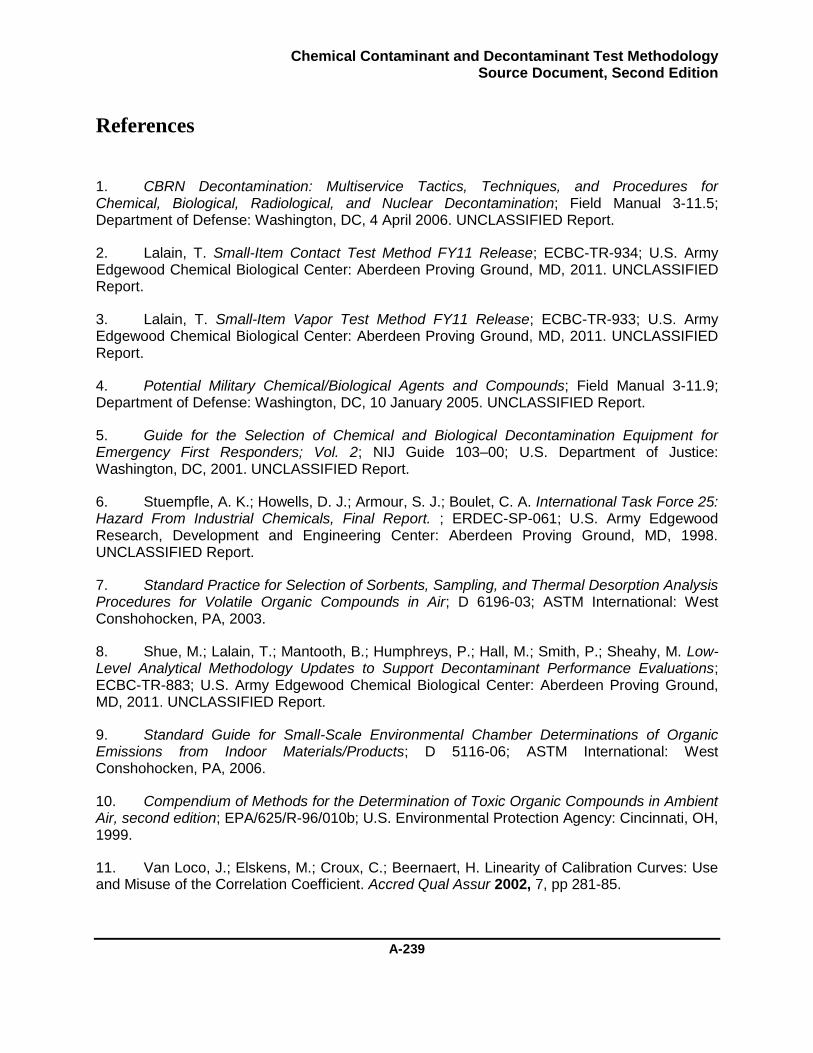
Chemical Contaminant and Decontaminant Test Methodology Source Document, Second Edition
A-239
References
1. CBRN Decontamination: Multiservice Tactics, Techniques, and Procedures for Chemical, Biological, Radiological, and Nuclear Decontamination; Field Manual 3-11.5; Department of Defense: Washington, DC, 4 April 2006. UNCLASSIFIED Report.
2. Lalain, T. Small-Item Contact Test Method FY11 Release; ECBC-TR-934; U.S. Army Edgewood Chemical Biological Center: Aberdeen Proving Ground, MD, 2011. UNCLASSIFIED Report.
3. Lalain, T. Small-Item Vapor Test Method FY11 Release; ECBC-TR-933; U.S. Army Edgewood Chemical Biological Center: Aberdeen Proving Ground, MD, 2011. UNCLASSIFIED Report.
4. Potential Military Chemical/Biological Agents and Compounds; Field Manual 3-11.9; Department of Defense: Washington, DC, 10 January 2005. UNCLASSIFIED Report.
5. Guide for the Selection of Chemical and Biological Decontamination Equipment for Emergency First Responders; Vol. 2; NIJ Guide 103–00; U.S. Department of Justice: Washington, DC, 2001. UNCLASSIFIED Report.
6. Stuempfle, A. K.; Howells, D. J.; Armour, S. J.; Boulet, C. A. International Task Force 25: Hazard From Industrial Chemicals, Final Report. ; ERDEC-SP-061; U.S. Army Edgewood Research, Development and Engineering Center: Aberdeen Proving Ground, MD, 1998. UNCLASSIFIED Report.
7. Standard Practice for Selection of Sorbents, Sampling, and Thermal Desorption Analysis Procedures for Volatile Organic Compounds in Air; D 6196-03; ASTM International: West Conshohocken, PA, 2003.
8. Shue, M.; Lalain, T.; Mantooth, B.; Humphreys, P.; Hall, M.; Smith, P.; Sheahy, M. Low-Level Analytical Methodology Updates to Support Decontaminant Performance Evaluations; ECBC-TR-883; U.S. Army Edgewood Chemical Biological Center: Aberdeen Proving Ground, MD, 2011. UNCLASSIFIED Report.
9. Standard Guide for Small-Scale Environmental Chamber Determinations of Organic Emissions from Indoor Materials/Products; D 5116-06; ASTM International: West Conshohocken, PA, 2006.
10. Compendium of Methods for the Determination of Toxic Organic Compounds in Ambient Air, second edition; EPA/625/R-96/010b; U.S. Environmental Protection Agency: Cincinnati, OH, 1999.
11. Van Loco, J.; Elskens, M.; Croux, C.; Beernaert, H. Linearity of Calibration Curves: Use and Misuse of the Correlation Coefficient. Accred Qual Assur 2002, 7, pp 281-85.

Chemical Contaminant and Decontaminant Test Methodology Source Document, Second Edition
A-240
12. FDA Guidance for Industry: Bioanalytical Method Validation; http://www.fda.gov/cder/guidance/index.htm (Accessed December, 2007).
13. Kiser, M. M.; Dolan, J. W. Selecting the Best Curve Fit. LC GC Europe 2004, 17 (3), pp 138-43.
14. Lavagnini, I.; Magno, F.; Traldi, P. A Statistical Overview on Univariate Calibration, Inverse Regression, and Detection Limits: Application to Gas Chromatography/Mass Spectrometry Technique. Mass Spectrom. Rev. 2007, 26, pp 1-18.
15. Zorn, M. E.; Gibbons, R. D.; Sonzogni, W. C. Weighted Least-Squares Approach To Calculating Limits of Detection and Quantification by Modeling Variability as a Function of Concentration. Anal. Chem. 1997, 69, pp 3069-75.
16. Helsel, D. R. Nondetects and Data Analysis: Statistics for Censored Environmental Data. John Wiley & Sons, Inc.: Hoboken, NJ, 2005; pp 252.
17. U.S. Army Engineering Manual EM 200-1-10, Environmental Quality - Guidance for Evaluationg Performance-Based Chemical Data. Department of the Army, U.S. Army Corps of Engineers: Washington, DC, 2005.
18. American National Standard Z1.4 Sampling Procedures and Tables for Inspection by Attributes; ANSI/ASQ Z1.4; American Society for Quality: Milwaukee, WI, 2008.
19. Standard Test Methods for Direct Moisture Content Measurement of Wood and Wood-Base Materials; D 4442 – 92 (Reapproved 03); ASTM International: West Conshohocken, PA, 1992.
20. Ellison, D. H. Handbook of Chemical and Biological Warfare Agents. CRC Press LLC: Boca Raton, FL, 2000; pp 508.
21. Standard Practice for Dealing with Outlying Observations; E 178; ASTM International: West Conshohocken, PA, 2008.
22. Guidelines for Exposure Assessment; EPA/600/Z-92/001; U.S. Environmental Protection Agency, Risk Assessment Forum: Washington, DC, 29 May 1992.
23. Isselbacher, K. J.; Upton, A. C.; Bailar, J. C.; Bischoff, K. B.; Bogen, K. T.; Brauman, J. I.; Doniger, D. D.; Doull, J.; Finkel, A. M.; Harris, C. C.; Hopke, P. K.; Jasanoff, S. S.; McClellan, R. O.; Moses, L. E.; North, D. W.; Oren, C. N.; Parkin, R. T.; Pellizzari, E. D.; Rodricks, J. V.; Russell, A. G.; Seiber, J. N.; Spaw, S. N.; Spengler, J. D.; Walker, J. D.; Witschi, H. Science and Judgment in Risk Assessment. Committee on Risk Assessment of Hazardous Air Pollutants, Commission on Life Sciences, National Research Council; The National Academies Press: Washington, DC, 1994.
24. General Principles for Performing Aggregate Exposure and Risk Assessments; 6043; U.S. Environmental Protection Agency, Office of Pesticide Programs: Washington, DC, 28 November 2001.
Chemical Contaminant and Decontaminant Test Methodology Source Document, Second Edition
A-241
25. Dermal Exposure Assessment: A Summary of EPA Approaches; EPA 600/R-07/040F; U.S. Environmental Protection Agency, National Center for Environmental Assessment: Washington, DC, September 2007.
26. EPA Dermal Exposure Assessment: A Summary of EPA Approaches; EPA 600/R-07/040F; National Center for Environmental Assessment, Office of Research and Development, U.S. Environmental Protection Agency: Washington, DC, September 2007.
27. Acute Toxicity Estimation and Operational Risk Management of Chemical Warfare Agent Exposures; USACHPPM 47-EM-5863-04; U.S. Army Center for Health Promotion and Preventive Medicine: Aberdeen Proving Ground, MD, May 2004. UNCLASSIFIED Report.
28. NRC Review of Acute Human-Toxicity Estimates for Selected Chemical-Warfare Agents. National Academy Press: Washington, DC, 1997; pp 98.
29. Box, G. E.; Hunter, S. J.; Hunter, W. G. Statistics for Experimenters: Design, Innovation, and Discovery. 2nd ed.; John Wiley & Sons, Inc.: Hoboken, NJ, 2009; pp 664.
30. Bates, D. M.; Watts, D. G. Nonlinear Regression Analysis and Its Applications. John Wiley & Sons, Inc.: Hoboken, NJ, 2007.
31. Draper, N. R.; Smith, H. Applied Regression Analysis. Third ed.; John Wiley & Sons, Inc.: New York, 1998; pp 706.
32. Press, W. H.; Teukolsky, S. A.; Vetterling, W. T.; Flannery, B. P. Numerical Recipes: The Art of Scientific Computing. 3rd ed.; Cambridge University Press: New York, 2007.
33. DuMouchel, W. H.; O'Brien, F. L. In Integrating a Robust Option into a Multiple Regression Computing Environment. Computer Science and Statistics: Proceedings of the 21st Symposium on the Interface, Alexandria, VA, 1989; American Statistical Association.
34. Helsel, D. R. Less Than Obvious - Statistical Treatment of Data Below the Detection Limit. Environ. Sci. Technol. 1990, 24 (12), pp 1766-74.
35. Helsel, D. R. More Than Obvious: Better Methods for Interpreting Nondetect Data. Environ. Sci. Technol. 2005, 39 (20), pp 419A-23A.
36. Clarke, J. U. Evaluation of Censored Data Methods to Allow Statistical Comparisons among Very Small Samples with Below Detection Limit Observations. Environ. Sci. Technol. 1998, 32 (1).
37. Zhao, Y.; Frey, H. C. Uncertainty for Data with Non-Detects: Air Toxic Emissions from Combustion. Hum. Ecol. Risk Assess. 2006, 12, pp 1171-91.
38. Sommerville, D. R.; Reutter, S. A.; Crosier, R. B.; Shockley, E. E.; Bray, J. J. Chemical Warfare Agent Toxicity Estimates for the General Population; ECBC-TR-442; U.S. Army, Edgewood Chemical Biological Center: Aberdeen Proving Ground, MD, 2005. UNCLASSIFIED Report (AD-B311 889).

Chemical Contaminant and Decontaminant Test Methodology Source Document, Second Edition
A-242
39. Taylor, J. R. An Introduction to Error Analysis: The Study of Uncertainties in Physical Measurements. 2nd ed.; University Science Books: South Orange, NJ, 1996; pp 327.
40. Callahan, M. A.; Dixon, G. L.; Nacht, S. H.; Dixon, D. A.; Doria, J. J. Methods for Assessing Exposure to Chemical Substances; EPA 560/5-85-001; U.S. Environmental Protection Agency, Office of Pesticides and Toxic Substances: Washington, DC, July 1985.
41. Dermal Exposure Assessment: Principles and Applications; EPA/600/8-91/011B; U.S. Environmental Protection Agency, Office of Health and Environmental Assessment: Washington, DC, 1992. Interim Report.
42. Lioy, P. J.; Daisey, J. M.; Duan, N.; Hileman, F. D.; Hopke, P. K.; Jayjock, M. A.; Leaderer, M. S.; Pfaffenberger, C. D.; Robinson, J. P.; Schroy, J. M.; Stetter, J. R.; Weschler, C. J.; Wesolowski, J. J. Human Exposure Assessment for Airborne Pollutants: Advances and Opportunities. Committee on Advances in Assessing Human Exposure to Airborne Pollutants, National Research Council; The National Academies Press: Washington, DC, 1991; pp 321.
43. A Companion Document to USACHPPM Technical Guide (TG) 230 Chemical Exposure Guidelines for Deployed Military Personnel; RD 230; U.S. Army Center for Health Promotion and Preventive Medicine (USACHPPM): Aberdeen Proving Ground, MD, May 2003.
44. Aral, M. M. Environmental Modeling and Health Risk Analysis (Acts/Risk). Springer Science+Business Media: New York, 2010; pp 470.
45. The Handbook of Environmental Chemistry: Indoor Air Pollution. Pluschke, P., Ed.Springer-Verlag: Heidelberg, Germany, 2004; Vol. 4-F, pp 270.
46. Uhde, E.; Clausen, P. A.; Kofoed-Sorensen, V.; Crump, D.; Zhang, Y.; Mo, J.; Salthammer, T.; Woolfenden, E.; Wensing, M.; Mayer, F.; Breuer, K.; Sedlbauer, K.; Heinzow, B.; Sagunski, H.; Tham, K. W.; Sekhar, S. C.; Zuraimi, M. S.; Butte, W.; Schiewek, A.; Watts, S. F.; Morrison, G.; Molhave, L.; Ayoko, G. A.; Brown, S. K.; Schripp, T.; Wensing, M. Organic Indoor Air Pollutants: Occurrence, Measurement, Evaluation. 2nd ed.; Salthammer, T.; Uhde, E., Eds.Wiley-VCH: Weinheim, Germany, 2009; pp 438.
47. EPA Guidance on Environmental Data Verification and Data Validation EPA QA/G-8; EPA/240/R-02/004; Office of Environmental Information, U.S. Environmental Protection Agency: Washington, DC, November 2002.
48. Ivancic, W. A.; Nishioka, M. G.; Barnes, R. H.; Hubal, E. C.; Morara, M.; Bortnick, S. M. Development and Evaluation of a Quantitative Video-fluorescence Imaging System and Fluorescent Tracer for Measuring Transfer of Pesticide Residues from Surfaces to Hands with Repeated Contacts. The Annals of Occupational Hygiene 2004, 48 (6), pp 519-32.
49. Magee, R. J.; Won, D.; Shaw, C. Y.; Lusztyk, E.; Yang, W. VOC emissions from building materials - the impact of specimen variability - a case study; NRCC-47061; National Research Council Canada - Conseil national de recherches Canada: 2002.
Chemical Contaminant and Decontaminant Test Methodology Source Document, Second Edition
A-243
50. EPA Data Quality Assessment: Statistical Methods for Practitioners EPA QA/G-9S; EPA/240/B-06/003; U.S. Environmental Protection Agency, Office of Environmental Information: Washington, DC, February 2006.


Chemical Contaminant and Decontaminant Test Methodology Source Document, Second Edition
A-244