charlotte, nc market activity for september 2011
DESCRIPTION
Market Activity and Trends for Charlotte, NC and the surrounding areas for the month of August 2011.TRANSCRIPT

ON MOve Market Activity and Trends for Charlotte & Surrounding Counties
S E P T E M B E R 2 0 1 1
There were 2289 total closings in Aug. 2011, up 25.6% compared to Aug. 2010. 70% of all home sales in Aug. 2011 were in the $200,000 and under category. The average closing price for the
Charlotte metro area in Aug. 2011 was $205,915, down 9.2% from Aug. 2010. In Aug. 2011, new listings decreased by 18.4%, pending sales increased by 24.6%, total active listings decreased by 22.5%.
Residential Closings - Entire MLS August 2010 - August 2011
August 2011 Sales by Price Range
www.helenadamsrealty.com
the
Current Active Listings by Price Range
Under $100,000
$100,001 - $150K
$150,001 - $200K
$200,001 - $300K
$300,001 - $450K
Total Active Listings = 20,924
20%
20%
18%
11%
3%
ASP = Average Sold Price Data Courtesy Carolina MLS.
Total Sold August, 2011 = 2289 Data Courtesy Carolina MLS.
$450,001 - $600K
$600,001 - $800K
17%
5%
$800,001 - $1M
Over $1 Million
2% 1% Under $100,000
$100,001 - $150K
$150,001 - $200K
$200,001 - $300K
$300,001 - $450K 35%
19%
18%
12%
5%
$450,001 - $600K
$600,001 - $800K 16%
$800,001 - $1M
Over $1 Million
1% 1% 3%
Change in Closed Sales
Change in New Listings
Average Sales Price
Total Active Listings
Months Supply of Homes for Sale
Average Days on Market
Pending Sales
+25.6 +24.6 -18.4% -9.2% -22.5% 146 11.4
Brought to You by Evelyn McCorkle
Evelyn McCorkle — 704. 957. 3558 — [email protected] — www.evelynmccorkle.com

Page 2 On the Move - He len Adams Realty Volume 4, Issue 9
Closed Units by Area August 2011 - By MLS Areas
Residential Single Family, Townhomes & Condos
MLS Area Units Closed
1 Year Change
Average Sales Price
Charlotte - Gastonia - Rock Hill 1772 +23.1 $211,400
All of Mecklenburg County 1066 +23.7 $219,763
01 - Mecklenburg County (N) 182 +14.5 $ 178,481
02 - Mecklenburg County (E) 139 +46.3 $ 98,450
03 - Mecklenburg County (SE) 57 +3.76 $ 151,443
04 - Mecklenburg County (SSE) 104 +14.3 $ 329,703
05 - Mecklenburg County (S) 197 +10.1 $ 360,370
06 - Mecklenburg County (SSW) 72 +50.0 $ 188,826
07 - Mecklenburg County (SW) 81 +97.6 $ 123,018
08 - Mecklenburg County (W) 62 +24.0 $ 74,107
10 - Union County 189 +7.4 $ 261,095
11 - Cabarrus County 186 +27.4 $ 190,989
12 - Iredell County 174 +42.6 $ 239,822
13 - Lake Norman 122 +27.1 $ 403,584
14 - Lincoln County 52 +15.6 $ 173,285
15 - Lake Wylie 39 +25.8 $306,662
16 - Gaston County 149 +3.5 $ 127,225
17 - York County, SC 178 +8.5 $233,365
42 - Mtn. Island Lake 17 +35.3 $179,607
99 - Uptown Charlotte 11 -15.4 $285,933
TOTAL (for All CMLS Area) 2289 +25.6 $205,915
09 - Mecklenburg County (NW) 97 +24.4 $160,942
August Home Sales Snapshot
Data Courtesy Carolina MLS & 10K Research and Marketing.
+9.7% -0.1% -4.5%Price Range with Strongest Sales:
Under $100,000
# Bedrooms Strongest Sales: 4+ bedrooms
Property Type Strongest Sales: Single Family

Page 3 On the Move - He len Adams Realty Volume 4, Issue 9
Pending Contracts
Average Residential Sales Price
New Listings
30 Year Fixed Mortgage Rates
Source: Freddie Mac, NAR, August, 2011
Data Courtesy Carolina MLS.
Evelyn McCorkle — 704. 957. 3558 — [email protected] — www.evelynmccorkle.com
Page 4 On the Move - He len Adams Realty Volume 4, Issue 9
August 2011 Home Sales Overview
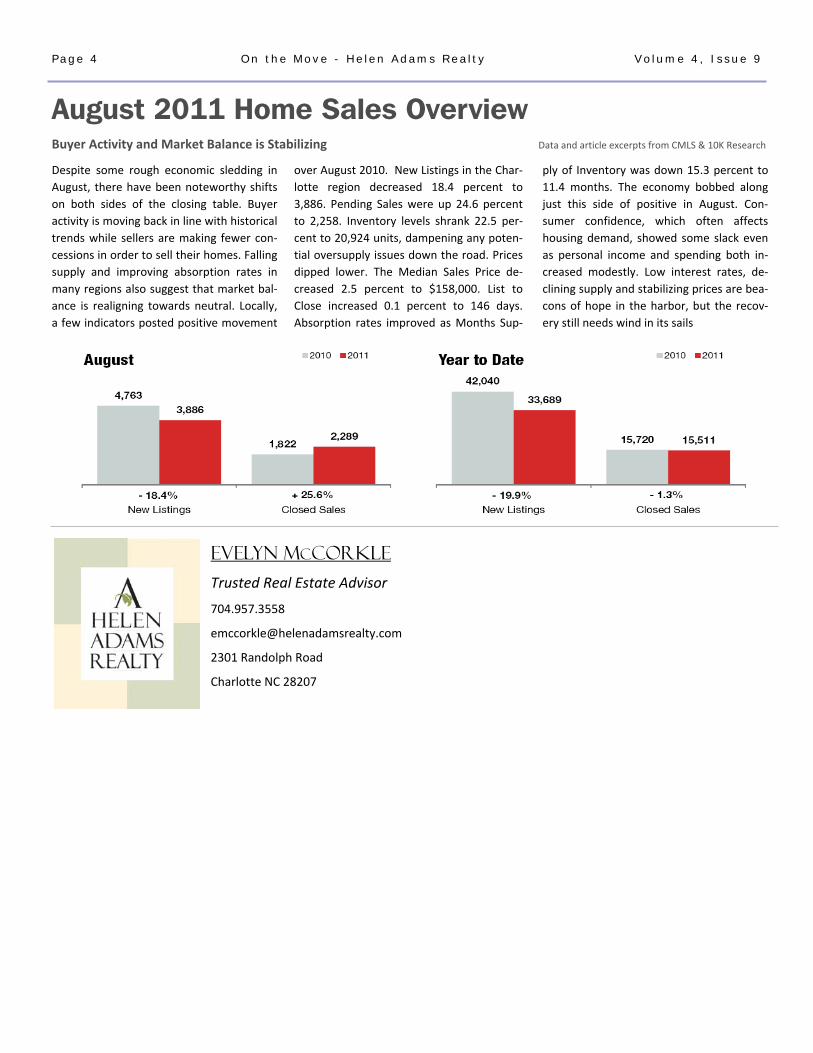
Despite some rough economic sledding in August, there have been noteworthy shifts on both sides of the closing table. Buyer activity is moving back in line with historical trends while sellers are making fewer con-cessions in order to sell their homes. Falling supply and improving absorption rates in many regions also suggest that market bal-ance is realigning towards neutral. Locally, a few indicators posted positive movement
Buyer Activity and Market Balance is Stabilizing Data and article excerpts from CMLS & 10K Research
over August 2010. New Listings in the Char-lotte region decreased 18.4 percent to 3,886. Pending Sales were up 24.6 percent to 2,258. Inventory levels shrank 22.5 per-cent to 20,924 units, dampening any poten-tial oversupply issues down the road. Prices dipped lower. The Median Sales Price de-creased 2.5 percent to $158,000. List to Close increased 0.1 percent to 146 days. Absorption rates improved as Months Sup-
ply of Inventory was down 15.3 percent to 11.4 months. The economy bobbed along just this side of positive in August. Con-sumer confidence, which often affects housing demand, showed some slack even as personal income and spending both in-creased modestly. Low interest rates, de-clining supply and stabilizing prices are bea-cons of hope in the harbor, but the recov-ery still needs wind in its sails
Evelyn MCCorkle
Trusted Real Estate Advisor 704.957.3558
2301 Randolph Road
Charlotte NC 28207