characterizing exhaled airflow from breathing and …yanchen/paper/2010-5.pdfcharacterizing exhaled...
TRANSCRIPT
Characterizing Exhaled Airflow from Breathing and Talking Jitendra K. Gupta1 Chao-Hsin Lin2 Qingyan Chen1*
1National Air Transportation Center of Excellence for Research in the Intermodal Transport Environment (RITE), School of Mechanical Engineering, Purdue University, West Lafayette, IN, USA, 2Environmental Control Systems, Boeing Commercial Airplanes, Seattle, WA, USA *e-mail: [email protected]
Abstract The exhaled air of infected humans is one of the prime sources of contagious viruses. The exhaled air comes from respiratory events such as the coughing, sneezing, breathing and talking. Accurate information on the thermo-fluid characteristics of the exhaled airflow can be important for prediction of infectious disease transmission. The present study developed a source model to provide the thermo-fluid conditions of the exhaled air from the breathing and talking processes. The source model is a set of equations obtained from the measurements of the flow rate, flow direction, and area of mouth/nose opening with human subjects. It was found that the exhaled flow rate over time can be represented as a sinusoidal function for breathing and a constant for talking. The flow rates can be calculated by physiological parameters of a subject. The direction of the exhalation jet did not vary much between subjects and the area of mouth/nose opening could be regarded as a constant. Though the mouth/nose opening size varied among subjects, they were not correlated with the physiological parameters of the subjects. If combined with appropriate virus and droplet distribution information, the model can be used to describe the disease source due to breathing and talking.
Keywords: Source model, airborne infection, airflow, visualization, opening area
Practical Implication: Accurate prediction of airborne disease transmission, and the infection prone zones, can aid in identifying and implementing the control strategies. With the recent advancements, Computational Fluid Dynamics (CFD) has become a powerful tool in predicting the disease transmission. Accurate prediction of the transmission by these CFD simulations requires information on sources and sinks of infectious viruses and models for dispersion of these viruses. The exhaled air of an infected human is one of the prime sources of disease viruses. In the present study measurements of the flow were conducted on human subjects to develop models for the flow boundary conditions for the exhalation and inhalation during breathing and talking.
Introduction Airborne infection has always been a major source of morbidity and mortality worldwide (Corbett et al., 2003). Dye et al. (1999) evaluated the global burden of TB (tuberculosis). About 22 countries were found to have TB infections with a total of 1.87 million deaths. Influenza epidemics were found to cause about 47,200 deaths each year in the United States
Gupta, J.K., Lin, C.-H., and Chen, Q. 2010. "Characterizing exhaled airflow from breathing and talking,"Indoor Air, 20, 31-39.
with similar figures in Europe (Viboud et al., 2004). The list of such social and economic disruption caused by these and many more airborne diseases is endless. Hence there is a strong need to mitigate the infection transmission to trim down the deaths. Accurate prediction of the transmission, and thus the infection prone zones, can aid in identifying and implementing the control strategies. With the recent advancements, Computational Fluid Dynamics (CFD) has become a powerful tool in predicting the disease transmission (Holmes et al., 2006) in enclosed spaces, such as buildings and transportation vehicles. The CFD simulations are inexpensive in comparison with experimental measurements. Accurate prediction of the transmission by these CFD simulations requires information on sources and sinks of infectious viruses and models for dispersion of these viruses. The exhaled air of an infected human is a source of infectious viruses. These viruses then disperse in the enclosed spaces depending on the airflow distribution. Finally these viruses enter the body of the victim through inhalation, deposit on a surface, or are extracted through a ventilation exhaust, which are called sinks. The virus dispersion in air has been investigated (Holmes et al., 2006), but no comprehensive literature exists on the exhalation and inhalation characterization. The present study is focused on developing models for the exhalations and inhalations, which can be used as thermo-fluid boundary conditions in CFD simulations.
The thermo-fluid boundary conditions include, the flow rate, direction, area of mouth/nose opening, duration of the event, temperature, and droplet size distribution. These parameters are transient and can have considerable variation among people. But most of the CFD simulations (Kato et al., 2006, 2006; Zhao et al., 2005 and Gao et al., 2006) for virus dispersion predictions have treated these boundary conditions as arbitrary periodic profile with assumed direction, temperature, and a ballpark number for the area of the mouth or nose opening. This assumption could be due to scarcity of reliable source/sink models, which can provide accurate information on these boundary conditions.
The main exhalation modes include, coughing, sneezing, talking, and breathing. All these exhalation modes can introduce significant amount of infectious viruses. The coughing and sneezing have a higher exhalation velocity and droplet concentration but a lower event frequency, while the breathing and talking have a lower velocity and droplet concentration but a higher event frequency. Our early investigation (Gupta et al., 2009) conducted a comprehensive study on thermo-fluid characterization of coughing. This investigation is focused on breathing and talking processes.
Some information on breathing airflow is available in the literature, such as Respiration Frequency (RF), Minute Volume (MV), and Tidal Volume (TV). The RF is defined as the number of breaths in a minute; MV the volume expired in a minute; and TV the volume expired in a single breath. These parameters are of medical interest and had been studied thoroughly (Handbook of Physiology, 1986 and Altman et al., 2004). The RF, MV, and TV vary with age, height, weight, body surface area, sex, posture and physical load (Handbook of Physiology, 1986 and Altman et al., 2004). Flow-volume studies by Araujo (2004) were on evaluating the effect of physical load but not on quantifying the flow rate variation over time. All these studies provide a good insight but not the information as boundary conditions for CFD simulations.
Most of the past efforts on characterizing a talking process were focused on establishing droplet size distribution (Duguid, 1945; Jennison et al., 1942; Wells et al., 1939; Chao et al., 2009 and Morawska et al., 2009). Duguid (1945) revealed that the air flow velocities during a
speech can go up to 16 m/s. Jennision (1942) found that consonants, like ‘F’, when pronounced loudly can generate high flow. Wells (1939) used the Tyndall effect to visualize the pronunciation of the letters ‘P’ and ‘T’. The PIV studies by Chao (2009) indicated that the average velocities during talking can be of the order of 3.1 m/s. But none of the studies quantified the flow rate transience or the variation with people.
There is substantial information on droplet size distribution (Duguid, 1945; Fairchild et al. 1987; Papineni et al., 1997; Edwards et al., 2004; Fabian et al., 2008; Chao et al., 2009 and Morawska et al., 2009), and the exhaled air temperature (Hoppe, 1981), to be used as boundary conditions for the breathing and talking processes. The information is incomplete for CFD simulations because the flow rate and direction of breathing and talking jets and opening area of mouth/nose are not available. Hence our investigation was to address this gap by studying the exhaled flow rate, flow direction, and mouth/nose opening area during breathing and talking, which is reported in this paper.
Research Method and Design This investigation used experimental methods to measure the flow rates, flow directions, and mouth/nose opening areas of breathing and talking processes. A spirometer based on Fleish type pneumotachograph was used to measure the flow rates at 330 Hz. The flow directions were visualized through moderate speed photography at 120Hz. Cigarette smoke was used for flow visualization. The mouth opening areas were measured through the photography at 120Hz. All the measurements were performed with 12 female and 13 male healthy subjects to obtain realistic flow features with an approval from the Institutional Review Board for human subject experimentation. Our early paper (Gupta et al. 2009) reported the experimental equipment and setup in detail so the method is not repeated here.
The most common postures are sitting and standing, and the common routes of breathing are through the mouth and the nose. Thus the measurements were conducted with these variations, with a total of four sets of measurements, as described in Table 1.
Table 1 Design of experiments for breathing
Organ Posture
Mouth Sitting
Nose Standing
The flow rate measurements for talking consisted of three exercises. The first set was based on articulating letters from the alphabet. An alphabet set consists of 6 letters: F, E, C, O, S and T. F, S, and T were found to have the maximum exhalation flow rates, while E, C, and O are the most frequently used letters. Peak velocities of these measurements were analyzed. The second set of measurements was based on enunciating the numbers from one to ten. This was done to correlate the number of droplets with flow rates as the measurements on droplet sizes were done for this kind of exercise (Papineni et al., 1997). The third set was based on the pronunciation of a reading rainbow passage (Fairbanks, 1940). This passage contains a mixture of oral and nasal consonants in the approximate proportion found in everyday speech (Seaver et al., 1991) and, hence, provides a reflection of the possible combination of flow rates that can be found in a conversation. The airflow rates from both the subject’s mouth and nose were recorded during this exercise.
The flow visualization study was performed on smoker subjects. Smoking may affect the lung capacity and thus the lung performance. But as the direction of the exhalation jet is mainly dependent on the immediate airways (nostrils or the mouth opening), smoking may not affect the direction of the exhaled jet significantly. A light source was placed beneath a subject’s face to throw light upwards. The light source, when used along with a dark background, helped with the flow visualization. The subjects were asked to exhale smoke out through breathing and saying words/letters.
The measurements of the mouth/nose opening area were performed over 8 male and 8 female subjects. The subjects were asked to breathe normally and talk, and the front and side views close to each subject’s lips were captured for the whole event.
Results This section reports the experimental results on breathing and talking processes.
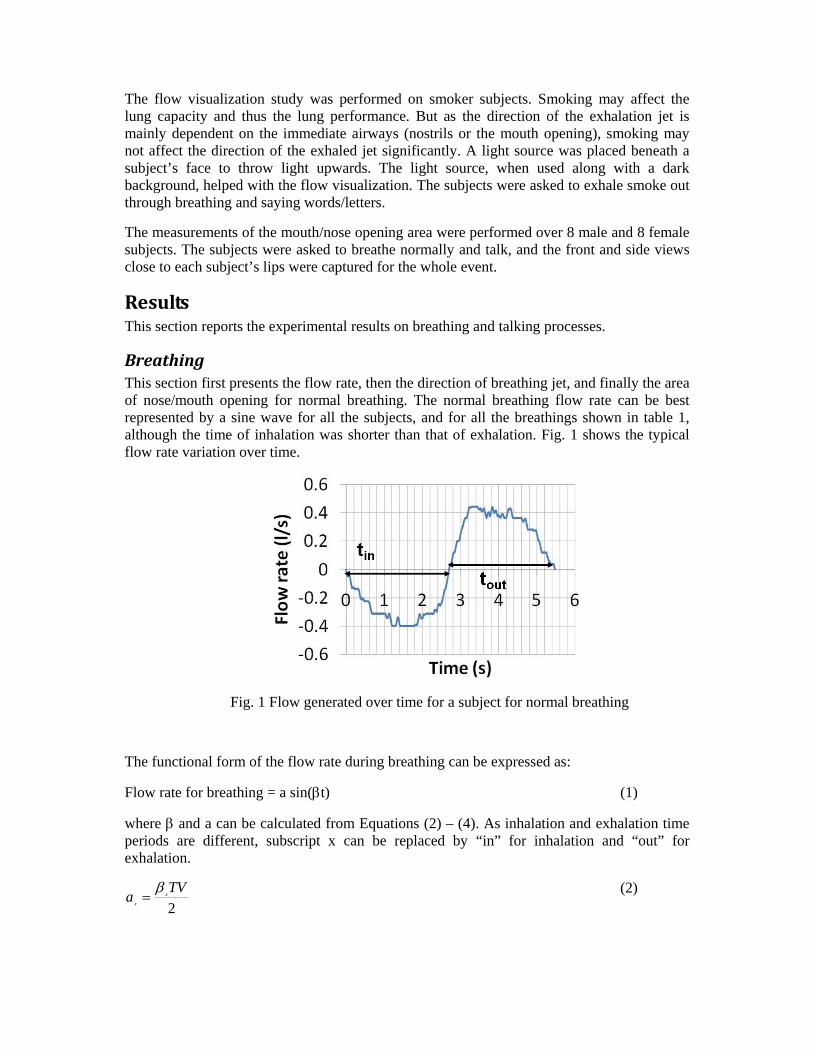
Breathing This section first presents the flow rate, then the direction of breathing jet, and finally the area of nose/mouth opening for normal breathing. The normal breathing flow rate can be best represented by a sine wave for all the subjects, and for all the breathings shown in table 1, although the time of inhalation was shorter than that of exhalation. Fig. 1 shows the typical flow rate variation over time.
Fig. 1 Flow generated over time for a subject for normal breathing
The functional form of the flow rate during breathing can be expressed as:
Flow rate for breathing = a sin(t) (1)
where and a can be calculated from Equations (2) – (4). As inhalation and exhalation time periods are different, subscript x can be replaced by “in” for inhalation and “out” for exhalation.
2
TVa x
x
(2)
outin
outin
RFRF
RFRFMVTV
2
)( (3)
30x
x
RF (4)
The MV and RF can vary with the subject, organ of breathing or human posture, and so will “a” and “”. We conducted statistical tests to investigate the influence of organ of breathing and human posture on MV and RF. The RF and thus MV can change with the organ of breathing due to the differences in the routes of respiration (Douglas et al., 1983), but the hypothesis testing through the paired t tests indicated no significant differences in the current data. Human posture affects the activity of the abdominal muscle and thus may influence the breathing (Kera et al., 2005). The paired t test indicated no significant differences in the MV and RF due to the change in the posture. This is in agreement with studies by Kera, 2005. Therefore further analysis was performed on the nose breathing in sitting posture.
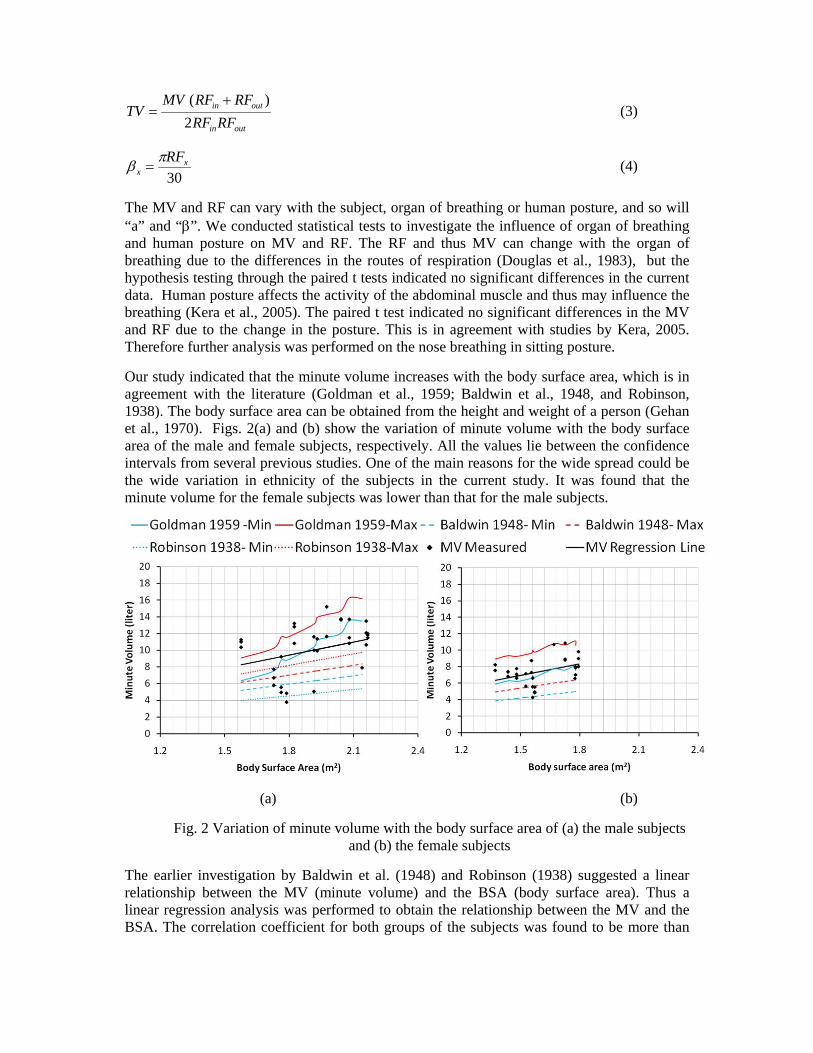
Our study indicated that the minute volume increases with the body surface area, which is in agreement with the literature (Goldman et al., 1959; Baldwin et al., 1948, and Robinson, 1938). The body surface area can be obtained from the height and weight of a person (Gehan et al., 1970). Figs. 2(a) and (b) show the variation of minute volume with the body surface area of the male and female subjects, respectively. All the values lie between the confidence intervals from several previous studies. One of the main reasons for the wide spread could be the wide variation in ethnicity of the subjects in the current study. It was found that the minute volume for the female subjects was lower than that for the male subjects.
(a) (b)
Fig. 2 Variation of minute volume with the body surface area of (a) the male subjects and (b) the female subjects
The earlier investigation by Baldwin et al. (1948) and Robinson (1938) suggested a linear relationship between the MV (minute volume) and the BSA (body surface area). Thus a linear regression analysis was performed to obtain the relationship between the MV and the BSA. The correlation coefficient for both groups of the subjects was found to be more than
0.4 for a p less than 0.05. The relationship for the male and female subjects can be described by Equations (5) and (6) respectively.
)(225.5)( 2mBSAliterMVmale
(5)
)(634.4)( 2mBSAliterMVfemale
(6)
The confidence interval for the slope for the male and female subjects was from 4.838 to 5.868 liter/m2 and 4.421 to 5.16 liter/m2, respectively.
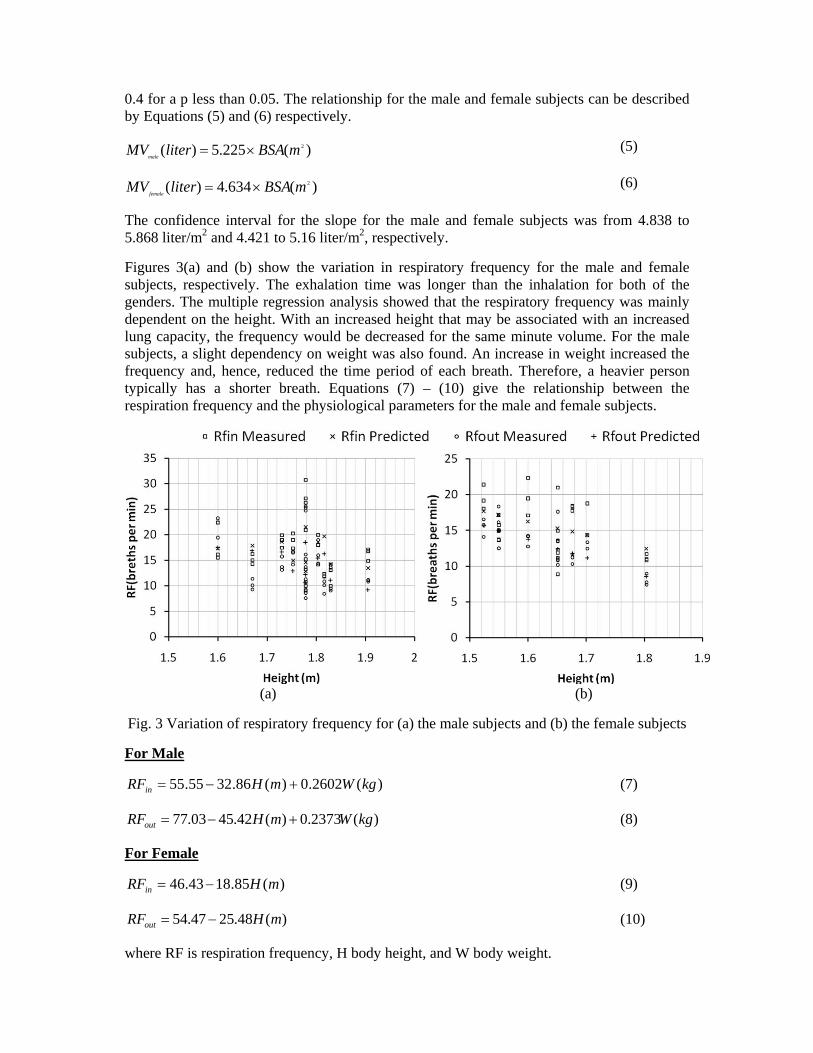
Figures 3(a) and (b) show the variation in respiratory frequency for the male and female subjects, respectively. The exhalation time was longer than the inhalation for both of the genders. The multiple regression analysis showed that the respiratory frequency was mainly dependent on the height. With an increased height that may be associated with an increased lung capacity, the frequency would be decreased for the same minute volume. For the male subjects, a slight dependency on weight was also found. An increase in weight increased the frequency and, hence, reduced the time period of each breath. Therefore, a heavier person typically has a shorter breath. Equations (7) – (10) give the relationship between the respiration frequency and the physiological parameters for the male and female subjects.
(a) (b)
Fig. 3 Variation of respiratory frequency for (a) the male subjects and (b) the female subjects
For Male
)(2602.0)(86.3255.55 kgWmHRFin (7)
)(2373.0)(42.4503.77 kgWmHRFout (8)
For Female
)(85.1843.46 mHRFin (9)
)(48.2547.54 mHRFout (10)
where RF is respiration frequency, H body height, and W body weight.
Thus, with physiological parameters of a person, the minute volume and respiratory frequencies can be obtained using equations (5) – (10). The amplitude and frequency of the breathing sine wave can then be calculated from the MV, RFin, and RFout through equations (2) – (4). Finally the flow rate over time can be obtained with the a and values via equation (1).
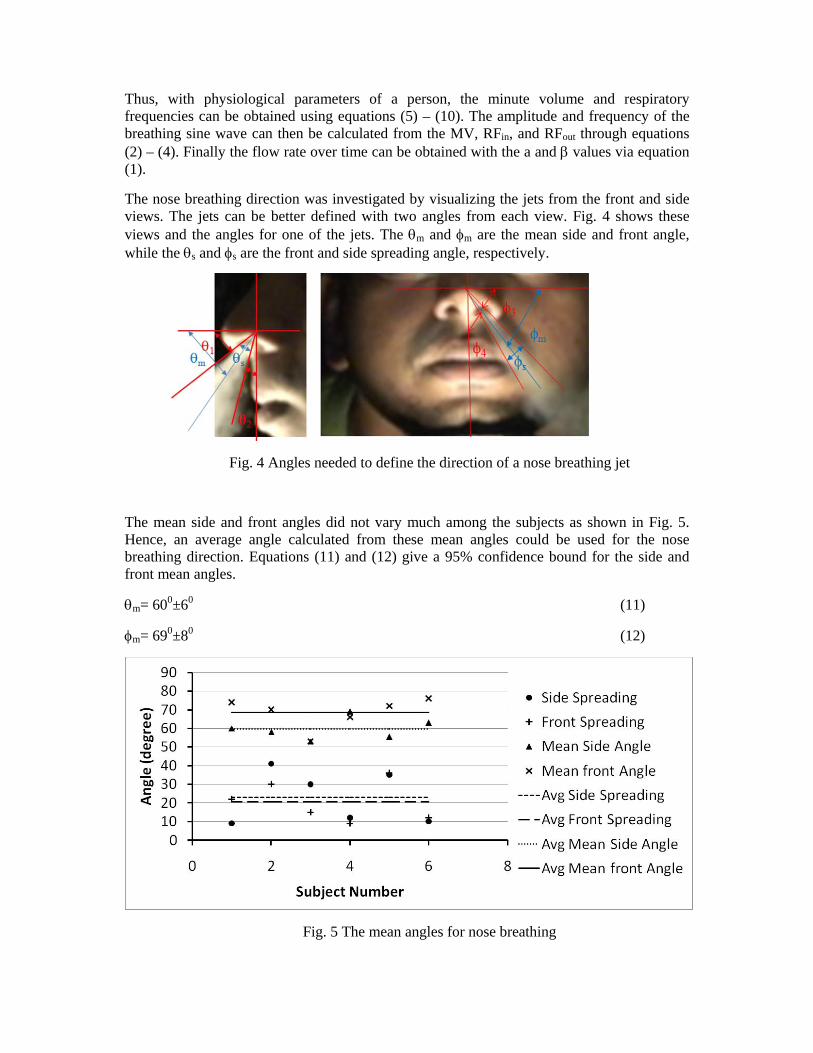
The nose breathing direction was investigated by visualizing the jets from the front and side views. The jets can be better defined with two angles from each view. Fig. 4 shows these views and the angles for one of the jets. The m and m are the mean side and front angle, while the s and s are the front and side spreading angle, respectively.
Fig. 4 Angles needed to define the direction of a nose breathing jet
The mean side and front angles did not vary much among the subjects as shown in Fig. 5. Hence, an average angle calculated from these mean angles could be used for the nose breathing direction. Equations (11) and (12) give a 95% confidence bound for the side and front mean angles.
m= 600±60 (11)
m= 690±80 (12)
Fig. 5 The mean angles for nose breathing
Similar variation was observed for the spreading angle though there was variation among the subjects as shown in Fig. 5. Thus, averaged mean and spreading angles with 95% confidence bounds are proposed and are given by equations (13) and (14) respectively.
s= 230±140 (13)
s= 210±100 (14)
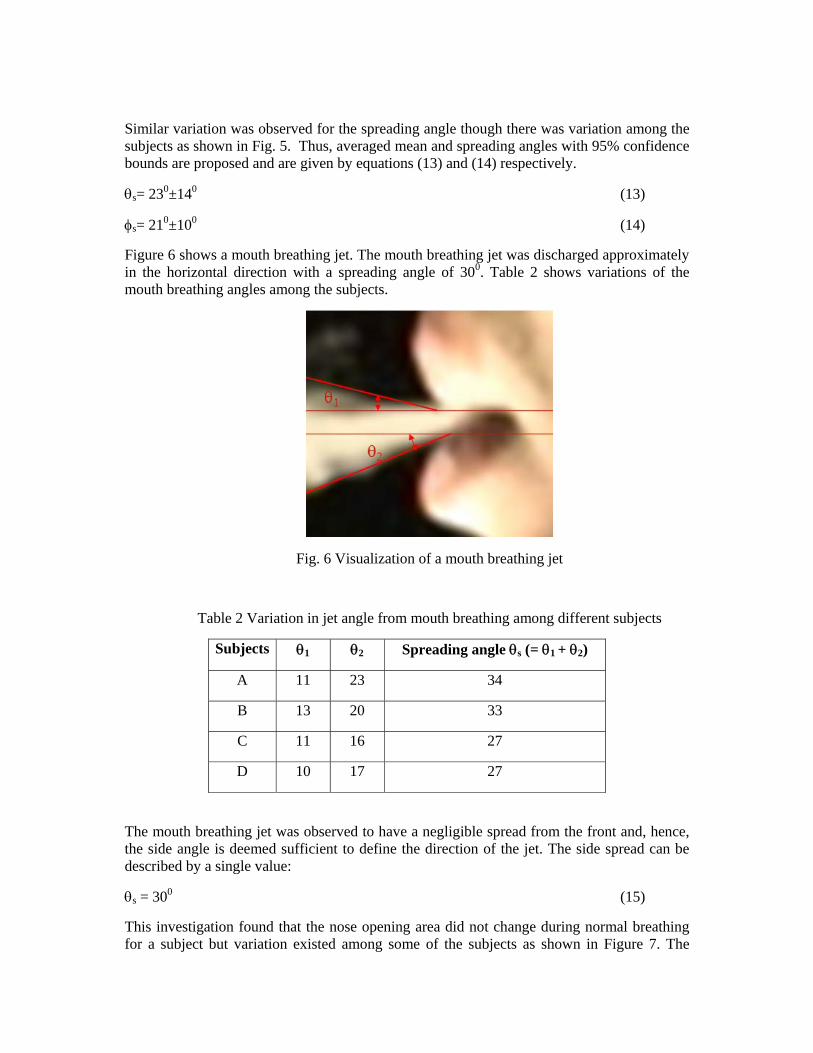
Figure 6 shows a mouth breathing jet. The mouth breathing jet was discharged approximately in the horizontal direction with a spreading angle of 300. Table 2 shows variations of the mouth breathing angles among the subjects.
Fig. 6 Visualization of a mouth breathing jet
Table 2 Variation in jet angle from mouth breathing among different subjects
Subjects 1 2 Spreading angle s (= 1 + 2)
A 11 23 34
B 13 20 33
C 11 16 27
D 10 17 27
The mouth breathing jet was observed to have a negligible spread from the front and, hence, the side angle is deemed sufficient to define the direction of the jet. The side spread can be described by a single value:
s = 300 (15)
This investigation found that the nose opening area did not change during normal breathing for a subject but variation existed among some of the subjects as shown in Figure 7. The
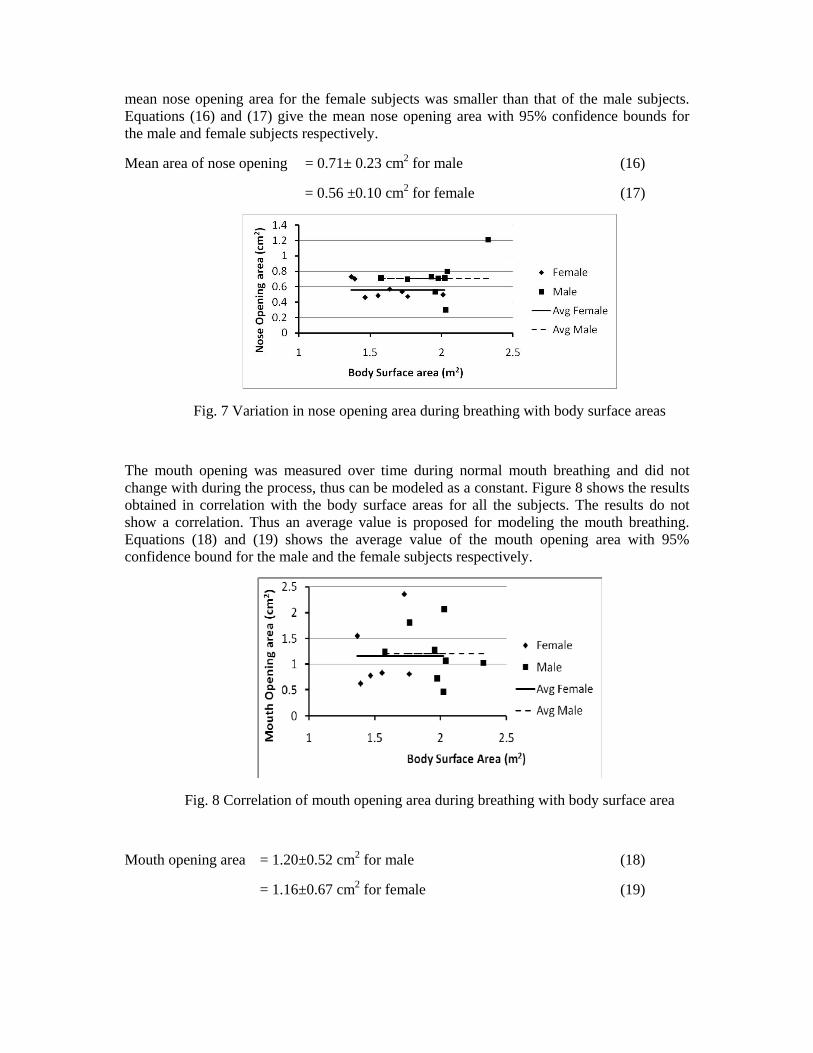
mean nose opening area for the female subjects was smaller than that of the male subjects. Equations (16) and (17) give the mean nose opening area with 95% confidence bounds for the male and female subjects respectively.
Mean area of nose opening = 0.71± 0.23 cm2 for male (16)
= 0.56 ±0.10 cm2 for female (17)
Fig. 7 Variation in nose opening area during breathing with body surface areas
The mouth opening was measured over time during normal mouth breathing and did not change with during the process, thus can be modeled as a constant. Figure 8 shows the results obtained in correlation with the body surface areas for all the subjects. The results do not show a correlation. Thus an average value is proposed for modeling the mouth breathing. Equations (18) and (19) shows the average value of the mouth opening area with 95% confidence bound for the male and the female subjects respectively.
Fig. 8 Correlation of mouth opening area during breathing with body surface area
Mouth opening area = 1.20±0.52 cm2 for male (18)
= 1.16±0.67 cm2 for female (19)
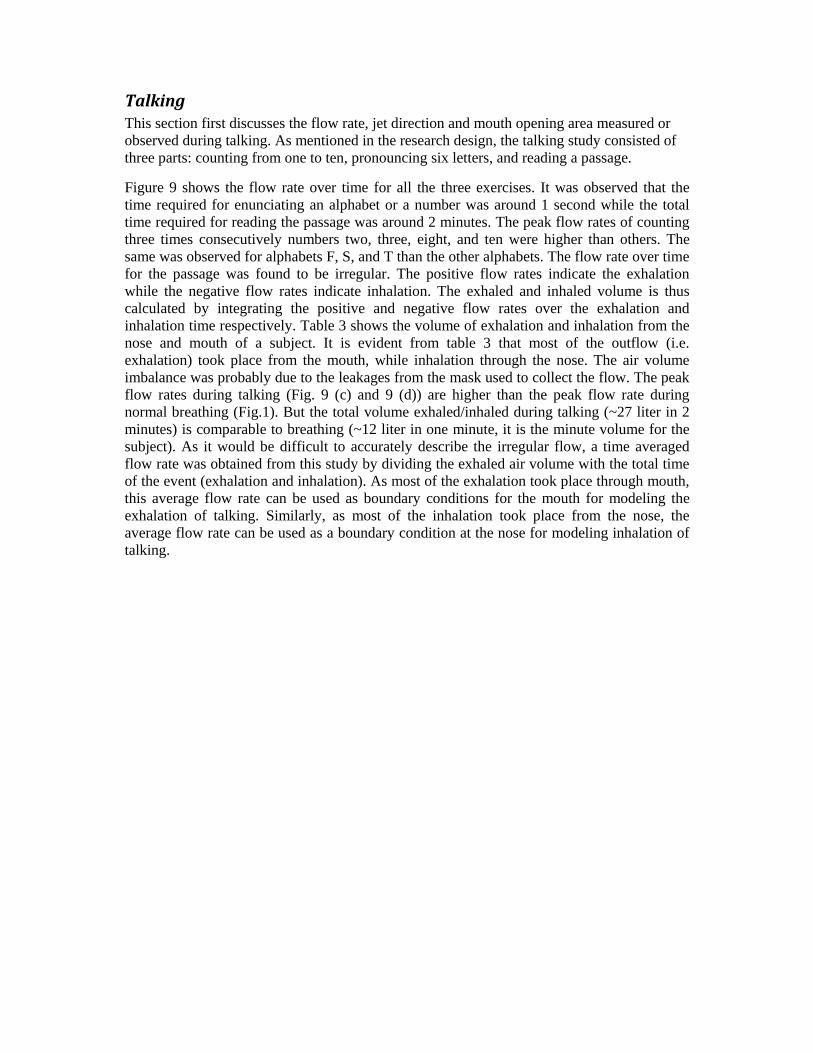
Talking This section first discusses the flow rate, jet direction and mouth opening area measured or observed during talking. As mentioned in the research design, the talking study consisted of three parts: counting from one to ten, pronouncing six letters, and reading a passage.
Figure 9 shows the flow rate over time for all the three exercises. It was observed that the time required for enunciating an alphabet or a number was around 1 second while the total time required for reading the passage was around 2 minutes. The peak flow rates of counting three times consecutively numbers two, three, eight, and ten were higher than others. The same was observed for alphabets F, S, and T than the other alphabets. The flow rate over time for the passage was found to be irregular. The positive flow rates indicate the exhalation while the negative flow rates indicate inhalation. The exhaled and inhaled volume is thus calculated by integrating the positive and negative flow rates over the exhalation and inhalation time respectively. Table 3 shows the volume of exhalation and inhalation from the nose and mouth of a subject. It is evident from table 3 that most of the outflow (i.e. exhalation) took place from the mouth, while inhalation through the nose. The air volume imbalance was probably due to the leakages from the mask used to collect the flow. The peak flow rates during talking (Fig. 9 (c) and 9 (d)) are higher than the peak flow rate during normal breathing (Fig.1). But the total volume exhaled/inhaled during talking (~27 liter in 2 minutes) is comparable to breathing (~12 liter in one minute, it is the minute volume for the subject). As it would be difficult to accurately describe the irregular flow, a time averaged flow rate was obtained from this study by dividing the exhaled air volume with the total time of the event (exhalation and inhalation). As most of the exhalation took place through mouth, this average flow rate can be used as boundary conditions for the mouth for modeling the exhalation of talking. Similarly, as most of the inhalation took place from the nose, the average flow rate can be used as a boundary condition at the nose for modeling inhalation of talking.
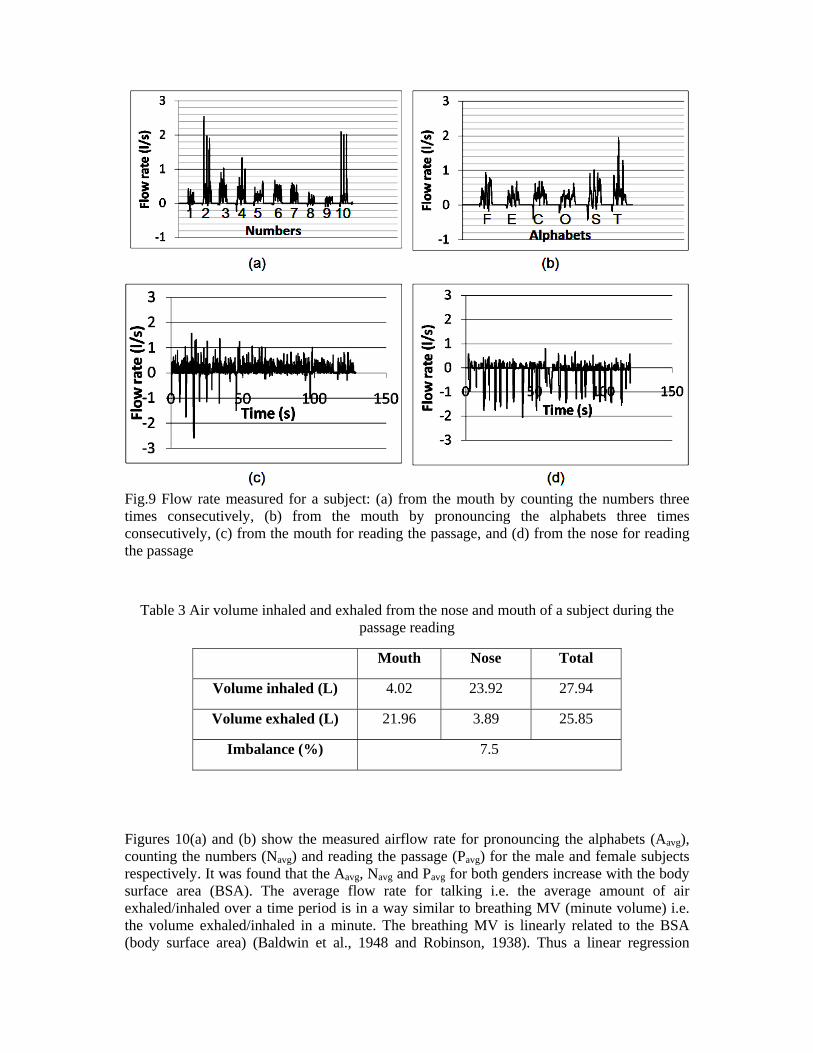
Fig.9 Flow rate measured for a subject: (a) from the mouth by counting the numbers three times consecutively, (b) from the mouth by pronouncing the alphabets three times consecutively, (c) from the mouth for reading the passage, and (d) from the nose for reading the passage
Table 3 Air volume inhaled and exhaled from the nose and mouth of a subject during the passage reading
Mouth Nose Total
Volume inhaled (L) 4.02 23.92 27.94
Volume exhaled (L) 21.96 3.89 25.85
Imbalance (%) 7.5
Figures 10(a) and (b) show the measured airflow rate for pronouncing the alphabets (Aavg), counting the numbers (Navg) and reading the passage (Pavg) for the male and female subjects respectively. It was found that the Aavg, Navg and Pavg for both genders increase with the body surface area (BSA). The average flow rate for talking i.e. the average amount of air exhaled/inhaled over a time period is in a way similar to breathing MV (minute volume) i.e. the volume exhaled/inhaled in a minute. The breathing MV is linearly related to the BSA (body surface area) (Baldwin et al., 1948 and Robinson, 1938). Thus a linear regression
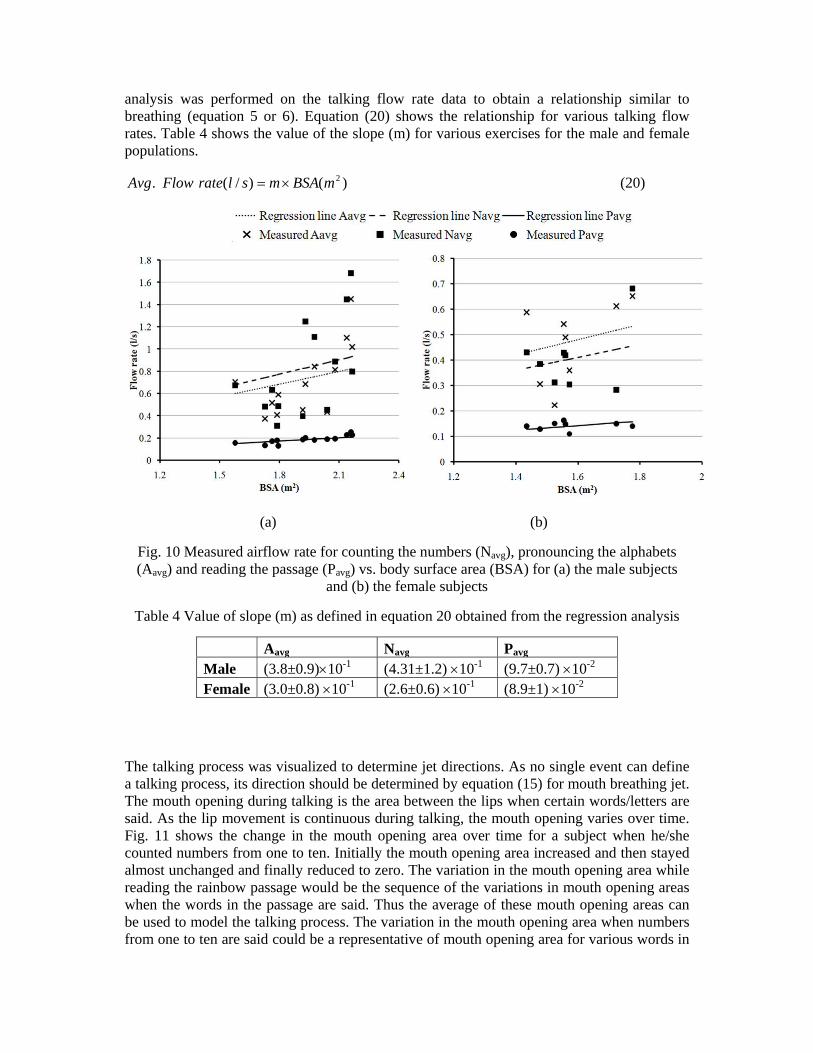
analysis was performed on the talking flow rate data to obtain a relationship similar to breathing (equation 5 or 6). Equation (20) shows the relationship for various talking flow rates. Table 4 shows the value of the slope (m) for various exercises for the male and female populations.
)()/(. 2mBSAmslrateFlowAvg (20)
(a) (b)
Fig. 10 Measured airflow rate for counting the numbers (Navg), pronouncing the alphabets (Aavg) and reading the passage (Pavg) vs. body surface area (BSA) for (a) the male subjects
and (b) the female subjects
Table 4 Value of slope (m) as defined in equation 20 obtained from the regression analysis
Aavg Navg Pavg Male (3.8±0.9)10-1 (4.31±1.2) 10-1 (9.7±0.7) 10-2 Female (3.0±0.8) 10-1 (2.6±0.6) 10-1 (8.9±1) 10-2
The talking process was visualized to determine jet directions. As no single event can define a talking process, its direction should be determined by equation (15) for mouth breathing jet. The mouth opening during talking is the area between the lips when certain words/letters are said. As the lip movement is continuous during talking, the mouth opening varies over time. Fig. 11 shows the change in the mouth opening area over time for a subject when he/she counted numbers from one to ten. Initially the mouth opening area increased and then stayed almost unchanged and finally reduced to zero. The variation in the mouth opening area while reading the rainbow passage would be the sequence of the variations in mouth opening areas when the words in the passage are said. Thus the average of these mouth opening areas can be used to model the talking process. The variation in the mouth opening area when numbers from one to ten are said could be a representative of mouth opening area for various words in
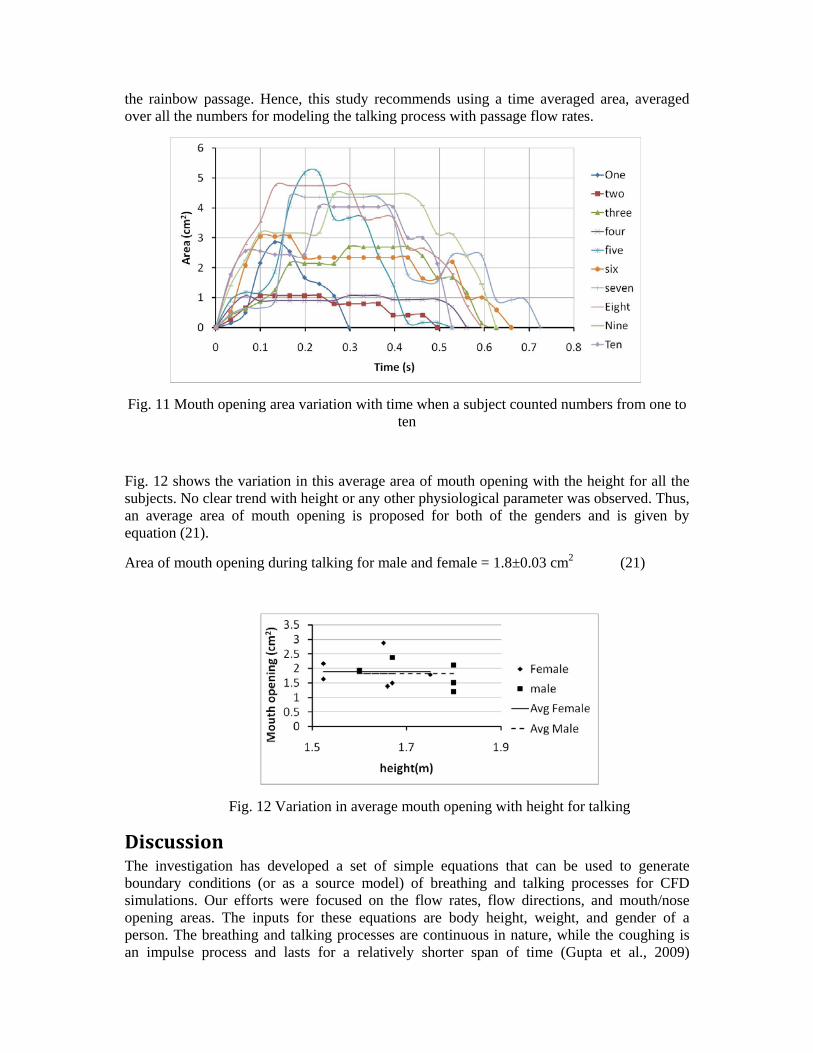
the rainbow passage. Hence, this study recommends using a time averaged area, averaged over all the numbers for modeling the talking process with passage flow rates.
Fig. 11 Mouth opening area variation with time when a subject counted numbers from one to ten
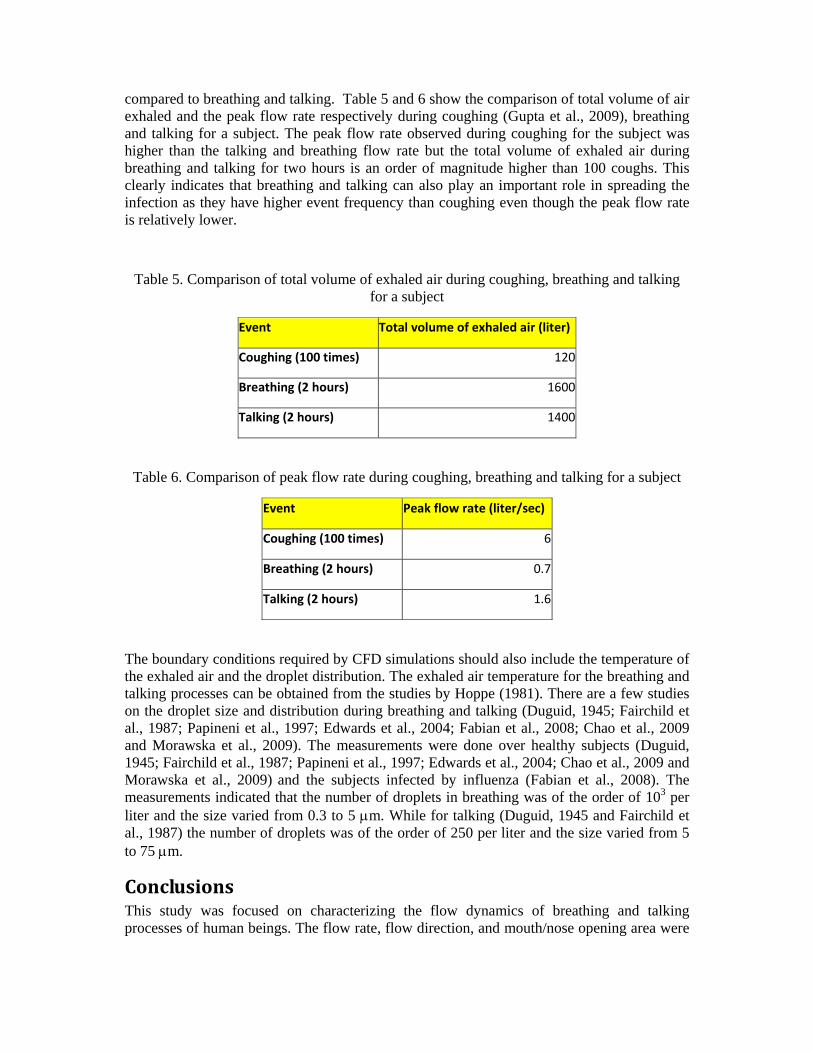
Fig. 12 shows the variation in this average area of mouth opening with the height for all the subjects. No clear trend with height or any other physiological parameter was observed. Thus, an average area of mouth opening is proposed for both of the genders and is given by equation (21).
Area of mouth opening during talking for male and female = 1.8±0.03 cm2 (21)
Fig. 12 Variation in average mouth opening with height for talking
Discussion The investigation has developed a set of simple equations that can be used to generate boundary conditions (or as a source model) of breathing and talking processes for CFD simulations. Our efforts were focused on the flow rates, flow directions, and mouth/nose opening areas. The inputs for these equations are body height, weight, and gender of a person. The breathing and talking processes are continuous in nature, while the coughing is an impulse process and lasts for a relatively shorter span of time (Gupta et al., 2009)
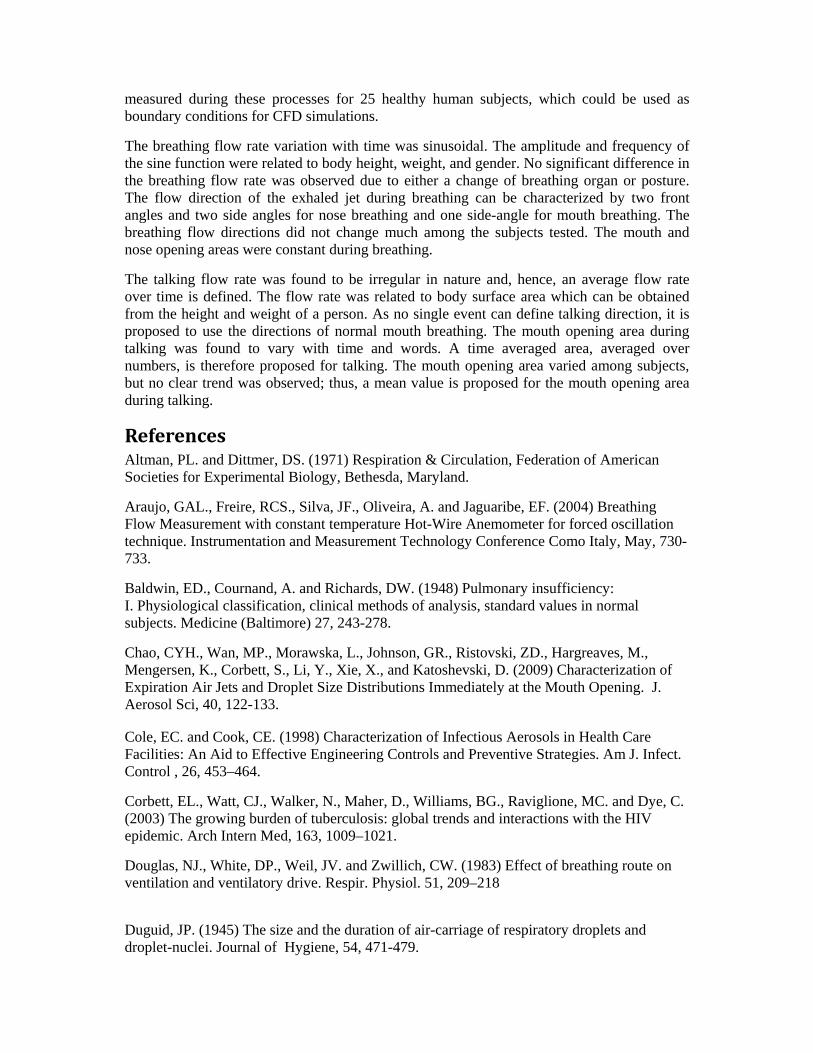
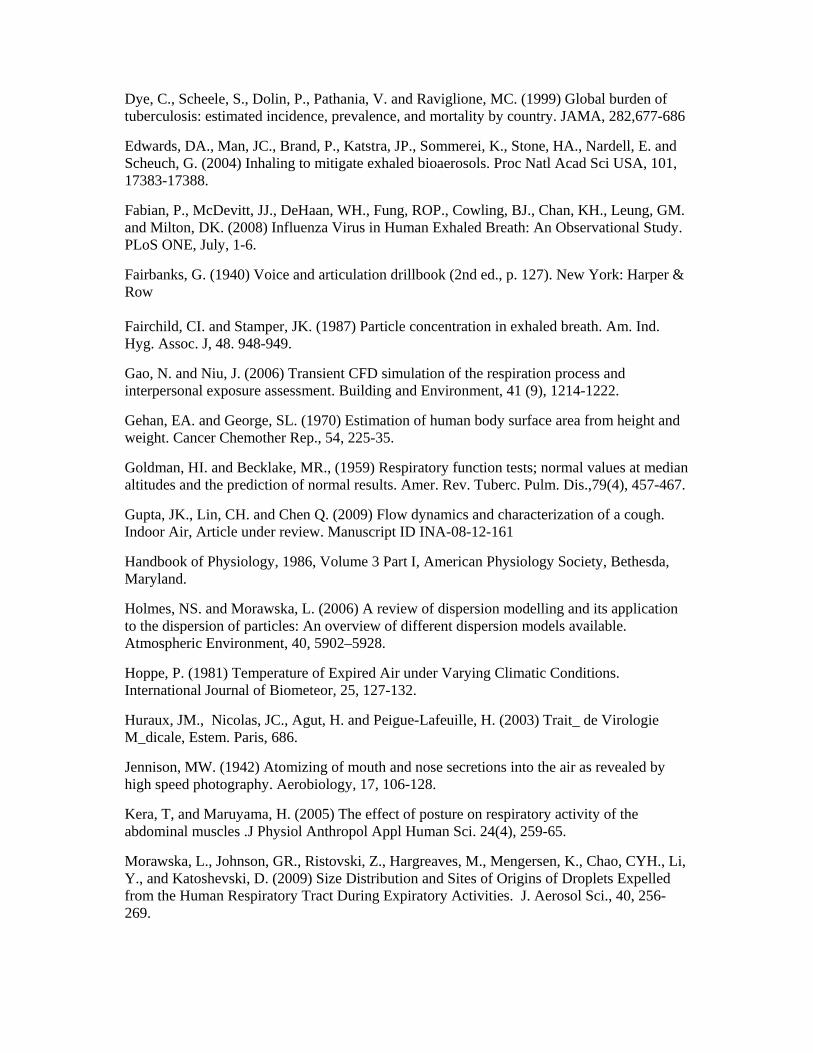
compared to breathing and talking. Table 5 and 6 show the comparison of total volume of air exhaled and the peak flow rate respectively during coughing (Gupta et al., 2009), breathing and talking for a subject. The peak flow rate observed during coughing for the subject was higher than the talking and breathing flow rate but the total volume of exhaled air during breathing and talking for two hours is an order of magnitude higher than 100 coughs. This clearly indicates that breathing and talking can also play an important role in spreading the infection as they have higher event frequency than coughing even though the peak flow rate is relatively lower.
Table 5. Comparison of total volume of exhaled air during coughing, breathing and talking for a subject
Event Total volume of exhaled air (liter)
Coughing (100 times) 120
Breathing (2 hours) 1600
Talking (2 hours) 1400
Table 6. Comparison of peak flow rate during coughing, breathing and talking for a subject
Event Peak flow rate (liter/sec)
Coughing (100 times) 6
Breathing (2 hours) 0.7
Talking (2 hours) 1.6
The boundary conditions required by CFD simulations should also include the temperature of the exhaled air and the droplet distribution. The exhaled air temperature for the breathing and talking processes can be obtained from the studies by Hoppe (1981). There are a few studies on the droplet size and distribution during breathing and talking (Duguid, 1945; Fairchild et al., 1987; Papineni et al., 1997; Edwards et al., 2004; Fabian et al., 2008; Chao et al., 2009 and Morawska et al., 2009). The measurements were done over healthy subjects (Duguid, 1945; Fairchild et al., 1987; Papineni et al., 1997; Edwards et al., 2004; Chao et al., 2009 and Morawska et al., 2009) and the subjects infected by influenza (Fabian et al., 2008). The measurements indicated that the number of droplets in breathing was of the order of 103 per liter and the size varied from 0.3 to 5 m. While for talking (Duguid, 1945 and Fairchild et al., 1987) the number of droplets was of the order of 250 per liter and the size varied from 5 to 75 m.
Conclusions This study was focused on characterizing the flow dynamics of breathing and talking processes of human beings. The flow rate, flow direction, and mouth/nose opening area were
measured during these processes for 25 healthy human subjects, which could be used as boundary conditions for CFD simulations.
The breathing flow rate variation with time was sinusoidal. The amplitude and frequency of the sine function were related to body height, weight, and gender. No significant difference in the breathing flow rate was observed due to either a change of breathing organ or posture. The flow direction of the exhaled jet during breathing can be characterized by two front angles and two side angles for nose breathing and one side-angle for mouth breathing. The breathing flow directions did not change much among the subjects tested. The mouth and nose opening areas were constant during breathing.
The talking flow rate was found to be irregular in nature and, hence, an average flow rate over time is defined. The flow rate was related to body surface area which can be obtained from the height and weight of a person. As no single event can define talking direction, it is proposed to use the directions of normal mouth breathing. The mouth opening area during talking was found to vary with time and words. A time averaged area, averaged over numbers, is therefore proposed for talking. The mouth opening area varied among subjects, but no clear trend was observed; thus, a mean value is proposed for the mouth opening area during talking.
References Altman, PL. and Dittmer, DS. (1971) Respiration & Circulation, Federation of American Societies for Experimental Biology, Bethesda, Maryland.
Araujo, GAL., Freire, RCS., Silva, JF., Oliveira, A. and Jaguaribe, EF. (2004) Breathing Flow Measurement with constant temperature Hot-Wire Anemometer for forced oscillation technique. Instrumentation and Measurement Technology Conference Como Italy, May, 730-733.
Baldwin, ED., Cournand, A. and Richards, DW. (1948) Pulmonary insufficiency: I. Physiological classification, clinical methods of analysis, standard values in normal subjects. Medicine (Baltimore) 27, 243-278.
Chao, CYH., Wan, MP., Morawska, L., Johnson, GR., Ristovski, ZD., Hargreaves, M., Mengersen, K., Corbett, S., Li, Y., Xie, X., and Katoshevski, D. (2009) Characterization of Expiration Air Jets and Droplet Size Distributions Immediately at the Mouth Opening. J. Aerosol Sci, 40, 122-133. Cole, EC. and Cook, CE. (1998) Characterization of Infectious Aerosols in Health Care Facilities: An Aid to Effective Engineering Controls and Preventive Strategies. Am J. Infect. Control , 26, 453–464.
Corbett, EL., Watt, CJ., Walker, N., Maher, D., Williams, BG., Raviglione, MC. and Dye, C. (2003) The growing burden of tuberculosis: global trends and interactions with the HIV epidemic. Arch Intern Med, 163, 1009–1021.
Douglas, NJ., White, DP., Weil, JV. and Zwillich, CW. (1983) Effect of breathing route on ventilation and ventilatory drive. Respir. Physiol. 51, 209–218
Duguid, JP. (1945) The size and the duration of air-carriage of respiratory droplets and droplet-nuclei. Journal of Hygiene, 54, 471-479.
Dye, C., Scheele, S., Dolin, P., Pathania, V. and Raviglione, MC. (1999) Global burden of tuberculosis: estimated incidence, prevalence, and mortality by country. JAMA, 282,677-686
Edwards, DA., Man, JC., Brand, P., Katstra, JP., Sommerei, K., Stone, HA., Nardell, E. and Scheuch, G. (2004) Inhaling to mitigate exhaled bioaerosols. Proc Natl Acad Sci USA, 101, 17383-17388.
Fabian, P., McDevitt, JJ., DeHaan, WH., Fung, ROP., Cowling, BJ., Chan, KH., Leung, GM. and Milton, DK. (2008) Influenza Virus in Human Exhaled Breath: An Observational Study. PLoS ONE, July, 1-6.
Fairbanks, G. (1940) Voice and articulation drillbook (2nd ed., p. 127). New York: Harper & Row Fairchild, CI. and Stamper, JK. (1987) Particle concentration in exhaled breath. Am. Ind. Hyg. Assoc. J, 48. 948-949.
Gao, N. and Niu, J. (2006) Transient CFD simulation of the respiration process and interpersonal exposure assessment. Building and Environment, 41 (9), 1214-1222.
Gehan, EA. and George, SL. (1970) Estimation of human body surface area from height and weight. Cancer Chemother Rep., 54, 225-35.
Goldman, HI. and Becklake, MR., (1959) Respiratory function tests; normal values at median altitudes and the prediction of normal results. Amer. Rev. Tuberc. Pulm. Dis.,79(4), 457-467.
Gupta, JK., Lin, CH. and Chen Q. (2009) Flow dynamics and characterization of a cough. Indoor Air, Article under review. Manuscript ID INA-08-12-161
Handbook of Physiology, 1986, Volume 3 Part I, American Physiology Society, Bethesda, Maryland.
Holmes, NS. and Morawska, L. (2006) A review of dispersion modelling and its application to the dispersion of particles: An overview of different dispersion models available. Atmospheric Environment, 40, 5902–5928.
Hoppe, P. (1981) Temperature of Expired Air under Varying Climatic Conditions. International Journal of Biometeor, 25, 127-132.
Huraux, JM., Nicolas, JC., Agut, H. and Peigue-Lafeuille, H. (2003) Trait_ de Virologie M_dicale, Estem. Paris, 686.
Jennison, MW. (1942) Atomizing of mouth and nose secretions into the air as revealed by high speed photography. Aerobiology, 17, 106-128.
Kera, T, and Maruyama, H. (2005) The effect of posture on respiratory activity of the abdominal muscles .J Physiol Anthropol Appl Human Sci. 24(4), 259-65.
Morawska, L., Johnson, GR., Ristovski, Z., Hargreaves, M., Mengersen, K., Chao, CYH., Li, Y., and Katoshevski, D. (2009) Size Distribution and Sites of Origins of Droplets Expelled from the Human Respiratory Tract During Expiratory Activities. J. Aerosol Sci., 40, 256-269.
Papineni, RS. and Rosenthal, FS. (1997) The size distribution of droplets in the exhaled breath of healthy human subjects. J Aerosol Med., 10, 105–116.
Robinson, S., (1938) Experimental studies of physical fitness in relation to age. European Journal of Applied Physiology,10, 251-323.
Seaver, EJ., Dalston, RM., Leeper, HA. and Adams, LE. (1991) A study of nasometric values for normal nasal resonance. Journal of Speech, Language and Hearing Research, ASHA, 34, 715-721.
Viboud, C., Boelle, PY. and Pakdaman K, et al. (2004) Influenza epidemics in the United States, France, and Australia, 1972–1997. Emerg Infect Dis, 10, 32–39. Wells, WF., Wells, MW. and Mudd, S. (1939) Infection of Air: Bacteriologic and Epidemiologic Factors. American Journal of Public Health, 29, 863-880.
Zhao, B., Zhang, Z. and Li, X. (2005) Numerical Study of Transport of droplets or particles generated by respiratory system indoors. Building and Environment, 40 (8), 1032-1039.
Zhu, S., Kato, S. and Yang, JH. (2006) Investigation into airborne transport characteristics of air-flow due to coughing in a stagnant room environment. American Society of Heating, Refrigerating and Air-Conditioning Engineers Transaction, 112, 123-133.
Zhu, S., Kato, S. and Yang, JH. (2006) Study on transport characteristics of saliva droplets produced by coughing in a calm indoor environment. Building and Environment, 41, 1691-1702.