characterization of volume holographic optical elements … · 2016-04-15 · characterization of...
TRANSCRIPT
Characterization of volume holographic optical elements recorded in Bayfol HX photopolymer
for solar photovoltaic applications Julia Marín-Sáez,1 Jesús Atencia,2,* Daniel Chemisana,1 and María-Victoria Collados2
1Departamento de Medio Ambiente (Sección de Física Aplicada), Universidad de Lleida, Escuela Politécnica Superior (INSPIRES), Jaume II 69, 25001 Lleida, Spain
2Departamento de Física Aplicada, Instituto de Investigación en Ingeniería de Aragón (I3A), Universidad de Zaragoza, Facultad de Ciencias, Pedro Cerbuna 12, 50009 Zaragoza, Spain
Abstract: Volume Holographic Optical Elements (HOEs) present interesting characteristics for photovoltaic applications as they can select spectrum for concentrating the target bandwidth and avoiding non-desired wavelengths, which can cause the decrease of the performance on the cell, for instance by overheating it. Volume HOEs have been recorded on Bayfol HX photopolymer to test the suitability of this material for solar concentrating photovoltaic systems. The HOEs were recorded at 532 nm and provided a dynamic range, reaching close to 100% efficiency at 800 nm. The diffracted spectrum had a FWHM of 230 nm when illuminating at Bragg angle. These characteristics prove HOEs recorded on Bayfol HX photopolymer are suitable for concentrating solar light onto photovoltaic cells sensitive to that wavelength range.
©2016 Optical Society of America
OCIS codes: (350.6050) Solar energy; (090.2890) Holographic optical elements; (090.7330) Volume gratings; (160.5335) Photosensitive materials.
References and links
1. M. V. Collados, D. Chemisana, and J. Atencia, “Holographic solar energy systems: the role of optical elements,” Renew. Sustain. Energy Rev. 59, 130–140 (2016).
2. H. Field, “Solar cell spectral response measurement errors related to spectral band width and chopped light waveform,” in Conference Record of the Twenty Sixth IEEE Photovoltaic Specialists Conference - 1997 (IEEE, 1997), pp. 471–474.
3. C. Xiao, X. Yu, D. Yang, and D. Que, “Impact of solar irradiance intensity and temperature on the performance of compensated crystalline silicon solar cells,” Sol. Energy Mater. Sol. Cells 128, 427–434 (2014).
4. S. Chander, A. Purohit, A. Sharma, S. P. Nehra, and M. S. Dhaka, “A study on photovoltaic parameters of mono-crystalline silicon solar cell with cell temperature,” Energy Reports 1, 104–109 (2015).
5. D. Chemisana, M. V. Collados, M. Quintanilla, and J. Atencia, “Holographic lenses for building integrated concentrating photovoltaics,” Appl. Energy 110, 227–235 (2013).
6. J. E. Ludman, J. Riccobono, I. V. Semenova, N. O. Reinhand, W. Tai, X. Li, G. Syphers, E. Rallis, G. Sliker, and J. Martín, “The optimization of a holographic system for solar power generation,” Sol. Energy 60(1), 1–9 (1997).
7. A. Villamarín, J. Atencia, M. V. Collados, and M. Quintanilla, “Characterization of transmission volume holographic gratings recorded in Slavich PFG04 dichromated gelatin plates,” Appl. Opt. 48(22), 4348–4353 (2009).
8. P. Bañares-Palacios, S. Álvarez-Álvarez, J. Marín-Sáez, M.-V. Collados, D. Chemisana, and J. Atencia, “Broadband behavior of transmission volume holographic optical elements for solar concentration,” Opt. Express 23(11), A671–A681 (2015).
9. D. Zhang, J. M. Castro, and R. K. Kostuk, “One-axis tracking holographic planar concentrator systems,” J. Photonics Energy 1(1), 015505 (2011).
10. J. M. Castro, D. Zhang, B. Myer, and R. K. Kostuk, “Energy collection efficiency of holographic planar solar concentrators,” Appl. Opt. 49(5), 858–870 (2010).
11. C. G. Stojanoff, “A review of selected technological applications of DCG holograms,” Proc. SPIE 7957, 79570 (2011).
12. S. T. L. Sam, A. P. T. Kumar, P. Predeep, M. Thakur, and M. K. R. Varma, “Design and Optimization of Photopolymer Based Holographic Solar Concentrators,” in Optics: Phenomena, Materials, Devices and Characterization, (AIP Conference Proceedings, 2011), pp. 248–250.
13. H. Akbari, I. Naydenova, and S. Martin, “Using acrylamide-based photopolymers for fabrication of holographic optical elements in solar energy applications,” Appl. Opt. 53(7), 1343–1353 (2014).
#258926 Received 3 Feb 2016; revised 10 Mar 2016; accepted 12 Mar 2016; published 18 Mar 2016 © 2016 OSA 21 Mar 2016 | Vol. 24, No. 6 | DOI:10.1364/OE.24.00A720 | OPTICS EXPRESS A720
14. G. Bianco, M. A. Ferrara, F. Borbone, A. Roviello, V. Pagliarulo, S. Grilli, P. Ferraro, V. Striano, and G. Coppola, “Multiplexed holographic lenses : realization and optical characterization,” in 2015 Fotonica AEIT Italian Conference on Photonics Technologies (IET, 2015), pp. 1–3.
15. H. Berneth, F.-K. Bruder, T. Fäcke, D. Jurbergs, R. Hagen, D. Hönel, T. Rölle, and G. Walze, “Bayfol HX photopolymer for full-color transmission volume Bragg gratings,” Proc. SPIE 9006, 900602 (2014).
16. M. R. Gleeson, J. T. Sheridan, F.-K. Bruder, T. Rölle, H. Berneth, M.-S. Weiser, and T. Fäcke, “Comparison of a new self developing photopolymer with AA/PVA based photopolymer utilizing the NPDD model,” Opt. Express 19(27), 26325–26342 (2011).
17. A. Zanutta, E. Orselli, T. Fäcke, and A. Bianco, “Photopolymeric films with highly tunable refractive index modulation for high precision diffractive optics,” Opt. Mater. Express 6(1), 252 (2016).
18. A. Zanutta, A. Bianco, M. Insausti, and F. Garzón, “Volume phase holographic gratings for astronomy based on solid photopolymers,” Proc. SPIE 9151, 91515 (2014).
19. M.-L. Piao, K.-C. Kwon, H.-J. Kang, K.-Y. Lee, and N. Kim, “Full-color holographic diffuser using time-scheduled iterative exposure,” Appl. Opt. 54(16), 5252–5259 (2015).
20. Y. S. Hwang, F.-K. Bruder, T. Fäcke, S.-C. Kim, G. Walze, R. Hagen, and E.-S. Kim, “Time-sequential autostereoscopic 3-D display with a novel directional backlight system based on volume-holographic optical elements,” Opt. Express 22(8), 9820–9838 (2014).
21. P. Vojtíšek and M. Květoň, “Impact of overmodulation on spectral response in high efficient transmission gratings,” Proc. SPIE 9442, 94421H (2015).
22. H. Kogelnik, “Coupled wave theory for thick hologram gratings,” Bell Syst. Tech. J. 48(9), 2909–2947 (1969). 23. E. Hecht, Optics (Addison-Wesley, 1998). 24. M. V. Collados, I. Arias, A. García, J. Atencia, and M. Quintanilla, “Silver halide sensitized gelatin process
effects in holographic lenses recorded on Slavich PFG-01 plates,” Appl. Opt. 42(5), 805–810 (2003). 25. F.-K. Bruder, T. Fäcke, R. Hagen, D. Hönel, E. Orselli, C. Rewitz, T. Rölle, G. Walze, and B. Wewer, “Second
harmonics HOE recording in Bayfol HX,” Proc. SPIE 9508, 95080G (2015).
1. Introduction
Volume Holographic Optical Elements (HOEs) can operate as solar concentrators [1]. For their design two main characteristics should be taken into consideration: chromatic and angular selectivity. Since holograms are wavelength-selective optical elements they can be designed to efficiently diffract the bandwidth for which the photovoltaic cell will work best. In the case of a Si or a CIGS cell the range is approximately from 700 to 1050 nm, and for a GaAs, from 500 to 850 nm [2], as it can be seen in Fig. 1. To operate as a solar concentrator, a HOE should diffract a broad spectrum and the design should also take into account the solar spectrum (Fig. 1). An advantage of the chromatic selectivity that holograms offer is the possibility of eliminating the non-desired wavelengths, such as infrared, by diffracting that range with a very poor efficiency. This prevents the photovoltaic cell from overheating, which causes a performance decrease on the cell [3,4].
Volume HOEs present angular selectivity, i.e., they efficiently diffract light for a range of incident directions. This is an important aspect to take into account, since the position of the sun varies over the day and the year. When varying the incident direction along the plane formed by the two recording beams, this efficient angular range is rather small, so the HOE has a high angular selectivity. On the other hand, in the perpendicular plane, low angular selectivity is achieved. One can take advantage of this effect by using cylindrical holographic lenses which allow the use of single-axis solar tracking devices [5].
Moreover, the efficiency depends on additional parameters: composition and thickness of the photosensitive material, recording geometry and spatial frequency, among others. The chromatic dispersion of the holographic lens should also be taken into account. Each wavelength is focused on a different point, which could be a drawback, since the wavelength range of interest should focus on the photovoltaic cell, or an advantage, if several photovoltaic cells, each one sensitive to a different wavelength range, are used [6].
#258926 Received 3 Feb 2016; revised 10 Mar 2016; accepted 12 Mar 2016; published 18 Mar 2016 © 2016 OSA 21 Mar 2016 | Vol. 24, No. 6 | DOI:10.1364/OE.24.00A720 | OPTICS EXPRESS A721
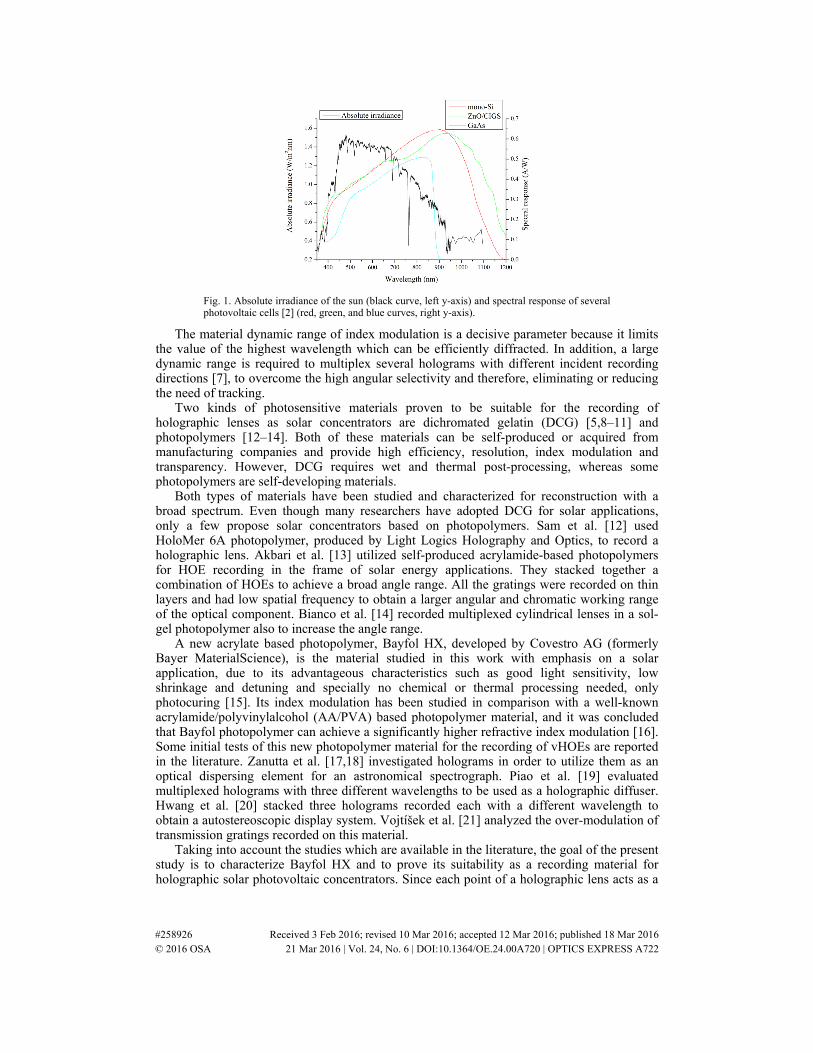
Fig. 1. Absolute irradiance of the sun (black curve, left y-axis) and spectral response of several photovoltaic cells [2] (red, green, and blue curves, right y-axis).
The material dynamic range of index modulation is a decisive parameter because it limits the value of the highest wavelength which can be efficiently diffracted. In addition, a large dynamic range is required to multiplex several holograms with different incident recording directions [7], to overcome the high angular selectivity and therefore, eliminating or reducing the need of tracking.
Two kinds of photosensitive materials proven to be suitable for the recording of holographic lenses as solar concentrators are dichromated gelatin (DCG) [5,8–11] and photopolymers [12–14]. Both of these materials can be self-produced or acquired from manufacturing companies and provide high efficiency, resolution, index modulation and transparency. However, DCG requires wet and thermal post-processing, whereas some photopolymers are self-developing materials.
Both types of materials have been studied and characterized for reconstruction with a broad spectrum. Even though many researchers have adopted DCG for solar applications, only a few propose solar concentrators based on photopolymers. Sam et al. [12] used HoloMer 6A photopolymer, produced by Light Logics Holography and Optics, to record a holographic lens. Akbari et al. [13] utilized self-produced acrylamide-based photopolymers for HOE recording in the frame of solar energy applications. They stacked together a combination of HOEs to achieve a broad angle range. All the gratings were recorded on thin layers and had low spatial frequency to obtain a larger angular and chromatic working range of the optical component. Bianco et al. [14] recorded multiplexed cylindrical lenses in a sol-gel photopolymer also to increase the angle range.
A new acrylate based photopolymer, Bayfol HX, developed by Covestro AG (formerly Bayer MaterialScience), is the material studied in this work with emphasis on a solar application, due to its advantageous characteristics such as good light sensitivity, low shrinkage and detuning and specially no chemical or thermal processing needed, only photocuring [15]. Its index modulation has been studied in comparison with a well-known acrylamide/polyvinylalcohol (AA/PVA) based photopolymer material, and it was concluded that Bayfol photopolymer can achieve a significantly higher refractive index modulation [16]. Some initial tests of this new photopolymer material for the recording of vHOEs are reported in the literature. Zanutta et al. [17,18] investigated holograms in order to utilize them as an optical dispersing element for an astronomical spectrograph. Piao et al. [19] evaluated multiplexed holograms with three different wavelengths to be used as a holographic diffuser. Hwang et al. [20] stacked three holograms recorded each with a different wavelength to obtain a autostereoscopic display system. Vojtíšek et al. [21] analyzed the over-modulation of transmission gratings recorded on this material.
Taking into account the studies which are available in the literature, the goal of the present study is to characterize Bayfol HX and to prove its suitability as a recording material for holographic solar photovoltaic concentrators. Since each point of a holographic lens acts as a
#258926 Received 3 Feb 2016; revised 10 Mar 2016; accepted 12 Mar 2016; published 18 Mar 2016 © 2016 OSA 21 Mar 2016 | Vol. 24, No. 6 | DOI:10.1364/OE.24.00A720 | OPTICS EXPRESS A722
plane grating (“local grating” treatment) [8], it is necessary to study first the performance of volume gratings recorded on this material. In order to achieve a compromise between solar irradiance and cell optimum wavelength ranges, depicted in Fig. 1, 800 nm is established as the desired wavelength with maximum efficiency in the reconstruction.
2. Theoretical background
The analysis of holographic gratings is based on Kogelnik’s Coupled Wave Theory [22]. A holographic grating is recorded with the interference of two beams with wave propagation
vectors 1k
and 2k
, with modulus 1 2
2
R
k kπ
λ= = , where Rλ is the recording wavelength. The
grating vector K
, is determined by means of
1 2K k k= ±
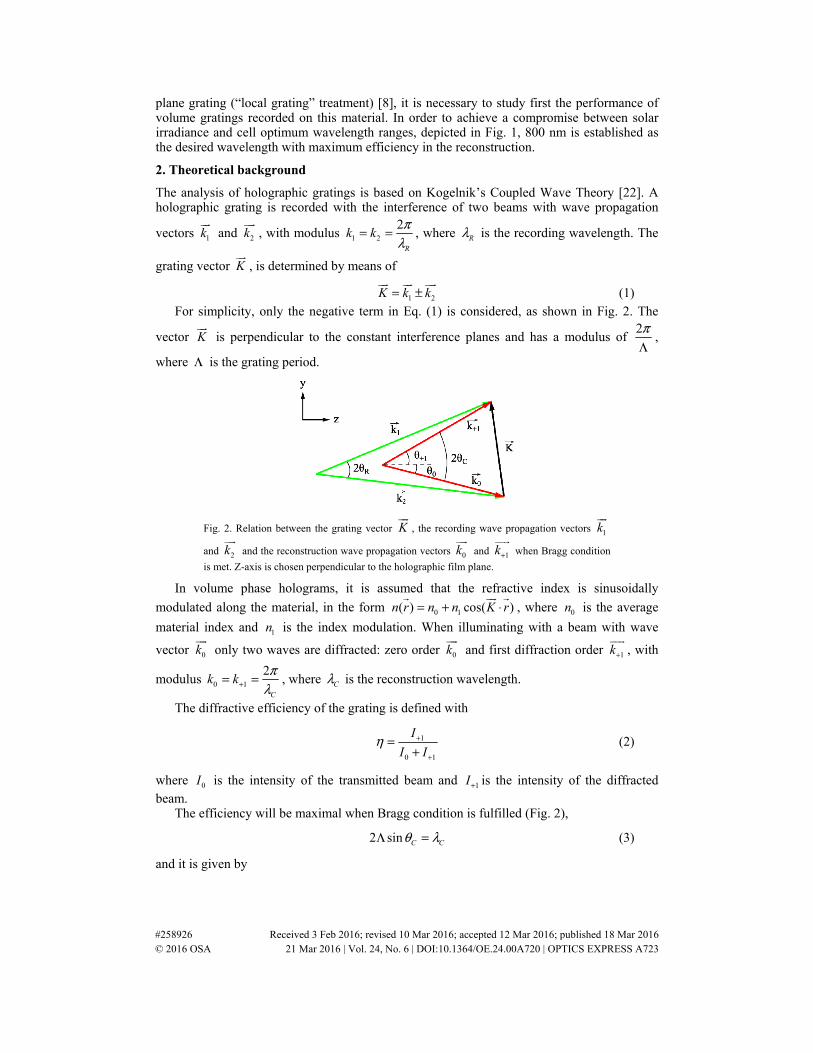
(1) For simplicity, only the negative term in Eq. (1) is considered, as shown in Fig. 2. The
vector K
is perpendicular to the constant interference planes and has a modulus of 2πΛ
,
where Λ is the grating period.
Fig. 2. Relation between the grating vector K
, the recording wave propagation vectors 1k
and 2k
and the reconstruction wave propagation vectors 0k
and 1k+
when Bragg condition
is met. Z-axis is chosen perpendicular to the holographic film plane.
In volume phase holograms, it is assumed that the refractive index is sinusoidally
modulated along the material, in the form 0 1( ) cos( )n r n n K r= + ⋅
, where 0n is the average
material index and 1n is the index modulation. When illuminating with a beam with wave
vector 0k
only two waves are diffracted: zero order 0k
and first diffraction order 1k+
, with
modulus 0 1
2
C
k kπ
λ+= = , where Cλ is the reconstruction wavelength.
The diffractive efficiency of the grating is defined with
1
0 1
I
I Iη +
+
=+
(2)
where 0I is the intensity of the transmitted beam and 1I+ is the intensity of the diffracted beam.
The efficiency will be maximal when Bragg condition is fulfilled (Fig. 2),
2 sin C Cθ λΛ = (3)
and it is given by
#258926 Received 3 Feb 2016; revised 10 Mar 2016; accepted 12 Mar 2016; published 18 Mar 2016 © 2016 OSA 21 Mar 2016 | Vol. 24, No. 6 | DOI:10.1364/OE.24.00A720 | OPTICS EXPRESS A723
2 1
0 1
sincos cosC
n dπηλ θ θ+
=
(4)
where d is the material thickness, and 0θ and 1θ+ are depicted in Fig. 2. With an appropriate
value of 1n , determined with the recording exposure, the efficiency can reach 1η = .
3. Experimental method and results
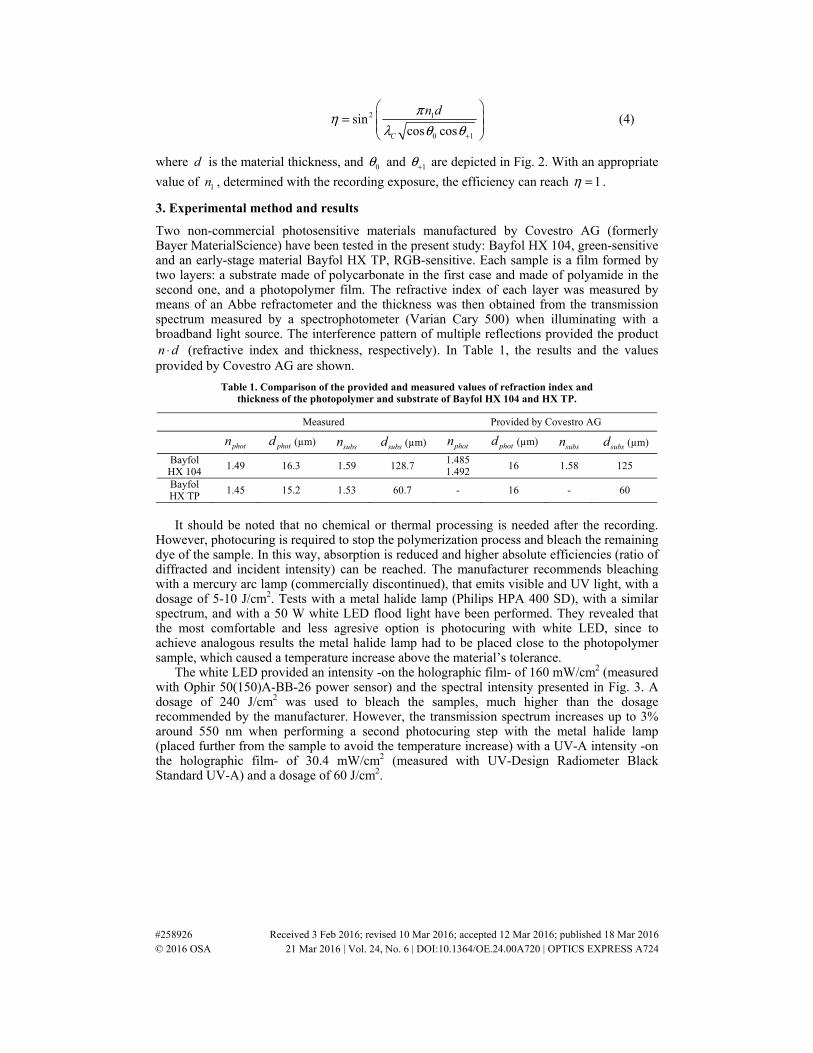
Two non-commercial photosensitive materials manufactured by Covestro AG (formerly Bayer MaterialScience) have been tested in the present study: Bayfol HX 104, green-sensitive and an early-stage material Bayfol HX TP, RGB-sensitive. Each sample is a film formed by two layers: a substrate made of polycarbonate in the first case and made of polyamide in the second one, and a photopolymer film. The refractive index of each layer was measured by means of an Abbe refractometer and the thickness was then obtained from the transmission spectrum measured by a spectrophotometer (Varian Cary 500) when illuminating with a broadband light source. The interference pattern of multiple reflections provided the product n d⋅ (refractive index and thickness, respectively). In Table 1, the results and the values provided by Covestro AG are shown.
Table 1. Comparison of the provided and measured values of refraction index and thickness of the photopolymer and substrate of Bayfol HX 104 and HX TP.
Measured Provided by Covestro AG
photn photd (µm) subsn subsd (µm) photn photd (µm) subsn subsd (µm)
Bayfol HX 104
1.49 16.3 1.59 128.7 1.4851.492
16 1.58 125
Bayfol HX TP
1.45 15.2 1.53 60.7 - 16 - 60
It should be noted that no chemical or thermal processing is needed after the recording.
However, photocuring is required to stop the polymerization process and bleach the remaining dye of the sample. In this way, absorption is reduced and higher absolute efficiencies (ratio of diffracted and incident intensity) can be reached. The manufacturer recommends bleaching with a mercury arc lamp (commercially discontinued), that emits visible and UV light, with a dosage of 5-10 J/cm2. Tests with a metal halide lamp (Philips HPA 400 SD), with a similar spectrum, and with a 50 W white LED flood light have been performed. They revealed that the most comfortable and less agresive option is photocuring with white LED, since to achieve analogous results the metal halide lamp had to be placed close to the photopolymer sample, which caused a temperature increase above the material’s tolerance.
The white LED provided an intensity -on the holographic film- of 160 mW/cm2 (measured with Ophir 50(150)A-BB-26 power sensor) and the spectral intensity presented in Fig. 3. A dosage of 240 J/cm2 was used to bleach the samples, much higher than the dosage recommended by the manufacturer. However, the transmission spectrum increases up to 3% around 550 nm when performing a second photocuring step with the metal halide lamp (placed further from the sample to avoid the temperature increase) with a UV-A intensity -on the holographic film- of 30.4 mW/cm2 (measured with UV-Design Radiometer Black Standard UV-A) and a dosage of 60 J/cm2.
#258926 Received 3 Feb 2016; revised 10 Mar 2016; accepted 12 Mar 2016; published 18 Mar 2016 © 2016 OSA 21 Mar 2016 | Vol. 24, No. 6 | DOI:10.1364/OE.24.00A720 | OPTICS EXPRESS A724
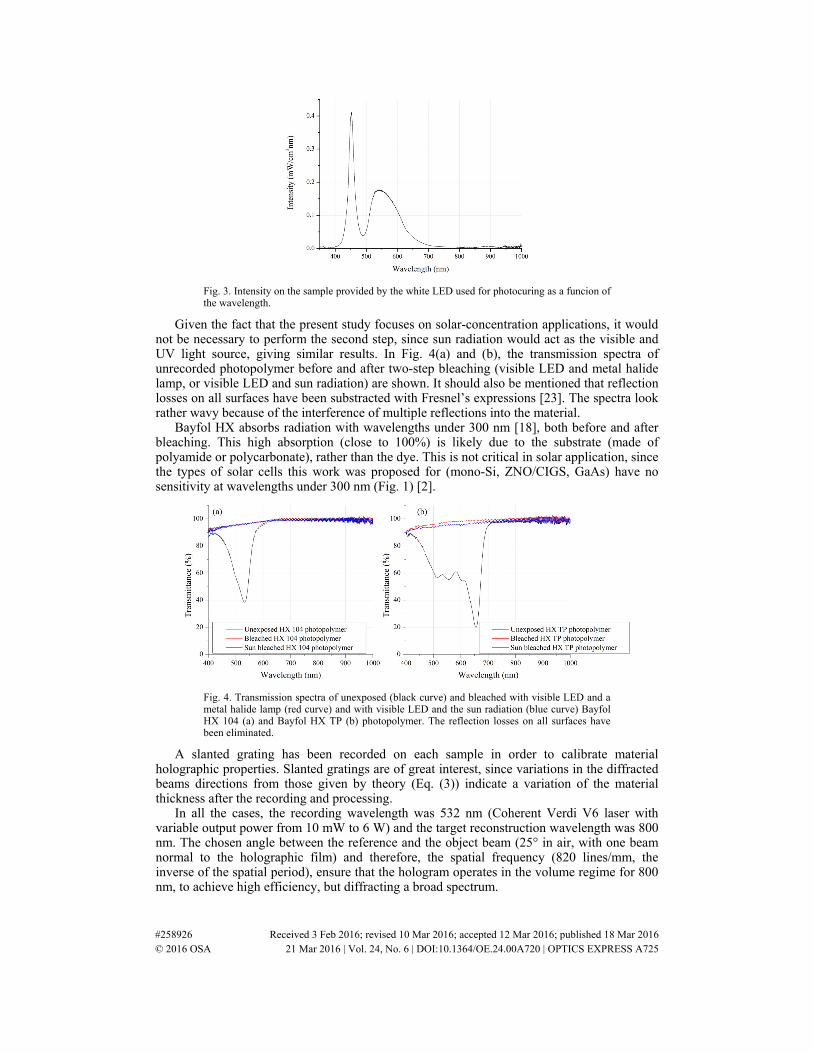
Fig. 3. Intensity on the sample provided by the white LED used for photocuring as a funcion of the wavelength.
Given the fact that the present study focuses on solar-concentration applications, it would not be necessary to perform the second step, since sun radiation would act as the visible and UV light source, giving similar results. In Fig. 4(a) and (b), the transmission spectra of unrecorded photopolymer before and after two-step bleaching (visible LED and metal halide lamp, or visible LED and sun radiation) are shown. It should also be mentioned that reflection losses on all surfaces have been substracted with Fresnel’s expressions [23]. The spectra look rather wavy because of the interference of multiple reflections into the material.
Bayfol HX absorbs radiation with wavelengths under 300 nm [18], both before and after bleaching. This high absorption (close to 100%) is likely due to the substrate (made of polyamide or polycarbonate), rather than the dye. This is not critical in solar application, since the types of solar cells this work was proposed for (mono-Si, ZNO/CIGS, GaAs) have no sensitivity at wavelengths under 300 nm (Fig. 1) [2].
Fig. 4. Transmission spectra of unexposed (black curve) and bleached with visible LED and a metal halide lamp (red curve) and with visible LED and the sun radiation (blue curve) Bayfol HX 104 (a) and Bayfol HX TP (b) photopolymer. The reflection losses on all surfaces have been eliminated.
A slanted grating has been recorded on each sample in order to calibrate material holographic properties. Slanted gratings are of great interest, since variations in the diffracted beams directions from those given by theory (Eq. (3)) indicate a variation of the material thickness after the recording and processing.
In all the cases, the recording wavelength was 532 nm (Coherent Verdi V6 laser with variable output power from 10 mW to 6 W) and the target reconstruction wavelength was 800 nm. The chosen angle between the reference and the object beam (25° in air, with one beam normal to the holographic film) and therefore, the spatial frequency (820 lines/mm, the inverse of the spatial period), ensure that the hologram operates in the volume regime for 800 nm, to achieve high efficiency, but diffracting a broad spectrum.
#258926 Received 3 Feb 2016; revised 10 Mar 2016; accepted 12 Mar 2016; published 18 Mar 2016 © 2016 OSA 21 Mar 2016 | Vol. 24, No. 6 | DOI:10.1364/OE.24.00A720 | OPTICS EXPRESS A725
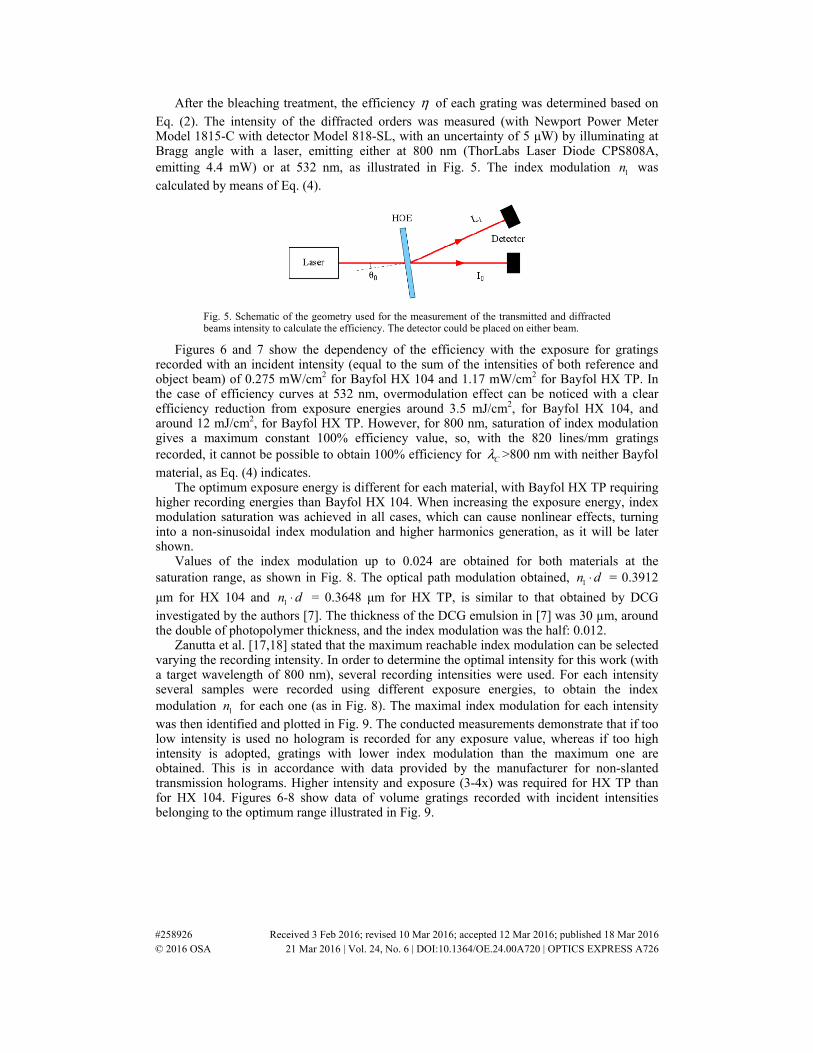
After the bleaching treatment, the efficiency η of each grating was determined based on Eq. (2). The intensity of the diffracted orders was measured (with Newport Power Meter Model 1815-C with detector Model 818-SL, with an uncertainty of 5 μW) by illuminating at Bragg angle with a laser, emitting either at 800 nm (ThorLabs Laser Diode CPS808A, emitting 4.4 mW) or at 532 nm, as illustrated in Fig. 5. The index modulation 1n was calculated by means of Eq. (4).
Fig. 5. Schematic of the geometry used for the measurement of the transmitted and diffracted beams intensity to calculate the efficiency. The detector could be placed on either beam.
Figures 6 and 7 show the dependency of the efficiency with the exposure for gratings recorded with an incident intensity (equal to the sum of the intensities of both reference and object beam) of 0.275 mW/cm2 for Bayfol HX 104 and 1.17 mW/cm2 for Bayfol HX TP. In the case of efficiency curves at 532 nm, overmodulation effect can be noticed with a clear efficiency reduction from exposure energies around 3.5 mJ/cm2, for Bayfol HX 104, and around 12 mJ/cm2, for Bayfol HX TP. However, for 800 nm, saturation of index modulation gives a maximum constant 100% efficiency value, so, with the 820 lines/mm gratings recorded, it cannot be possible to obtain 100% efficiency for Cλ >800 nm with neither Bayfol material, as Eq. (4) indicates.
The optimum exposure energy is different for each material, with Bayfol HX TP requiring higher recording energies than Bayfol HX 104. When increasing the exposure energy, index modulation saturation was achieved in all cases, which can cause nonlinear effects, turning into a non-sinusoidal index modulation and higher harmonics generation, as it will be later shown.
Values of the index modulation up to 0.024 are obtained for both materials at the saturation range, as shown in Fig. 8. The optical path modulation obtained, 1n d⋅ = 0.3912
μm for HX 104 and 1n d⋅ = 0.3648 μm for HX TP, is similar to that obtained by DCG investigated by the authors [7]. The thickness of the DCG emulsion in [7] was 30 µm, around the double of photopolymer thickness, and the index modulation was the half: 0.012.
Zanutta et al. [17,18] stated that the maximum reachable index modulation can be selected varying the recording intensity. In order to determine the optimal intensity for this work (with a target wavelength of 800 nm), several recording intensities were used. For each intensity several samples were recorded using different exposure energies, to obtain the index modulation 1n for each one (as in Fig. 8). The maximal index modulation for each intensity was then identified and plotted in Fig. 9. The conducted measurements demonstrate that if too low intensity is used no hologram is recorded for any exposure value, whereas if too high intensity is adopted, gratings with lower index modulation than the maximum one are obtained. This is in accordance with data provided by the manufacturer for non-slanted transmission holograms. Higher intensity and exposure (3-4x) was required for HX TP than for HX 104. Figures 6-8 show data of volume gratings recorded with incident intensities belonging to the optimum range illustrated in Fig. 9.
#258926 Received 3 Feb 2016; revised 10 Mar 2016; accepted 12 Mar 2016; published 18 Mar 2016 © 2016 OSA 21 Mar 2016 | Vol. 24, No. 6 | DOI:10.1364/OE.24.00A720 | OPTICS EXPRESS A726
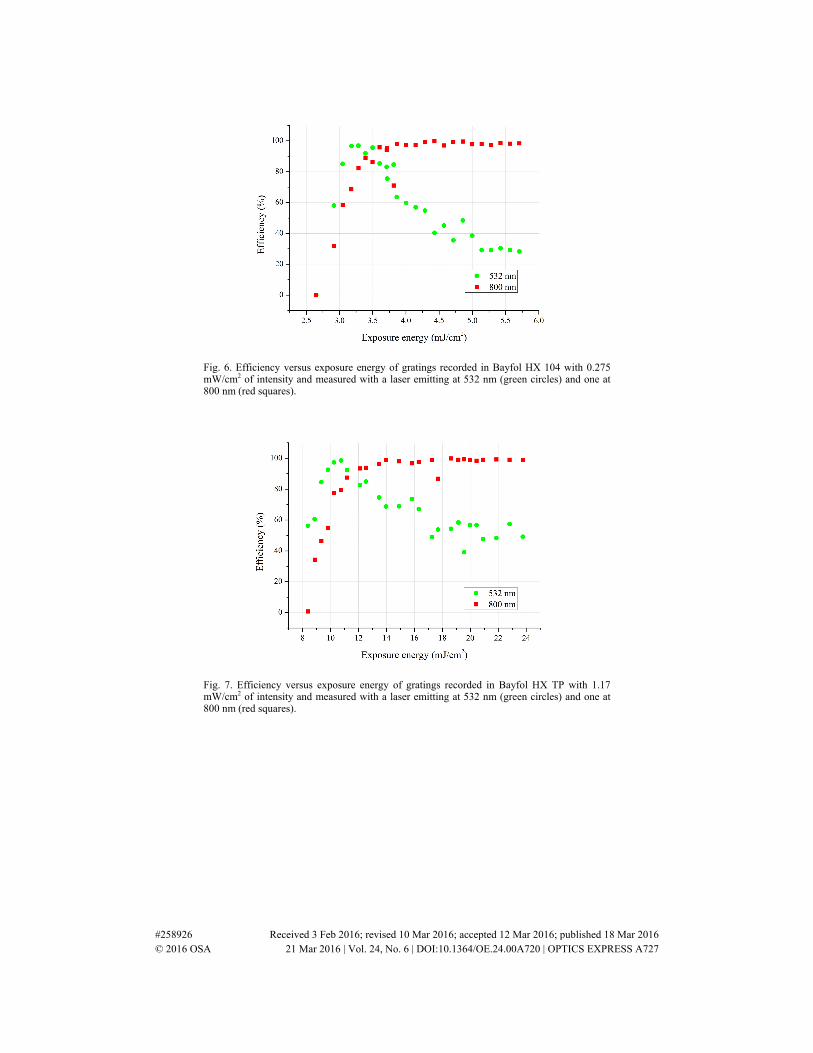
Fig. 6. Efficiency versus exposure energy of gratings recorded in Bayfol HX 104 with 0.275 mW/cm2 of intensity and measured with a laser emitting at 532 nm (green circles) and one at 800 nm (red squares).
Fig. 7. Efficiency versus exposure energy of gratings recorded in Bayfol HX TP with 1.17 mW/cm2 of intensity and measured with a laser emitting at 532 nm (green circles) and one at 800 nm (red squares).
#258926 Received 3 Feb 2016; revised 10 Mar 2016; accepted 12 Mar 2016; published 18 Mar 2016 © 2016 OSA 21 Mar 2016 | Vol. 24, No. 6 | DOI:10.1364/OE.24.00A720 | OPTICS EXPRESS A727
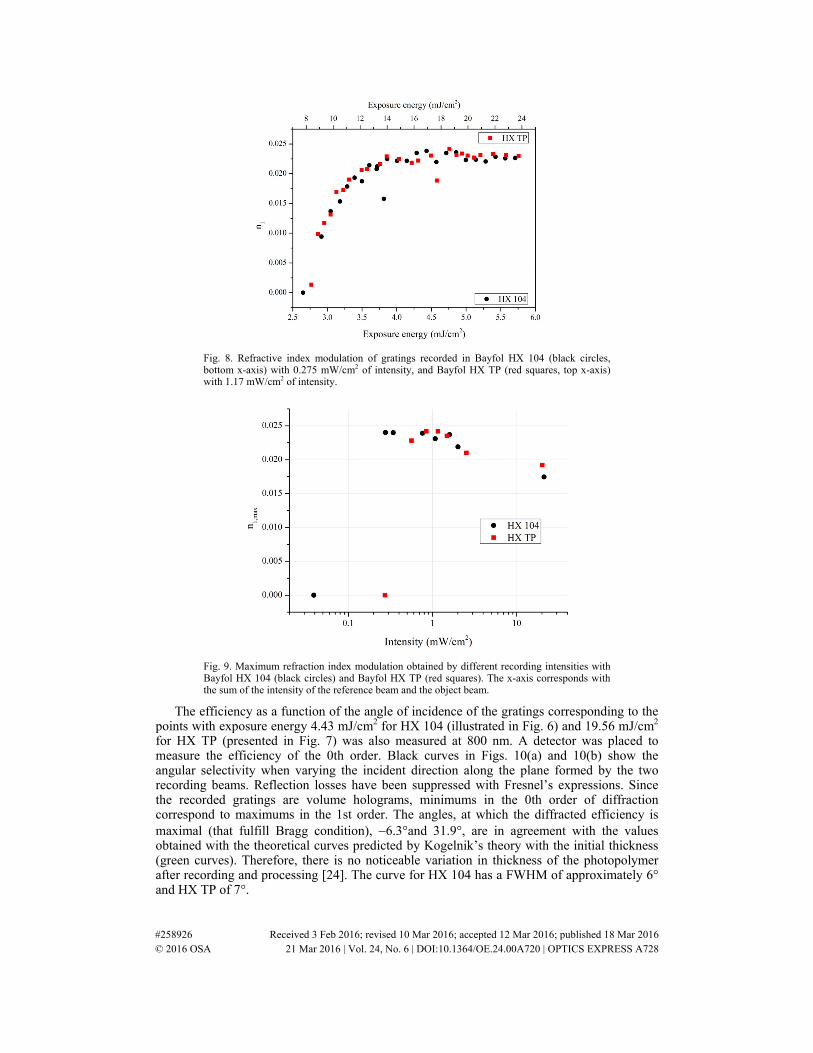
Fig. 8. Refractive index modulation of gratings recorded in Bayfol HX 104 (black circles, bottom x-axis) with 0.275 mW/cm2 of intensity, and Bayfol HX TP (red squares, top x-axis) with 1.17 mW/cm2 of intensity.
Fig. 9. Maximum refraction index modulation obtained by different recording intensities with Bayfol HX 104 (black circles) and Bayfol HX TP (red squares). The x-axis corresponds with the sum of the intensity of the reference beam and the object beam.
The efficiency as a function of the angle of incidence of the gratings corresponding to the points with exposure energy 4.43 mJ/cm2 for HX 104 (illustrated in Fig. 6) and 19.56 mJ/cm2 for HX TP (presented in Fig. 7) was also measured at 800 nm. A detector was placed to measure the efficiency of the 0th order. Black curves in Figs. 10(a) and 10(b) show the angular selectivity when varying the incident direction along the plane formed by the two recording beams. Reflection losses have been suppressed with Fresnel’s expressions. Since the recorded gratings are volume holograms, minimums in the 0th order of diffraction correspond to maximums in the 1st order. The angles, at which the diffracted efficiency is maximal (that fulfill Bragg condition), −6.3°and 31.9°, are in agreement with the values obtained with the theoretical curves predicted by Kogelnik’s theory with the initial thickness (green curves). Therefore, there is no noticeable variation in thickness of the photopolymer after recording and processing [24]. The curve for HX 104 has a FWHM of approximately 6° and HX TP of 7°.
#258926 Received 3 Feb 2016; revised 10 Mar 2016; accepted 12 Mar 2016; published 18 Mar 2016 © 2016 OSA 21 Mar 2016 | Vol. 24, No. 6 | DOI:10.1364/OE.24.00A720 | OPTICS EXPRESS A728

Fig. 10. Comparison of theoretical (green curves) and experimental (black curves) angular selectivity of a grating recorded with 4.43 mJ/cm2 in Bayfol HX 104 (a) and a grating recorded with 19.56 mJ/cm2 in Bayfol HX TP (b), measured with a laser emmiting at 800 nm and varying the incident direction along the plane formed by the two recording beams. Reflection losses have been suppressed.
The peak at θ = −26.1° of Figs. 10(a) and 10(b) corresponds to a grating with grating
vector 2K
. This occurs due to the fact that the index modulation is saturated (Fig. 8); thus, the recorded grating is not sinusoidally modulated and higher order harmonics appear [25]. This effect does not seem to affect the behavior of the recorded grating.
Figure 11 shows the angular selectivity when varying the incident direction along the plane perpendicular to the two recording beams. Reflection losses have also been suppressed with Fresnel’s expressions. The curves have a FWHM slightly bigger than 80°. This characteristic will allow the design of HOEs for solar concentration with one-axis tracking [5].
Fig. 11. Angular selectivity of a grating recorded with 4.43 mJ/cm2 in Bayfol HX 104 (black curve) and a grating recorded with 19.56 mJ/cm2 in Bayfol HX TP (red curve), measured with a laser emmiting at 800 nm and varying the incident direction along the plane perpendicular to the two recording beams. Reflection losses have been suppressed.
In order to analyze the chromatic selectivity (the dependence of the efficiency with the wavelength), the HOE is illuminated at Bragg angle with a white light source (Ocean Optics LS-1) and the transmitted light is measured with a spectrometer (Ocean Optics USB2000). In Fig. 12, the efficiency of the 0th order of the previous gratings versus the wavelength, when illuminating in a direction that fulfills Bragg condition for 800 nm, is shown. Reflection losses have also been suppressed with Fresnel’s expressions. The maximum around 800 nm has a FWHM of approximately 200 nm for the HX 104 sample and 230 nm for the HX TP
#258926 Received 3 Feb 2016; revised 10 Mar 2016; accepted 12 Mar 2016; published 18 Mar 2016 © 2016 OSA 21 Mar 2016 | Vol. 24, No. 6 | DOI:10.1364/OE.24.00A720 | OPTICS EXPRESS A729
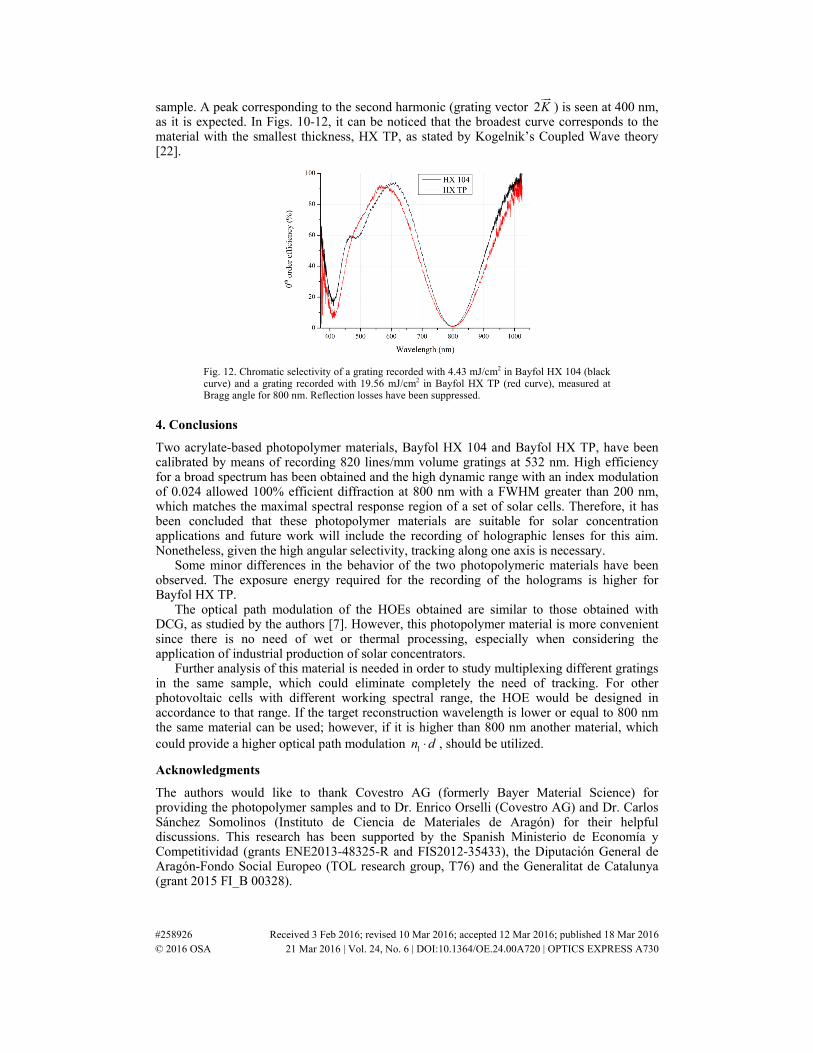
sample. A peak corresponding to the second harmonic (grating vector 2K
) is seen at 400 nm, as it is expected. In Figs. 10-12, it can be noticed that the broadest curve corresponds to the material with the smallest thickness, HX TP, as stated by Kogelnik’s Coupled Wave theory [22].
Fig. 12. Chromatic selectivity of a grating recorded with 4.43 mJ/cm2 in Bayfol HX 104 (black curve) and a grating recorded with 19.56 mJ/cm2 in Bayfol HX TP (red curve), measured at Bragg angle for 800 nm. Reflection losses have been suppressed.
4. Conclusions
Two acrylate-based photopolymer materials, Bayfol HX 104 and Bayfol HX TP, have been calibrated by means of recording 820 lines/mm volume gratings at 532 nm. High efficiency for a broad spectrum has been obtained and the high dynamic range with an index modulation of 0.024 allowed 100% efficient diffraction at 800 nm with a FWHM greater than 200 nm, which matches the maximal spectral response region of a set of solar cells. Therefore, it has been concluded that these photopolymer materials are suitable for solar concentration applications and future work will include the recording of holographic lenses for this aim. Nonetheless, given the high angular selectivity, tracking along one axis is necessary.
Some minor differences in the behavior of the two photopolymeric materials have been observed. The exposure energy required for the recording of the holograms is higher for Bayfol HX TP.
The optical path modulation of the HOEs obtained are similar to those obtained with DCG, as studied by the authors [7]. However, this photopolymer material is more convenient since there is no need of wet or thermal processing, especially when considering the application of industrial production of solar concentrators.
Further analysis of this material is needed in order to study multiplexing different gratings in the same sample, which could eliminate completely the need of tracking. For other photovoltaic cells with different working spectral range, the HOE would be designed in accordance to that range. If the target reconstruction wavelength is lower or equal to 800 nm the same material can be used; however, if it is higher than 800 nm another material, which could provide a higher optical path modulation 1n d⋅ , should be utilized.
Acknowledgments
The authors would like to thank Covestro AG (formerly Bayer Material Science) for providing the photopolymer samples and to Dr. Enrico Orselli (Covestro AG) and Dr. Carlos Sánchez Somolinos (Instituto de Ciencia de Materiales de Aragón) for their helpful discussions. This research has been supported by the Spanish Ministerio de Economía y Competitividad (grants ENE2013-48325-R and FIS2012-35433), the Diputación General de Aragón-Fondo Social Europeo (TOL research group, T76) and the Generalitat de Catalunya (grant 2015 FI_B 00328).
#258926 Received 3 Feb 2016; revised 10 Mar 2016; accepted 12 Mar 2016; published 18 Mar 2016 © 2016 OSA 21 Mar 2016 | Vol. 24, No. 6 | DOI:10.1364/OE.24.00A720 | OPTICS EXPRESS A730