characterization of microcellular biodegradable polymeric foams produced from supercritical carbon...
TRANSCRIPT

Characterization of Microcellular Biodegradable Polymeric FoamsProduced from Supercritical Carbon Dioxide Solutions
S. Cotugno, E. Di Maio, and G. Mensitieri*
Department of Materials and Production Engineering University of Naples FEDERICO II,P. le Tecchio 80, 80125 Naples, Italy
S. Iannace
IMCB-CNR Institute for Composite and Biomedical Materials, P. le Tecchio 80, 80125 Naples, Italy
G. W. Roberts, R. G. Carbonell, and H. B. Hopfenberg
Department of Chemical Engineering, North Carolina State University, Raleigh, North Carolina 27695-7565
The formation of foams of biodegradable poly(ε-caprolactone) (PCL) from CO2 solutions in moltenPCL was investigated. This study included characterization of the CO2 diffusion and equilibriumsolubility in molten PCL in contact with supercritical CO2 (scCO2). Experiments were performedat 70, 80, and 90 °C at CO2 pressures up to 25 MPa. The effective mutual diffusivity of CO2 inmolten PCL was measured as a function of the CO2 pressure. The data revealed a dramaticincrease in apparent effective diffusivity at elevated pressure, likely related to the formation offluid bubbles, phase-separated from the previously homogeneous, molten PCL solution of CO2.Microcellular PCL foams were produced by starting from an equilibrium CO2-PCL solution at70 °C over a wide range of initial pressures (from 6.9 to 32 MPa) by quenching down to foamingtemperatures (from 24 to 30 °C) followed by rapid depressurization to atmospheric pressure.Foam structures were characterized by scanning electron microscopy, and cell sizes and densitywere determined quantitatively. The various foam structures were analyzed and interpreted inconnection with the independently measured kinetics and equilibrium of CO2 sorption in PCLby considering the effects of starting pressure and foaming temperature on bubble nucleationand growth.
1. Introduction
Foams are of particular interest in commercial ap-plications, including packaging, acoustic and thermalinsulation, biomedical products, and sporting equip-ment.1-3 The foam density and cell size distributioninfluence the final properties of the foam. A foam withhigh density and relatively high tensile strength andYoung’s modulus can be used for structural parts, whilelow-density foams can be used in thermal and acousticinsulation as well as in packaging applications. Thelarge and increasing volume of manufactured, foamed,polymeric materials has stimulated interest in develop-ing useful innovations related to recycling the materialsused in these high-volume applications.
An alternative to recycling is the use of biodegradablepolymers, such as poly(ε-caprolactone) (PCL), as a foammatrix. The use of supercritical CO2 (scCO2) as ablowing agent is also useful in developing environmen-tally benign foaming processes. In fact, scCO2 can beused as a substitute for traditional blowing agents that,in addition to environmental concerns, often compromisecontrol of the final structure of the microcellular plastic.In fact, many traditional blowing agents belong to theclass of chlorofluorocarbons (CFC), which are clearlyrecognized to contribute to serious effects on the ozonelayer. As a result, CFC’s were banned by the Montreal
Protocol in 1987. Several studies over the past decadehave shown the importance of scCO2 in polymer pro-cessing, including foaming, coating, and additive im-pregnation.3-9
Microcellular foaming using CO2 as a blowing agenthas been reported in the literature for several polymers,e.g. polystyrene (PS), polyamide 11 (PA 11), and poly-(methyl methacrylate) (PMMA).1,3,10 For these systems,various models for homogeneous nucleation and growthof the bubbles in the gas-polymer mixture have beenproposed.5,11-14 The initial nucleation is induced by achange in temperature and/or pressure of the mixture.Once the bubble is nucleated, it will grow, due to thediffusion of the gas dissolved in the molten polymer tothe nucleated bubble. In this respect, the nucleation andthe growth of the bubble are related to sorption equi-libria and mass transport kinetics of the blowing agentin the molten polymer as well as to the rheological andsurface properties of the mixture surrounding thebubble itself.9,13
This study focuses upon interpreting the effects of thekinetics and equilibria of sorption of CO2 in PCL on thenature of the PCL foams produced from scCO2. Theequilibrium sorption has been determined at 70, 80, and90 °C at pressures up to 25 MPa, and data have beenanalyzed using the Sanchez-Lacombe (SL) latticemodel15-18 and the Peng-Robinson equation of state(PR-EOS).19 In fact, the equilibrium concentration ofCO2 in PCL, at each temperature and pressure, hasbeen evaluated by equating the chemical potential of
* To whom correspondence should be addressed. Phone:+39 081 7682512. Fax: +39 081 7682404. E-mail: [email protected].
1795Ind. Eng. Chem. Res. 2005, 44, 1795-1803
10.1021/ie049445c CCC: $30.25 © 2005 American Chemical SocietyPublished on Web 02/19/2005

CO2 in the polymeric mixture and in the contiguousfluid phase, assumed to be in equilibrium with themolten polymeric phase. The chemical potential of CO2in the polymer phase was calculated using the SL model,while the chemical potential of CO2 in the fluid phasewas calculated using the PR-EOS. The latter approachhas been adopted, since Peng-Robinson equations areexpected to provide a more reliable predictive capabilitythan SL theory in the supercritical range of CO2.
We explored the possibility of obtaining microcellularfoams by using a batch foaming technique based onscCO2 as a blowing agent. The effects of initial equilib-rium pressure (in the 6.9-32 MPa range and at 70 °C)and of foaming temperature (in the 24-30 °C range andat an initial equilibrium pressure equal to 6.9 MPa) onthe final structure of the foam have been studied.
2. Experimental Section
2.1. Materials. Poly(ε-caprolactone) was supplied bySolvay Interox Ltd. (PCL CAPA 6800). The physicalproperties of the PCL are presented in Table 1.
The parameters of SL-EOS for pure PCL, determinedby fitting PVT data at pressures up to 50 MPa andtemperatures from 70 to 120 °C, are20
From these parameters, the close-packed mer vol-ume18 can be calculated:
The liquid carbon dioxide (bone dry grade 2.8, purity>99.8%) was obtained from National Welders NC andused as received. The parameters of SL-EOS for pureCO2 were taken from the literature:21,22
From these values, we obtain
where M1 is the molecular weight of carbon dioxide andr1
0 is the number of lattice sites occupied by a carbondioxide molecule. Here and in the following, subscripts1 and 2 will refer respectively to carbon dioxide andPCL.
2.2. Methods. 2.2.1. CO2 Sorption Measurement.The sorption equilibrium and mass transport be-havior were studied using a quartz spring microbal-ance and a magnetic suspension balance. All the ex-periments were performed above the melting temper-ature of neat PCL and well above its glass transi-tion temperature. The quartz spring balance was usedto provide carbon dioxide sorption data in the low-pressure range (0-7 MPa) at 70 °C, while the magneticsuspension balance was used at 70, 80, and 90 °C inthe high-pressure range, 0-25 MPa. These high-pres-sure values can be attained due to the particularelectromagnetic coupling between the balance mecha-nism and the freely suspended measuring load, whichallows the physical separation of the balance from themeasuring chamber.
Sorption experiments were conducted by measuringchanges of sample weight with a calibrated quartzspring microbalance (RUSKA Co., Houston, TX; maxi-mum elongation 400 mm, maximum weight 50 mg)placed in a pressurized stainless steel cylindrical vessel(2.54 cm diameter) equipped with high-pressure viewingports and with a water jacket for accurate temperaturecontrol. The polymer sample was placed in an aluminumpan (which guaranteed dimensional stability of thesample) and hung on the lower spring hook. Thealuminum pan had a cylindrical shape, and its dimen-sions were accurately measured. The initial thicknessof the molten polymer was estimated by knowing itsdensity at the temperature of interest (as calculatedfrom PVT measurements), the weight of the sample, andthe diameter of the pan. The kinetics of CO2 sorptionand sorption equilibrium values in the molten polymerwere evaluated by measuring spring elongation with atraveling microscope (resolution of 0.01 mm). To ensurethe measurement of the absolute spring elongation, anundeformable reference glass rod, coaxial to the springhelix, was used.
Measurements were conducted by performing step-change sorption experiments. Consecutive sorption testswere conducted by step increments of the carbon dioxidepressure (about 0.3 MPa steps) with preheated carbondioxide, after the attainment of equilibrium sorption inthe previous step.
When penetrant diffusivity is expected to depend onpenetrant concentration, data should be properly ana-lyzed to derive meaningful diffusion coefficients fromstep-change experiments. In this investigation weadopted a method proposed by Vrentas et al.23 to obtainthe value of mutual diffusivity, D(C), at a specificpenetrant concentration, C, between the initial and finalconcentrations of each sorption experiment. The methodis based on the evaluation of an average mutual diffu-sivity (Dh ) from the initial rate of sorption. Since thesystem under investigation follows a Fickian behavior,the expression for Dh takes the form24
where Mt is the mass of carbon dioxide sorbed at timet, M∞ is the amount sorbed at equilibrium, and L is thesample thickness (sample is exposed to the gas phaseon one side only). The value of Dh calculated through eq1 corresponds to the value of the carbon dioxide mutualdiffusivity, D(C), at a certain concentration value which
Table 1. Physical Properties of PCL
wt avmol wt (Mw)
glass transitiontemp (Tg)
meltingtemp (Tm)
crystallizntemp (Tcry)
80 000 -60 °C 60 °C 27.4 °C
P2* ) 548.6 MPa
T2* ) 637.7 K
F2* ) 1.158 g/cm3
v2* )RT2*P2*
) 9.66 cm3/mol
P1* ) 574.5 MPa
T1*) 305.3 K
F1* ) 1.510 g/cm3
v1*)RT1*P1*
) 4.42 cm3/mol
r10 )
M1
F1*v1*) 6.60
Dh ) πL2
4 (d(Mt/M∞)
d(xt) )2
(1)
1796 Ind. Eng. Chem. Res., Vol. 44, No. 6, 2005

can be evaluated following the procedures proposed byVrentas et al.23 Since the sample volume increased withcarbon dioxide concentration, for each sorption step thesample thickness to be used in the analysis of the datawas estimated from the mixture volume predicted bythe SL equation of state (SL-EOS), using the arithmeticaverage of initial and final density of the polymer-gasmixture.
A buoyancy correction was also performed, consistentwith the carbon dioxide density and the volumes ofthe sample (as evaluated from SL-EOS), the pan, andthe spring. The volumes of the pan and the springhave been previously determined by evaluating thebuoyancy effect at test conditions but without thepolymer sample.
In the case of the magnetic suspension balancemeasurements (Rubotherm ISOSORP, Bochum, Ger-many, maximum weight 100 g, resolution 10 µg), acrucible containing the polymer sample was attachedto a permanent magnet. The system was placed in asorption chamber maintained at a controlled tempera-ture ((0.05 °C). The system could withstand pressuresup to 30 MPa. The permanent magnet was kept sus-pended by an electromagnet, which was attached to thehook of an analytical balance (SARTORIUS Model MC5). Coupling between the magnet and the electromagnetwas controlled electronically. The balance and theelectromagnet were completely isolated from the sorp-tion chamber and maintained at ambient conditions.The force change due to mass uptake during thesorption process was transmitted from the sorptionchamber to the analytical balance by the coupling of thepermanent magnet and electromagnet. The experimen-tal protocol used to determine diffusion coefficients andsorption equilibria were similar to those used in thequartz spring microbalance experiments. The pressureof scCO2 in the sorption chamber was controlled bymeans of a high-pressure syringe pump (Isco 500D). Thebalance is also equipped with a system for the auto-matic, continuous evaluation of the density of the scCO2in the measuring chamber, based on the buoyancy effecton a known weight. Sorption isotherms were determinedby using both the Rubotherm and quartz spring systemsat each temperature and are reported as equilibriumsorption values as a function of pressure.
2.2.2. Description of Batch Foaming Protocol.The preparation of foam samples was carried out in athermoregulated and pressurized 316 SS high-pressurecylindrical cell (see Figure 1). Typical experiments were
conducted using the following procedure. A known massof PCL was charged into the cell, which was then purgedwith carbon dioxide under ambient conditions. Thetemperature was raised to 70 °C, 10 °C above themelting temperature of pure PCL, and the cell was filledwith CO2 at the desired pressure (referred in thefollowing as initial pressure, PIN) by using an ISCOpump (Isco 500D). Molten polymer samples were keptunder these conditions (P ) PIN and T ) 70 °C) foraround 4 h: that is, a contact time sufficient to achievesorption equilibrium in view of the thickness (around 2mm) of the adopted molten samples. The cell temper-ature was then dropped to the foaming temperature,TFOAM, equal to 24, 27, or 30 °C, in about 5 min. Thecell was then vented by dropping the pressure to 1 atmin around 4 s. This venting time is referred to in thefollowing as foaming time, tFOAM. Several batch foamingexperiments were performed at different values of PIN,in the range 6.5-32 MPa.
2.2.3. Scanning Electron Microscopy. The foamedsamples were sectioned in liquid nitrogen and coatedwith gold using a sputter coater. The structure, revealedby the examination of the fracture surface, was deter-mined by using a variable-pressure scanning electronmicroscope (Hitachi S3200N VP-SEM).
3. Results and Discussion
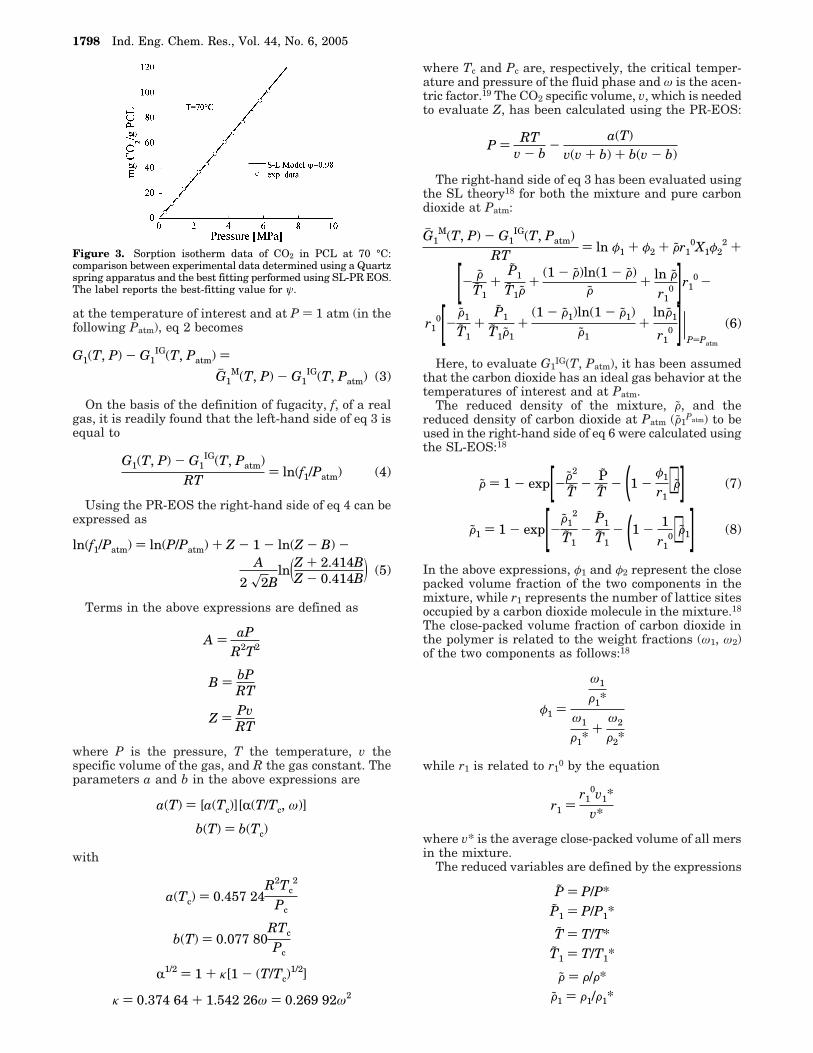
3.1. scCO2 Sorption Isotherms in Molten PCL.The sorption isotherms were determined using the twoexperimental techniques. The Rubotherm apparatuswas used over the pressure range 0-25 MPa at 70, 80,and 90 °C, and the quartz spring balance was used overthe pressure range 0-7 MPa at 70 °C. The results areshown in Figures 2 and 3, respectively.
Sorption equilibrium data were interpreted using theSL and PR-EOS. In particular, at each temperature andpressure, the equality of molar Gibbs free energy of CO2in the gaseous phase and in the molten polymer mixturehas been imposed:
where G1 is the molar free energy of carbon dioxide inthe pure gaseous phase and Gh 1
M is the partial molarfree energy of carbon dioxide in the polymer mixture(it is assumed here that polymer chains are not dis-solved in the carbon dioxide rich phase). Using as areference the molar free energy of the ideal gas (“IG”)
Figure 1. Batch foaming apparatus.
Figure 2. Sorption isotherms of CO2 in PCL at 70, 80, and 90°C: comparison between experimental data determined using aRubotherm apparatus and the best fitting performed usingSL-PR EOS. The label reports best-fitting values for ψ.
G1(T, P) ) Gh 1M(T, P) (2)
Ind. Eng. Chem. Res., Vol. 44, No. 6, 2005 1797
at the temperature of interest and at P ) 1 atm (in thefollowing Patm), eq 2 becomes
On the basis of the definition of fugacity, f, of a realgas, it is readily found that the left-hand side of eq 3 isequal to
Using the PR-EOS the right-hand side of eq 4 can beexpressed as
Terms in the above expressions are defined as
where P is the pressure, T the temperature, v thespecific volume of the gas, and R the gas constant. Theparameters a and b in the above expressions are
with
where Tc and Pc are, respectively, the critical temper-ature and pressure of the fluid phase and ω is the acen-tric factor.19 The CO2 specific volume, v, which is neededto evaluate Z, has been calculated using the PR-EOS:
The right-hand side of eq 3 has been evaluated usingthe SL theory18 for both the mixture and pure carbondioxide at Patm:
Here, to evaluate G1IG(T, Patm), it has been assumed
that the carbon dioxide has an ideal gas behavior at thetemperatures of interest and at Patm.
The reduced density of the mixture, F, and thereduced density of carbon dioxide at Patm (F1
Patm) to beused in the right-hand side of eq 6 were calculated usingthe SL-EOS:18
In the above expressions, φ1 and φ2 represent the closepacked volume fraction of the two components in themixture, while r1 represents the number of lattice sitesoccupied by a carbon dioxide molecule in the mixture.18
The close-packed volume fraction of carbon dioxide inthe polymer is related to the weight fractions (ω1, ω2)of the two components as follows:18
while r1 is related to r10 by the equation
where v* is the average close-packed volume of all mersin the mixture.
The reduced variables are defined by the expressions
Figure 3. Sorption isotherm data of CO2 in PCL at 70 °C:comparison between experimental data determined using a Quartzspring apparatus and the best fitting performed using SL-PR EOS.The label reports the best-fitting value for ψ.
P ) RTv - b
-a(T)
v(v + b) + b(v - b)
Gh 1M(T, P) - G1
IG(T, Patm)RT
) ln φ1 + φ2 + Fr10X1φ2
2 +
[- FT1
+P1
T1F+
(1 - F)ln(1 - F)F
+ ln Fr1
0 ]r10 -
r10[-
F1
T1+
P1
T1F1+
(1 - F1)ln(1 - F1)F1
+lnF1
r10 ]|
P)Patm
(6)
F ) 1 - exp[-F2
T- P
T- (1 -
φ1
r1)F] (7)
F1 ) 1 - exp[-F1
2
T1-
P1
T1- (1 - 1
r10)F1] (8)
φ1 )
ω1
F1*ω1
F1*+
ω2
F2*
r1 )r1
0v1*v*
P ) P/P*P1 ) P/P1*
T ) T/T*T1 ) T/T1*
F ) F/F*F1 ) F1/F1*
G1(T, P) - G1IG(T, Patm) )
Gh 1M(T, P) - G1
IG(T, Patm) (3)
G1(T, P) - G1IG(T, Patm)
RT) ln(f1/Patm) (4)
ln(f1/Patm) ) ln(P/Patm) + Z - 1 - ln(Z - B) -A
2 x2Bln(Z + 2.414B
Z - 0.414B) (5)
A ) aPR2T2
B ) bPRT
Z ) PvRT
a(T) ) [a(Tc)][R(T/Tc, ω)]
b(T) ) b(Tc)
a(Tc) ) 0.457 24R2Tc
2
Pc
b(T) ) 0.077 80RTc
Pc
R1/2 ) 1 + κ[1 - (T/Tc)1/2]
κ ) 0.374 64 + 1.542 26ω ) 0.269 92ω2
1798 Ind. Eng. Chem. Res., Vol. 44, No. 6, 2005

The mixture parameters are evaluated based onspecific mixing rules:18,25
The only parameter which characterizes the binarymixture is ∆P* or X1; these are defined as
where ψ is a dimensionless parameter which measuresthe deviation of P12* from the geometric mean.
A comparison between the prediction of the theoreti-cal model (i.e. eqs 3-8) and the experimental data isshown in Figures 2 and 3. A best fit to the data wasobtained by using as the fitting parameter the SLinteraction parameter, ψ. Best-fit values are reportedin the insets of Figures 2 and 3. A satisfactory agree-ment between the theoretical model and the experimen-tal data was obtained over the pressure range 0-7 MPa,while significant deviations between the prediction ofthe model and the experimental data were observed overthe pressure range 7-25 MPa.
3.2. Sorption Kinetics of scCO2 in Molten PCL.Effective mutual diffusion coefficients of CO2 in moltenPCL were evaluated according to the procedure reportedin the Experimental Section. Sorption kinetics obtainedwith the magnetic suspension balance for pressurescomprised between 0.2 and 10 MPa, at 70 °C, arepresented in Figure 4 as plots of M(t)/M∞ versus thesquare root of time divided by the thickness of thesample. At CO2 pressures below its critical pressure(Pc
CO2 ) 7.38 MPa) the kinetics of carbon dioxidesorption in PCL exhibit essentially linear behavior upto a value of at least M(t)/M∞ equal to 0.6, consistentwith purely Fickian diffusion. At higher pressures, thekinetics of sorption change significantly, most likely dueto the formation of a dispersed fluid phase within thepolymer at elevated pressures, discussed later.
The values of the mutual diffusion coefficient at 70,80, and 90 °C and at pressures up to 25 MPa are re-ported in Figure 5 as a function of carbon dioxide con-centration (mgCO2/gPCL). A steady increase of D(C) withCO2 concentration occurs up to about 100 mgCO2/gPCL
while at higher values of concentration an apparentmarked increase of the diffusivity occurs at 70 and 80°C at pressure levels of CO2 above Pc
CO2. In fact, sub-sequent experiments performed at 70 °C using a viewcell apparatus26 showed that, at pressures above Pc
CO2,bubble formation occurs in the polymer-scCO2 mixture.In Figure 6 are reported photographs of the moltenPCL/CO2 system in the view cell taken at differentpressures (3.45, 6.9, 13.8, and 24.15 MPa) at 70 °C. Theobserved increase of the effective mutual diffusivity athigher pressures is, therefore, consistent with theformation of a second, dispersed, low-density phase.Under these experimental conditions, CO2 diffusionoccurs in a heterogeneous medium, comprising bubbles
Figure 4. Sorption kinetics of CO2 at various pressures in PCLat 70 °C obtained with a Rubotherm apparatus.
P* ) φ1P1* + φ2P2* - φ1φ2∆P*
T* ) P*
(φ1P1*T1*
+φ2P2*T2* )
F* ) (ω1F1* + ω2F2*)-1
∆P* ) P1* + P2* - 2P12*
P12* ) ψxP1*P2*
X1 )∆P*M1
RTF1*r10
Figure 5. Mutual diffusivity of CO2 in the PCL/CO2 system vscarbon dioxide concentration in the polymer phase.
Figure 6. Photographs of the molten PCL/CO2 system in the viewcell at 70 °C and different pressures: (a) 3.45, (b) 6.80, (c) 13.80,and (d) 24.15 MPa.
Ind. Eng. Chem. Res., Vol. 44, No. 6, 2005 1799

of fluid dispersed in the molten polymer-CO2 solution,which provide a parallel, lower resistance path fordiffusion.
The formation of a separate fluid phase in the bulkof the polymer-rich solution induced by pressure in-crease suggests rather peculiar phase bahavior of thesystem at hand. In fact, few examples have beenreported in the literature of demixing of polymer-solvent mixtures induced by pressure increase, as, forexample, the case of the cyclohexane-polystyrene and1-phenyldecane-polystyrene systems.27,28 Relevant ex-amples are available also for the case of polymersolutions in supercritical fluids, as is the case of pres-sure-induced demixing upon an increase in pressure inpolymer solutions of poly(dimethylsiloxane) in super-critical carbon dioxide29 and of the anomalous swellingbehavior of PMMA films exposed to supercritical CO2.30
The behaviors of polymer solutions in supercriticalfluids are dominated by the large differences in freevolume between solvent and polymer as well as by theisothermal compressibility, the volume expansivity, andconcentration fluctuations of the solution. Energetic(enthalpy of mixing) and entropic thermodynamic forces(entropy of mixing and noncombinatorial entropy changesrelated to free volume dissimilarities between thesolvent and the polymer) determine the phase behaviorof the system. In particular, phase instability is deter-mined by the relative importance of an “incompressible”contribution and a “compressible” contribution. Thelatter is scaled by the solution compressibility andalways contributes unfavorably to phase stability.30-32
In the case of PMMA thin films contacted with super-critical CO2,30 the authors report anomalous maximain the swelling isotherms. Interestingly, these maximaoccur in the regions of pressure/temperature where pureCO2 compressibility also shows a maximum. This maxi-mum in compressibility shifts to higher pressures andbecomes broader and smaller in magnitude as thetemperature increases: a consistent trend was observedalso for the anomalous swelling maxima. This anoma-lous swelling was attributed to the formation of a lessdense phase, due to a separation of CO2 from thepolymer as a consequence of decrease in CO2 solubilitypromoted by an increase in compressibility. The phase-separated CO2-rich phase does not leave the polymerfilm over the experimental time scale, due to reducedmobility of the surrounding polymer-rich phase and, aspostulated by the authors, to critical wetting phenomenathat allow the CO2 to remain and expand the film.
Similar arguments can be invoked to justify also thephase separation behavior, induced by pressure in-crease, observed in the present investigation. Super-critical fluids are characterized by large gas compress-ibilities near the critical point, which can produceabrupt changes in density over small pressure incre-ment. As a consequence also the “quality” of the solventis greatly influenced by pressure and temperatureconditions. Depending on the nature of the prevailinginteractions in the system between solvent and polymermolecules (attractive or repulsive), the solvent qualitycan increase or decrease with increasing density (or,equivalently, pressure).32 It is likely that at the tem-perature conditions considered in the present investiga-tion the maxima in CO2 compressibility, which are stillrelevant, play a role in affecting the phase behavior andinducing at 70 °C a phase separation evident from thevisual inspection as well as from the abrupt increase of
the apparent diffusivity. This phenomenon tends todecrease with temperature in connection with thebroadening and with the decrement of the compress-ibility maximum, which moves toward higher pressures.A maximum in the sorption isotherms would be ex-pected if the phase-separated fluid phase could com-pletely separate from the polymer-rich phase. It is likelythat, in the case under investigation, this effect was notobserved, since the high viscosity of the surroundingmedium and possible critical wetting phenomena pre-vent the carbon dioxide rich bubbles from leaving themolten polymer solution and the sample pan.
3.3. Batch Foaming Results. In batch foaming it isimportant to control the initial equilibrium temperature,TIN, the initial pressure, PIN, the foaming temperature,TFOAM, and foaming time, tFOAM, to obtain microcellularfoams with controlled properties. During the equilibra-tion step the polymer was maintained in its molten stateat TIN ) 70 °C. Sorption equilibrium was obtained atthe imposed initial pressure of scCO2. The mixture wasthen rapidly cooled to the desired foaming temperature,TFOAM, while maintaining a constant pressure in thesystem. The system was kept under these conditions fora few minutes to ensure the development of a uniformtemperature distribution. No supersaturation was de-veloped, since the solubility increases as the tempera-ture decreases. The development of supersaturation andhomogeneous nucleation of a foam structure was theninduced by rapidly decreasing the pressure of themixture to atmospheric pressure. The experimentalconditions used in this study to produce the PCL foamswith scCO2 are summarized in Table 2. Due to theincrease of solubility at lower temperatures, the CO2pressure should decrease as a consequence of increasedCO2 solubility after cooling. However, in view of thelower carbon dioxide diffusivity at the relatively lowfoaming temperatures, it is reasonable to assume that,during the few minutes allowed for temperature equili-bration, no significant change of carbon dioxide concen-tration occurs in the polymer melt.
This laboratory-scale foaming procedure was adoptedto mimic the processing conditions actually used toproduce foams, where a molten polymer-gas mixtureis formed at high temperature (e.g. in an extruder) andfoaming occurs by depressurization at low temperature.The relatively low temperature used during foaming isrequired to permit immobilization of the foam throughviscosity increase and, eventually, partial matrix crys-tallization after phase separation and cell formation.
Accurate control of the cooling rate following thesaturation of the mixture was not possible. The experi-mental design allowed the attainment of the foamingtemperature in the range 24-30 °C, however, to bereached in a few minutes.
3.4. Effects of Foaming Temperature and InitialPressure on the Foam Structure. SEM photomicro-graphs of the PCL foams are presented in Figures 7 and8. The samples have a uniform foam structure with amicroporous core and apparently dense skin. The effectof foaming temperature on the foam structures is shownin Figure 7, where a marked difference is apparent
Table 2. PCL-CO2 Batch Foaming ExperimentalParameters
TFOAM (°C) PIN range (MPa) TIN (°C) tFOAM (s)
24 6.5-32 70 427 6.5-32 70 430 6.5-32 70 4
1800 Ind. Eng. Chem. Res., Vol. 44, No. 6, 2005

between the foam structures, generated at values ofTFOAM equal to 24, 27, and 30 °C and at PIN equal to 6.9MPa, in terms of number of cells per unit area and meandiameter of the cells. Moreover, various structures ofthe foams produced at values of PIN equal to 6.9, 20.7,and 31.7 MPa at 24 °C are shown in Figure 8.
To analyze these effects, the mean diameter of thecells and the number of observed cells per unit area, inthe pressure range 7-32 MPa for the three foamingtemperatures, are plotted in Figures 9 and 10. Thenumber of cells per unit area increases and the meandiameter of the cells decreases with increasing PIN anddecreasing TFOAM. The dependence of the number of cellsper unit area and the mean cell size on pressure appearsto reach a plateau when PIN > Pc
CO2.The number of bubbles formed during the batch
foaming process and their mean size are determined bythe competition between bubble nucleation and growthrates. If nucleation rate dominates, a larger number ofcells and a smaller mean cell diameter is expected. Theopposite holds if growth rate is higher.
In summary, foaming temperature influences severalfactors that, in turn, can have opposite effects on bubble
nucleation and growth rate. As a consequence, theprediction of the effect of TFOAM in the range 24-30 °Con the size and number of cells in the resulting foam isquite complicated. As a matter of fact, batch foamingexperiments show that the competition between growthand nucleation rates give rise to the smallest cell sizeat the lowest foaming temperature (i.e. 24 °C).
If we fix TFOAM, the dominating factor which deter-mines the final cell size is PIN or, more properly, theassociated initial concentration of carbon dioxide. As thepressure increases, the supersaturation increases oncedepressurization is imposed. Consequently, the bubblediameter is expected to decrease while the number ofbubbles is expected to increase as the initial pressureis raised. However, above a certain value of initialpressure (around 10.3 MPa) the initial concentration ofCO2 is found to be rather constant with pressure (seeFigure 2). As a result, above a value of PIN close to 10.3MPa, the number and mean size of cells obtained bybatch foaming become rather insensitive to initialequilibrium conditions.
4. Conclusions
Mass transport kinetics and sorption equilibria of CO2in PCL melts have been determined at 70, 80, and 90°C at carbon dioxide pressures both below and abovePc
CO2. The experimental sorption data were describedby the Sanchez-Lacombe lattice model and the Peng-Robinson equation of state. The CO2 mutual diffusivityhas been determined as a function of concentration ofdissolved CO2. A steady increase with concentration upto a pressure of approximately 10 MPa, followed by adramatic increase in the apparent effective diffusioncoefficients at high pressure, was observed. This abruptchange can be attributed to the formation of a dispersed,fluid bubble phase, separate from the polymer-fluidsolution. Interestingly, this phase separation phenom-enon occurs in the regions of pressure/temperaturewhere pure CO2 compressibility also shows a maximum.
Biodegradable foams based on PCL were obtainedwith various cell densities and mean cell sizes, using abatch scCO2 foaming process involving variation ofinitial pressure between 6.9 and 32 MPa and foamingtemperature between 24 and 30 °C. The morphology ofthe resulting foams was related to the fundamentalprocesses responsible for controlling both nucleation andgrowth of cells within the PCL foam. These fundamental
Figure 7. Scanning electron microscope micrographs of the cellstructure of PCL foams obtained starting from CO2/PCL solutionsat 24, 27, and 30 °C subjected to rapid pressure decrease from 6.9MPa to atmospheric pressure.
Figure 8. Scanning electron microscope micrographs of the cellstructure of PCL foams obtained starting from CO2/PCL solutionsat 24 °C subjected to rapid pressure decrease from 6.9, 20.7, and31.7 MPa to atmospheric pressure.
Figure 9. Effect of foaming temperature and initial pressure onthe size of the foam cells. On the left side of the dotted line PIN <Pc
CO2, and on the right side PIN > PcCO2.
Figure 10. Effect of foaming temperature and initial pressureon the number of foam cells per unit area. On the left side of thedotted line PIN < Pc
CO2, and on the right side PIN > PcCO2.
Ind. Eng. Chem. Res., Vol. 44, No. 6, 2005 1801

processes are additionally described in terms of theindependently measured sorption equilibria and sorp-tion kinetics measured and presented in the study.
Nomenclature
a ) attraction parameterb ) van der Waals covolumeC ) penetrant concentrationD ) mutual diffusivityDh ) average mutual diffusivityf1 ) carbon dioxide fugacity in the pure gas phaseG1(T, P) ) molar Gibbs free energy of carbon dioxide at T
and PG1
IG(T, Patm) ) molar Gibbs free energy of ideal gas at Tand P ) 1 atm
Gh 1M(T, P) ) partial molar Gibbs free energy of carbondioxide in the mixture at T and P
k ) Boltzman constantL ) sample thicknessM∞ ) mass of carbon dioxide sorbed at equilibriumMt ) mass of carbon dioxide sorbed at time tM1 ) molecular weight of carbon dioxideMw ) weight average molecular weight of PCLP ) pressurePatm ) atmospheric pressureP* ) characteristic pressure∆P* ) binary mixture parameterP12* ) binary mixture parameterP ) reduced pressure of the PCL-CO2 mixtureP1*, P2* ) characteristic pressures (hypothetical cohesive
energy density of a component in the close-packed state)of CO2 and PCL
P1 ) reduced pressure of pure CO2Pc ) critical pressurePc
CO2 ) CO2 critical pressurePIN ) initial pressure in the pressure vessel in a batch
foaming experimentR ) gas constantr1
0 ) number of lattice sites occupied by a carbon dioxidemolecule in the pure gas state
r1 ) number of lattice sites occupied by a carbon dioxidemolecule in the PCL-CO2 mixture
T ) absolute temperatureT* ) characteristic temperature of the PCL-CO2 mixtureT ) reduced temperature of the PCL-CO2 mixtureT1*, T2* ) characteristic temperatures of CO2, PCLT1 ) reduced temperature of pure CO2Tc ) critical temperature of carbon dioxideTcry ) crystallization temperature of PCLTFOAM ) foaming temperaturetFOAM ) foaming time, i.e., time elapsed for pressure dropTg ) glass transition temperature of PCLTIN ) initial temperature in a batch foaming experimentTm ) melting temperature of PCLV ) volumev ) molar volume of carbon dioxidev* ) average close-packed volume of a mer in the mixturev1*, v2* ) close packed volumes of a mer of CO2 or of PCL
in the pure stateZ ) compressibility factorX1 ) binary mixture parameter
Greek Letters
R ) scaling factorφ1, φ2 ) close-packed volume fractions of CO2, PCLκ ) characteristic constant in the definition of RF* ) characteristic density (mass density in the close-
packed state) of the PCL-CO2 mixtureF ) reduced density of the PCL-CO2 mixture
F1*, F2* ) characteristic densities (mass densities in theclose-packed state) of CO2, PCL
F1 ) reduced density of pure CO2ω ) acentric factorω1, ω2 ) mass fractions of CO2, PCL in the mixtureψ ) SL dimensionless interaction parameter
Superscripts
* ) characteristic stateIG ) ideal gas stateM ) mixture
Subscripts
1, 2 ) identification for CO2, PCLc ) critical propertyPatm ) properties and terms evaluated at P ) 1 atm
Literature Cited
(1) Park, C. B.; Behravesh, A. H.; Venter, R. D. Low-densitymicrocellular foam processing in extrusion using CO2. Polym. Eng.Sci. 1998, 38, 1812.
(2) Martinache, J. D.; Royer, J. R.; Siripurapu, S.; Henon, F.E.; Genzer, J.; Khan, S. A.; Carbonell, R. G. Processing ofpolyamide 11 with supercritical carbon dioxide. Ind. Eng. Chem.Res. 2001, 40, 5570.
(3) Handa, Y. P.; Zhiyi, Z.; Wong, B. Solubility, diffusivity, andretrograde vitrification in PMMA-CO2, and development of sub-micron cellular structures. Cellular Polym. 2001, 20 (1), 1.
(4) Johnston, K. P., Penninger, M. L., Eds. Supercritical FluidScience and Technology; ACS Symposium Series 406; AmericanChemical Society: Washington, DC, 1989 (developed from asymposium at the American Institute of Chemical EngineersAnnual Meeting, Washington, DC, Nov 27-Dec 2, 1988).
(5) Goel, S. K.; Beckman, E. J. Nucleation and growth inmicrocellular materials: supercritical CO2 as foaming agent.AICHE J. 1995, 41, 357.
(6) Shim, J.; Yates, M. Z.; Johnston, K. P. Polymer coating byrapid expansion of suspensions in supercritical carbon dioxide. Ind.Eng. Chem. Res. 1999, 38, 3655.
(7) Berens, A. R.; Huvard, G. S.; Korsmeyer, R. W.; Kunig, F.W. Application of compressed carbon dioxide in the incorporationof additives into polymers. J. Appl. Polym. Sci. 1992, 46 (2), 231.
(8) Li, D.; Han, B. Impregnation of polyethylene (PE) withstyrene using supercritical CO2 as swelling agent and preparationof PE/polystyrene composites. Ind. Eng. Chem. Res. 2000, 39, 4506.
(9) Charpentier, P. A.; Kennedy, K. A.; DeSimone, J. M.;Roberts, G. W. Continuous polymerizations in supercritical carbondioxide: chain-growth precipitation polymerizations. Macromol-ecules 1999, 32, 5973.
(10) Goel, S. K.; Beckman, E. J. Generation of microcellularpolymeric foams using supercritical carbon dioxide I: Effect ofpressure and temperature on nucleation. Polym. Eng. Sci. 1994,34 (14), 1137.
(11) Goel, S. K.; Beckman, E. J. Generation of microcellularpolymeric foams using supercritical carbon dioxide. II: Cell growthand skin formation Polym. Eng. Sci. 1994, 34 (14), 1148.
(12) Venerus, D. C.; Yala, N. Transport analysis of diffusion-induced bubble growth and collapse in viscous liquids. AICHE J.1997, 43 (11), 2948.
(13) Han, X.; Baxter, A. R.; Koelling, K. W.; Tomasko, D. L.;Lee, L. J. Influences of solubility and viscosity in the polystyrene/CO2 microcellular foaming extrusion Antec 2002, 60 (2), 1910.
(14) Di Maio, E.; Iannace, S.; Nicolais, L.; Flumerfelt, W.; Li,R. W. Structure optimization of PCL foams, by using mixtures ofCO2 and N2 as blowing agents. Polym. Eng. Sci. 2005, 45 (3), 432.
(15) Sanchez, I. C.; Lacombe, R. H. An elementary moleculartheory of classical fluids. Pure fluids. J. Phys. Chem. 1976, 80 (21),2352.
(16) Sanchez, I. C.; Lacombe, R. H. Theory of liquid-liquid andliquid-vapor equilibriums. Nature 1974, 252 (21), 381.
(17) Sanchez, I. C.; Lacombe, R. H. Statistical thermodynamicsof fluids mixtures. J. Phys. Chem. 1976, 80 (23), 2568.
(18) Sanchez, I. C.; Lacombe, R. H. Statistical thermodynamicsof polymer solutions. Macromolecules 1978, 11 (6), 1145.
(19) Peng, D. Y.; Robinson, D. B. A new two constant equationof state. Ind. Eng. Chem., Fundam. 1976, 15 (1), 59.
1802 Ind. Eng. Chem. Res., Vol. 44, No. 6, 2005

(20) Cotugno, S.; Mensitieri, G.; Iannace, S.; Di Maio, E.;Ciardiello, C.; Nicolais, L. Sorption thermodynamics and mutualdiffusivity of carbon dioxide in molten polycaprolactone. Ind. Eng.Chem. Res. 2003, 42, 4398.
(21) Kiszka, M. B.; Meilchen, M. A.; McHugh, M. A. Modellinghigh-pressure gas-polymer mixtures using the Sanchez-Lacombeequation of state. J. Appl. Polym. Sci. 1988, 36, 583.
(22) Hariharan, R.; Freeman, B. D.; Carbonell, R. G.; Sarti, G.C. Equation of state predictions of sorption isotherms in polymericmaterials. J. Appl. Polym. Sci. 1993, 50, 1781.
(23) Vrentas, J. S.; Duda, J. L.; Ni, Y. C. Analysis of step-changesorption experiments. J. Polym. Sci.: Polym. Phys. Ed. 1977, 15,2039.
(24) Crank, J. The Mathematics of Diffusion, 2nd ed.; OxfordUniversity Press: Oxford, U.K., 1975.
(25) Pope, D. S.; Sanchez, I. C.; Koros, W. J.; Fleming, G. K.Statistical thermodynamic interpretation of sorption/dilation be-havior of gases in silicone rubber. Macromolecules 1991, 24, 1779.
(26) Royer, J. R.; DeSimone, J. M.; Khan, S. A. Carbon dioxide-induced swelling of poly(dimethylsiloxane). Macromolecules 1999,32, 8965.
(27) Koningsveld, R.; Stockmayer, W. H.; Nies, E. PolymerPhase Diagrams: A Textbook; Oxford University Press: New York,2001.
(28) Wolf, B. A.; Geerissen, H. Pressure dependence of thedemixing of polymer solutions determined by viscometry. ColloidPolym. Sci. 1981, 259, 1214.
(29) Melnichenko, Y. B.; Kiran, E.; Wignall, G. D.; Heath, K.D.; Salaniwal, S.; Cochran, H. D.; Stamm, M. Pressure- andtemperature-induced transitions in solutions of poly(dimethylsi-loxane) in supercritical carbon dioxide. Macromolecules 1999, 32,5344.
(30) Sirard, S. M.; Ziegler, K. J.; Sanchez, I. C.; Green, P. F.;Johnston, P. K. Anomalous properties of poly(methyl methacrylate)thin films in supercritical carbon dioxide. Macromolecules 2002,35, 1928.
(31) Sanchez, I. C.; Stone, M. T. In Polymer Blends: Formula-tion; Paul, D. R., Bucknall, C., Eds.; Wiley: New York, 2000;Vol. 1.
(32) Luna-Barcenas, G.; Meredith, J. C.; Sanchez, I. C.; Johnston,K. P.; Gromov, D. G.; de Pablo, J. J. Relationship between polymerchain conformation and phase boundaries in a supercritical fluid.J. Chem. Phys. 1997, 107 (24), 10782.
Received for review June 24, 2004Revised manuscript received December 27, 2004
Accepted January 11, 2005
IE049445C
Ind. Eng. Chem. Res., Vol. 44, No. 6, 2005 1803