chapter3 fgdc
TRANSCRIPT
7/29/2019 chapter3 FGDC
http://slidepdf.com/reader/full/chapter3-fgdc 1/28
Federal Geographic Data Committee
Department of Agriculture • Department of Commerce • Department of Defense • Department of EnergyDepartment of Housing and Urban Development • Department of the Interior • Department of State
Department of Transportation • Environmental Protection AgencyFederal Emergency Management Agency • Library of Congress
National Aeronautics and Space Administration • National Archives and Records Administration
Tennessee Valley Authority
FGDC-STD-007.3-1998
Geospatial Positioning Accuracy Standards
Part 3: National Standard for Spatial Data Accuracy
Subcommittee for Base Cartographic Data
Federal Geographic Data Committee
7/29/2019 chapter3 FGDC
http://slidepdf.com/reader/full/chapter3-fgdc 2/28
3-ii
Federal Geographic Data Committee
Established by Office of Management and Budget Circular A-16, the Federal Geographic Data Committee
(FGDC) promotes the coordinated development, use, sharing, and dissemination of geographic data.
The FGDC is composed of representatives from the Departments of Agriculture, Commerce, Defense,Energy, Housing and Urban Development, the Interior, State, and Transportation; the Environmental
Protection Agency; the Federal Emergency Management Agency; the Library of Congress; the National
Aeronautics and Space Administration; the National Archives and Records Administration; and the
Tennessee Valley Authority. Additional Federal agencies participate on FGDC subcommittees and
working groups. The Department of the Interior chairs the committee.
FGDC subcommittees work on issues related to data categories coordinated under the circular.
Subcommittees establish and implement standards for data content, quality, and transfer; encourage the
exchange of information and the transfer of data; and organize the collection of geographic data to reduce
duplication of effort. Working groups are established for issues that transcend data categories.
For more information about the committee, or to be added to the committee's newsletter mailing list,
please contact:
Federal Geographic Data Committee Secretariat
c/o U.S. Geological Survey
590 National Center
Reston, Virginia 22092
Telephone: (703) 648-5514
Facsimile: (703) 648-5755
Internet (electronic mail): [email protected]
Anonymous FTP: ftp://fgdc.er.usgs.gov/pub/gdc/
World Wide Web: http://fgdc.er.usgs.gov/fgdc.html
7/29/2019 chapter3 FGDC
http://slidepdf.com/reader/full/chapter3-fgdc 3/28
Federal Geographic Data Committee FGDC-STD-007.3-1998
Geospatial Positioning Accuracy Standards
Part 3: National Standard for Spatial Data Accuracy
3-iii
CONTENTS
Page
3.1 Introduction . . . . . . . . . . . . . . . . . . . . . . . . . . . . . . . . . . . . . . . . . . . . . . . . . . . . . . . . . . . . . . 3-1
3.1.1 Objective . . . . . . . . . . . . . . . . . . . . . . . . . . . . . . . . . . . . . . . . . . . . . . . . . . . . . . . . . 3-1
3.1.2 Scope . . . . . . . . . . . . . . . . . . . . . . . . . . . . . . . . . . . . . . . . . . . . . . . . . . . . . . . . . . . . 3-1
3.1.3 Applicability . . . . . . . . . . . . . . . . . . . . . . . . . . . . . . . . . . . . . . . . . . . . . . . . . . . . . . 3-1
3.1.4 Related Standards . . . . . . . . . . . . . . . . . . . . . . . . . . . . . . . . . . . . . . . . . . . . . . . . . . 3-1
3.1.5 Standards Development Procedures . . . . . . . . . . . . . . . . . . . . . . . . . . . . . . . . . . . . . 3-2
3.1.6 Maintenance . . . . . . . . . . . . . . . . . . . . . . . . . . . . . . . . . . . . . . . . . . . . . . . . . . . . . . 3-3
3.2 Testing Methodology And Reporting Requirements . . . . . . . . . . . . . . . . . . . . . . . . . . . . . . . . 3-4
3.2.1 Spatial Accuracy . . . . . . . . . . . . . . . . . . . . . . . . . . . . . . . . . . . . . . . . . . . . . . . . . . . 3-4
3.2.2 Accuracy Test Guidelines . . . . . . . . . . . . . . . . . . . . . . . . . . . . . . . . . . . . . . . . . . . . . 3-4
3.2.3 Accuracy Reporting . . . . . . . . . . . . . . . . . . . . . . . . . . . . . . . . . . . . . . . . . . . . . . . . . 3-5
3.3 NSSDA and Other Map Accuracy Standards . . . . . . . . . . . . . . . . . . . . . . . . . . . . . . . . . . . . . 3-7
References . . . . . . . . . . . . . . . . . . . . . . . . . . . . . . . . . . . . . . . . . . . . . . . . . . . . . . . . . . . . . . . . . . . . . . 3-8
Appendices
Appendix 3-A. Accuracy Statistics (normative) . . . . . . . . . . . . . . . . . . . . . . . . . . . . . . . . . . . . . . . . . . 3-9
Appendix 3-B Horizontal Accuracy Computations (informative) . . . . . . . . . . . . . . . . . . . . . . . . . . . . 3-12
Appendix 3-C. Testing guidelines (informative) . . . . . . . . . . . . . . . . . . . . . . . . . . . . . . . . . . . . . . . . 3-16
Appendix 3-D. Other Accuracy Standards (informative) . . . . . . . . . . . . . . . . . . . . . . . . . . . . . . . . . . 3-19
Tables
1. Accuracy Calculations for Crider, Kentucky USGS 1:24,000-scale Topographic Quadrangle
RMSE = RMSE assumed . . . . . . . . . . . . . . . . . . . . . . . . . . . . . . . . . . . . . . . . . . . . . . . . . . 3-14x y
2. Accuracy Computations for Crider, Kentucky USGS 1:24,000-scale Topographic Quadrangle
RMSE RMSE . . . . . . . . . . . . . . . . . . . . . . . . . . . . . . . . . . . . . . . . . . . . . . . . . . . . . . . . . 3-15x y
3. ASPRS Accuracy Standards for Large-Scale Maps, Class 1 horizontal (x or y) limiting RMSE for
various map scales at ground scale for feet units . . . . . . . . . . . . . . . . . . . . . . . . . . . . . . . . . 3-23
4. ASPRS Accuracy Standards for Large-Scale Maps, Class 1 horizontal (x or y) limiting RMSE for
various map scales at ground scale for metric units . . . . . . . . . . . . . . . . . . . . . . . . . . . . . . . 3-24
7/29/2019 chapter3 FGDC
http://slidepdf.com/reader/full/chapter3-fgdc 4/28
Federal Geographic Data Committee FGDC-STD-007.3-1998
Geospatial Positioning Accuracy Standards
Part 3: National Standard for Spatial Data Accuracy
3-1
3.1 Introduction
3.1.1 Objective
The National Standard for Spatial Data Accuracy (NSSDA) implements a statistical and testing
methodology for estimating the positional accuracy of points on maps and in digital geospatial data,
with respect to georeferenced ground positions of higher accuracy.
3.1.2 Scope
The NSSDA applies to fully georeferenced maps and digital geospatial data, in either raster, point,
or vector format, derived from sources such as aerial photographs, satellite imagery, and ground
surveys. It provides a common language for reporting accuracy to facilitate the identification of
spatial data for geographic applications.
This standard is classified as a Data Usability Standard by the Federal Geographic Data Committee
Standards Reference Model . A Data Usability Standard describes how to express “the applicability
or essence of a dataset or data element” and includes “data quality, assessment, accuracy, and
reporting or documentation standards” (FGDC, 1996, p. 8)
This standard does not define threshold accuracy values. Agencies are encouraged to establish
thresholds for their product specifications and applications and for contracting purposes. Ultimately,
users identify acceptable accuracies for their applications. Data and map producers must determine
what accuracy exists or is achievable for their data and report it according to NSSDA.
3.1.3 Applicability
Use the NSSDA to evaluate and report the positional accuracy of maps and geospatial data produced,
revised, or disseminated by or for the Federal Government. According to Executive Order 12906,
Coordinating Geographic Data Acquisition and Access: the National Spatial Data Infrastructure
(Clinton, 1994, Sec. 4. Data Standards Activities, item d), “Federal agencies collecting or producing
geospatial data, either directly or indirectly (e.g. through grants, partnerships, or contracts with
other entities), shall ensure, prior to obligating funds for such activities, that data will be collected
in a manner that meets all relevant standards adopted through the FGDC process.”
Accuracy of new or revised spatial data will be reported according to the NSSDA. Accuracy of
existing or legacy spatial data and maps may be reported, as specified, according to the NSSDA or
the accuracy standard by which they were evaluated.
3.1.4 Related Standards
Data producers may elect to use conformance levels or accuracy thresholds in standards such as the
National Map Accuracy Standards of 1947 (U.S. Bureau of the Budget, 1947) or Accuracy Standards
for Large-Scale Maps [American Society for Photogrammetry and Remote Sensing (ASPRS)
Specifications and Standards Committee, 1990] if they decide that these values are truly applicable
7/29/2019 chapter3 FGDC
http://slidepdf.com/reader/full/chapter3-fgdc 5/28
Federal Geographic Data Committee FGDC-STD-007.3-1998
Geospatial Positioning Accuracy Standards
Part 3: National Standard for Spatial Data Accuracy
3-2
for digital geospatial data.
Positional accuracy of geodetically surveyed points is reported according to Part 2, Standards for
Geodetic Control Networks (Federal Geographic Data Committee, 1998), Geospatial Positioning
Accuracy Standards. Ground coordinates of points collected according to Standards and
Specifications for Geodetic Control Networks (Federal Geodetic Control Committee, 1984) are used
in the National Spatial Reference System (NSRS). NSRS is a consistent national coordinate system
that defines latitude, longitude, height, scale, gravity, and orientation throughout the Nation, and
how these values change with time. Consequently, it ties spatial data to georeferenced positions.
NSRS points may be selected as an independent source of higher accuracy to test positional accuracy
of maps and geospatial data according to the NSSDA.
Part 4, Standards for A/E/C and Facility Management (Facilities Working Group, 1997), uses the
NSSDA for accuracy testing and verification. The NSSDA may be used for fully georeferenced
maps for A/E/C and Facility Management applications such as preliminary site planning andreconnaissance mapping.
3.1.5 Standards Development Procedures
The National Standard for Spatial Data Accuracy was developed by the FGDC ad hoc working
group on spatial data accuracy, with the intent to update the United States National Map Accuracy
Standards (NMAS) (U.S. Bureau of the Budget, 1947). The ASPRS Accuracy Standards for Large-
Scale Maps (ASPRS Specifications and Standards Committee, 1990) formed the basis for update
of the NMAS. The NSSDA, in its former version as the draft National Cartographic Standards for
Spatial Accuracy (NCSSA), extended the ASPRS Accuracy Standards to map scales smaller than
1:20,000. The NCSSA were released for public review through the Federal Geographic Data
Committee and were substantially rewritten as a result.
The geospatial data community has diversified to include many data producers with different product
specifications and many data users with different application requirements. The NSSDA was
developed to provide a common reporting mechanism so that users can directly compare datasets for
their applications. It was realized that map-dependent measures of accuracy, such as publication
scale and contour interval, were not fully applicable when digital geospatial data can be readily
manipulated and output to any scale or data format. Principal changes included requirements to
report numeric accuracy values; a composite statistic for horizontal accuracy, instead of component
(x,y) accuracy, and alignment with emerging Federal Geographic Control Subcommittee (FGCS)
accuracy standards (FGDC, 1998). The NCSSA was renamed the National Standard for Spatial Data
Accuracy to emphasize its applicability to digital geospatial data as well as graphic maps.

7/29/2019 chapter3 FGDC
http://slidepdf.com/reader/full/chapter3-fgdc 6/28
Federal Geographic Data Committee FGDC-STD-007.3-1998
Geospatial Positioning Accuracy Standards
Part 3: National Standard for Spatial Data Accuracy
3-3
3.1.6 Maintenance
The U.S. Department of the Interior, U.S. Geological Survey (USGS), National Mapping Division,
maintains the National Standard for Spatial Data Accuracy (NSSDA) for the Federal Geographic
Data Committee. Address questions concerning the NSSDA to: Chief, National Mapping Division,
USGS, 516 National Center, Reston, VA 20192.
7/29/2019 chapter3 FGDC
http://slidepdf.com/reader/full/chapter3-fgdc 7/28
Federal Geographic Data Committee FGDC-STD-007.3-1998
Geospatial Positioning Accuracy Standards
Part 3: National Standard for Spatial Data Accuracy
see Appendix 3-A1
see Appendix 3-C, section 22
see Appendix 3-C, section 13
see Appendix 3-C, section 34
3-4
3.2 Testing Methodology And Reporting Requirements
3.2.1 Spatial Accuracy
The NSSDA uses root-mean-square error (RMSE) to estimate positional accuracy. RMSE is the
square root of the average of the set of squared differences between dataset coordinate values and
coordinate values from an independent source of higher accuracy for identical points .1
Accuracy is reported in ground distances at the 95% confidence level. Accuracy reported at the 95%
confidence level means that 95% of the positions in the dataset will have an error with respect to true
ground position that is equal to or smaller than the reported accuracy value. The reported accuracy
value reflects all uncertainties, including those introduced by geodetic control coordinates,
compilation, and final computation of ground coordinate values in the product.
3.2.2 Accuracy Test Guidelines
According to the Spatial Data Transfer Standard (SDTS) (ANSI-NCITS, 1998), accuracy testing by
an independent source of higher accuracy is the preferred test for positional accuracy.
Consequently, the NSSDA presents guidelines for accuracy testing by an independent source of
higher accuracy. The independent source of higher accuracy shall the highest accuracy feasible and
practicable to evaluate the accuracy of the dataset.2
The data producer shall determine the geographic extent of testing. Horizontal accuracy shall be
tested by comparing the planimetric coordinates of well-defined points in the dataset with3
coordinates of the same points from an independent source of higher accuracy. Vertical accuracy
shall be tested by comparing the elevations in the dataset with elevations of the same points as
determined from an independent source of higher accuracy.
Errors in recording or processing data, such as reversing signs or inconsistencies between the dataset
and independent source of higher accuracy in coordinate reference system definition, must be
corrected before computing the accuracy value.
A minimum of 20 check points shall be tested, distributed to reflect the geographic area of interest
and the distribution of error in the dataset. When 20 points are tested, the 95% confidence level4
allows one point to fail the threshold given in product specifications.
7/29/2019 chapter3 FGDC
http://slidepdf.com/reader/full/chapter3-fgdc 8/28
Federal Geographic Data Committee FGDC-STD-007.3-1998
Geospatial Positioning Accuracy Standards
Part 3: National Standard for Spatial Data Accuracy
3-5
If fewer than twenty points can be identified for testing, use an alternative means to evaluate the
accuracy of the dataset. SDTS (ANSI-NCITS, 1998) identifies these alternative methods for determining positional accuracy:
Deductive Estimate
Internal Evidence
Comparison to Source
3.2.3 Accuracy Reporting
Spatial data may be compiled to comply with one accuracy value for the vertical component and
another for the horizontal component. If a dataset does not contain elevation data, label for
horizontal accuracy only. Conversely, when a dataset, e.g. a gridded digital elevation dataset or elevation contour dataset, does not contain well-defined points, label for vertical accuracy only.
A dataset may contain themes or geographic areas that have different accuracies. Below are
guidelines for reporting accuracy of a composite dataset:
If data of varying accuracies can be identified separately in a dataset, compute and report
separate accuracy values.
If data of varying accuracies are composited and cannot be separately identified AND the
dataset is tested, report the accuracy value for the composited data.
If a composited dataset is not tested, report the accuracy value for the least accurate dataset
component.
Positional accuracy values shall be reported in ground distances. Metric units shall be used when
the dataset coordinates are in meters. Feet shall be used when the dataset coordinates are in feet.
The number of significant places for the accuracy value shall be equal to the number of significant
places for the dataset point coordinates.
Accuracy reporting in ground distances allows users to directly compare datasets of differing scales
or resolutions. A simple statement of conformance (or omission, when a map or dataset is non-
conforming) is not adequate in itself. Measures based on map characteristics, such as publication
scale or contour interval, are not longer adequate when data can be readily manipulated and output
to any scale or to different data formats.
Report accuracy at the 95% confidence level for data tested for both horizontal and vertical accuracy
as:
Tested ____ (meters, feet) horizontal accuracy at 95% confidence level
____ (meters, feet) vertical accuracy at 95% confidence level
7/29/2019 chapter3 FGDC
http://slidepdf.com/reader/full/chapter3-fgdc 9/28
Federal Geographic Data Committee FGDC-STD-007.3-1998
Geospatial Positioning Accuracy Standards
Part 3: National Standard for Spatial Data Accuracy
3-6
Use the “compiled to meet” statement below when the above guidelines for testing by an independent
source of higher accuracy cannot be followed and an alternative means is used to evaluate accuracy.Report accuracy at the 95% confidence level for data produced according to procedures that have
been demonstrated to produce data with particular horizontal and vertical accuracy values as:
Compiled to meet ____ (meters, feet) horizontal accuracy at 95% confidence level
____ (meters, feet) vertical accuracy at 95% confidence level
Report accuracy for data tested for horizontal accuracy and produced according to procedures that
have been demonstrated to comply with a particular vertical accuracy value as:
Tested ____ (meters, feet) horizontal accuracy at 95% confidence level
Compiled to meet ____ (meters, feet) vertical accuracy at 95% confidence level
Show similar labels when data are tested for vertical accuracy and produced according to proceduresthat have been demonstrated to produce data with a particular horizontal accuracy value.
For digital geospatial data, report the accuracy value in digital geospatial metadata (Federal
Geographic Data Committee, 1998, Section 2), as appropriate to dataset spatial characteristics:
(Data_Quality_Information/Positional_Accuracy/Horizontal_Positional_Accuracy/Horizontal_Po
sitional_Accuracy_Assessment/Horizontal_Positional_Accuracy_Value)
and/or
(Data_Quality_Information/Positional_Accuracy/Vertical_Positional_Accuracy/Vertical_Position
al_Accuracy_Assessment/Vertical_Positional_Accuracy_Value)
Enter the text “National Standard for Spatial Data Accuracy” for these metadata elements (Federal
Geographic Data Committee, 1998, Section 2), as appropriate to dataset spatial characteristics:
(Data_Quality_Information/Positional_Accuracy/Horizontal_Positional_Accuracy/Horizontal_Po
sitional_Accuracy_Assessment/Horizontal_Positional_Accuracy_Explanation)
and/or
(Data_Quality_Information/Positional_Accuracy/Vertical_Positional_Accuracy/Vertical_Position
al_Accuracy_Assessment/Vertical_Positional_Accuracy_Explanation)
Regardless of whether the data was tested by a independent source of higher accuracy or evaluated
for accuracy by alternative means, provide a complete description on how the values were determined
in metadata, as appropriate to dataset spatial characteristics (Federal Geographic Data Committee,
1998, Section 2):
(Data_Quality_Information/Positional_Accuracy/Horizontal_Positional_Accuracy/Horizontal_Po
sitional_Accuracy_Report)
and/or
(Data_Quality_Information/Positional_Accuracy/Vertical_Positional_Accuracy/Vertical_Position
al_Accuracy_Report)
7/29/2019 chapter3 FGDC
http://slidepdf.com/reader/full/chapter3-fgdc 10/28
Federal Geographic Data Committee FGDC-STD-007.3-1998
Geospatial Positioning Accuracy Standards
Part 3: National Standard for Spatial Data Accuracy
3-7
3.3 NSSDA and Other Map Accuracy Standards
Accuracy of new or revised spatial data will be reported according to the NSSDA. Accuracy of
existing or legacy spatial data and maps may be reported, as specified, according to the NSSDA or
the accuracy standard by which they were evaluated. Appendix 3-D describes root mean square
error (RMSE) as applied to individual x-, y- components, former NMAS, and ASPRS Accuracy
Standards for Large-Scale Maps. These standards, their relationships to NSSDA, and accuracy
labeling are described to ensure that users have some means to assess positional accuracy of spatial
data or maps for their applications.
If accuracy reporting cannot be provided using NSSDA or other recognized standards, provide
information to enable users to evaluate how the data fit their applications requirements. This
information may include descriptions of the source material from which the data were compiled,
accuracy of ground surveys associated with compilation, digitizing procedures, equipment, and
quality control procedures used in production.
No matter what method is used to evaluate positional accuracy, explain the accuracy of coordinate
measurements and describe the tests in digital geospatial metadata (Federal Geographic Data
Committee, 1998, Section 2) , as appropriate to dataset spatial characteristics:
(Data_Quality_Information/Positional_Accuracy/Horizontal_Positional_Accuracy/Horizontal_Po
sitional_Accuracy_Report)
and/or
(Data_Quality_Information/Positional_Accuracy/Vertical_Positional_Accuracy/Vertical_Position
al_Accuracy_Report)
Provide information about the source data and processes used to produce the dataset in data elements
of digital geospatial metadata (Federal Geographic Data Committee, 1998, Section 2) under
(Data_Quality_Information/Lineage).

7/29/2019 chapter3 FGDC
http://slidepdf.com/reader/full/chapter3-fgdc 11/28
Federal Geographic Data Committee FGDC-STD-007.3-1998
Geospatial Positioning Accuracy Standards
Part 3: National Standard for Spatial Data Accuracy
3-8
References
American National Standards Institute, Information Technology - Spatial Data Transfer Standard (SDTS)
(ANSI-NCITS 320:1998): New York, New York.
American Society for Photogrammetry and Remote Sensing (ASPRS) Specifications and Standards
Committee, 1990, ASPRS Accuracy Standards for Large-Scale Maps: Photogrammetric Engineering
and Remote Sensing, v. 56, no. 7, p. 1068-1070.
Clinton, William J., 1994, Executive Order 12906, Coordinating Geographic Data Acquisition and Access:
The National Spatial Data Infrastructure: Washington, DC, Federal Register, Volume 59, Number
71, pp. 17671-17674.
Facilities Working Group, 1997, Part 4, Draft Standards for Architecture, Engineering, Construction (A/E/C)
and Facility Management, Geospatial Positioning Accuracy Standards: Washington, DC, U.S. ArmyCorps of Engineers, 21 p.
Federal Geodetic Control Committee, 1984, Standards and Specifications for Geodetic Control Networks:
Silver Spring, Md., National Geodetic Survey, National Oceanic and Atmospheric Administration,
29 p.
Federal Geographic Data Committee, 1998, Content Standards for Digital Geospatial Metadata (version 2.0),
FGDC-STD-001-1998: Washington, D.C., Federal Geographic Data Committee, 66 p.
Federal Geographic Data Committee, 1998, Part 2, Standards for Geodetic Networks, Geospatial Positioning
Accuracy Standards, FGDC-STD-007.2-1998: Washington, D.C., Federal Geographic Data
Committee, 9 p.
Federal Geographic Data Committee, 1996, FGDC Standards Reference Model: Reston, Va., Federal
Geographic Data Committee, 24 p.
Greenwalt, C.R. and M.E. Schultz, 1968, Principles and Error Theory and Cartographic Applications,
ACIC Technical Report No. 96: St. Louis, Mo., Aeronautical Chart and Information Center, U.S.
Air Force, 89 p.
National Mapping Division, 1987, Procedure Manual for Map Accuracy Testing (draft ): U.S. Geological
Survey, Reston, Va.
U.S. Bureau of the Budget, 1947, United States National Map Accuracy Standards: U.S. Bureau of the Budget,
Washington, D.C.
7/29/2019 chapter3 FGDC
http://slidepdf.com/reader/full/chapter3-fgdc 12/28
Federal Geographic Data Committee FGDC-STD-007.3-1998
Geospatial Positioning Accuracy Standards
Part 3: National Standard for Spatial Data Accuracy
Appendix 3-A (normative): Accuracy Statistics
3-9
Appendix 3-A.
Accuracy Statistics
(normative)
7/29/2019 chapter3 FGDC
http://slidepdf.com/reader/full/chapter3-fgdc 13/28
Federal Geographic Data Committee FGDC-STD-007.3-1998
Geospatial Positioning Accuracy Standards
Part 3: National Standard for Spatial Data Accuracy
Appendix 3-A (normative): Accuracy Statistics
3-10
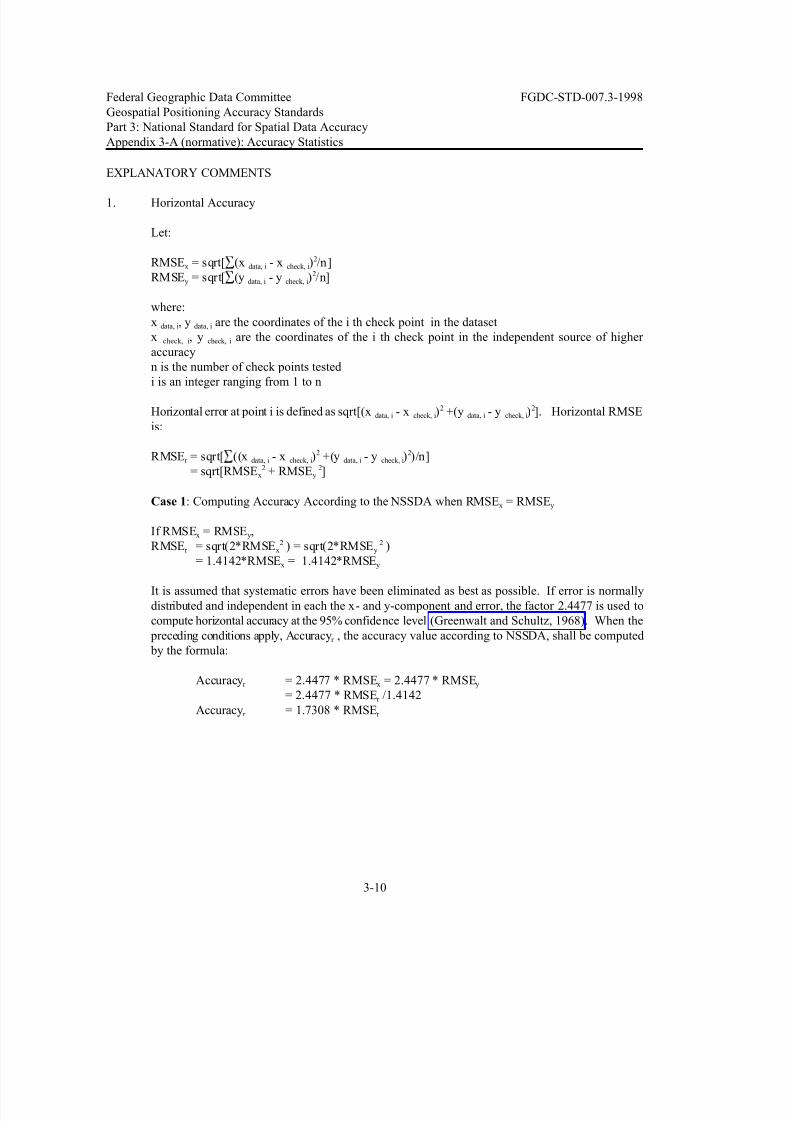
EXPLANATORY COMMENTS
1. Horizontal Accuracy
Let:
RMSE = sqrt[ (x - x ) /n]x data, i check, i2
RMSE = sqrt[ (y - y ) /n]y data, i check, i2
where:
x , y are the coordinates of the i th check point in the datasetdata, i data, i
x , y are the coordinates of the i th check point in the independent source of higher check, i check, i
accuracy
n is the number of check points tested
i is an integer ranging from 1 to n
Horizontal error at point i is defined as sqrt[(x - x ) +(y - y ) ]. Horizontal RMSEdata, i check, i data, i check, i2 2
is:
RMSE = sqrt[ ((x - x ) +(y - y ) )/n]r data, i check, i data, i check, i2 2
= sqrt[RMSE + RMSE ]x y2 2
Case 1: Computing Accuracy According to the NSSDA when RMSE = RMSEx y
If RMSE = RMSE ,x y
RMSE = sqrt(2*RMSE ) = sqrt(2*RMSE )r x y2 2
= 1.4142*RMSE = 1.4142*RMSEx y
It is assumed that systematic errors have been eliminated as best as possible. If error is normally
distributed and independent in each the x- and y-component and error, the factor 2.4477 is used to
compute horizontal accuracy at the 95% confidence level (Greenwalt and Schultz, 1968). When the
preceding conditions apply, Accuracy , the accuracy value according to NSSDA, shall be computedr
by the formula:
Accuracy = 2.4477 * RMSE = 2.4477 * RMSEr x y
= 2.4477 * RMSE /1.4142r
Accuracy = 1.7308 * RMSEr r
7/29/2019 chapter3 FGDC
http://slidepdf.com/reader/full/chapter3-fgdc 14/28
Federal Geographic Data Committee FGDC-STD-007.3-1998
Geospatial Positioning Accuracy Standards
Part 3: National Standard for Spatial Data Accuracy
Appendix 3-A (normative): Accuracy Statistics
3-11
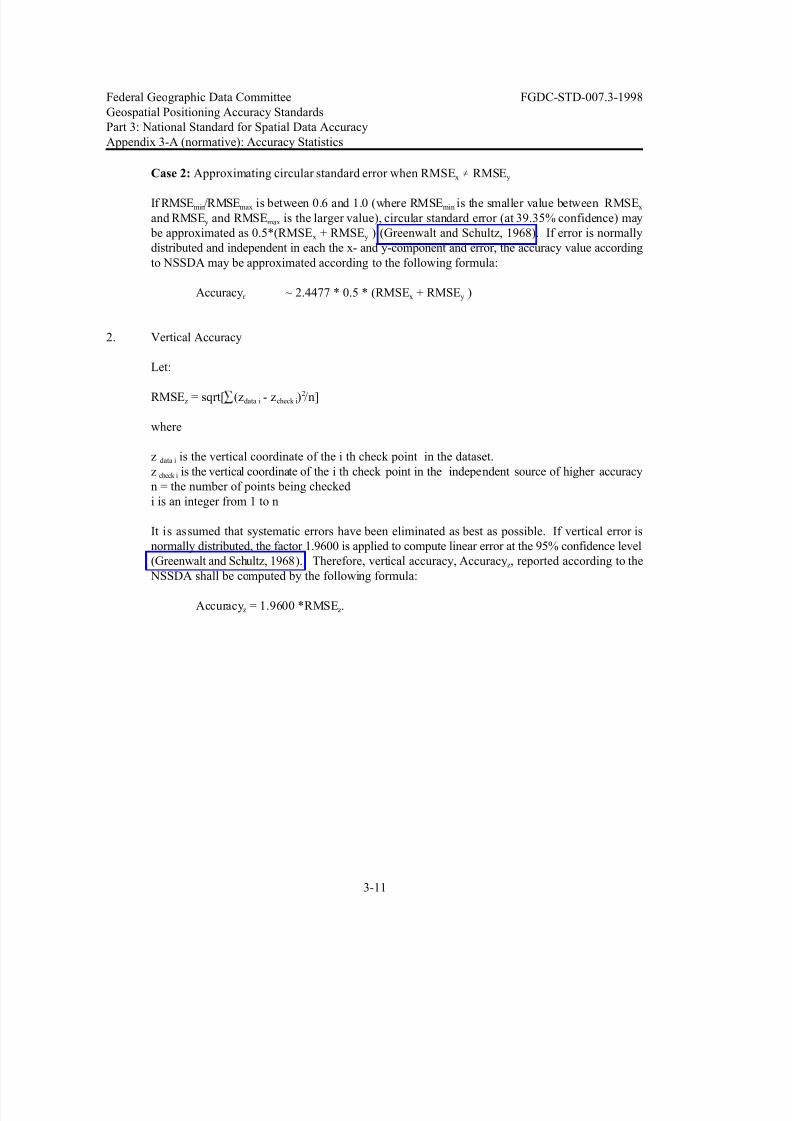
Case 2: Approximating circular standard error when RMSE RMSEx y
If RMSE /RMSE is between 0.6 and 1.0 (where RMSE is the smaller value between RMSEmin max min x
and RMSE and RMSE is the larger value), circular standard error (at 39.35% confidence) mayy max
be approximated as 0.5*(RMSE + RMSE ) (Greenwalt and Schultz, 1968). If error is normallyx y
distributed and independent in each the x- and y-component and error, the accuracy value according
to NSSDA may be approximated according to the following formula:
Accuracy ~ 2.4477 * 0.5 * (RMSE + RMSE )r x y
2. Vertical Accuracy
Let:
RMSE = sqrt[ (z - z ) /n]z data i check i2
where
z is the vertical coordinate of the i th check point in the dataset.data i
z is the vertical coordinate of the i th check point in the independent source of higher accuracycheck i
n = the number of points being checked
i is an integer from 1 to n
It is assumed that systematic errors have been eliminated as best as possible. If vertical error is
normally distributed, the factor 1.9600 is applied to compute linear error at the 95% confidence level
(Greenwalt and Schultz, 1968). Therefore, vertical accuracy, Accuracy , reported according to thez
NSSDA shall be computed by the following formula:
Accuracy = 1.9600 *RMSE .z z
7/29/2019 chapter3 FGDC
http://slidepdf.com/reader/full/chapter3-fgdc 15/28
Federal Geographic Data Committee FGDC-STD-007.3-1998
Geospatial Positioning Accuracy Standards
Part 3: National Standard for Spatial Data Accuracy
Appendix 3-B (informative): Horizontal Accuracy Computations
3-12
Appendix 3-B
Horizontal Accuracy Computations
(informative)
7/29/2019 chapter3 FGDC
http://slidepdf.com/reader/full/chapter3-fgdc 16/28
Federal Geographic Data Committee FGDC-STD-007.3-1998
Geospatial Positioning Accuracy Standards
Part 3: National Standard for Spatial Data Accuracy
Appendix 3-B (informative): Horizontal Accuracy Computations
3-13
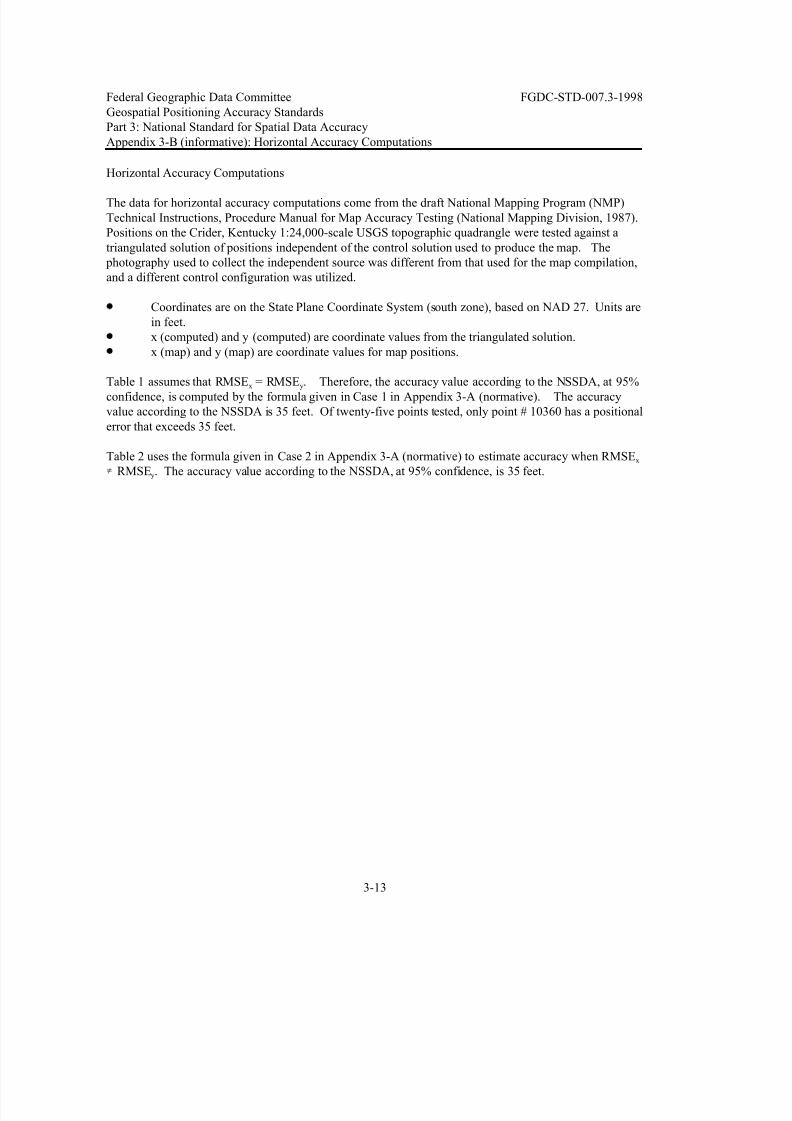
Horizontal Accuracy Computations
The data for horizontal accuracy computations come from the draft National Mapping Program (NMP)
Technical Instructions, Procedure Manual for Map Accuracy Testing (National Mapping Division, 1987).
Positions on the Crider, Kentucky 1:24,000-scale USGS topographic quadrangle were tested against a
triangulated solution of positions independent of the control solution used to produce the map. The
photography used to collect the independent source was different from that used for the map compilation,
and a different control configuration was utilized.
Coordinates are on the State Plane Coordinate System (south zone), based on NAD 27. Units are
in feet.
x (computed) and y (computed) are coordinate values from the triangulated solution.
x (map) and y (map) are coordinate values for map positions.
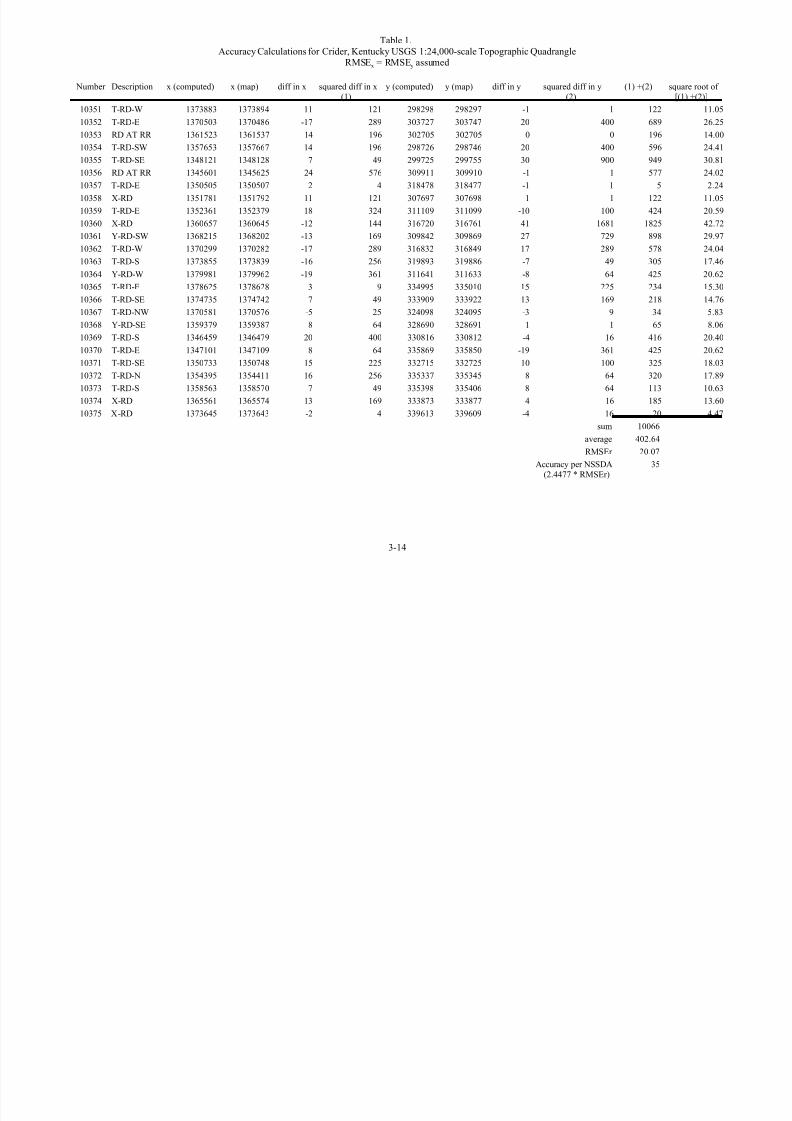
Table 1 assumes that RMSE = RMSE . Therefore, the accuracy value according to the NSSDA, at 95%x y
confidence, is computed by the formula given in Case 1 in Appendix 3-A (normative). The accuracy
value according to the NSSDA is 35 feet. Of twenty-five points tested, only point # 10360 has a positional
error that exceeds 35 feet.
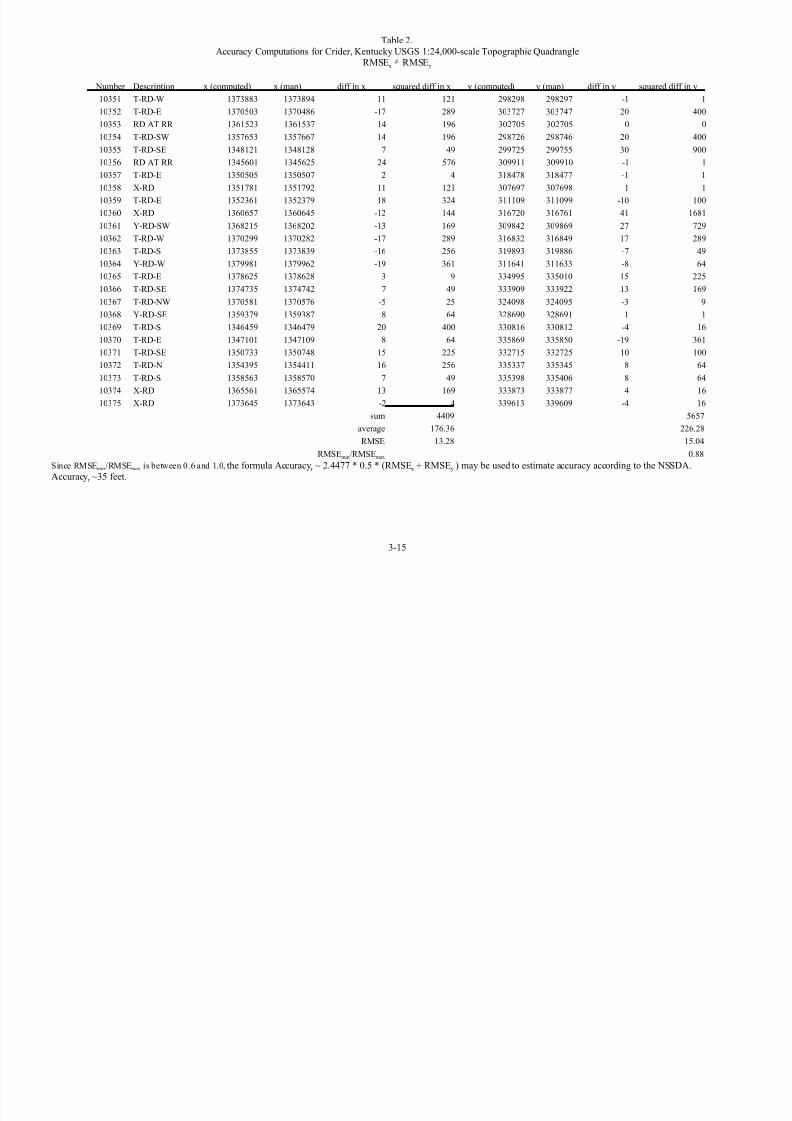
Table 2 uses the formula given in Case 2 in Appendix 3-A (normative) to estimate accuracy when RMSEx
RMSE . The accuracy value according to the NSSDA, at 95% confidence, is 35 feet.y
7/29/2019 chapter3 FGDC
http://slidepdf.com/reader/full/chapter3-fgdc 17/28
3-14
Table 1.Accuracy Calculations for Crider, Kentucky USGS 1:24,000-scale Topographic Quadrangle
RMSE = RMSE assumedx y
Number Description x (computed) x (map) diff in x squared diff in x y (computed) y (map) diff in y squared diff in y (1) +(2) square root of
(1) (2) [(1) +(2)]
10351 T-RD-W 1373883 1373894 11 121 298298 298297 -1 1 122 11.05
10352 T-RD-E 1370503 1370486 -17 289 303727 303747 20 400 689 26.25
10353 RD AT RR 1361523 1361537 14 196 302705 302705 0 0 196 14.00
10354 T-RD-SW 1357653 1357667 14 196 298726 298746 20 400 596 24.41
10355 T-RD-SE 1348121 1348128 7 49 299725 299755 30 900 949 30.81
10356 RD AT RR 1345601 1345625 24 576 309911 309910 -1 1 577 24.02
10357 T-RD-E 1350505 1350507 2 4 318478 318477 -1 1 5 2.2410358 X-RD 1351781 1351792 11 121 307697 307698 1 1 122 11.05
10359 T-RD-E 1352361 1352379 18 324 311109 311099 -10 100 424 20.59
10360 X-RD 1360657 1360645 -12 144 316720 316761 41 1681 1825 42.72
10361 Y-RD-SW 1368215 1368202 -13 169 309842 309869 27 729 898 29.97
10362 T-RD-W 1370299 1370282 -17 289 316832 316849 17 289 578 24.04
10363 T-RD-S 1373855 1373839 -16 256 319893 319886 -7 49 305 17.46
10364 Y-RD-W 1379981 1379962 -19 361 311641 311633 -8 64 425 20.62
10365 T-RD-E 1378625 1378628 3 9 334995 335010 15 225 234 15.30
10366 T-RD-SE 1374735 1374742 7 49 333909 333922 13 169 218 14.76
10367 T-RD-NW 1370581 1370576 -5 25 324098 324095 -3 9 34 5.83
10368 Y-RD-SE 1359379 1359387 8 64 328690 328691 1 1 65 8.06
10369 T-RD-S 1346459 1346479 20 400 330816 330812 -4 16 416 20.40
10370 T-RD-E 1347101 1347109 8 64 335869 335850 -19 361 425 20.62
10371 T-RD-SE 1350733 1350748 15 225 332715 332725 10 100 325 18.03
10372 T-RD-N 1354395 1354411 16 256 335337 335345 8 64 320 17.8910373 T-RD-S 1358563 1358570 7 49 335398 335406 8 64 113 10.63
10374 X-RD 1365561 1365574 13 169 333873 333877 4 16 185 13.60
10375 X-RD 1373645 1373643 -2 4 339613 339609 -4 16 20 4.47
sum 10066
average 402.64
RMSEr 20.07
Accuracy per NSSDA 35
(2.4477 * RMSEr)
7/29/2019 chapter3 FGDC
http://slidepdf.com/reader/full/chapter3-fgdc 18/28
3-15
Table 2.Accuracy Computations for Crider, Kentucky USGS 1:24,000-scale Topographic Quadrangle
RMSE RMSEx y
Number Description x (computed) x (map) diff in x squared diff in x y (computed) y (map) diff in y squared diff in y
10351 T-RD-W 1373883 1373894 11 121 298298 298297 -1 1
10352 T-RD-E 1370503 1370486 -17 289 303727 303747 20 400
10353 RD AT RR 1361523 1361537 14 196 302705 302705 0 0
10354 T-RD-SW 1357653 1357667 14 196 298726 298746 20 400
10355 T-RD-SE 1348121 1348128 7 49 299725 299755 30 900
10356 RD AT RR 1345601 1345625 24 576 309911 309910 -1 1
10357 T-RD-E 1350505 1350507 2 4 318478 318477 -1 1
10358 X-RD 1351781 1351792 11 121 307697 307698 1 110359 T-RD-E 1352361 1352379 18 324 311109 311099 -10 100
10360 X-RD 1360657 1360645 -12 144 316720 316761 41 1681
10361 Y-RD-SW 1368215 1368202 -13 169 309842 309869 27 729
10362 T-RD-W 1370299 1370282 -17 289 316832 316849 17 289
10363 T-RD-S 1373855 1373839 -16 256 319893 319886 -7 49
10364 Y-RD-W 1379981 1379962 -19 361 311641 311633 -8 64
10365 T-RD-E 1378625 1378628 3 9 334995 335010 15 225
10366 T-RD-SE 1374735 1374742 7 49 333909 333922 13 169
10367 T-RD-NW 1370581 1370576 -5 25 324098 324095 -3 9
10368 Y-RD-SE 1359379 1359387 8 64 328690 328691 1 1
10369 T-RD-S 1346459 1346479 20 400 330816 330812 -4 16
10370 T-RD-E 1347101 1347109 8 64 335869 335850 -19 361
10371 T-RD-SE 1350733 1350748 15 225 332715 332725 10 100
10372 T-RD-N 1354395 1354411 16 256 335337 335345 8 64
10373 T-RD-S 1358563 1358570 7 49 335398 335406 8 6410374 X-RD 1365561 1365574 13 169 333873 333877 4 16
10375 X-RD 1373645 1373643 -2 4 339613 339609 -4 16
sum 4409 5657
average 176.36 226.28
RMSE 13.28 15.04
RMSE /RMSE 0.88min max
Since RMSE /RMSE is between 0.6 and 1.0, the formula Accuracy ~ 2.4477 * 0.5 * (RMSE + RMSE ) may be used to estimate accuracy according to the NSSDA.min max r x y
Accuracy ~35 feet.r
7/29/2019 chapter3 FGDC
http://slidepdf.com/reader/full/chapter3-fgdc 19/28
Federal Geographic Data Committee FGDC-STD-007.3-1998
Geospatial Positioning Accuracy Standards
Part 3: National Standard for Spatial Data Accuracy
Appendix 3-C (informative): Testing guidelines
3-16
Appendix 3-C.
Testing guidelines
(informative)
7/29/2019 chapter3 FGDC
http://slidepdf.com/reader/full/chapter3-fgdc 20/28
Federal Geographic Data Committee FGDC-STD-007.3-1998
Geospatial Positioning Accuracy Standards
Part 3: National Standard for Spatial Data Accuracy
Appendix 3-C (informative): Testing guidelines
3-17
1. Well-Defined Points
A well-defined point represents a feature for which the horizontal position is known to a high
degree of accuracy and position with respect to the geodetic datum. For the purpose of accuracy
testing, well-defined points must be easily visible or recoverable on the ground, on the
independent source of higher accuracy, and on the product itself. Graphic contour data and
digital hypsographic data may not contain well-defined points.
The selected points will differ depending on the type of dataset and output scale of the dataset.
For graphic maps and vector data, suitable well-defined points represent right-angle intersections
of roads, railroads, or other linear mapped features, such as canals, ditches, trails, fence lines,
and pipelines. For orthoimagery, suitable well-defined points may represent features such as
small isolated shrubs or bushes, in addition to right-angle intersections of linear features. For
map products at scales of 1:5,000 or larger, such as engineering plats or property maps, suitable
well-defined points may represent additional features such as utility access covers andintersections of sidewalks, curbs, or gutters.
2. Data acquisition for the independent source of higher accuracy
The independent source of higher accuracy shall be acquired separately from data used in the
aerotriangulation solution or other production procedures. The independent source of higher
accuracy shall be of the highest accuracy feasible and practicable to evaluate the accuracy of the
dataset.
Although guidelines given here are for geodetic ground surveys, the geodetic survey is only one
of many possible ways to acquire data for the independent source of higher accuracy. Geodetic
control surveys are designed and executed using field specifications for geodetic control surveys
(Federal Geodetic Control Committee, 1984). Accuracy of geodetic control surveys is evaluated
using Part 2, Standards for Geodetic Networks (Federal Geographic Data Committee, 1998). To
evaluate if the accuracy of geodetic survey is sufficiently greater than the positional accuracy
value given in the product specification, compare the FGCS network accuracy reported for the
geodetic survey with the accuracy value given by the product specification for the dataset.
Other possible sources for higher accuracy information are Global Positioning System (GPS)
ground surveys, photogrammetric methods, and data bases of high accuracy point coordinates.
3. Check Point Location
Due to the diversity of user requirements for digital geospatial data and maps, it is not realistic to
include statements in this standard that specify the spatial distribution of check points. Dataand/or map producers must determine check point locations. This section provides guidelines for
distributing the check point locations.
Check points may be distributed more densely in the vicinity of important features and more
sparsely in areas that are of little or no interest. When data exist for only a portion of the dataset,
confine test points to that area. When the distribution of error is likely to be nonrandom, it may

7/29/2019 chapter3 FGDC
http://slidepdf.com/reader/full/chapter3-fgdc 21/28
Federal Geographic Data Committee FGDC-STD-007.3-1998
Geospatial Positioning Accuracy Standards
Part 3: National Standard for Spatial Data Accuracy
Appendix 3-C (informative): Testing guidelines
3-18
be desirable to locate check points to correspond to the error distribution.
For a dataset covering a rectangular area that is believed to have uniform positional accuracy,
check points may be distributed so that points are spaced at intervals of at least 10 percent of the
diagonal distance across the dataset and at least 20 percent of the points are located in each
quadrant of the dataset.

7/29/2019 chapter3 FGDC
http://slidepdf.com/reader/full/chapter3-fgdc 22/28
Federal Geographic Data Committee FGDC-STD-007.3-1998
Geospatial Positioning Accuracy Standards
Part 3: National Standard for Spatial Data Accuracy
Appendix 3-D (informative): Other Accuracy Standards
3-19
Appendix 3-D.
Other Accuracy Standards
(informative)
7/29/2019 chapter3 FGDC
http://slidepdf.com/reader/full/chapter3-fgdc 23/28
Federal Geographic Data Committee FGDC-STD-007.3-1998
Geospatial Positioning Accuracy Standards
Part 3: National Standard for Spatial Data Accuracy
Appendix 3-D (informative): Other Accuracy Standards
3-20
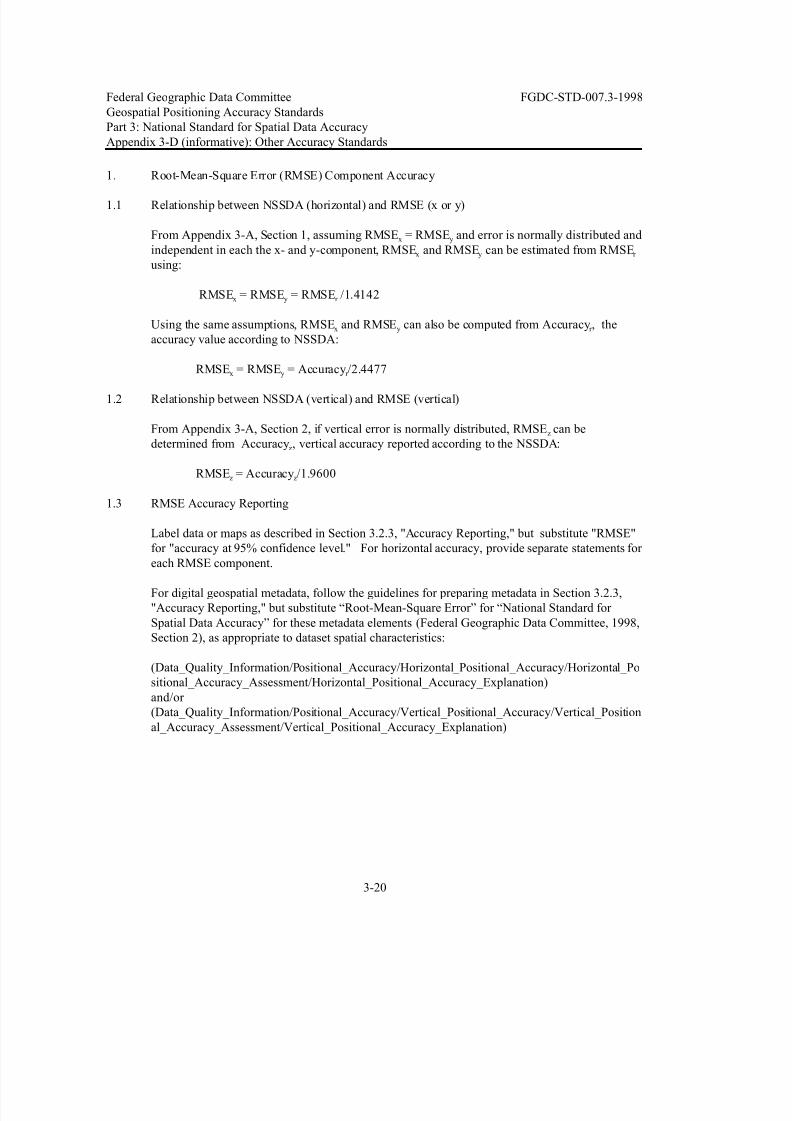
1. Root-Mean-Square Error (RMSE) Component Accuracy
1.1 Relationship between NSSDA (horizontal) and RMSE (x or y)
From Appendix 3-A, Section 1, assuming RMSE = RMSE and error is normally distributed andx y
independent in each the x- and y-component, RMSE and RMSE can be estimated from RMSEx y r
using:
RMSE = RMSE = RMSE /1.4142x y r
Using the same assumptions, RMSE and RMSE can also be computed from Accuracy, thex y r
accuracy value according to NSSDA:
RMSE = RMSE = Accuracy /2.4477x y r
1.2 Relationship between NSSDA (vertical) and RMSE (vertical)
From Appendix 3-A, Section 2, if vertical error is normally distributed, RMSE can bez
determined from Accuracy , vertical accuracy reported according to the NSSDA:z
RMSE = Accuracy /1.9600z z
1.3 RMSE Accuracy Reporting
Label data or maps as described in Section 3.2.3, "Accuracy Reporting," but substitute "RMSE"
for "accuracy at 95% confidence level." For horizontal accuracy, provide separate statements for
each RMSE component.
For digital geospatial metadata, follow the guidelines for preparing metadata in Section 3.2.3,
"Accuracy Reporting," but substitute “Root-Mean-Square Error” for “National Standard for
Spatial Data Accuracy” for these metadata elements (Federal Geographic Data Committee, 1998,
Section 2), as appropriate to dataset spatial characteristics:
(Data_Quality_Information/Positional_Accuracy/Horizontal_Positional_Accuracy/Horizontal_Po
sitional_Accuracy_Assessment/Horizontal_Positional_Accuracy_Explanation)
and/or
(Data_Quality_Information/Positional_Accuracy/Vertical_Positional_Accuracy/Vertical_Position
al_Accuracy_Assessment/Vertical_Positional_Accuracy_Explanation)
7/29/2019 chapter3 FGDC
http://slidepdf.com/reader/full/chapter3-fgdc 24/28
Federal Geographic Data Committee FGDC-STD-007.3-1998
Geospatial Positioning Accuracy Standards
Part 3: National Standard for Spatial Data Accuracy
Appendix 3-D (informative): Other Accuracy Standards
3-21
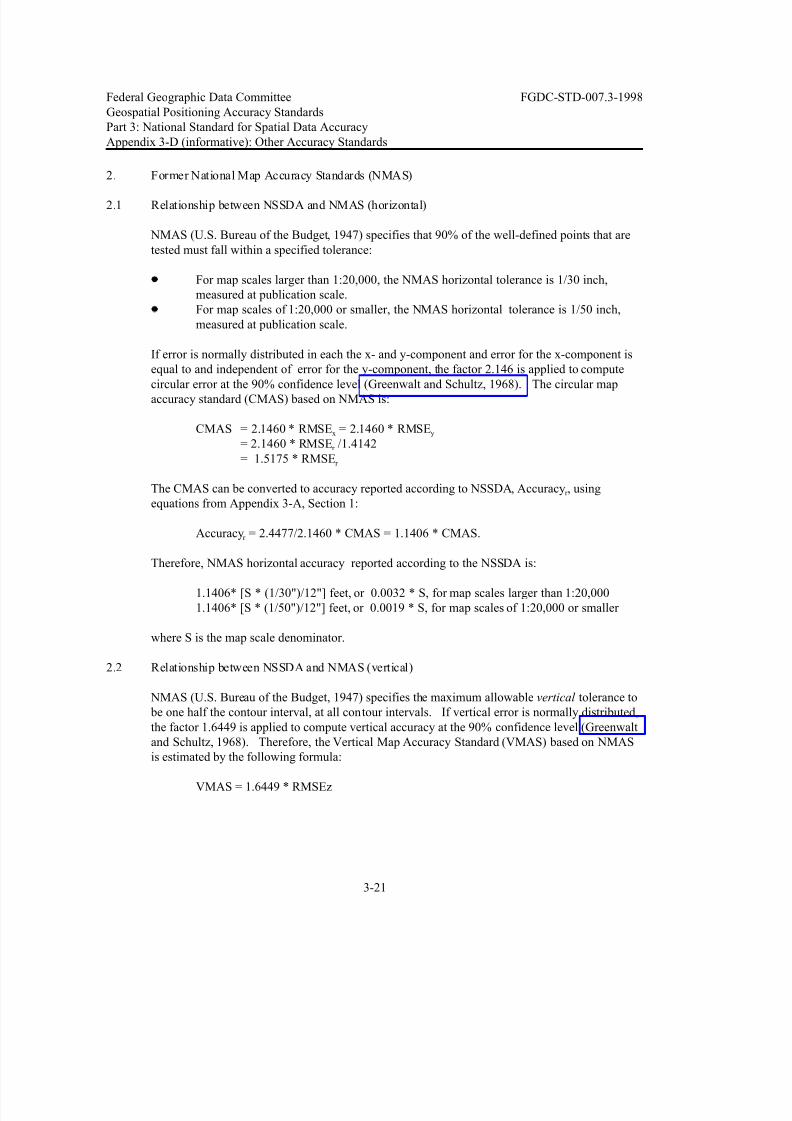
2. Former National Map Accuracy Standards (NMAS)
2.1 Relationship between NSSDA and NMAS (horizontal)
NMAS (U.S. Bureau of the Budget, 1947) specifies that 90% of the well-defined points that are
tested must fall within a specified tolerance:
For map scales larger than 1:20,000, the NMAS horizontal tolerance is 1/30 inch,
measured at publication scale.
For map scales of 1:20,000 or smaller, the NMAS horizontal tolerance is 1/50 inch,
measured at publication scale.
If error is normally distributed in each the x- and y-component and error for the x-component is
equal to and independent of error for the y-component, the factor 2.146 is applied to compute
circular error at the 90% confidence level (Greenwalt and Schultz, 1968). The circular map
accuracy standard (CMAS) based on NMAS is:
CMAS = 2.1460 * RMSE = 2.1460 * RMSEx y
= 2.1460 * RMSE /1.4142r
= 1.5175 * RMSEr
The CMAS can be converted to accuracy reported according to NSSDA, Accuracy , usingr
equations from Appendix 3-A, Section 1:
Accuracy = 2.4477/2.1460 * CMAS = 1.1406 * CMAS.r
Therefore, NMAS horizontal accuracy reported according to the NSSDA is:
1.1406* [S * (1/30")/12"] feet, or 0.0032 * S, for map scales larger than 1:20,000
1.1406* [S * (1/50")/12"] feet, or 0.0019 * S, for map scales of 1:20,000 or smaller
where S is the map scale denominator.
2.2 Relationship between NSSDA and NMAS (vertical)
NMAS (U.S. Bureau of the Budget, 1947) specifies the maximum allowable vertical tolerance to
be one half the contour interval, at all contour intervals. If vertical error is normally distributed,
the factor 1.6449 is applied to compute vertical accuracy at the 90% confidence level (Greenwalt
and Schultz, 1968). Therefore, the Vertical Map Accuracy Standard (VMAS) based on NMAS
is estimated by the following formula:
VMAS = 1.6449 * RMSEz
7/29/2019 chapter3 FGDC
http://slidepdf.com/reader/full/chapter3-fgdc 25/28
Federal Geographic Data Committee FGDC-STD-007.3-1998
Geospatial Positioning Accuracy Standards
Part 3: National Standard for Spatial Data Accuracy
Appendix 3-D (informative): Other Accuracy Standards
3-22
The VMAS can be converted to Accuracy , accuracy reported according to the NSSDA usingz
equations from Appendix 3-A, Section 2:
Accuracy = 1.9600/1.6449 * VMAS = 1.1916 * VMAS.z
Therefore, vertical accuracy reported according to the NSSDA is (1.1916)/2 * CI = 0.5958 * CI,
where CI is the contour interval.
2.3 NMAS Reporting
Map labels provide a statement of conformance with NMAS, rather than reporting the accuracy
value. Label maps, as appropriate to dataset spatial characteristics:
This map complies with National Map Accuracy Standards of 1947 for horizontal
accuracy
OR
This map complies with National Map Accuracy Standards of 1947 for vertical
accuracy
OR
This map complies with National Map Accuracy Standards of 1947 for horizontal and
vertical accuracy
For digital geospatial data evaluated by the NMAS, follow the guidelines for preparing metadata
in Section 3.2.3, "Accuracy Reporting," but substitute “U.S. National Map Accuracy Standards of
1947" for “National Standard for Spatial Data Accuracy” for these metadata elements (Federal
Geographic Data Committee, 1998, Section 2), as appropriate to dataset spatial characteristics:
(Data_Quality_Information/Positional_Accuracy/Horizontal_Positional_Accuracy/Horizontal_Po
sitional_Accuracy_Assessment/Horizontal_Positional_Accuracy_Explanation)
and/or
(Data_Quality_Information/Positional_Accuracy/Vertical_Positional_Accuracy/Vertical_Position
al_Accuracy_Assessment/Vertical_Positional_Accuracy_Explanation)
3. American Society for Photogrammetry and Remote Sensing (ASPRS) Accuracy Standards for
Large-Scale Maps
3.1 Explanation of ASPRS Accuracy Standards for Large-Scale Maps
ASPRS Accuracy Standards for Large-Scale Maps (ASPRS Specifications and Standards
Committee, 1990) provide accuracy tolerances for maps at 1:20,000-scale or larger “prepared for
special purposes or engineering applications.” RMSE is the statistic used by the ASPRS
standards. Accuracy is reported as Class 1, Class 2, or Class 3. Class 1 accuracy for horizontal
and vertical components is discussed below. Class 2 accuracy applies to maps compiled within
limiting RMSE’s twice those allowed for Class 1 maps. Similarly, Class 3 accuracy applies to
7/29/2019 chapter3 FGDC
http://slidepdf.com/reader/full/chapter3-fgdc 26/28
Federal Geographic Data Committee FGDC-STD-007.3-1998
Geospatial Positioning Accuracy Standards
Part 3: National Standard for Spatial Data Accuracy
Appendix 3-D (informative): Other Accuracy Standards
3-23
maps compiled within limiting RMSE’s three times those allowed for Class 1 maps.
3.2 Relationship between NSSDA and ASPRS Accuracy Standards for Large-Scale Maps
(horizontal)
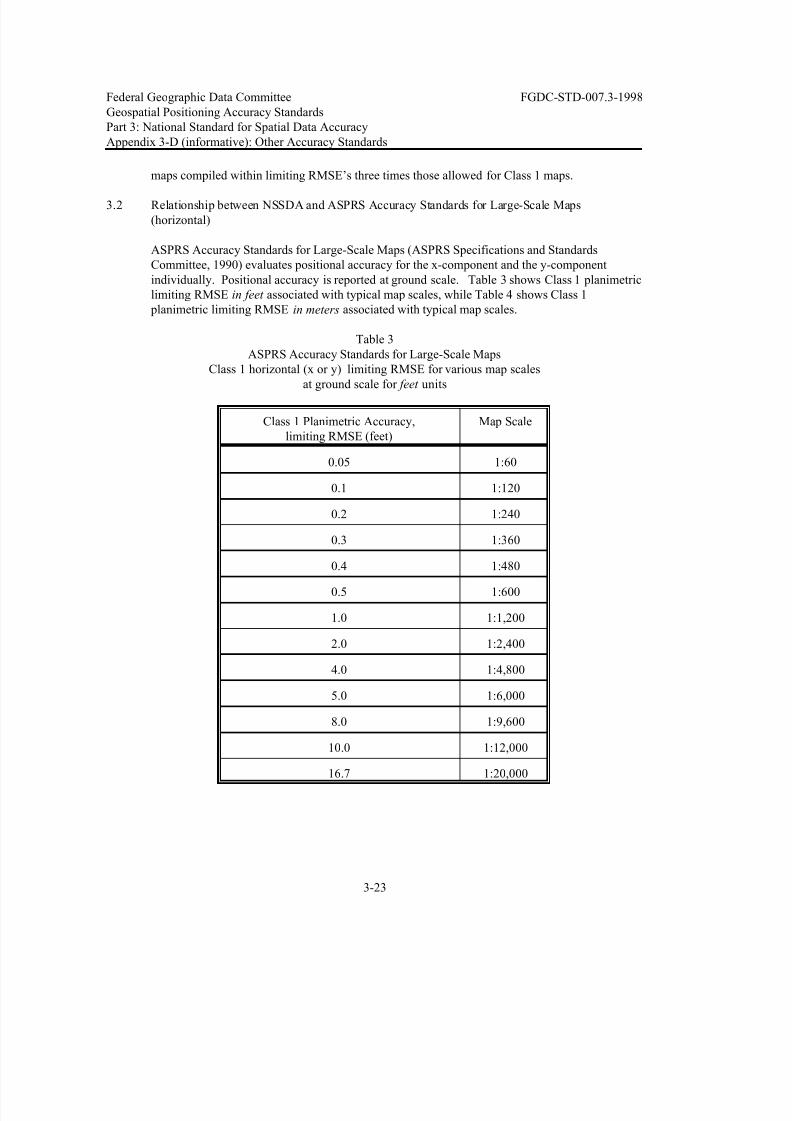
ASPRS Accuracy Standards for Large-Scale Maps (ASPRS Specifications and Standards
Committee, 1990) evaluates positional accuracy for the x-component and the y-component
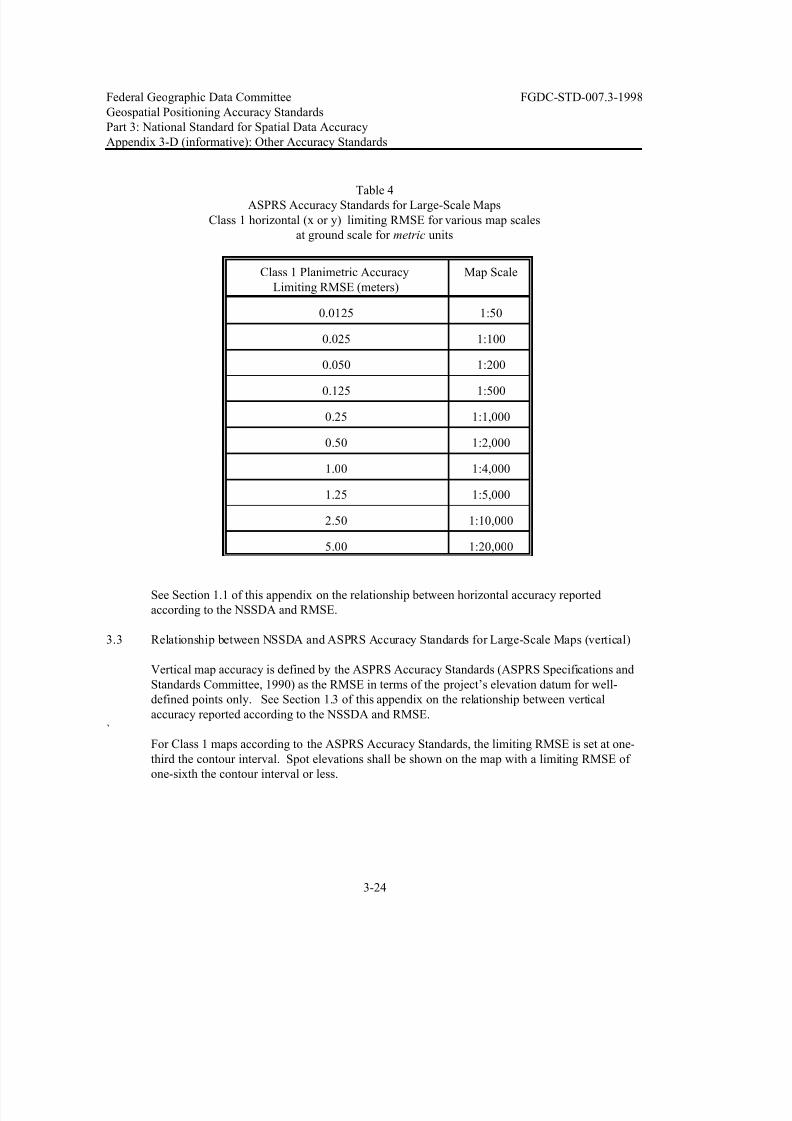
individually. Positional accuracy is reported at ground scale. Table 3 shows Class 1 planimetric
limiting RMSE in feet associated with typical map scales, while Table 4 shows Class 1
planimetric limiting RMSE in meters associated with typical map scales.
Table 3
ASPRS Accuracy Standards for Large-Scale Maps
Class 1 horizontal (x or y) limiting RMSE for various map scales
at ground scale for feet units
Class 1 Planimetric Accuracy, Map Scale
limiting RMSE (feet)
0.05 1:60
0.1 1:120
0.2 1:240
0.3 1:360
0.4 1:480
0.5 1:600
1.0 1:1,200
2.0 1:2,400
4.0 1:4,800
5.0 1:6,000
8.0 1:9,600
10.0 1:12,000
16.7 1:20,000
7/29/2019 chapter3 FGDC
http://slidepdf.com/reader/full/chapter3-fgdc 27/28
Federal Geographic Data Committee FGDC-STD-007.3-1998
Geospatial Positioning Accuracy Standards
Part 3: National Standard for Spatial Data Accuracy
Appendix 3-D (informative): Other Accuracy Standards
3-24
Table 4ASPRS Accuracy Standards for Large-Scale Maps
Class 1 horizontal (x or y) limiting RMSE for various map scales
at ground scale for metric units
Class 1 Planimetric Accuracy Map Scale
Limiting RMSE (meters)
0.0125 1:50
0.025 1:100
0.050 1:200
0.125 1:500
0.25 1:1,000
0.50 1:2,000
1.00 1:4,000
1.25 1:5,000
2.50 1:10,000
5.00 1:20,000
See Section 1.1 of this appendix on the relationship between horizontal accuracy reported
according to the NSSDA and RMSE.
3.3 Relationship between NSSDA and ASPRS Accuracy Standards for Large-Scale Maps (vertical)
Vertical map accuracy is defined by the ASPRS Accuracy Standards (ASPRS Specifications and
Standards Committee, 1990) as the RMSE in terms of the project’s elevation datum for well-
defined points only. See Section 1.3 of this appendix on the relationship between vertical
accuracy reported according to the NSSDA and RMSE.
`
For Class 1 maps according to the ASPRS Accuracy Standards, the limiting RMSE is set at one-
third the contour interval. Spot elevations shall be shown on the map with a limiting RMSE of one-sixth the contour interval or less.
7/29/2019 chapter3 FGDC
http://slidepdf.com/reader/full/chapter3-fgdc 28/28
Federal Geographic Data Committee FGDC-STD-007.3-1998
Geospatial Positioning Accuracy Standards
Part 3: National Standard for Spatial Data Accuracy
Appendix 3-D (informative): Other Accuracy Standards
3-25
3.4 ASPRS Accuracy Standards for Large-Scale Maps Reporting
Maps evaluated according to ASPRS Accuracy Standards for Large-Scale Maps are labeled by a
conformance statement, rather than a numeric accuracy value.
Label maps produced according to this standard:
THIS MAP WAS COMPILED TO MEET THE ASPRS
STANDARD FOR CLASS (1., 2., 3.) MAP ACCURACY
Label maps checked and found to confirm to this standard:
THIS MAP WAS CHECKED AND FOUND TO CONFORM
TO THE ASPRS
STANDARD FOR CLASS (1., 2., 3.) MAP ACCURACY