chapter v job satisfaction analysis: a comparative study ... · job satisfaction analysis: a...
TRANSCRIPT
221
CHAPTER V
Job Satisfaction Analysis: A Comparative Study of SBI and ICICI Banks
5.1 Introduction
Job satisfaction is a key instrument to gauge the organizational health as service quality largely
depends upon the human resources Saker et al (2003). Job Satisfaction is the buzz word in
today’s corporate era. Since the transformation of personnel into HR, and its inception in the
industry new concepts related to human capital has been emerging day by day. A decade ago this
concept was not practiced or applied and the employees were very loyal to their organizations
and used to start and end their career in the same organizations. Apart from the bread and butter
the organization used to act as their sanctuary and no one was much concerned about the job
itself or job satisfaction. Over the period of time employees have witnessed several eras in
modern business history and the concept of treating humans as assets of the organization has
flourished and has done wonders around the world in terms of growth of companies.
The concept of job satisfaction has several factors contributing to it which are monetary and
non-monetary. Job satisfaction is the favorableness or un-favorableness with which employees
view their work and it is affected by both the internal and external environment of the
organization. Job design affect the job satisfaction, as jobs that are rich in behavioral elements
such as variety autonomy, task importance and feedback contribute to employee’s satisfaction.
Similarly the employee’s acceptance by the work group is important to job satisfaction. To sum
up each element of the organization environment and system can contribute to or detract from
job satisfaction William & Keith (2000).
Locke (1976) defined job satisfaction as “a pleasurable or positive emotional state, resulting
from the appraisal of one’s job experiences.” In general, therefore, job satisfaction refers to an
individual’s positive emotional reactions to a particular job. It is an affective reaction to a job
that results from the person’s comparison of actual outcomes with those that are desired,
anticipated, or deserved Opkara (2002). Job satisfaction has significance towards human health
both physical and mental and is positively or negatively correlated. Employees spend a major
222
part of their lives at the workplace hence the factors related to job satisfaction and employee
behavior and their implication are important to measure Oshagbemi (1999).
Job satisfaction is an attitude of an employee over a period of his/her job so the factors of job
satisfaction and dissatisfaction changes over the period of time. However, in today's business
climate of continuous changes and uncertainty, the importance of job satisfaction to
organizational performance and individual can be “pay”. Job satisfaction is an attitude and
measuring attitudes at workplace is not an easy task.
The paradigm of the banking sector changed with the emergence of plastic money and online
transfers etc. Thus the technological Pay and breakthroughs affected the banking sector and
numerous career opportunities were created in this sector in all disciplines. The paradigm shifted
from a financial sector to a services sector where providing quality service to the customer
became the ultimate goal of the bank. Due to heavy inflow of multinational banks, a new culture
in the banking sector is emerged which is based on performance, rewards and compensations.
This has brought higher employment opportunities, increases in income level, and changes in
consumption pattern and consequently there emerges a competitive environment in the industry.
A review of the literature in this context reveals that a number of researchers have emphasized
the importance of factors affecting job satisfaction. Job satisfaction involves several different
spheres such as satisfaction with pay, promotion opportunities, fringe benefits, job security and
the importance/challenge of the job Nguyen, Taylor, & Bradley (2003). Job satisfaction can lead
to cost reduction by reducing absences, task errors, and turnover. Since work is an important
aspect of people’s lives and most people spend a large part of their working lives at work,
understanding the factors involved in job satisfaction is crucial to improving employees’
performance and productivity. Job satisfaction has often been linked to organizational
commitment, turnover intentions, and absenteeism. These variables are costly to an organization,
as they could lead to low morale, poor performance, lower productivity, and higher costs of
hiring, retention, and training Opkara (2002).
223
The private banks specifically created a cut throat competition by launching new products and
services regularly to gain more market share. The employment patterns in the banking sector
changed abruptly and it became a high volatile market. The salary bands and compensation and
rewards patterns changed and focus became on performance and targets rather than experience
and loyalty. Hence, pay and job satisfaction became a key factor for the banking professionals
which needed attention so as to achieve the long term goals of the bank. Studies have tested the
hypothesis that income is an important determinant of job satisfaction Nguyen, Taylor & Bradley
(2003). Factors such as pay, the work itself, supervision, relationships with co-workers and
opportunities for promotions have been found to contribute to job satisfaction Opkara (2002).
There is a significant difference in the job satisfaction levels of employees based on their
income. Employees earning the lowest income report significantly lower levels of job
satisfaction relative to the other income groups. Highly paid employees may still be dissatisfied
if they do not like the nature of their job and feel they cannot enter a more satisfying job Luddy,
(2005)
During the literature review various models have been followed by different researchers which
included various theories. Frederick Hertzberg’s motivation-hygiene theory proposes that
intrinsic factors are related to job satisfaction and motivation, whereas extrinsic factors are
associated with job dissatisfaction. This theory is not much used by researchers because of its
simplicity as the environment have changed a lot yet many organizations uses their job design
techniques based on this theory. The higher the education level the lower is the job satisfaction
Nguyen, Taylor, & Bradley (2003).
5.2. Employee Job Satisfaction
People hold different attitudes about many aspects of their work and life. From the management
perspective, job satisfaction is one of the most meaningful employee attitudes. The widely used
research definition of job satisfaction is the one by Locke (1976), who defined it as “a
pleasurable or positive emotional state resulting from the appraisal of one’s job or job
experiences” (as cited in Saari and Judge, 2004). According to Locke (1976), job satisfaction is
resulted from the interaction of cognition and affect, or thoughts and feelings. Warr (1979)
pointed out that people’s feeling about their work is a function both of that work itself and also
224
of their own personality. Arches (1991) described job satisfaction as a positive emotional state
caused by the appraisal of one’s job situation, and it is related to the characteristics and demands
of one’s work (as cited in Tornblom, 2005). Job satisfaction can be understood as the extent to
which employees like their jobs Heneman, Schwab, Fossum and Dyer (1989).
5.3. Indicators of employee job satisfaction
Herzberg, Mausner, Peterson and Capwell (1957) stated that the term job satisfaction is
multidimensional: “there can be satisfaction with the specific activities of the job; with the place
and working conditions under which the job is performed; or with specific factors such as
economic rewards, security, or social prestige”. Issues such as how to measure job satisfaction,
what does job satisfaction consist of, aroused much interest of different researchers. Smith,
Kendall and Hulin (1969) created the Job Descriptive Index (JDI) to measure employee job
satisfaction. It is a specific questionnaire which measures one’s satisfaction in five facets: pay,
promotions and promotion opportunities, coworkers, supervision, and the work itself. JDI is
highly regarded and well documented as valid and reliable. According to Kerr (1985), the JDI
“possesses good content validity (including concurrent, predictive, convergent, and discriminate
validities), impressive construct validity, and adequate reliability,” and “very few instruments in
industrial organizational psychology have received the attention of researchers that the JDI has”.
Locke (1976) further adds more facets such as recognition, working conditions, and company
and management. Weiss et al (1967) developed Minnesota Satisfaction Questionnaire measuring
job satisfaction on twenty aspects including: ability utilization, co-workers, moral values,
achievement, creativity, recognition, activity, independence, responsibility, advancement,
security, supervision human relations, authority, social service, supervision-technical, company
policies, social status, variety, compensation, and working conditions.
Job satisfaction links closely to work motivation. It may be viewed, at one level, as an outcome
of being able to succeed in acting in accordance with one’s motivation Tornblom et al (2005). In
this sense, satisfaction arises not from performance of the job per se, but from the ability to have
a need or motive satisfied. It is assumed that high levels of motivation will have both
psychological and behavioral consequences. The psychological consequences include job
225
satisfaction and organizational commitment; whereas the behavioral effects include higher
output, lower absenteeism and lower likelihood of leaving the job Foster (2000). The close
relationship between work motivation and job satisfaction implied that studying the indicators of
job satisfaction will lead to the understanding of employees’ needs and the factors influencing
their behavior. To test the job satisfaction levels of sample respondents of SBI and ICICI, the
second part of the instrument was used. It contains items that measure job satisfaction, Job
Descriptive Index (JDI) was one of the most commonly used instruments on measuring
employee job satisfaction. Designed by Smith et al. in 1969, JDI evaluates job satisfaction in five
facets namely pay, promotions and promotion opportunities, coworkers, supervision, and the
work itself.
The questionnaire included questions (Question 1-19) in relation to the employees’ job
satisfaction, measuring with 5-point Likert scale: ranking from One to Five (1 being of “strongly
disagree” and 5 being “strongly agree”). The pretest applied to measure reliability and validity.
The collected item total correlation was 0.50, and if deleting the item (questions no 7) increase
Cronbach’s α, the item was deleted. The overall reliability co-efficient of the instrument yielded
an r = 0.73 Cronbach’s alpha.
To study the job satisfaction of the respondent’s factor analysis is adopted. Factor analysis is a
statistical method used to describe variability among observed, Factor analysis searches for such
joint variations in response to unobserved latent variables. The observed variables are modeled
as linear combinations of the potential factors, plus error terms. The information gained about the
interdependencies between observed variables can be used later to reduce the set of variables in a
dataset. Computationally this technique is equivalent to low rank approximation of the matrix of
observed variables.
5.4. Factor Analysis
Factor analysis and principal component analysis were used to identify smaller number of factors
underlying a large number of observed variables. Variables that have high correlation between
them, and are largely independent of other subsets of variables, are combined in to factors. These
226
measures help in developing objective instruments for measuring constructs which are not
directly observable in the real life. 18 items in the questionnaire were analyzed by applying
factor analysis which revealed underlying dimensions of Job Satisfaction.
Exploratory factor analysis is used to explore the underlying dimensions that could have
correlations among the observed variables. Exploratory factor analysis also helps in theory
building. The process of extraction used here is principle component analysis as it helps in
reducing number of variables. Factor analysis produced factor loadings for each combination of
extracted factors and observed variables. Factor loadings were similar to correlation coefficients
between the factors and variables. Higher the factor loading more likely it is that the factor
underlies that variable. Factor loadings help in identifying which variables are associated with a
particular factor. Factor loadings obtained from extraction may not represent a clear picture of
the factor structure of the dataset. After extraction it was known which observed variable load on
different factors. Un- rotated factor loading are difficult to interpret. Rotation helps in arriving at
a simple pattern of factor loadings by maximizing high correlations and minimizing low ones.
Extraction communalities for a variable give the total amount of variation, explained by all
factors. If the communality exceeds 1.0, there is a spurious solution, which may reflect too small
a sample or the researcher has too many or too few factors. Factor analysis was conducted on
the responses of 300 respondents’. The objective is to identify factors which lead to job
satisfaction.
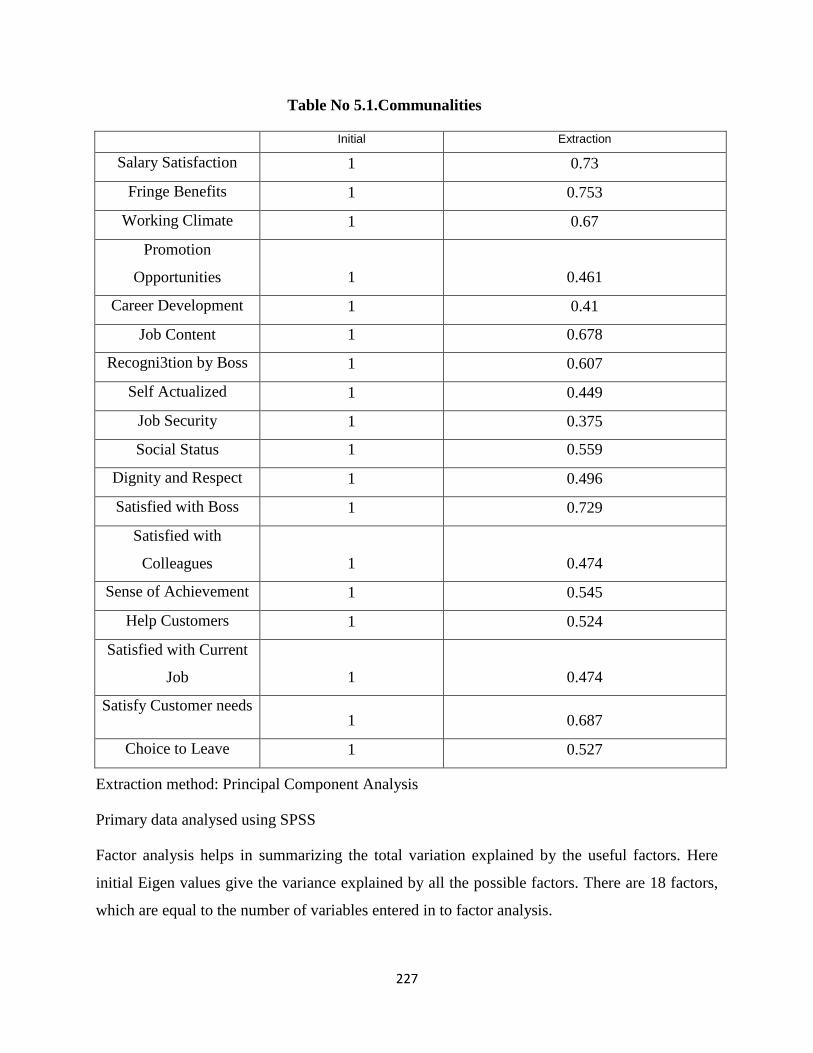
The following table depicts the communalities of job satisfaction. It can be observed from the
following table that the extraction values do not exceed 1.
227
Table No 5.1.Communalities
Initial Extraction
Salary Satisfaction 1 0.73
Fringe Benefits 1 0.753
Working Climate 1 0.67
Promotion
Opportunities 1 0.461
Career Development 1 0.41
Job Content 1 0.678
Recogni3tion by Boss 1 0.607
Self Actualized 1 0.449
Job Security 1 0.375
Social Status 1 0.559
Dignity and Respect 1 0.496
Satisfied with Boss 1 0.729
Satisfied with
Colleagues 1 0.474
Sense of Achievement 1 0.545
Help Customers 1 0.524
Satisfied with Current
Job 1 0.474
Satisfy Customer needs 1 0.687
Choice to Leave 1 0.527
Extraction method: Principal Component Analysis
Primary data analysed using SPSS
Factor analysis helps in summarizing the total variation explained by the useful factors. Here
initial Eigen values give the variance explained by all the possible factors. There are 18 factors,
which are equal to the number of variables entered in to factor analysis.
228
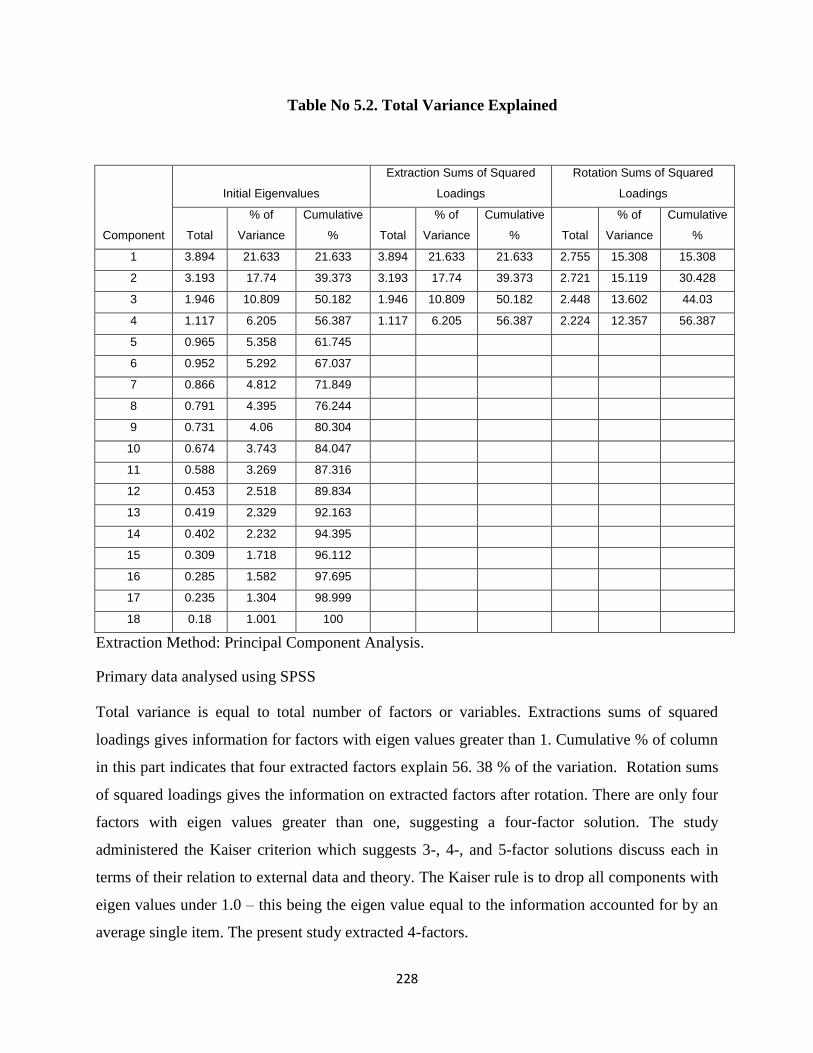
Table No 5.2. Total Variance Explained
Component
Initial Eigenvalues
Extraction Sums of Squared
Loadings
Rotation Sums of Squared
Loadings
Total
% of
Variance
Cumulative
% Total
% of
Variance
Cumulative
% Total
% of
Variance
Cumulative
%
1 3.894 21.633 21.633 3.894 21.633 21.633 2.755 15.308 15.308
2 3.193 17.74 39.373 3.193 17.74 39.373 2.721 15.119 30.428
3 1.946 10.809 50.182 1.946 10.809 50.182 2.448 13.602 44.03
4 1.117 6.205 56.387 1.117 6.205 56.387 2.224 12.357 56.387
5 0.965 5.358 61.745
6 0.952 5.292 67.037
7 0.866 4.812 71.849
8 0.791 4.395 76.244
9 0.731 4.06 80.304
10 0.674 3.743 84.047
11 0.588 3.269 87.316
12 0.453 2.518 89.834
13 0.419 2.329 92.163
14 0.402 2.232 94.395
15 0.309 1.718 96.112
16 0.285 1.582 97.695
17 0.235 1.304 98.999
18 0.18 1.001 100
Extraction Method: Principal Component Analysis.
Primary data analysed using SPSS
Total variance is equal to total number of factors or variables. Extractions sums of squared
loadings gives information for factors with eigen values greater than 1. Cumulative % of column
in this part indicates that four extracted factors explain 56. 38 % of the variation. Rotation sums
of squared loadings gives the information on extracted factors after rotation. There are only four
factors with eigen values greater than one, suggesting a four-factor solution. The study
administered the Kaiser criterion which suggests 3-, 4-, and 5-factor solutions discuss each in
terms of their relation to external data and theory. The Kaiser rule is to drop all components with
eigen values under 1.0 – this being the eigen value equal to the information accounted for by an
average single item. The present study extracted 4-factors.
229
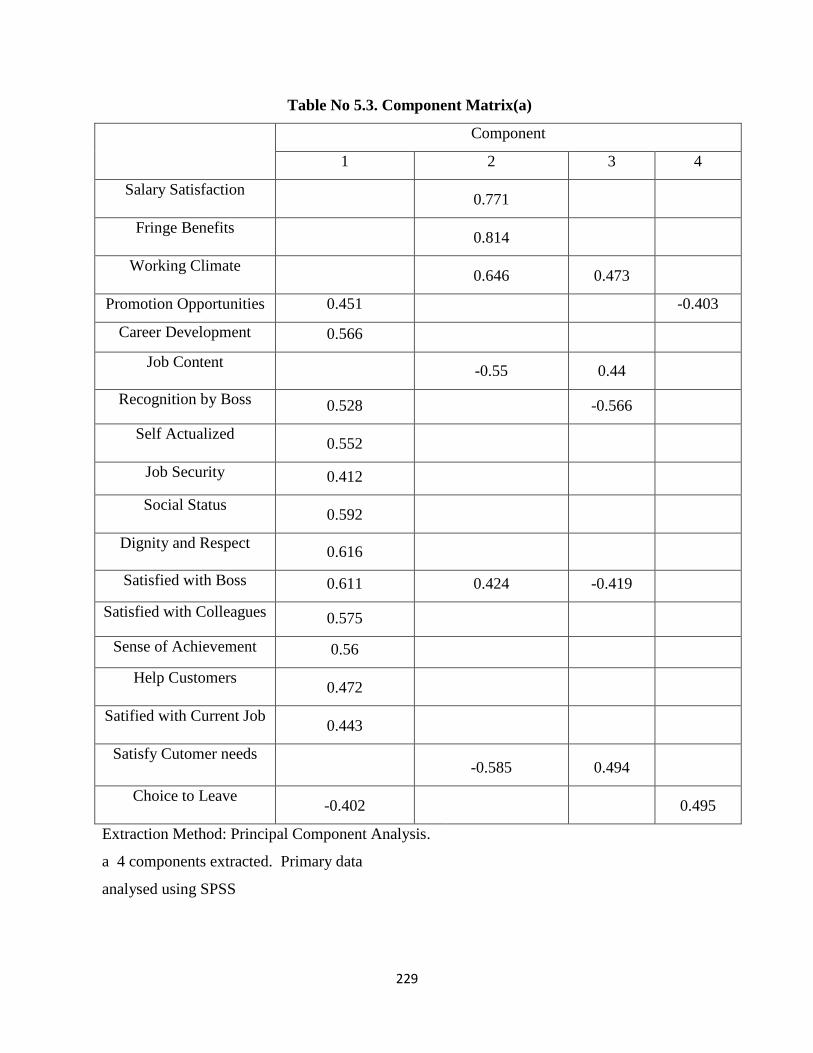
Table No 5.3. Component Matrix(a)
Component
1 2 3 4
Salary Satisfaction 0.771
Fringe Benefits 0.814
Working Climate 0.646 0.473
Promotion Opportunities 0.451 -0.403
Career Development 0.566
Job Content -0.55 0.44
Recognition by Boss 0.528 -0.566
Self Actualized 0.552
Job Security 0.412
Social Status 0.592
Dignity and Respect 0.616
Satisfied with Boss 0.611 0.424 -0.419
Satisfied with Colleagues 0.575
Sense of Achievement 0.56
Help Customers 0.472
Satified with Current Job 0.443
Satisfy Cutomer needs -0.585 0.494
Choice to Leave -0.402 0.495
Extraction Method: Principal Component Analysis.
a 4 components extracted. Primary data
analysed using SPSS
230
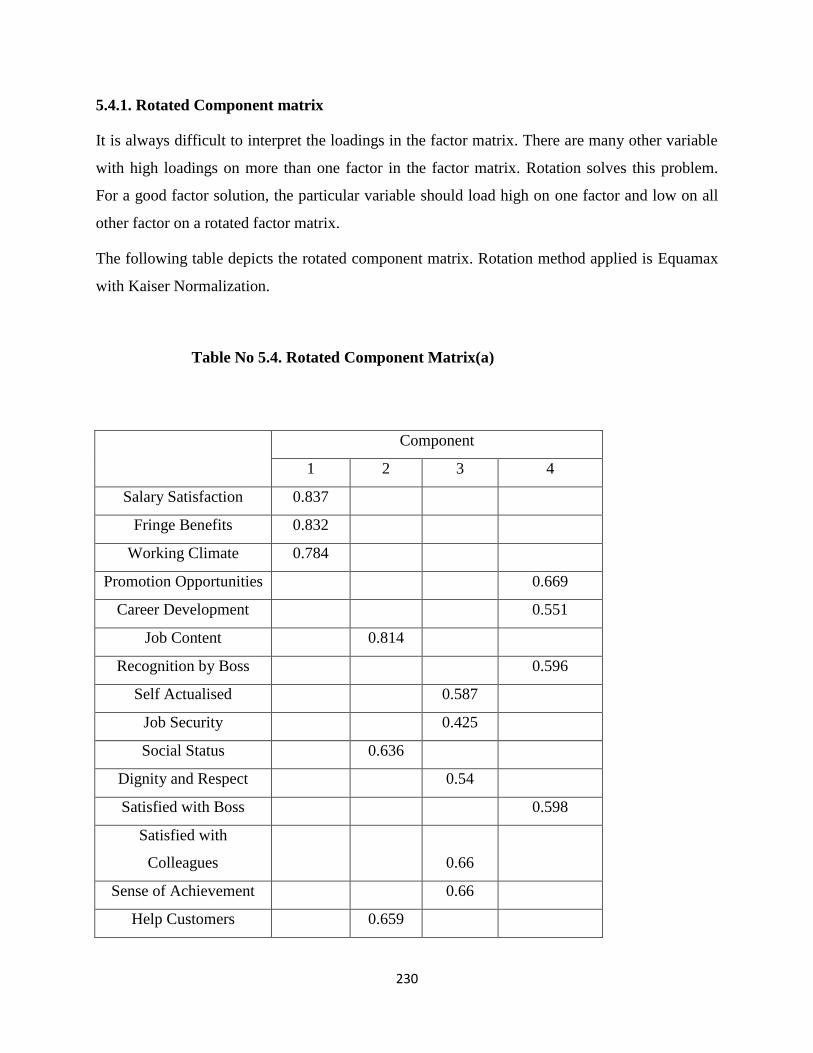
5.4.1. Rotated Component matrix
It is always difficult to interpret the loadings in the factor matrix. There are many other variable
with high loadings on more than one factor in the factor matrix. Rotation solves this problem.
For a good factor solution, the particular variable should load high on one factor and low on all
other factor on a rotated factor matrix.
The following table depicts the rotated component matrix. Rotation method applied is Equamax
with Kaiser Normalization.
Table No 5.4. Rotated Component Matrix(a)
Component
1 2 3 4
Salary Satisfaction 0.837
Fringe Benefits 0.832
Working Climate 0.784
Promotion Opportunities 0.669
Career Development 0.551
Job Content 0.814
Recognition by Boss 0.596
Self Actualised 0.587
Job Security 0.425
Social Status 0.636
Dignity and Respect 0.54
Satisfied with Boss 0.598
Satisfied with
Colleagues 0.66
Sense of Achievement 0.66
Help Customers 0.659
231
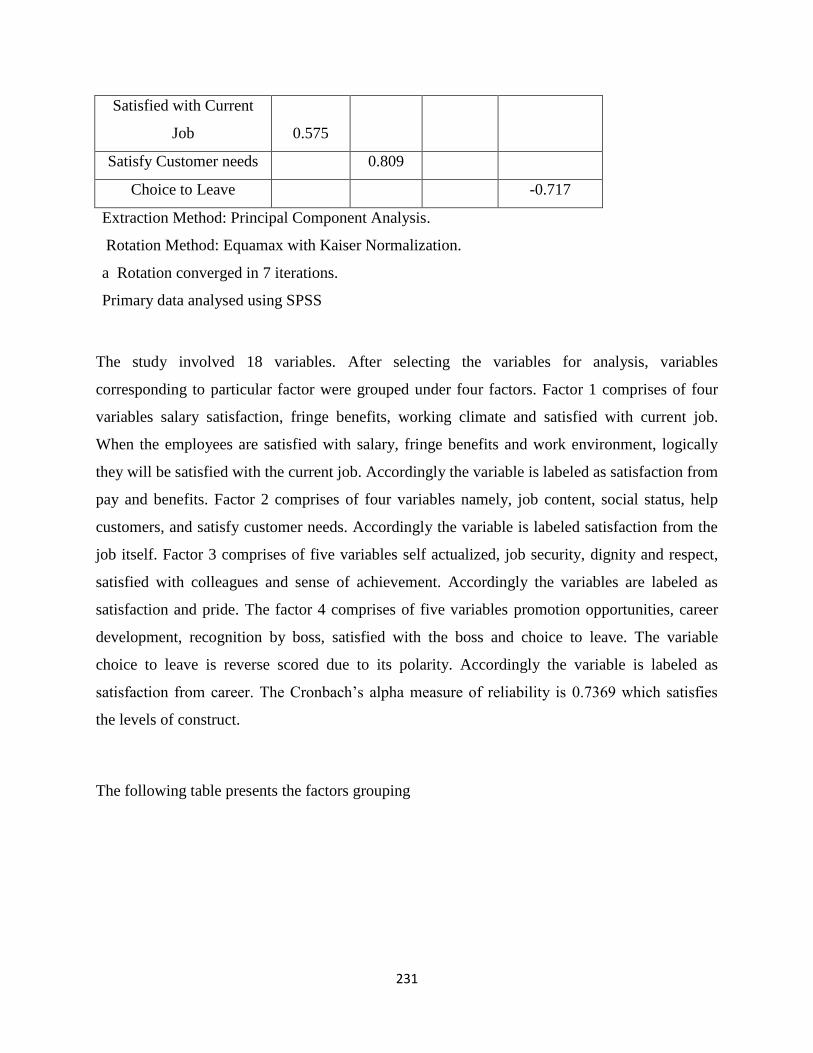
Satisfied with Current
Job 0.575
Satisfy Customer needs 0.809
Choice to Leave -0.717
Extraction Method: Principal Component Analysis.
Rotation Method: Equamax with Kaiser Normalization.
a Rotation converged in 7 iterations.
Primary data analysed using SPSS
The study involved 18 variables. After selecting the variables for analysis, variables
corresponding to particular factor were grouped under four factors. Factor 1 comprises of four
variables salary satisfaction, fringe benefits, working climate and satisfied with current job.
When the employees are satisfied with salary, fringe benefits and work environment, logically
they will be satisfied with the current job. Accordingly the variable is labeled as satisfaction from
pay and benefits. Factor 2 comprises of four variables namely, job content, social status, help
customers, and satisfy customer needs. Accordingly the variable is labeled satisfaction from the
job itself. Factor 3 comprises of five variables self actualized, job security, dignity and respect,
satisfied with colleagues and sense of achievement. Accordingly the variables are labeled as
satisfaction and pride. The factor 4 comprises of five variables promotion opportunities, career
development, recognition by boss, satisfied with the boss and choice to leave. The variable
choice to leave is reverse scored due to its polarity. Accordingly the variable is labeled as
satisfaction from career. The Cronbach’s alpha measure of reliability is 0.7369 which satisfies
the levels of construct.
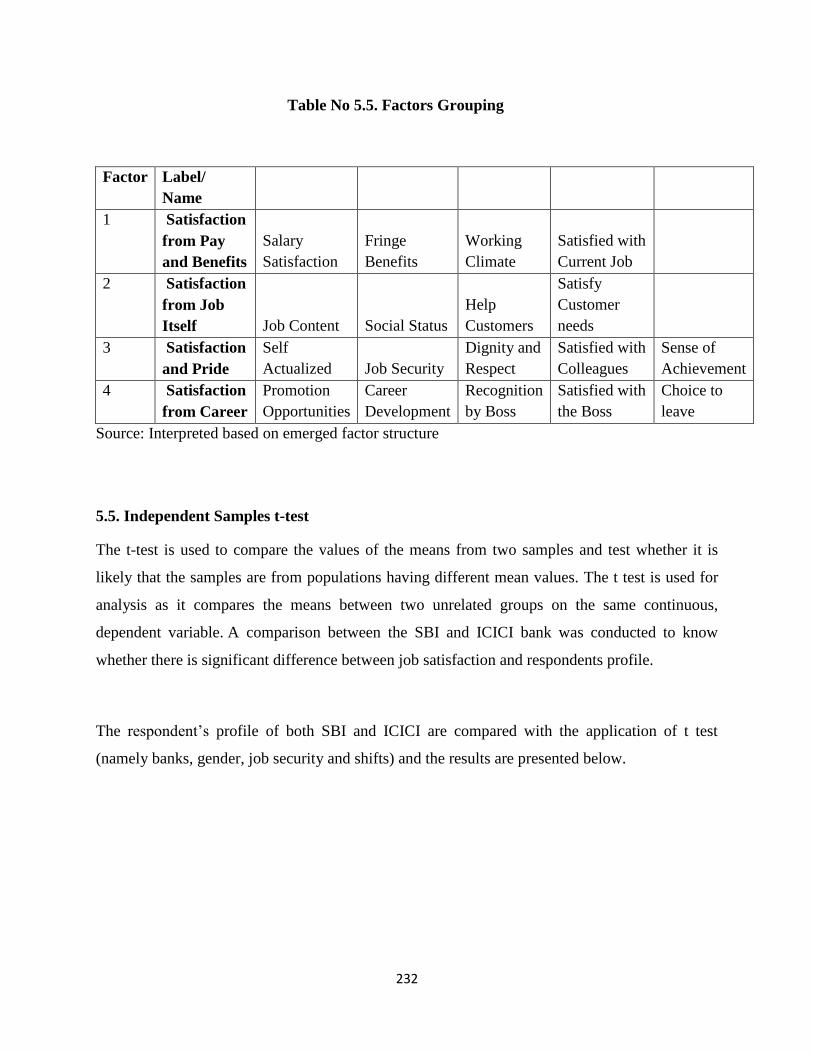
The following table presents the factors grouping
232
Table No 5.5. Factors Grouping
Factor Label/
Name
1 Satisfaction
from Pay
and Benefits
Salary
Satisfaction
Fringe
Benefits
Working
Climate
Satisfied with
Current Job
2 Satisfaction
from Job
Itself Job Content Social Status
Help
Customers
Satisfy
Customer
needs
3 Satisfaction
and Pride
Self
Actualized Job Security
Dignity and
Respect
Satisfied with
Colleagues
Sense of
Achievement
4 Satisfaction
from Career
Promotion
Opportunities
Career
Development
Recognition
by Boss
Satisfied with
the Boss
Choice to
leave
Source: Interpreted based on emerged factor structure
5.5. Independent Samples t-test
The t-test is used to compare the values of the means from two samples and test whether it is
likely that the samples are from populations having different mean values. The t test is used for
analysis as it compares the means between two unrelated groups on the same continuous,
dependent variable. A comparison between the SBI and ICICI bank was conducted to know
whether there is significant difference between job satisfaction and respondents profile.
The respondent’s profile of both SBI and ICICI are compared with the application of t test
(namely banks, gender, job security and shifts) and the results are presented below.
233
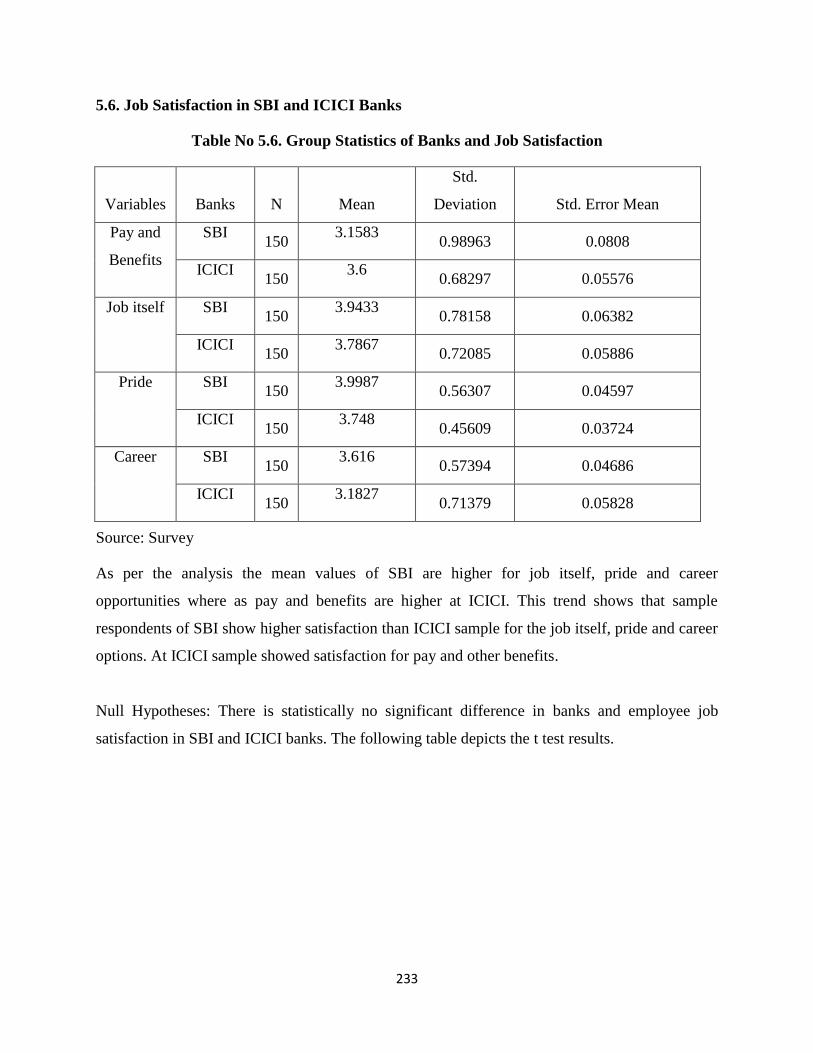
5.6. Job Satisfaction in SBI and ICICI Banks
Table No 5.6. Group Statistics of Banks and Job Satisfaction
Variables Banks N Mean
Std.
Deviation Std. Error Mean
Pay and
Benefits
SBI 150
3.1583 0.98963 0.0808
ICICI 150
3.6 0.68297 0.05576
Job itself SBI 150
3.9433 0.78158 0.06382
ICICI 150
3.7867 0.72085 0.05886
Pride SBI 150
3.9987 0.56307 0.04597
ICICI 150
3.748 0.45609 0.03724
Career SBI 150
3.616 0.57394 0.04686
ICICI 150
3.1827 0.71379 0.05828
Source: Survey
As per the analysis the mean values of SBI are higher for job itself, pride and career
opportunities where as pay and benefits are higher at ICICI. This trend shows that sample
respondents of SBI show higher satisfaction than ICICI sample for the job itself, pride and career
options. At ICICI sample showed satisfaction for pay and other benefits.
Null Hypotheses: There is statistically no significant difference in banks and employee job
satisfaction in SBI and ICICI banks. The following table depicts the t test results.
234
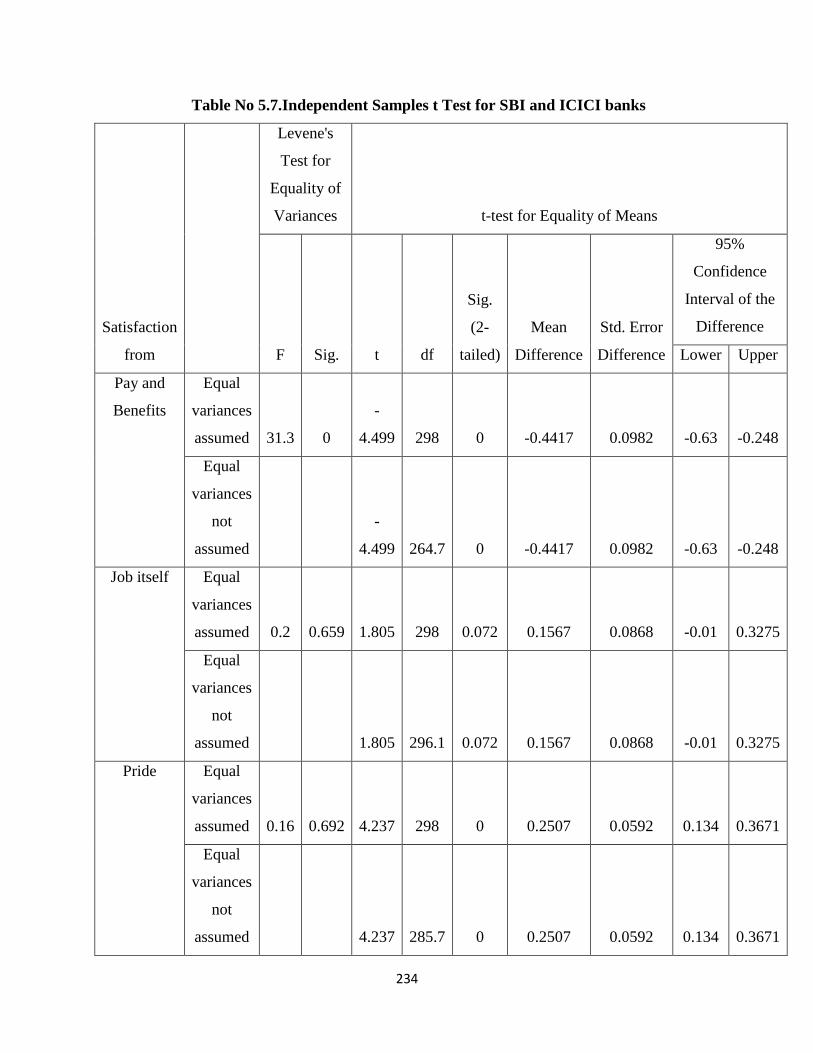
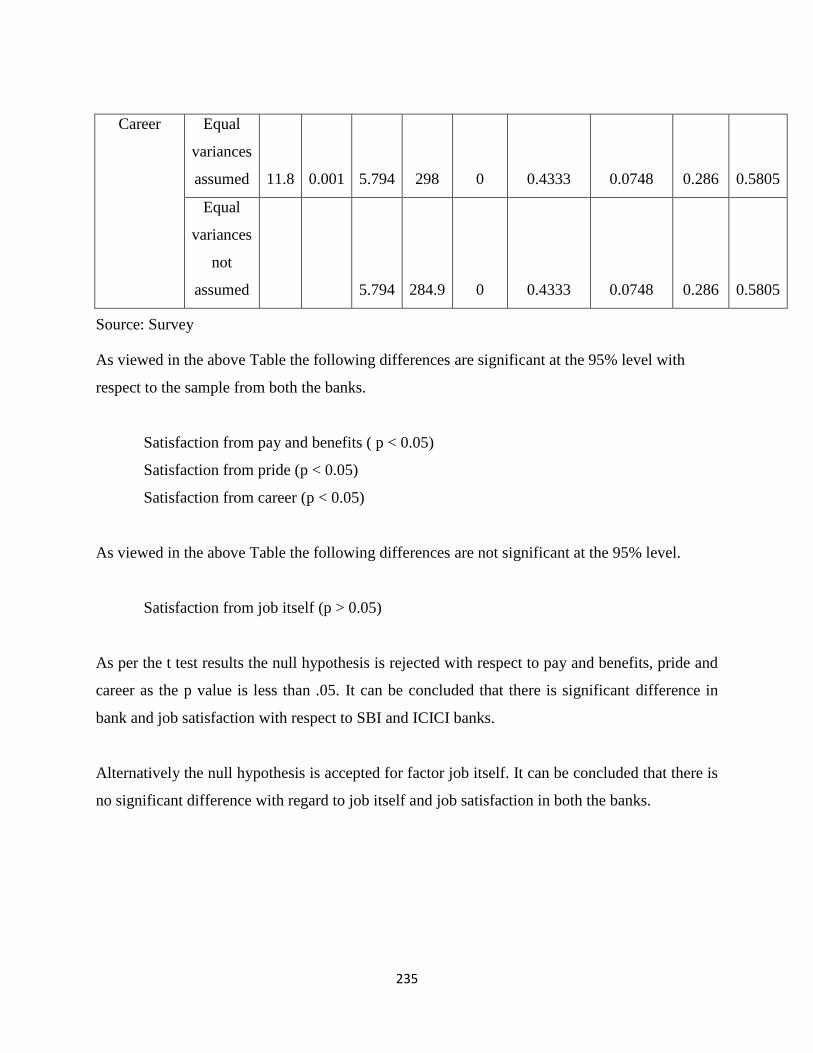
Table No 5.7.Independent Samples t Test for SBI and ICICI banks
Satisfaction
from
Levene's
Test for
Equality of
Variances t-test for Equality of Means
F Sig. t df
Sig.
(2-
tailed)
Mean
Difference
Std. Error
Difference
95%
Confidence
Interval of the
Difference
Lower Upper
Pay and
Benefits
Equal
variances
assumed 31.3 0
-
4.499 298 0 -0.4417 0.0982 -0.63 -0.248
Equal
variances
not
assumed
-
4.499 264.7 0 -0.4417 0.0982 -0.63 -0.248
Job itself Equal
variances
assumed 0.2 0.659 1.805 298 0.072 0.1567 0.0868 -0.01 0.3275
Equal
variances
not
assumed 1.805 296.1 0.072 0.1567 0.0868 -0.01 0.3275
Pride Equal
variances
assumed 0.16 0.692 4.237 298 0 0.2507 0.0592 0.134 0.3671
Equal
variances
not
assumed 4.237 285.7 0 0.2507 0.0592 0.134 0.3671
235
Career Equal
variances
assumed 11.8 0.001 5.794 298 0 0.4333 0.0748 0.286 0.5805
Equal
variances
not
assumed 5.794 284.9 0 0.4333 0.0748 0.286 0.5805
Source: Survey
As viewed in the above Table the following differences are significant at the 95% level with
respect to the sample from both the banks.
Satisfaction from pay and benefits ( p < 0.05)
Satisfaction from pride (p < 0.05)
Satisfaction from career (p < 0.05)
As viewed in the above Table the following differences are not significant at the 95% level.
Satisfaction from job itself (p > 0.05)
As per the t test results the null hypothesis is rejected with respect to pay and benefits, pride and
career as the p value is less than .05. It can be concluded that there is significant difference in
bank and job satisfaction with respect to SBI and ICICI banks.
Alternatively the null hypothesis is accepted for factor job itself. It can be concluded that there is
no significant difference with regard to job itself and job satisfaction in both the banks.
236
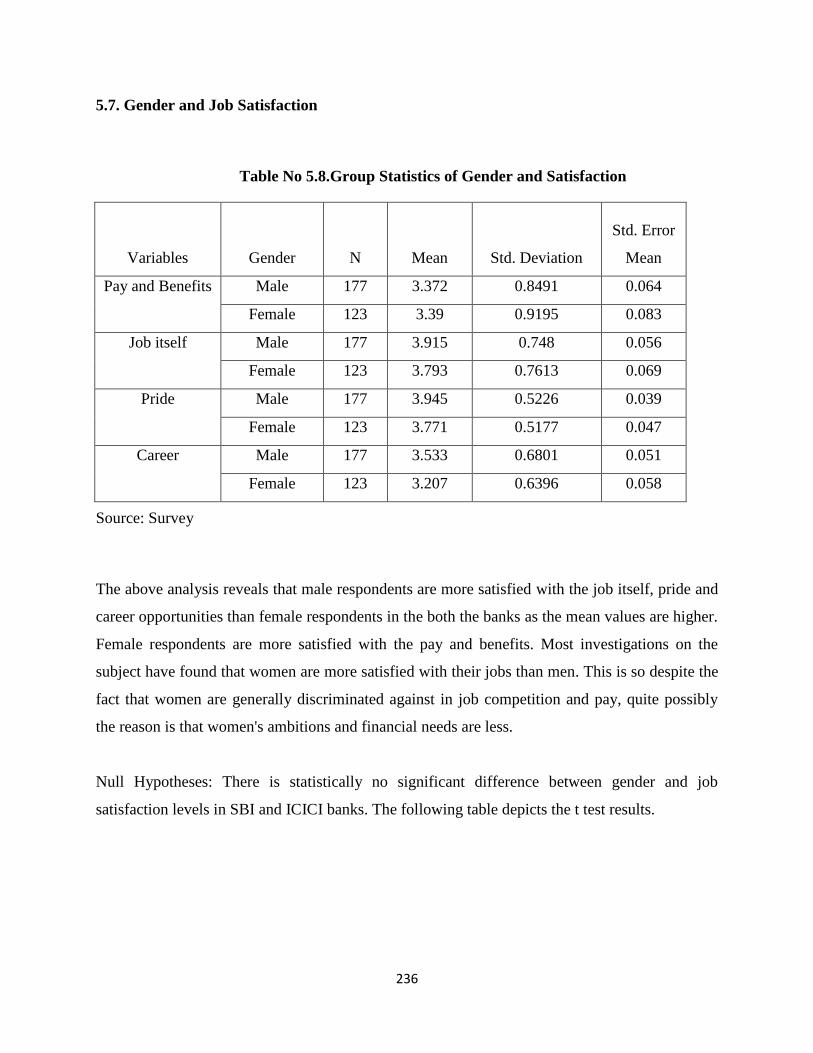
5.7. Gender and Job Satisfaction
Table No 5.8.Group Statistics of Gender and Satisfaction
Variables Gender N Mean Std. Deviation
Std. Error
Mean
Pay and Benefits Male 177 3.372 0.8491 0.064
Female 123 3.39 0.9195 0.083
Job itself Male 177 3.915 0.748 0.056
Female 123 3.793 0.7613 0.069
Pride Male 177 3.945 0.5226 0.039
Female 123 3.771 0.5177 0.047
Career Male 177 3.533 0.6801 0.051
Female 123 3.207 0.6396 0.058
Source: Survey
The above analysis reveals that male respondents are more satisfied with the job itself, pride and
career opportunities than female respondents in the both the banks as the mean values are higher.
Female respondents are more satisfied with the pay and benefits. Most investigations on the
subject have found that women are more satisfied with their jobs than men. This is so despite the
fact that women are generally discriminated against in job competition and pay, quite possibly
the reason is that women's ambitions and financial needs are less.
Null Hypotheses: There is statistically no significant difference between gender and job
satisfaction levels in SBI and ICICI banks. The following table depicts the t test results.
237
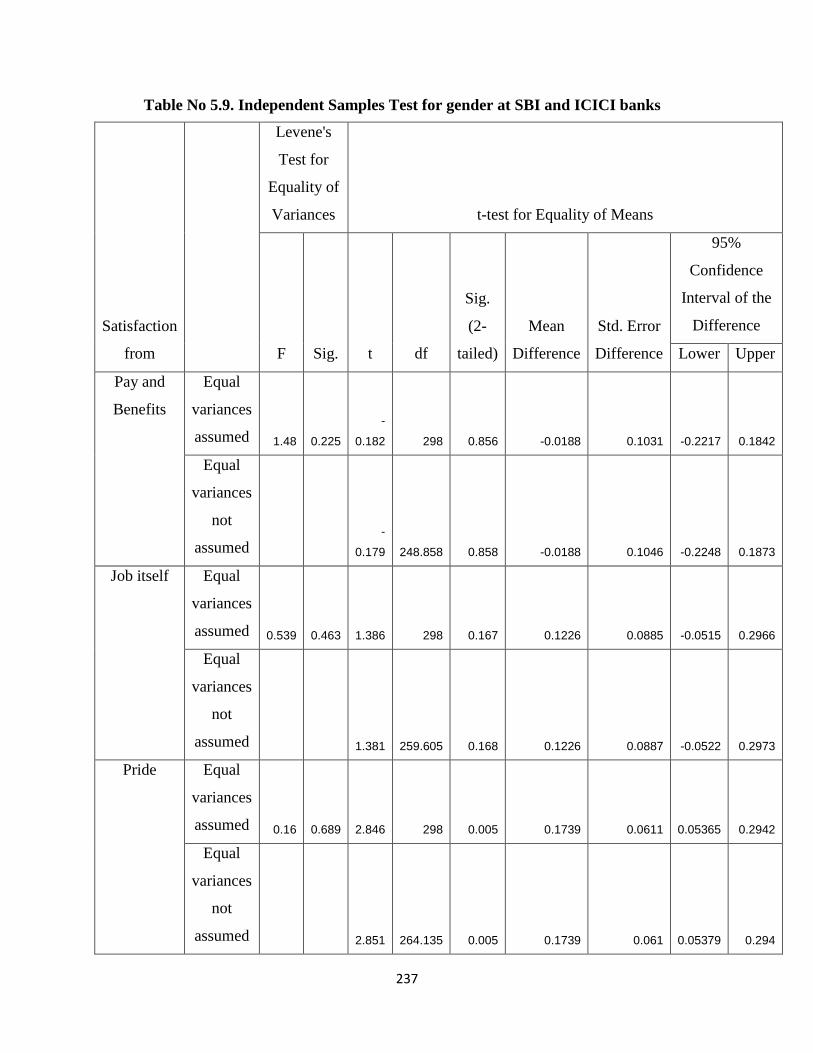
Table No 5.9. Independent Samples Test for gender at SBI and ICICI banks
Satisfaction
from
Levene's
Test for
Equality of
Variances t-test for Equality of Means
F Sig. t df
Sig.
(2-
tailed)
Mean
Difference
Std. Error
Difference
95%
Confidence
Interval of the
Difference
Lower Upper
Pay and
Benefits
Equal
variances
assumed 1.48 0.225
-
0.182 298 0.856 -0.0188 0.1031 -0.2217 0.1842
Equal
variances
not
assumed
-
0.179 248.858 0.858 -0.0188 0.1046 -0.2248 0.1873
Job itself Equal
variances
assumed 0.539 0.463 1.386 298 0.167 0.1226 0.0885 -0.0515 0.2966
Equal
variances
not
assumed 1.381 259.605 0.168 0.1226 0.0887 -0.0522 0.2973
Pride Equal
variances
assumed 0.16 0.689 2.846 298 0.005 0.1739 0.0611 0.05365 0.2942
Equal
variances
not
assumed 2.851 264.135 0.005 0.1739 0.061 0.05379 0.294
238
Career Equal
variances
assumed 0.094 0.76 4.194 298 0 0.3268 0.0779 0.17347 0.4802
Equal
variances
not
assumed 4.241 272.44 0 0.3268 0.0771 0.1751 0.4786
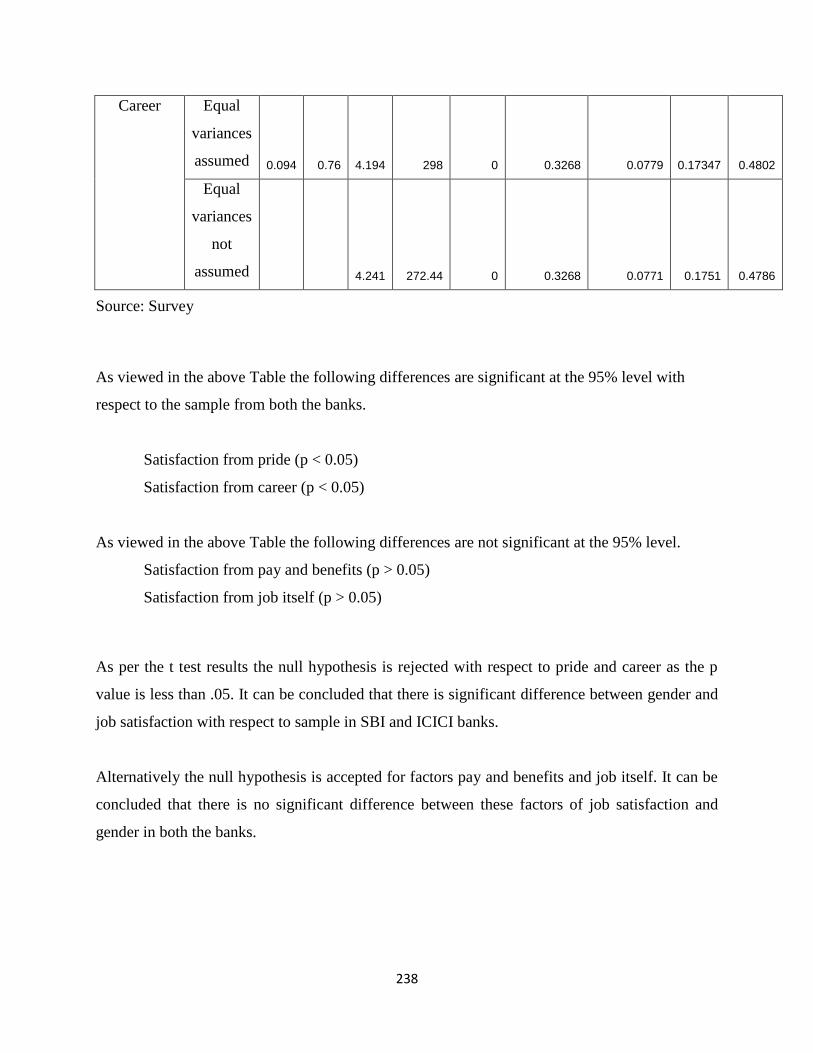
Source: Survey
As viewed in the above Table the following differences are significant at the 95% level with
respect to the sample from both the banks.
Satisfaction from pride (p < 0.05)
Satisfaction from career (p < 0.05)
As viewed in the above Table the following differences are not significant at the 95% level.
Satisfaction from pay and benefits (p > 0.05)
Satisfaction from job itself (p > 0.05)
As per the t test results the null hypothesis is rejected with respect to pride and career as the p
value is less than .05. It can be concluded that there is significant difference between gender and
job satisfaction with respect to sample in SBI and ICICI banks.
Alternatively the null hypothesis is accepted for factors pay and benefits and job itself. It can be
concluded that there is no significant difference between these factors of job satisfaction and
gender in both the banks.
239
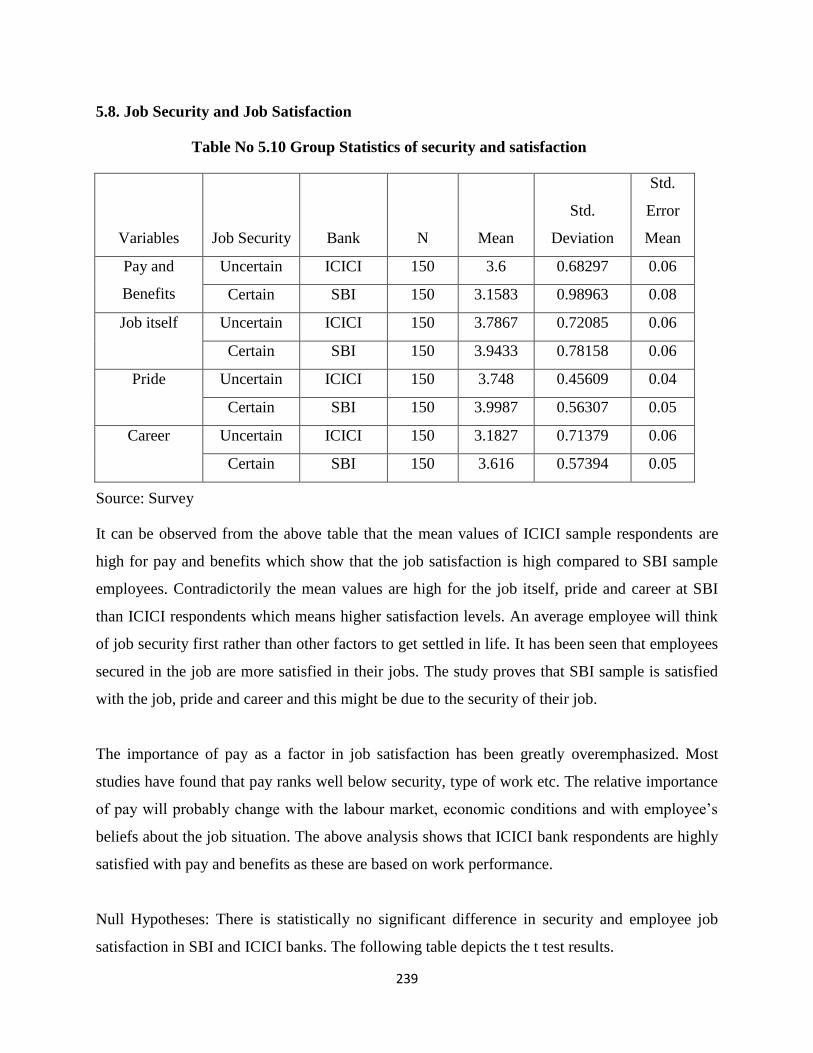
5.8. Job Security and Job Satisfaction
Table No 5.10 Group Statistics of security and satisfaction
Variables Job Security Bank N Mean
Std.
Deviation
Std.
Error
Mean
Pay and
Benefits
Uncertain ICICI 150 3.6 0.68297 0.06
Certain SBI 150 3.1583 0.98963 0.08
Job itself Uncertain ICICI 150 3.7867 0.72085 0.06
Certain SBI 150 3.9433 0.78158 0.06
Pride Uncertain ICICI 150 3.748 0.45609 0.04
Certain SBI 150 3.9987 0.56307 0.05
Career Uncertain ICICI 150 3.1827 0.71379 0.06
Certain SBI 150 3.616 0.57394 0.05
Source: Survey
It can be observed from the above table that the mean values of ICICI sample respondents are
high for pay and benefits which show that the job satisfaction is high compared to SBI sample
employees. Contradictorily the mean values are high for the job itself, pride and career at SBI
than ICICI respondents which means higher satisfaction levels. An average employee will think
of job security first rather than other factors to get settled in life. It has been seen that employees
secured in the job are more satisfied in their jobs. The study proves that SBI sample is satisfied
with the job, pride and career and this might be due to the security of their job.
The importance of pay as a factor in job satisfaction has been greatly overemphasized. Most
studies have found that pay ranks well below security, type of work etc. The relative importance
of pay will probably change with the labour market, economic conditions and with employee’s
beliefs about the job situation. The above analysis shows that ICICI bank respondents are highly
satisfied with pay and benefits as these are based on work performance.
Null Hypotheses: There is statistically no significant difference in security and employee job
satisfaction in SBI and ICICI banks. The following table depicts the t test results.
240
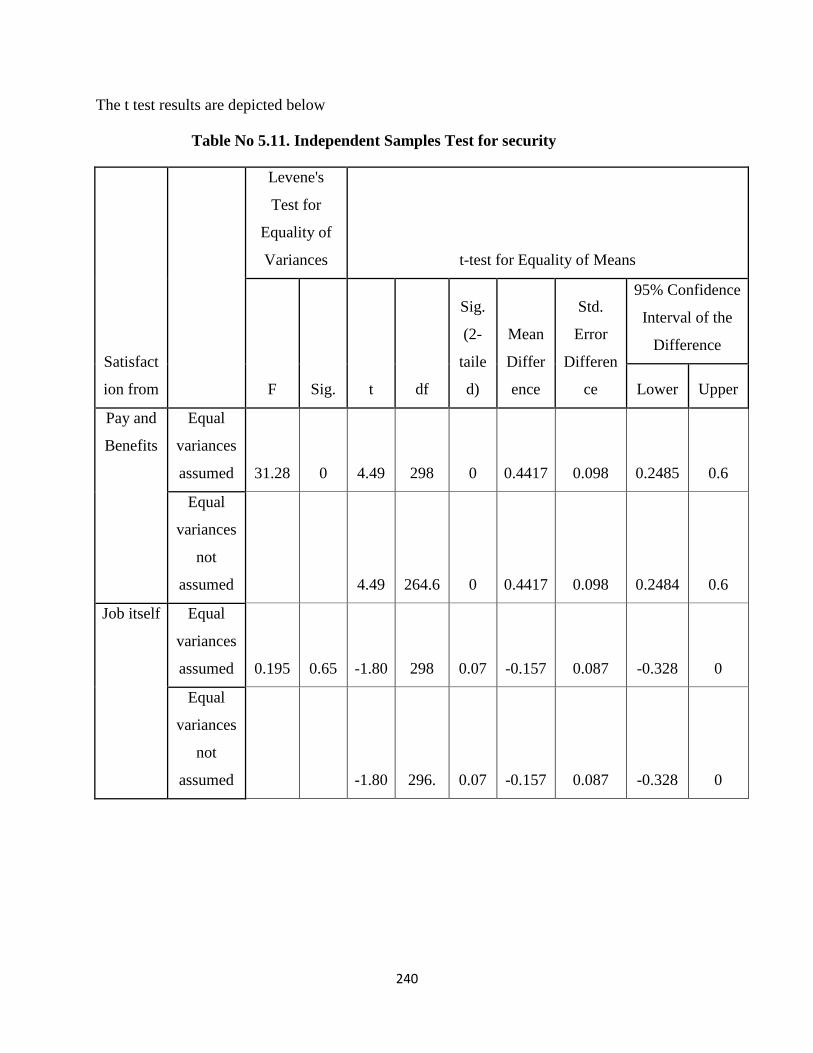
The t test results are depicted below
Table No 5.11. Independent Samples Test for security
Satisfact
ion from
Levene's
Test for
Equality of
Variances t-test for Equality of Means
F Sig. t df
Sig.
(2-
taile
d)
Mean
Differ
ence
Std.
Error
Differen
ce
95% Confidence
Interval of the
Difference
Lower Upper
Pay and
Benefits
Equal
variances
assumed 31.28 0 4.49 298 0 0.4417 0.098 0.2485 0.6
Equal
variances
not
assumed 4.49 264.6 0 0.4417 0.098 0.2484 0.6
Job itself Equal
variances
assumed 0.195 0.65 -1.80 298 0.07 -0.157 0.087 -0.328 0
Equal
variances
not
assumed -1.80 296. 0.07 -0.157 0.087 -0.328 0
241
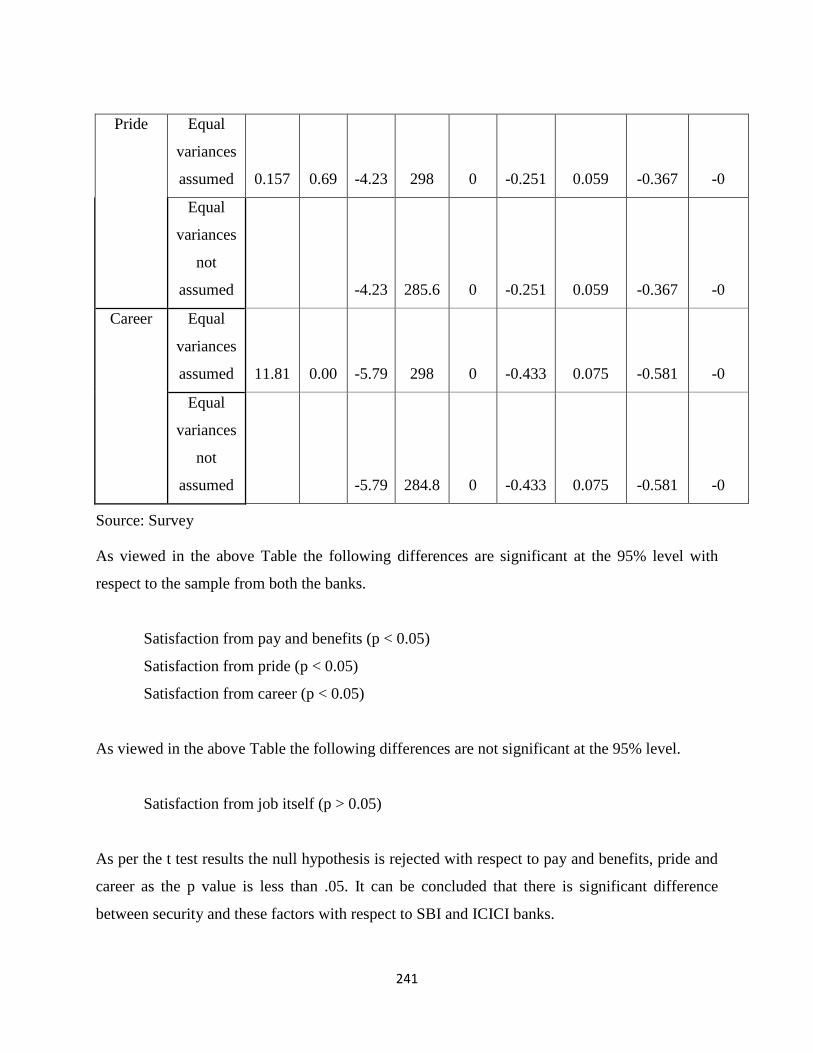
Pride Equal
variances
assumed 0.157 0.69 -4.23 298 0 -0.251 0.059 -0.367 -0
Equal
variances
not
assumed -4.23 285.6 0 -0.251 0.059 -0.367 -0
Career Equal
variances
assumed 11.81 0.00 -5.79 298 0 -0.433 0.075 -0.581 -0
Equal
variances
not
assumed -5.79 284.8 0 -0.433 0.075 -0.581 -0
Source: Survey
As viewed in the above Table the following differences are significant at the 95% level with
respect to the sample from both the banks.
Satisfaction from pay and benefits (p < 0.05)
Satisfaction from pride (p < 0.05)
Satisfaction from career (p < 0.05)
As viewed in the above Table the following differences are not significant at the 95% level.
Satisfaction from job itself (p > 0.05)
As per the t test results the null hypothesis is rejected with respect to pay and benefits, pride and
career as the p value is less than .05. It can be concluded that there is significant difference
between security and these factors with respect to SBI and ICICI banks.
242
Alternatively the null hypothesis is accepted for jobs itself. It can be concluded that there is no
significant difference between job itself and security in both the banks.
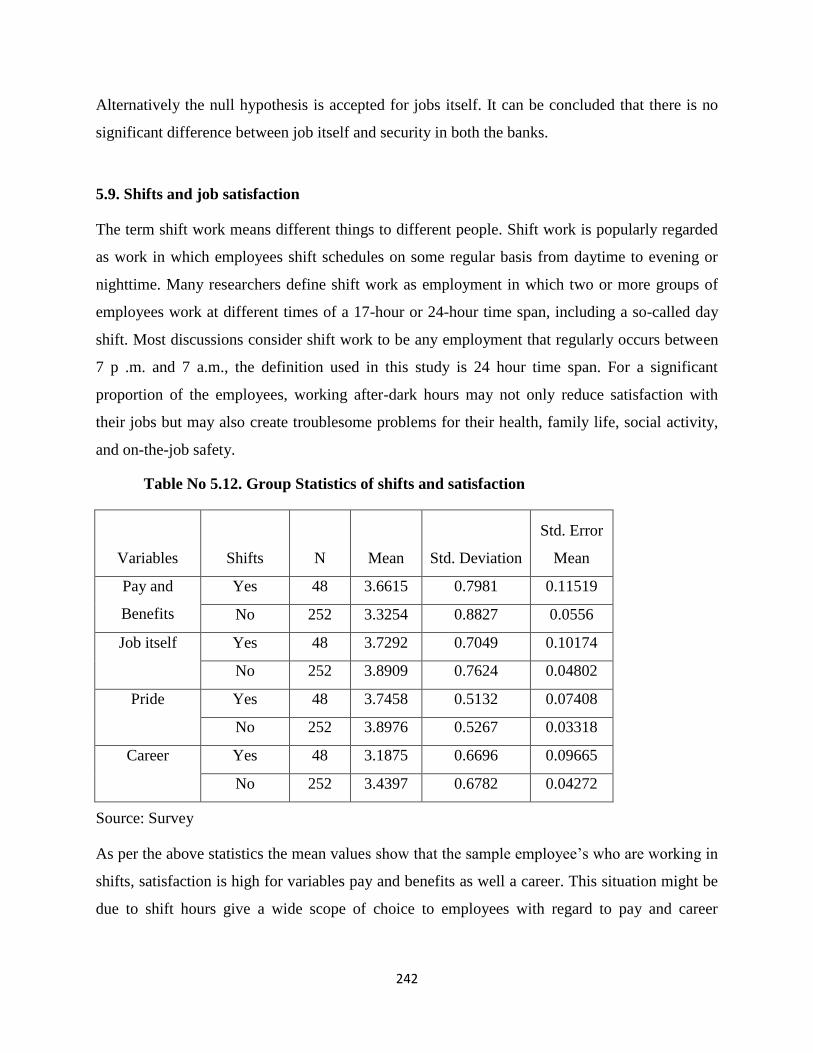
5.9. Shifts and job satisfaction
The term shift work means different things to different people. Shift work is popularly regarded
as work in which employees shift schedules on some regular basis from daytime to evening or
nighttime. Many researchers define shift work as employment in which two or more groups of
employees work at different times of a 17-hour or 24-hour time span, including a so-called day
shift. Most discussions consider shift work to be any employment that regularly occurs between
7 p .m. and 7 a.m., the definition used in this study is 24 hour time span. For a significant
proportion of the employees, working after-dark hours may not only reduce satisfaction with
their jobs but may also create troublesome problems for their health, family life, social activity,
and on-the-job safety.
Table No 5.12. Group Statistics of shifts and satisfaction
Variables Shifts N Mean Std. Deviation
Std. Error
Mean
Pay and
Benefits
Yes 48 3.6615 0.7981 0.11519
No 252 3.3254 0.8827 0.0556
Job itself Yes 48 3.7292 0.7049 0.10174
No 252 3.8909 0.7624 0.04802
Pride Yes 48 3.7458 0.5132 0.07408
No 252 3.8976 0.5267 0.03318
Career Yes 48 3.1875 0.6696 0.09665
No 252 3.4397 0.6782 0.04272
Source: Survey
As per the above statistics the mean values show that the sample employee’s who are working in
shifts, satisfaction is high for variables pay and benefits as well a career. This situation might be
due to shift hours give a wide scope of choice to employees with regard to pay and career
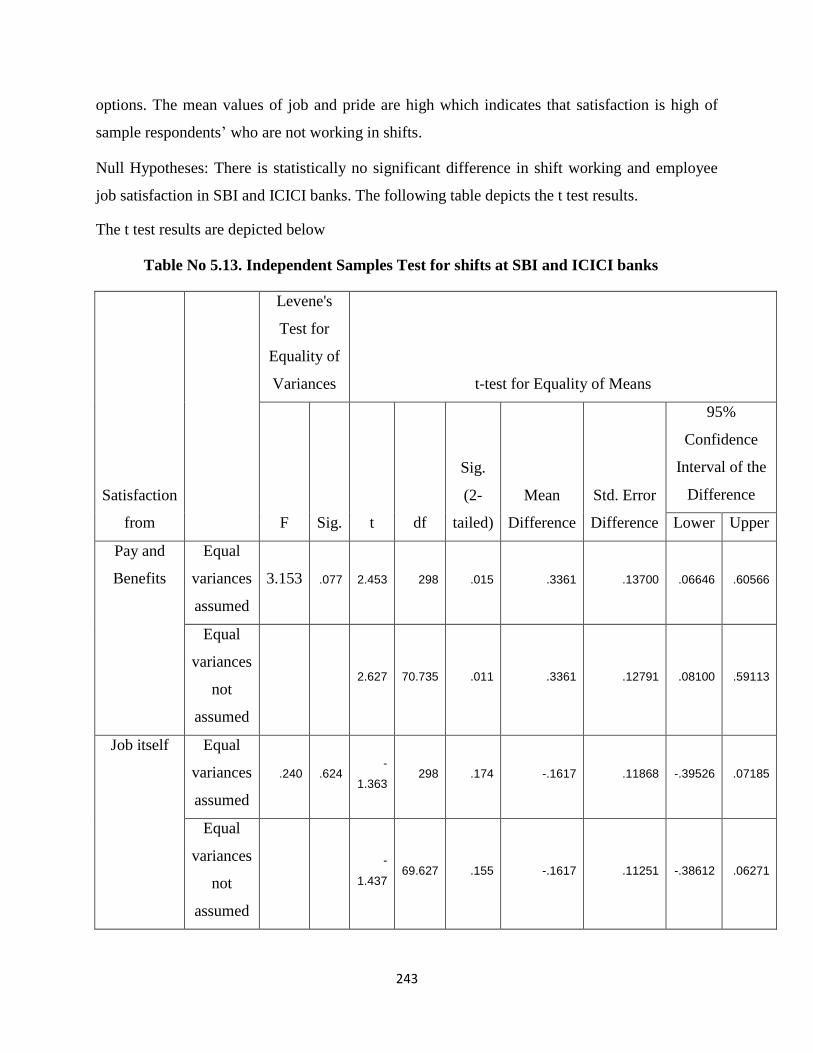
243
options. The mean values of job and pride are high which indicates that satisfaction is high of
sample respondents’ who are not working in shifts.
Null Hypotheses: There is statistically no significant difference in shift working and employee
job satisfaction in SBI and ICICI banks. The following table depicts the t test results.
The t test results are depicted below
Table No 5.13. Independent Samples Test for shifts at SBI and ICICI banks
Satisfaction
from
Levene's
Test for
Equality of
Variances t-test for Equality of Means
F Sig. t df
Sig.
(2-
tailed)
Mean
Difference
Std. Error
Difference
95%
Confidence
Interval of the
Difference
Lower Upper
Pay and
Benefits
Equal
variances
assumed
3.153 .077 2.453 298 .015 .3361 .13700 .06646 .60566
Equal
variances
not
assumed
2.627 70.735 .011 .3361 .12791 .08100 .59113
Job itself Equal
variances
assumed
.240 .624 -
1.363 298 .174 -.1617 .11868 -.39526 .07185
Equal
variances
not
assumed
-
1.437 69.627 .155 -.1617 .11251 -.38612 .06271
244
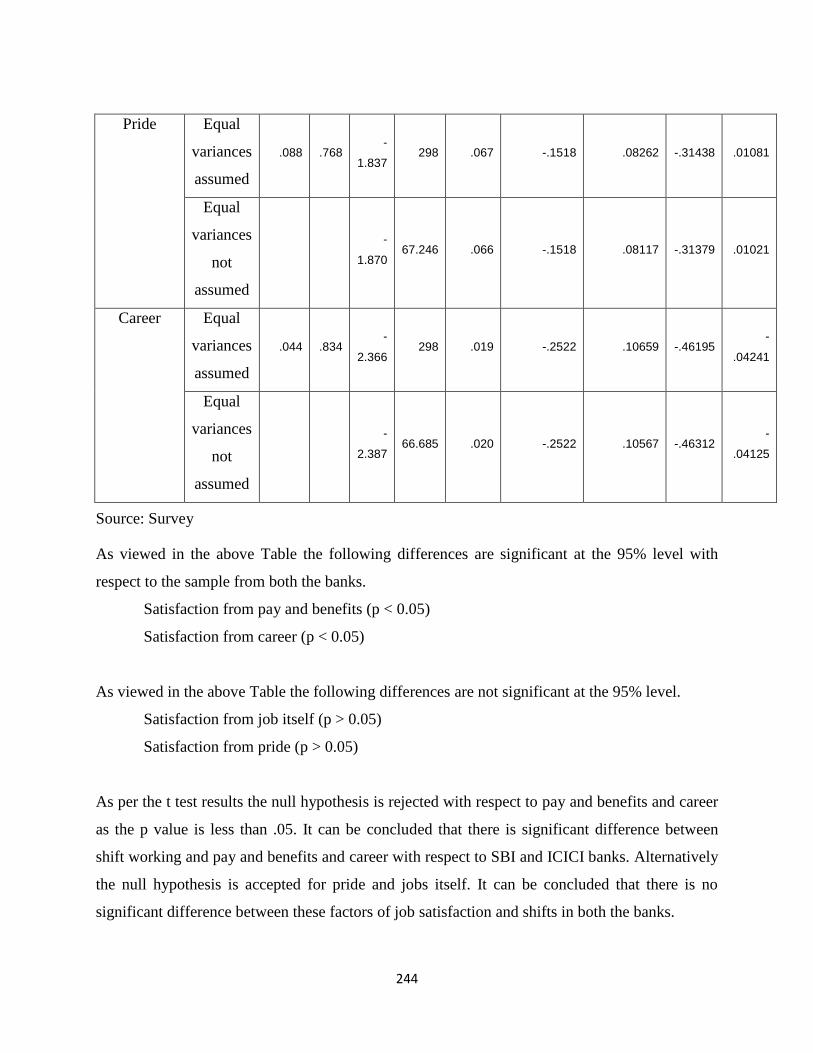
Pride Equal
variances
assumed
.088 .768 -
1.837 298 .067 -.1518 .08262 -.31438 .01081
Equal
variances
not
assumed
-
1.870 67.246 .066 -.1518 .08117 -.31379 .01021
Career Equal
variances
assumed
.044 .834 -
2.366 298 .019 -.2522 .10659 -.46195
-
.04241
Equal
variances
not
assumed
-
2.387 66.685 .020 -.2522 .10567 -.46312
-
.04125
Source: Survey
As viewed in the above Table the following differences are significant at the 95% level with
respect to the sample from both the banks.
Satisfaction from pay and benefits (p < 0.05)
Satisfaction from career (p < 0.05)
As viewed in the above Table the following differences are not significant at the 95% level.
Satisfaction from job itself (p > 0.05)
Satisfaction from pride (p > 0.05)
As per the t test results the null hypothesis is rejected with respect to pay and benefits and career
as the p value is less than .05. It can be concluded that there is significant difference between
shift working and pay and benefits and career with respect to SBI and ICICI banks. Alternatively
the null hypothesis is accepted for pride and jobs itself. It can be concluded that there is no
significant difference between these factors of job satisfaction and shifts in both the banks.
245
5.10. ANALYSIS OF VARIANCE (Anova)
Anova was employed to determine whether there is a difference in the job satisfaction factors
based on respondent’s profile (namely age, educational background, job experience, annual
salary, designation, working in shifts, working days and working hours).
5.11. Age and Job Satisfaction
One variable which is hypothesized to have a strong relationship to job satisfaction is age.
Herzberg et al. (1957) theorized that age has a curvilinear relationship to job satisfaction. As a
person begins a job, satisfaction is high. Satisfaction declines for several years, and then begins
to rise. This relationship is explained as follows: People receive frequent feedback and rewards
during years spent in formal schooling. After formal schooling is finished, a person enters work
with high expectations of frequent rewards. When these rewards occur less frequently than
expected, the worker becomes disenchanted and less satisfied with the job. Over time, the worker
accepts the lack of rewards as normal, lowers expectations, and becomes more satisfied.
Hulin (1963) found that job satisfaction and age are positively correlated. He disagreed with
Herzberg in that he found the relationship between age and job satisfaction to be linear rather
than curvilinear. Recent studies support the positive, linear relationship between age and
satisfaction.
In a study involving assistant principals in Ohio, Sutter (1994), using the long form of the MSQ,
found that age has a positive linear relationship to job satisfaction. Edison (1992) using the Job
Diagnostic Survey, The Self Efficacy Scale, and the Task Structure Scale surveyed two hundred
sixteen assistant principals in the Detroit School System. He reported that age is a significant
predictor of job satisfaction among assistant principals. Anderson (1982), utilizing a modified
version of the MSQ (Long Form), reported that age has a positive, linear relationship to job
satisfaction. As the age of assistant principals increases the job satisfaction of assistant principals
increases.
246
The above investigations have examined the relationship between age and job satisfaction as
positive linear, negative linear, U-shaped, inverted U-shaped or inverted J-shaped, or no
significant relations. Such conflicting results have left the true nature of the relationship
unresolved. Many studies have found different results in different groups on the relationship of
age to job satisfaction. There was higher intrinsic job satisfaction among older employees, but
lower financial and job status satisfaction among this group. However, different studies reveal
different impact of age related with job satisfaction. Few indicated that there is increase in the
level of satisfaction with age.
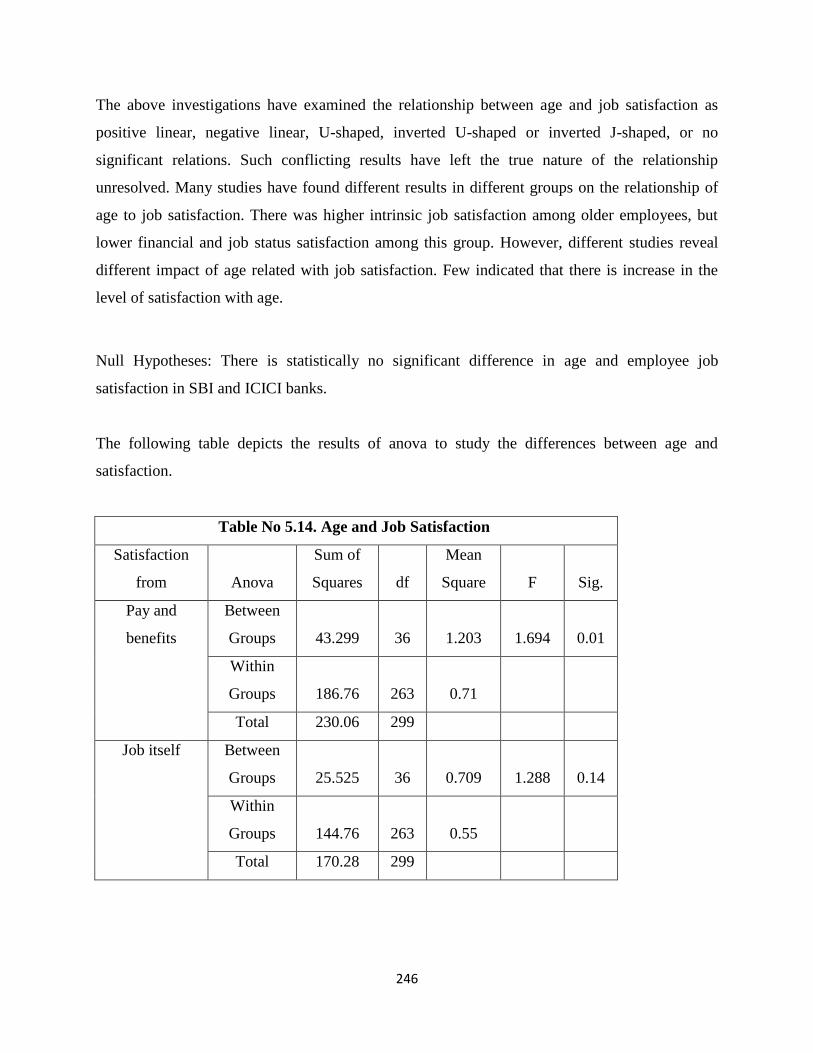
Null Hypotheses: There is statistically no significant difference in age and employee job
satisfaction in SBI and ICICI banks.
The following table depicts the results of anova to study the differences between age and
satisfaction.
Table No 5.14. Age and Job Satisfaction
Satisfaction
from Anova
Sum of
Squares df
Mean
Square F Sig.
Pay and
benefits
Between
Groups 43.299 36 1.203 1.694 0.01
Within
Groups 186.76 263 0.71
Total 230.06 299
Job itself Between
Groups 25.525 36 0.709 1.288 0.14
Within
Groups 144.76 263 0.55
Total 170.28 299
247
Pride Between
Groups 11.296 36 0.314 1.152 0.26
Within
Groups 71.651 263 0.272
Total 82.947 299
Career Between
Groups 29.182 36 0.811 1.94 0
Within
Groups 109.9 263 0.418
Total 139.08 299
Source: Survey
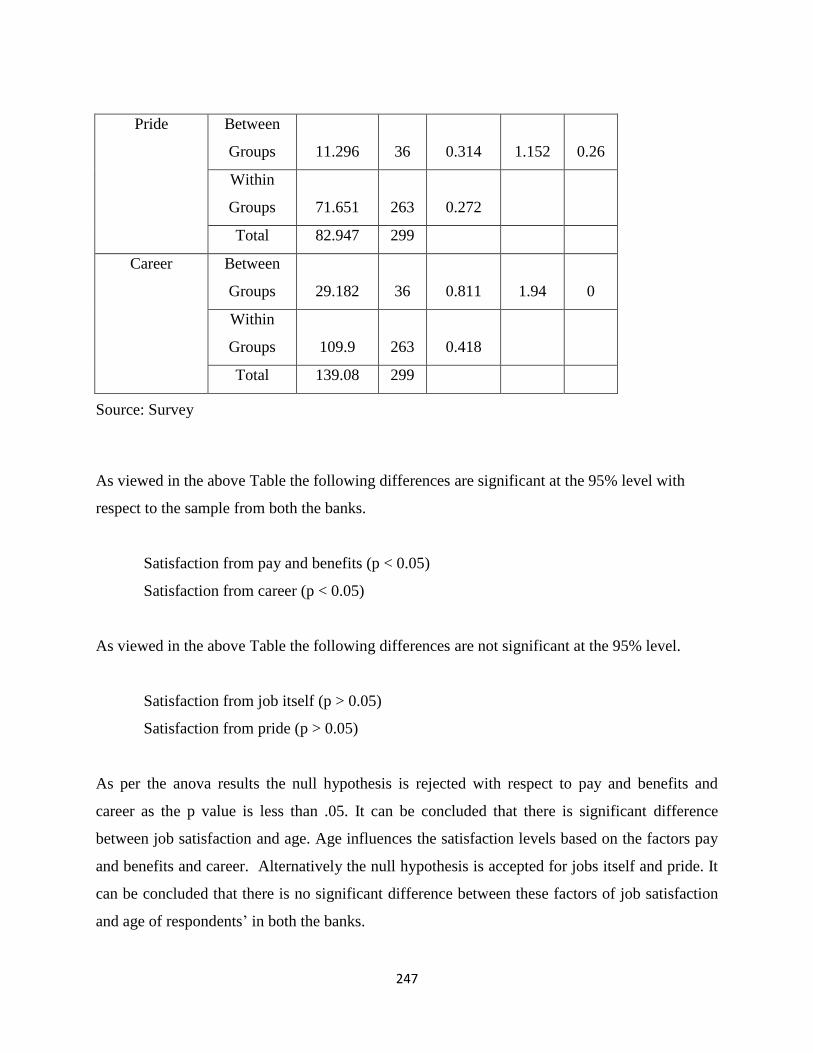
As viewed in the above Table the following differences are significant at the 95% level with
respect to the sample from both the banks.
Satisfaction from pay and benefits (p < 0.05)
Satisfaction from career (p < 0.05)
As viewed in the above Table the following differences are not significant at the 95% level.
Satisfaction from job itself (p > 0.05)
Satisfaction from pride (p > 0.05)
As per the anova results the null hypothesis is rejected with respect to pay and benefits and
career as the p value is less than .05. It can be concluded that there is significant difference
between job satisfaction and age. Age influences the satisfaction levels based on the factors pay
and benefits and career. Alternatively the null hypothesis is accepted for jobs itself and pride. It
can be concluded that there is no significant difference between these factors of job satisfaction
and age of respondents’ in both the banks.
248
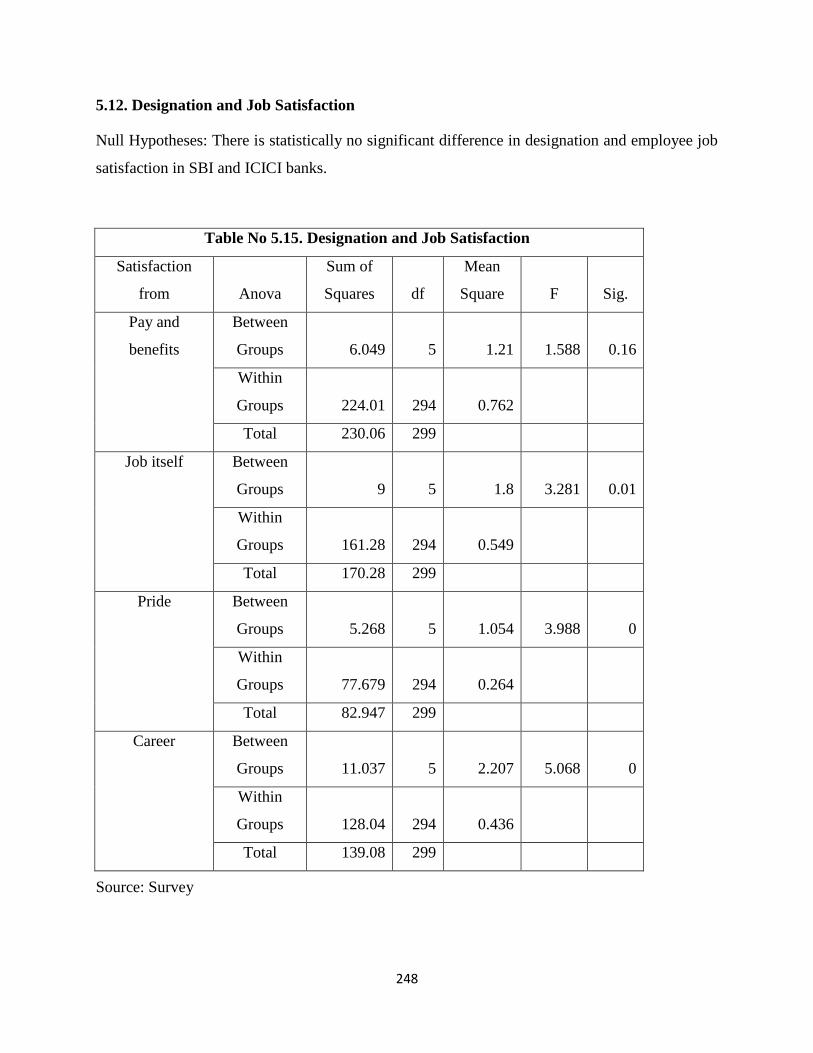
5.12. Designation and Job Satisfaction
Null Hypotheses: There is statistically no significant difference in designation and employee job
satisfaction in SBI and ICICI banks.
Table No 5.15. Designation and Job Satisfaction
Satisfaction
from Anova
Sum of
Squares df
Mean
Square F Sig.
Pay and
benefits
Between
Groups 6.049 5 1.21 1.588 0.16
Within
Groups 224.01 294 0.762
Total 230.06 299
Job itself Between
Groups 9 5 1.8 3.281 0.01
Within
Groups 161.28 294 0.549
Total 170.28 299
Pride Between
Groups 5.268 5 1.054 3.988 0
Within
Groups 77.679 294 0.264
Total 82.947 299
Career Between
Groups 11.037 5 2.207 5.068 0
Within
Groups 128.04 294 0.436
Total 139.08 299
Source: Survey
249
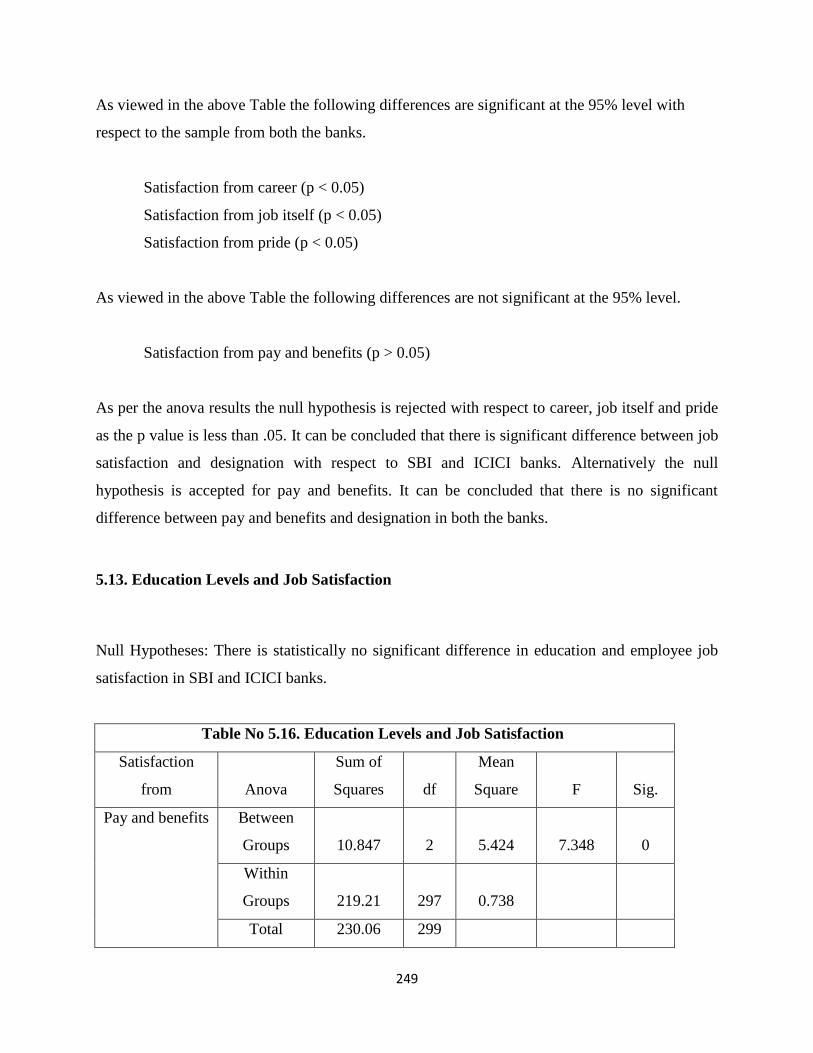
As viewed in the above Table the following differences are significant at the 95% level with
respect to the sample from both the banks.
Satisfaction from career (p < 0.05)
Satisfaction from job itself (p < 0.05)
Satisfaction from pride (p < 0.05)
As viewed in the above Table the following differences are not significant at the 95% level.
Satisfaction from pay and benefits (p > 0.05)
As per the anova results the null hypothesis is rejected with respect to career, job itself and pride
as the p value is less than .05. It can be concluded that there is significant difference between job
satisfaction and designation with respect to SBI and ICICI banks. Alternatively the null
hypothesis is accepted for pay and benefits. It can be concluded that there is no significant
difference between pay and benefits and designation in both the banks.
5.13. Education Levels and Job Satisfaction
Null Hypotheses: There is statistically no significant difference in education and employee job
satisfaction in SBI and ICICI banks.
Table No 5.16. Education Levels and Job Satisfaction
Satisfaction
from Anova
Sum of
Squares df
Mean
Square F Sig.
Pay and benefits Between
Groups 10.847 2 5.424 7.348 0
Within
Groups 219.21 297 0.738
Total 230.06 299
250
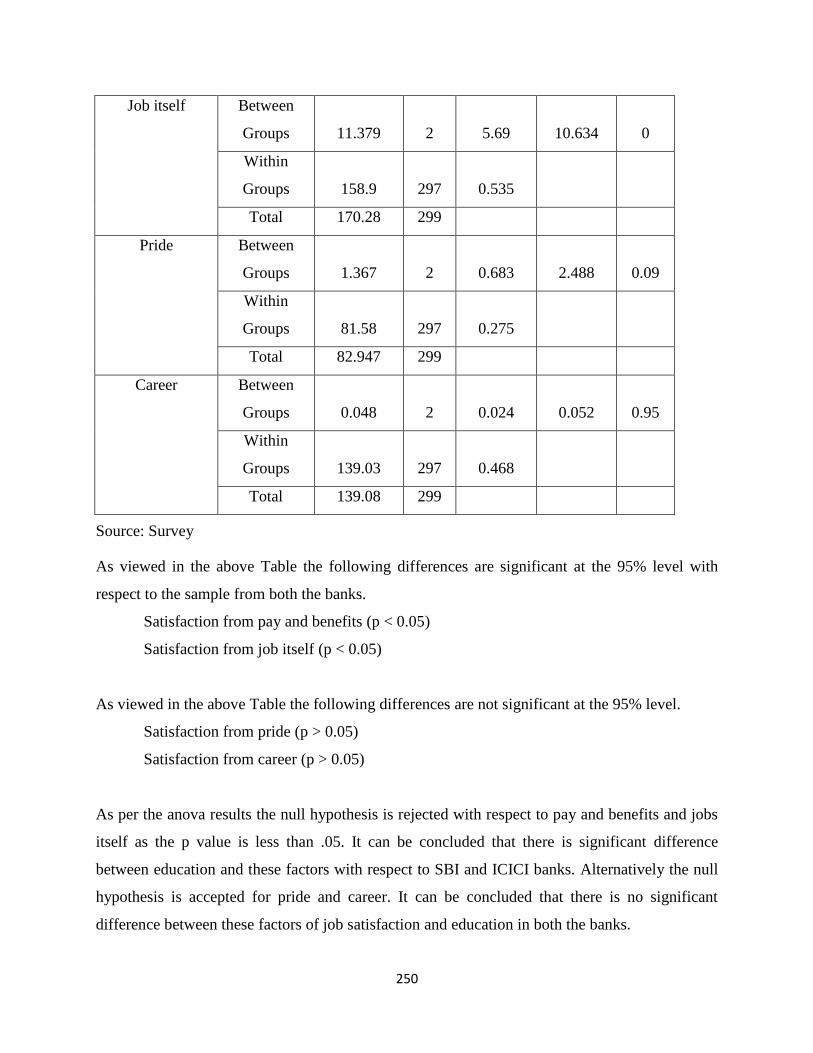
Job itself Between
Groups 11.379 2 5.69 10.634 0
Within
Groups 158.9 297 0.535
Total 170.28 299
Pride Between
Groups 1.367 2 0.683 2.488 0.09
Within
Groups 81.58 297 0.275
Total 82.947 299
Career Between
Groups 0.048 2 0.024 0.052 0.95
Within
Groups 139.03 297 0.468
Total 139.08 299
Source: Survey
As viewed in the above Table the following differences are significant at the 95% level with
respect to the sample from both the banks.
Satisfaction from pay and benefits (p < 0.05)
Satisfaction from job itself (p < 0.05)
As viewed in the above Table the following differences are not significant at the 95% level.
Satisfaction from pride (p > 0.05)
Satisfaction from career (p > 0.05)
As per the anova results the null hypothesis is rejected with respect to pay and benefits and jobs
itself as the p value is less than .05. It can be concluded that there is significant difference
between education and these factors with respect to SBI and ICICI banks. Alternatively the null
hypothesis is accepted for pride and career. It can be concluded that there is no significant
difference between these factors of job satisfaction and education in both the banks.
251
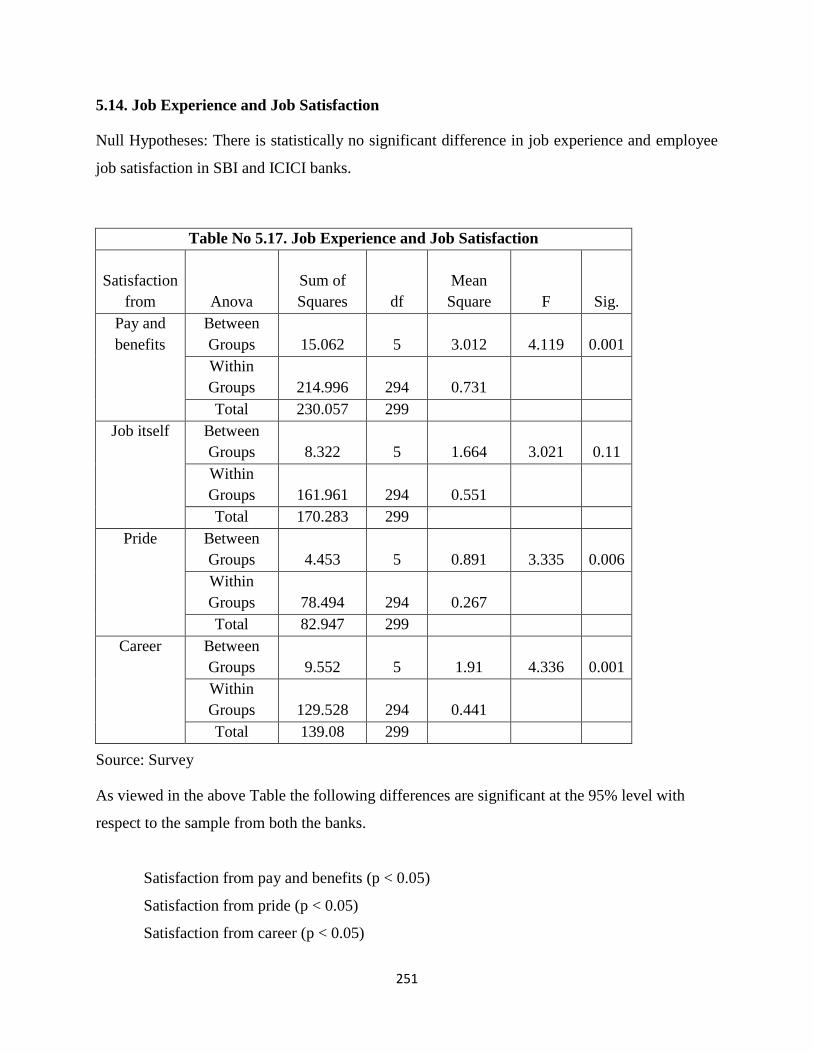
5.14. Job Experience and Job Satisfaction
Null Hypotheses: There is statistically no significant difference in job experience and employee
job satisfaction in SBI and ICICI banks.
Table No 5.17. Job Experience and Job Satisfaction
Satisfaction
from Anova
Sum of
Squares df
Mean
Square F Sig.
Pay and
benefits
Between
Groups 15.062 5 3.012 4.119 0.001
Within
Groups 214.996 294 0.731
Total 230.057 299
Job itself Between
Groups 8.322 5 1.664 3.021 0.11
Within
Groups 161.961 294 0.551
Total 170.283 299
Pride Between
Groups 4.453 5 0.891 3.335 0.006
Within
Groups 78.494 294 0.267
Total 82.947 299
Career Between
Groups 9.552 5 1.91 4.336 0.001
Within
Groups 129.528 294 0.441
Total 139.08 299
Source: Survey
As viewed in the above Table the following differences are significant at the 95% level with
respect to the sample from both the banks.
Satisfaction from pay and benefits (p < 0.05)
Satisfaction from pride (p < 0.05)
Satisfaction from career (p < 0.05)
252
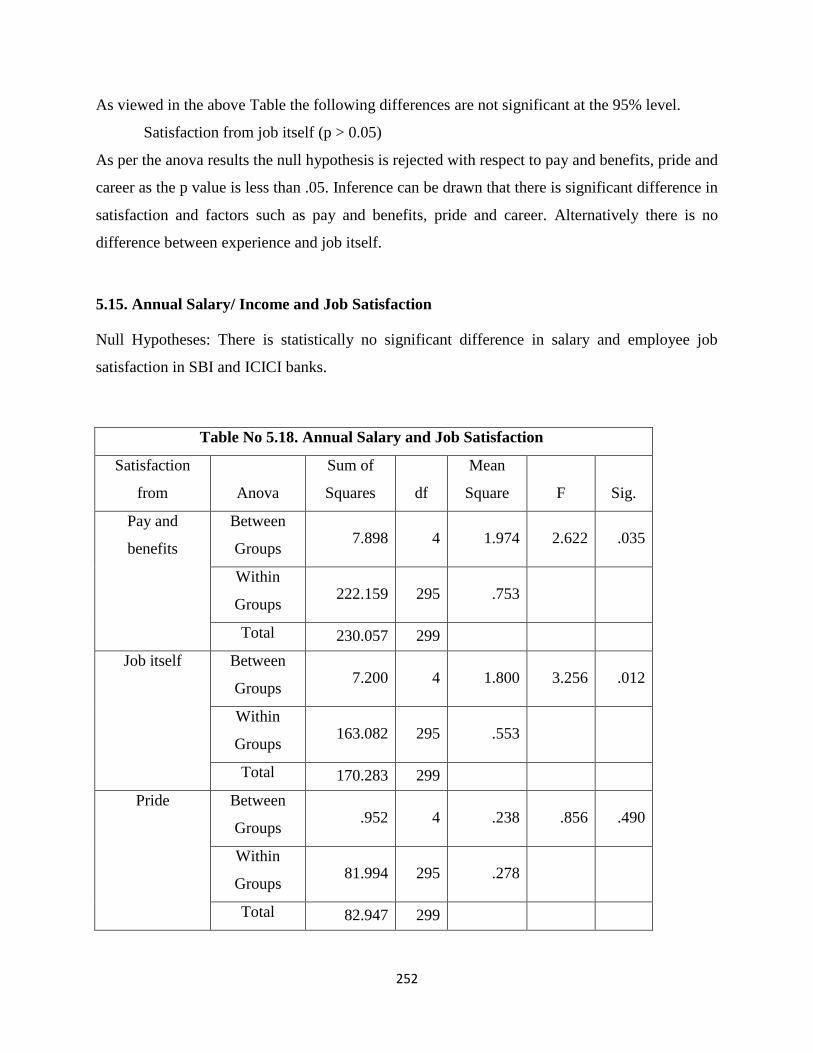
As viewed in the above Table the following differences are not significant at the 95% level.
Satisfaction from job itself (p > 0.05)
As per the anova results the null hypothesis is rejected with respect to pay and benefits, pride and
career as the p value is less than .05. Inference can be drawn that there is significant difference in
satisfaction and factors such as pay and benefits, pride and career. Alternatively there is no
difference between experience and job itself.
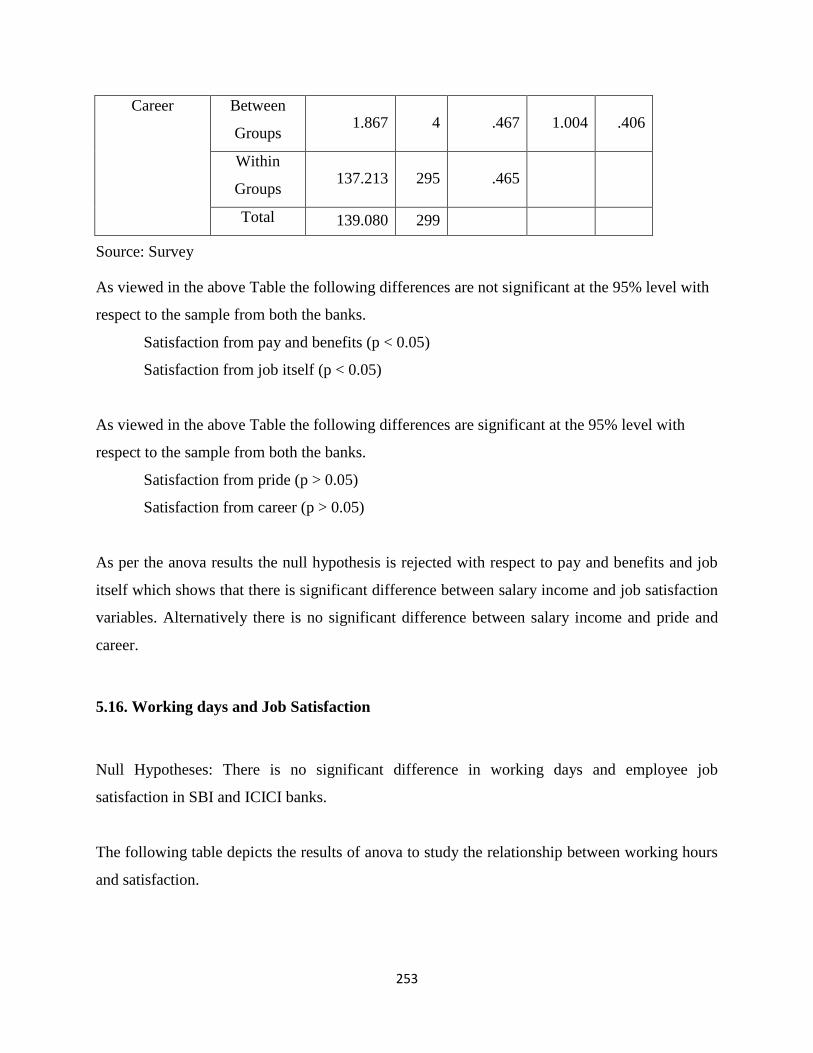
5.15. Annual Salary/ Income and Job Satisfaction
Null Hypotheses: There is statistically no significant difference in salary and employee job
satisfaction in SBI and ICICI banks.
Table No 5.18. Annual Salary and Job Satisfaction
Satisfaction
from Anova
Sum of
Squares df
Mean
Square F Sig.
Pay and
benefits
Between
Groups 7.898 4 1.974 2.622 .035
Within
Groups 222.159 295 .753
Total 230.057 299
Job itself Between
Groups 7.200 4 1.800 3.256 .012
Within
Groups 163.082 295 .553
Total 170.283 299
Pride Between
Groups .952 4 .238 .856 .490
Within
Groups 81.994 295 .278
Total 82.947 299
253
Career Between
Groups 1.867 4 .467 1.004 .406
Within
Groups 137.213 295 .465
Total 139.080 299
Source: Survey
As viewed in the above Table the following differences are not significant at the 95% level with
respect to the sample from both the banks.
Satisfaction from pay and benefits (p < 0.05)
Satisfaction from job itself (p < 0.05)
As viewed in the above Table the following differences are significant at the 95% level with
respect to the sample from both the banks.
Satisfaction from pride (p > 0.05)
Satisfaction from career (p > 0.05)
As per the anova results the null hypothesis is rejected with respect to pay and benefits and job
itself which shows that there is significant difference between salary income and job satisfaction
variables. Alternatively there is no significant difference between salary income and pride and
career.
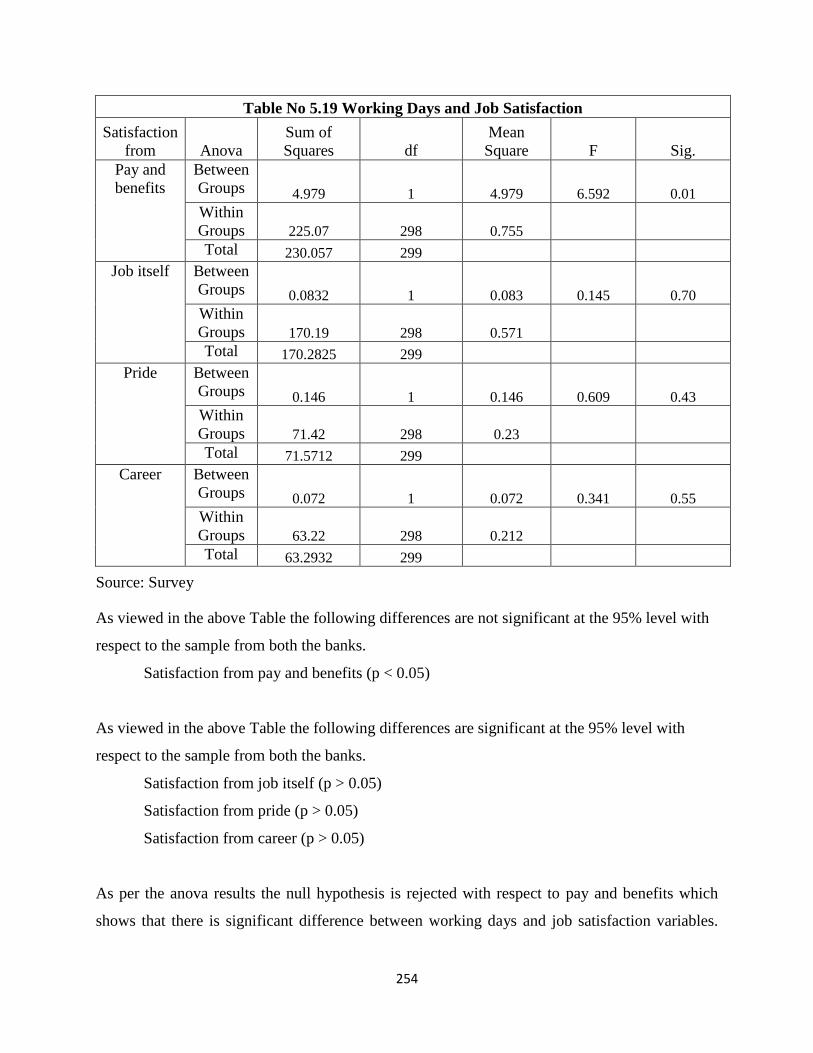
5.16. Working days and Job Satisfaction
Null Hypotheses: There is no significant difference in working days and employee job
satisfaction in SBI and ICICI banks.
The following table depicts the results of anova to study the relationship between working hours
and satisfaction.
254
Table No 5.19 Working Days and Job Satisfaction
Satisfaction
from Anova
Sum of
Squares df
Mean
Square F Sig.
Pay and
benefits
Between
Groups 4.979 1 4.979 6.592 0.01
Within
Groups 225.07 298 0.755
Total 230.057 299
Job itself Between
Groups 0.0832 1 0.083 0.145 0.70
Within
Groups 170.19 298 0.571
Total 170.2825 299
Pride Between
Groups 0.146 1 0.146 0.609 0.43
Within
Groups 71.42 298 0.23
Total 71.5712 299
Career Between
Groups 0.072 1 0.072 0.341 0.55
Within
Groups 63.22 298 0.212
Total 63.2932 299
Source: Survey
As viewed in the above Table the following differences are not significant at the 95% level with
respect to the sample from both the banks.
Satisfaction from pay and benefits (p < 0.05)
As viewed in the above Table the following differences are significant at the 95% level with
respect to the sample from both the banks.
Satisfaction from job itself (p > 0.05)
Satisfaction from pride (p > 0.05)
Satisfaction from career (p > 0.05)
As per the anova results the null hypothesis is rejected with respect to pay and benefits which
shows that there is significant difference between working days and job satisfaction variables.
255
Alternatively there is no significant difference between working days and job itself, pride and
career.
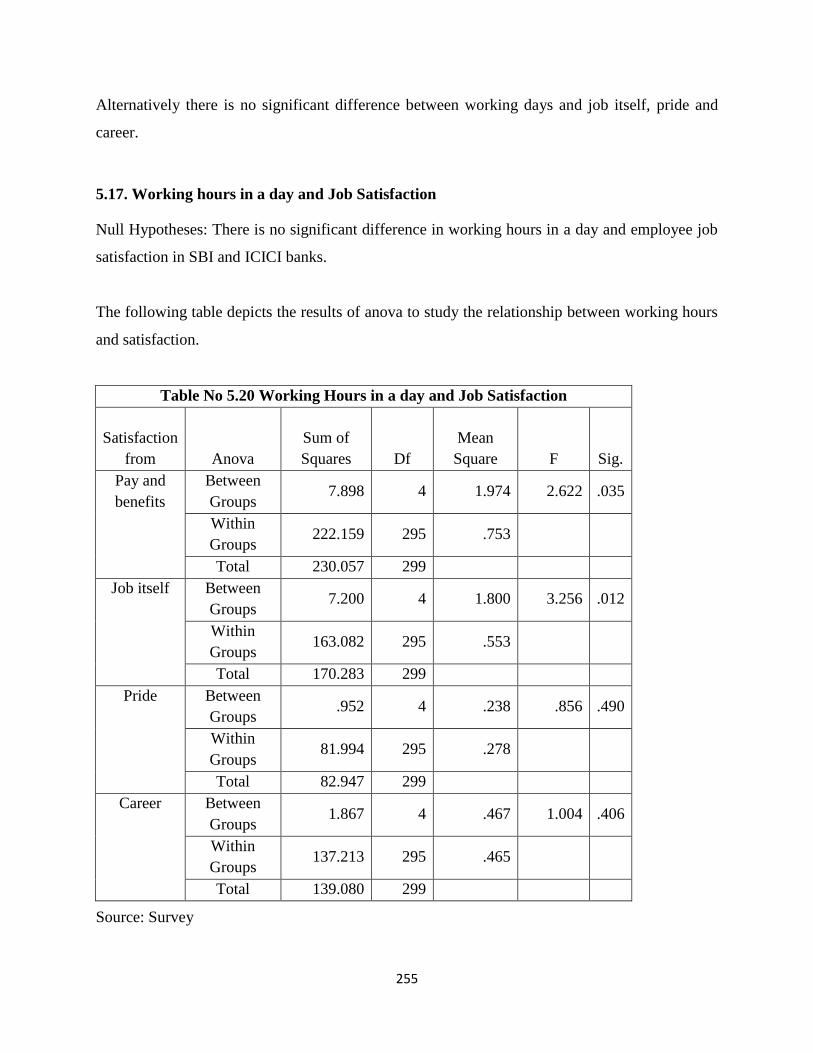
5.17. Working hours in a day and Job Satisfaction
Null Hypotheses: There is no significant difference in working hours in a day and employee job
satisfaction in SBI and ICICI banks.
The following table depicts the results of anova to study the relationship between working hours
and satisfaction.
Table No 5.20 Working Hours in a day and Job Satisfaction
Satisfaction
from Anova
Sum of
Squares Df
Mean
Square F Sig.
Pay and
benefits
Between
Groups 7.898 4 1.974 2.622 .035
Within
Groups 222.159 295 .753
Total 230.057 299
Job itself Between
Groups 7.200 4 1.800 3.256 .012
Within
Groups 163.082 295 .553
Total 170.283 299
Pride Between
Groups .952 4 .238 .856 .490
Within
Groups 81.994 295 .278
Total 82.947 299
Career Between
Groups 1.867 4 .467 1.004 .406
Within
Groups 137.213 295 .465
Total 139.080 299
Source: Survey
256
As viewed in the above Table the following differences are significant at the 95% level with
respect to the sample from both the banks.
Satisfaction from pay and benefits (p < 0.05)
Satisfaction from job itself (p < 0.05)
As viewed in the above Table the following differences are not significant at the 95% level with
respect to the sample from both the banks.
Satisfaction from pride (p > 0.05)
Satisfaction from career (p > 0.05)
As per the anova results the null hypothesis is rejected with respect to pay and benefits and job
itself which shows that there is significant difference between working hours and job satisfaction
factors. Alternatively the null hypothesis is accepted for pride and career. Inference can be drawn
that there is statistically no significant difference between working hours and pride and career.
5.18. Motivation and Job Satisfaction
The earlier parts of the study focused to show the variations between motivation and
respondent’s profile, job satisfaction and profile of the respondents, now it is proposed to study
the relationship between motivation and job satisfaction of the employees’. There has been a lot
of study in the area of ‘Motivation and Job Satisfaction’ still it remains unexplored to some
extent and yet a general understanding has not been developed when it comes to studies
conducted at different times and in different work environment.
Motivation is the key to organizational effectiveness and is a predictor for performance and job
satisfaction. The gurus of workplace motivation vouch for motivators beyond money; money is
not what makes the world go. It is the realization of personal need satisfaction. Man works to
satisfy his needs and he wants the needs to be recognized and satisfied. All employers want their
people to perform to the best of their abilities and they take great pains in ensuring that they can
provide all the necessary resources and a good working environment in order to keep their
employees’ motivated. Yet motivation remains a difficult factor to manage because employee’s
aspirations and targets do not always match with what their employers can provide.
257
People do not change changing places; they remain same individuals whether at work place or at
home. So understanding individual person related needs can give better insight to managing
human motivation. Job satisfaction and motivation reinforce each other, strengthen each other
and promote each other. If the employee is satisfied on job performance he tends to be motivated
and vice-versa. Frankl (1984) suggests that motivation reflects people’s search for meaning and
that job satisfaction may reflect the degree to which people have found meaning in their work.
Sylvia and Hutchinson (1985) view that true job satisfaction is derived from the gratification of
higher- order needs i.e. social relations, esteem, and self actualization rather than lower- order
needs.
Review of a number of studies on motivation, concluded that for supervisors and middle- level
managers, promotion is an important incentive as well as a dissatisfier. Recognition is another
job factor causing both satisfaction and dissatisfaction. Reasons which contribute to
dissatisfaction are lack of adequate organizational policy and administration, lack of technically
competent and sympathetic supervision, unfriendliness of superior and lack of opportunity for
growth. First line supervisors value income, promotion, job security and working conditions
most. Middle level managers value advancement, type of work and earnings. Senior managers,
on the other hand value feeling of worthwhile accomplishment, recognition of good work done
and decision making authority.
Motivators, or satisfiers, are those factors that cause feelings of satisfaction at work. These
factors motivate by changing the nature of the work. They challenge a person to develop their
talents and fulfill their potential. Motivators are those that come from intrinsic feelings. In
addition to responsibility and learning opportunities also recognition, achievement, advancement
and growth are motivating factors. These factors don’t dissatisfy if they are not present but by
giving value to these, satisfaction levels of the employees will increase.
According to Bogardus (2007) when hygiene factors are maintained, dissatisfaction can be
avoided. When these are not maintained, dissatisfaction is most probable to occur and motivation
can’t take place. Hygiene factors, or dissatisfiers, are those that the employee expects to be in
good condition. As motivators are those if present cause satisfaction, hygiene factors are those
258
that don’t cause satisfaction but if they are lacking, it causes job dissatisfaction. Salaries or
wages must be equivalent to those salaries that other people in the same industry or geographical
area get. The status of the person must be recognized and maintained. Employees must feel that
their job is as secure as it is possible in the current economical situation. The working conditions
should be clean, sufficiently lit and safe in other way. Sufficient amount of fringe benefits like
health, pension and child care must be provided and compensation in general equivalent to the
amount of work done. Policies and administrative practices such as flex hours, dress code,
vacation schedules and other scheduling affect workers and should be run efficiently. These
factors relate to the content of the work and if they are in proper form, it tends to eliminate job
dissatisfaction Ellis (2005).
Crites (1985) has aptly distinguished between job satisfaction and job attitudes. He observes that
if the specific aspects of the job such as duties and tasks or working conditions are specified then
the concept which is defined would be job attitudes. If it is the overall job in which the individual
is presently employed, then the concept would be job satisfaction. According to Keith Davis
(1996) job satisfaction is a set of favorable or unfavorable feelings and emotions with which
employees view their work. It is an affective attitude a feeling of relative like or dislike towards
something. Cook et al (1981) examined the relationship of organizational learning culture, job
satisfaction, and organizational outcome variables with a sample of information technology (IT)
employees in the United States. It is found that learning organizational culture is associated with
IT employee job satisfaction and motivation to transfer learning. Turnover intention was found to
be negatively influenced by organizational learning culture and job satisfaction.
According to research done by Ilies et al (2004) on job satisfaction, people who tend to be
positive and cheerful most of the time do indeed tend to express higher job Satisfaction than ones
who tend to be down and gloomy. They also added that job satisfaction depends primarily on the
match between the outcomes individuals’ value in their jobs and their perceptions about the
availability of such outcomes especially for those facets of the job that are highly valued.
Boudreau et al (2001) have given the concept of ‘Honeymoon Effect’ and ‘Hangover Effect’ in
relation to Job Satisfaction. According to them, Honeymoon effect is the tendency to enjoy high
level of satisfaction on new jobs that they have taken in response to dissatisfaction with their old
259
jobs, while hangover effect is the tendency for people’s level of satisfaction to drop over time
from when a position is brand new to when one gains more experience with it.
Moynihan and Pandey (2007) examined the effects of individual attributes, job characteristics,
and organizational variables on three aspects of work motivation: job satisfaction, organizational
commitment, and job involvement. They found that managers have varying degrees of influence
over these different aspects of work motivation, with greatest influence over job satisfaction and
least influence over job involvement. A number of variables are important for work motivation,
including public service motivation, advancement opportunities, role clarity, and group culture.
Motivation basically has two dimensions one being making employees work better, more
efficiently and effectively and the other being in the view of managers, enabling employees to do
their jobs in the best way with enjoyment and desire. In fact, there are ways of increasing
employees’ work motivation and satisfaction other than monetary tools Moncrief (2010).
Yasemin Oraman (2011) worked to evaluate the effective dynamics of work motivation and job
satisfaction of textile employees. He analyzed the effectiveness of psycho-social, economic,
organizational and managerial tools over individuals’ motivation. He came out with the
conclusions that economic tools are positively and significantly related to the level of motivation.
5.19. Motivation and Job Satisfaction of the respondents
In the present study, Motivation has been treated as an independent and Job Satisfaction as
dependent variable. The objective is to examine the relationship between the perceived
motivation and employee perceived satisfaction in SBI and ICICI Banks. To study the nature of
relationship correlation has been adopted. As the coefficient of correlation tells only that there is
a relationship between the two variables but it does not clarify the kind of relationship existing
between the two variables. Therefore, regression analysis was carried out to examine the kind of
relationship existing between Motivation and Job Satisfaction.
Hypothesis: There is no relationship between perceived motivation and perceived job
satisfaction of employees working at SBI and ICICI banks.
260
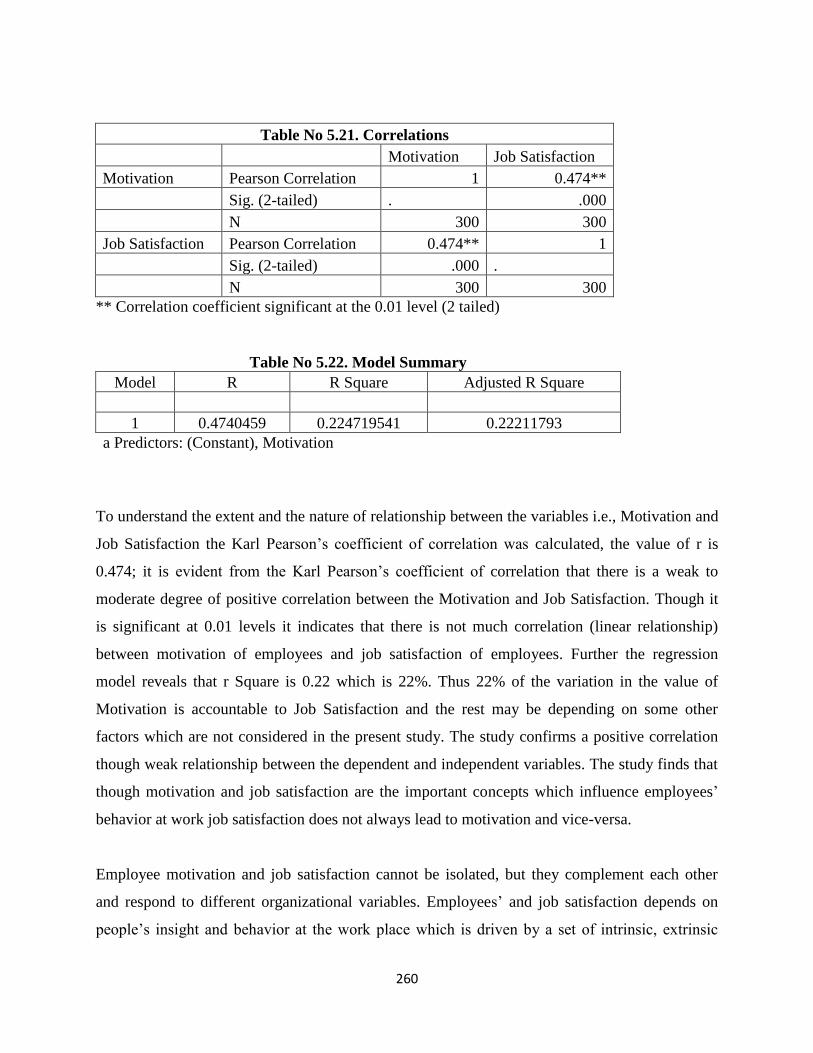
Table No 5.21. Correlations
Motivation Job Satisfaction
Motivation Pearson Correlation 1 0.474**
Sig. (2-tailed) . .000
N 300 300
Job Satisfaction Pearson Correlation 0.474** 1
Sig. (2-tailed) .000 .
N 300 300
** Correlation coefficient significant at the 0.01 level (2 tailed)
Table No 5.22. Model Summary
Model R R Square Adjusted R Square
1 0.4740459 0.224719541 0.22211793
a Predictors: (Constant), Motivation
To understand the extent and the nature of relationship between the variables i.e., Motivation and
Job Satisfaction the Karl Pearson’s coefficient of correlation was calculated, the value of r is
0.474; it is evident from the Karl Pearson’s coefficient of correlation that there is a weak to
moderate degree of positive correlation between the Motivation and Job Satisfaction. Though it
is significant at 0.01 levels it indicates that there is not much correlation (linear relationship)
between motivation of employees and job satisfaction of employees. Further the regression
model reveals that r Square is 0.22 which is 22%. Thus 22% of the variation in the value of
Motivation is accountable to Job Satisfaction and the rest may be depending on some other
factors which are not considered in the present study. The study confirms a positive correlation
though weak relationship between the dependent and independent variables. The study finds that
though motivation and job satisfaction are the important concepts which influence employees’
behavior at work job satisfaction does not always lead to motivation and vice-versa.
Employee motivation and job satisfaction cannot be isolated, but they complement each other
and respond to different organizational variables. Employees’ and job satisfaction depends on
people’s insight and behavior at the work place which is driven by a set of intrinsic, extrinsic
261
needs and by their view of numerous job-related and organization related attitudes. Literature
review finds that the relation between motivation and job satisfaction exists but the results are
not significant for all the studies. Khalid and Irshad (2010), in their comparative study of job
satisfaction in public and private sector banks concluded that the relationship between dependent
and independent variables is causal as the regression value r is 0.38. (38%)
Saleem, Mahamood and Asif (2010), in their study effect of work motivation on job satisfaction
in telecommunication services concluded that there was a positive relationship between the
motivation and job satisfaction and overall the employees were quiet satisfied with their jobs and
had their interest in their job. The conclusions were arrived though the p-value is less than 0.05
(0.042) and the value of R square is too low (0.069) the value of beta (0.264) which is showing
the positive relationship between the dependent and independent variables but not a strong
relationship.
According to the results of a study there is a positive relationship between work motivation and
job satisfaction though r value is less (r=.563). These findings are consistent with previous
researches such as Brown and Shepherd (1997) who reported that motivation improves workers’
performance and job satisfaction. The result also agrees with Vinokur et al (1994), who reported
that certain motivational factors contribute to the prediction of job satisfaction. Results suggest
that managers feel motivated by a good work environment, colleagues, interesting assignments,
feedback as well as compensation as money can satisfy basic needs such as food and security but
also more sophisticated needs such as the need for recognition and influence Locke (1999).
Therefore, financial compensation is assumed to play a significant part when people choose jobs,
stay in jobs and are motivated in jobs. The possible explanations of these findings are when the
managers basic and higher order needs are fulfilled at work, the employee will have a positive
attitude towards job that will eventually lead to job satisfaction.
Most of experts consider that the issue of motivation is essential for human activity and also for
understanding and explaining behaviour and especially organizational behaviour. Therefore, this
issue is frequently addressed. Due to the complexity of the phenomenon, some aspects cannot be
captured or explained exactly. Employees are always the vital resource of the organization and at
262
times, they are often neglected at their jobs which lead to their failure to perform. Thus the
organizations need to understand what motivates people and how they get satisfied from their job
that leads to organizational performance. Based on the above contributions on motivation and
job satisfaction and highlighting the results of the study it can be concluded that motivation and
job satisfaction are positively related but the relationship varies significantly depending upon
number of factors.
Summary
Job Satisfaction is the buzz word in today’s corporate era. Since the transformation of personnel
into HR, and its inception in the industry new concepts related to human capital has been
emerging day by day. A decade ago this concept was not practiced or applied and the employees
were very loyal to their organizations and used to start and end their career in the same
organizations. Apart from the bread and butter the organization used to act as their sanctuary and
no one was much concerned about the job itself or job satisfaction. Over the period of time
employees have witnessed several eras in modern business history and the concept of treating
humans as assets of the organization has flourished and has done wonders around the world in
terms of growth of companies.
The concept of job satisfaction has emerged and now there are several factors contributing to it
which are monetary and non-monetary. Job satisfaction is the favorableness or un-favorableness
with which employees view their work and it is affected by both the internal and external
environment of the organization. Job design affect the job satisfaction, as jobs that are rich in
behavioral elements such as variety autonomy, task unimportance and feedback contribute to
employee’s satisfaction. Job satisfaction links closely to work motivation. It may be viewed, at
one level, as an outcome of being able to succeed in acting in accordance with one’s motivation.
In this sense, satisfaction arises not from performance of the job per se, but from the ability to
have a need or motive satisfied. It is assumed that high levels of motivation will have both
psychological and behavioral consequences: the psychological consequences include job
satisfaction and organizational commitment; whereas the behavioral effects include higher
output, lower absenteeism and lower likelihood of leaving the job.
263
The paradigm of the banking sector changed with the emergence of plastic money and online
transfers etc. Thus the technological pay and breakthroughs affected the banking sector and
numerous career opportunities were created in this sector in all disciplines. The paradigm shifted
from a financial sector to a services sector where providing quality service to the customer
became the ultimate goal of the bank. Due to heavy inflow of multinational banks, a new culture
in the banking sector is emerged which is based on performance, rewards and compensations.
This has brought higher employment opportunities, increases in income level, and changes in
consumption pattern and consequently there emerges a competitive environment in the industry.
To study the job satisfaction of the respondent’s factor analysis is adopted. Factor analysis is a
statistical method used to describe variability among observed. Factor analysis searches for such
joint variations in response to unobserved latent variables. The job satisfaction as per factor
analysis comprises of four factors, salary satisfaction, fringe benefits, working climate and
satisfied with current job. When the employees are satisfied with salary, fringe benefits and work
environment, logically they will be satisfied with the current job. Accordingly the variable is
labeled as satisfaction from pay and benefits. Component 2 comprises of four factors namely, job
content, social status, help customers, and satisfy customer needs. Accordingly the variable is
labeled satisfaction from the job itself. Component 3 comprises of five factors, self actualized,
job security, dignity and respect, satisfied with colleagues and sense of achievement.
Accordingly the variables are labeled as satisfaction and pride. Component 4 comprises of five
factors, promotion opportunities, career development, recognition by boss, satisfied with the boss
and choice to leave. The factor choice to leave is reverse scored due to its polarity. Accordingly
the variable is labeled as satisfaction from career.
The respondent’s profile of both SBI and ICICI are compared with the application of t test
(namely banks, gender, job security and shifts). Anova was employed to determine whether there
is a difference in the job satisfaction factors based on respondent’s profile (namely age,
educational background, job experience, annual salary, designation, working in shifts, working
days and working hours).
264
The study finds from the t test results that, the null hypothesis is rejected and there is significant
difference between job satisfaction and pay and benefits, pride and career in SBI and ICICI
banks. The study also finds that there is significant difference between gender, job satisfaction
and pride and career. Similarly there is significant difference between job satisfaction, Security
and pay and benefits and career with respect to SBI and ICICI banks. The null hypothesis is also
rejected and concluded that there is significant difference between job satisfaction, shifts and
career. Alternatively the null hypothesis is accepted and there is no significant difference
between job itself and satisfaction in SBI and ICICI banks. There is no significant difference
between gender, satisfaction and pay and benefits and job itself. Similarly there is no difference
between job satisfaction, security and pride and job itself.
The anova results show that the null hypothesis is rejected with respect to age and pay and
benefits and career, which shows that there is significant difference between job satisfaction and
age. The study also draws the conclusion that there is significant difference between job
satisfaction, education and pay and benefits and jobs itself. The findings of the study depict that
the null hypothesis is rejected with respect to pay and benefits, pride and career. It indicates that
and there is difference between experience and job satisfaction. As per the anova results the null
hypothesis is rejected with respect to salary income and job itself which shows that there is
significant difference between salary income and job satisfaction variables. There is significant
difference between working days and benefits.
Alternatively the findings depict that there is no difference between job satisfaction, age and jobs
itself and pride. There is also no difference between pride and career and educational background
of respondents as well as experience and job itself. Income levels and benefits, pride and career
are independent which draws conclusion that there is no difference between these variables. The
study finds that there is no significant difference between working days and job itelf, pride and
career.
Employee motivation is an innate force shaped and maintained by a set of highly individualistic
factors that may change from time to time, depending on the particular needs and motives of an
employee. Findings show that the factors that motivate employees are the same ones that
265
contribute towards their satisfaction in the workplace and subsequently conclude that motivated
employees are generally also satisfied with their work. The study finds that there is a weak
positive relationship between motivation and job satisfaction of employees of SBI and ICICI
banks.
266
REFERENCES
Anderson, W. T. (1982). Job satisfaction among school psychologists. Unpublished
doctoral dissertation, Virginia Polytechnic Institute and State University, Blacksburg,
VA.
Arches, J. (1991) Social structure, burnout, and job satisfaction. Social work, 36, pp.193-
272.
Bogardus, Anne M. (2007). PHR/SPHR: Professional in Human Resources certification
study guide. Indianapolis. Wiley Publishing, Inc.
Boudreau, J. W., Boswell, W. R., Judge, T. A., & Bretz, R. D. Jr. (2001). Personality and
cognitive ability and predictors of job search among employed managers. Personnel
Psychology, 54, 25-50.
Brown, J. & Sheppard, B. (1997). Teacher librarians in learning organizations. Paper
Presented at the Annual Conference of the International Association of School
Librarianship, Canada. Au.
Cook, John D., Susan J. Hepworth, Toby D. Wall, and Peter B. Warr. (1981). The
experience of work. London: Academic Press.
Crites, J. 0. (1985). [Review of the Job Descriptive Index]. In J. V. Mitchell (Ed.), The
ninth mental measurements yearbook (pp. 753-754). Lincoln, NE: Buros Institute.
Edison, E. L. (1992). Career assistant principals: Job satisfaction, self efficacy, and
perceptions of task structure. An unpublished doctoral dissertation, Wayne State
University, Detroit, MI.
Ellis.W.Carol (2005). Management skills for new managers. USA. AMACOM.
267
Foster, J. J. (2000) Motivation in the workplace. In Chmiel, N. (Ed.), Introduction towork
and organizational psychology: a European perspective (pp.302-326). Oxford: Blackwell
Publishers Inc.
Frankl, V. (1984), .Man.s Search for Meaning (3rd edition, translated)., New York:
Simon & Schuster.
Heneman, H. G., Schwab, P. P., Fossum, J. A. and Dyer, L. D. (1989) Personnel/Human
Resource Management. Homewood: IRWIN.
Herzberg, F., Mausner, B., Peterson, R. O., & Capwell, D. F. (1957). Job attitudes:
Review of research and opinion. Pittsburgh, PA: Psychological Service of Pittsburgh.
Herzberg, F., Mausner, B., Peterson, R. O., & Capwell, D. F. (1957). Job attitudes:
Review of research and opinion. Pittsburgh, PA: Psychological Service of Pittsburgh.
Hulin, C. L. (1963). A linear model of job satisfaction. Authorized facsimile of an
unpublished doctoral dissertation (Cornell University, Ithaca, NY,1963) Ann Arbor, MI:
University Microfilms Limited.
Ilies R. And Judge T.A (2004). On the heritability of Job Satisfaction: the mediating role
of personality Journal of applied psychology, 88, 750-759.
Keith Davis and J.W.Newstrom (1996), Organisational Behaviour; Human Behaviour at
work, Tata Mc Graw Hill Publishing company Limited, New Delhi 9th edition.
Kerr, B. A. (1985) Review of The Job Descriptive Index. In Mitchell, J. V. (Ed.), The
ninth mental measurements yearbook (pp.754-756). Lincoln, NE: Buros Institute.
Khalid Salman, Irshad Zohaib Muhammad, (2010), Job Satisfaction among employees in
Punjab, Pakistan: A Comparative Study, European Journal of Social Sciences, Vol 17.
268
Locke E. A. (Eds.), (1999).Industrial and organizational psychology: Linking theory with
practice (pp. 166–198). Oxford, UK: Blackwell.
Locke, E. A. (1976). The nature and causes of job satisfaction. In M. D. Dunnette (Ed.),
Handbook of industrial and organizational psychology (pp. 1297–1349). Chicago: Rand
McNally.
Luddy,N. (2005). Job Satisfaction Amongst Employees at a Public Health institution in
the Western Cape, University of the Western Cape.
Mahmood Azeem, Mahmood Asif,Saaleem Rizwana. (2010).Effect of Work Motivation
on Job Satisfaction in Mobile Telecommunication Service Organizations of Pakistan,
International Journal of Business and Management Vol. 5, No. 11, Canadian Center of
Science and Education.
Moncrief L (2010). 5 Powerful Tools To Improve Employee Motivation And Job
Satisfaction Without Money, http://www.articledashboard.com/Article/5-Powerful-Tools-
to- ImproveEmployee-Motivation-and-Job-Satisfaction-Without- Money/1526591
Moynihan Donald P. and Pandey, Sanjay K. (2007), Finding Workable Levers over Work
Motivation: Comparing Job Satisfaction, Job Involvement and organizational
Commitment. <http://papers.ssrn.com/sol3/papers.cfm.
Nguyen, A. N., Taylor, J., & Bradley, S. (2003). Relative pay and job satisfaction: some
new evidence. http://mpra.ub.uni-muenchen.de/1382 , 01 (43).
Opkara, J. O. (2002). The impact of salary differential on managerial job satisfaction: a
study of the gender gap and its implications for management education and practice in a
developing economy. The Journal of Business in Developing Nations , 65-92.
269
Oshagbemi, T. (1999). Overall job satisfaction: how good are single versus multiple-item
measures? Journal of Managerial Psychology , 388-403.
Saari L.M. and Judge T. A., 2004 “Employee Attitude and Job Satisfaction” HRM,
Winter, Vol.43. No. 4, pp 395-407.
Saker, AH, Crossman, A and Chinmeteepituck, P. (2003). The relationships of age and
and length of service with job satisfaction: An examination of hotel employees in
Thailand. Journal Managerial Psychology, p. 18, pp. 745-58.
Smith, P. C., Kendall, L. M., & Hulin, C. L. (1969). The measurement of satisfaction in
work and retirement. Rand McNally & Company: Chicago, IL.
Sutter, M. R. (1994). Job and career satisfaction of secondary school assistant principals.
An unpublished doctoral dissertation, Kent State University, Kent, Ohio.
Sylvia, R.D., and Hutchinson, T. (1985), .What makes Ms. Johnson teach? A study of
teacher motivation., Human Relations, 38, 841-856.
Vinokur, K.D., Jayaaratne, S., Chess, W.A. (1994). Job satisfaction and retention of
social workers in public agencies, non-profit agencies and private practice: The impact of
work place conditions and motivators. Administration in Social Work 18 (3) 93-121.
Warr, P., Cook, J., Wall, T. (1979) ‘Scales for the measurement of some work attitudes
and aspects of psychological well-being’, Journal of Occupational Psychology, Vol. 52:
129-148 186.
Weiss, D.J. (1967). Manual for the Minnesota satisfaction Questionnaire. Minnesota
Studies in Vocational Rehabilitation, XXII. University of Minnesota.
William B. Werthe, JR. Keith Daris (2000), Human Resources and Personnel
Management, USA: McGraw-Hill-Inc.

270
Yasemin Oraman, (2011), Work motivation and job satisfaction dynamics of textile
employees, African Journal of Business Management Vol. 5(8), pp. 3361- 3368, 18 April,
2011