chapter iii research methodology a. research designdigilib.uinsby.ac.id/1284/8/bab 3.pdf · chapter...
TRANSCRIPT
1
CHAPTER III
RESEARCH METHODOLOGY
In this chapter, the writer describes the method of the research. It consists of
(1) Research design, (2) Research variable, (3) Research population and sample,
(4) Data collection technique and research instruments, (5) Variable and reability
(6) Research procedure, (7) Data analysis technique and (8) Hypotheses.
A. Research Design
This study examines the use of problem sticks as teaching media to teach
speaking on asking for and giving opinion in speaking skill in order to help
teacher to know the student active for speaking skill or not. The research
design used in this study is quasi experimental design. Quasi-experimental is a
design of research which needs two groups to be tested.1 The groups that are
already available at the place of the research should have almost the same
ability. Thus, the researcher takes two classes which have almost the same
ability and they are already available in the school.
In this research, the researcher explores how problem sticks is used to teach
the students, how problem sticks can improve students’ speaking skill and
whether the students who are taught speaking material of expression through
problem sticks have better speaking or not. So, there are two classes which are
taken as the sample of this study. One class is the experimental group and the
other class is the control group. The experimental group gets some treatments
1M. Adnan Latief, Tanya Jawab Metode Pembelajaran Bahasa (Malang:UM Press, 2010) , 117-
121.
1
2
about speaking material of expression through problem sticks and the control
group does not get the treatments about speaking material of expression
through problem sticks.2 The research steps in the experimental group are pre-
test, treatments, post-test. The pre-test explores the students’ speaking skill
before they get the treatments. The post-test is given to the students after they
get the treatments. Therefore, the data for the research are collected from the
scores of two pre-test and the two post-test and then the data are analyzed and
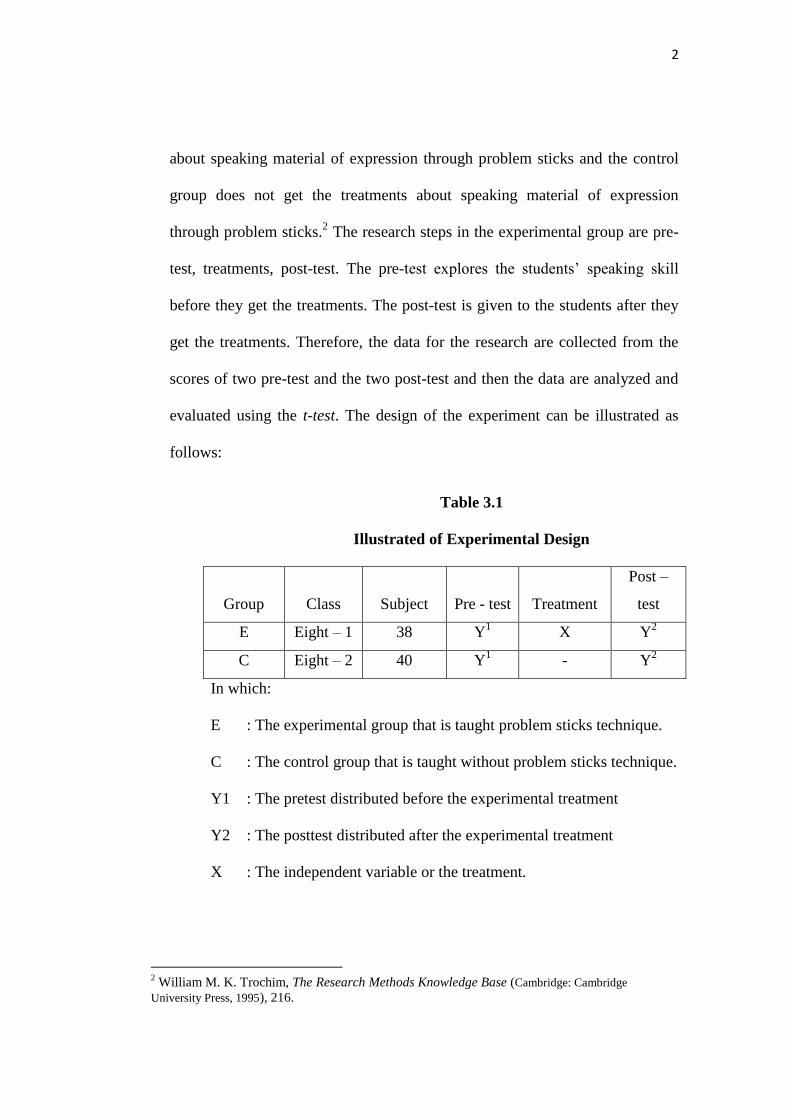
evaluated using the t-test. The design of the experiment can be illustrated as
follows:
Table 3.1
Illustrated of Experimental Design
Group Class Subject Pre - test Treatment
Post –
test
E Eight – 1 38 Y1 X Y
2
C Eight – 2 40 Y1 - Y
2
In which:
E : The experimental group that is taught problem sticks technique.
C : The control group that is taught without problem sticks technique.
Y1 : The pretest distributed before the experimental treatment
Y2 : The posttest distributed after the experimental treatment
X : The independent variable or the treatment.
2 William M. K. Trochim, The Research Methods Knowledge Base (Cambridge: Cambridge
University Press, 1995), 216.
3
B. Research Variable
Variable of this research is what is researched by the researcher.3 A variable
is any entity which is determined by the researcher to be studied in order to
gain the information, then will be concluded. There are two variable examined
in this research. Those are independent and dependent variable.
1. Independent variable
This variable is also called stimulus, predictor or antecedent variable.
Independent variable is variable which will give effect to dependent
variable.4 In this study, the independent variable is problem sticks as
teaching media.
2. Dependent variable
It is also called output, criteria or consequent variable which will get
effect or cause from independent variable.5 In this study, the dependent
variable used is the students’ speaking.
C. Population and sample
1. Population
The population of the study is the eighth graders of SMPI Brawijaya
Pungging, Mojokerto in academics year of 2013/2014. This school consists
of four classes. Each class consists of 38 students.
2. Sample
The researcher takes two classes which have almost the same characteristic.
The researcher takes A class and B class because both classes are taught by
3 Sugiono, Statistika Untuk Penelitian … 2.
4 Sugiyono. Statistika Untuk Penelitian... 4.
5 Sugiyono. Statistika Untuk Penelitian… 4.
4
the same teacher. To decide which control group and experimental group,
the researcher flipped a coin.
D. Data Collection Technique and Instrument
1. Data collection technique
The data is gotten from the assessment and questionnaire:
a. Assessment
The researcher gives test to the students by using problem sticks as
teaching media to teach speaking skill.
b. Questionnaire
Questionnaire is data collection technique which gives a set of
question or written explanation in order to be answered by respondent. In
constructing the questionnaire, the writer uses closed questionnaire. It
means that the respondents answer the questions by choosing one of the
answers given by the researcher. In this study, the writer uses
questionnaire to get information about students’ responses after using
problem sticks in learning process.
2. Instrument
The researcher uses some instruments which help the researcher getting the
empirical data and drawing the conclusion or the result of this research
easily. The instruments are pre-test, post test and questionnaire.6
6 Sugiono, Metode Penelitain Kuantitatif , Kualitatif dan R&D (Bandung: Alfabeta, 2008) , 148.
5
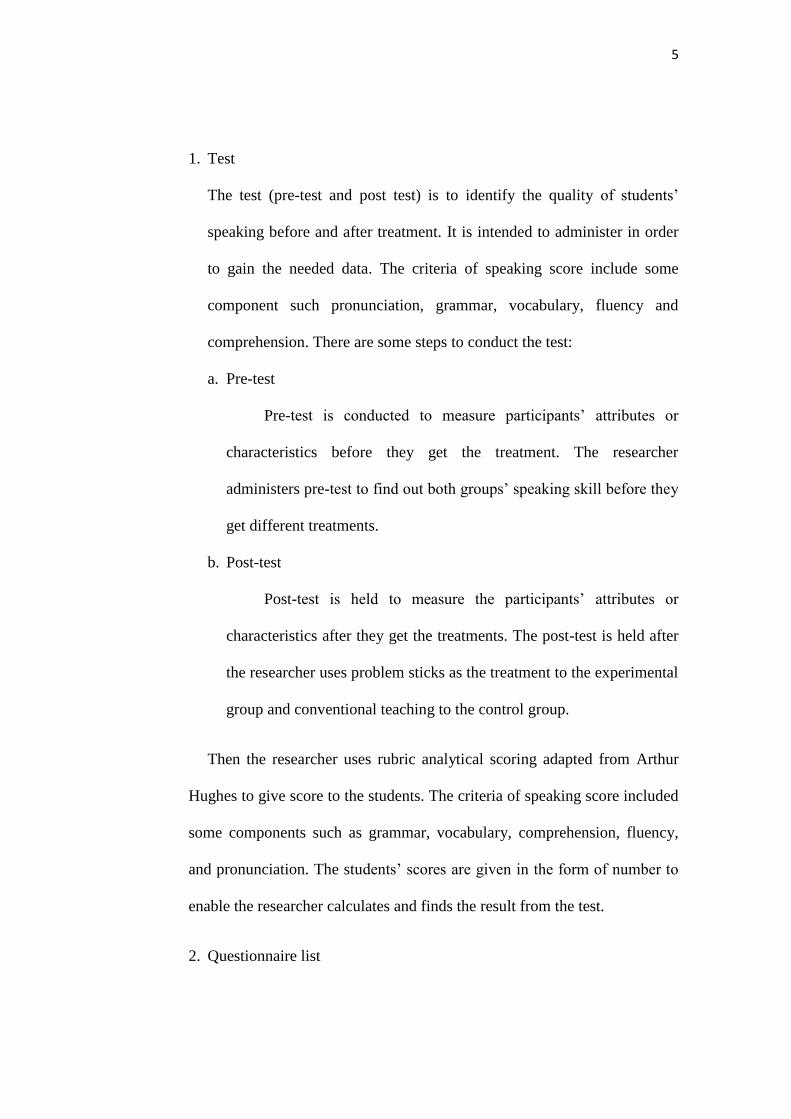
1. Test
The test (pre-test and post test) is to identify the quality of students’
speaking before and after treatment. It is intended to administer in order
to gain the needed data. The criteria of speaking score include some
component such pronunciation, grammar, vocabulary, fluency and
comprehension. There are some steps to conduct the test:
a. Pre-test
Pre-test is conducted to measure participants’ attributes or
characteristics before they get the treatment. The researcher
administers pre-test to find out both groups’ speaking skill before they
get different treatments.
b. Post-test
Post-test is held to measure the participants’ attributes or
characteristics after they get the treatments. The post-test is held after
the researcher uses problem sticks as the treatment to the experimental
group and conventional teaching to the control group.
Then the researcher uses rubric analytical scoring adapted from Arthur
Hughes to give score to the students. The criteria of speaking score included
some components such as grammar, vocabulary, comprehension, fluency,
and pronunciation. The students’ scores are given in the form of number to
enable the researcher calculates and finds the result from the test.
2. Questionnaire list
6
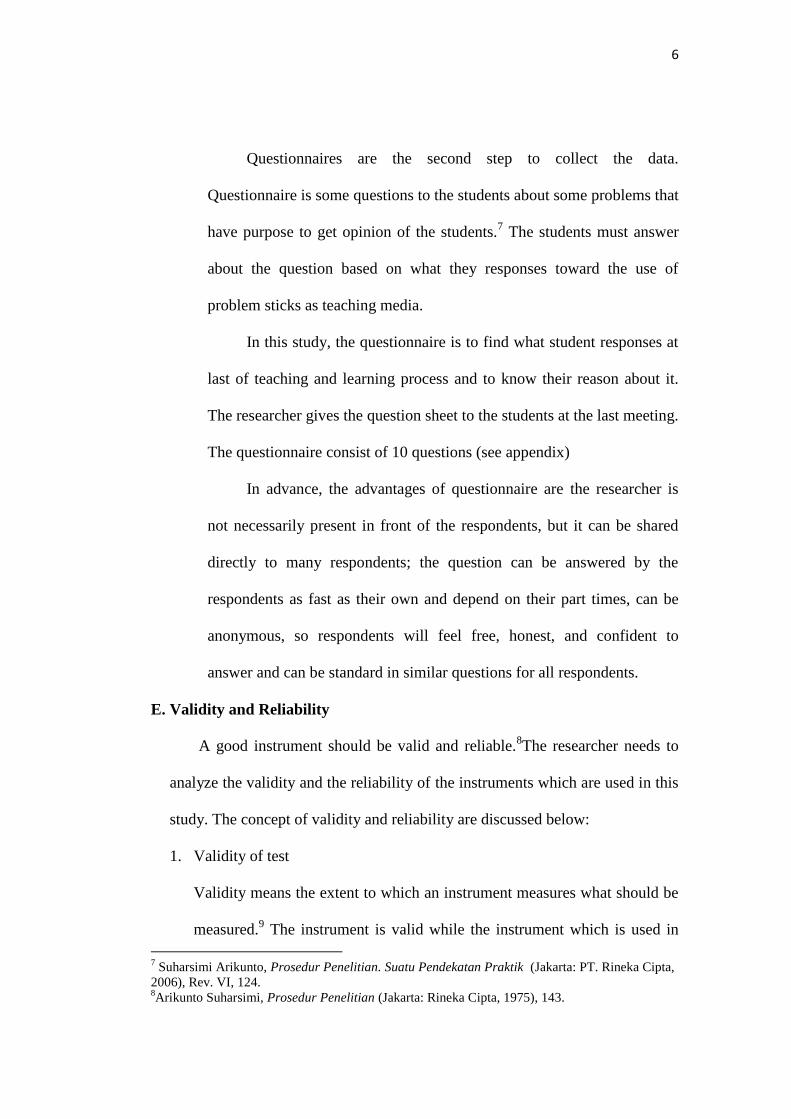
Questionnaires are the second step to collect the data.
Questionnaire is some questions to the students about some problems that
have purpose to get opinion of the students.7 The students must answer
about the question based on what they responses toward the use of
problem sticks as teaching media.
In this study, the questionnaire is to find what student responses at
last of teaching and learning process and to know their reason about it.
The researcher gives the question sheet to the students at the last meeting.
The questionnaire consist of 10 questions (see appendix)
In advance, the advantages of questionnaire are the researcher is
not necessarily present in front of the respondents, but it can be shared
directly to many respondents; the question can be answered by the
respondents as fast as their own and depend on their part times, can be
anonymous, so respondents will feel free, honest, and confident to
answer and can be standard in similar questions for all respondents.
E. Validity and Reliability
A good instrument should be valid and reliable.8The researcher needs to
analyze the validity and the reliability of the instruments which are used in this
study. The concept of validity and reliability are discussed below:
1. Validity of test
Validity means the extent to which an instrument measures what should be
measured.9 The instrument is valid while the instrument which is used in
7 Suharsimi Arikunto, Prosedur Penelitian. Suatu Pendekatan Praktik (Jakarta: PT. Rineka Cipta,
2006), Rev. VI, 124. 8Arikunto Suharsimi, Prosedur Penelitian (Jakarta: Rineka Cipta, 1975), 143.
7
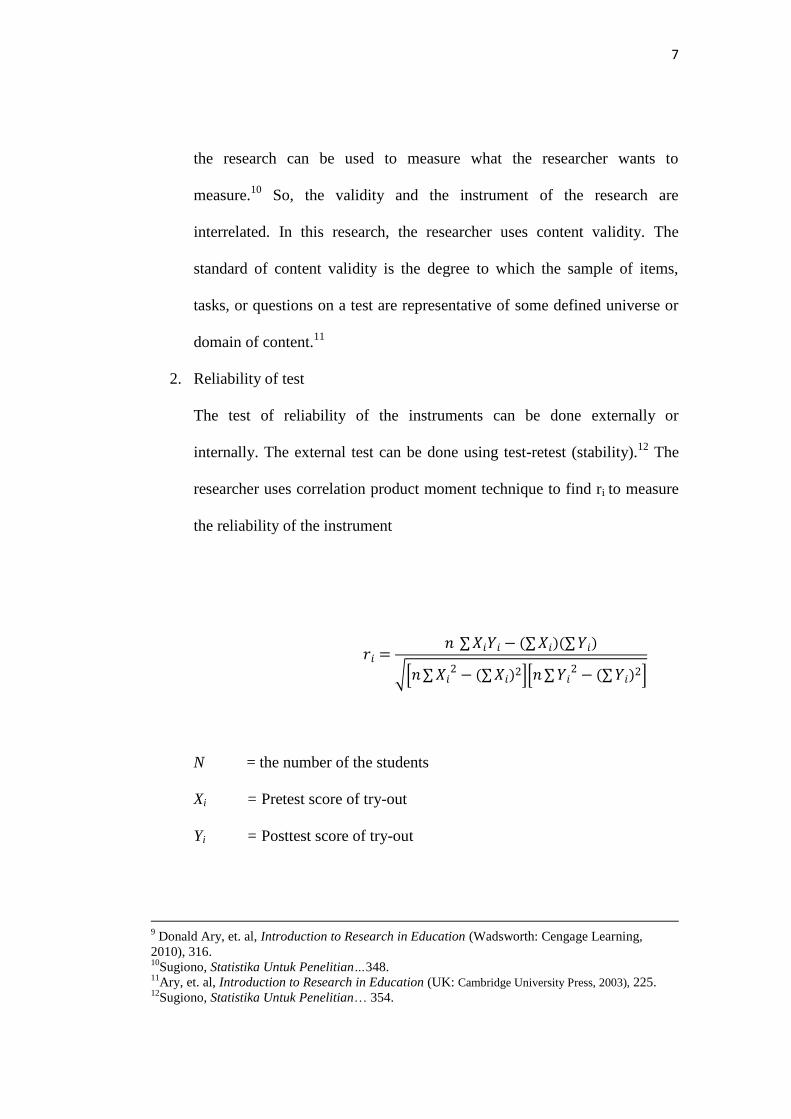
the research can be used to measure what the researcher wants to
measure.10
So, the validity and the instrument of the research are
interrelated. In this research, the researcher uses content validity. The
standard of content validity is the degree to which the sample of items,
tasks, or questions on a test are representative of some defined universe or
domain of content.11
2. Reliability of test
The test of reliability of the instruments can be done externally or
internally. The external test can be done using test-retest (stability).12
The
researcher uses correlation product moment technique to find ri to measure
the reliability of the instrument
N = the number of the students
Xi = Pretest score of try-out
Yi = Posttest score of try-out
9 Donald Ary, et. al, Introduction to Research in Education (Wadsworth: Cengage Learning,
2010), 316. 10
Sugiono, Statistika Untuk Penelitian…348. 11
Ary, et. al, Introduction to Research in Education (UK: Cambridge University Press, 2003), 225. 12
Sugiono, Statistika Untuk Penelitian… 354.
∑ (∑ )(∑ )
√[ ∑ (∑ ) ][ ∑
(∑ ) ]

8
The criteria to interpret the reliability of the test based on Brown:13
Table3.2
Reliability of the Test
SCALE LEVEL OF RELIABILITY
0.00 – 0.20 Not reliable
0.20 – 0.40 Less reliable
0.40 – 0.60 Reliable enough
0.60 – 0.80 Reliable
0.80 – 1.00 Very Reliable
Below is the result of the try-out:
( )( )
√[ ( )
][ ( )
]
( )( )
√[ ( ) ][ ( ) ]
The result of the try-out shows that the value of the reliability of the
test is 0.78. Based on the table of criteria of the reliability of the test, 0.78 is
reliable. Thus, the test can be used as the instrument of this research.
F. Research Procedure
The research procedure is divided into 4 steps. There are pretest, treatment
and questionnaire. The researcher collects the data taken from the students’
13
Dwi Wahyu Sugiarti, The Effectiveness of Clustering Technique in Teaching Writing atThe
Eighth Grade ofMTs Raudlatul Ulum, (Surabaya: IAIN, 2010), 26

9
pretest and posttest score. The pretest and posttest scores are collected from
experimental and control group. The research schedule can be seen on the table
below:
Table 3.3
Research Schedule
No. Day / Date Activity Class / Group
1 Tuesday, June 11
th
2013 Pretest
VIII-B
(Experimental
Group)
VIII-A
(Control Group)
2
Wednesday, June
12th
2013
1st Treatment
Introduction of Problem sticks
1st Meeting
Introduce and explain the topic
based on the syllabus on
speaking skill
VIII-B
(Experimental
Group)
VIII-A
(Control Group)
3
Wednesday, June
19th
2013
2nd
Treatment
Practice speaking by using
problem sticks and give some
examples
2nd
Meeting
Teaching speaking using
conventional teaching
VIII-B
(Experimental
Group)
VIII-A
(Control Group)
4
Friday, June 21st
2013
Posttest
VIII-B
(Experimental
Group)
VIII-A
(Control Group)
1. Experimental group

10
The students of VIII-B are the member of experimental group. In
the experimental group, the researcher divides in four meetings. The
first meeting covers pretest, the second meeting is 1st
treatment; the
third meeting is 2nd
treatment, and posttest. The students are taught
using problem sticks as the treatment for the experimental group.
a. Pretest
The pretest was held on Tuesday, June 11th
2013. The aim of
conducting pretest is to know the students’ speaking skill before
they receive the treatment.
b. 1st Treatment
The following step is the implementation of the treatment for
experimental group by applying problem sticks. The first treatment
was held on Wednesday, June 12th
2013. The topic is “Holiday”.
The researcher set up situation that focus students attention on the
structure of the language. The researcher work with the students,
the researcher gave some examples to the students by problem
sticks. After that, the researcher asks the students to understand
their reaction to the lesson or what they have learned.
c. 2nd
Treatment
The second treatment was held on Wednesday, June 19th
2013.
The topic is the same as in the first treatment. In experimental
group, the researcher elaborates how to use problem sticks at
expression of asking for and giving opinion. The researcher

11
indicated that each of group represented how to pronounce material
of asking for and giving opinion. After that, the student tried that
activity with the other group.
d. Posttest
The posttest was held on Friday, June 21st 2013. The aim is to
know the students’ enhancement progress after getting treatments.
The researcher conducted posttest for 90 minutes.
2. Control Group
The members of control group are the students of VIII-A. There
were also four meetings in control group. The four meetings include
pretest, 1st meeting, 2
nd meeting, and posttest. The students weren’t
taught using problem sticks but conventional teaching.
a. Pretest
The pretest was held on Tuesday, June 11th
2013. The
researcher conducted pretest for 90 minutes. It is also for
measuring the students’ achievement before getting treatment.
b. 1st Meeting
The 1st meeting was conducted on Wednesday, June 12
th 2013.
The researcher uses English Students’ workbook based on the
syllabus for the control group.
c. 2nd
Meeting
The 2nd
meeting was held on Wednesday, June 19th
2013. In
the second meeting, the researcher elicited the students about what
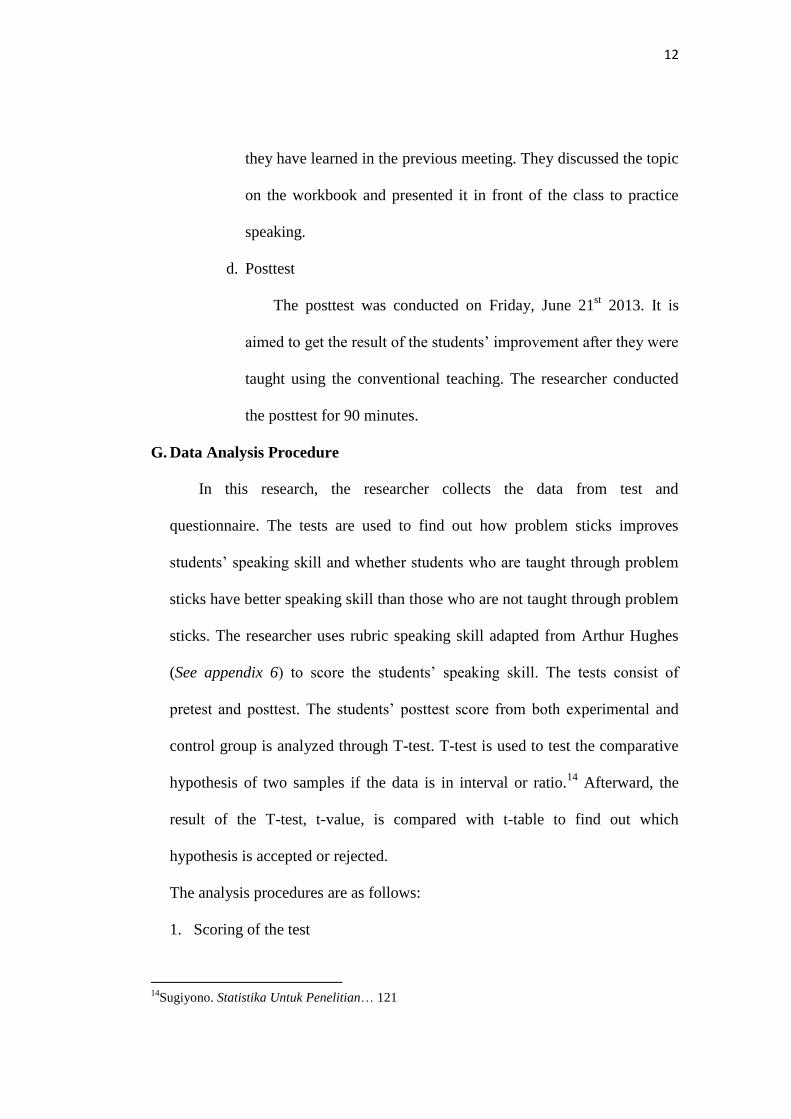
12
they have learned in the previous meeting. They discussed the topic
on the workbook and presented it in front of the class to practice
speaking.
d. Posttest
The posttest was conducted on Friday, June 21st 2013. It is
aimed to get the result of the students’ improvement after they were
taught using the conventional teaching. The researcher conducted
the posttest for 90 minutes.
G. Data Analysis Procedure
In this research, the researcher collects the data from test and
questionnaire. The tests are used to find out how problem sticks improves
students’ speaking skill and whether students who are taught through problem
sticks have better speaking skill than those who are not taught through problem
sticks. The researcher uses rubric speaking skill adapted from Arthur Hughes
(See appendix 6) to score the students’ speaking skill. The tests consist of
pretest and posttest. The students’ posttest score from both experimental and
control group is analyzed through T-test. T-test is used to test the comparative
hypothesis of two samples if the data is in interval or ratio.14
Afterward, the
result of the T-test, t-value, is compared with t-table to find out which
hypothesis is accepted or rejected.
The analysis procedures are as follows:
1. Scoring of the test
14
Sugiyono. Statistika Untuk Penelitian… 121
13
The researcher uses speaking rubric which is adapted from Arthur Hughes
to score the students’ speaking skill for the test. The speaking rubric
includes 5 categories of scoring the students’ speaking skill. The categories
are pronunciation, grammar, vocabulary, fluency and comprehension.
2. T-test
T-test is used for comparative hypothesis of two samples if the data is in
interval or ratio.15
It is aimed to compare if the students’ score of the test
from both experimental and control group are significantly different. By
using t-test formula, the researcher calculates the students’ posttest score
from experimental and control group.16
The terms in using t-test should be
in normal distribution and homogenous variants. Thus, the researcher needs
to check whether the data distribution is normal and homogenous variants
or not. To check the normal distribution is through normality test.
Meanwhile, the homogeneity test is also needed to be calculated to find the
homogenous variants. The normality test and homogeneity test are
calculated as follows:
a. Normality test
The researcher uses normality test to check whether the posttest score
of experimental group and control group are normally distributed or
not. There are some steps to calculate the normality test. The steps
are:17
15
Sugiyono. Statistika Untuk Penelitian…121. 16
Anas Sudjiono, Pengantar Statistik Pendidikan, (Jakarta: PT. Raja GrafindoPersada, 2006), 314. 17
Sugiyono. Statistika Untuk Penelitian ...80.
14
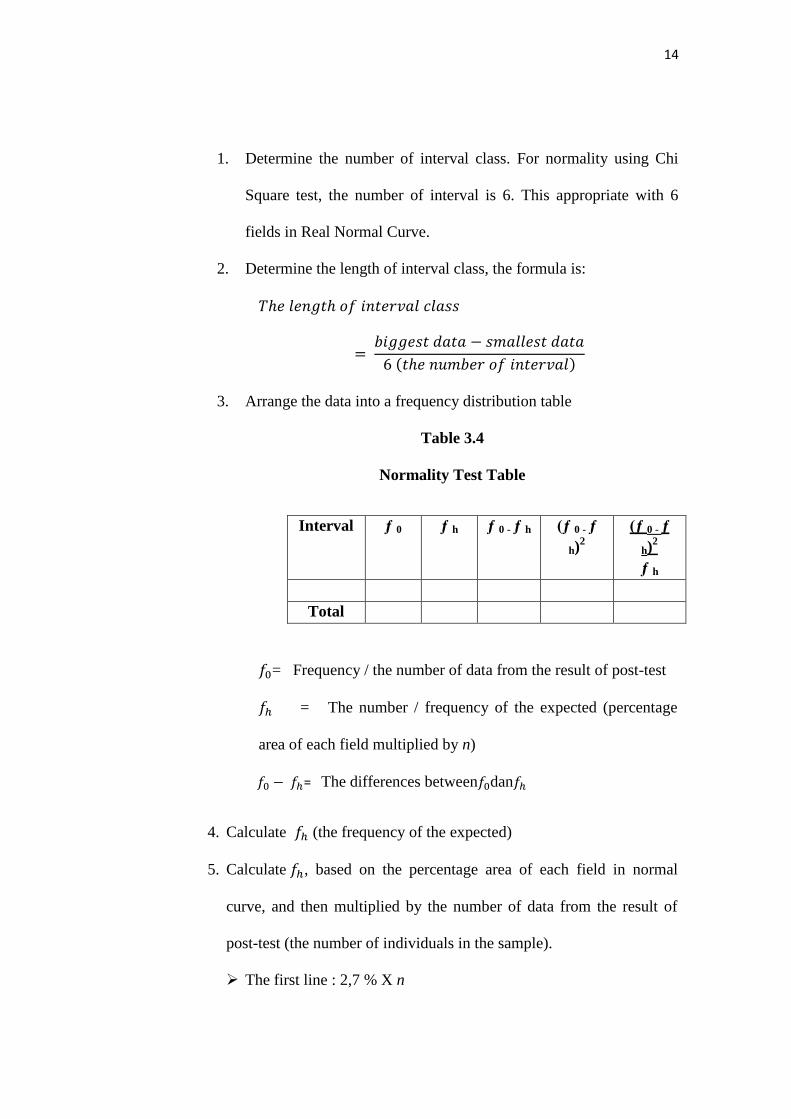
1. Determine the number of interval class. For normality using Chi
Square test, the number of interval is 6. This appropriate with 6
fields in Real Normal Curve.
2. Determine the length of interval class, the formula is:
( )
3. Arrange the data into a frequency distribution table
Table 3.4
Normality Test Table
Interval ƒ 0 ƒ h ƒ 0 - ƒ h (ƒ 0 - ƒ
h)2
(ƒ 0 - ƒ
h)2
ƒ h
Total
= Frequency / the number of data from the result of post-test
= The number / frequency of the expected (percentage
area of each field multiplied by n)
= The differences between dan
4. Calculate (the frequency of the expected)
5. Calculate , based on the percentage area of each field in normal
curve, and then multiplied by the number of data from the result of
post-test (the number of individuals in the sample).
The first line : 2,7 % X n

15
The second line : 13,53 % X n
The third line : 34,13 % X n
The fourth line : 34,13 % X n
The fifth line: 13,53 % X n
The sixth line: 2,7 % X n
6. Insert the value of to the column table, and then calculate the
value of ( ) and
( )
. The value of
( )
is the
calculated value of Chi square( ).
7. Compare the calculated Chi square value to the Chi square table.
X2
tableis 9.48.
b. Homogeneity test
Homogeneity test is used to check whether the posttest score of
experimental and control group have similar variance or not. The
followings are steps of homogeneity test, there are:
1) Find the biggest variant score and the smallest variant score, the
formula is:
Explanation:
S12 = the larger variance
S22 = the smaller variance
16
2) Compare Fscore with Ftable , the criteria is Fscore < Ftable. It is mean the
homogeneity and comparative test will go on.
3. After that, the last analysis is for questionnaire technique. This data is to
answer second problem. The researcher calculates the frequency of each
response (optional formation) of every question by using the formula
below:
The score = The Total Earned x 100%
Total of Students
H. Research of Hypotheses
The researcher needs to check and compare the result of t-test (t-value) to the t-
table.
1. If the t-value is more than the value in the t-table (t value>t table), it means
that Ha is accepted and H0 is rejected. So, students who are taught
through problem sticks have better speaking skill than those who are not
taught through problem sticks.
2. In the other hand, if the t-value is less than the value in the t-table (t
value<t table), it means that H0 is accepted and Ha is rejected. Thus, students
who are not taught through problem sticks have better speaking skill than
those who are taught through problem sticks.