chapter- iii research methodology -...
TRANSCRIPT

47
CHAPTER- III
RESEARCH METHODOLOGY
48
CHAPTER-III
RESEARCH METHODOLOGY
3.1 Overview:
This chapter illustrates the type of research procedure that has been undertaken
for the research. The processes used to gather secondary and primary data and the
causes for adopting the selected approach are discussed. As discussed in Chapter- II,
literature was searched to gain insights into the question of IPTV acceptability. As this
technology is newer in age, literature used for different technologies have also been
applied in this research. Regarding the aim and overall objectives, the work has a
particular focus on factors influencing the consumers’ acceptance of IPTV service in
India. The literature review comprised of; collecting and compiling literature from
various published sources like books, articles, newspapers relating to the theories in
advertising, interactive advertising, technology acceptance model, marketing and
consumer behavior. The focus of the primary data is on the views of the respondents to
find the main factors of IPTV service. Chisnall (2001) said Central component of a
study is research plan. Therefore, this empirical work attempts to identify the factors
influencing IPTV adoption in Indian context and also providing a suggestive IPTV
business framework. The adopted methodology and the sample used in the present
research add a new dimension to the existing studies available on IPTV. As this
technology is in nascent stage in India, this research will open a new window for the
IPTV business. Following steps were conducted to complete the study.
1. Finalizing of Research purpose
2. Finalizing of Research approach
3. Developing appropriate Hypotheses for the research
4. Identifying Data Collection Methodology
5. Developing the Survey Instrument and pre-testing
6. Sampling Design

49
7. Conducting the Survey and Coding the Results
8. Analyzing the Survey Findings
3.2 Research Purpose
Depending on the nature of purpose or research problem, research can be
classified into several types. The purpose of academic research can be exploratory
(ambiguous problem), descriptive (awareness of problem), or explanatory (clearly
defined problem) (Yin, 1994; Zikmund, 2000). Saunders et al. (2009) stated that more
than one purpose can be employed in a study. Yin (1994) highlighted that the
boundaries among the categories are not always clear.
• Exploratory Research
According to Zikmund (2000), for better understanding of the nature of the
problem and to research on it, exploratory research is conducted. When there is a little
prior knowledge of the problem researched, exploratory research is suitable.
Exploratory research is purposeful to find out “What is happening; to investigate new
insight; to ask questions and to assess phenomena in a new light”. The intention of the
exploratory research is to provide insight and understanding, not conclusive manifest.
Saunders and Thornhill (2003) argued that exploratory study has advantages because it
is flexible and adaptable to change. An exploratory investigation is appropriate when
research problem is unstructured and difficult to define (Baraghani, 2007).
• Descriptive Research
Zikmund (2000) stated that when a research problem is known but the
researcher is not fully aware of the situation, descriptive research is used. According to
Huczynski and Buchanan (1991, cited in Baraghani, 2007), when a particular
phenomenon of the nature is under research, it is understandable that research is needed
to describe it. To explain its properties and inner relationship descriptive research can be
used. Zikmund (2000) added descriptive research will answer who, what, Where and
how questions and not give any explanation for the reason of the findings.
50
• Explanatory Research
Studying a problem or a phenomenon in order to establish causal relationship
among variables explanatory research is used (Saunders et al., 2009). Explanatory
research is sometimes referred to as causal research (Zikmund, 2000; Malhotra 2011).
Saunders at al. (2009) stated, normally, exploratory and descriptive research is
conducted first and the explanatory research attempts to demonstrate and explain
patterns related to phenomenon.
The starting point of our research purpose is the research problem, what are the
factors influencing adoptions of internet protocol television. Depending on research
problem, literature has been searched in order to set research questions and construct
framework. It is clear from the research purpose and research question that this study is
primarily descriptive.
3.3 Research Approach
3.3.1 Quantitative versus Qualitative Research Approach
In social science research, two broad approaches to research are Qualitative and
quantitative research. In quantitative research numerical representation and
manipulation observation for the purpose of describing and explaining the phenomena
that those observations reflect are involved, but qualitative research involves non-
numerical examination and interpretation of observation (Zikmund, 2000).In
quantitative research variables and relationships are the main concern. In quantitative
research detailed planning prior to data collection and analysis is required, because it
provides tools for measuring concepts, planning design stages and for handling
population and sample issues (Malhotra, 2011).
51
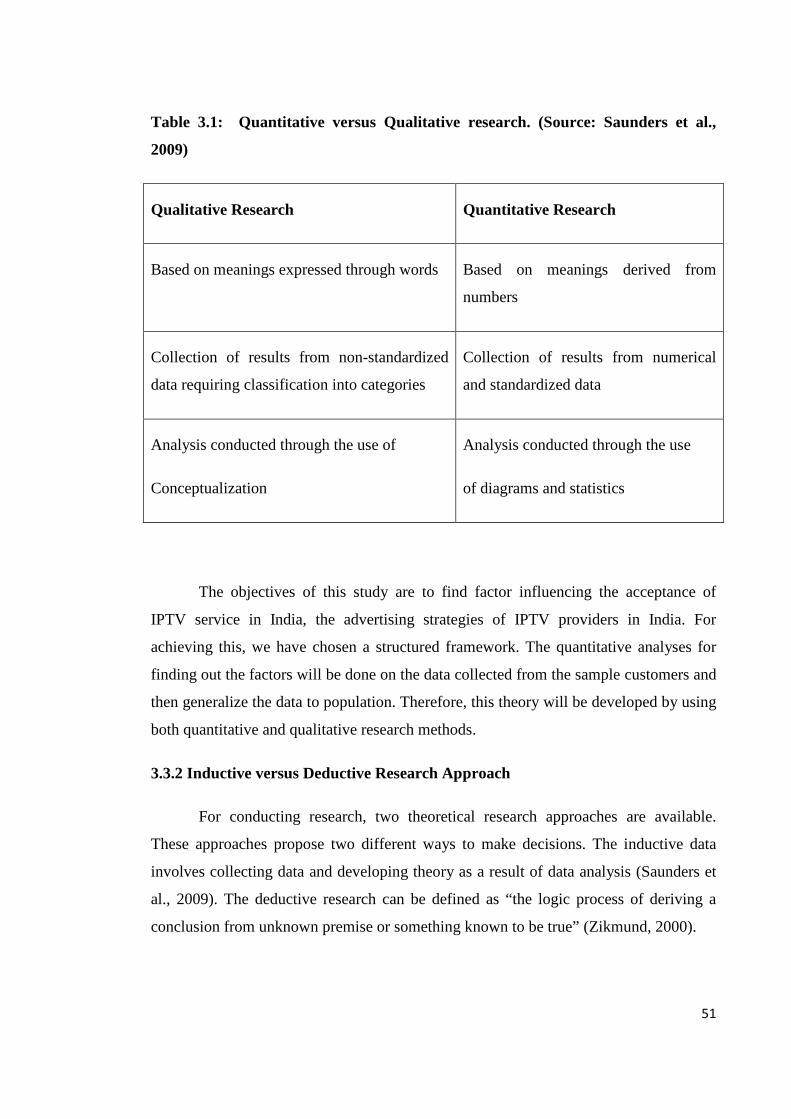
Table 3.1: Quantitative versus Qualitative research. (Source: Saunders et al.,
2009)
Qualitative Research Quantitative Research
Based on meanings expressed through words Based on meanings derived from
numbers
Collection of results from non-standardized
data requiring classification into categories
Collection of results from numerical
and standardized data
Analysis conducted through the use of
Conceptualization
Analysis conducted through the use
of diagrams and statistics
The objectives of this study are to find factor influencing the acceptance of
IPTV service in India, the advertising strategies of IPTV providers in India. For
achieving this, we have chosen a structured framework. The quantitative analyses for
finding out the factors will be done on the data collected from the sample customers and
then generalize the data to population. Therefore, this theory will be developed by using
both quantitative and qualitative research methods.
3.3.2 Inductive versus Deductive Research Approach
For conducting research, two theoretical research approaches are available.
These approaches propose two different ways to make decisions. The inductive data
involves collecting data and developing theory as a result of data analysis (Saunders et
al., 2009). The deductive research can be defined as “the logic process of deriving a
conclusion from unknown premise or something known to be true” (Zikmund, 2000).
52
Saunders et al. (2009) suggests number criteria for deciding what research to be
adopted and comments that most important criterion is the nature of the research topic.
If one has access to lots of literature about the problem from which a theoretical model
can be defined, it is suitable to use the deductive approach. On the other hand, when
researching a topic that is new, only limited existing literature can be found, it may be
more appropriate to use an inductive approach (Brahma, 2009).
This study is deductive, because in the area of Technology Acceptance Model
(TAM) related research, large number of literature is available and conclusion were
drawn from theories.
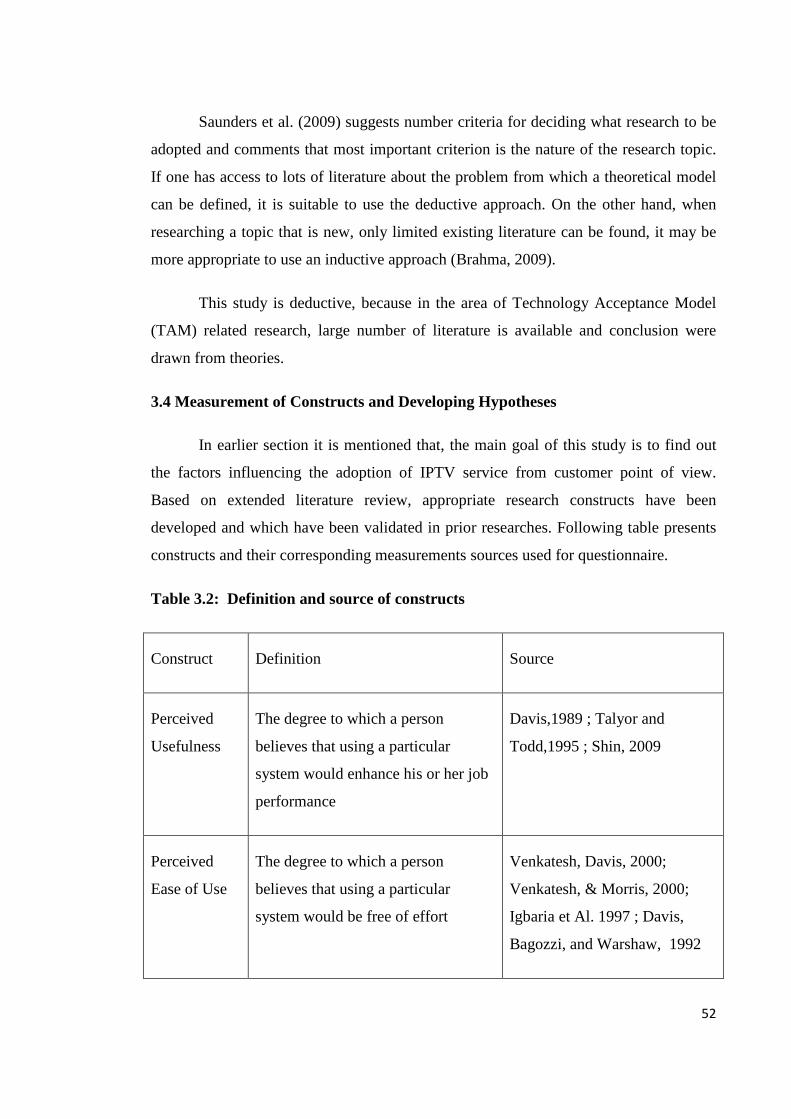
3.4 Measurement of Constructs and Developing Hypotheses
In earlier section it is mentioned that, the main goal of this study is to find out
the factors influencing the adoption of IPTV service from customer point of view.
Based on extended literature review, appropriate research constructs have been
developed and which have been validated in prior researches. Following table presents
constructs and their corresponding measurements sources used for questionnaire.
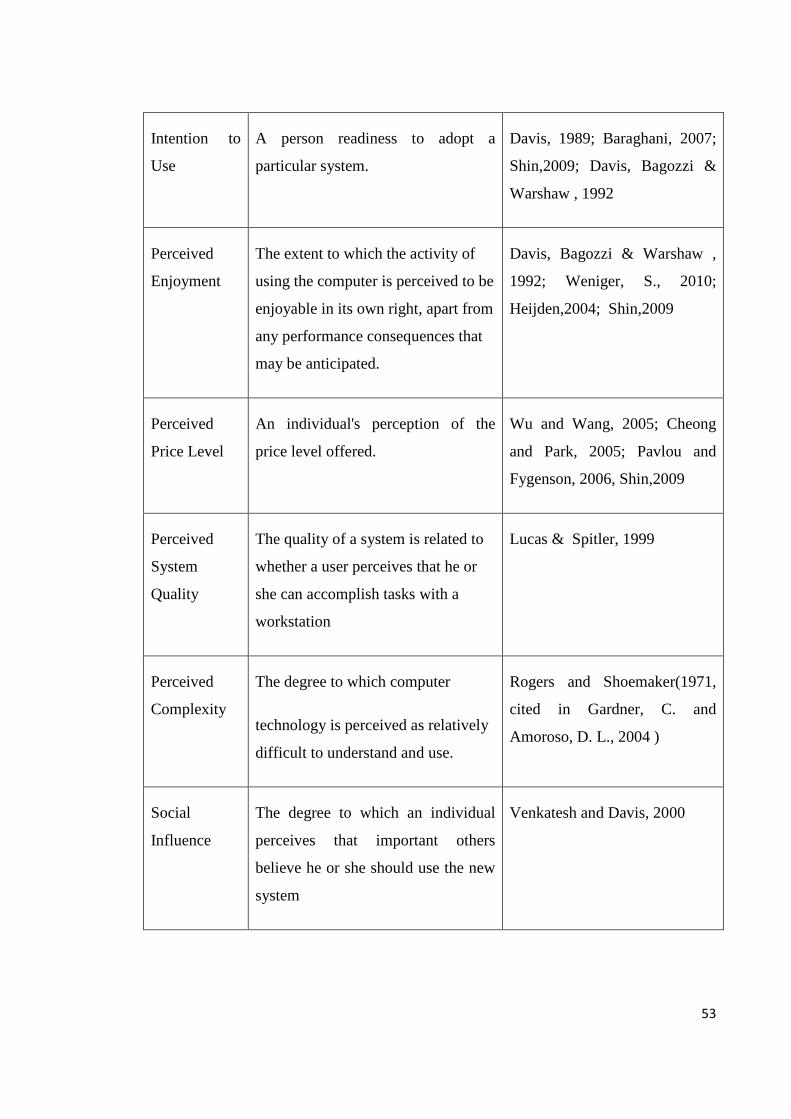
Table 3.2: Definition and source of constructs
Construct Definition Source
Perceived
Usefulness
The degree to which a person
believes that using a particular
system would enhance his or her job
performance
Davis,1989 ; Talyor and
Todd,1995 ; Shin, 2009
Perceived
Ease of Use
The degree to which a person
believes that using a particular
system would be free of effort
Venkatesh, Davis, 2000;
Venkatesh, & Morris, 2000;
Igbaria et Al. 1997 ; Davis,
Bagozzi, and Warshaw, 1992
53
Intention to
Use
A person readiness to adopt a
particular system.
Davis, 1989; Baraghani, 2007;
Shin,2009; Davis, Bagozzi &
Warshaw , 1992
Perceived
Enjoyment
The extent to which the activity of
using the computer is perceived to be
enjoyable in its own right, apart from
any performance consequences that
may be anticipated.
Davis, Bagozzi & Warshaw ,
1992; Weniger, S., 2010;
Heijden,2004; Shin,2009
Perceived
Price Level
An individual's perception of the
price level offered.
Wu and Wang, 2005; Cheong
and Park, 2005; Pavlou and
Fygenson, 2006, Shin,2009
Perceived
System
Quality
The quality of a system is related to
whether a user perceives that he or
she can accomplish tasks with a
workstation
Lucas & Spitler, 1999
Perceived
Complexity
The degree to which computer
technology is perceived as relatively
difficult to understand and use.
Rogers and Shoemaker(1971,
cited in Gardner, C. and
Amoroso, D. L., 2004 )
Social
Influence
The degree to which an individual
perceives that important others
believe he or she should use the new
system
Venkatesh and Davis, 2000
54
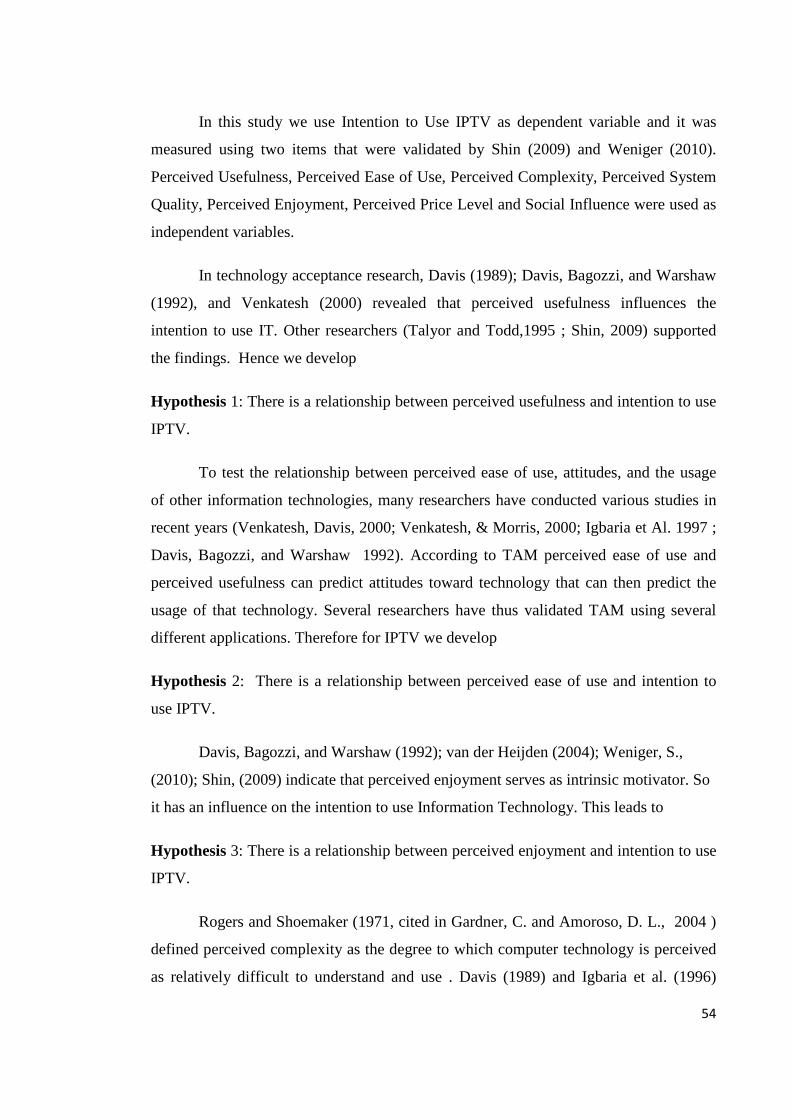
In this study we use Intention to Use IPTV as dependent variable and it was
measured using two items that were validated by Shin (2009) and Weniger (2010).
Perceived Usefulness, Perceived Ease of Use, Perceived Complexity, Perceived System
Quality, Perceived Enjoyment, Perceived Price Level and Social Influence were used as
independent variables.
In technology acceptance research, Davis (1989); Davis, Bagozzi, and Warshaw
(1992), and Venkatesh (2000) revealed that perceived usefulness influences the
intention to use IT. Other researchers (Talyor and Todd,1995 ; Shin, 2009) supported
the findings. Hence we develop
Hypothesis 1: There is a relationship between perceived usefulness and intention to use
IPTV.
To test the relationship between perceived ease of use, attitudes, and the usage
of other information technologies, many researchers have conducted various studies in
recent years (Venkatesh, Davis, 2000; Venkatesh, & Morris, 2000; Igbaria et Al. 1997 ;
Davis, Bagozzi, and Warshaw 1992). According to TAM perceived ease of use and
perceived usefulness can predict attitudes toward technology that can then predict the
usage of that technology. Several researchers have thus validated TAM using several
different applications. Therefore for IPTV we develop
Hypothesis 2: There is a relationship between perceived ease of use and intention to
use IPTV.
Davis, Bagozzi, and Warshaw (1992); van der Heijden (2004); Weniger, S.,
(2010); Shin, (2009) indicate that perceived enjoyment serves as intrinsic motivator. So
it has an influence on the intention to use Information Technology. This leads to
Hypothesis 3: There is a relationship between perceived enjoyment and intention to use
IPTV.
Rogers and Shoemaker (1971, cited in Gardner, C. and Amoroso, D. L., 2004 )
defined perceived complexity as the degree to which computer technology is perceived
as relatively difficult to understand and use . Davis (1989) and Igbaria et al. (1996)
55
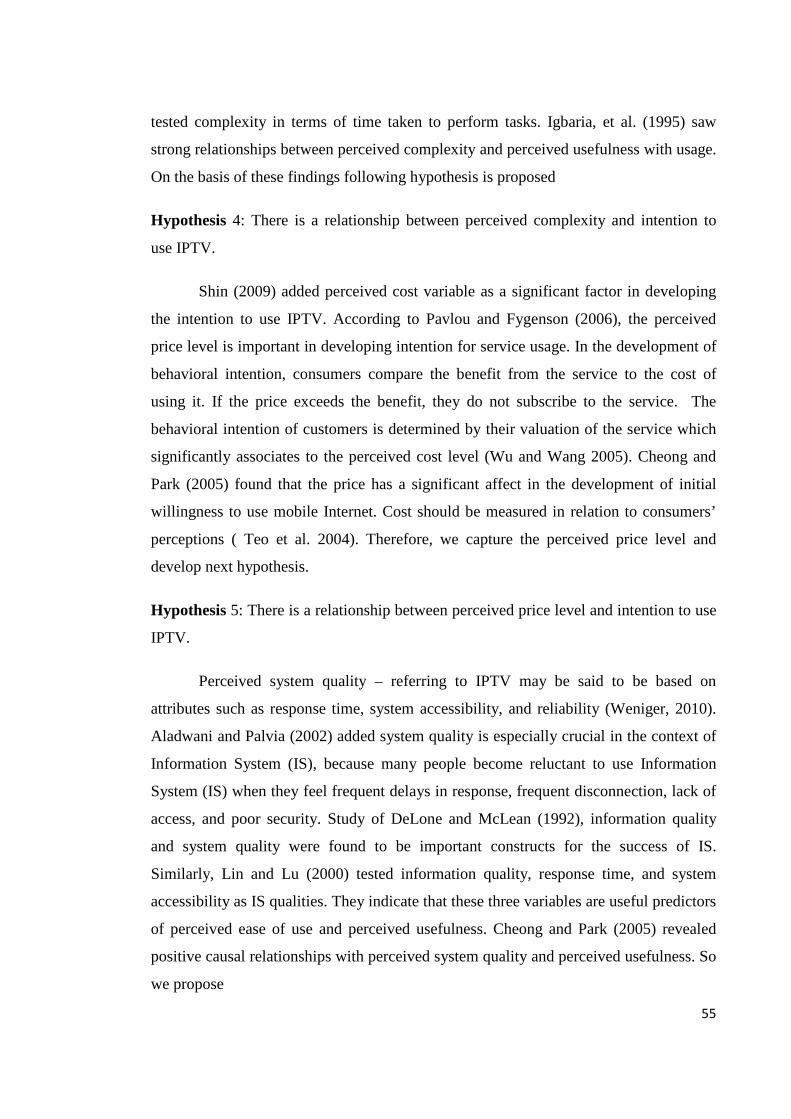
tested complexity in terms of time taken to perform tasks. Igbaria, et al. (1995) saw
strong relationships between perceived complexity and perceived usefulness with usage.
On the basis of these findings following hypothesis is proposed
Hypothesis 4: There is a relationship between perceived complexity and intention to
use IPTV.
Shin (2009) added perceived cost variable as a significant factor in developing
the intention to use IPTV. According to Pavlou and Fygenson (2006), the perceived
price level is important in developing intention for service usage. In the development of
behavioral intention, consumers compare the benefit from the service to the cost of
using it. If the price exceeds the benefit, they do not subscribe to the service. The
behavioral intention of customers is determined by their valuation of the service which
significantly associates to the perceived cost level (Wu and Wang 2005). Cheong and
Park (2005) found that the price has a significant affect in the development of initial
willingness to use mobile Internet. Cost should be measured in relation to consumers’
perceptions ( Teo et al. 2004). Therefore, we capture the perceived price level and
develop next hypothesis.
Hypothesis 5: There is a relationship between perceived price level and intention to use
IPTV.
Perceived system quality – referring to IPTV may be said to be based on
attributes such as response time, system accessibility, and reliability (Weniger, 2010).
Aladwani and Palvia (2002) added system quality is especially crucial in the context of
Information System (IS), because many people become reluctant to use Information
System (IS) when they feel frequent delays in response, frequent disconnection, lack of
access, and poor security. Study of DeLone and McLean (1992), information quality
and system quality were found to be important constructs for the success of IS.
Similarly, Lin and Lu (2000) tested information quality, response time, and system
accessibility as IS qualities. They indicate that these three variables are useful predictors
of perceived ease of use and perceived usefulness. Cheong and Park (2005) revealed
positive causal relationships with perceived system quality and perceived usefulness. So
we propose
56
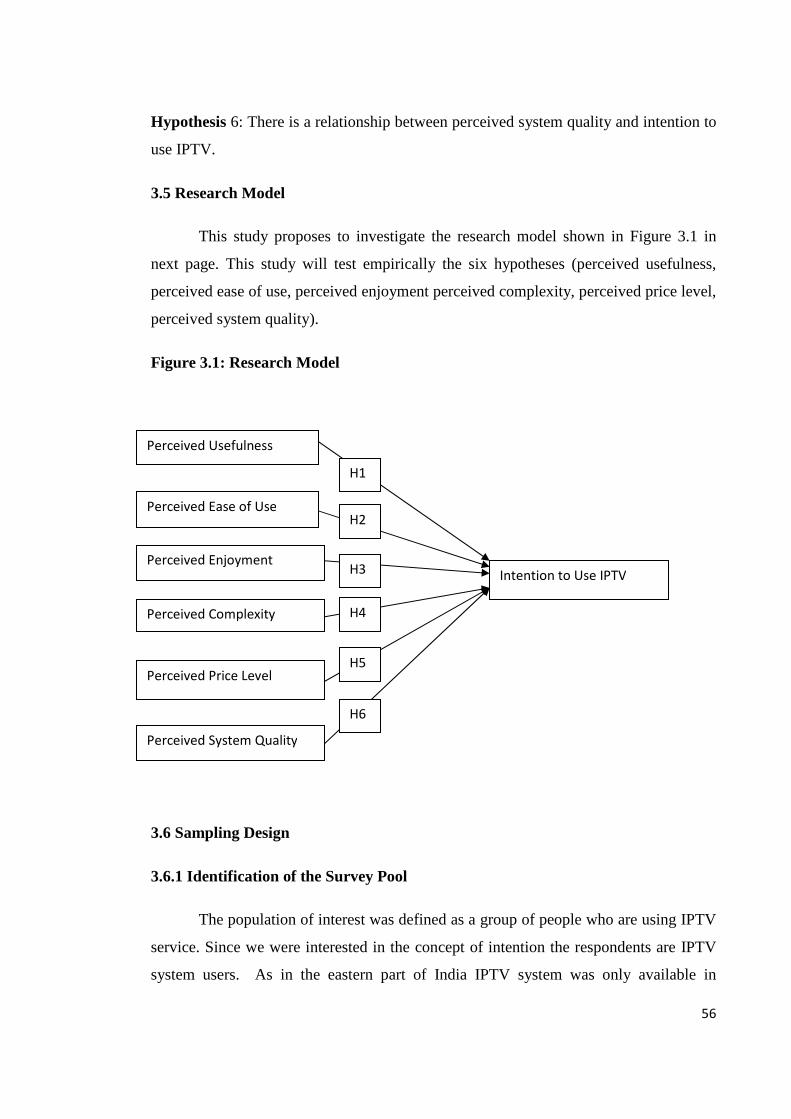
Hypothesis 6: There is a relationship between perceived system quality and intention to
use IPTV.
3.5 Research Model
This study proposes to investigate the research model shown in Figure 3.1 in
next page. This study will test empirically the six hypotheses (perceived usefulness,
perceived ease of use, perceived enjoyment perceived complexity, perceived price level,
perceived system quality).
Figure 3.1: Research Model
3.6 Sampling Design
3.6.1 Identification of the Survey Pool
The population of interest was defined as a group of people who are using IPTV
service. Since we were interested in the concept of intention the respondents are IPTV
system users. As in the eastern part of India IPTV system was only available in
Perceived Usefulness
Intention to Use IPTV
Perceived Ease of Use
Perceived Enjoyment
Perceived Complexity
Perceived Price Level
Perceived System Quality
H1
H2
H3
H4
H5
H6

57
Kolkata, we have chosen the place for conducting the study. The respondents include
the consumers belonging to all income groups and covering all age groups namely
students, working class in private sector, working class in govt. or public sector,
housewives and businessmen or self-employed. Respondents were comfortable with
English language.
3.6.2 Selecting of Sampling Technique
Traditional sampling method can be divided into two categories: (Malhotra ,
2011)
• Probability
• Nonprobability
In probability sampling, sampling units are chosen randomly. If done in the right
way, probability sampling assures that the sample is representative (Hair et al.,
2003).Usually Probability sampling is used in survey–based research where researcher
needs to make inferences from the sample about a population to meet research
objectives (Saunders et al. 2009).
In non-probability sampling, researcher decides what elements to include in the
sample either arbitrarily or consciously (Malhotra, 2011). In non-probability sampling
the selection of elements for the sample is not necessarily made with the aim of being
statistically representative of the population.
For this study two stage cluster sampling under probability sampling was
chosen. In this type of sampling method, there is initial sampling of groups of clusters
and then selection of elements within each selected cluster. The clusters are made up of
individual units which constitute mutually exclusive and exhaustive subsets. This is a
probability sampling method. Two-stage sampling is a complex form of cluster
sampling. Using all the sample elements in all the selected clusters may be prohibitively
expensive or not necessary. Under these circumstances, two-stage cluster sampling
becomes useful (Malhotra, 2011). Instead of using all the elements contained in the
selected clusters, the researcher randomly selects elements from each cluster.
58
Constructing the cluster is the first stage. Deciding what elements within the cluster to
use is the second stage. The technique is used frequently when a complete list of all
members of the population does not exist and is inappropriate.
Hinkin (1998) argued that, the determination of suitable sample size is
debatable. As the sample size increases, the likelihood of achieving statistical
significance also increases (Field, 2009). Hair et al. (2003) discussed, the large sample
has an advantage that it can produce stable estimates of the standard errors to ensure
that factor loadings are exact manifestations of the true population values. From
literature, recommended item-to-response ratios in exploratory and confirmatory factor
analysis ranged from 1:4 to 1:10 (Hair et al. 2003; Hinkin 1998; Field, 2009). In this
study, 27 items were finalized and the sample size was estimated 500.
At the first stage, the clustering was done on the basis of area and then at the
second stage the respondents were randomly selected from the clusters thus formed.
3.7 Developing the Survey Instrument
The first step of scale development is item generation (Brahma, 2009). A review
of literature on this subject reveals that most of the work in this area has been
undertaken in industrially advanced countries of Europe, USA and Asia. The issue of
IPTV in developing countries like India has received little attention till date. Earlier
studies on technology acceptance behavior have been inconclusive about the
applicability of a western-developed model of technology acceptance in other non-
western countries (e.g., Rose and Straub, 1998; Straub et al., 2001; Bagozzi et al.,
2000).
The overview of literature identifies that very few studies that have examined
the relationship of new technology and a set of determinants influencing them are
available in the Indian context. Moreover, all these works are mainly confined to the
mobile phone. The researchers in this regards have neglected the IPTV sector.
Hinkin (1998) suggested, for a successful item generation, existence of a well-
formulated theoretical background that indicates the content domain for the measure is
required. One of the best processes to ensure content validity is to select and adapt items
59
from previously validated instruments. This research attempts to borrow items from
prior research. The researcher should have objective to create items that will result in
tests that sample the theoretical domain of interest to demonstrate content validity.
Simple and short statements should be used, and the target population should be
familiar with the language used in the questionnaire. Also, each item should address a
single issue (Hinkin 1998).One way of getting a low measurement error when
developing a sample of items is to draw items from already existing validated scales
(Churchill 1979).
Based on Moore and Benbasat’s (1991) item creation process, the following
steps were adopted:
• Step 1 – Literature survey of existing instruments
• Step 2 – Choosing of appropriate items
• Step 3 – Add necessary items if dimensions were not covered and
testing the reliability
• Step 4 – Analyse and categorize all items based on the similarities and
differences among items
• Step 5 – Revise items - uniform and clarity of wording
The TAM (Davis, 1989) frameworks were developed for relatively simple and
mainly work or job related technologies (e.g. word processing tools and e-mail).
However, as IPTV service is not directly related to job or work place, adopting all TAM
constructs may not be a useful idea. Therefore, new items were generated based on
IPTV technology. To generate new items, the focus group study was conducted and
opinions were taken from experts in this field.
In this research constructs were borrowed from TAM related studies and were
used on the specific feature of IPTV. As suggested by Churchill (1979), in order to
obtain first-hand insights on IPTV related issues one focus group session was
conducted. In the work of developing a new set of items to measure the constructs,
60
qualitative research was conducted. Cronbach (1971, cited in Brahma, 2009) and
another study (Subramaniam and Venkatraman, 2001) describes, experts who are
familiar with the content universe can evaluate the items until a consensus is reached.
Therefore, after completion of focus group session, experts’ opinions were also taken
for generating new items.
In this study, 50 numbers of initial items were created by doing literature search,
focus group method and experts’ opinion.
To ensure the reliability of the research constructs while doing the research, it
has been tried to choose previously validated items in the literature. Besides this, few
new items has been suggested to be added by the experts. All the new items are related
to IPTV in Indian context.
3.7.1 Pretesting the Instrument
Pretesting is testing of questionnaire for identifying and eliminating potential
problems. It is done on small sample . Pre-tests are best done by personal interviews
(Malhotra, 2011). A preliminary survey was carried out through a questionnaire
consisting of both open ended and close-ended questions to get the initial feedback on
the issues concerned. Therefore, the questionnaire was pre-tested on a group of 100
subjects (both male and female) to find the reliability and credibility of the instrument
(Survey period was 15th February, 2012 to 10th March, 2012). Senior academicians and
experts who have a lot of experience in the field of IPTV and Customer service were
consulted and their views were suitably incorporated in the questionnaire. From this
pre-testing, many valuable feedbacks were obtained concerning language and structure.
The final questionnaire constitutes of three sections. The first section consisted
of 27 questions on all the independent and dependent variables. The second section was
designed to collect qualitative data to know the source of awareness i.e. from where did
they get to know about IPTV, what motivated subscribers’ to switch to IPTV and which
service of IPTV they like most. By analysing these data, which media is playing
important role for the advertisement of IPTV and which service of IPTV is playing
significant role to customers can be identified. The third part was for collecting
61
demographics data, pertaining to age, gender, academic qualification, occupation and
level of income.
The most frequently used summated scales in the study of social attitude follow
the pattern prepared by Likert (Kothari C.R, 2006); therefore, all the 27 items were
presented in the questionnaire consisted of a five point Likert scale. This five-point
scale ranged from “strongly agree” to “strongly disagree”; with the middle of the scale
identified by the response alternative “neither agree nor disagree”. As recommended by
Parasuraman (2000), the items were presented in a randomly mixed order. A detail of
the items with origin is given in table Annex-2 in Annexure II. Questionnaire in English
was derived for the study. A complete version of the questionnaire is listed in Annexure
III.
3.8 Operational Measures of the Study Variables
One important question in research design using factor analysis techniques is
how to determine the number of variables to be included in the study. Hair et al. (2003)
suggest that “the researcher should attempt to minimize the number of variables
included but still maintain a reasonable number of variables per factor”. With this in
mind, all the variables (dependent and independent variables) were adopted from prior
studies for the purpose of this study. The complete results of factor analysis are
exhibited in findings section.
3.9 Data Collection Methodology
3.9.1 Secondary Data
Searching the literature on chosen topic is a vital step. The fresh data, which are
specifically collected for the recent research project, is called primary data, where the
researcher is the first user, as opposed to secondary data (Kothari C.R, 2006). Review of
literature is an important part of nearly all research. According to Malhotra (2011)
existing data which was collected for an intention other than that of the current study
but which can be used a second time for a current project is referred as secondary data.
Sometimes secondary data can be superior to primary data, as earlier researchers could
have had different situations to work under.
62
Secondary data played a vital role for this research. In this case, few studies on
the related topic have been done. However, no research has been done in Indian context,
where the market potentiality is huge. In this country, a significant number of users are
already using mobile phones, internet, broadband system and Television.
The literature review allowed the researcher to gain the concept of key issues of
IPTV related system. Furthermore, the use of secondary data helped the researcher to
establish new relationships between the ideas that were at the beginning of the research
collection, entirely unforeseen. Moreover, the use of existing sources helped the
researcher to formulate and realize the research problem better (Ghauri et al. 2002)
The literature review contained academic work and other published sources
related to the theories in interactive advertising, Technology Acceptance Model and
IPTV. Regarding the aim and overall objectives, it had in particular a focus on
acceptability of IPTV system. In this study, the first objective is the advertising
strategies of IPTV providers in India, which purely depends on secondary data.
Academic journals on the subject and newspapers formed an important source of
information.
Use of secondary data might not always be appropriate for a specific research as
the information might have been collected for a different purpose or in a different
circumstance, but nonetheless it helps in building a sound idea on the subject.
3.9.2 Primary Data
Primary data are new data specifically collected in the current study, where the
researcher is the first user, as opposed to secondary data (Malhotra, 2011).For the
primary data collection a quantitative method was applied which is a structured form of
data collection and it employs quantitative measurement and statistical analysis.
This research has two parts, these are (a) Acceptance related- for this part, 27
statements were specially constructed for quantitative analysis and for this purpose the
technology acceptance related literature was searched, the focus group study was
conducted and opinions were taken from experts in this field. (b) Awareness related –
for this part items were created to know the source of knowing about IPTV and their
63
motivations behind subscription of IPTV. For this study, 3 questions (Group-B,
ANNEXURE-IV) were constructed within the questionnaire.
3.10 Assessment of the Instrument by Reliability and Validity Analysis
One of the main objective of the item generation process is to ensure content
validity (Moore and Benbasat 1991). Validity and reliability are vital factors when
considering errors that might influence the results. Reliability is the extent to which a
set of variables is consistent in what it is intended to measure, while validity refers to
how well the measures correctly represent the concept of the study. That is, validity is
concerned with what is studied, and reliability relates to how it is measured (Hair et al.
2003).
“ Reliability refers to the extent to which a scale produces consistent results if
repeated measurements are made” (Malhotra, 2011). As reliability is a necessary
condition of validity, a researcher first provides evidence that his scale has achieved a
satisfactory level of reliability. Reliability of a scale can be described as the degree to
which a measure is free from error and, therefore, yields consistent results (Peter 1979;
Brahma 2009). The internal consistency of reliability when items in the measurement
scale all coincided with the same underlying construct, was measured using Cronbach’s
alpha and corrected item to total correlations. Cronbach’s alpha is one of the most
popular methods for measuring internal consistency reliability. Essentially Cronbach’s
alpha can be referred as an average correlation of every combination of one item to the
other items in the same scale (Brahma, 2009). Reliability assessment was carried out
using Cronbach’s alpha, in order to ensure that the variables comprising each proposed
research construct were internally consistent. As per guideline, minimum alpha is
considered as .70; however, a value of .60 may be acceptable for new scales (Nunally
1978; Hair et al. 2003). Thus for this purpose Cronbach’s alpha value has been
measured for all questions. The total Cronbach’s alpha was equal to .728 which is
acceptable according to the reliability value mentioned by Hair et al. (2003).
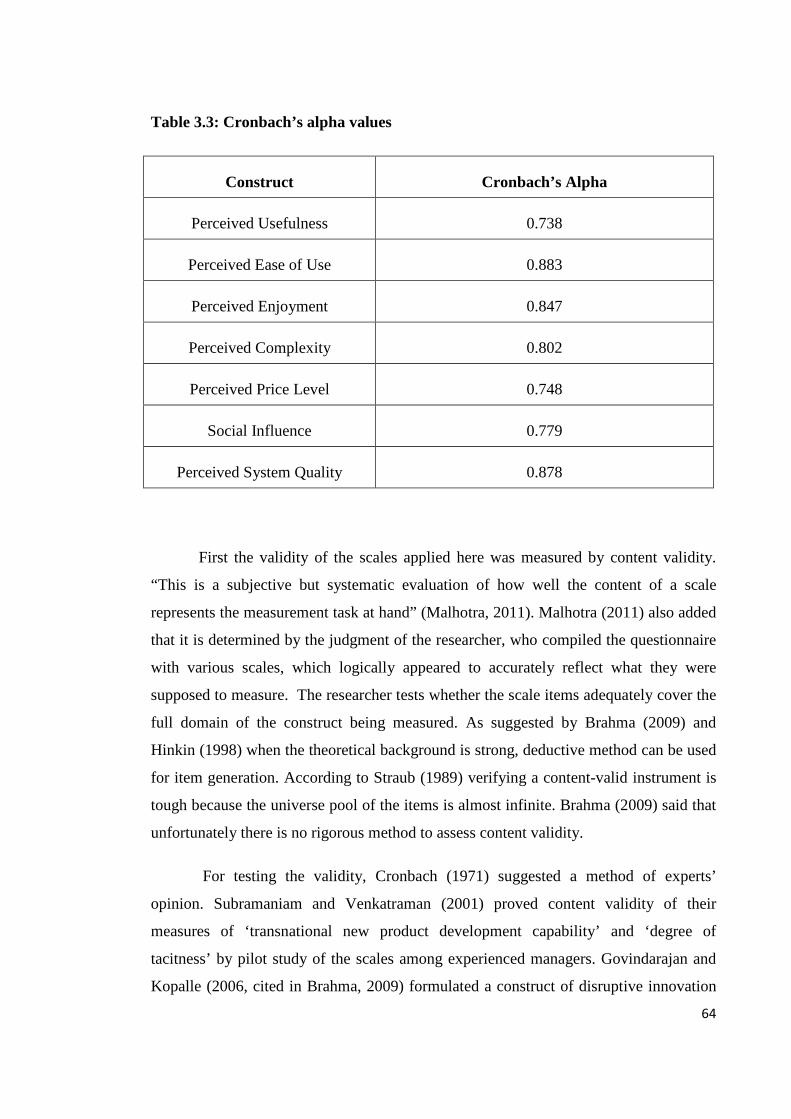
For determining construct reliability, based on the data from pilot testing of the
survey instrument, table 3.3 shows that the Cronbach’s alpha of the measures of the
planned variables are well above acceptable thresholds.
64
Table 3.3: Cronbach’s alpha values
Construct Cronbach’s Alpha
Perceived Usefulness 0.738
Perceived Ease of Use 0.883
Perceived Enjoyment 0.847
Perceived Complexity 0.802
Perceived Price Level 0.748
Social Influence 0.779
Perceived System Quality 0.878
First the validity of the scales applied here was measured by content validity.
“This is a subjective but systematic evaluation of how well the content of a scale
represents the measurement task at hand” (Malhotra, 2011). Malhotra (2011) also added
that it is determined by the judgment of the researcher, who compiled the questionnaire
with various scales, which logically appeared to accurately reflect what they were
supposed to measure. The researcher tests whether the scale items adequately cover the
full domain of the construct being measured. As suggested by Brahma (2009) and
Hinkin (1998) when the theoretical background is strong, deductive method can be used
for item generation. According to Straub (1989) verifying a content-valid instrument is
tough because the universe pool of the items is almost infinite. Brahma (2009) said that
unfortunately there is no rigorous method to assess content validity.
For testing the validity, Cronbach (1971) suggested a method of experts’
opinion. Subramaniam and Venkatraman (2001) proved content validity of their
measures of ‘transnational new product development capability’ and ‘degree of
tacitness’ by pilot study of the scales among experienced managers. Govindarajan and
Kopalle (2006, cited in Brahma, 2009) formulated a construct of disruptive innovation

65
by deductive process. First, they developed five items scale from the literature and then
it was content validated by scholars who were experienced in that field. In this
research, constructs were generated from literature and were content validated through
experienced managers.
Convergent validity is a significant factor of construct validity, which is present
when the indicators of the same construct have a high proportion of variance in
common (Bagozzi and Phillips, 1982). All items should be related to each other for
multi-item measures of a single construct. For testing the convergent validity
Exploratory Factor Analysis (EFA) represented by Principal Components Analysis
(PCA) with Varimax rotation were performed. The result of factor analysis is shown in
findings section (Chapter-IV). Interestingly the items related to ‘Job Search’ and
‘Improvement of performance’ has made separate factor, though these two were added
within the ‘perceived usefulness’ construct. The possible reason of this result has been
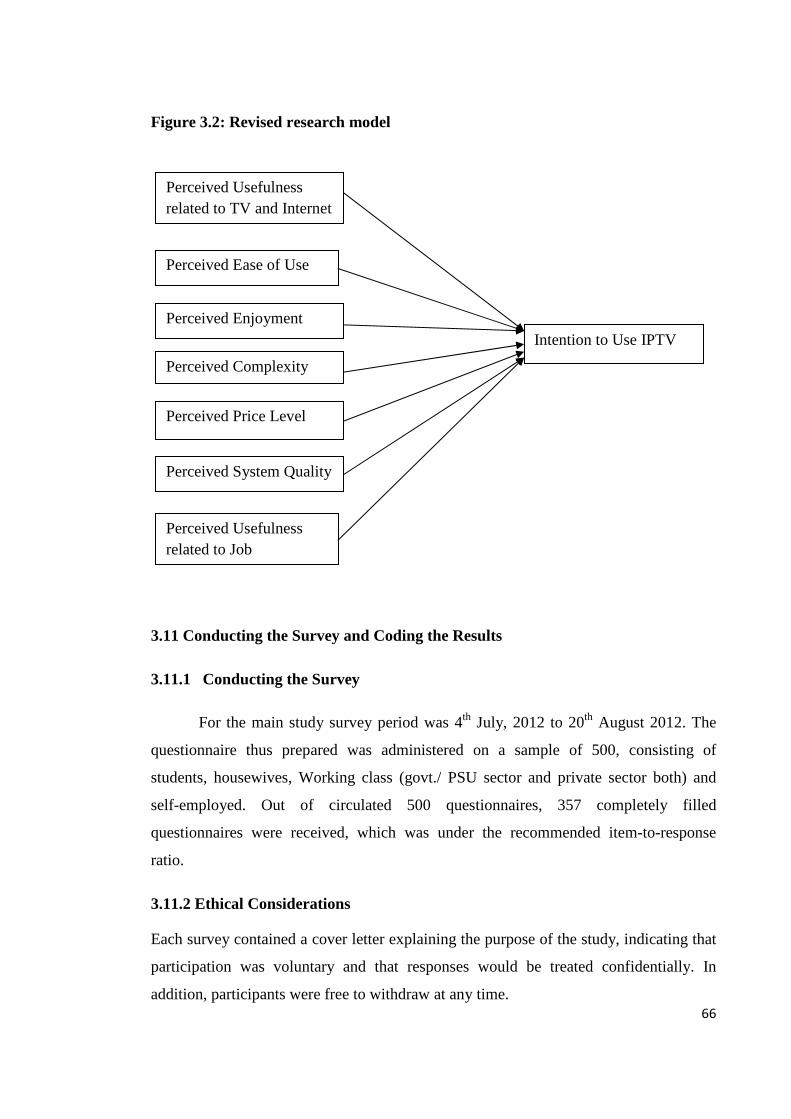
discussed in next chapter (Chapter –IV). As these two items creates separate factor with
a high load, we have revised our research model which is shown in figure 3.2 in next
page. Rest all the items have taken high load on their respective construct. The result is
shown in table Annex 4.5 in ANNEXURE-IV. Discriminant validity can be shown if
items are loaded highly in a specific factor and do not take high load on other factors
(Straub 1989; Hair et al. 2003). From table Annex 4.5 in ANNEXURE-IV, it can be
concluded that all the items take high load on their respective constructs and weak
loading on other constructs, hence discriminant validity is proved.
66
Figure 3.2: Revised research model
3.11 Conducting the Survey and Coding the Results
3.11.1 Conducting the Survey
For the main study survey period was 4th July, 2012 to 20th August 2012. The
questionnaire thus prepared was administered on a sample of 500, consisting of
students, housewives, Working class (govt./ PSU sector and private sector both) and
self-employed. Out of circulated 500 questionnaires, 357 completely filled
questionnaires were received, which was under the recommended item-to-response
ratio.
3.11.2 Ethical Considerations
Each survey contained a cover letter explaining the purpose of the study, indicating that
participation was voluntary and that responses would be treated confidentially. In
addition, participants were free to withdraw at any time.
Perceived Usefulness related to TV and Internet
Intention to Use IPTV
Perceived Ease of Use
Perceived Enjoyment
Perceived Complexity
Perceived Price Level
Perceived System Quality
Perceived Usefulness related to Job
67
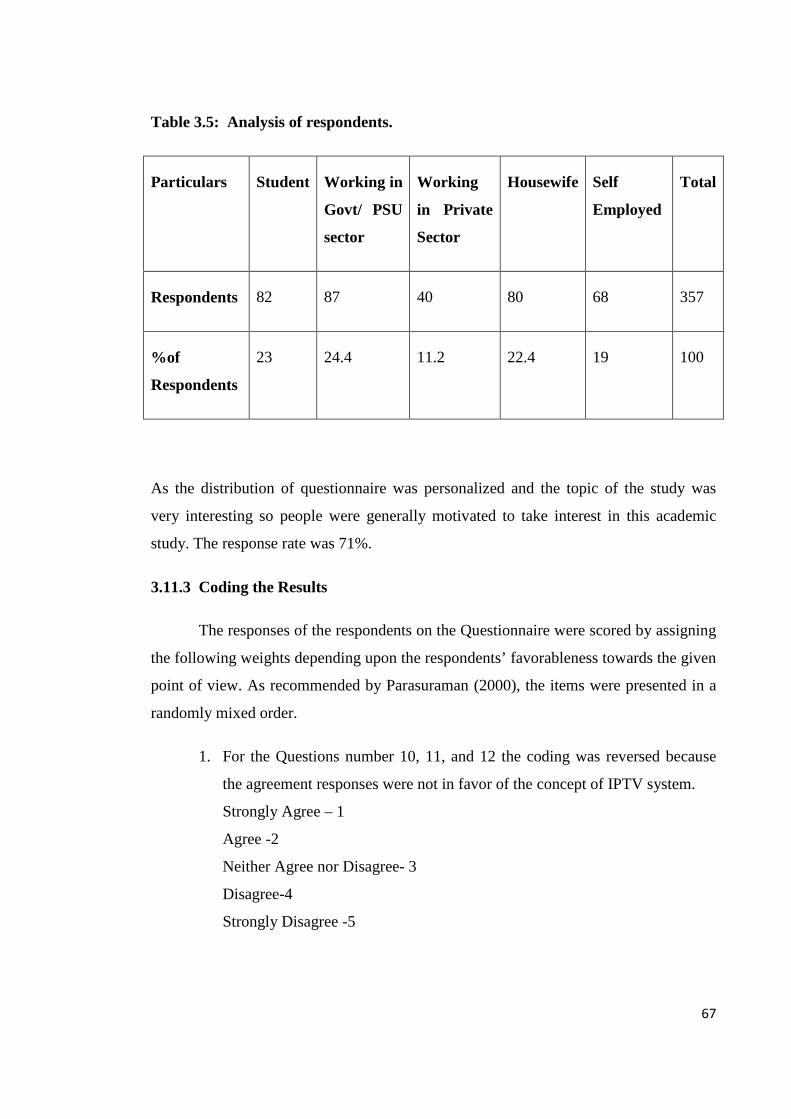
Table 3.5: Analysis of respondents.
Particulars Student Working in
Govt/ PSU
sector
Working
in Private
Sector
Housewife Self
Employed
Total
Respondents 82 87 40 80 68 357
%of
Respondents
23 24.4 11.2 22.4 19 100
As the distribution of questionnaire was personalized and the topic of the study was
very interesting so people were generally motivated to take interest in this academic
study. The response rate was 71%.
3.11.3 Coding the Results
The responses of the respondents on the Questionnaire were scored by assigning
the following weights depending upon the respondents’ favorableness towards the given
point of view. As recommended by Parasuraman (2000), the items were presented in a
randomly mixed order.
1. For the Questions number 10, 11, and 12 the coding was reversed because
the agreement responses were not in favor of the concept of IPTV system.
Strongly Agree – 1
Agree -2
Neither Agree nor Disagree- 3
Disagree-4
Strongly Disagree -5
68
2. For other Questions, the coding was done as follows for these questions
showed a favorable attitude towards IPTV system.
Strongly Agree – 5
Agree -4
Neither Agree nor Disagree- 3
Disagree-2
Strongly Disagree -1
3.12 Factor Analysis:
Factor analysis was performed to identify the structure of a set of variables in
the survey data. An exploratory factor analysis was used for extraction and
interpretation of the factors. Factor analysis is a statistical tool to decide a minimum
number of unobservable common factors by studying the covariance among a set of
observed variables (Malhotra, 2011). It tries to bring inter-correlated variables under
more general fundamental variables. According to Rietveld & Van Hout (1993, cited in
kootstra, 2004), more particularly, the objective of factor analysis is to reduce “the
dimensionality of the original space and to give an interpretation to the new space,
spanned by a reduced number of new dimensions which are supposed to underlie the
old ones”. Thus, factor analysis provides not only the possibility of deriving a clear
picture of the data, but also the possibility of applying the output in subsequent analyses
(Field, 2000). The factor structure was labelled subjectively, by inference from the
nature of the grouped items, which is exhibited in next chapter. For conducting factor
analysis there should be at least four or five times as many observations (sample size) as
there are items (Hair et al. 2003; Hinkin 1998; Field, 2009). This study has maintains
the ratio. The result of factor analysis is exhibited in findings section.
In summary, the following factor extraction rules were implemented:
• Factor extraction method: Principal Component Analysis
• Number of factors to retain: Eingenvalue>1 and Scree plotting
• Rotation method: Varimax
69
3.13 Multiple Regression Analysis:
In next step of the study a multiple regression analysis is performed in order to
assess the influence of identified factors on dependent variables. This analysis was
performed on the basis of collected data from responders. “The objective of multiple
regression analysis is to use the independent variables whose values are known to
predict the single dependent value selected by the researcher” (Hair et al., 2003).
Multiple regression is a statistical technique that allows us to predict someone’s score
on one variable on the basis of their scores on several other variables. In the regression
analysis, Intention to Use IPTV is used as a dependent variable and other factors used as
the independent variables.
One common problem that exists when applying multiple regressions is
multicollinearity. When using more than five independent variables, two or more of
them may be highly correlated to one another, this condition called multicollinearity
(Tabachnick and Fidell 2007). Multicollinearity was measured through variance
inflation factor (VIF) which indicates that the variables are reasonably free of the
problem. Hypotheses were tested through multiple regression analysis.
3.14 Summary
This chapter has given an overview of the detailed methodology
followed to carry out the research study. The analysis of responses collected through the
circulation of final questionnaire is dealt with in the next chapter.