chapter demand and supply in factor...
TRANSCRIPT
Demand andSupply in
Factor Markets
Chapter
CHAPTER OUTLINE
I. Describe the anatomy of the markets for labor, capital, and land. A. Labor Markets B. Financial Markets
1. Stock Market 2. Bond Market
C. Land Markets D. Competitive Factor Markets
2. Explain how the value of marginal product determines the demand for a factor of production.
A. Value of Marginal Product 1. The Value of Marginal Product Curve
B. A Firm’s Demand for Labor 1. A Firm’s Demand for Labor Curve
C. Changes in the Demand for Labor 1. The Price of the Firm’s Output 2. The Prices of Other Factors of Production 3. Technology
3. Explain how wage rates and employment are determined. A. The Supply of Labor
1. Market Supply Curve B. Influences on the Supply of Labor
1. Adult Population 2. Preferences 3. Time in School and Training
C. Labor Market Equilibrium
4. Explain how interest rates, borrowing, and lending are determined. A. The Demand for Financial Capital B. The Supply of Financial Capital C. Financial Market Equilibrium and the Interest Rate
446 Part 6 . HOW INCOMES ARE DETERMINED
5. Explain how rents and natural resource prices are determined. A. The Market for Land (Renewable Natural Resources) B. Economic Rent and Opportunity Cost C. The Supply of a Nonrenewable Natural Resource
CHAPTER ROADMAP
What’s New in this Edition? The data in Chapter 18 are up‐dated.
Where We Are In this chapter, we examine how firms and households in‐teract in competitive factor markets to determine the quan‐tity of resources employed. We also examine how prices (wages, rents, interest rates) are determined in these markets.
Where We’ve Been In previous chapters we have studied demand and supply. This chapter applies demand and supply model and the model of a competitive market to factor markets.
Where We’re Going This chapter is the first of two that concentrate on incomes. In Chapter 19, we explore economic inequality and poverty. We also look at the labor market in more detail to see how skill affects people’s incomes.
IN THE CLASSROOM
Class Time Needed
You can complete this chapter in two sessions. Most of the material reviews con‐cepts presented in earlier chapters and will not require a great deal of time. Two topics, the value of the marginal product and economic rent, are new concepts that should take more of your time. An estimate of the time per checkpoint is: • 18.1 The Anatomy of Factor Markets—10 to 15 minutes • 18.2 The Demand for a Factor of Production—25 to 40 minutes • 18.3 Wages and Employment—20 to 35 minutes • 18.4 Financial Markets—15 to 25 minutes • 18.5 Land and Natural Resource Markets—20 to 30 minutes

Chapter 18 . Demand and Supply in Factor Markets 447
CHAPTER LECTURE
18.1 The Anatomy of Factor Markets • Goods and services are produced using the factors of production, which are the resources
used to produce goods and services. There are four factors of production: labor, which earns a wage rate; capital, which earns interest; land, which earns rent; entrepreneurship, which earns normal profit and, as the owner of a firm, receives any economic profit or economic loss.
• Factors of production are traded in markets where their prices and quantities are deter‐mined by the market forces of demand and supply.
Labor Markets A labor market is a collection of people and firms who are trading labor services. Households supply labor and firms demand labor.
Financial Markets A financial market is the collection of people and firms who are lending and borrowing to fi‐nance the purchase of physical capital.
• Stock markets, a market in which shares in the stocks of companies are traded, and bond markets, a market in which bonds issued by firms and governments are traded, are two important financial markets.
Land Markets Land is all the gifts of nature, so oil markets, coal markets, and so on are example of land market. A commodity market is a market in which raw materials are traded.
18.2 The Demand for a Factor of Production • The demand for a factor of production is called a derived demand because it is derived
from the market demand for the goods and services produced by the factor.
Value of Marginal Product • The value of marginal product (VMP) is the value to the firm from one more unit of a
factor of production. The value of the marginal product of labor equals the price of a unit of output multiplied by the marginal product of labor, or VMP = P × MP. • As more labor is employed, the MP diminishes. So as more labor is employed, the
VMP diminishes.
Labor Demand Curve • The firm hires the quantity of labor that maximizes its profit by comparing the value of
the marginal product produced by employing one more worker to the marginal cost of employing one more worker.
• If VMP of labor exceeds the wage rate, the firm increases its profit by employing one more worker; if VMP is less than the wage rate, the firm increases its profit by employing one less worker; and, if VMP equals the wage rate, the firm is employing the profit‐maximizing quantity of labor.
448 Part 6 . HOW INCOMES ARE DETERMINED
• Because the firm hires workers until the wage rate equals the VMP, the value of the mar‐ginal product curve is the firm’s labor demand curve. Because the VMP of labor dimin‐ishes as the quantity of labor employed increases, the demand curve for labor is downward sloping.
Changes in the Demand for Labor Three factors can change the demand for labor ands shift the labor demand curve:
• Price of the firm’s output: If the price of the firm’s output changes, the demand for labor changes. An increase in the price of the output increases the demand for labor and shifts the demand curve rightward.
• Prices of other factors of production: If the prices of other factors of production change, in the long run the demand for labor changes. An increase in the price of a substitute factor leads the firm to increase the demand for labor.
• Technology: If a change in technology increases the productivity of one type of labor, the demand for this labor increases and the demand curve shifts rightward.
18.3 Wages and Employment
The Supply of Labor • The supply of labor depends on how people allocate their time between leisure activities
and labor activities. As the wage rate rises, initially people increase the quantity of labor supplied. However, when the wage rate is high enough, further increases decrease the quantity of labor supplied because people decide to take more leisure time and work fewer hours.
• The fact that people eventually respond to a rise in the wage rate by decreasing the quan‐tity of labor supplied means that the supply of labor curve bends backward.
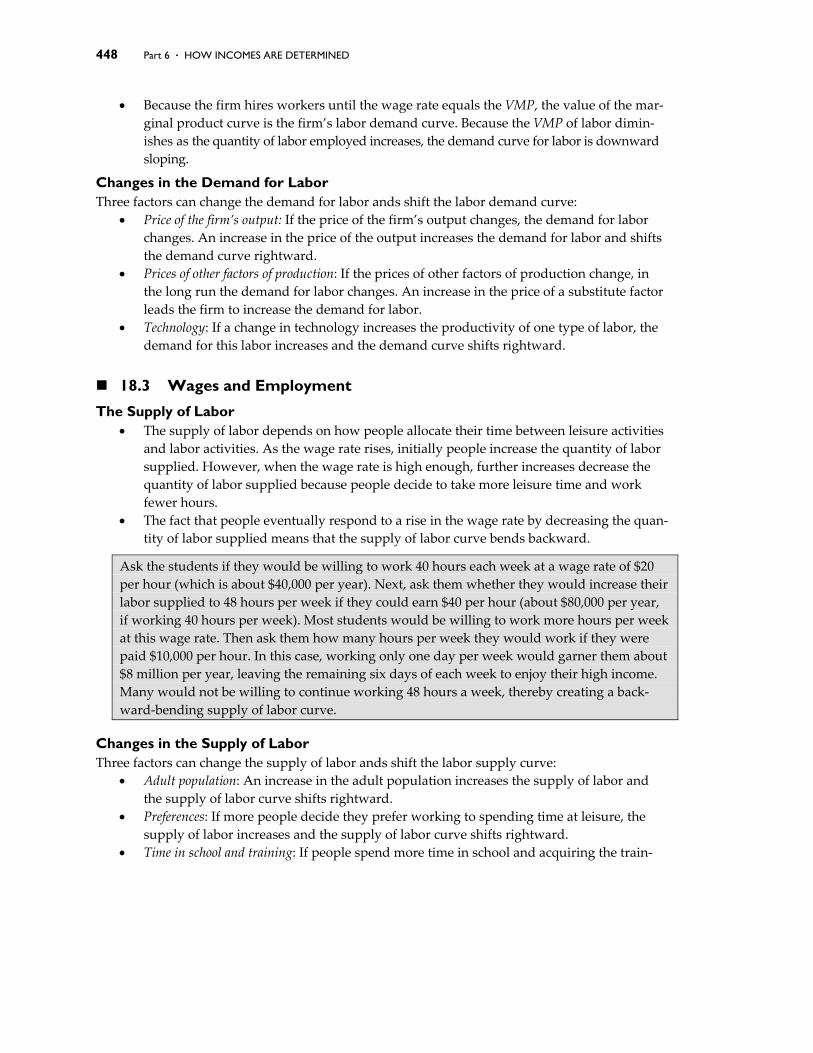
Ask the students if they would be willing to work 40 hours each week at a wage rate of $20 per hour (which is about $40,000 per year). Next, ask them whether they would increase their labor supplied to 48 hours per week if they could earn $40 per hour (about $80,000 per year, if working 40 hours per week). Most students would be willing to work more hours per week at this wage rate. Then ask them how many hours per week they would work if they were paid $10,000 per hour. In this case, working only one day per week would garner them about $8 million per year, leaving the remaining six days of each week to enjoy their high income. Many would not be willing to continue working 48 hours a week, thereby creating a back‐ward‐bending supply of labor curve.
Changes in the Supply of Labor Three factors can change the supply of labor ands shift the labor supply curve:
• Adult population: An increase in the adult population increases the supply of labor and the supply of labor curve shifts rightward.
• Preferences: If more people decide they prefer working to spending time at leisure, the supply of labor increases and the supply of labor curve shifts rightward.
• Time in school and training: If people spend more time in school and acquiring the train‐
Chapter 18 . Demand and Supply in Factor Markets 449
ing, the supply of low‐skilled labor decreases and the supply of high‐skilled labor in‐creases. The supply curve of low‐skilled labor shifts leftward and the supply curve of high‐skilled labor shifts rightward.
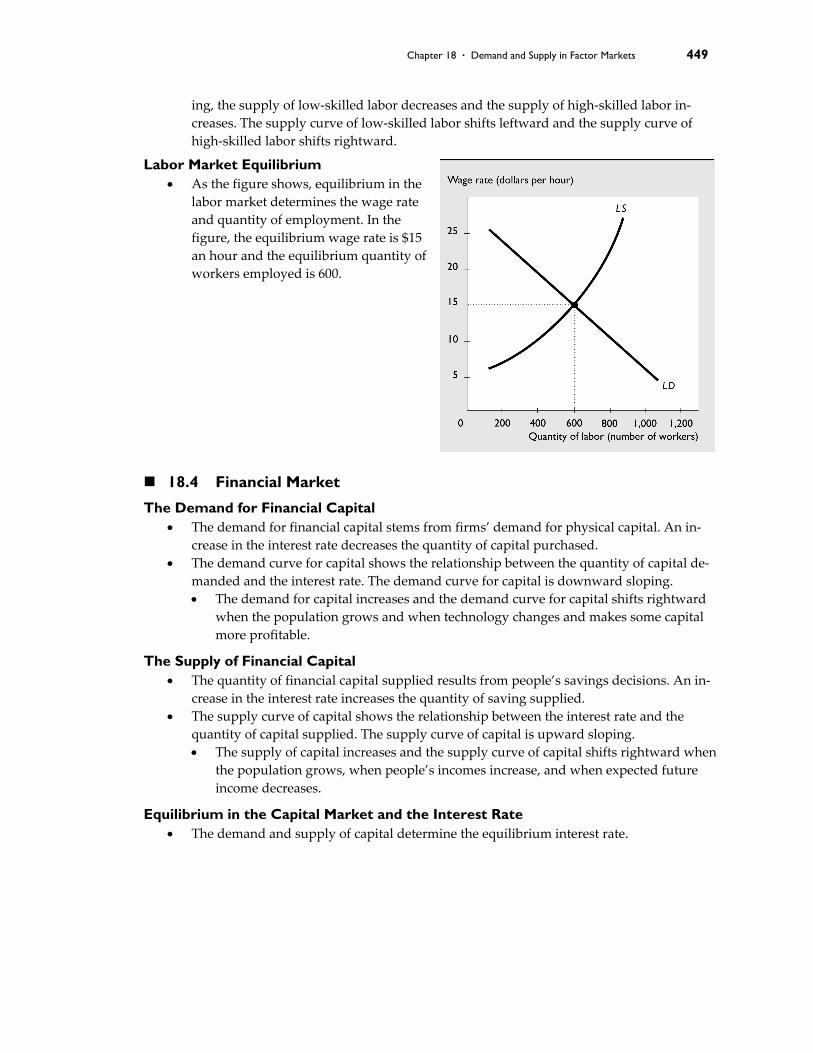
Labor Market Equilibrium • As the figure shows, equilibrium in the
labor market determines the wage rate and quantity of employment. In the figure, the equilibrium wage rate is $15 an hour and the equilibrium quantity of workers employed is 600.
18.4 Financial Market
The Demand for Financial Capital • The demand for financial capital stems from firms’ demand for physical capital. An in‐
crease in the interest rate decreases the quantity of capital purchased. • The demand curve for capital shows the relationship between the quantity of capital de‐
manded and the interest rate. The demand curve for capital is downward sloping. • The demand for capital increases and the demand curve for capital shifts rightward
when the population grows and when technology changes and makes some capital more profitable.
The Supply of Financial Capital • The quantity of financial capital supplied results from people’s savings decisions. An in‐
crease in the interest rate increases the quantity of saving supplied. • The supply curve of capital shows the relationship between the interest rate and the
quantity of capital supplied. The supply curve of capital is upward sloping. • The supply of capital increases and the supply curve of capital shifts rightward when
the population grows, when people’s incomes increase, and when expected future income decreases.
Equilibrium in the Capital Market and the Interest Rate • The demand and supply of capital determine the equilibrium interest rate.
450 Part 6 . HOW INCOMES ARE DETERMINED
• In the United States, over time both the demand and supply of capital have increased by roughly the same amounts. The quantity of capital has increased but there has been no real trend in the interest rate.
This is a good point in the lecture to discuss how U.S. households tend to save less of their income than do households in the more rapidly growing countries. By now the students can see the connection between total saving in an economy and the available financial capital for investment by businesses, which is an important influence on a society’s economic growth rate. This brief discussion is a good advertisement for the principles of macroeconomics and might well encourage some students to take this course in your economics curriculum.
18.5 Land and Natural Resource Markets • Renewable natural resources are natural resources that can be used repeatedly, such as
land (in its everyday sense), rivers, lakes, rain, and sunshine. • Nonrenewable natural resources are natural resources that can be used only once and
cannot be replaced once they have been used, such as oil and coal.
The Market for Land (Renewable Natural Resources) • The quantity of a renewable natural resources at any given time is fixed, which means
the supply is perfectly inelastic so that the supply curve is vertical. As a result, the price of a renewable natural resources is determined solely by market demand
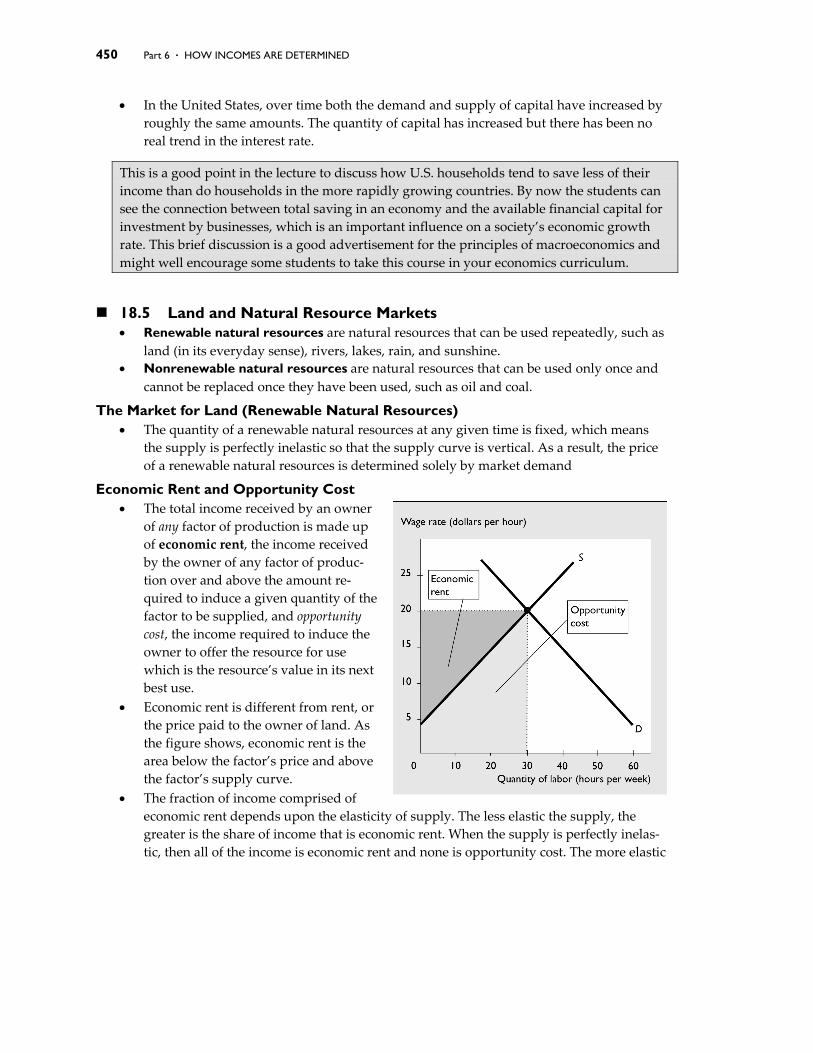
Economic Rent and Opportunity Cost • The total income received by an owner
of any factor of production is made up of economic rent, the income received by the owner of any factor of produc‐tion over and above the amount re‐quired to induce a given quantity of the factor to be supplied, and opportunity cost, the income required to induce the owner to offer the resource for use which is the resource’s value in its next best use.
• Economic rent is different from rent, or the price paid to the owner of land. As the figure shows, economic rent is the area below the factor’s price and above the factor’s supply curve.
• The fraction of income comprised of economic rent depends upon the elasticity of supply. The less elastic the supply, the greater is the share of income that is economic rent. When the supply is perfectly inelas‐tic, then all of the income is economic rent and none is opportunity cost. The more elastic
Chapter 18 . Demand and Supply in Factor Markets 451
the supply, the smaller the share of income that is economic rent. When the supply is per‐fectly inelastic, then none of the income is economic rent—all the income is opportunity cost.
The Supply of a Nonrenewable Natural Resource • At any given time, the quantity of any natural resource is fixed and is independent of the
price, so the supply curve is vertical. • Using a natural resource decreases its supply and raises its price. But over time, more of a
resource might be discovered, which increases its supply and lowers its price. In addi‐tion, new technology can be developed that uses less of the resource, thereby decreasing the demand for the resource and decreasing its price.
452 Part 6 . HOW INCOMES ARE DETERMINED
Lecture Launchers 1. Go back to Chapter 1 and the major questions of microeconomics. Point out
that the course so far has addressed the first two questions: “what?” and “how?” and that you’re now going to answer the third big question: “for whom?” Explain that we can cover all this material in just two chapters (the current one and Chapter 19) because we’re able to draw on what the stu‐dents already know. Understanding choices at the margin, demand and supply, market forces that bring equilibrium and coordinate activity are all used in this chapter. Note the power of the economic tools that the students already know and how big the payoff is from keeping on top of the entire course as it builds.
2. The bet between Julian Simon and Paul Ehrlich (presented in “Eye on the Global Economy”) can be a great attention‐getter. Review the theories on which each man based his ideas. Ehrlich’s contention follows Malthus’ pre‐diction that unchecked population growth would place so much pressure on the demand for nonrenewable natural resources, that prices of these re‐sources would rise. Ehrlich has suggested that government limit population growth and resource use. Simon, on the other hand, contended that people would meet the challenge by developing more efficient ways to use these resources. He predicted that the prices of these resources would fall. To prove their points, Simon offered a bet in 1980 that the prices of five metals (copper, chrome, nickel, tin and tungsten) would fall in that decade.
Ask your students who they think won the bet. You can make an over‐head of the graph provided in the text. Reveal only the data from 1972 to 1980. Ask students which side of the bet they would take. Of course, these data show that prices are rising. Then, slowly uncover the years showing the early 1980s. All of those students supporting a decrease in prices believe they are correct! Then continue uncovering up the data through 1985 though 1989 that show prices rising. Ask students if any want to change their minds now! Finish your introduction by revealing the rest of the data and showing that while prices have changed, overall they have declined. Simon was correct and won his bet. Ehrlich refused to renew the bet for the decade of the 1990s.
Land Mines
1. To avoid any possible confusion on the part of students, point out that in the labor market the tables have been turned compared to the goods and ser‐vices market. The household that is on the demand side of the markets for consumption of goods and services is now on the supply side of the market. Stress that we are not talking about the demand for jobs and the supply of jobs. Rather we study the demand for labor and the supply of labor.
Chapter 18 . Demand and Supply in Factor Markets 453
2. It has been several chapters since the difference between a movement along a curve and a shift of a curve was discussed. Take the time to re‐emphasize that a change in the variable on the vertical axis causes a movement along the curve but other factors will shift a curve. Point out these differences when explaining the labor, capital, and land markets.
3. The idea of economic rent versus opportunity cost can be clarified by draw‐ing the supply curve. Remind students that the area under the supply curve shows the income that is required to induce the supply of a given quantity of a factor of production, which is its opportunity cost. The area above the supply curve but below the resource price measures economic rent.
454 Part 6 . HOW INCOMES ARE DETERMINED
ANSWERS TO CHECKPOINT EXERCISES
CHECKPOINT 18.1 The Anatomy of Factor Markets
1. The committee is using all the different types of factors of production. First, the committee itself is the entrepreneurship. Then, it is using labor (organ‐izers, ticket sellers, officials, dormitory staff, cooks, builders); land (ski slopes, stadium property); and capital (stadiums, dormitories, computers, kitchen equipment).
CHECKPOINT 18.2 The Demand for a Factor of Production
1a. The marginal product of the third worker is 4 groomings a day. 1b. The value of the marginal product of the third worker is (4 groomings a
day) × ($20 a grooming), which is $80 a day. 1c. Greg will hire 7 workers because the value of the marginal product of the
seventh worker is $40 a day, (2 groomings a day × $20 a grooming) which equals the wage rate.
1d. When Greg hires 7 workers, 25 dogs are groomed a day. 1e. If the wage rate rises to $60, Greg hires 6 workers. The value of the mar‐
ginal product of the sixth worker is $60, which equals the new wage rate. 1f. With the increase in productivity and the fall in the price of a dog groom‐
ing, Greg hires 7 workers. The value of the marginal product of the seventh worker is equal to the marginal product, which is now 4 groomings a day, times the price of a grooming, which is now $10. So the value of the mar‐ginal product of the seventh worker is (4 groomings a day) × ($10 a groom‐ing) = $40, which is equal to the wage rate.
CHECKPOINT 18.3 Wages and Employment
1a. If ski holidays become more popular, the demand for ski instructors in‐creases. The number of ski instructors employed increases and the wage rate rises.
1b. If new skis are invented that are much easier to use, the demand for ski in‐structors would tumble. The number of ski instructors employed decreases and the wage rate falls.
2. The demand for truck drivers and couriers increases. As a result, the num‐ber of truck drivers and couriers employed increases and the wage rate rises. The demand for sales clerks in stores decreases as more transactions take place via the Internet. As a result, the number of sales clerks employed decreases and the wage rate falls.
3. Your students answers will vary because they likely will list different occu‐pations. As a sample answer, as more people use the Internet, the sales of
Chapter 18 . Demand and Supply in Factor Markets 455
computers increases. These computers will break and need repair. The de‐mand for PC producers and repair people increases. As more firms enter the Internet market, they hire Web‐page designers. The demand for Web‐page designers also increases. The demand for other types of workers de‐creases. As more people use the Internet for news, the demand for newspa‐pers decreases so newspapers lay off people. If more sales are transacted via the Internet, fewer sales clerks are needed. Fewer customer service rep‐resentatives are needed as people use the Internet to get product informa‐tion.
4. As more people go to college, the supply of low‐skilled labor decreases. With no change in demand, the wage of low‐skilled labor increases. As the supply of high‐skilled workers increases with no change in demand, the wage rate of high‐skilled workers decreases.
CHECKPOINT 18.4 Financial Markets
1a. Lou’s annual cost of capital is $20,000 × 0.03 = $600. 1b. Lou needs financial capital to buy the trees and to pay his workers. He
needs $20,000 to buy the trees. For his workers, Lou needs 50 weeks × 100 hours a week × $8 an hour = $40,000. In total, Lou needs $60,000 of financial capital.
1c. With the new technology, Lou will not need the $40,000 to pay workers but will need to borrow $10,000 to buy the additional equipment. Lou now needs $30,000 of financial capital.
CHECKPOINT 18.5 Land and Natural Resource Markets
1. The deep ocean oil fields increased the supply of oil and have kept oil prices from rising higher than they have. The people benefiting from the discovery are the owners of the oil rigs and the firms selling this oil. And consumers benefit because the price of oil is lower.
2. With the increased supply, the price of water will fall in Arizona and Cali‐fornia. Water is a renewable resource in Canada so it will not run out.
3. The increased demand for bottled water has encouraged land owners to sell the spring water produced on their land. Springs are renewable resources and will not run dry.
4. Farmers sell their land to urban developers because they believe their re‐turn from selling the land is greater than they will receive from farming. The price offered for the land is high because the demand for land to use for development is high.

456 Part 6 . HOW INCOMES ARE DETERMINED
ANSWERS TO CHAPTER CHECKPOINT EXERCISES
1a. If the demand for college graduates does not increase, wage rates for college grad‐uates fall and the number employed increases. This outcome is shown in Figure 18.1 in which the wage rate falls from W0 to W1 and the number employed increases from L0 to L1.
1b. The demand for college professors increases. The salary of a college professor rises and the number of college professors employed increases.
1c. The supply of high‐school graduates de‐
creases and the supply curve shifts left‐ward. The wage rate rises and the number employed decreases, as shown in Figure 18.2. In Figure 18.2, the wage rate rises from W0 to W1 and the number employed decreases from L0 to L1.
2. The demand for information technology workers increases. If fewer class‐
rooms, dormitories, and apartments are needed, the demand for this type
Chapter 18 . Demand and Supply in Factor Markets 457
of capital decreases. The demand for capital that relates to the delivery of online courses, such as computers, increases.
3a. The marginal product of the sixth worker is 6 boxes of asparagus an hour. 3b. The marginal product of the fifth worker is greater than the marginal
product of the sixth worker. 3c. The marginal product of the eighth worker is 4 boxes of asparagus an hour. 4a. When Palm Island decides to build an airport, the demand for financial
capital and land increases. The government needs the land to build the airport and needs financial capital to fund the construction. The supply of financial capital does not change nor does the supply of land.
4b. If Palm Island’s population doubles, the demand for capital and land in‐creases. People need capital and land to build homes, and land owners need capital to build shopping centers, hospitals, etc. The government needs more land for building roads, schools, and other new infrastructure, so its demand for financial capital increases to pay for the new infrastruc‐ture. There is an increase in the supply of financial capital as the popula‐tion increases. The supply of land does not change.
4c. If the price of coconuts increases, the demand for land and financial capital increases. If people believe they can earn a higher profit by growing coco‐nuts, they demand more land that is lying fallow or being used in a differ‐ent way. In starting new farms, these people need to borrow financial capi‐tal to fund their operations. The supply of land does not change. The sup‐ply of capital likely decreases because high prices for coconuts translate into high expected future incomes for Palm Island residents.
4d. As Palm Island encourages entrepreneurs to immigrate, the supply of, and the demand for, financial capital increases. With the increase in popula‐tion, the demand for land increases. The supply of land does not change.
5a. The statement is probably correct. As growers substitute capital for labor, the demand for tomato pickers decreases. With the decrease in demand comes lower wages. The only way the statement might be incorrect would be if lower priced capital led to growers increasing the scale of their opera‐tions enough so that the demand for tomato pickers increased.
5b. The statement is false. The decrease in the demand for basketball means that the demand for basketball players decreases. The salary of a basketball player will fall.
5c. This statement is correct. The new diamond discovery in Canada reduces the world diamond price. The value of marginal product of South African diamond workers decreases, and the wage rate paid to South African diamond workers falls
5d. Assuming that fuel efficiency is the only influence changing, the statement is correct.
458 Part 6 . HOW INCOMES ARE DETERMINED
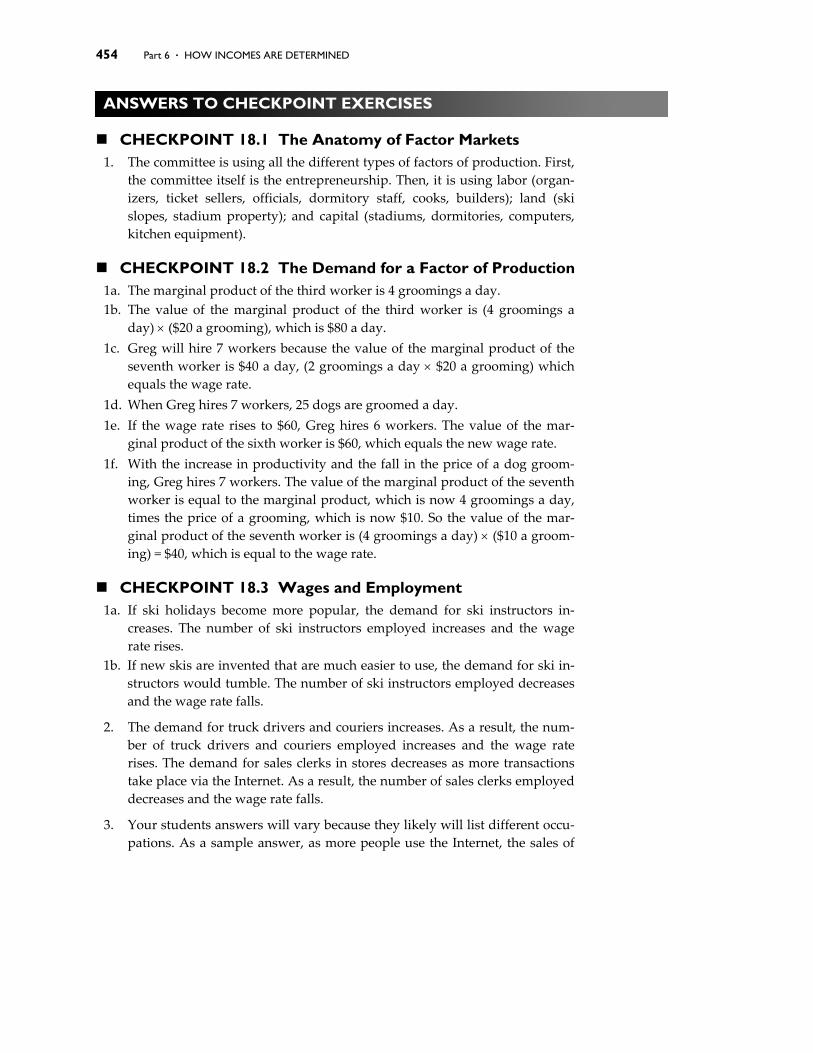
6a. The tax decreases the number of people attending college and decreases
the supply of college‐graduate labor. As Figure 18.3 illustrates, the supply curve shifts leftward. The wage rate rises and the quantity of college‐graduate labor decreases.
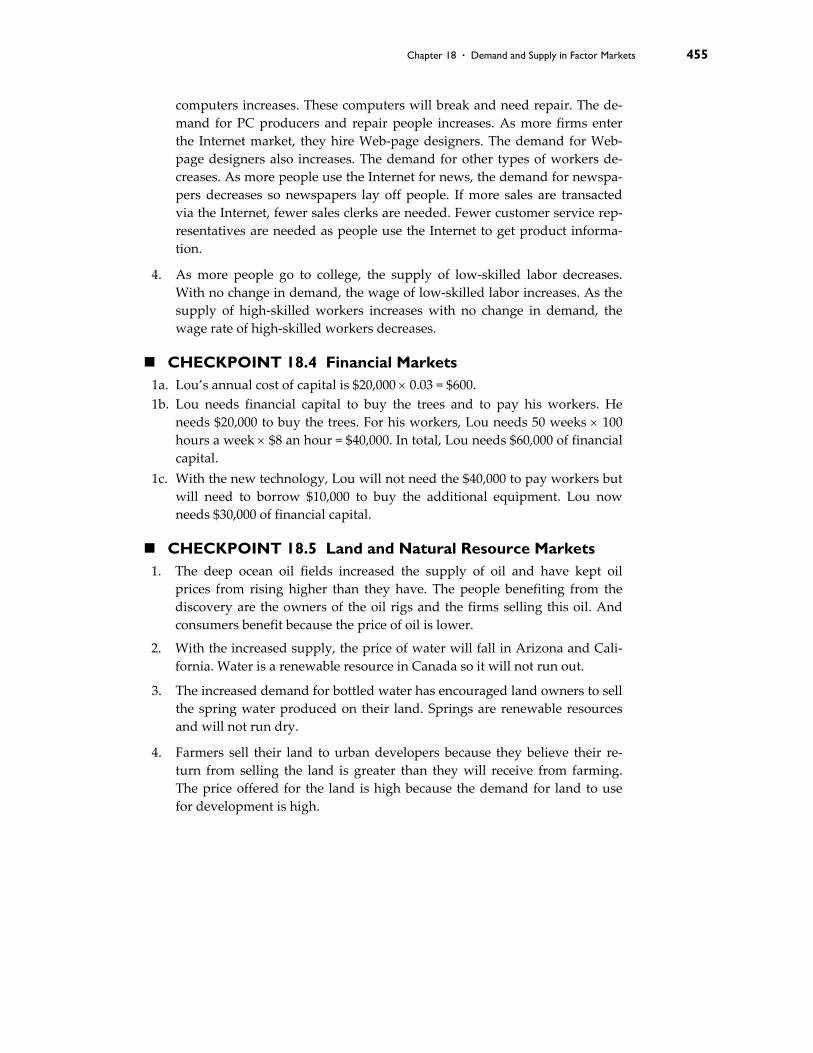
6b. The payment to firms increases the demand for workers acquiring skills on
Chapter 18 . Demand and Supply in Factor Markets 459
the job. As Figure 18.4 illustrates, the demand curve shifts rightward. The wage rate rises and the quantity of industrial workers with skills acquired on the job employed increases.
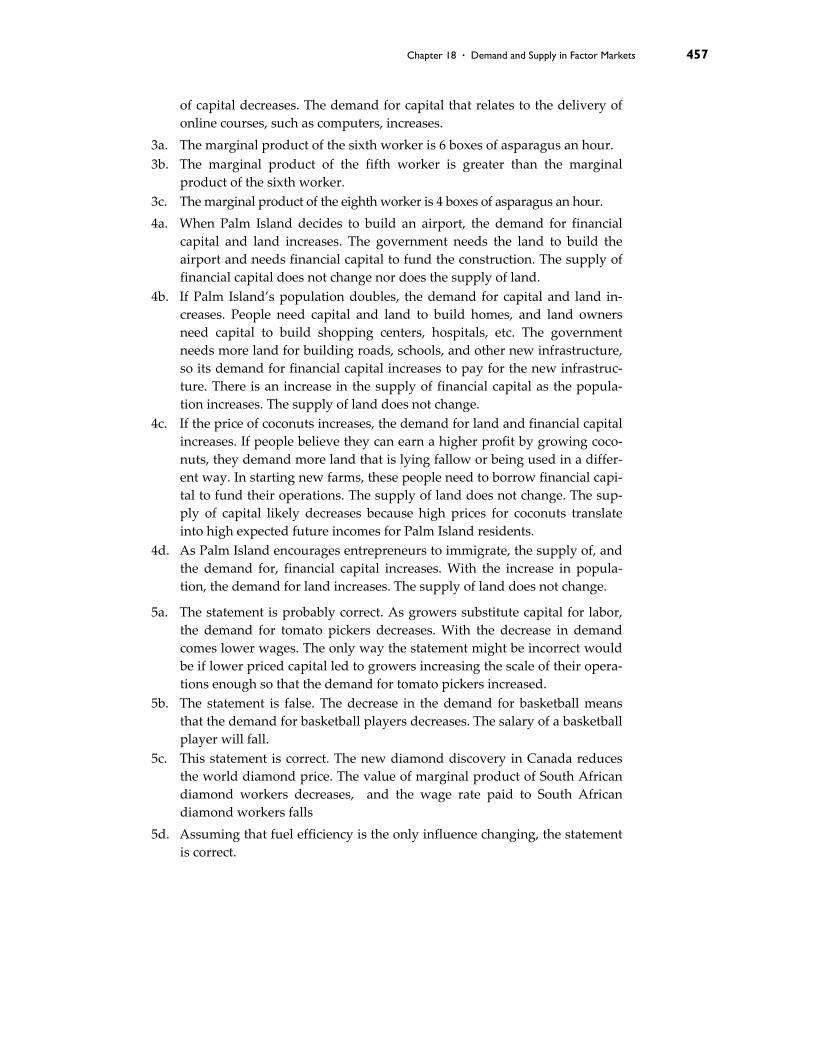
6c. The decrease in the number of people attending college decreases the de‐mand for college professors. As Figure 18.5 illustrates, the demand curve shifts leftward. The wage rate falls and the quantity of college professors employed decreases.
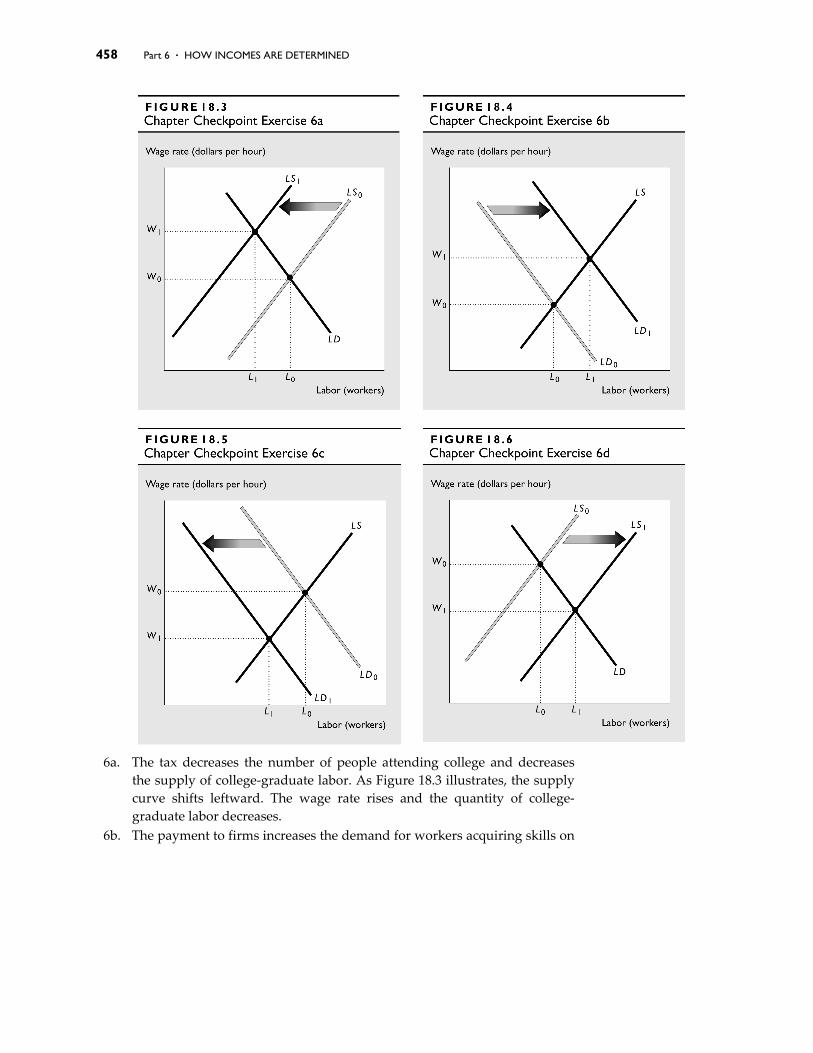
6d. As more people acquire skills, the supply of skilled industrial workers in‐creases. As Figure 18.6 illustrates, the supply curve shifts rightward. The wage rate falls and the quantity of skilled industrial workers employed in‐creases.
7a. Three factors might have contributed to the fall in the saving rate. First, the real interest rate fell in the last few years. Second, people might have ex‐pected higher incomes in the future. Third, in the last couple of years peo‐ple’s incomes might have fallen. All of these factors lead to a fall in the sav‐ings rate.
7b. The fall in the real interest rate decreases the quantity of saving supplied. The increase in expected future income and decrease in current income lead to a decrease in the supply of saving.
7c. With everything else the same, the decrease in the supply of saving raises the real interest rate.
8a. When the baby‐boom generation retires, the supply of saving will de‐crease.
8b. The decrease in the supply of saving will increase the equilibrium real in‐terest rate.
8c. The higher real interest rate will decrease firms’ use of capital because the opportunity cost of capital rises. As a result, production will become less capital intensive.
460 Part 6 . HOW INCOMES ARE DETERMINED
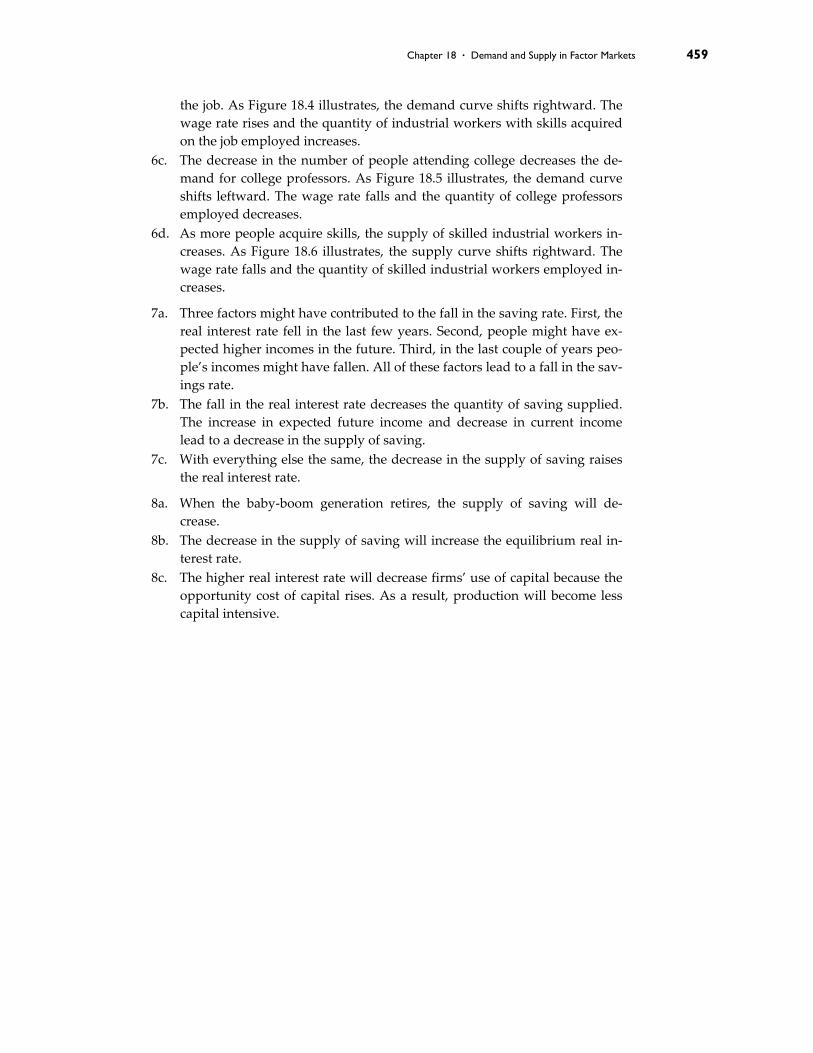
9a. The inflow of funds from abroad increases the supply of saving. In Figure 18.7, the supply curve shifts rightward from KS0 to KS1. The equilibrium real interest rate falls, in the figure from 4 percent a year to 3 per‐cent a year, and the equilibrium quantity of capital increases from $2,000 billion to $3,000 billion.
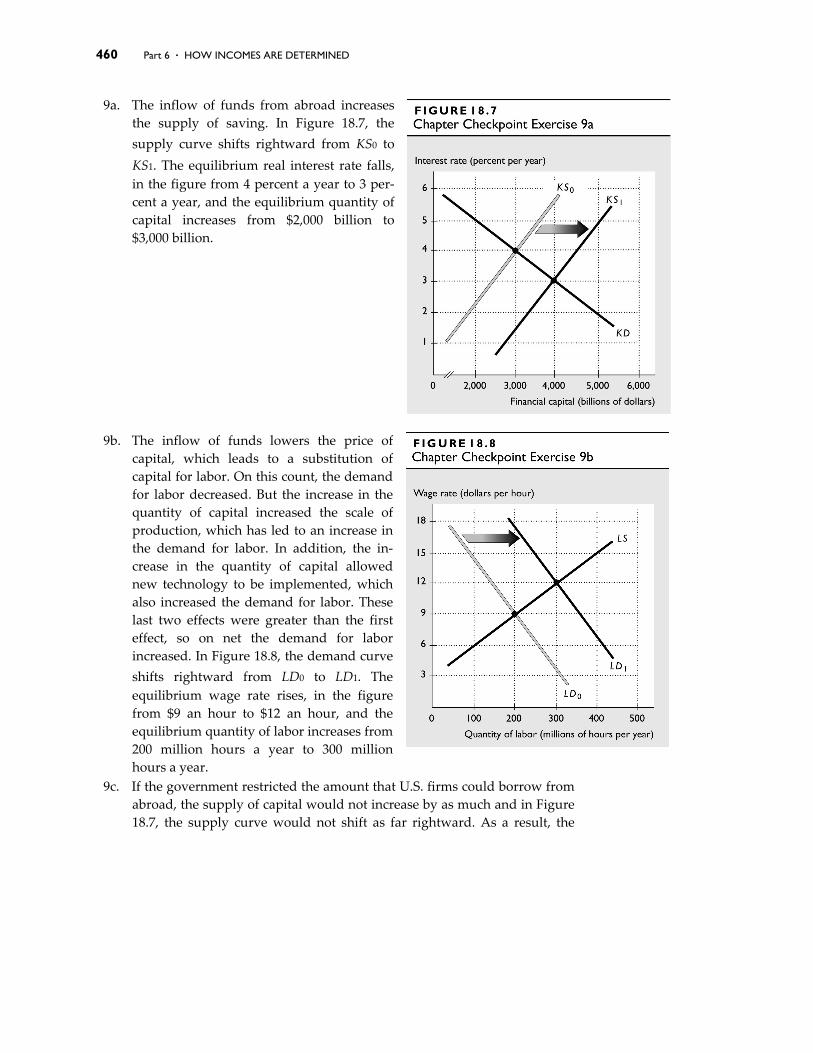
9b. The inflow of funds lowers the price of capital, which leads to a substitution of capital for labor. On this count, the demand for labor decreased. But the increase in the quantity of capital increased the scale of production, which has led to an increase in the demand for labor. In addition, the in‐crease in the quantity of capital allowed new technology to be implemented, which also increased the demand for labor. These last two effects were greater than the first effect, so on net the demand for labor increased. In Figure 18.8, the demand curve shifts rightward from LD0 to LD1. The equilibrium wage rate rises, in the figure from $9 an hour to $12 an hour, and the equilibrium quantity of labor increases from 200 million hours a year to 300 million hours a year.
9c. If the government restricted the amount that U.S. firms could borrow from abroad, the supply of capital would not increase by as much and in Figure 18.7, the supply curve would not shift as far rightward. As a result, the
Chapter 18 . Demand and Supply in Factor Markets 461
equilibrium real interest rate would be higher and the equilibrium quan‐tity of capital would be lower.
9d. If the government restricted the amount that U.S. firms could borrow from abroad, the demand for labor would not increase by as much and in Figure 18.8, the demand curve would not shift as far rightward. As a result the equilibrium wage rate and the equilibrium quantity of labor both would be lower.
10. The rent in Hong Kong is higher than the rent in Chicago. The population of Hong Kong is greater than in Chicago and there is a less land available. If the price of space is too high in Hong Kong, firms have few options for substitute locations. If the price of space in Chicago rises, firms have many options for relocating. The demand for newer buildings is greater in Hong Kong than in Chicago because of population growth in Hong Kong and in‐creases in demand for commercial space.
11. The statement is false. First, as more people buy Internet service, the price of the service will rise. It would fall only if the supply of the service in‐creases more than the demand increases and no change in the supply was mentioned in the question. Second, as more people surf the Internet, busi‐nesses will increase their demand for Web pages and increase their de‐mand for Web‐page designers. The increase in demand for Web‐page de‐signers will increase their wage rate, not decrease it.
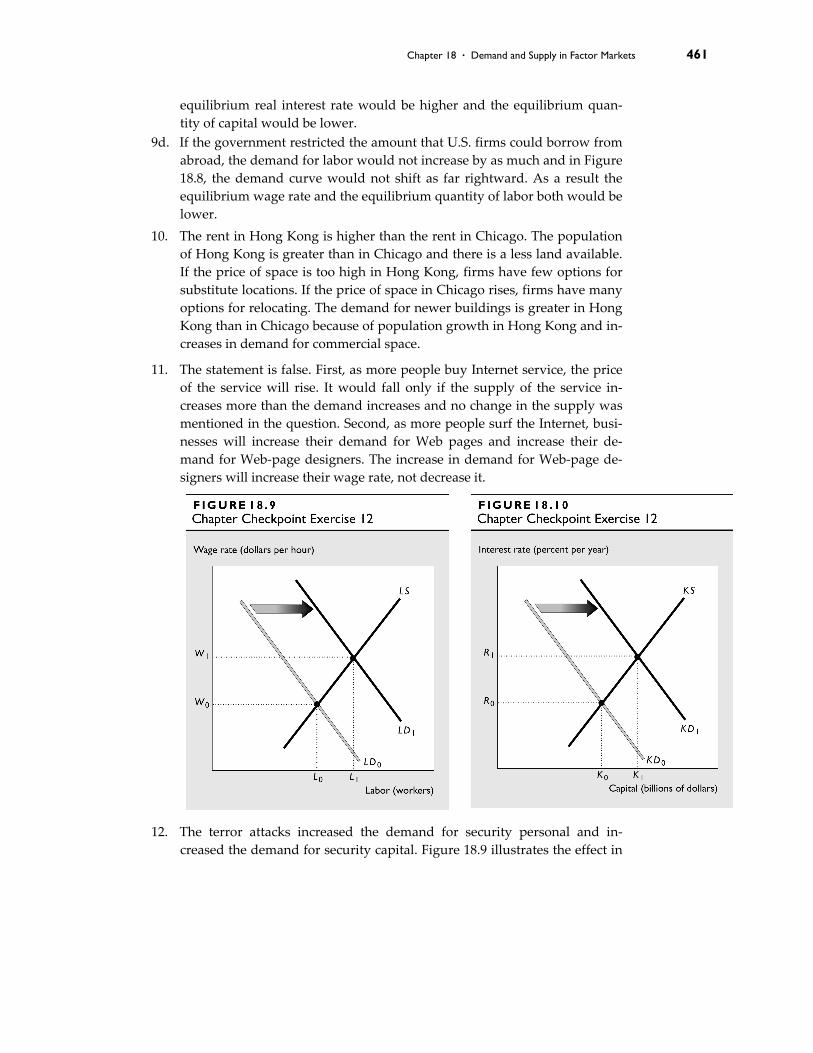
12. The terror attacks increased the demand for security personal and in‐creased the demand for security capital. Figure 18.9 illustrates the effect in

462 Part 6 . HOW INCOMES ARE DETERMINED
the labor market for security personal. The demand increases and the labor demand curve shifts rightward from LD0 to LD1. The equilibrium wage rate rises from W0 to W1 and the equilibrium quantity of labor increases from L0 to L1. Figure 18.10 illustrates the effect in the capital market. The demand for capital increases and the demand curve shifts rightward from KD0 to KD1. The equilibrium interest rate rises from R0 to R1 and the equi‐librium quantity of capital increases from K0 to K1.
Chapter 18 . Demand and Supply in Factor Markets 463
Critical Thinking
13a. The new technology used machines that replaced mill workers. As a result, the demand for mill workers decreased, which lead to a fall in the wage rate of mill workers.
13b. Workers who produced the machines used by the new technology gained. Workers who had the skills to work with the new technology gained. Work‐ers employed to repair the machines used by the new technology gained.
13c. The effect on the demand for unskilled workers is ambiguous. If the owner of a factory with destroyed machines decided to re‐open the factories without the new machines, the demand for unskilled mill workers in‐creased. If other factory owners worried that installing new machines would lead to vandalism, the demand for unskilled mill workers in‐creased. If the factories with destroyed machines remained closed or in‐stalled the new machines, the demand for unskilled mill workers de‐creased.
13d. The Luddites can not destroy machines in every factory. So the owners of the factories in which machines are destroyed cannot afford to reopen without the machines because they will be driven out of business by facto‐ries with the machines. So these owners face a choice: Reopen with ma‐chines or remain closed. In neither circumstance does the employment of unskilled mill workers increase. And, to the extent that the owner had em‐ployed at least some unskilled mill workers even with the new machines, destroying the machines destroys the jobs of these particular unskilled mill workers. So, destroying machines is at best futile and at worst harmful.
14. The introduction of the new machines in the early 1800s had similar effects to the introduction of computers in telecommunications in the late 1900s. In both cases, workers who used the old technology were replaced with new capital equipment. These workers lost, though eventually they might have acquired training to work with the new technology and new ma‐chines. In both cases, other workers gained. In particular, workers who manufactured the new machines and computers gained, as did workers who repaired them. In addition, workers who were able to work with the new machines or computers gained.
15. Technological change that lowers some wage rates sends a signal to work‐ers in these fields that the demand for labor in these areas has decreased; fewer workers are needed in these areas. The lower wage rates motivate affected workers to either switch to new sectors of the economy or to ac‐quire new skills. The lower wage rates help the economy adjust to the changes. By keeping the wage rate higher than otherwise, minimum wage laws slow the economy’s adjustment and decrease its efficiency.
464 Part 6 . HOW INCOMES ARE DETERMINED
Web Exercises
16a. Your students will need to create their free account. 16b. Your students will need to search for jobs. 16c. Your students will need to report what jobs they found. 16d. Monster.com is paid for by employers, who must pay to list a job, and by
advertisers.
17a. The change in the price of stocks can be measured by various stock indices. On the New York Stock Exchange web site, the NYSE composite, NYSE US 100, NYSE International 100, NYSE World Leaders, DJIA, and S&P 500 are available.
17b. Your students will select their own favorite stock. 17c. To determine if the price of a share of their company’s stock is performing
better or worse than the average, your students should compare its price performance to one of the stock indices listed above. If the company’s stock has risen more or fallen less than the index, presumably the demand for the particular stock has increased more than the average because the company has better than average profit expectations. If the company’s stock has fallen more or risen less than the index, presumably the demand for the particular stock has decreased more than the average because the company has less than average profit expectations.
18a. The prize money offered at the U.S. Open tennis tournament is the same for men and women. In 2005, the first place winners in the men’s and women’s singles each received $1.1 million. The prize money offered by the PGA and LPGA differ, with the women’s prizes less than the men’s prizes. In 2004 the Vijay Singh received $2 million for winning the PGA Championship while in 2005 the entire purse for the LPGA Championship was $1.8 million and the winner, Annika Sorenstam received only $300,000.
18b. Discrimination might be a potential answer, but probably is inaccurate. Women golfers are probably not discriminated against because more peo‐ple prefer to watch male golfers. Male golf tournaments draw more specta‐tors than women’s tournaments and also have higher television ratings. Male golfers hit the ball harder and farther than female golfers. Maybe spectators prefer this difference in skills. If one compares the women’s tour to minor men’s events (like the Nike Tour), the women’s events attract more sponsorship, more spectators, higher television ratings, and higher prize money. This set of facts likely reflects the fact that female golfers have more skills than second‐tier male golfers and that people prefer to watch women golfers rather than the second‐tier men golfers.
Chapter 18 . Demand and Supply in Factor Markets 465
18c. The difference in prize money could be the result of two reasons. First, the amount of money available for prizes is a function of sponsorship fees and television revenue. Because the men’s tour attracts greater sums of money, it can pay higher prize money. Second, the U.S. Open tennis tournament occurs at the same time and place for the men and women. Because of nega‐tive publicity, the tournament agreed to pay the same prize money. If the U.S. Open tennis tournament took place at different venues and times, it is likely that the prize money would not be the same. Except for the four “grand slam” events, the two tours rarely meet at the same tournament and the prize money for these separate events differs. Of the four “grand slam” events, only the U.S. Open and the Australian Open pay the same prize money. Wimbledon and the French Open pay the men more prize money.
466 Part 6 . HOW INCOMES ARE DETERMINED
Workers
Wraps per day
1 20 2 38 3 54 4 68 5 80 6 90 7 98 8 104
ADDITIONAL EXERCISES FOR ASSIGNMENT
Questions
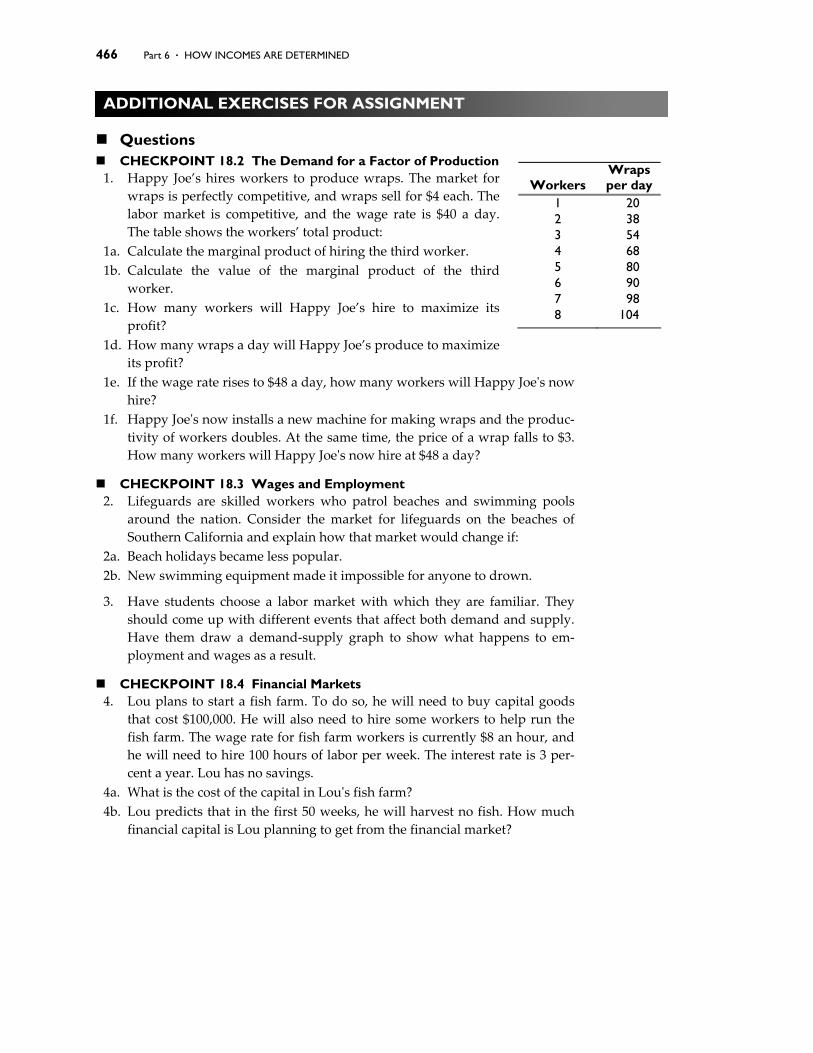
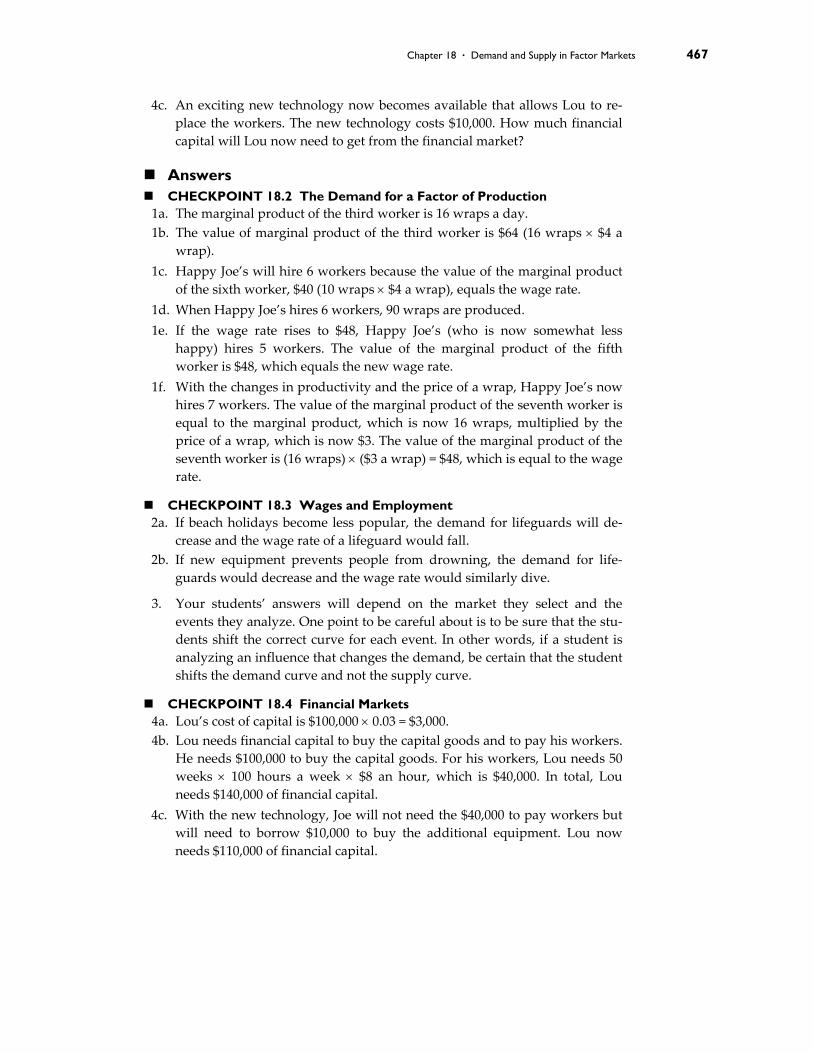
CHECKPOINT 18.2 The Demand for a Factor of Production 1. Happy Joe’s hires workers to produce wraps. The market for
wraps is perfectly competitive, and wraps sell for $4 each. The labor market is competitive, and the wage rate is $40 a day. The table shows the workers’ total product:
1a. Calculate the marginal product of hiring the third worker. 1b. Calculate the value of the marginal product of the third
worker. 1c. How many workers will Happy Joe’s hire to maximize its
profit? 1d. How many wraps a day will Happy Joe’s produce to maximize
its profit? 1e. If the wage rate rises to $48 a day, how many workers will Happy Joeʹs now
hire? 1f. Happy Joeʹs now installs a new machine for making wraps and the produc‐
tivity of workers doubles. At the same time, the price of a wrap falls to $3. How many workers will Happy Joeʹs now hire at $48 a day?
CHECKPOINT 18.3 Wages and Employment 2. Lifeguards are skilled workers who patrol beaches and swimming pools
around the nation. Consider the market for lifeguards on the beaches of Southern California and explain how that market would change if:
2a. Beach holidays became less popular. 2b. New swimming equipment made it impossible for anyone to drown.
3. Have students choose a labor market with which they are familiar. They should come up with different events that affect both demand and supply. Have them draw a demand‐supply graph to show what happens to em‐ployment and wages as a result.
CHECKPOINT 18.4 Financial Markets 4. Lou plans to start a fish farm. To do so, he will need to buy capital goods
that cost $100,000. He will also need to hire some workers to help run the fish farm. The wage rate for fish farm workers is currently $8 an hour, and he will need to hire 100 hours of labor per week. The interest rate is 3 per‐cent a year. Lou has no savings.
4a. What is the cost of the capital in Louʹs fish farm? 4b. Lou predicts that in the first 50 weeks, he will harvest no fish. How much
financial capital is Lou planning to get from the financial market?
Chapter 18 . Demand and Supply in Factor Markets 467
4c. An exciting new technology now becomes available that allows Lou to re‐place the workers. The new technology costs $10,000. How much financial capital will Lou now need to get from the financial market?
Answers
CHECKPOINT 18.2 The Demand for a Factor of Production 1a. The marginal product of the third worker is 16 wraps a day. 1b. The value of marginal product of the third worker is $64 (16 wraps × $4 a
wrap). 1c. Happy Joe’s will hire 6 workers because the value of the marginal product
of the sixth worker, $40 (10 wraps × $4 a wrap), equals the wage rate. 1d. When Happy Joe’s hires 6 workers, 90 wraps are produced. 1e. If the wage rate rises to $48, Happy Joe’s (who is now somewhat less
happy) hires 5 workers. The value of the marginal product of the fifth worker is $48, which equals the new wage rate.
1f. With the changes in productivity and the price of a wrap, Happy Joe’s now hires 7 workers. The value of the marginal product of the seventh worker is equal to the marginal product, which is now 16 wraps, multiplied by the price of a wrap, which is now $3. The value of the marginal product of the seventh worker is (16 wraps) × ($3 a wrap) = $48, which is equal to the wage rate.
CHECKPOINT 18.3 Wages and Employment 2a. If beach holidays become less popular, the demand for lifeguards will de‐
crease and the wage rate of a lifeguard would fall. 2b. If new equipment prevents people from drowning, the demand for life‐
guards would decrease and the wage rate would similarly dive.
3. Your students’ answers will depend on the market they select and the events they analyze. One point to be careful about is to be sure that the stu‐dents shift the correct curve for each event. In other words, if a student is analyzing an influence that changes the demand, be certain that the student shifts the demand curve and not the supply curve.
CHECKPOINT 18.4 Financial Markets 4a. Lou’s cost of capital is $100,000 × 0.03 = $3,000. 4b. Lou needs financial capital to buy the capital goods and to pay his workers.
He needs $100,000 to buy the capital goods. For his workers, Lou needs 50 weeks × 100 hours a week × $8 an hour, which is $40,000. In total, Lou needs $140,000 of financial capital.
4c. With the new technology, Joe will not need the $40,000 to pay workers but will need to borrow $10,000 to buy the additional equipment. Lou now needs $110,000 of financial capital.
468 Part 6 . HOW INCOMES ARE DETERMINED
USING EYE ON THE U.S. ECONOMY
Reallocating Labor
You can use this story to draw labor markets for the different industries. You can draw the labor markets for several industries (say tobacco manufacturing and computer services) and have the student give you their opinions as to what has occurred in these labor markets. Once you have completed the graphs, use the data from the table to show whether students have correctly described what has happened in the labor market for tobacco manufacturing (employment has de‐creased) and computer services (employment has increased).
Interest Rate Fluctuations
This story provides information on the behavior of interest rates over the past 40 years. Make sure to explain the meaning of real interest rates. I like to remind students that if they open a savings account, the bank pays them a nominal inter‐est rate, say of 4 percent. Ask students how valuable their account will be at the end of the year if prices rose by 4 percent. Most students realize that they are left with no real gain. Explain that this difference, nominal interest rate − inflation rate, is the real interest rate. You also can use this “Eye” to discuss the different average returns in the stock market versus the bond market as well as the differ‐ent variability of these returns.